Embed Size (px)
Citation preview
CHAPTER II
PERFORMANCE
AUDIT

5
CHAPTER II
PERFORMANCE AUDIT
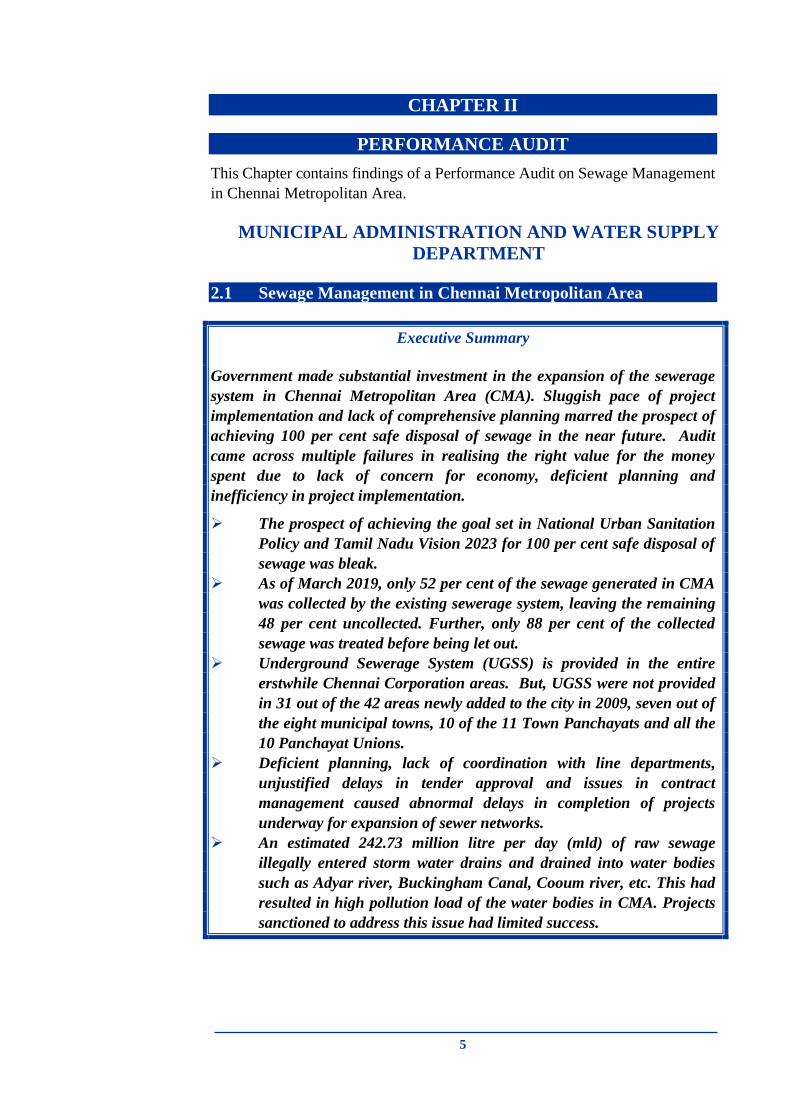
This Chapter contains findings of a Performance Audit on Sewage Management
in Chennai Metropolitan Area.
MUNICIPAL ADMINISTRATION AND WATER SUPPLY
DEPARTMENT
2.1 Sewage Management in Chennai Metropolitan Area
Executive Summary
Government made substantial investment in the expansion of the sewerage
system in Chennai Metropolitan Area (CMA). Sluggish pace of project
implementation and lack of comprehensive planning marred the prospect of
achieving 100 per cent safe disposal of sewage in the near future. Audit
came across multiple failures in realising the right value for the money
spent due to lack of concern for economy, deficient planning and
inefficiency in project implementation.
The prospect of achieving the goal set in National Urban Sanitation
Policy and Tamil Nadu Vision 2023 for 100 per cent safe disposal of
sewage was bleak.
As of March 2019, only 52 per cent of the sewage generated in CMA
was collected by the existing sewerage system, leaving the remaining
48 per cent uncollected. Further, only 88 per cent of the collected
sewage was treated before being let out.
Underground Sewerage System (UGSS) is provided in the entire
erstwhile Chennai Corporation areas. But, UGSS were not provided
in 31 out of the 42 areas newly added to the city in 2009, seven out of
the eight municipal towns, 10 of the 11 Town Panchayats and all the
10 Panchayat Unions.
Deficient planning, lack of coordination with line departments,
unjustified delays in tender approval and issues in contract
management caused abnormal delays in completion of projects
underway for expansion of sewer networks.
An estimated 242.73 million litre per day (mld) of raw sewage
illegally entered storm water drains and drained into water bodies
such as Adyar river, Buckingham Canal, Cooum river, etc. This had
resulted in high pollution load of the water bodies in CMA. Projects
sanctioned to address this issue had limited success.
Audit Report (General and Social Sector), Tamil Nadu for the year ended March 2019
6
Inadequate treatment capacity of sewage treatment plants (STP),
non-functioning of primary clarifier units in two STPs and
deficiencies in testing of treated water had adverse impact on the
quality of sewage treatment.
The achievement in recycling and reusing treated water was only
6.5 per cent of the sewage generated against the prescribed
benchmark of 20 per cent.
Five STPs without biogas power generation plant and three in which
the plants were non-functional released an estimated 5.7 million
cubic metre of environmentally dangerous methane gas per annum
into atmosphere and simultaneously CMWSSB lost an opportunity to
save on electricity bills.
2.1.1 Introduction
Sewage means contents of water closets, latrines, bathrooms, kitchen, stables,
cattle-sheds and other like places, and includes trade effluent. Sewage is the
single major source of water resource contamination, contributing 75 per cent
of the pollution load to water bodies and thereby adversely impacts human
health and aquatic life.
Sewerage system means the system for collection, treatment and disposal of
sewage. Sewerage system consists of house service connections, sewer lines,
lift stations, pumping stations and sewage treatment plants. The objective of
the sewerage system is to ensure that the sewage discharged by the community
is properly collected, transported and treated to safe levels, and disposed off or
reused without causing any health or environmental problems.
2.1.1.1 Chennai Metropolitan Area
The Chennai Metropolitan Water Supply and Sewerage Board (CMWSSB),
established in 1978, provides safe drinking water and safe disposal of sewage
in Greater Chennai Corporation (GCC), spread over an area of 426 sq.km.
Chennai Metropolitan Area (CMA), which encompasses GCC, is spread over
an area of 1,189 sq.km in three districts viz., the whole of Chennai district, and
parts of Kancheepuram and Tiruvallur districts. Other than GCC,
16 local bodies1 in Kancheepuram district and 13 local bodies2 in Tiruvallur
district fall within CMA.
In 2009, Government of Tamil Nadu (GoTN) expanded Chennai
Corporation’s jurisdiction by annexing 42 adjacent local bodies which include
nine municipalities, eight town panchayats and 25 village panchayats.
The newly added areas of the City came under the jurisdiction of CMWSSB
from October 2011.
1 Five municipalities, seven town panchayats and four panchayat unions. 2 One Municipal Corporation (Avadi), two municipalities, four town panchayats and
six panchayat unions.
Chapter II - Performance Audit
7
While it is the sole responsibility of CMWSSB to provide sewage
management services in the expanded GCC area, in respect of other local
bodies in CMA, CMWSSB is the nodal agency for implementing sewerage
schemes.
2.1.1.2 Sanitation Policy and goals
The National Urban Sanitation Policy (NUSP), 2008, emphasises the need for
spreading awareness about sanitation through an integrated city-wide approach
and recommends that each State and City need to formulate their own
sanitation strategy and respective City Sanitation Plan in overall conformity to
the National Policy. Government of India (GoI) fixed a target of treating
69 per cent of sewage by 2030 at all India level. In respect of urban areas,
NUSP has set a goal that 100 per cent of human excreta and liquid wastes
from all sanitation facilities including toilets must be disposed of safely.
GoTN, in its Vision 2023 Plan, envisaged 100 per cent safe sanitation in all
local bodies by 2023.
2.1.2 Organisational setup
The Additional Chief Secretary to the Government, Municipal Administration
and Water Supply (MAWS) Department is the Head of the Department.
Managing Director, CMWSSB is the executive head of CMWSSB assisted by
Engineering Director, Executive Director, Finance Director and
Chief Engineers. Organisational chart of CMWSSB is given in Appendix 2.1.
2.1.3 Audit Objective
Audit objectives were to assess whether:
Adequate plans were formulated to augment sewage collection
capacity, transportation, treatment and disposal system;
Sewage discharged from communities were properly collected,
transported and treated to the required degree in sewered and
unsewered areas and
Treated water was reused as a resource or safely disposed of to
protect public health and environment.
2.1.4 Audit Criteria
Audit criteria were derived from the following sources:
The Water (Prevention and Control of Pollution) Act, 1974;
The Environment (Protection) Act, 1986;
The Chennai Metropolitan Water Supply and Sewerage Act, 1978;
National Urban Sanitation Policy 2008;
Central Public Health and Environmental Engineering Organisation
(CPHEEO) Manual and Handbook;
Audit Report (General and Social Sector), Tamil Nadu for the year ended March 2019
8
Notification/Orders of Central Pollution Control Board and
Tamil Nadu Pollution Control Board (TNPCB) and
Government orders, Circulars and Master Plan of CMWSSB.
2.1.5 Scope and methodology of Audit
Audit was conducted from April to September 2019 covering five years period
from 2014-15 to 2018-19. An Entry Conference was held on 10 April 2019
with the Additional Chief Secretary, MAWS Department. Audit objectives,
criteria, methodology and sampling were discussed. On conclusion of the
Audit, an Exit Conference was held with the Additional Chief Secretary,
MAWS Department on 12 December 2019 to discuss the audit findings. This
report was prepared after considering the deliberations in the meeting and the
reply furnished (April 2020) by GoTN.
Audit examined the records at the Secretariat, headquarters and sampled field
units3 of CMWSSB and sampled local bodies4. Sampling was done by using
simple random sampling method. List of sampled units is given in
Appendix 2.2.
2.1.6 Physical Performance
The growth in sewerage network in CMWSSB during last 40 years was as
given in Table 2.1.
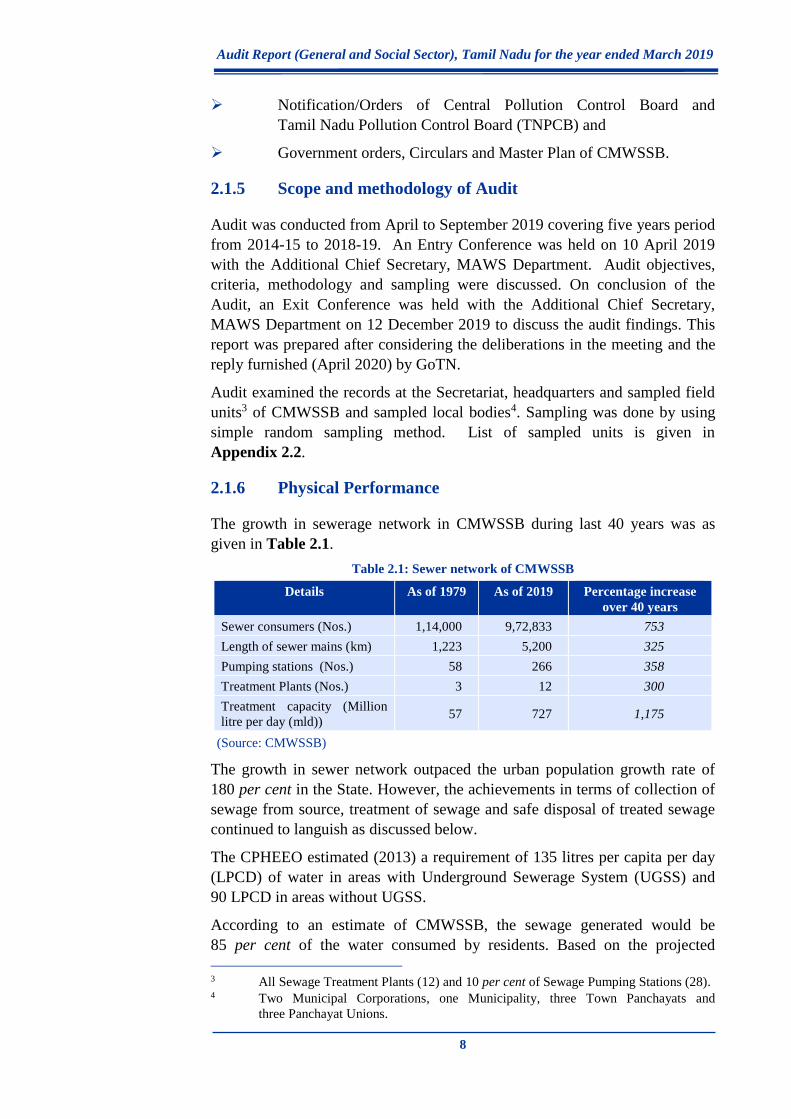
Table 2.1: Sewer network of CMWSSB
Details As of 1979 As of 2019 Percentage increase
over 40 years
Sewer consumers (Nos.) 1,14,000 9,72,833 753
Length of sewer mains (km) 1,223 5,200 325
Pumping stations (Nos.) 58 266 358
Treatment Plants (Nos.) 3 12 300
Treatment capacity (Million
litre per day (mld)) 57 727 1,175
(Source: CMWSSB)
The growth in sewer network outpaced the urban population growth rate of
180 per cent in the State. However, the achievements in terms of collection of
sewage from source, treatment of sewage and safe disposal of treated sewage
continued to languish as discussed below.
The CPHEEO estimated (2013) a requirement of 135 litres per capita per day
(LPCD) of water in areas with Underground Sewerage System (UGSS) and
90 LPCD in areas without UGSS.
According to an estimate of CMWSSB, the sewage generated would be
85 per cent of the water consumed by residents. Based on the projected
3 All Sewage Treatment Plants (12) and 10 per cent of Sewage Pumping Stations (28). 4 Two Municipal Corporations, one Municipality, three Town Panchayats and
three Panchayat Unions.
Chapter II - Performance Audit
9
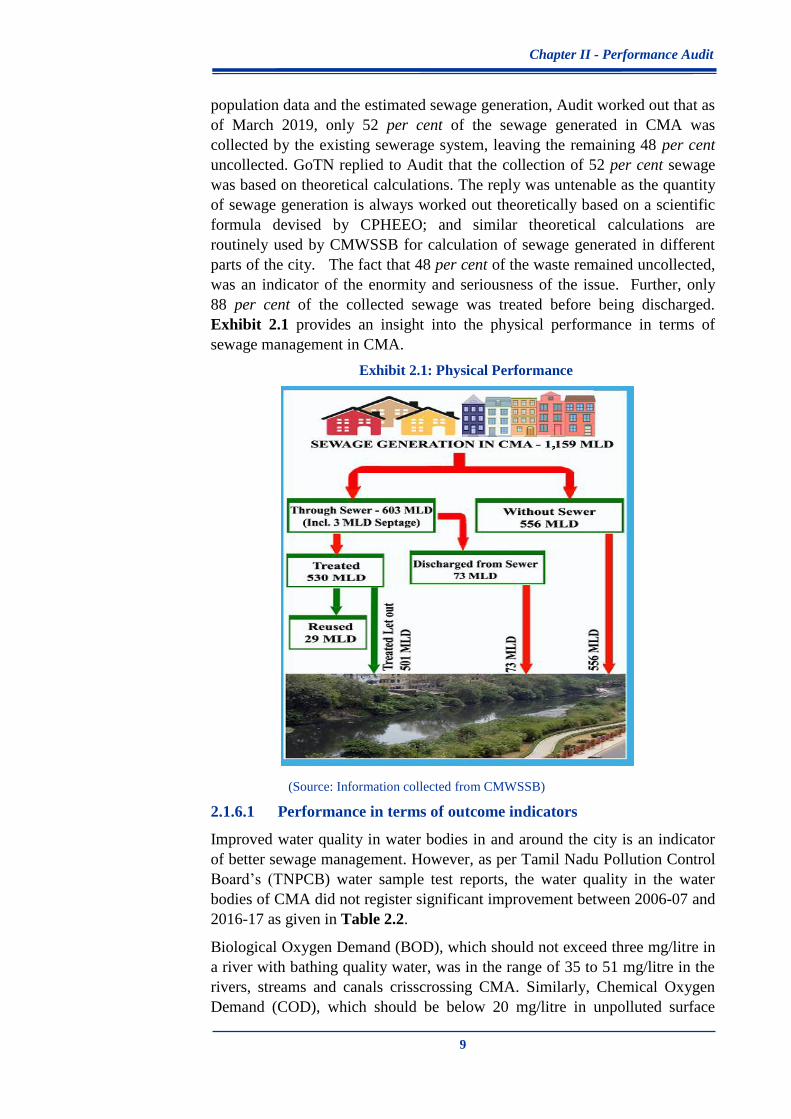
population data and the estimated sewage generation, Audit worked out that as
of March 2019, only 52 per cent of the sewage generated in CMA was
collected by the existing sewerage system, leaving the remaining 48 per cent
uncollected. GoTN replied to Audit that the collection of 52 per cent sewage
was based on theoretical calculations. The reply was untenable as the quantity
of sewage generation is always worked out theoretically based on a scientific
formula devised by CPHEEO; and similar theoretical calculations are
routinely used by CMWSSB for calculation of sewage generated in different
parts of the city. The fact that 48 per cent of the waste remained uncollected,
was an indicator of the enormity and seriousness of the issue. Further, only
88 per cent of the collected sewage was treated before being discharged.
Exhibit 2.1 provides an insight into the physical performance in terms of
sewage management in CMA.
Exhibit 2.1: Physical Performance
(Source: Information collected from CMWSSB)
2.1.6.1 Performance in terms of outcome indicators
Improved water quality in water bodies in and around the city is an indicator
of better sewage management. However, as per Tamil Nadu Pollution Control
Board’s (TNPCB) water sample test reports, the water quality in the water
bodies of CMA did not register significant improvement between 2006-07 and
2016-17 as given in Table 2.2.
Biological Oxygen Demand (BOD), which should not exceed three mg/litre in
a river with bathing quality water, was in the range of 35 to 51 mg/litre in the
rivers, streams and canals crisscrossing CMA. Similarly, Chemical Oxygen
Demand (COD), which should be below 20 mg/litre in unpolluted surface
Audit Report (General and Social Sector), Tamil Nadu for the year ended March 2019
10
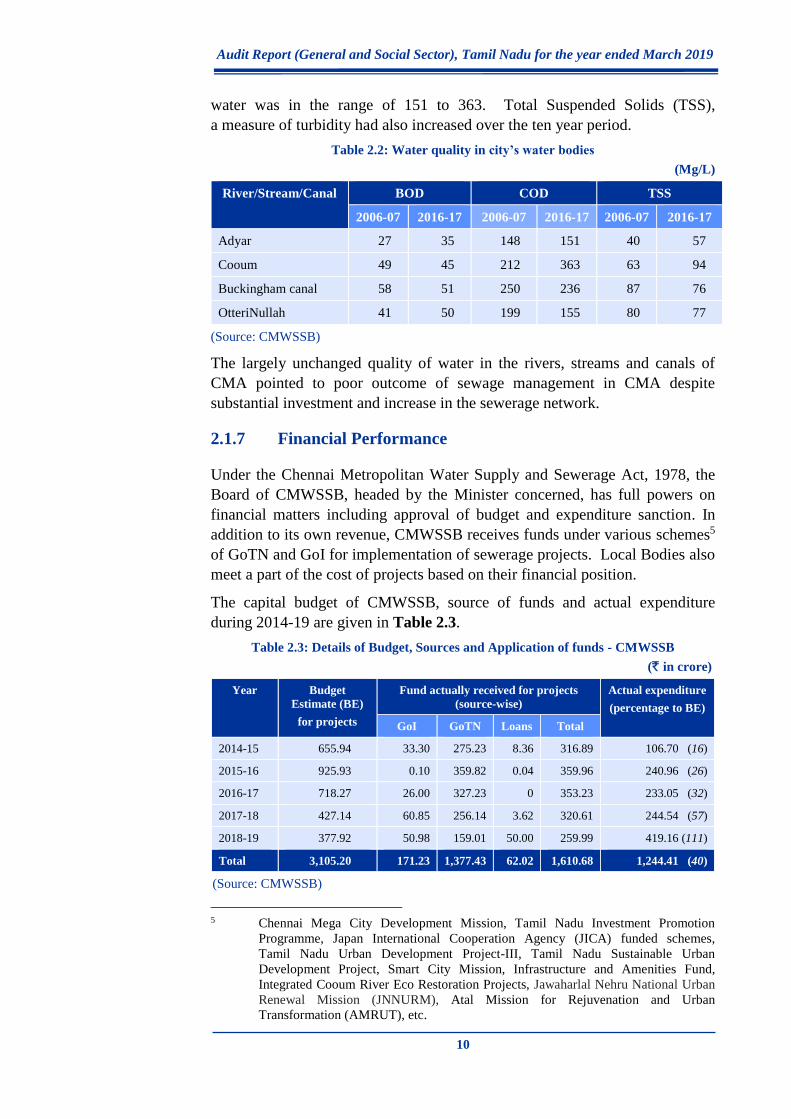
water was in the range of 151 to 363. Total Suspended Solids (TSS),
a measure of turbidity had also increased over the ten year period.
Table 2.2: Water quality in city’s water bodies
(Mg/L)
River/Stream/Canal BOD COD TSS
2006-07 2016-17 2006-07 2016-17 2006-07 2016-17
Adyar 27 35 148 151 40 57
Cooum 49 45 212 363 63 94
Buckingham canal 58 51 250 236 87 76
OtteriNullah 41 50 199 155 80 77
(Source: CMWSSB)
The largely unchanged quality of water in the rivers, streams and canals of
CMA pointed to poor outcome of sewage management in CMA despite
substantial investment and increase in the sewerage network.
2.1.7 Financial Performance
Under the Chennai Metropolitan Water Supply and Sewerage Act, 1978, the
Board of CMWSSB, headed by the Minister concerned, has full powers on
financial matters including approval of budget and expenditure sanction. In
addition to its own revenue, CMWSSB receives funds under various schemes5
of GoTN and GoI for implementation of sewerage projects. Local Bodies also
meet a part of the cost of projects based on their financial position.
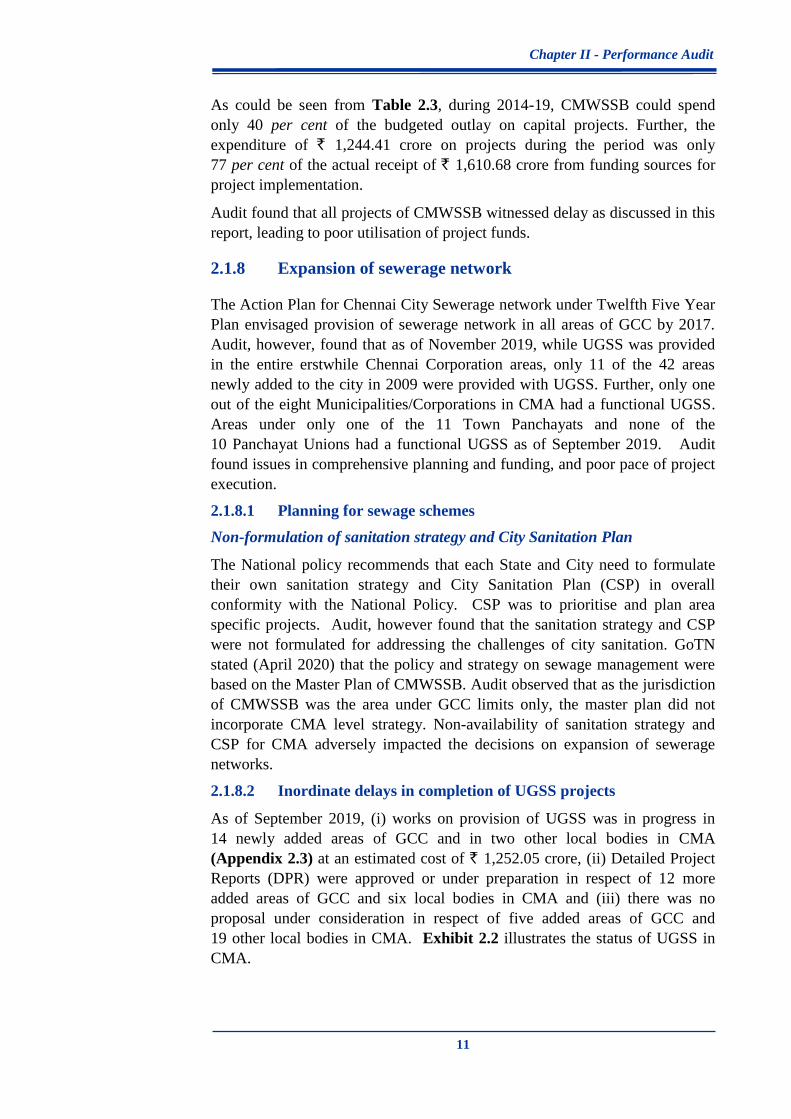
The capital budget of CMWSSB, source of funds and actual expenditure
during 2014-19 are given in Table 2.3.
Table 2.3: Details of Budget, Sources and Application of funds - CMWSSB
(` in crore)
Year Budget
Estimate (BE)
for projects
Fund actually received for projects
(source-wise)
Actual expenditure
(percentage to BE)
GoI GoTN Loans Total
2014-15 655.94 33.30 275.23 8.36 316.89 106.70 (16)
2015-16 925.93 0.10 359.82 0.04 359.96 240.96 (26)
2016-17 718.27 26.00 327.23 0 353.23 233.05 (32)
2017-18 427.14 60.85 256.14 3.62 320.61 244.54 (57)
2018-19 377.92 50.98 159.01 50.00 259.99 419.16 (111)
Total 3,105.20 171.23 1,377.43 62.02 1,610.68 1,244.41 (40)
(Source: CMWSSB)
5 Chennai Mega City Development Mission, Tamil Nadu Investment Promotion
Programme, Japan International Cooperation Agency (JICA) funded schemes,
Tamil Nadu Urban Development Project-III, Tamil Nadu Sustainable Urban
Development Project, Smart City Mission, Infrastructure and Amenities Fund,
Integrated Cooum River Eco Restoration Projects, Jawaharlal Nehru National Urban
Renewal Mission (JNNURM), Atal Mission for Rejuvenation and Urban
Transformation (AMRUT), etc.
Chapter II - Performance Audit
11
As could be seen from Table 2.3, during 2014-19, CMWSSB could spend
only 40 per cent of the budgeted outlay on capital projects. Further, the
expenditure of ` 1,244.41 crore on projects during the period was only
77 per cent of the actual receipt of ` 1,610.68 crore from funding sources for
project implementation.
Audit found that all projects of CMWSSB witnessed delay as discussed in this
report, leading to poor utilisation of project funds.
2.1.8 Expansion of sewerage network
The Action Plan for Chennai City Sewerage network under Twelfth Five Year
Plan envisaged provision of sewerage network in all areas of GCC by 2017.
Audit, however, found that as of November 2019, while UGSS was provided
in the entire erstwhile Chennai Corporation areas, only 11 of the 42 areas
newly added to the city in 2009 were provided with UGSS. Further, only one
out of the eight Municipalities/Corporations in CMA had a functional UGSS.
Areas under only one of the 11 Town Panchayats and none of the
10 Panchayat Unions had a functional UGSS as of September 2019. Audit
found issues in comprehensive planning and funding, and poor pace of project
execution.
2.1.8.1 Planning for sewage schemes
Non-formulation of sanitation strategy and City Sanitation Plan
The National policy recommends that each State and City need to formulate
their own sanitation strategy and City Sanitation Plan (CSP) in overall
conformity with the National Policy. CSP was to prioritise and plan area
specific projects. Audit, however found that the sanitation strategy and CSP
were not formulated for addressing the challenges of city sanitation. GoTN
stated (April 2020) that the policy and strategy on sewage management were
based on the Master Plan of CMWSSB. Audit observed that as the jurisdiction
of CMWSSB was the area under GCC limits only, the master plan did not
incorporate CMA level strategy. Non-availability of sanitation strategy and
CSP for CMA adversely impacted the decisions on expansion of sewerage
networks.
2.1.8.2 Inordinate delays in completion of UGSS projects
As of September 2019, (i) works on provision of UGSS was in progress in
14 newly added areas of GCC and in two other local bodies in CMA
(Appendix 2.3) at an estimated cost of ` 1,252.05 crore, (ii) Detailed Project
Reports (DPR) were approved or under preparation in respect of 12 more
added areas of GCC and six local bodies in CMA and (iii) there was no
proposal under consideration in respect of five added areas of GCC and
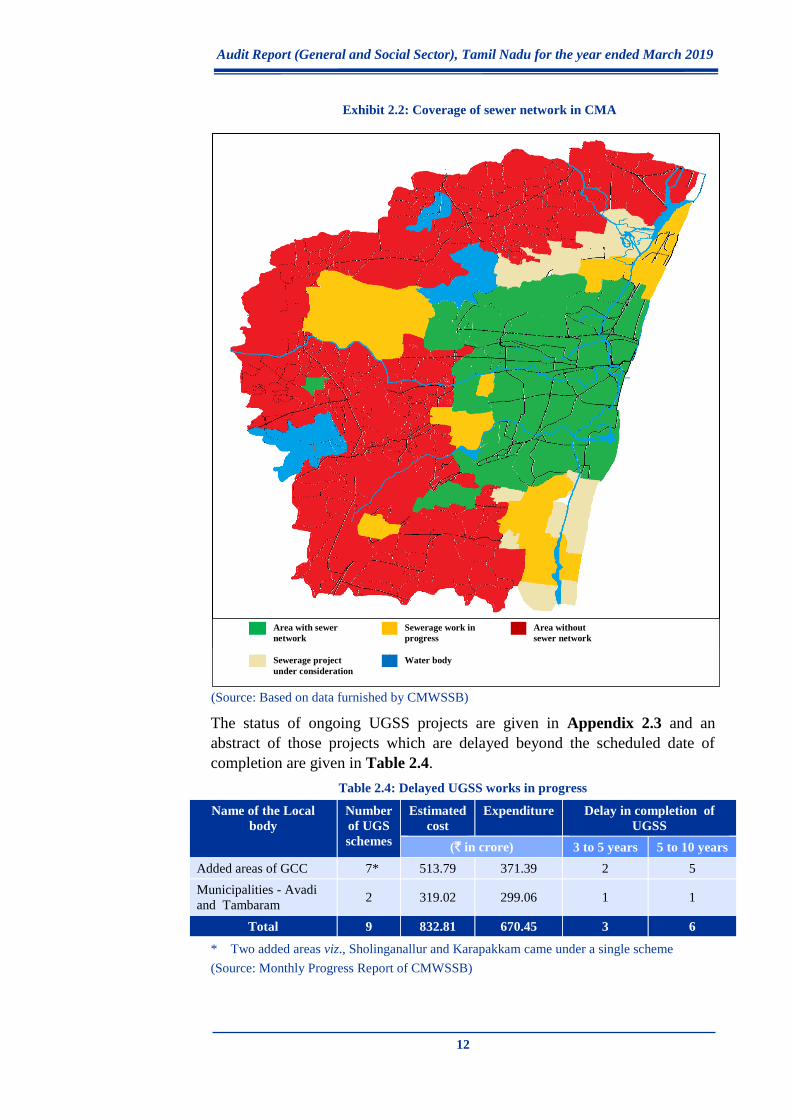
19 other local bodies in CMA. Exhibit 2.2 illustrates the status of UGSS in
CMA.
Audit Report (General and Social Sector), Tamil Nadu for the year ended March 2019
12
The status of ongoing UGSS projects are given in Appendix 2.3 and an
abstract of those projects which are delayed beyond the scheduled date of
completion are given in Table 2.4.
Table 2.4: Delayed UGSS works in progress
Name of the Local
body
Number
of UGS
schemes
Estimated
cost
Expenditure Delay in completion of
UGSS
(` in crore) 3 to 5 years 5 to 10 years
Added areas of GCC 7* 513.79 371.39 2 5
Municipalities - Avadi
and Tambaram 2 319.02 299.06 1 1
Total 9 832.81 670.45 3 6
* Two added areas viz., Sholinganallur and Karapakkam came under a single scheme
(Source: Monthly Progress Report of CMWSSB)
Exhibit 2.2: Coverage of sewer network in CMA
(Source: Based on data furnished by CMWSSB)
Area with sewer
network
Sewerage work in
progress
Area without
sewer network
Sewerage project
under consideration
Water body
Chapter II - Performance Audit
13
Audit scrutiny of UGSS projects show that these projects are plagued by
abnormal delays, mainly due to
(a) deficiencies in contract management, wherein contractors for
pipeline and STP works, were retained despite poor output as
discussed in Paragraphs 2.1.8.2 (ii), 2.1.8.2 (iii) and 2.1.8.2 (iv),
(b) lack of co-ordination with line departments, especially in digging of
roads for laying of sewer pipelines, as discussed in Paragraphs
2.1.8.2 (ii), 2.1.8.2 (v) and 2.1.8.2 (vi) (a),
(c) poor planning and faulty technical designs, as discussed in
Paragraphs 2.1.8.2 (i), 2.1.8.2 (ii), 2.1.8.2 (iii), 2.1.8.2 (iv) and
2.1.8.2 (vi) (d), and
(d) ineffective handling of issues connected with encroachment of work
sites as commented in Paragraph 2.1.8.2 (iv).
Specific failures in implementation of the projects are discussed below:
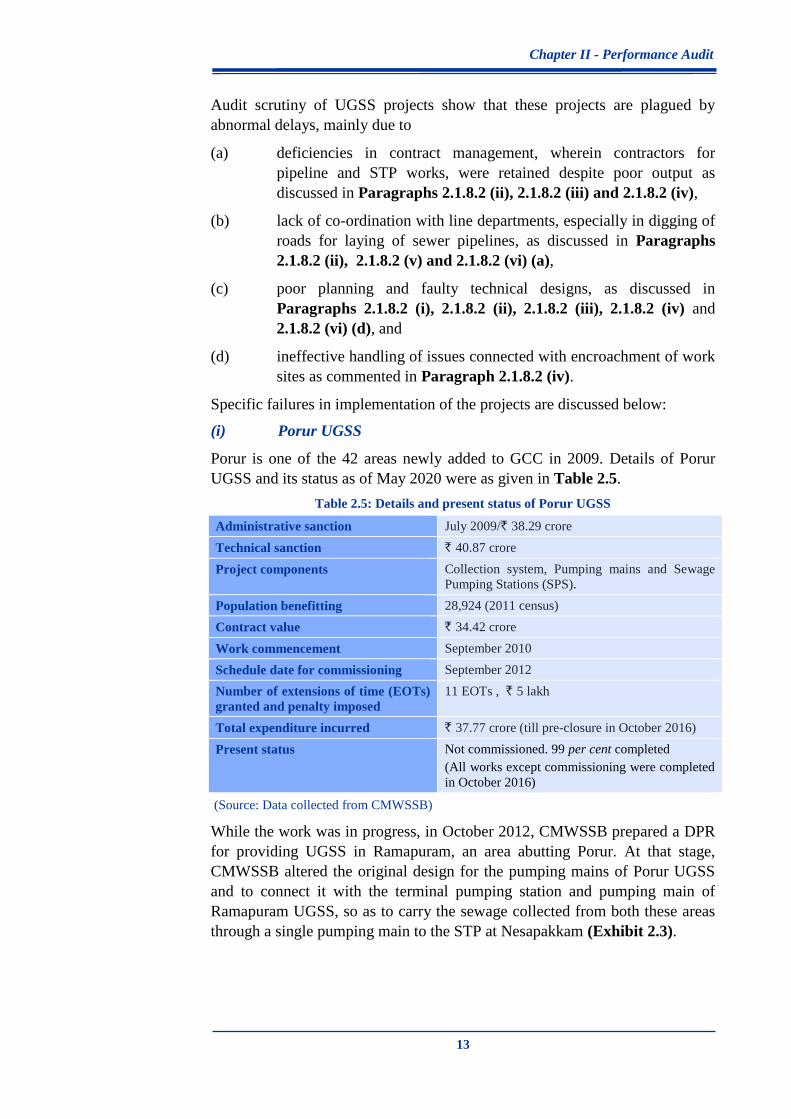
(i) Porur UGSS
Porur is one of the 42 areas newly added to GCC in 2009. Details of Porur
UGSS and its status as of May 2020 were as given in Table 2.5.
Table 2.5: Details and present status of Porur UGSS
Administrative sanction July 2009/` 38.29 crore
Technical sanction ` 40.87 crore
Project components Collection system, Pumping mains and Sewage
Pumping Stations (SPS).
Population benefitting 28,924 (2011 census)
Contract value ` 34.42 crore
Work commencement September 2010
Schedule date for commissioning September 2012
Number of extensions of time (EOTs)
granted and penalty imposed
11 EOTs , ` 5 lakh
Total expenditure incurred ` 37.77 crore (till pre-closure in October 2016)
Present status Not commissioned. 99 per cent completed
(All works except commissioning were completed
in October 2016)
(Source: Data collected from CMWSSB)
While the work was in progress, in October 2012, CMWSSB prepared a DPR
for providing UGSS in Ramapuram, an area abutting Porur. At that stage,
CMWSSB altered the original design for the pumping mains of Porur UGSS
and to connect it with the terminal pumping station and pumping main of
Ramapuram UGSS, so as to carry the sewage collected from both these areas
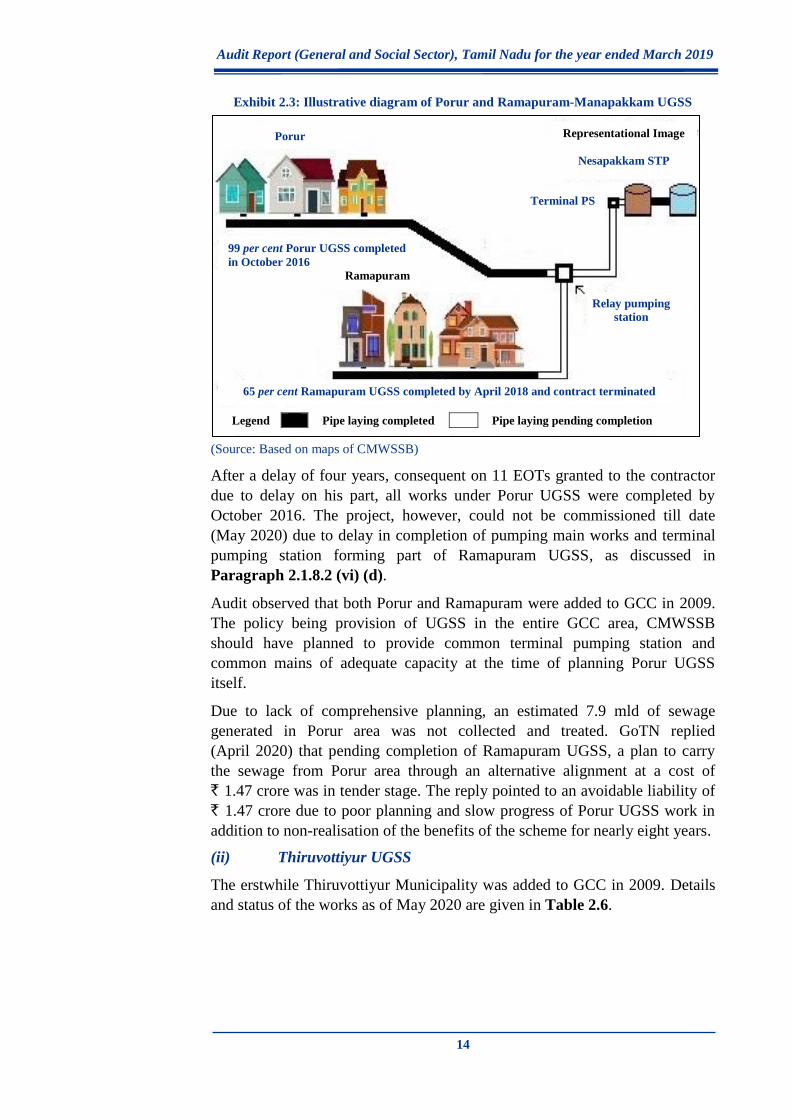
through a single pumping main to the STP at Nesapakkam (Exhibit 2.3).
Audit Report (General and Social Sector), Tamil Nadu for the year ended March 2019
14
Exhibit 2.3: Illustrative diagram of Porur and Ramapuram-Manapakkam UGSS
(Source: Based on maps of CMWSSB)
After a delay of four years, consequent on 11 EOTs granted to the contractor
due to delay on his part, all works under Porur UGSS were completed by
October 2016. The project, however, could not be commissioned till date
(May 2020) due to delay in completion of pumping main works and terminal
pumping station forming part of Ramapuram UGSS, as discussed in
Paragraph 2.1.8.2 (vi) (d).
Audit observed that both Porur and Ramapuram were added to GCC in 2009.
The policy being provision of UGSS in the entire GCC area, CMWSSB
should have planned to provide common terminal pumping station and
common mains of adequate capacity at the time of planning Porur UGSS
itself.
Due to lack of comprehensive planning, an estimated 7.9 mld of sewage
generated in Porur area was not collected and treated. GoTN replied
(April 2020) that pending completion of Ramapuram UGSS, a plan to carry
the sewage from Porur area through an alternative alignment at a cost of
` 1.47 crore was in tender stage. The reply pointed to an avoidable liability of
` 1.47 crore due to poor planning and slow progress of Porur UGSS work in
addition to non-realisation of the benefits of the scheme for nearly eight years.
(ii) Thiruvottiyur UGSS
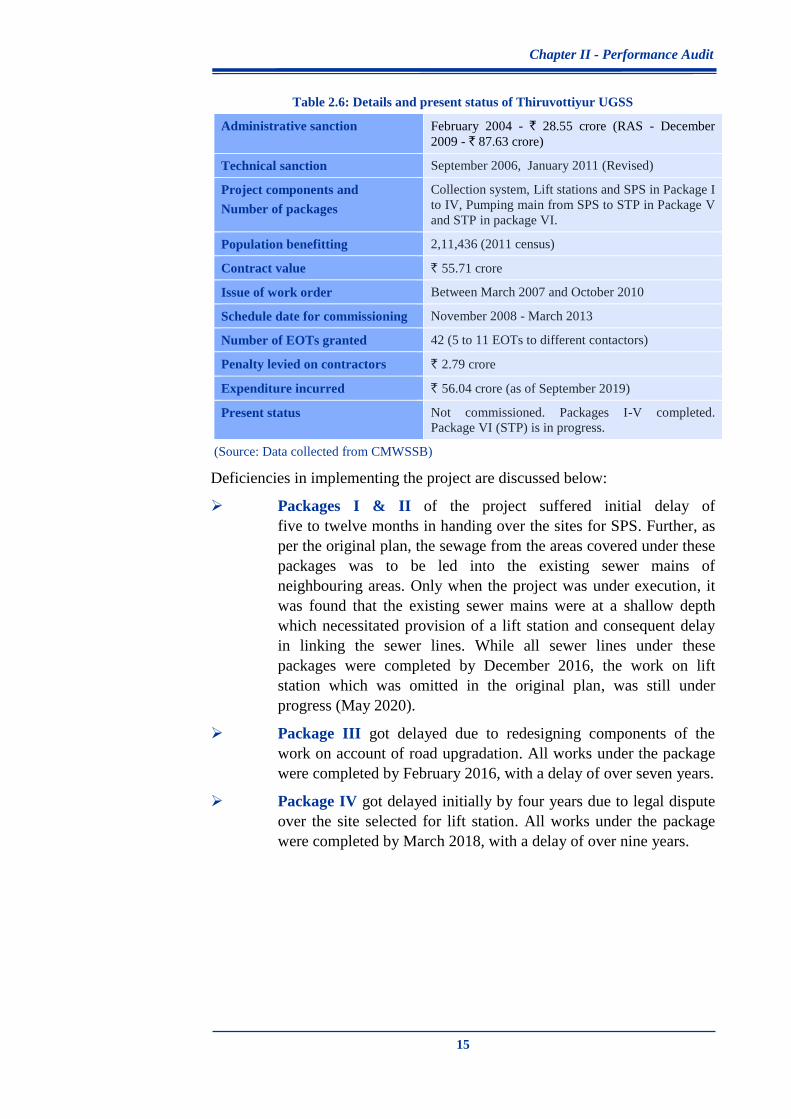
The erstwhile Thiruvottiyur Municipality was added to GCC in 2009. Details
and status of the works as of May 2020 are given in Table 2.6.
Representational Image
Nesapakkam STP
Porur
99 per cent Porur UGSS completed
in October 2016
Ramapuram
Relay pumping
station
65 per cent Ramapuram UGSS completed by April 2018 and contract terminated
Legend Pipe laying completed Pipe laying pending completion
Terminal PS
Chapter II - Performance Audit
15
Table 2.6: Details and present status of Thiruvottiyur UGSS
Administrative sanction February 2004 - ` 28.55 crore (RAS - December
2009 - ` 87.63 crore)
Technical sanction September 2006, January 2011 (Revised)
Project components and
Number of packages
Collection system, Lift stations and SPS in Package I
to IV, Pumping main from SPS to STP in Package V
and STP in package VI.
Population benefitting 2,11,436 (2011 census)
Contract value ` 55.71 crore
Issue of work order Between March 2007 and October 2010
Schedule date for commissioning November 2008 - March 2013
Number of EOTs granted 42 (5 to 11 EOTs to different contactors)
Penalty levied on contractors ` 2.79 crore
Expenditure incurred ` 56.04 crore (as of September 2019)
Present status Not commissioned. Packages I-V completed.
Package VI (STP) is in progress.
(Source: Data collected from CMWSSB)
Deficiencies in implementing the project are discussed below:
Packages I & II of the project suffered initial delay of
five to twelve months in handing over the sites for SPS. Further, as
per the original plan, the sewage from the areas covered under these
packages was to be led into the existing sewer mains of
neighbouring areas. Only when the project was under execution, it
was found that the existing sewer mains were at a shallow depth
which necessitated provision of a lift station and consequent delay
in linking the sewer lines. While all sewer lines under these
packages were completed by December 2016, the work on lift
station which was omitted in the original plan, was still under
progress (May 2020).
Package III got delayed due to redesigning components of the
work on account of road upgradation. All works under the package
were completed by February 2016, with a delay of over seven years.
Package IV got delayed initially by four years due to legal dispute
over the site selected for lift station. All works under the package
were completed by March 2018, with a delay of over nine years.
Audit Report (General and Social Sector), Tamil Nadu for the year ended March 2019
16
Package V, involving pumping main from terminal SPS to the STP,
was foreclosed in November 2008 due to change in the alignment
warranted by the change in the location of STP, and inordinate
delay in getting permission for carrying pipelines underneath
railway lines. The work was retendered by CMWSSB (May 2010)
and completed by May 2015, against the targeted completion in
June 2012. The delay of three years was due to slow progress of
work covered by five EOTs on account of site conditions which
included an ongoing road widening work and delay in obtaining
permission for railway line crossings.
Thiruvottiyur STP Package: The site identified for the STP was
changed twice; first due to issues in getting clearance under Coastal
Zone Regulations, and second time due to public protest as the
identified site was a burial ground. The third site identified and
handed over (March 2011) to the contractor was a garbage dumping
ground with about 10 feet of garbage pile up. The contractor,
inter alia, cited the delay in handing over the site as the reason for
delay and the same was accepted as one of the reasons for repeated
EOTs. Audit, however, observed that the delay was unjustified as
the contractor had not completed the work even after nine years of
handing over of the site. CMWSSB had allowed 10 EOTs to cover
the delay and levied penalties totaling to ` 1.10 crore. As of
April 2017, 97 per cent of the work was completed, but the work
did not progress thereafter. In July 2019, CMWSSB decided to
study the possibility of upgrading the technology used in the STP
from the Activated Sludge Processing (ASP) technology into
Sequencing Batch Reactor (SBR) technology6. This proposal was
under consideration to meet the new (April 2019) norms. No
further progress was made (March 2020).
As per CPHEEO Manual, the STP work should be scheduled before
the pipe line works, so as to synchronise the different packages.
CMWSSB, however, scheduled the packages for sewer lines before
the scheduled completion of STP. As a result, the pipeline works in
five packages were fully completed, but the project could not be
commissioned as the STP was not ready.
Thus, due to failures in planning and scheduling, lack of effective coordination
in land allocation and handing over site and granting unjustified EOTs, the
project sanctioned administratively in 2009, could not be commissioned even
as of March 2020. As a result, (i) even seven years after the scheduled date of
completion, an estimated 16.14 mld of sewage generated in that area was not
collected for treatment and (ii) 2,620 manholes of the Thiruvottiyur UGSS,
6 Both the technologies primarily use aeration and aerobic microorganisms to digest
organic matter in the sewage. SBR is a relatively newer technology with better
treatment at lower cost by processing the sewage in batches in the same tanks.
Chapter II - Performance Audit
17
constructed long back without synchronising with the construction of STP, got
buried due to relaying of roads. CMWSSB had to incur ` 1.44 crore for
tracing and raising these manholes.
GoTN accepted the facts and stated (April 2020) that the contractor met with
financial crunch and consequently could not show any progress in work. The
reply was untenable as CMWSSB had termed the performance of the
contractor as poor in May 2013 itself, but the contractor was given repeated
EOTs leading to the abnormal delays. Further GoTN did not explain the
indecisiveness in respect of the technology to be used in the STP, which
caused further delay.
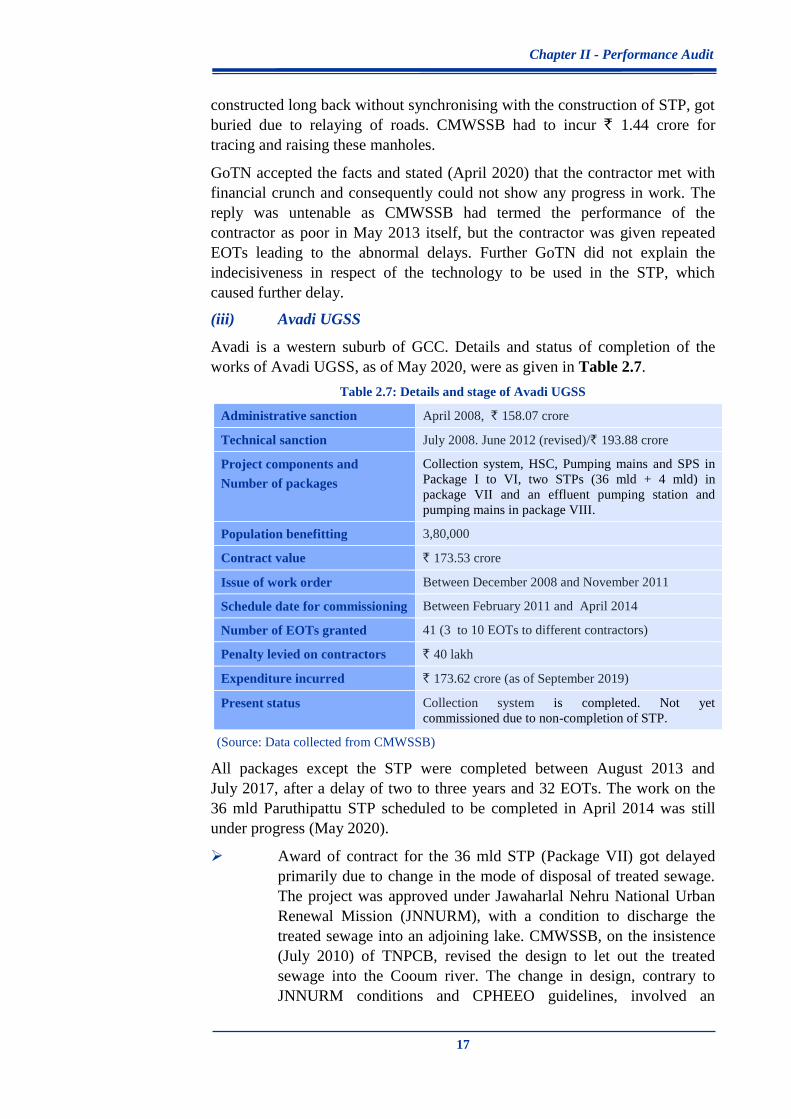
(iii) Avadi UGSS
Avadi is a western suburb of GCC. Details and status of completion of the
works of Avadi UGSS, as of May 2020, were as given in Table 2.7.
Table 2.7: Details and stage of Avadi UGSS
Administrative sanction April 2008, ` 158.07 crore
Technical sanction July 2008. June 2012 (revised)/` 193.88 crore
Project components and
Number of packages
Collection system, HSC, Pumping mains and SPS in
Package I to VI, two STPs (36 mld + 4 mld) in
package VII and an effluent pumping station and
pumping mains in package VIII.
Population benefitting 3,80,000
Contract value ` 173.53 crore
Issue of work order Between December 2008 and November 2011
Schedule date for commissioning Between February 2011 and April 2014
Number of EOTs granted 41 (3 to 10 EOTs to different contractors)
Penalty levied on contractors ` 40 lakh
Expenditure incurred ` 173.62 crore (as of September 2019)
Present status Collection system is completed. Not yet
commissioned due to non-completion of STP.
(Source: Data collected from CMWSSB)
All packages except the STP were completed between August 2013 and
July 2017, after a delay of two to three years and 32 EOTs. The work on the
36 mld Paruthipattu STP scheduled to be completed in April 2014 was still
under progress (May 2020).
Award of contract for the 36 mld STP (Package VII) got delayed
primarily due to change in the mode of disposal of treated sewage.
The project was approved under Jawaharlal Nehru National Urban
Renewal Mission (JNNURM), with a condition to discharge the
treated sewage into an adjoining lake. CMWSSB, on the insistence
(July 2010) of TNPCB, revised the design to let out the treated
sewage into the Cooum river. The change in design, contrary to
JNNURM conditions and CPHEEO guidelines, involved an
Audit Report (General and Social Sector), Tamil Nadu for the year ended March 2019
18
additional expenditure of ` 5.74 crore. The contract awarded in
November 2011 was scheduled to be completed in April 2014.
However, due to slow progress, CMWSSB granted nine EOTs to
the contractor and in July 2019 issued a show cause notice. After
arbitration (August 2019) the contractor was granted further
extension. The work was incomplete as of March 2020. In the
meantime, the STP with a capacity of four mld was completed and
commissioned in March 2019.
Even as a decision on discharge of treated effluent was being
debated, in violation of CPHEEO manual provision of scheduling
UG pipeline works after scheduling STP, CMWSSB proceeded
with tendering and award of contracts for pipeline works in all the
seven packages in December 2008 and completed between June
2014 and July 2017. As a result of non-synchronising of UG
pipeline works with the STP works, pipeline works were completed
and the entire infrastructure was lying idle for over three years.
Thus, as a result of the delay caused by deficient planning and contract
management, (i) an estimated 20.65 mld of sewage generated in Avadi area
remained uncollected and (ii) as the designed capacity of the STP would cater
to the projected population as of 20237, the STP would require capacity
expansion within a very short period of its commissioning, as 12 years out of
design life of 15 years had already lapsed. Similarly, 12 years out of the design
life of 30 years of the sewer lines had also lapsed, and pipelines in
120 reaches and 2,869 manholes got damaged over the years by other civic
agencies working in that stretches. CMWSSB’s contractor estimated
(April 2018) that it would cost ` 7.50 crore to rectify the damages.
GoTN replied (April 2020) that the sewage collection systems were handed
over to the Local Body and partial operations were started. GoTN also stated
that once house service connections were effected, the projects would be fully
commissioned. The reply was untenable as only the four mld STP was
commissioned in March 2019 after a delay of five years and the main 36 mld
STP was still under construction, leading to only partial utilisation of the
infrastructure created.
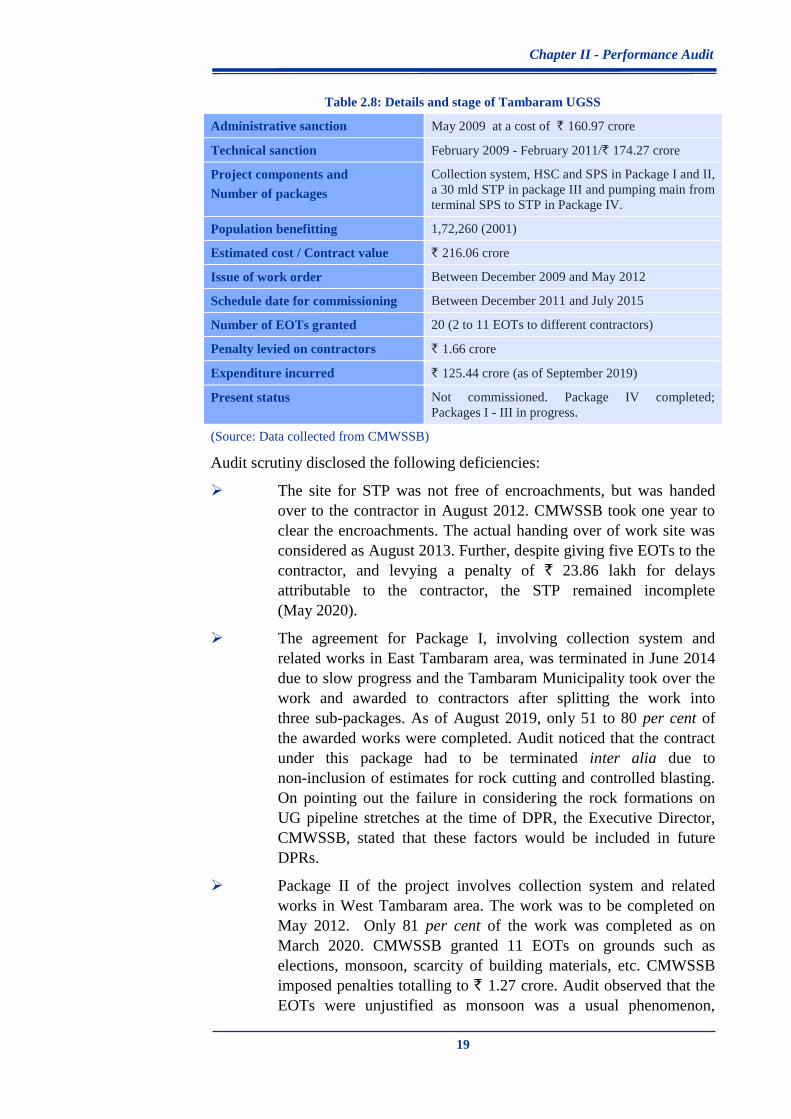
(iv) Tambaram UGSS
Details and status of completion of the works of Tambaram UGSS, as of
May 2020, were as given in Table 2.8.
7 STP was designed in 2008 with a 15 year design life, i.e., to meet the projected
population as of 2023.
Chapter II - Performance Audit
19
Table 2.8: Details and stage of Tambaram UGSS
Administrative sanction May 2009 at a cost of ` 160.97 crore
Technical sanction February 2009 - February 2011/` 174.27 crore
Project components and
Number of packages
Collection system, HSC and SPS in Package I and II,
a 30 mld STP in package III and pumping main from
terminal SPS to STP in Package IV.
Population benefitting 1,72,260 (2001)
Estimated cost / Contract value ` 216.06 crore
Issue of work order Between December 2009 and May 2012
Schedule date for commissioning Between December 2011 and July 2015
Number of EOTs granted 20 (2 to 11 EOTs to different contractors)
Penalty levied on contractors ` 1.66 crore
Expenditure incurred ` 125.44 crore (as of September 2019)
Present status Not commissioned. Package IV completed;
Packages I - III in progress.
(Source: Data collected from CMWSSB)
Audit scrutiny disclosed the following deficiencies:
The site for STP was not free of encroachments, but was handed
over to the contractor in August 2012. CMWSSB took one year to
clear the encroachments. The actual handing over of work site was
considered as August 2013. Further, despite giving five EOTs to the
contractor, and levying a penalty of ` 23.86 lakh for delays
attributable to the contractor, the STP remained incomplete
(May 2020).
The agreement for Package I, involving collection system and
related works in East Tambaram area, was terminated in June 2014
due to slow progress and the Tambaram Municipality took over the
work and awarded to contractors after splitting the work into
three sub-packages. As of August 2019, only 51 to 80 per cent of
the awarded works were completed. Audit noticed that the contract
under this package had to be terminated inter alia due to
non-inclusion of estimates for rock cutting and controlled blasting.
On pointing out the failure in considering the rock formations on
UG pipeline stretches at the time of DPR, the Executive Director,
CMWSSB, stated that these factors would be included in future
DPRs.
Package II of the project involves collection system and related
works in West Tambaram area. The work was to be completed on
May 2012. Only 81 per cent of the work was completed as on
March 2020. CMWSSB granted 11 EOTs on grounds such as
elections, monsoon, scarcity of building materials, etc. CMWSSB
imposed penalties totalling to ` 1.27 crore. Audit observed that the
EOTs were unjustified as monsoon was a usual phenomenon,
Audit Report (General and Social Sector), Tamil Nadu for the year ended March 2019
20
election related code of conduct would not affect ongoing works
and GoTN being the regulator of sand quarrying, scarcity could
have been avoided by proper coordination. While the STP
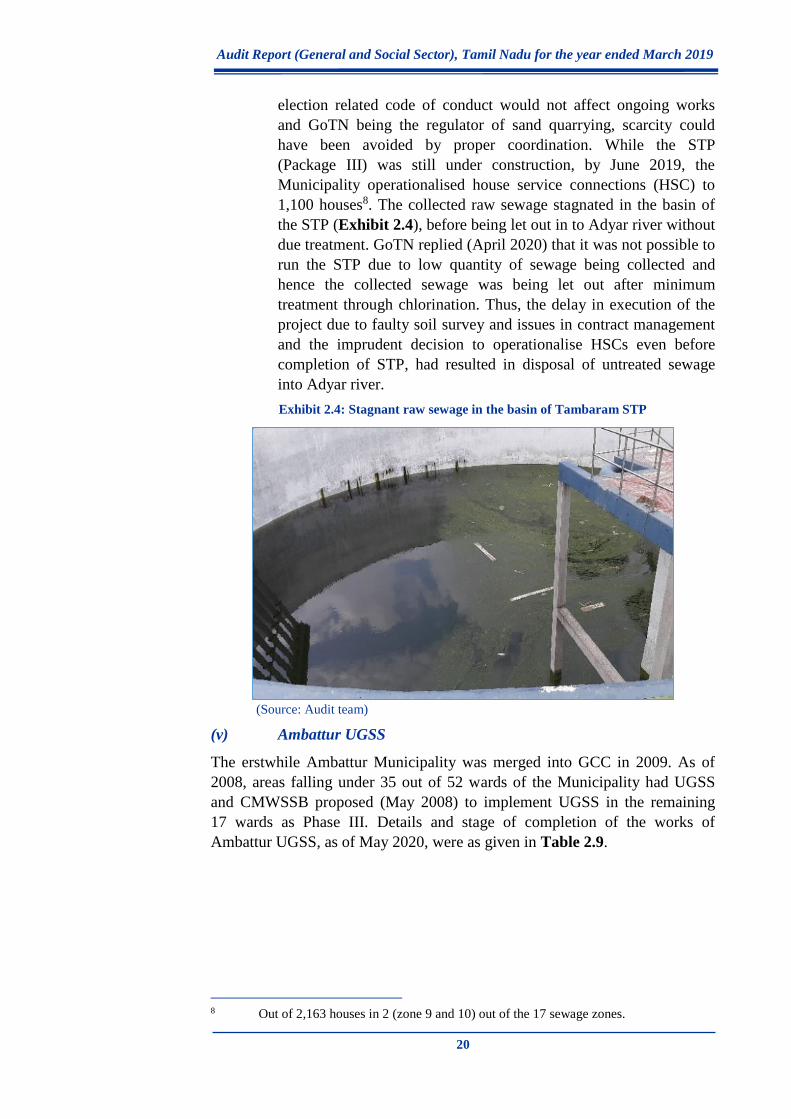
(Package III) was still under construction, by June 2019, the
Municipality operationalised house service connections (HSC) to
1,100 houses8. The collected raw sewage stagnated in the basin of
the STP (Exhibit 2.4), before being let out in to Adyar river without
due treatment. GoTN replied (April 2020) that it was not possible to
run the STP due to low quantity of sewage being collected and
hence the collected sewage was being let out after minimum
treatment through chlorination. Thus, the delay in execution of the
project due to faulty soil survey and issues in contract management
and the imprudent decision to operationalise HSCs even before
completion of STP, had resulted in disposal of untreated sewage
into Adyar river.
Exhibit 2.4: Stagnant raw sewage in the basin of Tambaram STP
(Source: Audit team)
(v) Ambattur UGSS
The erstwhile Ambattur Municipality was merged into GCC in 2009. As of
2008, areas falling under 35 out of 52 wards of the Municipality had UGSS
and CMWSSB proposed (May 2008) to implement UGSS in the remaining
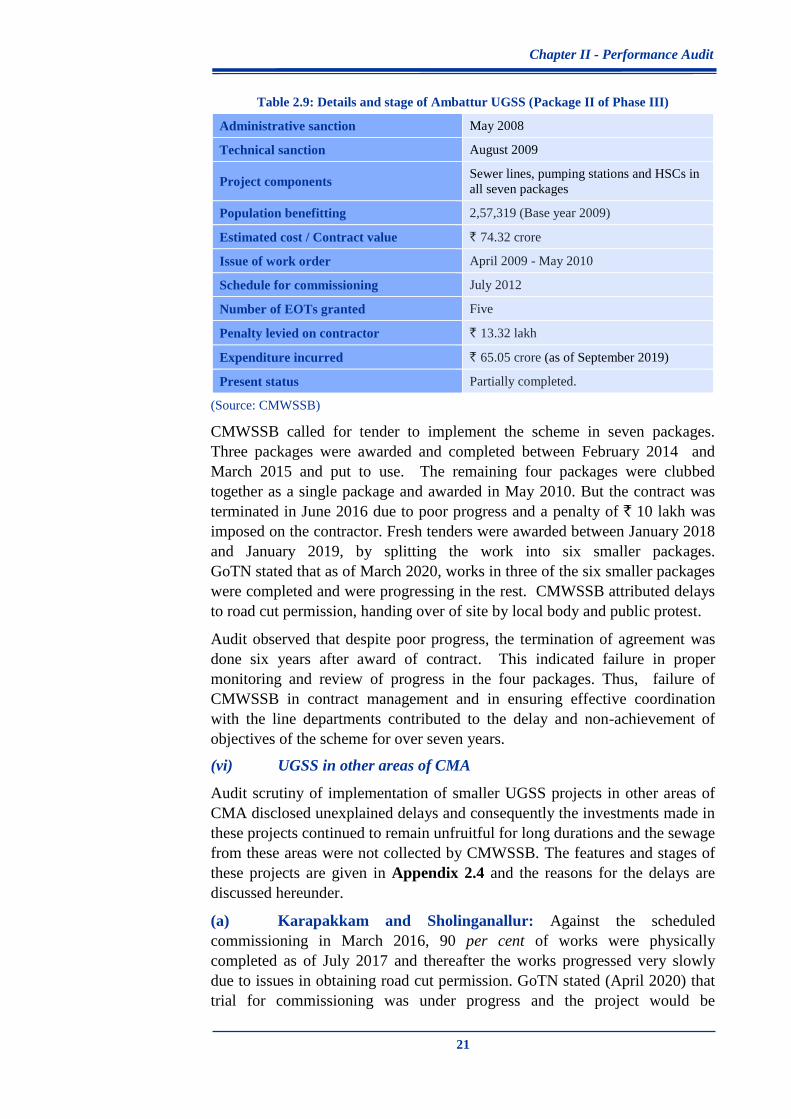
17 wards as Phase III. Details and stage of completion of the works of
Ambattur UGSS, as of May 2020, were as given in Table 2.9.
8 Out of 2,163 houses in 2 (zone 9 and 10) out of the 17 sewage zones.
Chapter II - Performance Audit
21
Table 2.9: Details and stage of Ambattur UGSS (Package II of Phase III)
Administrative sanction May 2008
Technical sanction August 2009
Project components Sewer lines, pumping stations and HSCs in
all seven packages
Population benefitting 2,57,319 (Base year 2009)
Estimated cost / Contract value ` 74.32 crore
Issue of work order April 2009 - May 2010
Schedule for commissioning July 2012
Number of EOTs granted Five
Penalty levied on contractor ` 13.32 lakh
Expenditure incurred ` 65.05 crore (as of September 2019)
Present status Partially completed.
(Source: CMWSSB)
CMWSSB called for tender to implement the scheme in seven packages.
Three packages were awarded and completed between February 2014 and
March 2015 and put to use. The remaining four packages were clubbed
together as a single package and awarded in May 2010. But the contract was
terminated in June 2016 due to poor progress and a penalty of ` 10 lakh was
imposed on the contractor. Fresh tenders were awarded between January 2018
and January 2019, by splitting the work into six smaller packages.
GoTN stated that as of March 2020, works in three of the six smaller packages
were completed and were progressing in the rest. CMWSSB attributed delays
to road cut permission, handing over of site by local body and public protest.
Audit observed that despite poor progress, the termination of agreement was
done six years after award of contract. This indicated failure in proper
monitoring and review of progress in the four packages. Thus, failure of
CMWSSB in contract management and in ensuring effective coordination
with the line departments contributed to the delay and non-achievement of
objectives of the scheme for over seven years.
(vi) UGSS in other areas of CMA
Audit scrutiny of implementation of smaller UGSS projects in other areas of
CMA disclosed unexplained delays and consequently the investments made in
these projects continued to remain unfruitful for long durations and the sewage
from these areas were not collected by CMWSSB. The features and stages of
these projects are given in Appendix 2.4 and the reasons for the delays are
discussed hereunder.
(a) Karapakkam and Sholinganallur: Against the scheduled
commissioning in March 2016, 90 per cent of works were physically
completed as of July 2017 and thereafter the works progressed very slowly
due to issues in obtaining road cut permission. GoTN stated (April 2020) that
trial for commissioning was under progress and the project would be
Audit Report (General and Social Sector), Tamil Nadu for the year ended March 2019
22
commissioned soon. But, the fact was that as of May 2020, the project was
delayed by more than four years, mainly due to deficiencies in coordination
with other agencies connected with the work site.
(b) Pallikaranai: Against the scheduled commissioning in
February 2013, 96 per cent of supply and erection of electrical, mechanical
and instrumentation works along with construction of pumping station were
physically completed as of July 2017. There was no progress thereafter.
Due to slow progress of work, show cause notice was issued (October 2018)
for termination of the contract and the contractor filed (November 2018) a
case in the Hon’ble Madras High Court and the arbitrator appointed (January
2019) by the Court allowed (November 2019) the termination. CMWSSB
called for fresh tenders (January 2020). Thus, primarily due to issues in
contract management, the Pallikaranai UGSS project was delayed by over
seven years. GoTN stated (April 2020) that the process for retendering was
going on.
(c) Perungudi: The project was scheduled for commissioning in
November 2012, however no progress was achieved as on May 2020.
GoTN attributed reasons such as sandy soil, delay in handing over site and
issues with shifting of electricity cables and water pipelines, etc,. for the slow
progress of work. Audit observed that lapses in planning and project
management were the primary reasons for the delay.
(d) Ramapuram: As of July 2017, 88.48 and 66 per cent of
construction of manholes and pumping stations were completed. Thereafter,
the contractor did not show any progress in the work. Therefore, the contract
was terminated (November 2018) and CMWSSB imposed a penalty of
` 66 lakh. GoTN (April 2020) stated that action was being taken for calling
fresh tenders.
(e) Nerkundram UGSS: In 2009, GoTN brought Nerkundram under
GCC. In March 2016, a DPR for the Nerkundram UGSS was prepared at a
cost of ` 106.55 crore and technical sanction was accorded (July 2016) by the
Engineering Director. In the meantime, CMWSSB proposed (June 2016) to
Government to accord revised administrative sanction under Chennai Rivers
Restoration Trust (CRRT). In anticipation of revised administrative sanction
from Government, CMWSSB invited (July 2016) tender and the single
responsive tender was rejected. In the meantime, Government accorded
(January 2017) revised administrative sanction and the estimate for the work
was revised (September 2017) for ` 100.35 crore. Re-tender was invited
during September 2017 and work order was awarded in January 2019 after a
delay of one year and four months for a contract value of ` 56.51 crore with
contract period of 30 months. Work was commenced in June 2019 and was
under progress (August 2019). Thus, due to abnormal delay in finalisation of
tender, the project could not be completed, thereby impacting sewage
collection.
Chapter II - Performance Audit
23
(vii) Abandoned projects
In September 2008, CMWSSB prepared a DPR for providing UGSS to
eight town panchayats9 (TP) in CMA at a total cost of ` 312.04 crore.
GoI approved (January 2009) the project under JNNURM with GoI, GoTN
and local body share at the ratio of 35:15:50. GoI and GoTN released
(March 2009) ` 27.15 crore and ` 11.63 crore as their share and share of local
bodies was proposed to be met by obtaining loan from Tamil Nadu Urban
Finance and Infrastructure Development Corporation Limited. Of the
eight TPs, works were taken up only in Pallikaranai and Perungudi, which
were added (October 2011) to GCC and in Tirumazhisai TP. Audit noticed
that mainly due to inability in mobilising funds for local body share, the
projects proposed for the remaining five town panchayats were dropped and
the grant of ` 38.78 crore already received from GoI and GoTN were
refunded.
Thus, despite availability of 35 per cent of project cost as grant from GoI,
GoTN did not attach due importance, leading to scrapping of sanctioned
projects. Audit found that there was no plan to revive these projects.
(viii) Impact of delays in project implementation
The delays in completion of sewerage projects discussed in
Paragraphs 2.1.8.2 (i) to 2.1.8.2 (vi) resulted in continued unsafe disposal of
sewage. Further, Audit observed that:
The undue delays in completion of UGSS projects had resulted in
cost escalation of ` 82.91 crore in respect of three projects
(Appendix 2.5) which are under implementation beyond their target
date for completion. The remaining projects were also likely to
overshoot the estimated cost when they are finally completed.
Six10 of the nine UGSS projects delayed beyond the target date were
implemented with JNNURM funds. Against the total sanction of
` 198.45 crore under JNNURM for these six projects, only
` 179.96 crore was received from GoI as of March 2019. As
JNNURM has since been wound up and these long pending projects
were not approved for continued funding under AMRUT scheme,
which succeeded JNNURM, GoI grant of ` 18.49 crore would not
be received and hence would be an additional burden on GoTN’s
budgetary resources.
As per the CPHEEO manual, sewerage projects are designed for
serving the projected population over the next 30 years. The STP
component is designed with the projected population at the end of
15 years from the base year. Audit observed that the abnormal
9 Chitlapakkam, Madambakkam, Pallikaranai, Peerkankaranai, Perungalathur,
Perungudi, Sembakkam and Thirumazhisai. 10 Ambattur, Avadi, Pallikaranai, Perungudi, Porur and Tambaram.
Audit Report (General and Social Sector), Tamil Nadu for the year ended March 2019
24
delays in Avadi, Tambaram and Thiruvottiyur STP projects would
lead to saturation of capacity in less than four/five years of
commissioning of these infrastructure and consequent possible
deterioration in the quality of treatment and need for further
investments. Further, these delays adversely impacted the
economic life span of the infrastructure created at huge cost.
Commissioning of completed packages were delayed due to
non-completion of other related packages. This would help
contractors of the completed packages to evade responsibilities for
construction defects which would ultimately come to notice only at
the time of trial run/commissioning of the project. The defect
liability periods and warranty period for electro mechanical items
would lapse as happened in the case of Package VI of Avadi UGSS.
An estimated 74.69 mld of sewage generated (Appendix 2.6) in the
project area was not collected for treatment due to the delay in
completion of the projects. Further, as the septage generated in
these areas were not handled properly, as commented in
Paragraph 2.1.9.3, the delayed completion of projects contributed
to water pollution in CMA.
In response to the delays pointed in Paragraphs 2.1.8.2 (i) to 2.1.8.2 (vi)
above, in the Exit Conference, the Executive Director stated that the sub soil
conditions of CMA region varied widely and monsoon season impacted the
timely completion of schemes. The Additional Chief Secretary, MAWS
Department observed that the involvement of multiple agencies for clearances
also contributed to the delay. Further, the Executive Director stated that the
time period adopted at present for completion of UGSS was 36 months,
irrespective of the conditions involved, and agreed that scheme specific factors
would be taken into consideration in future projects. In view of the facts
discussed in Paragraphs 2.1.8.2 (i) to 2.1.8.2 (vi) and the views expressed in
the Exit conference, Audit observed that effective planning, coordination with
line departments and contract management would have helped to avoid the
delay.
2.1.9 Sewage collection
As discussed in Paragraph 2.1.6, the sewerage network failed to collect
556 mld of sewage from CMA. Audit found that sewage from areas already
having sewer network as well as areas without sewer network were directly
flowing into the waterways of Chennai. Issues and deficiencies in sewage
collection are discussed hereunder.
2.1.9.1 Non-installation of flow meters in Sewage Pumping Stations
CPHEEO Manual envisages installation of flow meters for measuring sewage
received by pumping stations. Measuring sewage at SPSs would facilitate
identification of seepages in pipes carrying sewage to the SPS by enabling
comparison of daily collection. It will also facilitate identification of seepage
Chapter II - Performance Audit
25
in the pipeline from SPS to STP by comparing the pumped quantity with the
quantity received by STPs. Audit found that flow meters were not installed in
any of the SPSs of CMWSSB. It was replied that the sewage discharge
quantity was calculated based on pump running hour and efficiency of the
pump sets.
Audit found that in Pallavaram SPS of Pallavaram Municipality, the flow
meter was working properly for collecting charges from Pallavaram
Municipality. Therefore, Audit observed that providing meters for better
measurement of operational efficiency in sewage collection and pumping was
not a complex task and there was no reason why the flow meters could not be
made operational in SPSs of CMWSSB.
Audit also observed that in the absence of flow meters, SPSs and STPs of
CMWSSB were not in position to ascertain whether volume of sewage stated
to be pumped by the preceding SPS was actually received in the wells of
receiving SPS or STP. Measuring the performance of SPSs using pump
running hours would not give accurate data as the quantity actually pumped
would vary from the designed capacity of the pumps due to ageing, power
fluctuations etc. This would help to hide operational deficiencies as the system
lack transparency, which would ultimately affect the efficiency in sewage
collection. Availability of accurate data on sewage collection assumes
importance in the context of partial UGSS coverage in the city and large
amount of sewage entering water bodies through SWD as discussed in
Paragraph 2.1.10.
In response to Audit, GoTN stated (April 2020) that provision of flow meter in
SPS has not been made mandatory in the CPHEEO Manual; but, as pointed
out by Audit, the flow meters would be installed in all SPSs of CMWSSB in
due course.
2.1.9.2 Sewage not received at STP due to pipeline burst
Keelkattalai pumping station of Pallavaram Municipality pumps an average of
12.05 mld of sewage to Perungudi STP of CMWSSB. CMWSSB treats and
disposes the treated sewage and for that collects sewage treatment and
disposal charges at ` 4.65 per KL from Pallavaram Municipality. Audit found
that for 199 days during November 2017 to June 2018, an estimated
2,398 million litres of sewage was not received from Pallavaram Municipality
due to pipeline burst. Evidently, during this period, the uncollected sewage
was discharged into water bodies without treatment.
2.1.9.3 Non-adherence of guidelines of septage management by
CMWSSB and local bodies in CMA
Thirty one out of forty two added areas of GCC, seven out of eight
municipalities, 10 out of 11 Town Panchayats and all 10 Panchayat Unions of
CMA were not provided with UGSS. In unsewered areas, sewage are collected
in septic tanks for onward transmission to STPs. Sewage that is stored in a
septic tank is commonly called as septage. In September 2014, GoTN
Audit Report (General and Social Sector), Tamil Nadu for the year ended March 2019
26
reviewed the situation and felt that even as the available STPs were
underutilised11, septage from unsewered areas were let out into water bodies
without treatment. In view of that, GoTN issued (September 2014)
comprehensive guidelines which contemplated the initiatives for management
of septage in unsewered areas. The major elements of septage management
which requires the involvement of local bodies/statutory bodies (CMWSSB)
are septage transportation, treatment, septage disposal, record-keeping and
reporting (Management Information System) as discussed below:
Local body clusters have been identified for treatment of collected
septage at earmarked STP locations. All septage transportation
vehicles should be directed to transport septage to their designated
STP.
Only certified and licensed septage transporters to de-sludge and
transport waste to the designated STP. The transporters should be
selected in accordance with The Tamil Nadu Transparency in
Tenders Act, 1998, as per the terms and conditions.
Information related to septage generation from residents and
commercial establishments needs to be collected by the local
bodies, household level details of insanitary latrines, identification
of septic tank location, operator in-charge for each location, vehicle
details, name and location of STP earmarked for disposal of
septage, and decant facility details should be duly collected by all
local bodies.
Audit observations in management of septage by CMWSSB and local bodies
are discussed below:
(a) GCC areas including added areas of GCC
CMWSSB did not maintain any data on houses within its jurisdiction without
sewer connections. The 2014 orders of GoTN on septage management was not
implemented by CMWSSB even as of October 2019.
(b) Other local body areas in CMA
A total of eight12 local bodies were test-checked. None of them had a
functioning UGSS. The status of implementation of GoTN’s instructions on
septage management in the sampled local bodies was as given below:
Septic tank enumeration was not carried out in four13 LBs, which
made it difficult to monitor septage disposal.
11 Average actual sewage treatment was 530 mld against the combined installed
capacity of 727 mld of the 12 STPs in operation. 12 Avadi, Chitlapakkam, Poonamallee, St. Thomas Mount, Tambaram, Thirumazhisai,
Thiruneermalai and Villivakkam. 13 Chitlapakkam and Thiruneermalai TPs; Poonamallee and St. Thomas Mount PUs.
Chapter II - Performance Audit
27
The list of locations where sewage is getting mixed with storm
water drain were not enumerated and maintained by any of the
eight LBs.
Licenses were not granted for transporting septage in five14 LBs.
Although licenses were issued in the remaining three LBs, records
relating to details of STPs where the trucks decanted the septage,
were not made available to Audit. In the absence of monitoring of
septage trucks, safe disposal of the collected septage could not be
ensured and would entail the risk of letting out septage into the
water bodies. None of the LBs had details of their designated STP
and its decanting facilities.
Training sessions for LB staff, training/orientation sessions for
septage transporters/private vendors have not been conducted in
any LBs.
Thus, due to non-enforcement of the orders of GoTN, proper collection and
treatment of septage from unsewered areas was not ensured. The failure of
CMWSSB and local bodies to implement the guidelines pointed to lack of
willingness on their part and improper disposal of septic tank effluents and
septage pose direct and indirect socio-economic impacts.
2.1.9.4 Inadequate decanting facilities
Construction of decanting facility for receiving septage from areas not covered
by sewerage system is a mandatory part of sewage management. Major
decanting facilities for receiving septage through lorries are available only in
Nesapakkam and Perungudi STPs. The STPs at Kodungaiyur and
Koyambedu, which are closer to nine unsewered added areas of GCC with a
sewage generation of 54.42 mld, did not have decanting facilities. Audit found
that only 3.6 mld out of an estimated 375 mld generated in areas without
sewer lines was received by the decanting facilities of CMWSSB. Audit
observed that non-availability of sufficient decanting facilities at STPs was
one reason for non-collection and non-treatment of septage from areas without
sewer networks.
GoTN stated that in addition to the two STPs with decanting facilities,
three SPSs15 also had facility to receive septage through tankers. Audit found
that the total sewage handled by these three SPSs was only 85 mld and hence
in view of the total estimated uncollected sewage of 629 mld, the existing
facilities to receive septage through lorries were grossly inadequate, which
would result in the lorries letting out septage into the water bodies.
2.1.9.5 Non-maintenance of database on licensed septage transporters
Audit observed that data on volume of septage received in STP through lorries
were alone maintained. The data on details of certified and licensed septage
14 Poonamallee, St. Thomas Mount, Thirumazhisai, Thiruneermalai and Villivakkam. 15 Erukkencheri, Ganga Nagar and Mogappair.
Audit Report (General and Social Sector), Tamil Nadu for the year ended March 2019
28
transporters to de-sludge and transport waste to the designated STP were not
maintained by STPs and local bodies. CMWSSB replied that septage vehicles
were being operated by private transporters and they decant sewage at STPs
by paying charges fixed by CMWSSB. Audit observed that in the absence of
information on the local bodies from which septage was transported to the
STP, CMWSSB was not in a position to quantify separately the volume of
sewage received from each local bodies. GoTN stated (April 2020) that private
sewer lorries were not registered with government agencies, but CMWSSB
was maintaining data on septage transported by its lorries. The reply was
untenable as CMWSSB was providing septage transportation service only in
GCC area and the private operators in the rest of CMA were not monitored.
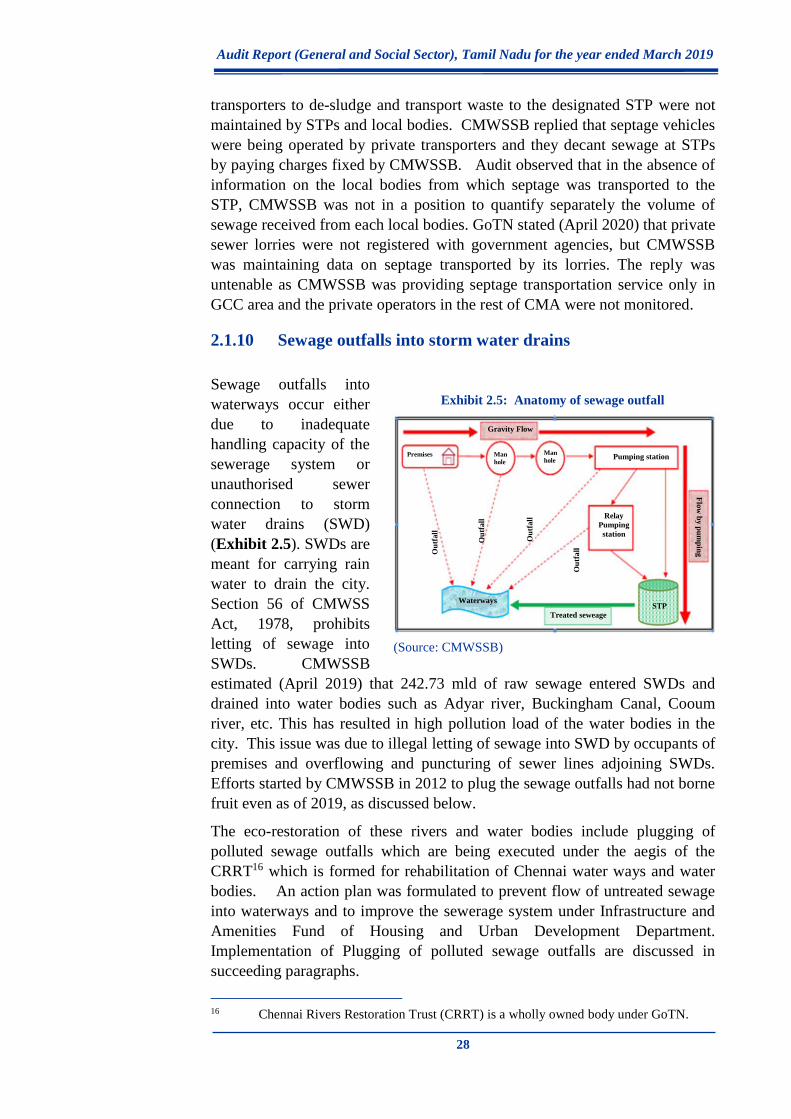
2.1.10 Sewage outfalls into storm water drains
Sewage outfalls into
waterways occur either
due to inadequate
handling capacity of the
sewerage system or
unauthorised sewer
connection to storm
water drains (SWD)
(Exhibit 2.5). SWDs are
meant for carrying rain
water to drain the city.
Section 56 of CMWSS
Act, 1978, prohibits
letting of sewage into
SWDs. CMWSSB
estimated (April 2019) that 242.73 mld of raw sewage entered SWDs and
drained into water bodies such as Adyar river, Buckingham Canal, Cooum
river, etc. This has resulted in high pollution load of the water bodies in the
city. This issue was due to illegal letting of sewage into SWD by occupants of
premises and overflowing and puncturing of sewer lines adjoining SWDs.
Efforts started by CMWSSB in 2012 to plug the sewage outfalls had not borne
fruit even as of 2019, as discussed below.
The eco-restoration of these rivers and water bodies include plugging of
polluted sewage outfalls which are being executed under the aegis of the
CRRT16 which is formed for rehabilitation of Chennai water ways and water
bodies. An action plan was formulated to prevent flow of untreated sewage
into waterways and to improve the sewerage system under Infrastructure and
Amenities Fund of Housing and Urban Development Department.
Implementation of Plugging of polluted sewage outfalls are discussed in
succeeding paragraphs.
16 Chennai Rivers Restoration Trust (CRRT) is a wholly owned body under GoTN.
Exhibit 2.5: Anatomy of sewage outfall
(Source: CMWSSB)
Gravity Flow
Premises Man
hole Pumping station Man
hole
Relay
Pumping
station
Waterways
Treated seweage STP
Ou
tfall
Ou
tfall
Ou
tfall
Ou
tfall
Flo
w b
y p
um
pin
g
Chapter II - Performance Audit
29
2.1.10.1 Plugging of outfalls using Infrastructure and Amenities Fund
In 2012, CMWSSB claimed to have surveyed the basins of the
three waterways of the city, viz., Adyar river, Buckingham canal and Cooum
river and identified 337 sewage outfalls, flowing into these water bodies.
Based on the proposal of CMWSSB, GoTN approved (July 2012 and
December 2014) a project at a cost of ` 313 crore to plug these outfalls in
two phases, using the Infrastructure and Amenities Fund of the Town and
Country Planning Department. As per original plan, all the 337 sewage
outfalls were to be plugged by March 2016, but work on 46 outfalls were
incomplete even as of March 2020.
Under Phase I of the project to plug 179 outfalls, the works were
awarded17 to a Contractor in November 2013. 170 out of
179 sewage works were completed after a delay of over two years
and the contract for the balance nine works were terminated
(November 2018) by CMWSSB due to slow progress of works by
the Contractor. The works were abandoned.
Under Phase II, works on 158 outfalls were split into
seven packages and separate contracts were awarded for each
package. Only three of the seven packages were completed
(Appendix 2.7) between March 2018 and January 2019 and
remaining four packages, with scheduled completion between
September 2019 and January 2020, were incomplete (March 2020).
Audit found that the delays were mainly due to unjustified delays in
finalisation of tenders by CMWSSB as discussed below:
(a) In respect of Buckingham Canal River Basin Package-II, overall
time taken to issue work order after opening of technical bid was
31 months. Of which, the Board took 25 months to accord approval.
(b) The overall time taken to issue work order after opening of technical
bid for Cooum River Basin Package-IB, was 20 months. Of which,
the Board took 11 months for according approval.
(c) In respect of Buckingham Canal River Basin Package-IB, after
opening of technical bid, the Board took more than 11 months to
open price bid with overall time taken of 16 months to issue work
order.
Recorded reasons for the delay in finalisation of tender were neither available
nor produced to Audit when called for.
Thus, Audit observed that the objective of plugging of polluted sewage
outfalls into water bodies remained unachieved in full, even four years after
the scheduled date.
17 For a contract value of ` 136.08 crore, with target date of completion as
19 January 2016.
Audit Report (General and Social Sector), Tamil Nadu for the year ended March 2019
30
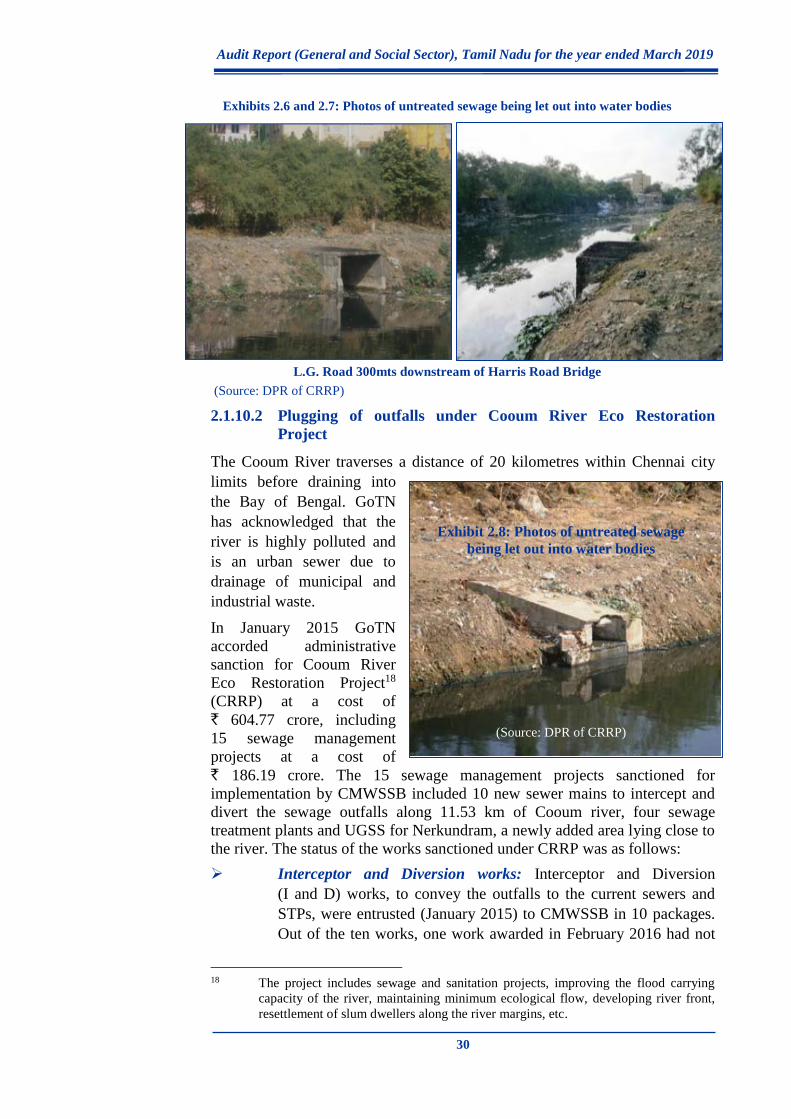
Exhibits 2.6 and 2.7: Photos of untreated sewage being let out into water bodies
L.G. Road 300mts downstream of Harris Road Bridge
(Source: DPR of CRRP)
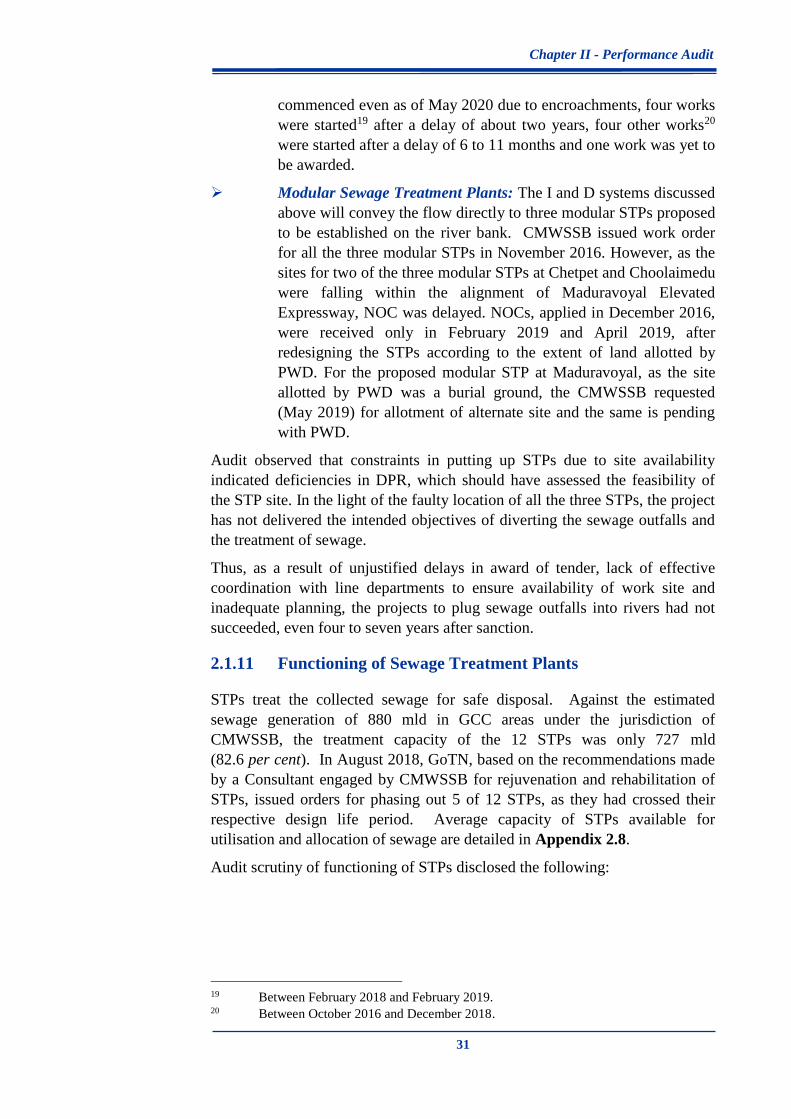
2.1.10.2 Plugging of outfalls under Cooum River Eco Restoration
Project
The Cooum River traverses a distance of 20 kilometres within Chennai city
limits before draining into
the Bay of Bengal. GoTN
has acknowledged that the
river is highly polluted and
is an urban sewer due to
drainage of municipal and
industrial waste.
In January 2015 GoTN
accorded administrative
sanction for Cooum River
Eco Restoration Project18
(CRRP) at a cost of
` 604.77 crore, including
15 sewage management
projects at a cost of
` 186.19 crore. The 15 sewage management projects sanctioned for
implementation by CMWSSB included 10 new sewer mains to intercept and
divert the sewage outfalls along 11.53 km of Cooum river, four sewage
treatment plants and UGSS for Nerkundram, a newly added area lying close to
the river. The status of the works sanctioned under CRRP was as follows:
Interceptor and Diversion works: Interceptor and Diversion
(I and D) works, to convey the outfalls to the current sewers and
STPs, were entrusted (January 2015) to CMWSSB in 10 packages.
Out of the ten works, one work awarded in February 2016 had not
18 The project includes sewage and sanitation projects, improving the flood carrying
capacity of the river, maintaining minimum ecological flow, developing river front,
resettlement of slum dwellers along the river margins, etc.
Exhibit 2.8: Photos of untreated sewage
being let out into water bodies
(Source: DPR of CRRP)
Chapter II - Performance Audit
31
commenced even as of May 2020 due to encroachments, four works
were started19 after a delay of about two years, four other works20
were started after a delay of 6 to 11 months and one work was yet to
be awarded.
Modular Sewage Treatment Plants: The I and D systems discussed
above will convey the flow directly to three modular STPs proposed
to be established on the river bank. CMWSSB issued work order
for all the three modular STPs in November 2016. However, as the
sites for two of the three modular STPs at Chetpet and Choolaimedu
were falling within the alignment of Maduravoyal Elevated
Expressway, NOC was delayed. NOCs, applied in December 2016,
were received only in February 2019 and April 2019, after
redesigning the STPs according to the extent of land allotted by
PWD. For the proposed modular STP at Maduravoyal, as the site
allotted by PWD was a burial ground, the CMWSSB requested
(May 2019) for allotment of alternate site and the same is pending
with PWD.
Audit observed that constraints in putting up STPs due to site availability
indicated deficiencies in DPR, which should have assessed the feasibility of
the STP site. In the light of the faulty location of all the three STPs, the project
has not delivered the intended objectives of diverting the sewage outfalls and
the treatment of sewage.
Thus, as a result of unjustified delays in award of tender, lack of effective
coordination with line departments to ensure availability of work site and
inadequate planning, the projects to plug sewage outfalls into rivers had not
succeeded, even four to seven years after sanction.
2.1.11 Functioning of Sewage Treatment Plants
STPs treat the collected sewage for safe disposal. Against the estimated
sewage generation of 880 mld in GCC areas under the jurisdiction of
CMWSSB, the treatment capacity of the 12 STPs was only 727 mld
(82.6 per cent). In August 2018, GoTN, based on the recommendations made
by a Consultant engaged by CMWSSB for rejuvenation and rehabilitation of
STPs, issued orders for phasing out 5 of 12 STPs, as they had crossed their
respective design life period. Average capacity of STPs available for
utilisation and allocation of sewage are detailed in Appendix 2.8.
Audit scrutiny of functioning of STPs disclosed the following:
19 Between February 2018 and February 2019. 20 Between October 2016 and December 2018.
Audit Report (General and Social Sector), Tamil Nadu for the year ended March 2019
32
2.1.11.1 Non-functioning of primary clarifier units
Treatment of raw sewage primarily involved multiple stages viz., primary
settling, aeration, secondary settling, etc. Since primary settling is the first
stage of treatment, any shortfall thereof would have a consequent detrimental
effect on the treatment quality of the subsequent stages.
In 3 of the 12 STPs with two units of primary clarifiers, only one unit was
functioning. The installed capacity of the STPs was based on the total
capacities of the two units of primary clarifiers. As one of the two units of
primary clarifiers were not functional in three STPs, these three STPs
continued to handle sewage volumes higher than the capacity of the functional
unit.
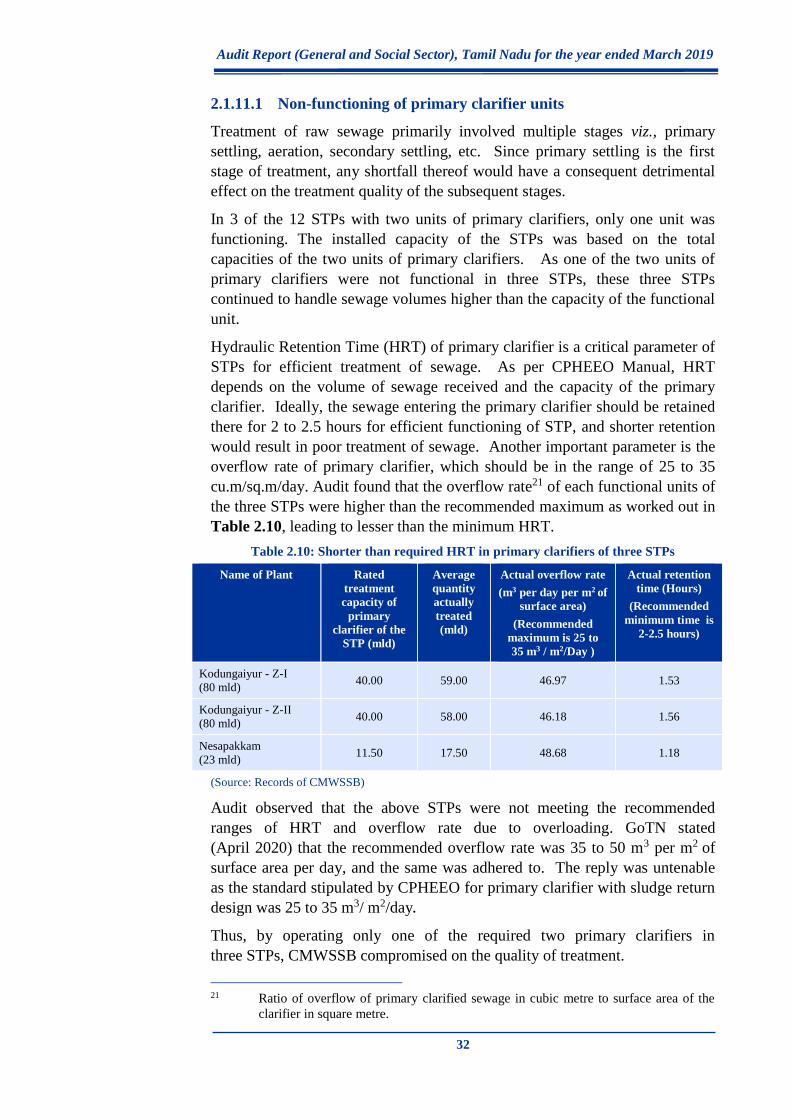
Hydraulic Retention Time (HRT) of primary clarifier is a critical parameter of
STPs for efficient treatment of sewage. As per CPHEEO Manual, HRT
depends on the volume of sewage received and the capacity of the primary
clarifier. Ideally, the sewage entering the primary clarifier should be retained
there for 2 to 2.5 hours for efficient functioning of STP, and shorter retention
would result in poor treatment of sewage. Another important parameter is the
overflow rate of primary clarifier, which should be in the range of 25 to 35
cu.m/sq.m/day. Audit found that the overflow rate21 of each functional units of
the three STPs were higher than the recommended maximum as worked out in
Table 2.10, leading to lesser than the minimum HRT.
Table 2.10: Shorter than required HRT in primary clarifiers of three STPs
Name of Plant Rated
treatment
capacity of
primary
clarifier of the
STP (mld)
Average
quantity
actually
treated
(mld)
Actual overflow rate
(m3 per day per m2 of
surface area)
(Recommended
maximum is 25 to
35 m3 / m2/Day )
Actual retention
time (Hours)
(Recommended
minimum time is
2-2.5 hours)
Kodungaiyur - Z-I
(80 mld) 40.00 59.00 46.97 1.53
Kodungaiyur - Z-II
(80 mld) 40.00 58.00 46.18 1.56
Nesapakkam
(23 mld) 11.50 17.50 48.68 1.18
(Source: Records of CMWSSB)
Audit observed that the above STPs were not meeting the recommended
ranges of HRT and overflow rate due to overloading. GoTN stated
(April 2020) that the recommended overflow rate was 35 to 50 m3 per m2 of
surface area per day, and the same was adhered to. The reply was untenable
as the standard stipulated by CPHEEO for primary clarifier with sludge return
design was 25 to 35 m3/ m2/day.
Thus, by operating only one of the required two primary clarifiers in
three STPs, CMWSSB compromised on the quality of treatment.
21 Ratio of overflow of primary clarified sewage in cubic metre to surface area of the
clarifier in square metre.
Chapter II - Performance Audit
33
2.1.11.2 Plant control tests not conducted
All 12 STPs of CMWSSB were designed to treat municipal sewage alone.
CPHEEO Manual recommended 56 parameters to be tested to measure the
physical, chemical and biological characteristics of treated sewage water
irrespective of the treatment process. These tests were conducted to meet the
statutory need as well as plant control needs. Audit noticed that tests were
conducted and documented at STPs for only 1122 out of the 56 parameters
recommended by CPHEEO Manual. Five out of the eleven tests conducted by
CMWSSB were mandatory tests as stipulated by the TNPCB and the
remaining six tests were conducted for plant control. Eleven tests presently
conducted at the STPs related to organic and biological parameters, except for
oil and grease.
GoTN stated (April 2020) that the mandatory tests were conducted. Audit,
however observed that the mandatory tests being conducted were not capable
of detecting industrial wastes. As the STPs were not designed to handle
industrial waste, it was necessary to analyse the presence of industrial wastes
in the inflow to ensure proper treatment. Audit found that a study conducted
(June 2018) by a Consultant engaged by CMWSSB found that by 2020
an estimated 62 mld of industrial effluent would flow into the STPs from
pumping stations. Further, the Tamil Nadu Agricultural University, which
conducted a study on converting the sludge into manure, also found traces of
heavy metals in the sludge. Therefore, Audit observed that conducting all
mandatory and plant control tests is critical for ensuring optimum performance
of the STPs and the quality of the treated water.
2.1.11.3 Absence of independent audit of wastewater quality
Municipal sewage contains various wastes. If improperly collected and
improperly treated, this sewage and its related solids could hurt human health
and the environment. A treatment plant’s primary objectives are to clean the
sewage and meet the plant’s discharge standards.
With a view to ensure the quality of treated water let out by STPs, the
Handbook of Benchmarks of the Ministry of Urban Development of GoI
envisages availability of own laboratory or easy and regular access to
accredited testing centers for carrying out tests in addition to periodic
independent audit of wastewater quality. Audit scrutiny disclosed that:
CMWSSB has established testing laboratories in all the STPs. But,
these laboratories were either operated by the operation and
maintenance (O&M) contractor of the respective STP or by using
staff outsourced from the contractor. Audit observed that this
arrangement paved way for conflict of interest as the contractors
were responsible for ensuring proper treatment of sewage.
22 Bio-Chemical Oxygen Demand, Chemical Oxygen Demand, Dissolved Oxygen,
Fecal Coliform, MLSS, MLVSS, Oil and Grease, pH, Suspended Solids,
Temperature and Total Dissolved Solids.
Audit Report (General and Social Sector), Tamil Nadu for the year ended March 2019
34
Further, CMWSSB had not put in place the envisaged system of
periodical independent audit of the quality of treated water.
GoTN stated (April 2020) that a proposal was under way to establish a
full-fledged laboratory for conducting all tests.
2.1.12 Reuse of treated sewage water
Water recycling is the reuse of treated wastewater for beneficial purposes such
as agricultural and landscape irrigation, industrial processes, toilet flushing,
etc. As per the Benchmark devised by Ministry of Urban Development, GoI,
at least 20 per cent of the treated water should be reused/recycled. Audit
scrutiny of performance in handling treated water disclosed the following:
2.1.12.1 Poor achievement in sale of treated water
As per the directions issued (June 2015) by the TNPCB, secondary treated
sewage water should be mandatorily sold for use for non-potable purposes
such as industrial process, railway & bus cleaning etc. Sale of treated water for
non-potable purposes would bring down the consumption of drinking water
for non-potable purpose and has the potential to earn revenue to CMWSSB.
Sale of treated water involves identifying potential buyers, signing MoUs with
them, providing requisite pipelines for carrying the treated water and other
related arrangements. CMWSSB has tied up with three major industries23 and
GCC for supply of treated water from only two24 out of its 12 STPs. During
2014-19, CMWSSB supplied an average of 28.42 mld of secondary treated
water to these industries and GCC earned an average revenue of ` 16.45 crore
per annum. During the same period, 463.27 mld of treated water was let out
into water bodies.
During the audit period, while the cost of treatment of sewage was in the range
of ` 12.50 to ` 18.40 per KL, the sale price of treated water to industries was
in the range of ` 12.49 to ` 16.16 per KL. Thus, the sale of treated water helps
in reducing the city’s dependence on fresh water for industrial uses and in
augmenting the revenue of CMWSSB.
The achievement in sale of treated water being only 6.5 per cent as of
March 2019, was well below the prescribed benchmark of 20 per cent.
CMWSSB lost an opportunity to earn ` 175 crore per annum by achieving
benchmark sale of 20 per cent of treated water. Instances of failures in
meeting the demand for secondary treated water and tertiary treated water are
discussed below:
In July 2014, the Divisional Railway Manager (DRM), Southern
Railway (SR), requested for 7.5 mld of treated water for use in the
Railway Yard. CMWSSB decided (February 2015) to supply
7.5 mld treated water to SR from its proposed 10 mld tertiary
23 Chennai Petroleum Corp. Ltd., Madras Fertilizers Ltd., and Manali Petro Products
Ltd. 24 Kodungaiyur STP and Nesapakkam STP.
Chapter II - Performance Audit
35
treatment plant at Langs Garden, Chennai, close to the Railway
Yard. The proposed tertiary treatment plant at Langs Garden,
Chennai, was approved by GoTN in January 2015. The work on the
plant, however, was started only in April 2019. As a result, the
treated water requested by SR in July 2014 was not supplied even as
of May 2020, as a result of which SR continued to consume potable
water from CMWSSB for non-potable purposes.
The Tariff Policy of Ministry of Power, GoI, envisaged
(January 2016) that thermal power plants within 50 kms radius of
STPs should mandatorily use treated sewage water produced by
these STPs. Accordingly, GoTN directed (June 2017) CMWSSB to
sign MoU with the five thermal power plants25 located near STPs of
CMWSSB for supply of treated water. From the correspondence
exchanged between CMWSSB and the thermal plants, it was
noticed that the plants were insisting for enhanced quality of treated
water. Meanwhile, CMWSSB supplied an average of 13.79 mld of
fresh water to the five thermal power plants, which could have been
avoided had appropriate quality of treated water been supplied to
these thermal power plants.
Thus, CMWSSB did not fulfill the existing demand for treated water, leading
to continued supply of potable water to industrial and commercial
establishments even as the city faced acute water scarcities.
2.1.13 Environmental issues in sewage treatment
2.1.13.1 Non-operation of biogas power generation plants
The sewage sludge includes organic matter. Decomposition of sludge releases
sludge gas, which contains methane (60 to 70 per cent), carbon-di-oxide
(25 to 35 per cent) and other gases. Methane and carbon-di-oxide are
greenhouse gases (GHG), which contribute to global warming. CPHEEO
Manual envisages provision of biogas plant in STPs to capture the
combustible methane gas for generation of electricity, which provides two
pronged benefits by cutting down emission of GHG and simultaneously
reducing power consumption of the STP.
Audit found that 5 of 12 STPs of CMWSSB did not have the facility to
generate electricity. Neither these plant had the facility to flare up methane gas
to prevent direct releasing of GHG into atmosphere. In the remaining
seven STPs, only four were generating electricity and the biogas plant in three
others were under repair. Audit examined the measures initiated by CMWSSB
to prevent GHG emission and noticed the following:
25 NTECL and four TANGEDCO’s coal based thermal power plants.
Audit Report (General and Social Sector), Tamil Nadu for the year ended March 2019
36
(a) Non-establishment of infrastructure facilities
The five STPs that did not have biogas generation facility were erected
between 1974 and 2003. CMWSSB did not take any effort for retrofitting
these STPs with biogas power generation plants. Based on CPHEEO’s
formula, Audit worked out that these five STPs theoretically released
15,676 m3 of methane per day (5.72 million m3 per annum). In an ideal
situation, it could have been possible for CMWSSB to generate about
30,000 units of electricity per day during 2014-19, against their average
energy requirement of 19,727 units of electricity per day during the same
period.
It was also found that biogas power generation plants were not provided in the
design for the three new STPs under construction at Avadi, Tambaram and
Thiruvottiyur.
GoTN stated (April 2020) that the biogas plant work in Nesapakkam
40 mld STP was under litigation and the work for providing biogas plants in
four STPs commenced in December 2019. Audit observed that lack of timely
interventions delayed provision of biogas plants in these STPs.
(b) Non-working of biogas power generation units in STPs
In three STPs, the biogas power generation units were under repair for periods
ranging from 37 to 43 months during 2014-19. Audit found that STPs were
completely dependent on grid power for day to day operations and two of the
STPs incurred ` 4.95 crore on electricity bills, which could have largely been
avoided if the biogas plants were functional. Audit noticed that work orders
for rehabilitation of the above STPs were issued in August 2019 with a
scheduled period of completion of 18 months.
In the Exit Conference, the Executive Director stated that the issues would be
resolved on implementation of scheme of rehabilitation of STPs.
2.1.13.2 Sludge disposal
Sludge is a by-product of sewage treatment. According to CPHEEO Manual,
dried sludge may be used as fertiliser for lawns and for growing cash crops
and fodder grasses and heat-dried sludge can be used as fertiliser along with
farm yard manure. Further, using sludge as a land fill was not usually
recommended as it could lead to surface water contamination and leaching
into ground water.
Audit, however, found that CMWSSB had not taken any effort to convert the
sludge as fertiliser. During 2014-19, the STPs of CMWSSB produced
42,644 MT of dried sludge. The entire quantity of dried sludge was spread
over low lying areas adjoining the STP. By not taking effective action for
disposal of sludge as fertiliser, CMWSSB lost opportunity for revenue
generation through such sale and continued to cause threat to the environment.
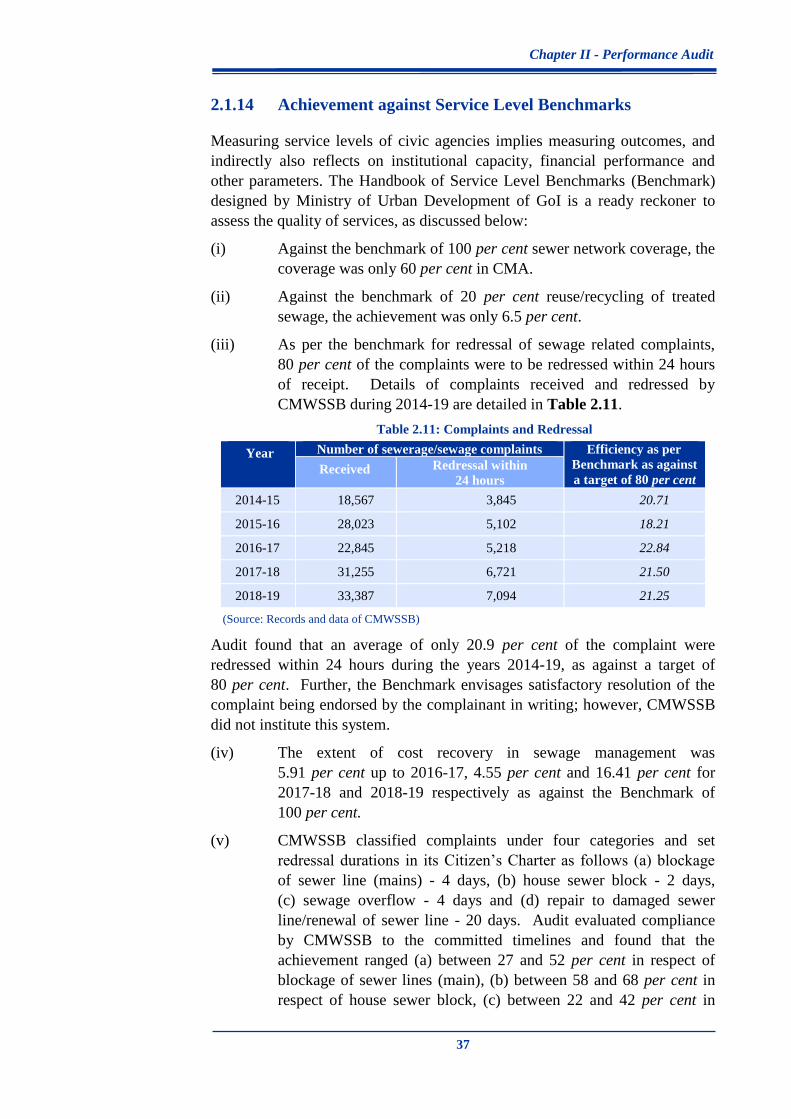
Chapter II - Performance Audit
37
2.1.14 Achievement against Service Level Benchmarks
Measuring service levels of civic agencies implies measuring outcomes, and
indirectly also reflects on institutional capacity, financial performance and
other parameters. The Handbook of Service Level Benchmarks (Benchmark)
designed by Ministry of Urban Development of GoI is a ready reckoner to
assess the quality of services, as discussed below:
(i) Against the benchmark of 100 per cent sewer network coverage, the
coverage was only 60 per cent in CMA.
(ii) Against the benchmark of 20 per cent reuse/recycling of treated
sewage, the achievement was only 6.5 per cent.
(iii) As per the benchmark for redressal of sewage related complaints,
80 per cent of the complaints were to be redressed within 24 hours
of receipt. Details of complaints received and redressed by
CMWSSB during 2014-19 are detailed in Table 2.11.
Table 2.11: Complaints and Redressal
Year Number of sewerage/sewage complaints Efficiency as per
Benchmark as against
a target of 80 per cent Received Redressal within
24 hours
2014-15 18,567 3,845 20.71
2015-16 28,023 5,102 18.21
2016-17 22,845 5,218 22.84
2017-18 31,255 6,721 21.50
2018-19 33,387 7,094 21.25
(Source: Records and data of CMWSSB)
Audit found that an average of only 20.9 per cent of the complaint were
redressed within 24 hours during the years 2014-19, as against a target of
80 per cent. Further, the Benchmark envisages satisfactory resolution of the
complaint being endorsed by the complainant in writing; however, CMWSSB
did not institute this system.
(iv) The extent of cost recovery in sewage management was
5.91 per cent up to 2016-17, 4.55 per cent and 16.41 per cent for
2017-18 and 2018-19 respectively as against the Benchmark of
100 per cent.
(v) CMWSSB classified complaints under four categories and set
redressal durations in its Citizen’s Charter as follows (a) blockage
of sewer line (mains) - 4 days, (b) house sewer block - 2 days,
(c) sewage overflow - 4 days and (d) repair to damaged sewer
line/renewal of sewer line - 20 days. Audit evaluated compliance
by CMWSSB to the committed timelines and found that the
achievement ranged (a) between 27 and 52 per cent in respect of
blockage of sewer lines (main), (b) between 58 and 68 per cent in
respect of house sewer block, (c) between 22 and 42 per cent in
Audit Report (General and Social Sector), Tamil Nadu for the year ended March 2019
38
respect of sewer overflow and (d) between 0 and 12 per cent in
respect of renewal of sewer lines.
2.1.15 Conclusion
Despite according due importance and making substantial investment, the
sewage network in CMA did not meet the needs of the growing population.
Inadequate treatment capacity and unchecked illegal discharge of untreated
sewage continued to pollute the waterways. As a result, there was no
improvement in the outcomes in terms of reduced pollution load in the water
bodies in CMA. All project suffered abnormal delays due to sluggish pace of
project implementation and lack of comprehensive planning. Failure to
achieve the benchmark sale of secondary treated water, poor achievements in
biogas power generation and non-conversion of sludge into manure
contributed adversely to the environment, besides resulting in lost
opportunities to augment revenue through these efforts.
2.1.16 Recommendations
In line with the audit findings, the following recommendations are made:
Government should formulate CMA-wide City Sanitation Plan in
line with NUSP for a focused approach and time-bound execution
of interconnected projects.
Government may consider putting in place an institutional
mechanism for ensuring coordination of all line departments in
implementing UGSS.
CMWSSB should ensure availability of work site and all mandatory
clearances from line departments before awarding tenders for
UGSS.
CMWSSB needs to focus on ensuring the quality of sewage
treatment by commissioning independent audit of water quality and
performing all recommended laboratory tests.
CMWSSB should be sensitive to the environmental issues by
increasing reuse of treated water, minimising release of greenhouse
gases into atmosphere and converting sludge into manure.