Embed Size (px)
Citation preview
1
CHAPTER I
INTRODUCTION AND LITERATURE REVIEW
1.1 Introduction 3
1.2 The Fundamentals of Sensor 4
1.2.1 The categorization of sensors 5
1.2.2 The importance of gas sensors 5
1.3 The Necessity for Gas Sensors 6
1.4 The Liquefied Petroleum Gas (LPG) 6
1.5 Literature Survey 7
1.6 An Overview of the Wireless Sensor Networks 10
1.6.1 Wireless sensor network (WSN): a brief history 10
1.6.2 Why wireless sensor networks (WSN)? 12
1.6.3 Wireless sensor nodes 14
1.6.4 Issues in wireless sensor networks 16
a) Energy efficiency 17
b) Localization 18
c) Routing 19
1.6.5 Applications 19
a) Environmental monitoring 19
b) Home automation 20
c) Health monitoring 21
d) Air pollution monitoring 22
e) Forest fire detection system 23
f) Earthquake and landslide detection 24
g) Smart agriculture system 24
h) Military application 24
2
1.7
The IEEE 802.15.4 and ZigBee Standard 26
1.7.1 An overview 26
1.7.2 The architecture of ZigBee 27
1.7.3 The features of ZigBee 29
1.7.4 The ZigBee topologies 31
a) Peer to Peer topology 31
b) Star topology 31
c) Mesh topology 32
1.7.5 The ZigBee network devices 32
a) Co-ordinator 32
b) Router 33
c) End device 33
1.7.6 The excellency of ZigBee over other devices 34
1.7.7 Programming with the XBee: X-CTU 34
1.8 Motivation of the Research 36
1.9 Objectives of the Research 37
References 40
3
CHAPTER I
INTRODUCTION AND LITERATURE REVIEW
1.1 Introduction
Hitherto, research and development activities pertaining to gas sensing
devices has gained a rigorous momentum across the world.
“The detection of LPG/CNG gases has become a main issue due to more
wellbeing policy wide-reaching.”
These sensors can be used for various applications, e.g. monitoring and controlling
of the explosive level of concentration of gases, finding of various harmful,
dangerous, toxic gases, industrial automation etc. In recent years, the biggest
advancement made in the sensor tools is the detection of liquefied petroleum gas
and has become tip of the iceberg because outburst accidents force to be happened
when it leaks excessively. Therefore, the research work particularly, in the area of
wireless sensor network and earlier gas leakage detection (alert system) is
imperative.
The monitoring, reorganization and controlling of the data are the key
concern of Wireless Sensor Network. The inaccessible interface and actual
monitoring with the physical world can be done easily by mote of the network.
The wireless sensor networks differ from general data networks, because WSN are
application oriented, planned and deployed for dedicated purpose. The wireless
sensor network provides extensive range of the applications such as in green
monitoring, defense, health, etc [1,2,3].The litheness in plan, enhanced mobility,
consistency, broadcast range, reduced power, cost-effective etc are the good
features of these network [1,3,4]. Additionally, the system uses the ZigBee
technology for wireless communication. This technology is most trustworthy and
apposite for interior and outdoor applications. The ZigBee can be configured in
star, mesh or peer to peer topology. A demanding subject in scheming WSNs is
inadequate power supply for sensor nodes in some application. The breakdown of
4
a mote results in degradation of the entire network. The preference of a topology
can play an imperative role in reduction of power consumption.
The present system is mainly used for the detection of LPG gas. If gas
leakage happens at certain place, the present system detects the LPG gas alerts the
peoples by buzzering and sending SMS on users mobile phone using arduino GSM
shield compatible to the arduino board [5, 6]. The monitoring of the sensor node
can be done using G-code created in LabVIEW. The current system provides
genuine instance notifications. This system can be installed in a place where LPG
is used as a fuel and leakage happens instantly. The present wireless gas detection
system plays imperative role model to industry as well as general public.
1.2 The Fundamentals of Sensors
A sensor is a device which converts physical quantity into electrical
quantity. The human body which can’t sense any quantity can be done easily by
commercial sensors like temperature, humidity, intensity etc. Any input signals
given to electronic instruments, detection of it and convert them into appropriate
output signal, the sensor does it entirely. Nowadays, sensor becomes omnipresent
in our regular routines. The properties of sensors are:
Convert the non-electrical quantity into electrical quantity
Take action speedily
Function incessantly
Portable.
The most significant uniqueness of a sensor is:
The sensitivity
The stability associated with it.
How repeatability it has?
5
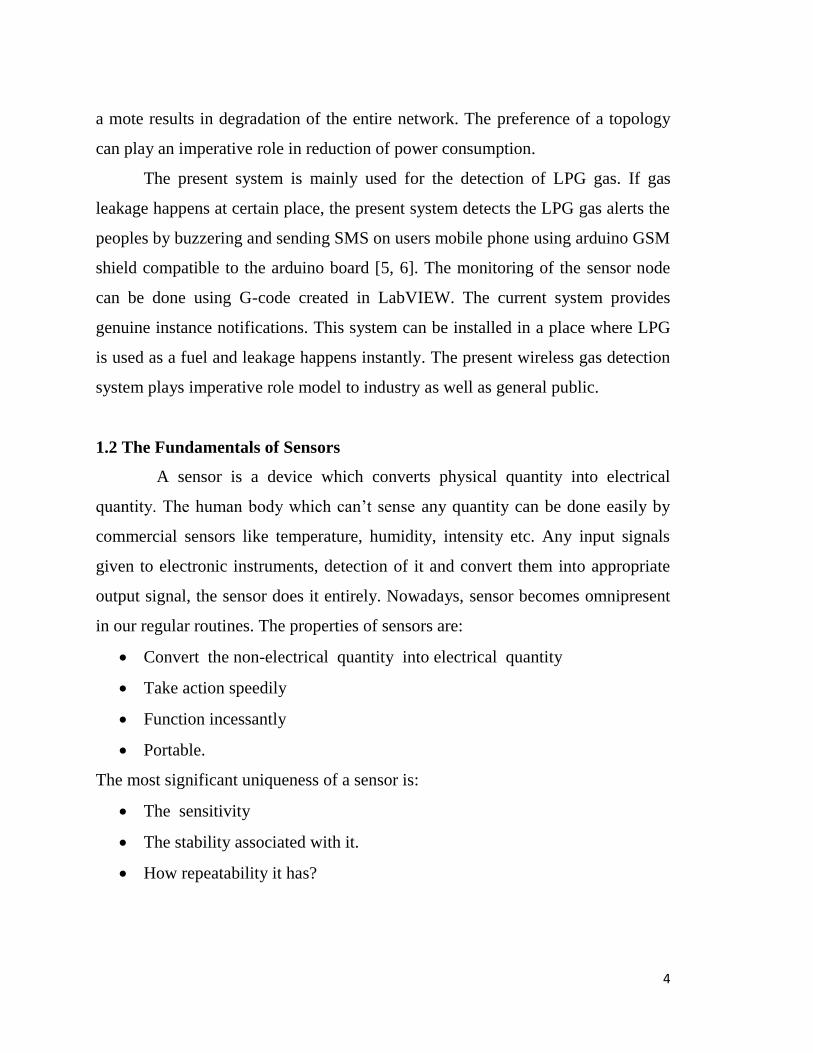
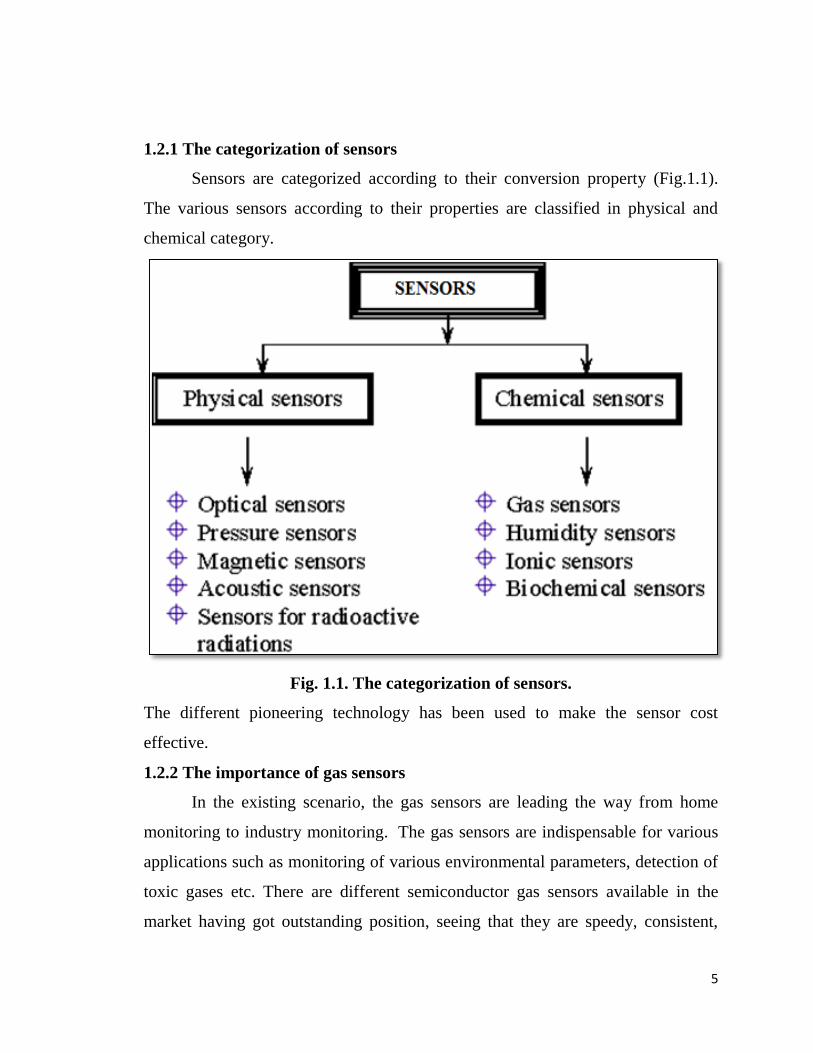
1.2.1 The categorization of sensors
Sensors are categorized according to their conversion property (Fig.1.1).
The various sensors according to their properties are classified in physical and
chemical category.
Fig. 1.1. The categorization of sensors.
The different pioneering technology has been used to make the sensor cost
effective.
1.2.2 The importance of gas sensors
In the existing scenario, the gas sensors are leading the way from home
monitoring to industry monitoring. The gas sensors are indispensable for various
applications such as monitoring of various environmental parameters, detection of
toxic gases etc. There are different semiconductor gas sensors available in the
market having got outstanding position, seeing that they are speedy, consistent,
6
cost-effective and bare minimum maintenance. Hitherto, ceramic gas sensors were
used for detection of gases. The gas sensors are mainly oxidizing and reducing in
nature. Whereas oxidizing sensors results in the creation of acceptor states and the
reducing sensor results in donor states. The resistive, potentiometric and
amperometric sensors [7, 8] are most sensitive sensors.
1.3 The Necessity for Gas Sensors
The olfactory system of humans is outstanding for the recognition of
odours which can be observed merely at towering concentrations or can’t detect at
all [7]. For the protection of human life, to take preventive measure against the
explosive concentration of gases and for poisonous gas applications, a gas sensor
is essential for the detection of gas in low concentration range. To prevent the gas
leakage that happens at homes, industries etc, detection of various gases at low
concentration is possible only due to gas sensors. Hence, gas sensor becomes the
part and parcel of today’s life.
1.4 The Liquefied Petroleum Gas (LPG)
The Liquefied petroleum gas (LPG) has no colour and no smell. The LPG
gas liquefies under moderate pressure and vapourize upon discharge of pressure.
Therefore, the LPG is stored in liquid form (concentrated). In general, LPG
obtained from sanitized crude oil, in this way, it is under pressure form [7] and
also from natural gas or crude oil streams. The LPG can be odorized by adding an
appropriate odour for the prevention of explosive attacks. The most important
property of LPG is that, it is heavier than air. As concentration of LPG increases, it
creates hazards to human health [8]. The LPG can be used as a fuel for many
sectors, viz. domestic, industrial, cooking processes etc. LPG is also used as a fuel
for vehicles [9].
7
Due to the flammable behaviour of LPG gas, out of harm's way handlings
of LPG must be useful in the domestic and industrial situations. Its liquid form is
very harmful for the skin [10]. Therefore, to avoid the hazards from this,
monitoring and controlling of LPG leakage is carried out through this thesis.
1.5 Literature Survey
To work against the dangerous effects of gas leakage, significant efforts
was carried out in manipulative and miniaturizing the gas leak sighting technique.
The occurrences of gas leak-related incidents are studied by several researchers
and have published statistical data incidents. In 2012, Somov et al [11] reported
“Energy-Aware Gas Sensing Using Wireless Sensor Networks” focusing on a
sensor node, a relay node, a wireless actuator and a network coordinator. The
network coordinator is the main unit of the WSN. It supports the network
operation by wireless communication based on the IEEE 802.15.4 standard and
the ZigBee specifications. The network coordinator is also responsible for alerting
a network operator or an emergency service using the Ethernet network or sending
a SMS using a GSM/GPRS modem. In fact, upon receiving the alert message from
the sensor node, the network coordinator can perform the first counter action by
deactivating the source of gas emission via the wireless actuator [11].
In 2011, Bhattacharjee et al [12] designed a system entitled “Design and
Development of a Flexible Reliable Smart Gas Detection System”. The system
composed of three modules; the base station, wireless sensor array and an
intelligent wireless alarm unit, which offers high reliability, flexibility and
uninterrupted sensing. These are achieved by incorporating various intelligent
protocols like auto sensor calibration, sensor handover, wireless threshold fixation
and intelligent alarm mechanism. The sensor node consists of three gas sensors,
one temperature sensor and one pyro-electric infrared sensor (PIR) which
enhances the sensing intelligence. The sensed data are digitized and processed by
the peripheral interface controller (PIC) 16f877A based centralized embedded
8
platform and wireless communication is achieved with a pair of 433 and 315 MHz
amplitude shift keying (ASK) wireless module. The encoding and decoding of
sensed data offer a high secured gas detection system [12].
Ya et al [13] pointed out an “Intelligent Residential Security Alarm and
Remote Control System Based on Single Chip Computer”. Their work focused on
the intelligent residential burglar alarm, emergency alarm, fire alarm, toxic gas
leakage remote automatic sound alarm and remote control system, which is based
on 89c51 single chip computer. The system can perform an automatic alarm,
which calls the police hotline number automatically. It can also be a voice alarm
and shows alarm occurred address. This intelligent security system can be used to
control the electrical power remotely through telephone [13]. Peijiang and
Xuehhua [14] developed a system namely “Design and Implementation of Remote
Monitoring System Based on GSM”, which has focused on the wireless
monitoring system; a remote monitoring system based on SMS through GSM. The
hardware and software architectures of the system are designed. In this system, the
remote signal is transmitted through GSM network. The system includes mainly
two parts; the monitoring centre and the remote monitoring station. The
monitoring centre consists of a computer and a TC35 communication module for
GSM. The computer and the TC35 are interfaced by RS232. The remote
monitoring station consists of a TC35 communication module for GSM, a
MSP430F149 MCU, a display unit, sensors and a data gathering and processing
unit. The software for the monitoring center and the remote monitoring station
were designed using Visual Basic [14].
A low cost automotive localization system using GPS and GSM-SMS
services was proposed by Lita et al [15]. It is concerning “A New Approach of
Automatic Localization System Using GPS and GSM/GPRS Transmission”,
which provides the position of the vehicle on the driver’s or owner’s mobile phone
as a short message (SMS).The system can be interconnected with the car alarm
9
system that alerts the owner, on his mobile phone, about the events that occurs
with his car when it is parked. The system is composed by a GPS receiver, a
microcontroller and a GSM phone. In addition, the system can be settled for
acquiring and transmitting the information, whenever requested about automobiles
status and alerts the user about the vehicle’s started engine. The system can be
used as a low cost solution for automobiles position localizing as well as in car
tracking system applications [15].Investigation on vehicle cabin air quality
monitoring system with metal oxide semiconductor gas sensor was the
breakthrough in this field by Galatsis et al[16]. Herein, commercially available gas
sensors are compared with the fabricated M0O3 based sensors. The sensor has a
response of 74% or higher relative to the host commercial sensor tested [16]. The
same authors have also contributed to the added vehicle safety through a vehicle
cabin air quality monitor using carbon monoxide (CO) and oxygen (02) gas
sensors system designed, developed and on-road tested [17]. The continuous
monitoring of oxygen and carbon monoxide provides added vehicle safety as
alarm could be set off when dangerous gas concentrations are reached, preventing
driver fatigue, drowsiness and exhaust gas suicides. CO concentrations of 30 ppm
and oxygen levels lower than 19.5% were experienced whilst driving.
A “GSM Based Gas leakage Detection System” by Srivastava and
Prabhukar[18] provides a cost effective and highly accurate system, which not
only detects the gas leakage but also alert and turn off the mains power and gas
supplies and sends a SMS. Rammaya and Palaniappen [19] reported an
“Embedded System for Hazardous Gas Detection and Alerting”. The alerting of
gas leakage is through buzzer and SMS. A“WSN based Smart System for
Detection of LPG and Combustible Gases” has been proposed by Hema et al
[20],which identifies potentially hazardous gas leak within an area by means of
various sensors based electronic systems. These systems also employ an audible
alarm to alert the people whenever a dangerous gas is detected. These gas
10
detection systems are of immense use because they can be used to detect a wide
range of combustible, flammable and toxic gases which have hazardous effects on
human health [20]. ”Design Implementation of an Economic Gas Leakage
Detector” by Mahalingam et al provided a cost effective audio-visual solution for
LPG leakage detection in homes and commercial premises and audibly alert the
users in case of a hazardous situation and provide warning signals (beeps) [21].
1.6 An Overview of Wireless Sensor Networks
1.6.1 Wireless sensor network (WSN): a brief history
Wireless sensor networks (WSNs) are paying attention not only in the
industry but also in the sector like academia because of their enormous application
potential and exclusive safety challenges. The function of this network is to collect
the data from the environment and send it to the sink node. Due to the least power
and cost-effective application nature, it is more superior to the traditional networks
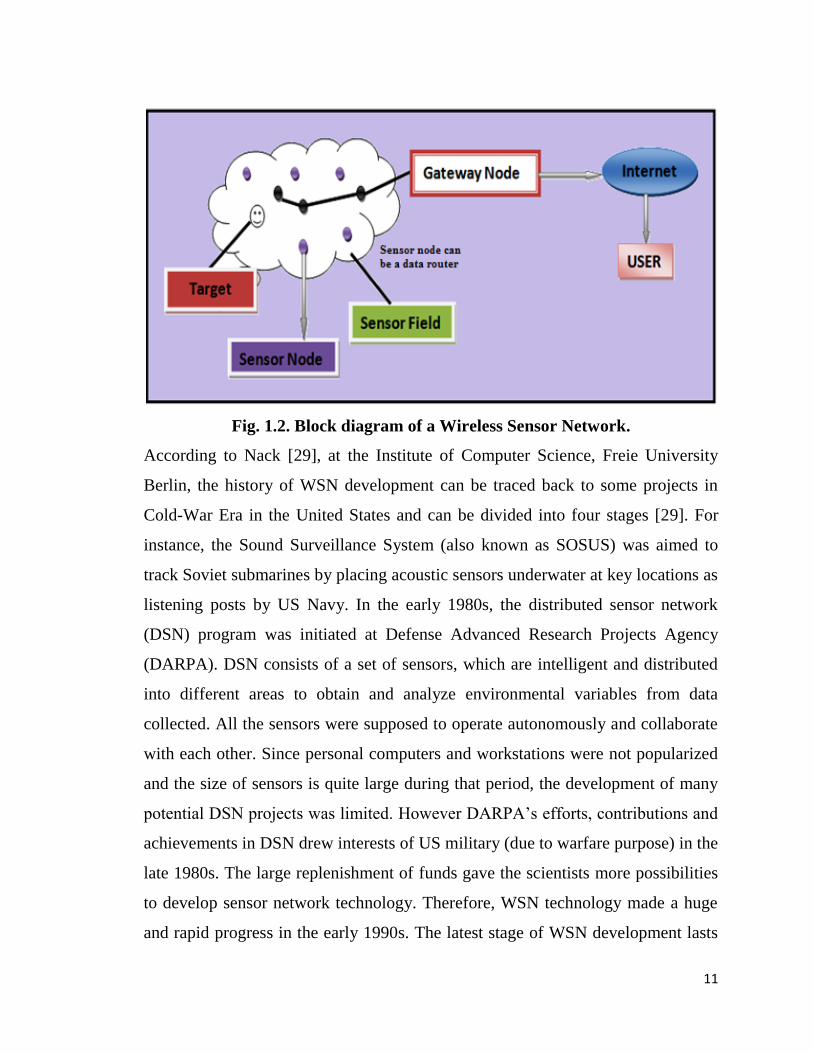
[22-25]. The components of WSN are; sensor nodes, base station and, routers etc.
A block sketch of WSN is shown in fig.1.2. It consists of a large number of sensor
nodes that collect information from the environment and transmit to the
gateway/co-ordinator node. Wireless sensor networks have been used for many
applications, from ecological monitoring to logistic, tracking etc. In addition,
wireless sensor networks can be used in appliances such as wellbeing monitoring
and control, environment and terrestrial monitoring, biomedical health monitoring,
home automation, travel control, natural disaster relief and seismic sensing etc,[26,
27, 28]. Fundamental characteristics of the wireless sensor network are small
energy consumption, self-motivated network topology, and large scale
exploitation. The architecture includes both a hardware platform and an operating
system designed.
11
Fig. 1.2. Block diagram of a Wireless Sensor Network.
According to Nack [29], at the Institute of Computer Science, Freie University
Berlin, the history of WSN development can be traced back to some projects in
Cold-War Era in the United States and can be divided into four stages [29]. For
instance, the Sound Surveillance System (also known as SOSUS) was aimed to
track Soviet submarines by placing acoustic sensors underwater at key locations as
listening posts by US Navy. In the early 1980s, the distributed sensor network
(DSN) program was initiated at Defense Advanced Research Projects Agency
(DARPA). DSN consists of a set of sensors, which are intelligent and distributed
into different areas to obtain and analyze environmental variables from data
collected. All the sensors were supposed to operate autonomously and collaborate
with each other. Since personal computers and workstations were not popularized
and the size of sensors is quite large during that period, the development of many
potential DSN projects was limited. However DARPA’s efforts, contributions and
achievements in DSN drew interests of US military (due to warfare purpose) in the
late 1980s. The large replenishment of funds gave the scientists more possibilities
to develop sensor network technology. Therefore, WSN technology made a huge
and rapid progress in the early 1990s. The latest stage of WSN development lasts
12
15% till present. With the rapid development of computing, micro-elecrtro
mechanical system (MEMS) and other technologies, the sensors are becoming
smaller in size and cheaper in price. These advancements provided WSN the
opportunities for commercial use in many areas [30]. Companies like Memsic and
Crossbow Technology begin to produce wireless motes, sensors and software
support. The standardization of protocols also becomes more and more matured.
The standards like ZigBee (802.15.4) and 6LoWPAN are built and commonly
used in WSN communications.
1.6.2 Why wirelesses sensor networks (WSN)?
The noticeable benefit of wireless transmission is a major reduction and
generalization in wiring. The electric wiring cost in industrial installations is 130–
650 US$ per meter and using wireless technology, it would be eradicated around
20–80% [31]. The proficient control of the equipment through effectual
monitoring of the environment gives rise to extra savings in terms of cost e.g.,
Wang et al [31]. The wireless system developed by Honeywell to scrutinize steam
traps saves the total cost effectively about 100,000–300,000 US$ annually [31].
The impracticable sensor applications, viz. monitoring far-off areas and locations,
this technology is featured with unrestricted mechanism and litheness for sensors
and augmented the network heftiness. Moreover, WSN technology makes the
system reliable and less costly. It allows more rapidly exploitation and deployment
of different sensors because this network provides various properties to the sensor
nodes. Further, an integration of WSN technology with MEMS makes the motes
with enormously stumpy cost, miniatured size and least power. MEMS are the
inertial sensors, pressure sensors, temperature sensors, humidity sensors, strain-
gage sensors and various piezo and capacitive sensors for proximity. Over the last
decade, the technology of Wireless Sensor Network (WSN) has been widely used
in many real time applications and these miniaturized sensors can sense, process
and communicate. Most wireless sensor nodes are capable of measuring
13
temperature, acceleration, light, illumination, humidity; level of gases and
chemical materials in the surrounding environment.WSN is a compilation of
wireless sensor nodes. A WSN is also an amalgamation of an integer of motes
with limited communication ability. The co-ordination between the sensor nodes
provides ability to process and to gather information in a large amount [32, 33].
Also, ad-hoc networks can be created. Generally, WSN networks are categorized
in two types: structured and unstructured. In unstructured WSN, the sensor nodes
are deployed in an ad-hoc manner without any careful planning. Once nodes are
deployed, monitoring and processing of data is done in unattended environment.
In structured WSN, motes are deployed in pre planned approach. The structured
wireless sensor network is superior to unstructured one, because cost and
maintenance required to deploy the node are less. The nodes in structured WSN
are positioned at exact locations to offer coverage, whereas unstructured
deployment has uncovered areas. Wireless sensor network aims to give co-
ordination among the physical conditions and the internet globe. It has the
following features:
WSN should be reliable
More accurate
Flexible in nature
Cost effective
Easy to install.
Tilak et al [34] have shown that the intellectual sensors can gather data
from disaster area, floods and also from revolutionary attacks. The network is
promising for,
Collection of information
Dealing out of information easily and
14
Environment monitoring for numerous applications.
Due to the above advantages WSN becomes an integral part of near future
applications. Today’s devices are used basically in underground and underwater
applications and also on land. We have therefore various challenges and
difficulties depending on the environment situations. These networks are of five
types depending upon their functions and structures e.g. multi-media, mobile,
land, underground and underwater WSNs [35]. Global WSNs involves use of 100
to 1000 of sensor nodes assembled either in an ad-hoc or in a pre-determined
manner. The sensor node in global WSN is relatively inexpensive, for it does not
need to fulfill the resistance to stress as in underground WSNs or the water
proofness as in underwater. We pre-planned the deployment of global (terrestrial)
WSN for our work.
Gas leakage can happen anywhere and at any time; hence wired sensors
could not be implemented in remote areas. Also it is very complex and costly to
mount and sustain the wired networks. Additionally, if a wire between the two
nodes gets breaks, the communication between these two nodes gets collapsed;
hence, the entire network will also fails. The WSN with a star topology is prefer
here because the sensor nodes are strongly cluster together and they communicate
only with single co-ordinator node. This property helps the individual sensor
nodes to save the battery power. Hence, star topology helps to reduced power
consumption among the sensor nodes. The data composed from WSNs are
massive in a real life situation and so, mining of this data is most important. Our
aim is to design, develop and discuss a wireless gas sensing system; an application
that would be developed and tested in order to detect the hazardous gas leakage
detection using WSNs.
1.6.3 Wireless sensor nodes
A wireless sensor network is miniaturized and compact in behaviour.
Mostly, it provides thousands of insignificant devices, called as sensor nodes and
15
are integrated to collect the information from various resources. The nodes are of
different sizes and takes disadvantage of varying size and cost to pose different
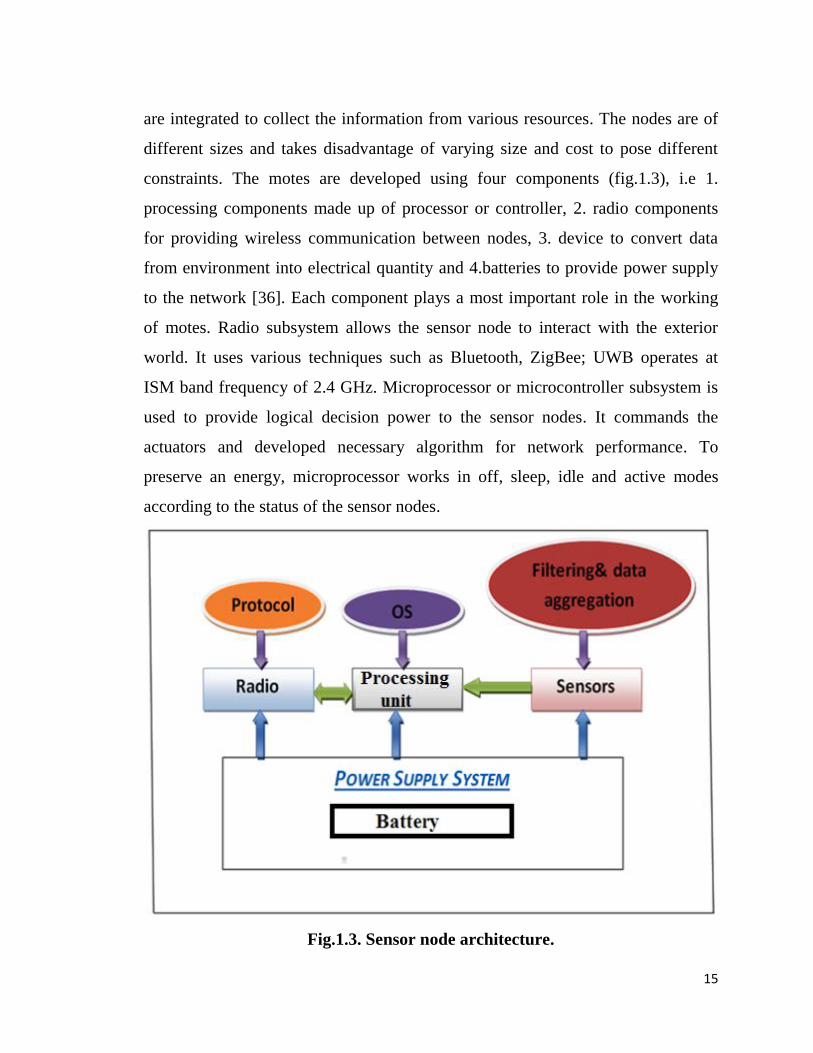
constraints. The motes are developed using four components (fig.1.3), i.e 1.
processing components made up of processor or controller, 2. radio components
for providing wireless communication between nodes, 3. device to convert data
from environment into electrical quantity and 4.batteries to provide power supply
to the network [36]. Each component plays a most important role in the working
of motes. Radio subsystem allows the sensor node to interact with the exterior
world. It uses various techniques such as Bluetooth, ZigBee; UWB operates at
ISM band frequency of 2.4 GHz. Microprocessor or microcontroller subsystem is
used to provide logical decision power to the sensor nodes. It commands the
actuators and developed necessary algorithm for network performance. To
preserve an energy, microprocessor works in off, sleep, idle and active modes
according to the status of the sensor nodes.
Fig.1.3. Sensor node architecture.

16
Sensor is used according to the application of the sensor nodes for which network
has been deployed. The battery plays an important role to improve the lifetime of
the network. Therefore, lifetime of motes thoroughly depends on the battery and
network’s lifetime on the sensor nodes [37, 38, 39]. Depending on the
environment, backup power supply is added. Solar battery is a best choice.
1.6.4 Issues in wireless sensor networks
Wireless sensor networks (WSNs) are composed of numerous small, low-
cost, randomly located nodes. The network can be scalable to thousands of nodes
that cooperatively perform complex tasks such as intelligent measurements. The
network must be able to self-organize, adapt to random node spacing, execute
algorithms for signal processing and operate as power efficiently as possible .A
WSN has its own design and resource constraints due to the limited size and cost
of sensor nodes such as limited energy and storage, short communication range,
low bandwidth and limited processing, which are different from the traditional
sensor networks. Ad-hoc and sensor networks share a number of challenges such
as energy constraints and routing [40]. On the other hand, general ad-hoc networks
most likely induce traffic patterns different from the sensor networks, have other
lifetime requirements and are often considered to consist of mobile nodes [41, 42].
In WSNs, most nodes are static; however, the network of basic sensor nodes may
be overlaid by more powerful mobile sensors (robots) that, guided by the basic
sensors, can move to interesting areas or even track intruders in the case of
military applications. Recent technology in wireless communication and
electronics have overcome some of the constraints and enabled the four
developments of sensor nodes which are low-power, low-cost, multifunctional and
small in size. However, three primary problems such as energy efficiency,
localization and routing still hold.
17
a) Energy efficiency
The power unit supports all the activities on sensor node, including
communication, local data processing, sensing, etc. The lifetime of a sensor node
is mainly determined by the power supply since battery replacement is not an
option in sensor networks, especially in dangerous environments such as in
battlefields or environment monitoring. As a result, every aspect of the wireless
sensor networks, from mote location through computing and communication is
viewed from the low-power perspective. Lifetime is extremely critical for most
applications and its primary limiting factor is the energy consumption of the
nodes, which needs to be self-powered. The longer the lifetime of a sensor, the
more stable the WSN. In order to save power, redundant activities should be
reduced if not eliminated. The most important factor to determine the life of a
sensor network is the energy consumption. Driven by a battery which is limited in
power and may not be rechargeable, sensor node is facing the big challenge of
conserving energy. Each mote depends on a low-capacity battery’s as an energy
source. Practically, the chance for battery replacement is nonexistent and sensor
nodes are deployed in unattended environment where battery replacement is not
possible. Hence, energy consumption is a vital factor to prolong sensor nodes
lifetime. If energy awareness can be applied in every stage of the wireless sensor,
the lifetime of the wireless sensor network can be maximized. Moreover, it will be
more powerful for wireless sensor networks to have the ability to make tradeoffs
between energy consumption and system performance.
To improve the energy efficiency for a static sensor network, different
techniques are available such as clustering [43-46], use of broadcast and
multicast trees [47-49] and exploitation of sleep modes[50, 51].It is imperative to
prevent sensor nodes from wasting energy in receiving packets unintended for
them. Combined with efficient medium access protocols, the “sleeping” approach
could reach optimal energy efficiency without degradation in throughput.
18
b) Localization
To have a faithful data to the users, sensor nodes must be used randomly in
the particular area, so that they must be aware of their locations to provide the
data. Hence the most fundamental and complex problem in WSN is the place
where network is to be established [52]. This location is dependent on many
factors and requirements potentially making it very troublesome [53]. e.g., cost of
extra localization hardware, beacons with their number and ranges, and their
degree of location accuracy, whether the system is indoors/outdoors, line of sight
umong the nodes, whether system is 2D or 3D , energy budget and duration of
localization, whether clock synchronized and kind of errors being made and
security attacks etc. In some cases difficulties are easily encountered. If the cost
and form factor are not of prime importance and few meters accuracy is
considered, then equipping of GPS is a probable answer. Majority of the
localization solutions in WSN are either range dependent or range- free. Range-
dependant schemes involve determination of distances between nodes (range) and
then location can be determined geometrically, whereas in range-free schemes, but
hop counts are used (distances are not determined directly). When hop counts are
estimated, distance between the nodes can be calculated geometrically to know the
location [54]. Various localization techniques can be classified as fine-grained and
coarse-grained. Timing, strength of the signal and pattern match and directionality
are the characteristics of the fine-grained localization, whereas coarse-grained is
based on multilateration and recursive trilateration.
The following are the rules for the localization:
System should work in the absence of node working
Immune to the noise
Estimated error should be low
Suitable for any territory.
19
c) Routing
For WSN, routing is important as far as power consumption is considered.
The network lifetime enhancement is a function of various power reducing factors.
The energy harvesting system has a major role instead of the data quality sent by
the motes to improve the network lifetime performance. Hence, conservation of
energy is also important compared to the performance of the network.
The literature survey shows the design principles for router that have been
extensively studied. Data compression with routing enhances the scalability of the
network [55]. There are three types of routing in WSN: flat-based routing,
hierarchical- routing and adaptive routing. In first, all nodes are assigned equal
roles [56] whereas in second, nodes have various roles in the network [57]. In the
third routing system parameters are controlled to adapt current conditions. [58,
59]. SPIN (Sensor Protocols for Information via Negotiation) and Directed
Diffusion are two primary routing protocols in wireless sensor networks. SPIN
protocols use information description for negotiation among all the sensor nodes
before transmission of the data [60]. Reactive routing sends out a sensing task that
it needs throughout the network and then the data node, sends it back to the former
[61]. Reference [62] discusses a variety of energy aware routing protocols.
1.6.5 Applications
WSN is used in applications like security, monitoring, biomedical research,
tracking etc [63, 64, 65]. The reduction in cost of the sensor nodes and energy may
lead revolution as far as applications of WSN are considered. The following
figures depict application potential of WSNs.
a) Environmental monitoring
The wireless sensor networks (WSN) is the most momentous technologies
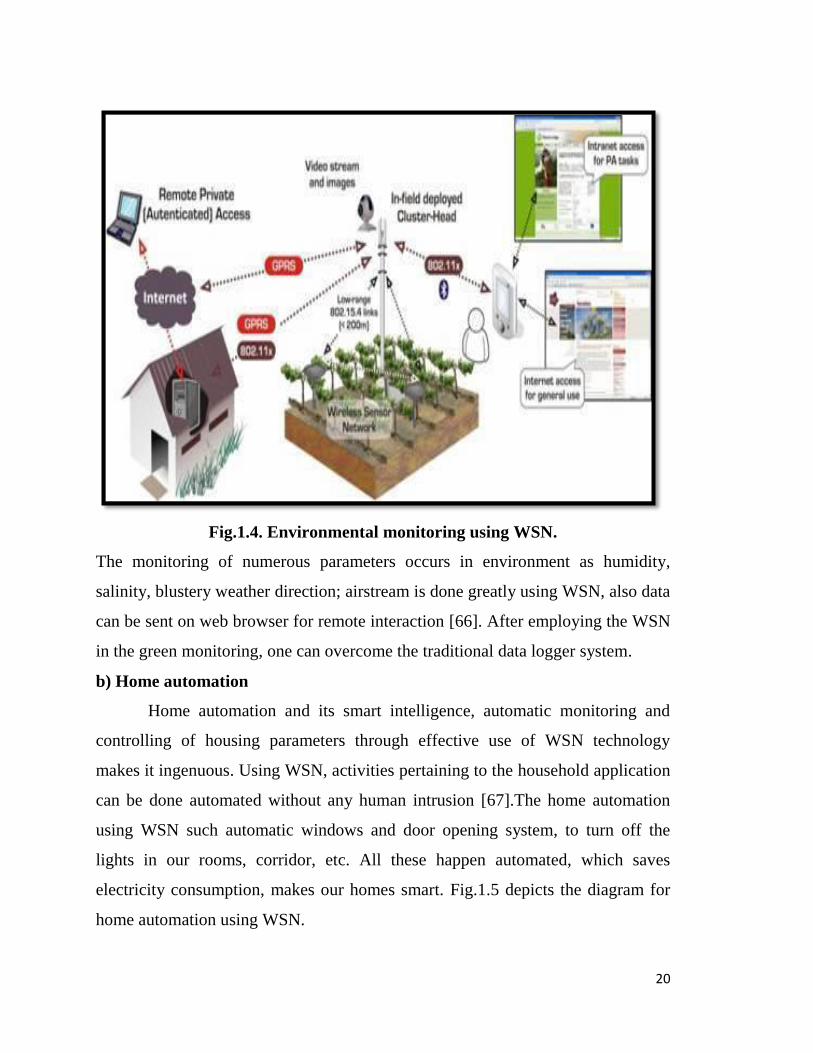
in today’s world. Fig.1.4 shows advancements and use of WSN in ecology
monitoring.
20
Fig.1.4. Environmental monitoring using WSN.
The monitoring of numerous parameters occurs in environment as humidity,
salinity, blustery weather direction; airstream is done greatly using WSN, also data
can be sent on web browser for remote interaction [66]. After employing the WSN
in the green monitoring, one can overcome the traditional data logger system.
b) Home automation
Home automation and its smart intelligence, automatic monitoring and
controlling of housing parameters through effective use of WSN technology
makes it ingenuous. Using WSN, activities pertaining to the household application
can be done automated without any human intrusion [67].The home automation
using WSN such automatic windows and door opening system, to turn off the
lights in our rooms, corridor, etc. All these happen automated, which saves
electricity consumption, makes our homes smart. Fig.1.5 depicts the diagram for
home automation using WSN.
21
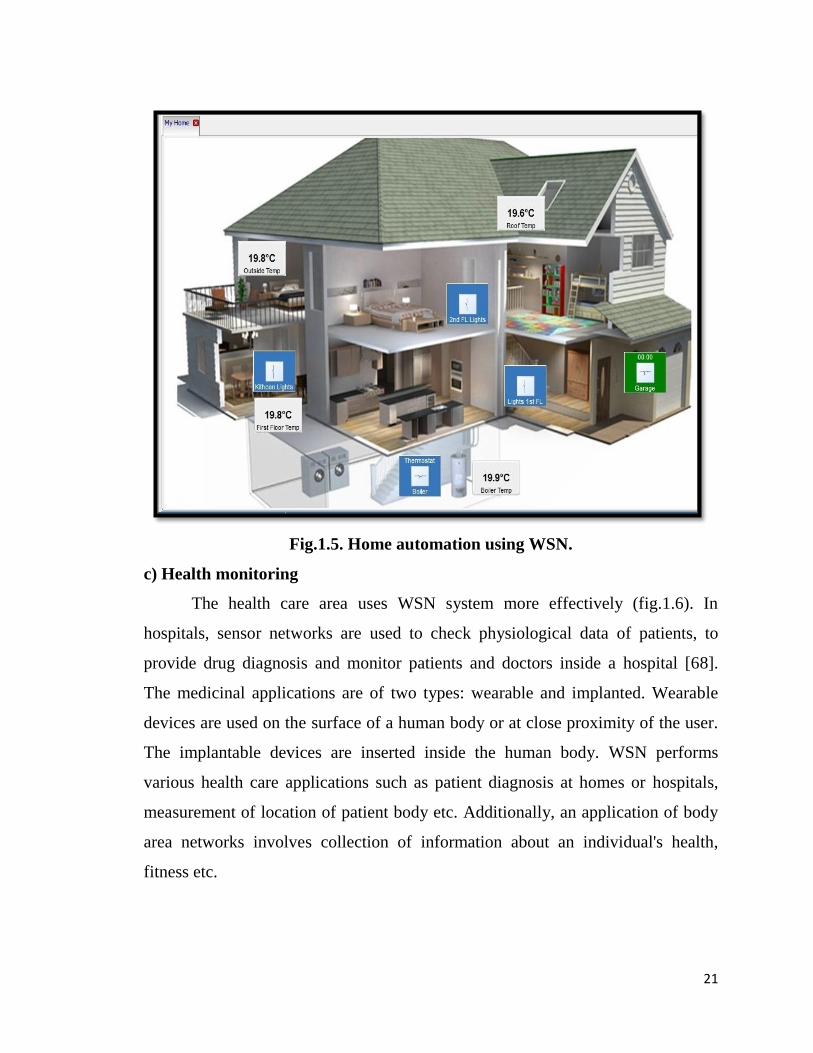
Fig.1.5. Home automation using WSN.
c) Health monitoring
The health care area uses WSN system more effectively (fig.1.6). In
hospitals, sensor networks are used to check physiological data of patients, to
provide drug diagnosis and monitor patients and doctors inside a hospital [68].
The medicinal applications are of two types: wearable and implanted. Wearable
devices are used on the surface of a human body or at close proximity of the user.
The implantable devices are inserted inside the human body. WSN performs
various health care applications such as patient diagnosis at homes or hospitals,
measurement of location of patient body etc. Additionally, an application of body
area networks involves collection of information about an individual's health,
fitness etc.
22
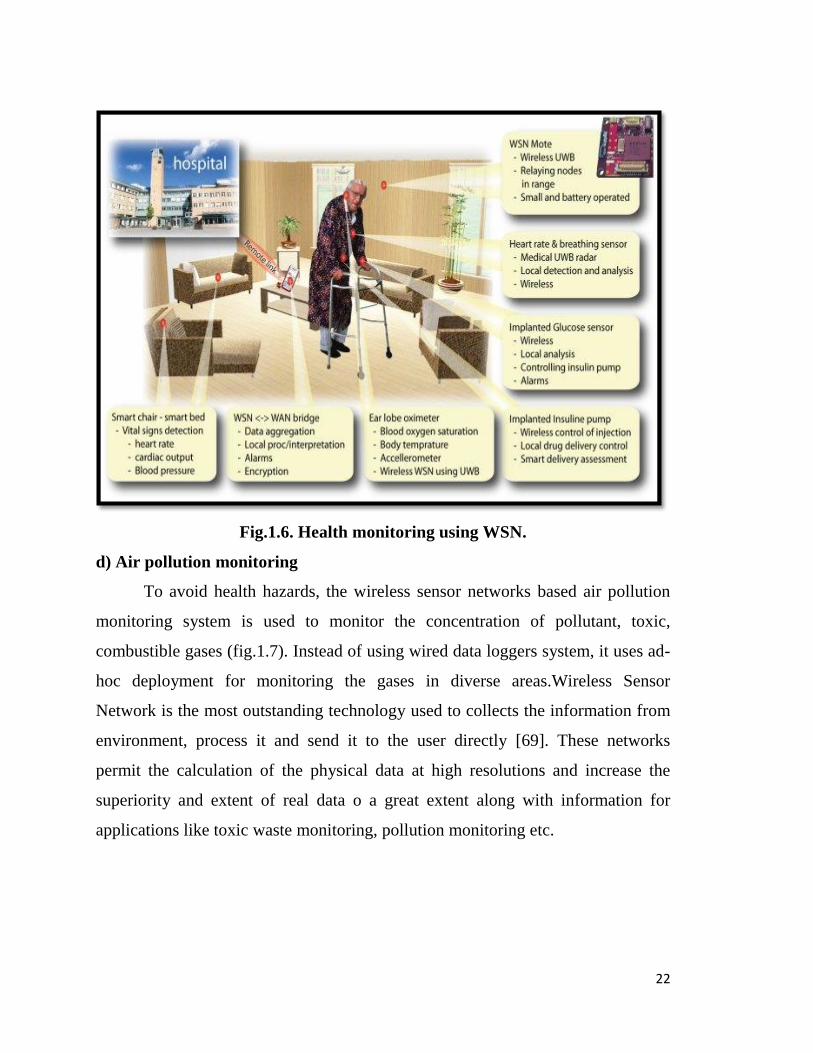
Fig.1.6. Health monitoring using WSN.
d) Air pollution monitoring
To avoid health hazards, the wireless sensor networks based air pollution
monitoring system is used to monitor the concentration of pollutant, toxic,
combustible gases (fig.1.7). Instead of using wired data loggers system, it uses ad-
hoc deployment for monitoring the gases in diverse areas.Wireless Sensor
Network is the most outstanding technology used to collects the information from
environment, process it and send it to the user directly [69]. These networks
permit the calculation of the physical data at high resolutions and increase the
superiority and extent of real data o a great extent along with information for
applications like toxic waste monitoring, pollution monitoring etc.
23
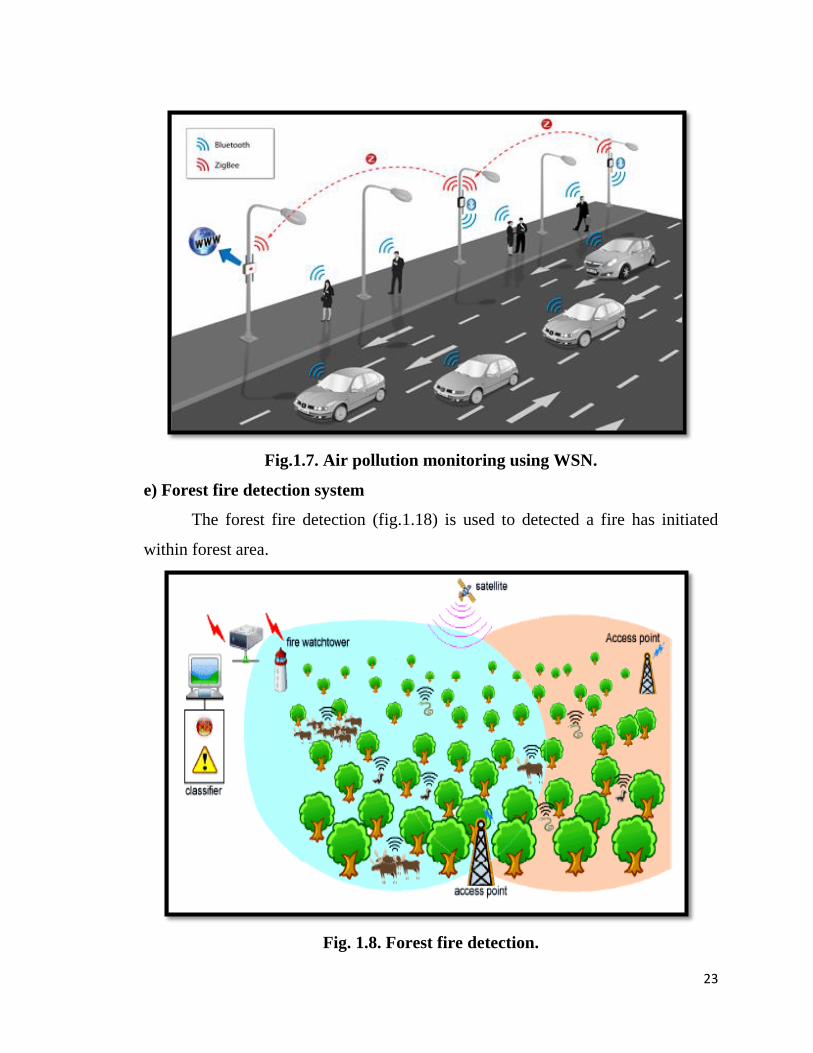
Fig.1.7. Air pollution monitoring using WSN.
e) Forest fire detection system
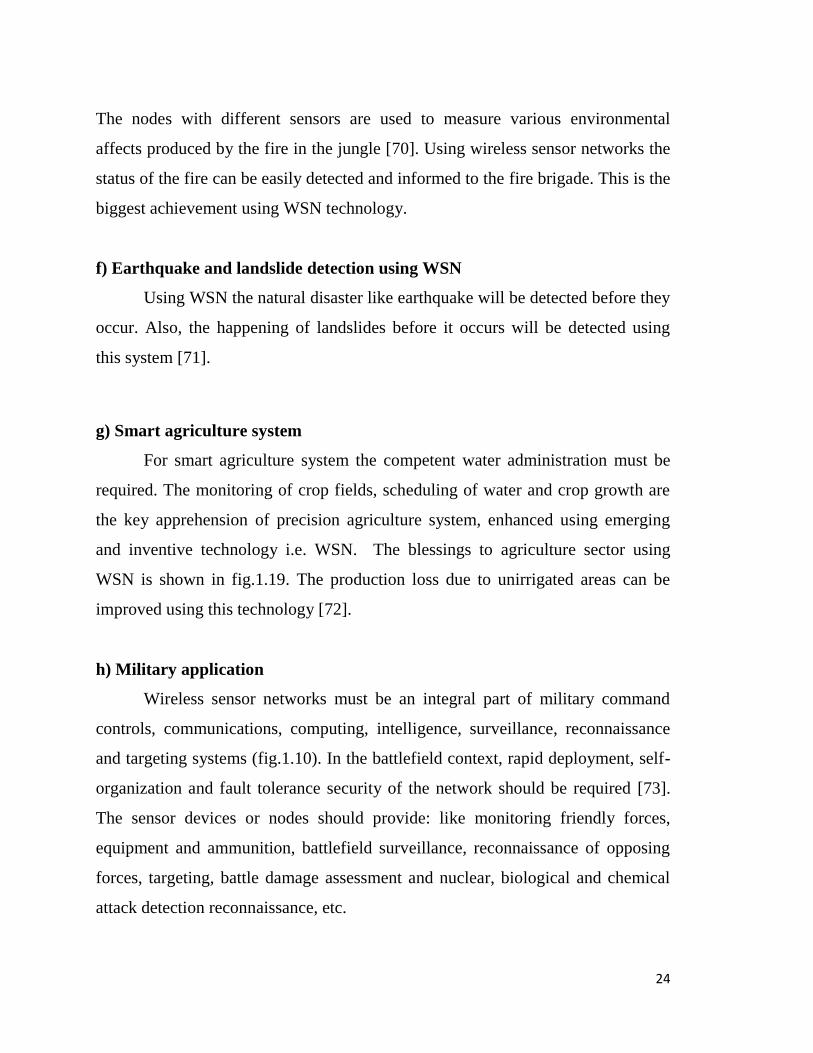
The forest fire detection (fig.1.18) is used to detected a fire has initiated
within forest area.
Fig. 1.8. Forest fire detection.
24
The nodes with different sensors are used to measure various environmental
affects produced by the fire in the jungle [70]. Using wireless sensor networks the
status of the fire can be easily detected and informed to the fire brigade. This is the
biggest achievement using WSN technology.
f) Earthquake and landslide detection using WSN
Using WSN the natural disaster like earthquake will be detected before they
occur. Also, the happening of landslides before it occurs will be detected using
this system [71].
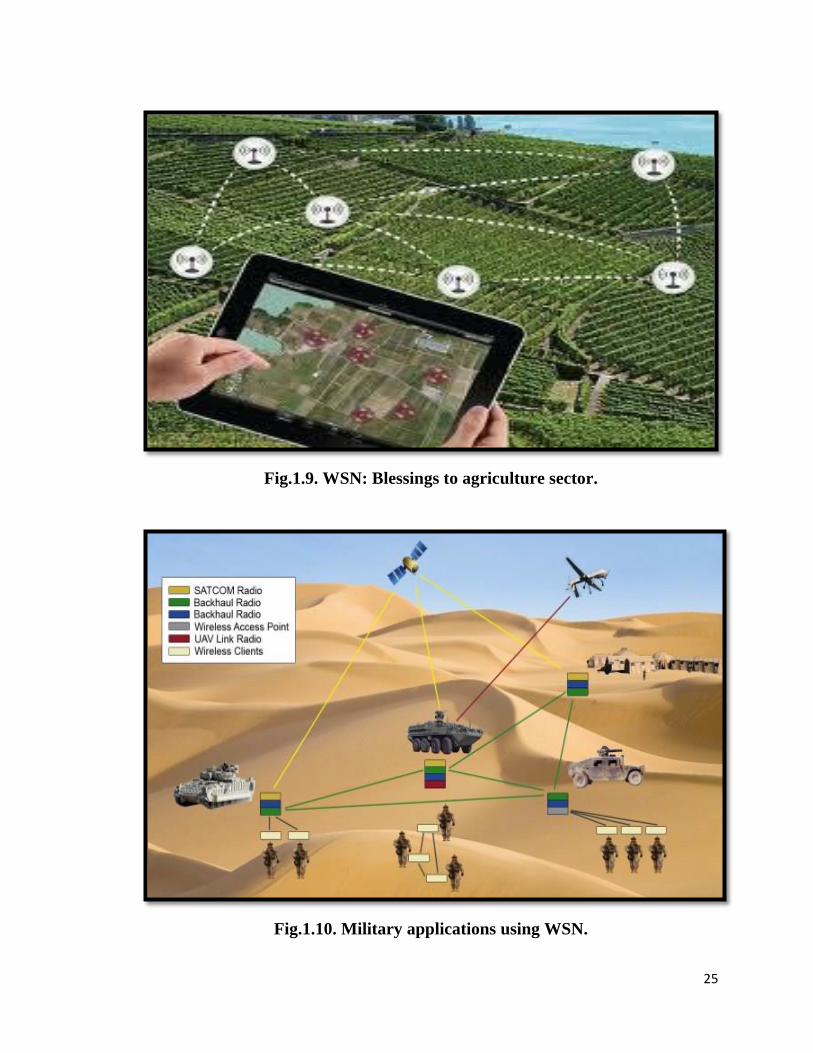
g) Smart agriculture system
For smart agriculture system the competent water administration must be
required. The monitoring of crop fields, scheduling of water and crop growth are
the key apprehension of precision agriculture system, enhanced using emerging
and inventive technology i.e. WSN. The blessings to agriculture sector using
WSN is shown in fig.1.19. The production loss due to unirrigated areas can be
improved using this technology [72].
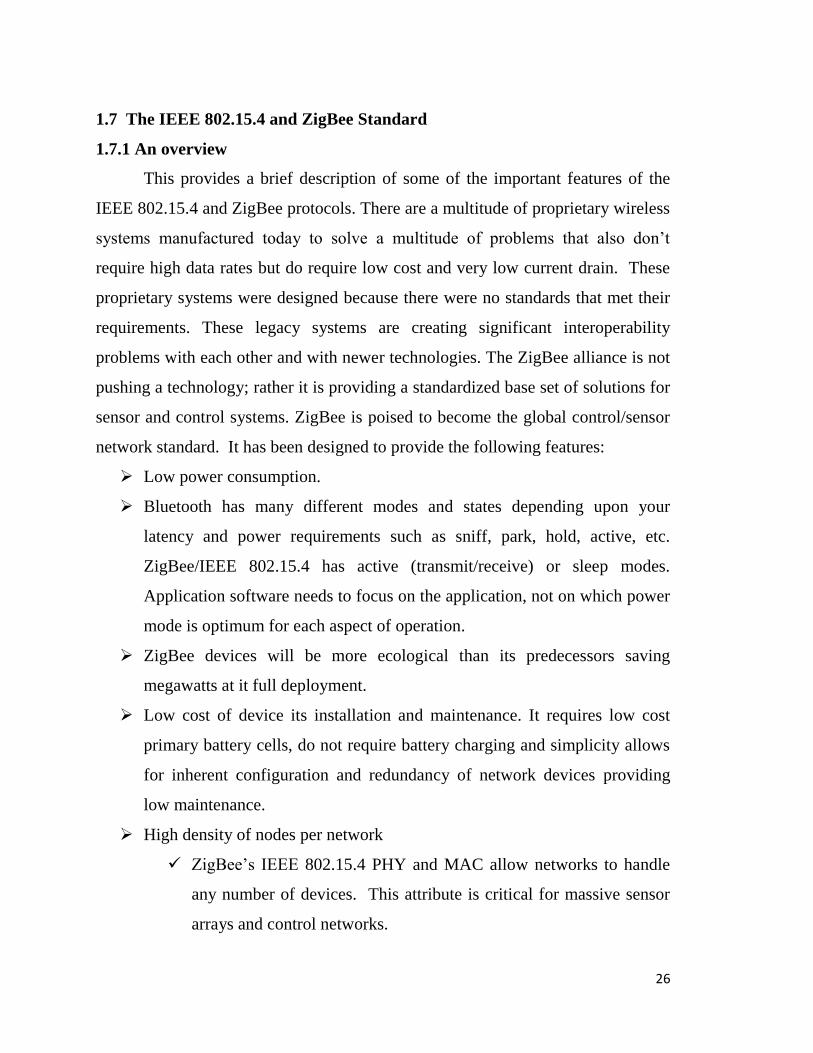
h) Military application
Wireless sensor networks must be an integral part of military command
controls, communications, computing, intelligence, surveillance, reconnaissance
and targeting systems (fig.1.10). In the battlefield context, rapid deployment, self-
organization and fault tolerance security of the network should be required [73].
The sensor devices or nodes should provide: like monitoring friendly forces,
equipment and ammunition, battlefield surveillance, reconnaissance of opposing
forces, targeting, battle damage assessment and nuclear, biological and chemical
attack detection reconnaissance, etc.
25
Fig.1.9. WSN: Blessings to agriculture sector.
Fig.1.10. Military applications using WSN.
26
1.7 The IEEE 802.15.4 and ZigBee Standard
1.7.1 An overview
This provides a brief description of some of the important features of the
IEEE 802.15.4 and ZigBee protocols. There are a multitude of proprietary wireless
systems manufactured today to solve a multitude of problems that also don’t
require high data rates but do require low cost and very low current drain. These
proprietary systems were designed because there were no standards that met their
requirements. These legacy systems are creating significant interoperability
problems with each other and with newer technologies. The ZigBee alliance is not
pushing a technology; rather it is providing a standardized base set of solutions for
sensor and control systems. ZigBee is poised to become the global control/sensor
network standard. It has been designed to provide the following features:
Low power consumption.
Bluetooth has many different modes and states depending upon your
latency and power requirements such as sniff, park, hold, active, etc.
ZigBee/IEEE 802.15.4 has active (transmit/receive) or sleep modes.
Application software needs to focus on the application, not on which power
mode is optimum for each aspect of operation.
ZigBee devices will be more ecological than its predecessors saving
megawatts at it full deployment.
Low cost of device its installation and maintenance. It requires low cost
primary battery cells, do not require battery charging and simplicity allows
for inherent configuration and redundancy of network devices providing
low maintenance.
High density of nodes per network
ZigBee’s IEEE 802.15.4 PHY and MAC allow networks to handle
any number of devices. This attribute is critical for massive sensor
arrays and control networks.
27
Simple protocol, global implementation
ZigBee’s protocol code stack is estimated to be about
1/4th of Bluetooth’s or 802.11’s. Simplicity is essential to cost,
interoperability and maintenance. It is a protocol that uses 802.15.4
standard as a baseline and adds additional routing and networking
functionality [74-75]. The IEEE 802.15.4 PHY has been designed
for 868 MHz band in Europe, the 915 MHz band in N. America,
Australia, etc. The 2.4 GHz band is now recognized to be a global
band accepted in almost all the countries.
1.7.2 The architecture of ZigBee
The two most common RF radios that are available from Digi are the Series
1 and Series 2 XBee. The Series 1 and Series 2 modules are quite similar, but
selection of a module should be based upon application specific needs.
All XBee radios have the same footprint and for the most part, are pin to pin
compatible (with a few differences in the placement of ADC/IO lines), but are not
interoperable. Series 1 and Series 2 use different application profiles, which are
unique to each radio family. They can however, use the same RS232 or USB
interface boards. The ZigBee devices are classified into two according to their
architecture as;
1. ZigBee Series-1: These radios use a microchip made by freescale that provides
a simple and point to point communication.
2. ZigBee Series-2:- It uses a microchip from Ember networks that enables
several different flavours of standards.
Both the series 1 and series 2 ZigBee devices are available in two different
versions such as regular and PRO [76]. The regular version is simply called an
XBee and other is XBee-PRO, which has more power consumption and
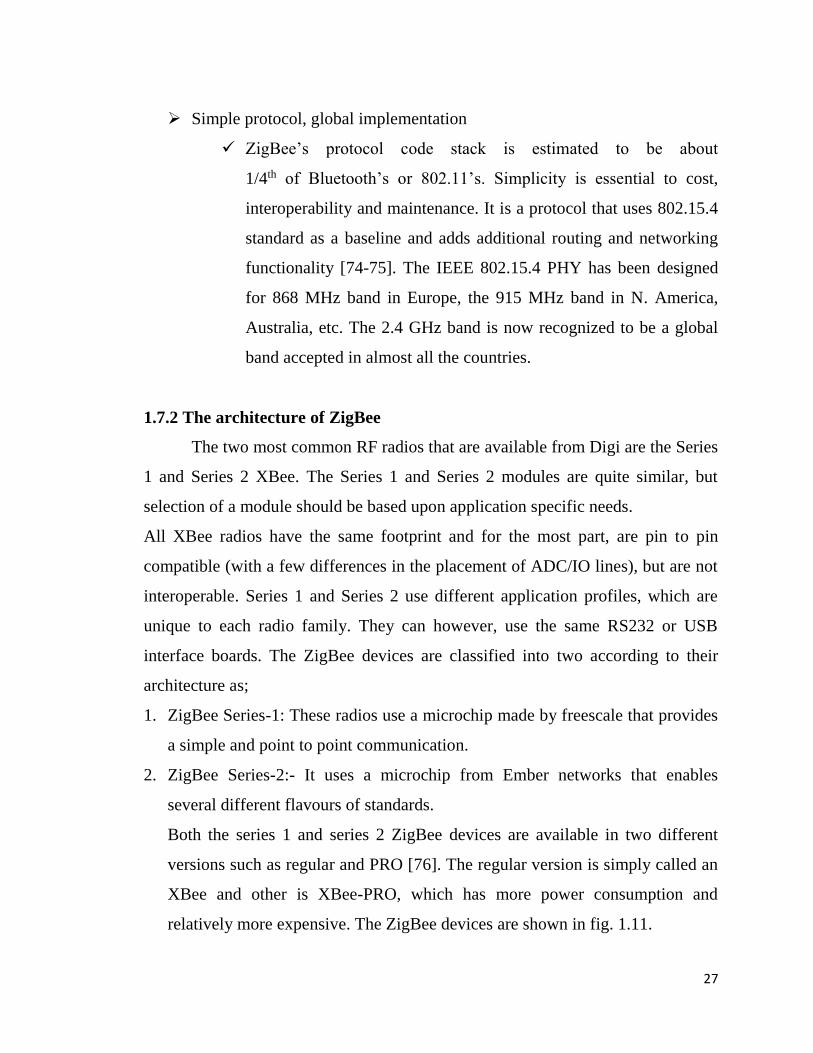
relatively more expensive. The ZigBee devices are shown in fig. 1.11.
28
Fig.1.11. Top and bottom views of XBee.
This XBee module has S2 hardware. The top side got only the antenna chip, which
replaces the regular antenna. In the left side, there is a place for a little antenna
when the antenna chip is not used. The ZigBee devices use different types of
antennas. Two of the most popular version are the chip antenna and whip antenna.
These use a chip with the actual antenna structure embedded in the chip. Many of
these devices use a whip (external) antenna via connector.
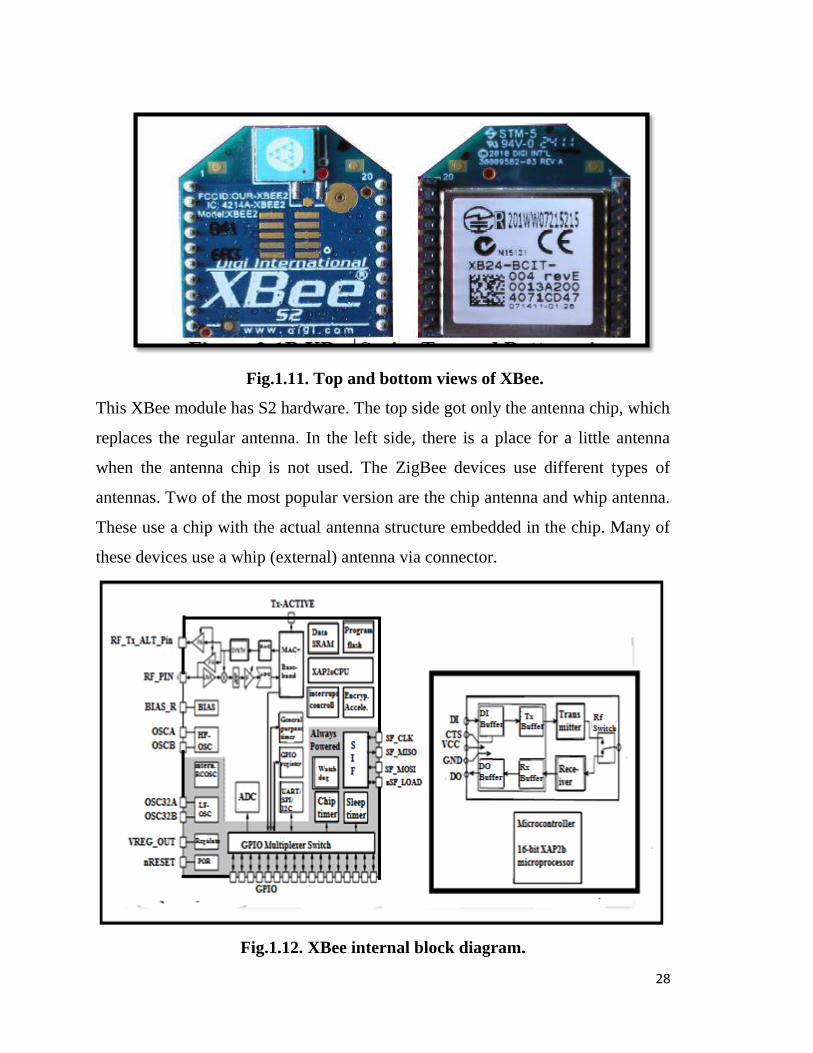
Fig.1.12. XBee internal block diagram.

29
Generally, the XBee module consists of the following internal parts as the block
diagrams describe (fig.1.12). It consists of a 16-bit microcontroller with all parts
that any 16 – bit microcontroller could have (ADC, Timer, Watchdog, Sleep timer,
UART, General-purpose I/O port, 128kB of Flash , 5kB of SRAM …etc.). Beside
the microcontroller, some other parts are for communication. The microcontroller
designed by Cambridge Consultants Ltd and runs on a 12 MHz clock speed. A
hardware AES encryption engine is included also in the EM250.
1.7.3 The features of ZigBee
The salient features of both the ZigBee devices are cited as follows. On
investigation of the structural details, it is found that ZigBee module of series
2(S2) is most suitable for establishment of the WSN.
30
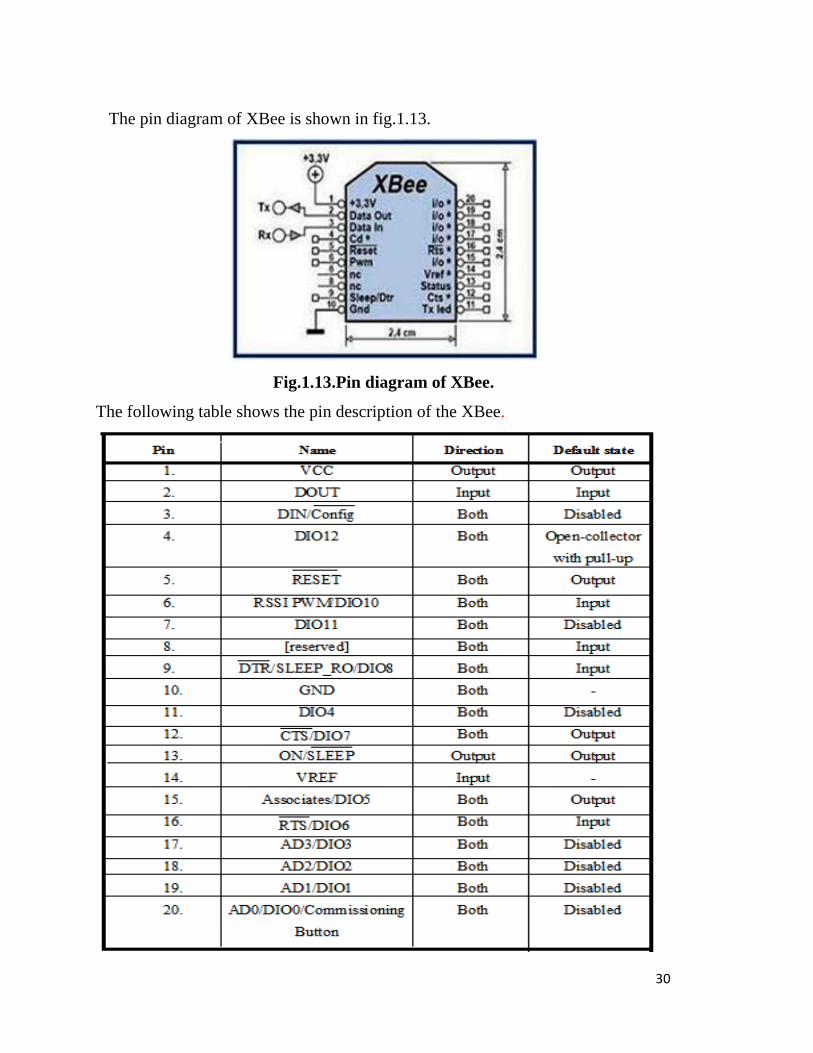
The pin diagram of XBee is shown in fig.1.13.
Fig.1.13.Pin diagram of XBee.
The following table shows the pin description of the XBee.
31
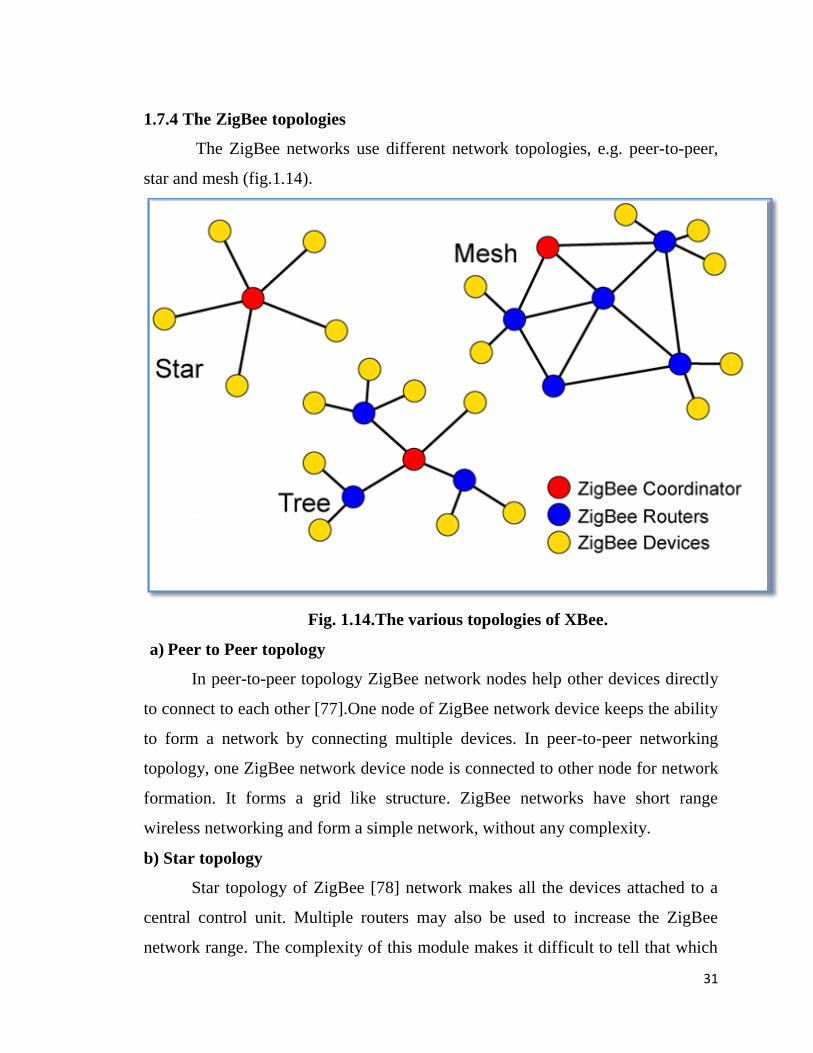
1.7.4 The ZigBee topologies
The ZigBee networks use different network topologies, e.g. peer-to-peer,
star and mesh (fig.1.14).
Fig. 1.14.The various topologies of XBee.
a) Peer to Peer topology
In peer-to-peer topology ZigBee network nodes help other devices directly
to connect to each other [77].One node of ZigBee network device keeps the ability
to form a network by connecting multiple devices. In peer-to-peer networking
topology, one ZigBee network device node is connected to other node for network
formation. It forms a grid like structure. ZigBee networks have short range
wireless networking and form a simple network, without any complexity.
b) Star topology
Star topology of ZigBee [78] network makes all the devices attached to a
central control unit. Multiple routers may also be used to increase the ZigBee
network range. The complexity of this module makes it difficult to tell that which
32
node is connected to which one but in case of any breakdown the ZigBee network
finds an alternate route to execute the command sending through coordinator and
does not get affected itself.
c) Mesh topology
Mesh topology (also called peer-to-peer) consists of a mesh of
interconnected routers and the end devices. Each router is typically connected
through at least two pathways, and can relay messages for its neighbours. Mesh
topology supports “multi-hop” communications through which data is transmitted
by hopping from device to device using the most reliable communication links and
most cost-effective path until its destination is reached [79]. The multi-hop ability
also helps to provide fault tolerance, in that if one device fails or experiences
interference, the network can reroute itself using the remaining devices. A mesh
topology is self-healing, means during transmission, if a path fails, the node will
find an alternate path to the destination. Devices can be close to each other so that
they use less power.
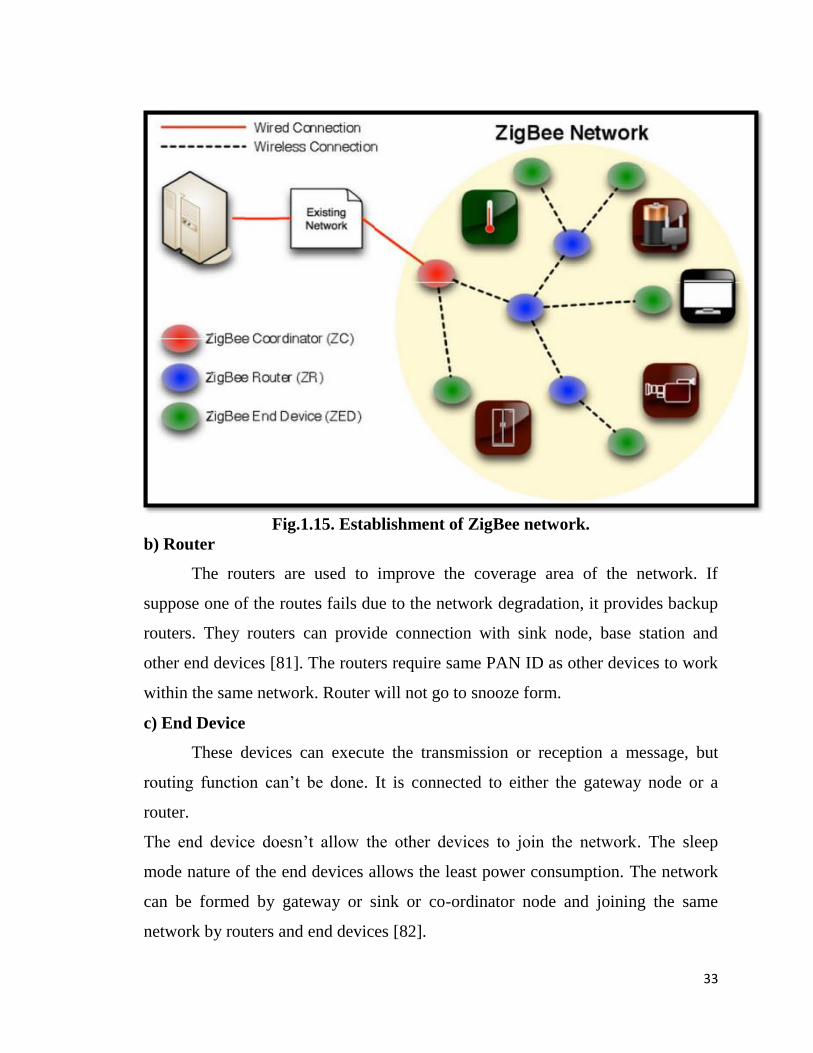
1.7.5 The ZigBee network devices
ZigBee networks include the device types as; coordinators, routers, end
devices (fig.1.15)
.
a) Coordinator
The coordinator stores information about the network, which includes
acting as the Trust Center being the repository for security keys. For performance
of the network the co-ordinator node need to be installed firstly, having same PAN
ID with respect to router or end devices. The PAN ID and channel selection is
done through sink node. [80]. The controlling of the network is done through it.
The coordinator is configured as the conviction center and network supervisor.
33
Fig.1.15. Establishment of ZigBee network.
b) Router
The routers are used to improve the coverage area of the network. If
suppose one of the routes fails due to the network degradation, it provides backup
routers. They routers can provide connection with sink node, base station and
other end devices [81]. The routers require same PAN ID as other devices to work
within the same network. Router will not go to snooze form.
c) End Device
These devices can execute the transmission or reception a message, but
routing function can’t be done. It is connected to either the gateway node or a
router.
The end device doesn’t allow the other devices to join the network. The sleep
mode nature of the end devices allows the least power consumption. The network
can be formed by gateway or sink or co-ordinator node and joining the same
network by routers and end devices [82].
34
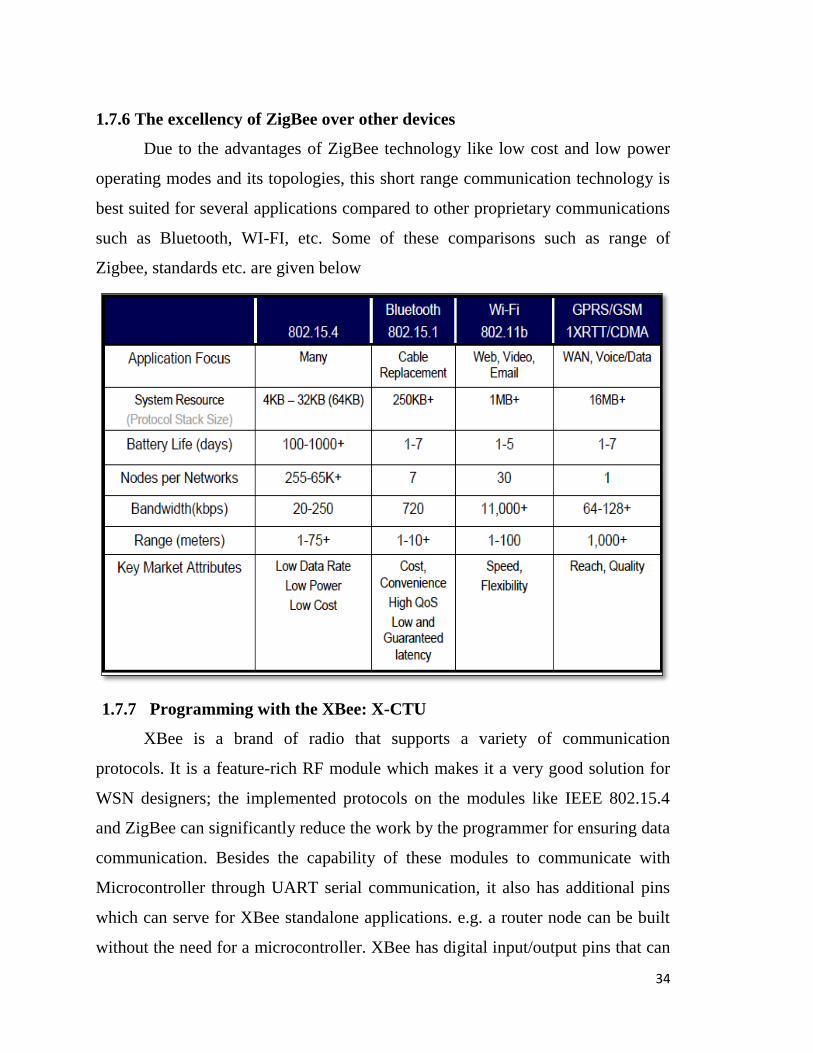
1.7.6 The excellency of ZigBee over other devices
Due to the advantages of ZigBee technology like low cost and low power
operating modes and its topologies, this short range communication technology is
best suited for several applications compared to other proprietary communications
such as Bluetooth, WI-FI, etc. Some of these comparisons such as range of
Zigbee, standards etc. are given below
1.7.7 Programming with the XBee: X-CTU
XBee is a brand of radio that supports a variety of communication
protocols. It is a feature-rich RF module which makes it a very good solution for
WSN designers; the implemented protocols on the modules like IEEE 802.15.4
and ZigBee can significantly reduce the work by the programmer for ensuring data
communication. Besides the capability of these modules to communicate with
Microcontroller through UART serial communication, it also has additional pins
which can serve for XBee standalone applications. e.g. a router node can be built
without the need for a microcontroller. XBee has digital input/output pins that can
35
be used to read a digital value by a sensor or to control a motor. XBee also has
PMW/analog pins; a 10-bit PWM pulse width modulated output may be sent to
another XBee. One important feature is line passing where a digital input on one
XBee can be reflected on the digital output of another, thus controlling the output
of the second XBee.
As discussed earlier, the ZigBee device can be called as XBee and should
be configured before deploying the same into respective WSN node. Present work
is based on development of wireless sensor network for hazardous gas leakage
detection. It comprises WSN node, wherein ZigBee are deployed. It is necessary
to configure these devices and hence to configure this devices the Digi corporation
has provided an integrated development environment (IDE) called “XBee
configuration and Test utility (X-CTU)”.Therefore, employing this IDE the
ZigBee devices are programmed and then deployed for present WSN.
X-CTU is a Windows-based application provided by Digi. This program
was designed to interact with the firmware files found on Digi’s RF products and
to provide a simple-to-use graphical user interface to them [83]. X-CTU is
designed to function with all Windows-based computers running Microsoft
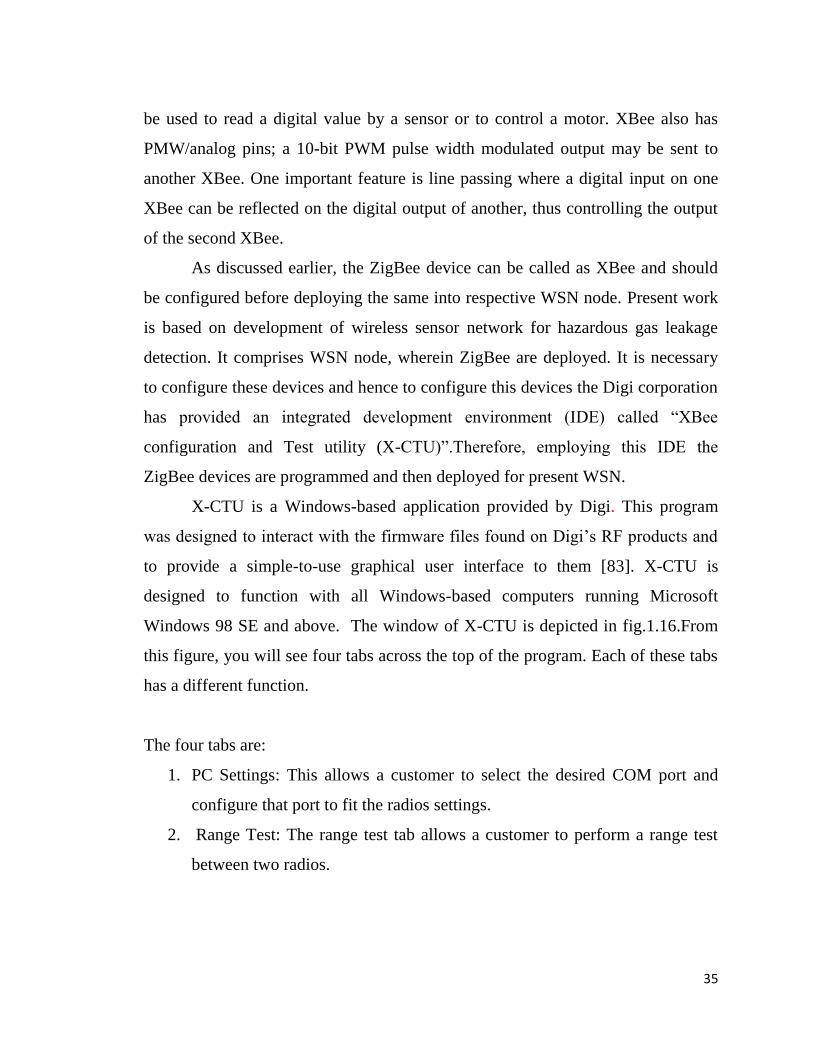
Windows 98 SE and above. The window of X-CTU is depicted in fig.1.16.From
this figure, you will see four tabs across the top of the program. Each of these tabs
has a different function.
The four tabs are:
1. PC Settings: This allows a customer to select the desired COM port and
configure that port to fit the radios settings.
2. Range Test: The range test tab allows a customer to perform a range test
between two radios.
36
3. Terminal: This allows access to the computers COM port with a terminal
emulation program. This tab also allows the ability to access the radios’
firmware using AT commands.
4. Modem Configuration: The modem configuration tab allows the ability to
program the radios’ firmware settings via a graphical user interface. This
tab also allows customers the ability to change firmware versions.
Fig.1.16.The programming tabs of X-CTU.
1.8. Motivation of the Research
In day to day life, environment has the most significant impact pertaining to
the health issues. The environment and industry air quality issues are therefore of
importance to enhance the awareness and responsibilities regarding the threat on
the environment towards public health. Most of the dangerous gases e.g.
refrigerant gas and liquefied petroleum gas (LPG), are colorless and odorless
37
compounds that are produced by the incomplete combustion and need to be
detected in order to inform the safety situation continuously.
The literature survey reveals that, many research devotions have been put
on gas leakage detection using wired networks.But wired sensors and monitoring
systems, however, presents many shortcomings: a long deployment time, high
maintenance cost, dependence on cable telemetry systems, the inability of cables
to resist to various damages, time consuming and expensive, large demand in
cable supplies, as well as unavailability of power supplies in remote places to
implement the monitoring systems. The answer to these questions is the
development of many wireless GPS and GSM based systems to detect the gas
leakages.
Therefore, the present research work is aimed to carry out using WSN
(Wireless Sensor Network) to replace non-compatible wired network system.
Moreover, advanced microcontrollers with low power consumption are available
to make smart WSN nodes. Monitoring of the system and GUI created using
LabVIEW tool makes the system more interactive, facile and effective compared
to reported.
1.9. Objectives of the Research Work
The objectives of this research work are to design, as well assemble and test
a dynamic system that can detect the presence of natural and combustible gases
and send an SMS alert to the user and nearest disaster management if gas leakage
occurs. The dynamic system makes mainly the use of Wireless Sensor Network
(WSN). The step programs that would be undertaken are as follows.
1. To analyze a gas sensor for the detection of liquid petroleum gas (LPG).
2. To establish the WSN nodes for gas leakage detection using Arduino nano
microcontrollers with XBee.
3. To study the salient features of ZigBee RF module and develop a suitable code
for it using X-CTU IDE.
38
4. To develop a dynamic system that can detect and control the gas leakage and
monitor automatically using LabVIEW.
5. Designing of the system will be such that it will be able to send SMS alert to the
users.
Taking the above survey into account, we are proposing a system which
will be able to detect and also control the gas leakage. In addition, it will be able
to alert by buzzer and should send an SMS. In addition, monitoring of the system
(wirelessly) would be easy and displayed on the internet using the URL obtained
from the web publishing tool. LabVIEW. The interface of the data monitoring
with internet server will provide an additional advantage to the users for
monitoring the gas leakage area at the long distance continuously.
We planned for a multistep research program and the actual quanta of the work
that has been carried out is divided into six chapters.
Chapter I mainly reviews the general concepts and some issues of wireless
sensor networks. This chapter includes basics of wireless sensor networks and
issues related to wireless sensor networks such as energy efficiency, localization
and routing strategy for the deployment of sensor nodes. A detailed literature
survey on the development of gas leakage detection and alert system and their
applications are also given in this chapter.
Chapter II starts with the discussion of hardware implementation of
wireless sensor node and includes details of microcontroller unit and its features.
The calibration of wireless sensor node using gas chamber is described in detail.
The design and development of PCB and co-ordinator node are discussed.
Chapter III concerns the details of technological platforms and development
tools required for a wireless gas sensing system. The details regarding the
development of firmware for wireless sensor node with arduino IDE, LabVIEW is
also discussed. The programming and flowcharts of wireless gas sensing system
are also described in this chapter.
39
Chapter IV gives detailed studies regarding implementation of wireless
system to monitor and control the LPG gas leakage. Designing of the graphical
user interface, in LabVIEW environment, is also discussed. The necessary circuit
required to control the gas leakage is also mentioned in the same chapter.
Chapter V includes detailed studies of testing and results of received signal
strength indicator (RSSI) of ZigBee.
Chapter VI highlights the summary of the research work with the
conclusions drawn.
40
References
1. A.Darwish and A.E.Hassanien, “Wearable and Implementable Wireless Sensor
Network for Health Monitoring”, sensor, 129 (2012) 12375-12376.
2. H. Alemdarand and C. Erosy, “Wireless Sensor Network for Health care’s: A
survey”, Computer Networks, 5415(2010) 2688-2710.
3. L. Lamont, M. Toulgoat, M. Deziel, “Tiered Wireless Sensor Network
Architecture for Military Surveillance Applications”, 5th International
Conference on (SENSORCOMM -2011), 288-294.
4. I.F. Akyildiz, W.S. Sankarasubramanium and E. Cayira, “Wireless Sensor
Network: A Survey”, Computer Networks, 384 (2002) 393-422.
5. http://www.sparkfun.com/datasheets/CellularShield/SM5100B%20TCPIP%20
App%20Note.pdf
6. “SM5100B-D AT Command” Shanghai Sendtrue Technologies Co., Ltd.,
2008.
7. Y.F. Sun, S.B. Liu, F.L. Meng, J.Y. Liu, “Metal Oxide Nanostructures and
Their Gas Sensing Properties: A Review”, Sensors 2012, 12, 2610-2631.
8. R. Srivastava, “Investigations on LPG sensing of nanostructured zinc oxide
synthesized via mechanochemical method”, American Journal of Engineering
Research (AJER), 3( 2013) 174-179.
9. J. Dyntar , I.Souček , I. Gros, “Application of Discrete Event Simulation in
LPG Storage Operation and Optimization”, IJCSI International Journal of
Computer Science Issues, 9 ( 2012) 33-42.
10. http://www.engineeringtoolbox.com/liquefied-petroleum-gas-lpgd_ 091.html
11. A. Somov, A. Baranov, A. Savkin, M.Ivanov, L. Calliari, R. Passerone, Е.
Karpov and А. Suchkov, “Energy-Aware Gas Sensing Using Wireless Sensor
Networks”, EWSN 2012, LNCS 7158, pp. 245–260.
12. D. bhattacharjee,P. Bhatnagar, S. choudhury, “Design and Development of a
Flexible Reliable Smart Gas Detection System”, IJCA, 31(2011) 1-8.
41
13. L.Z. Ya, W.Z. Dong and C. Rong, “Intelligent Residential Security Alarm and
Remote Control System Based on Single Chip Computer” 3rd International
conference on (ICIEA- 2008), June 3-5,159-161.
14. C. Peijiang and J. Xuehhua, “Design and implementation of remote monitoring
system based on GSM”, PACIIA-2008, 19-20 Dec. 678-681.
15. I. Lita, I.B. Cioc and D. A. Visan, “A New Approach of Automatic
Localization System Using GPS and GSM/GPRS Transmission”, 29th
International Spring Seminar on (ISSE-2006), 10-14 May, 115-119.
16. K. Galatsis, W. Wlodarsla, K.K. Zadeh and A. Trinchi, “Investigation of gas
sensors for vehicle cabin air quality monitoring”, IEEE (2002) 229-232.
17. K. Galatsis, W. Woldarsla, Y.X. Li and K.K. Zadeh, “A Vehicle air quality
monitor using gas sensors for improved safety”, Proceedings conference on
(COMMAD-2000), 65-68.
18. A. Srivastava, R. Prabhukar, “GSM Based Gas leakage Detection System”
Int.J.Tech.Research &Application, 1(2013) 42-45.
19. V. Rammaya, B. Palaniappen “Embedded System for Hazardous Gas
Detection and Altering” International Journal of Distributed and Parallel
Systems (IJDPS), 3 (2012) 287-300.
20. L.K. Hema, D. Murugan and M. Chitra “WSN based Smart system for
detection of LPG and Combustible Gases” IJETTCS, (NCASG-2013), ISBN
No. 978-93-80609-14-0.
21. A.Mahalingam, R .T. Naayagi, “Design implementation of an economic gas
leakage detector” 11th International conference on (AECE-2012), pp. 20-24.
22. C.Y.Chong and S.P.Kumar, “Sensor Networks: Evolution, Opportunities and
Challenges”, Proceedings of the IEEE, 91(2003) 1247-1256.
23. Crossbow Technology (n.d.), http://WWW.Xbow.com and Dust Networks,
Inc.(n.d), http:// www.dustnetworks.com
42
24. K. Bouabdellaha, H. Noureddine, S.Larbi, “Using Wireless Sensor Networks
for Reliable Forest Fires Detection”, 3rd International Conference on (SEIT
2013), Procedia Computer Science 19 (2013) 794 – 801.
25. S. Dubey and C.Agrawal, “A survey of data collection techniques in wireless
sensor network”, IJAET,6 (2013) pp. 1664-1673
26. U. Sharma, S.R.N. Reddy, “Implementation of a WSN based Home/Office
Automation (HOA)”, IJEAT, 3(2014) 370-376.
27. A. M. Bratkovski, "Monitoring an environment using RFID assembly." vol.
WO/2006/094085, W. I. P. Organization, 20 (2006) 1-3.
28. H. Kaur, R. S.Sawhney, N. Komal,” Wireless Sensor Networks for Disaster
Management” International Journal of Advanced Research in Computer
Engineering & Technology, 1(2012) 129-134.
29. F.Nack, “An Overview on Wireless Sensor Networks”, Institute of Computer
Science (ICS), Freie University, Berlin, (2010)1-8.
30. G.J.Pottie and W. J. Kaiser, “Wireless integrated network sensors”,
Communications of the ACM, 43 (2000) 51–58.
31. N.Wang, N. Zhang, M.Wang, “Wireless sensors in agriculture and food
Industry - Recent development and future perspective”, Computers and
Electronics in Agriculture, 50 (2006) 1–14.
32. N.K. Suryadevara, S. C. Mukhopadhyay, “Wireless Sensor Network Based
Home Monitoring System for Wellness Determination of Elderly”, IEEE
Sensors Journal, 12 (2012) 1965-1972.
33. J. Tiantian, Y. Zhanyong, “Research on Mine Safety Monitoring System Based
On WSN”, Procedia Engineering, 26 (2011) 2146 – 2151.
34. S. Tilak, N. A. Ghazaleh and W. Heinzelman “A taxonomy of wireless micro
sensor network nodels”, ACM Mobile Computing and Communications Rev.
(MC2R),6 (2002) 4.
43
35. J. Yick, B. Mukherjee and D. Ghosal, “Wireless sensor network survey,
Computer Networks 52 (2008) 2292–2330.
36. K. Maraiya, K. Kant and N. Gupta, “Application based Study on Wireless
Sensor Network”, International Journal of Computer Applications, 21(2011)
9-15.
37. V.Shnayder, “Simulating the Power Consumption of Large-scale Sensor
Network Application”, 2nd Int. Conference of (ENSS-2004), 188–200.
38. A.Gaafar, A.Elrahim, H. A.Elsayed, S. E. Ramly, M. M. Ibrahim, “An
Energy Aware WSN Geographic Routing Protocol” Universal Journal of
Computer Science and Engineering Technology, 1 (2010) 105-111.
39. A. Goldsmith and S. Wicker, “Design challenges for energy-constrained adhoc
wireless networks,” IEEE Wireless Communications Magazine, 9(2002) 8 - 27.
40. Z.J. Haas, G. M. Johnson,D. B. Perkins, “Special issue Wireless ad hoc
networks”, IEEE J. Selected Areas Commun., 17(1999) 1380-1394.
41. C.E. Perkins, Ed., Ad Hoc Networking. Addison -Wesley, 2000.
42. E.M. Royer and C. T. Keong, “A Review of Current Routing Protocols for Ad
Hoc Mobile Wireless Networks”. IEEE Personal Communications, 6(1999)
46–55.
43. W.B. Heinzelman,A.P. Chandrakasan and H. Balakrishnan, “An application-
Specific protocol architecture for wireless microsensor networks”, IEEE Trans.
Wireless Communication, 1(2002) 660–670.
44. A. Scaglione and S. Servetto, “On the interdependence of routing and data
compression in multihop sensor networks”, ACM Int. Conf. Mobile Comp.
Networks (MobiCom-2002), 140–147.
45. A.B. McDonald and T.F. Znati, “A mobility-based framework for adaptive
clustering in wireless adhoc networks”, IEEE J. Selected Areas Commun., 17
(1999) 1466–1487.
46. S.S. Pradhan, J. Kusuma and K. Ramchandran, “Distributed compression in a
44
dense microsensor network”, IEEE Signal Process.19 (2002) 51–60.
47. A. Ephremides, “Energy concerns in wireless networks”, IEEE Mag. Wireless
Commun., 9 (2002) 48–59.
48. J.E. Wieselthier, G.D. Nguyen and A. Ephremides, “On the construction of
energy-efficient broadcast and multicast trees in wireless networks”, IEEE
(INFOCOM -2000), 585–594.
49. J.E. Wieselthier, G.D. Nguyen and A. Ephremides, “An insensitivity property
of energy-limited wireless networks for session-based multicasting”, IEEE
International Symposium on (ISIT-2001), 24-29 June.
50. S. Singh and C.S. Raghavendra, “PAMAS — power aware multi-access
protocol with signaling for ad hoc networks”, ACM Computer Communication
Rev.28(1998) 5-26.
51. C.K. Toh, “Maximum battery life routing to support ubiquitous mobile
computing in wireless ad hoc networks”, IEEE Communication Mag., 39
(2001)138–147.
52. T. He, C. Huang, B. Blum, J. Stankovic and T. Abdelzaher, “Range-free
localization schemes for large scale sensor networks”, Proceedings of ACM
(MobiCom- 2003).
53. M. Haenggi, “Opportunities and Challenges in Wireless Sensor Networks”,
Handbook of Sensor Networks: Compact Wireless and Wired Sensing
Systems”, M. Ilyas and I. Mahgoub, eds. CRC Press, 2004, PP. 1.1–1.14,
54. H. Zhang and J. Hou, “Maintaining coverage and connectivity in large sensor
networks”, Ad hoc & Sensor Wireless Networks, 1(2005)89-124.
55. A. Scaglione and S. Servetto, “On the interdependence of routing and data
compression in multihop sensor networks”, 8th International Conf. on
(MobiCom-2002), 140–147.
56. K. Sohrabi and J. Pottie, “Protocols for self-organization of a wireless sensor
network”, IEEE Personal Commun., 7(2000) 16–27,
45
57. W. Heinzelman, A. Chandrakasan and H. Balakrishnan, “Energy-efficient
communication protocol for wireless microsensor networks”, Proc. 33rd
HawaiiInt. Conf. on (HICSS-2000), 4-7 January, 1-10.
58. W. Heinzelman, J. Kulik and H. Balakrishnan, “Adaptive protocols for
information dissemination in wireless sensor networks”, Proc. 5th ACM/IEEE
Mobicom Conf. (MobiCom-1999), 174–185.
59. J. Kulik, W.R. Heinzelman and H. Balakrishnan, “Negotiation-based protocols
for disseminating information in wireless sensor networks”, Wireless Network,
8 (2002)169–185.
60. D. Ganesan, R. Govindan, S. Shenkerand D. Estrin, “Highly resilient, energy-
efficient multipath routing in wireless sensor networks”, ACM Mobile
Computing Commun. Rev., 5(4), October 2001.
61. C. Intanagonwiwat, R. Govindan and D. Estrin, “Directed diffusion for
wireless sensor networks”, IEEE/ACM Trans. Networking, 11(2003) 2–16.
62. A. Manjeshwar and D.P. Agarwal, “APTEEN: a hybrid protocol for efficient
routing and comprehensive information retrieval in wireless sensor networks”,
Proc.Int., (IPDPS- 2002), 195–202.
63. A. Cerpa, J. Elson, M. Hamilton, "Habitat monitoring: application driver for
wireless communications technology”, ACM SIGCOMM Workshop Data
Commun.31(2001), April 3–5, pp. 20–41,
64. E. Stuart, T.H. Moh, “Privacy and security in biomedical applications of
wireless sensor networks”, 1st International Symposium on (ISABEL-2008),
Oct 25-28, pp.1-5.
65. P. Juang, H. Oki, Y. Wang, M. Martonosi, L. Peh and D. Rubenstein, “Energy-
efficient computing for wildlife tracking: Design tradeoffs and early
experiences with ZebraNet”,10th International Conference on (ASPLOS-2002),
pp. 96-107.
66. A. Kumar, I.P. Singh, S.K. Sud, “Indoor environment gas monitoring system
46
based on the digital signal processor”, International conference on (IMPACT-
2009), March 14–16, pp. 245–249.
67. R.Ashwini, P. Mohnani, “Application of Wireless Sensor Network in Home
Automation”, International Journal of Computer & Organization Trends, 9
(2014) 1-7.
68. W. Chang, T.J. Sung, H. W. Huang, Y. J. Yang “A smart medication
system using wireless sensor network technologies”, Sensors and Actuators
A: Physical 172 (2011) 315–321.
69. T.H.Mujawar, V.D.Bachuwar, S. S. Suryavanshi, “Air Pollution
Monitoring System in Solapur City using Wireless Sensor Network”,
Proceedings published by International Journal of Computer Applications®
(IJCA), CCSN-2013 (1) 1-15.
70. M. Hafeeda and M. Bagheri, “Wireless sensor networks for early detection of
forest fires”, IEEE International conference on (MASS-2007), Oct.8-11, 1-6.
71. P. K. Mishra, S. K. Shukla, S. Dutta, S. K. Chaulya and G. M. Prasad,
“Detection of Landslide Using Wireless Sensor Networks”, 978-1-4244-5118-
0/11/$26.00 ©2011 IEEE.
72. K. Shinghal, “Wireless sensor networks in agriculture: for potato farming”,
International Journal of Engineering Science and Technology, 2(2010) 3955-
3963.
73. A.V. Sutagundar, S.S.Manvi, “Context aware multisensory image fusion for
military sensor networks using multi-agent system”, IJASUC, 2(2011) 147-
167.
74. O. Hyncica, P. Kacz, P. Fiedler, Z. Bradac, P. Kuceraand R. Vrba, "The
ZigBee experience,” 2nd International Symposium on (ISCCSP-2006).
75. M. P. Shopov, G. I. Petrova and G. V. Spasov, "Evaluation of ZigBee - based
Body Sensor Networks,” Annual Journal of Electronics, 5(2011) 1-4.
76. http:/en.wikipedia.org/wiki/XBee
47
77. J.Yongping, F.Zehao, “Design and Application of Wireless Sensor Network
Web Server based on S3C2410 and ZigBee Protocol,” International
Conference on (NSWCTC-2009), 25-26 April, 2(2009) 28-31.
78. M. Inoue, T. Higuma, Y. Ito, N.Kushiro, H. Kubota, "Network Architecture
for Home Energy Management System," IEEE Transactions on Consumer
Electronics, 49 (2003) 606-613.
79. http:// lib.coardocs.org/ pars_docs/refs/8/7799/html m59138eaf.png.
80. K.Gill, S.H. Yang, F. Yao and X. Lu, “A ZigBee Based Home Automation
System”, IEEE Transactions on Consumer Electronics, 55 (2009) 422-430.
81. C.Sasikumar, D.Manivannan, “Gas Leakage Detection and Monitoring Based
on Low Power Microcontroller and XBee”, International Journal of
Engineering and Technology (IJET), 5(2013) 58-62.
82. A. Wheeler, “Commercial Applications of Wireless Sensor Network Using
ZigBee”, IEEE Communications Magazine, 45(2007) 70 – 77.
83. Online support: http://www.digi.com/support/eservice/login.jsp

48
49
CHAPTER II
HARDWARE IMPLEMENTATION OF WIRELESS
SENSOR NODES
2.1 Introduction 51
2.2 The Wireless Sensor Nodes 52
2.3 The Requirements of a Wireless Sensor Node 53
2.3.1 The microcontroller unit of WSN node 54
a) The salient features of an ATmega328 55
b) The pin description of an ATmega328 56
c) The I/O ports 57
d) The reset circuit 57
2.3.2 The hardware components 57
a) The gas sensing and the unit 58
1. The gas sensing 58
2. The gas sensing unit 59
b) The circuit for gas sensor 60
c) The output circuit connection of wireless gas sensing system 62
2.3.3 The PCB development 64
2.3.4 The power supply unit for sensor nodes 64
2.3.5 The hardware components for co-ordinator node 65
a) The XBee module 66
b) An arduino UNO microcontroller 66
c) An arduino GSM shield 66
d) The buzzer 68
50
e)
The power supply unit for co-ordinator node
68
2.3.6 The PC/Laptop for visual interpretation 69
2.4 Methodology 70
2.4.1 The calibration of WSN nodes 70
2.4.2 The design of WSN nodes for hazardous gas (LPG) leakage
detection and measurement: hardware implementation
72
2.4.3 The design of co-ordinator node: hardware implementation 75
2.5 Conclusions 76
References 77
51
CHAPTER II
HARDWARE IMPLEMENTATION OF WIRELESS SENSOR NODES
2.1 Introduction
The development in the equipment and our daily life are the major failures
to protect the environment against pollution. Consequently, the ecological
contamination control and monitoring systems becomes major issue [1]. The
environmental and industrial issues create the responsiveness and duty, regarding
the hazard on the environment towards human health. The liquefied petroleum
(LPG) and its leakage in large amount cause explosive accidents. Therefore, gas
leakage detection and alerting are of prime importance. The advanced
technologies with exactness and most competent quantity system are need of
today’s solution [2, 3, 4]. Such gas leakage detection and alert systems are of
extremely importance in homes, industries, automobiles, etc. [5].To develop such
a hazardous gas leakage detection system, the wireless sensor network system is
the only solution today [6] and is a novel class of computing, a new spot of
information technology and made up of a large amount of inexpensive micro
sensor nodes deployed in a monitored region. Integrated sensor nodes can inspect,
collect, process and transmit data of perceivable objects within the coverage of
network by perceiving and controlling parameters [7-9]. In sensor network, energy
is consumed mainly for three purposes namely data transmission, signal
processing and hardware operation [10]. As pointed out earlier, wireless sensor
network is a distributed network and hence it becomes more invasive among the
industrial, environmental, agricultural and military sectors. It is an innovative
technology to avoid hazards associated with the gas leakages [11-14]. According
to occupational safety and health administration (OSHA), hazardous gas is that, in
which chemicals present in the workplace are capable of causing harm. The
chemical term being referred to the dust, mixtures and common materials such as
paints, fuels and solvents. In view of the LPG gas limitation, OSHA mentioned
52
that exposes over 1000 ppm of LPG gas will cause hazards to human respiration
system [15]. Therefore, this value is used as the threshold value for the design
system under interest.
Jan et al [16] have applied wireless sensor network for carbon monoxide
detection and autonomous counter measurement system for a mill. The CO sensor
module is connected to a TelosB node and interfaced with ZigBee wireless
connectivity to the central controller. The system comprised of the central
controller, a high-end PC, connected to the TelosB wireless sensor module via
USB and to the actuator circuit through RS232. Somov et al [6] developed a
wireless sensor network system for smart gas (CO) monitoring. The system
represents an energy management that involves three sensor levels; the network
co-ordinator that uses information from the PIR sensor, neighbouring nodes to
detect the presence of a gas concentration and modulate the duty cycle of the node
and the sensor board, designed with a wireless sensor network (WSN) node that
can autonomously send the recorded data wirelessly. The recent addition in
wireless gas sensing system is a GPS based WSN systems [17-22].
As discussed earlier, architecture of a Wireless Sensor Network involves
the collaborative association of router and co-ordinator nodes [23-25].The
reliability of Wireless Sensor Network depends upon the small tiny devices called
sensor nodes. These sensor nodes are set with radio interface (ZigBee) with which
they establish communication link to form a network. Hence, entire working of a
Wireless Sensor Network is dependent on the sensor nodes [26-32].Present work
is based on the development of WSN for LPG gas leakage detection and the sensor
nodes were developed using an arduino microcontroller. The system consists of
both hardware as well as software components. The issues pertaining to hardware
components of the WSN nodes are described in this chapter.
2.2 The Wireless Sensor Nodes
A sensor node (also known as a mote) is the fundamental unit of a WSN.
53
Sensing, processing and communication are the three key elements in wireless
sensor networking whose combination in one tiny device gives rise to a sensor
node that can store and/or communicate the data over the network wirelessly [33].
The sensor motes are typically low-cost, low-power, small devices equipped with
limited sensing, data processing and wireless communication capabilities with
power supply. Such small, lightweight and portable sensor nodes are especially
designed in such a typical way that they have a microcontroller which controls the
monitoring a sensing element (sensor), a radio transceiver for generating radio
waves, different type of wireless communicating devices and also ready with an
energy source like battery. Distributed over the object, sensor nodes with the
necessary sensors make it possible to gather information about the object and
control processes which take place on this object. Depending on the application,
the sensor node may contain extra hardware parts. Usually sensor node is an
autonomous device. Each sensor node in WSN measures some physical conditions
such as temperature, humidity, pressure, vibration, and converts them into digital
data. Sensor node can also process and store measured data before transmission.
The detailed architecture of wireless sensor nodes is described in chapter I.
2.3 The Requirements of Wireless Sensor Nodes
The sensor node is the heart of the Wireless Sensor Network required to
perform various applications such as sensing, information gathering, processing
etc. The sensor nodes are required to coordinate with other nodes in the network,
they have the ability to communicate, measure and actuate in great detail. The
combination of sensor nodes creates an ad-hoc network e.g. the nodes can be
distributed to an environment and wireless ad-hoc networks can be formed. To
make Wireless Sensor Network such thousands of nodes are brought together that
communicate through wireless channels for information sharing and cooperative
processing. Although each node in the WSN is very limited in energy,
54
communication ability and computing and storage ability, the WSN has very
obvious advantages;
1) They can store a limited source of energy.
2) They have no hassle of cables and have mobility.
3) It can work efficiently under the harsh conditions, and it has large deployment.
4) It can be accessed through a centralized monitor.
5) Communication networks are self-organized with network topology adaptive
to various environments.
Hence, without sensor node the Wireless Sensor Network is incomplete.
2.3.1 The microcontroller unit for WSN node
The microcontroller plays a key role in the field of WSN technology. The
salient features of microcontroller decide the reliability of the WSN node [34, 35].
Going through the literature survey, it is found that there are various families of
microcontrollers such as PIC [36, 37], AVR [38, 39], ARM [40-42], LPC [43, 44],
MSP [45,46,47] etc those have been adopted for deployment of the Wireless
Sensor Networks. In the present system, it is decided to use the arduino platform
or microcontroller for the deployment of WSN nodes. Also, there are many other
microcontrollers and microcontroller platforms available for physical computing
e.g. Parallax Basic Stamp, Netmedia's BX-24, Phidgets, MIT's Handyboard and
many others offer similar functionality. All of these tools take the messy details of
microcontroller programming and wrap it up in an easy-to-use package. The use of
an arduino simplifies the process of working with microcontrollers and
additionally it offers some advantages to the users (teachers, students, and
interested amateurs) over other systems such as cross-platform, simple, clear
programming environment, open source and extensible software and hardware.
Arduino platform has good specifications e.g. cheap, easy to use and wide
varieties of shields that have been emerged with many different purposes such as
Ethernet and GSM support.
55
a) The salient features of an arduino nano microcontroller (ATmega328)
The ATmega328 is an embedded board having included USB competence.
The miniature and user responsive nature makes it more superior than other
advanced microcontrollers. These microcontrollers have more on chip facilities
such as +5V, analog and digital pins. It doesn’t have on board power jack. Due to
the auto switching capability of ATmega 328 microcontroller, no external power
jumpers are required. It posses various on board pins and has superior features as
follows:
It has automatic reset
LED indicating power satisfactory.
On board transmission and reception LED’s
Switching automatically to input power.
On board USB facility for serial communication
Reset can be done manually by pressing on board reset button.
The arduino nano controller has following features as:
The operating voltage is 5V.
The suggested input voltage is 7-12 V.
It has 14 digital input/output pins out of which six pins provides PWM
facility.
There are normally eight analog pins.
The current handling capability of this controller is approximately equal to
40 mA.
It has on board 32 KB flash memory, 2 KB SRAM and 1 KB EEPROM.
The crystal clock required for this controller is 16 MHz.
It is portable in nature.
Therefore, the present WSN nodes are designed using arduino nano-
microcontroller.
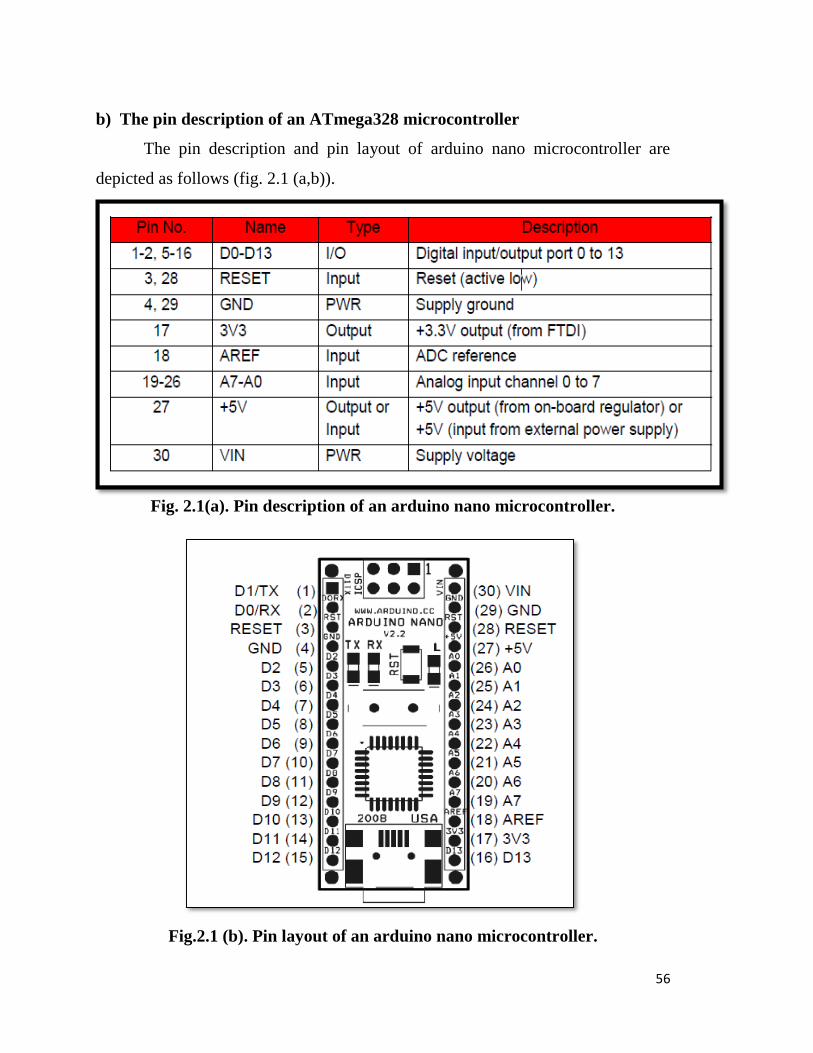
56
b) The pin description of an ATmega328 microcontroller
The pin description and pin layout of arduino nano microcontroller are
depicted as follows (fig. 2.1 (a,b)).
Fig. 2.1(a). Pin description of an arduino nano microcontroller.
Fig.2.1 (b). Pin layout of an arduino nano microcontroller.
57
c) The I/O ports
The I/O pins of arduino nano microcontroller can be programmed using
various functions available in arduino IDE. The 5 volt is required to operate the
microcontroller. Each pin has an internal pull-up resistor of 20-50 KΩ. The
workings of some pins are summarized below.
Serial pins - These pins are used for transmission and reception.
Exterior interrupt pins - It is used when external interrupts becomes
active.
PWM pins- It provides PWM facility to the controller using 3,5,6,9,10 and
11.
Serial Peripheral Interface – The Serial Peripheral Interface
communication is possible through the pins available on board.
LED: 13- The board uses digital pin 13 as LED.
I2C: (SDA) and (SCL) – The I2C (TWI) communication is possible using
wire library.
d) The reset circuit
Through the software running on a computer, any program may allow to
reset on arduino nano board. The reset circuit uses a 100 nf capacitor. The
uploading of code can be done using upload button in the arduino IDE [48]. When
the nano is connected to laptop/computer, it resets each time (via USB). For the
following half-second or so, the boot loader is running on the nano. If a sketch
running on the board receives one-time configuration or other data, when it first
starts, make sure that the software with which it communicates waits a second
after opening the connection and before sending this data.
2.3.2 The hardware components
Few parts of hardware for a wireless gas sensing and controlling system
are an exhaust fan and a buzzer and its interfacing circuits. In this section, the
design of a system and function of each component and its interfacing to arduino

58
is discussed. Actually the gas sensing unit required for sensor calibration is
described in this section. Additionally, power supply unit developed for sensor and
sink node is also deals with this section.
a) The gas sensing and the unit
In this, a gas sensing apparatus to achieve the sensing mechanism is
discussed.
1. The gas sensing
The device which converts physical quantity into electrical quantity is a
sensor according to the Instrument Society of America. The different definitions
and diverse views about the sensors have been adopted by scientists and engineers.
Also sensor is a device which converts one form of energy into other form.
Normally, the sensors are grouped according to their signals are received and
generated [49]. The sensors are classified according to the energy generated or
received by them. Sensors categorization is enormous field, can’t be classified on
one criterion e.g., they are classified according to its relevance, the fabric and the
property used by itself.
The sensors are active or passive in nature. To obtain and quantify the
signal, passive sensor is used. An active sensor is used for measuring signals
transmitted by the sensors that were reflected, refracted or scattered. Based on the
transmission of signals, active or passive sensors are classified. The vital
properties of sensors are summarized below.
The time taken by the sensor
How sensors are reproducible
An aging effect of the sensor
The sensitivity and stability possessed by the sensor
dynamic range
selectivity
size, weight and cost.
59
The response time of a sensor is the time taken by the sensor to reach 90%
of its steady state output value after the introduction of the measurand, whereas the
recovery time is the time taken by a sensor to be within 10% of the value it had
before the exposure to the measurand. The sensor with less response time and
recovery time is considered to be a good sensor. The ability of the sensor to
produce the same characteristic upon the repeated exposure to a particular
measurand is referred to as it’s reproducibility. The sensor with excellent
reproducibility will have the same recovery time, response time as well as the
same response for a particular measurand. However, there is some degradation on
the sensor signature after a long use of the sensor and it is natural. The time taken
by a sensor for it’s degradation is commonly known as aging. Sensitivity and
resolution are the critical properties of a sensor for the application with the precise
measurement system or for the application sensing the potentially dangerous
measurand. The smallest change in the measurand that a sensor can detect is the
resolution of the sensor and the change in the output per unit change in the
measurand is the sensitivity of the sensor. The importance of properties of a sensor
depends on the application where the sensor has to be used. For example: In the
detection of highly toxic gas, sensitivity is the important property, in online
control system where the measurand is exposed repeatedly. Reproducibility and
aging are the important properties wherein as application relating to the
implantation of biosensor in the animals, weight and size becomes the important
issues.
2. The gas sensing unit
The gas sensing unit is a cylindrical leak proof metallic (good quality
stainless steel) chamber of volume around 250 cm3. It’s typical dimensions are 8.6
cm X6 cm. It is fitted on a metallic base of dimension16.5cm X 15 cm. The
chamber was made leak proof using the metallic and rubber O-rings fitted tightly
to the chamber by a screw arrangement. A provision was made for inletting the
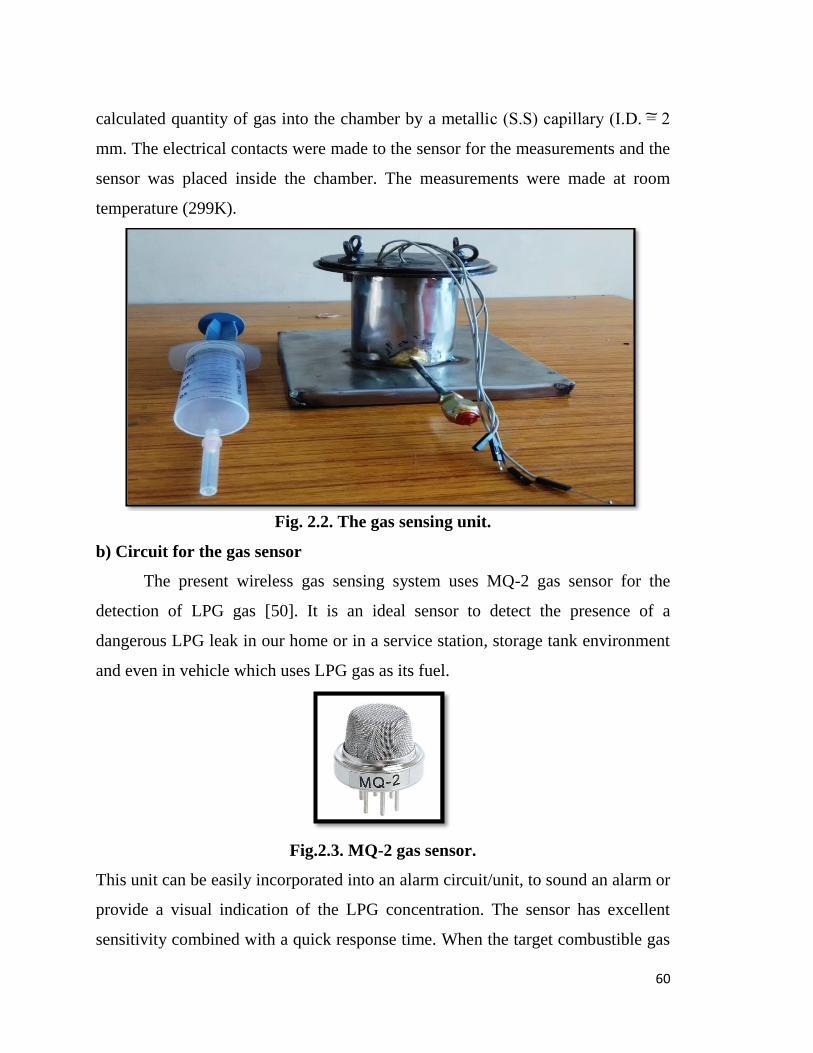
60
calculated quantity of gas into the chamber by a metallic (S.S) capillary (I.D. = 2
mm. The electrical contacts were made to the sensor for the measurements and the
sensor was placed inside the chamber. The measurements were made at room
temperature (299K).
Fig. 2.2. The gas sensing unit.
b) Circuit for the gas sensor
The present wireless gas sensing system uses MQ-2 gas sensor for the
detection of LPG gas [50]. It is an ideal sensor to detect the presence of a
dangerous LPG leak in our home or in a service station, storage tank environment
and even in vehicle which uses LPG gas as its fuel.
Fig.2.3. MQ-2 gas sensor.
This unit can be easily incorporated into an alarm circuit/unit, to sound an alarm or
provide a visual indication of the LPG concentration. The sensor has excellent
sensitivity combined with a quick response time. When the target combustible gas
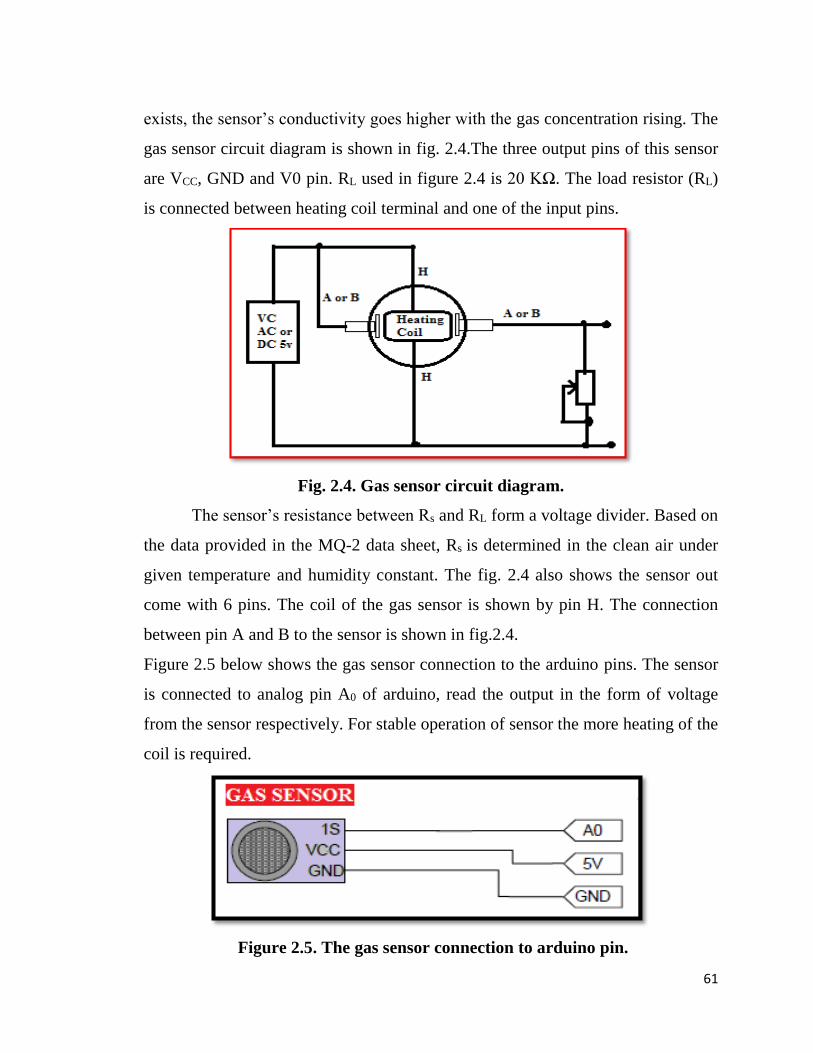
61
exists, the sensor’s conductivity goes higher with the gas concentration rising. The
gas sensor circuit diagram is shown in fig. 2.4.The three output pins of this sensor
are VCC, GND and V0 pin. RL used in figure 2.4 is 20 KΩ. The load resistor (RL)
is connected between heating coil terminal and one of the input pins.
Fig. 2.4. Gas sensor circuit diagram.
The sensor’s resistance between Rs and RL form a voltage divider. Based on
the data provided in the MQ-2 data sheet, Rs is determined in the clean air under
given temperature and humidity constant. The fig. 2.4 also shows the sensor out
come with 6 pins. The coil of the gas sensor is shown by pin H. The connection
between pin A and B to the sensor is shown in fig.2.4.
Figure 2.5 below shows the gas sensor connection to the arduino pins. The sensor
is connected to analog pin A0 of arduino, read the output in the form of voltage
from the sensor respectively. For stable operation of sensor the more heating of the
coil is required.
Figure 2.5. The gas sensor connection to arduino pin.

62
The coil of the sensor consumes more power.
To operate the senor 5 V is required.
The arduino gets powered through its jack available on board itself.
c) The output circuit connection of wireless gas sensing system
It consists of the following hardwares:
1. The connection of buzzer to the system
2. The exhaust fan connection and
3. The ZigBee connection.
The purpose of the above hardware is to alert, prevention of accidental attacks and
wireless communication among the motes. The alerting to the users is possible
only after the gas concentration beyond the towering concentration. The threshold
level limits with respect to sensor output voltage is shown below.
When the gas concentration is beyond 800 ppm, start buzzering to alert the
users that the neighboring areas have entered in hazardous situation and tragedy
emigration is needed. When the gas attention reaches between 400 ppm- 800 ppm
the fan will turn on to indicate the caution stage and it sucks out the gas outside
the leakage area as the precautionary measures against explosion attacks.
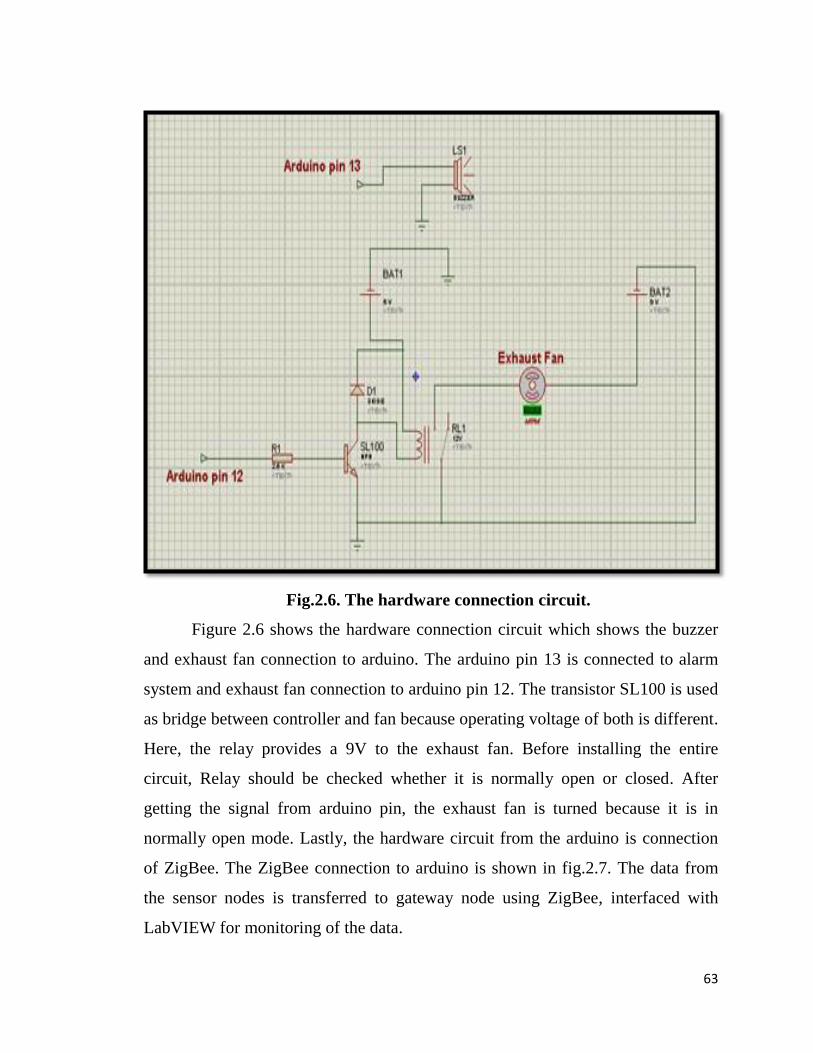
63
Fig.2.6. The hardware connection circuit.
Figure 2.6 shows the hardware connection circuit which shows the buzzer
and exhaust fan connection to arduino. The arduino pin 13 is connected to alarm
system and exhaust fan connection to arduino pin 12. The transistor SL100 is used
as bridge between controller and fan because operating voltage of both is different.
Here, the relay provides a 9V to the exhaust fan. Before installing the entire
circuit, Relay should be checked whether it is normally open or closed. After
getting the signal from arduino pin, the exhaust fan is turned because it is in
normally open mode. Lastly, the hardware circuit from the arduino is connection
of ZigBee. The ZigBee connection to arduino is shown in fig.2.7. The data from
the sensor nodes is transferred to gateway node using ZigBee, interfaced with
LabVIEW for monitoring of the data.
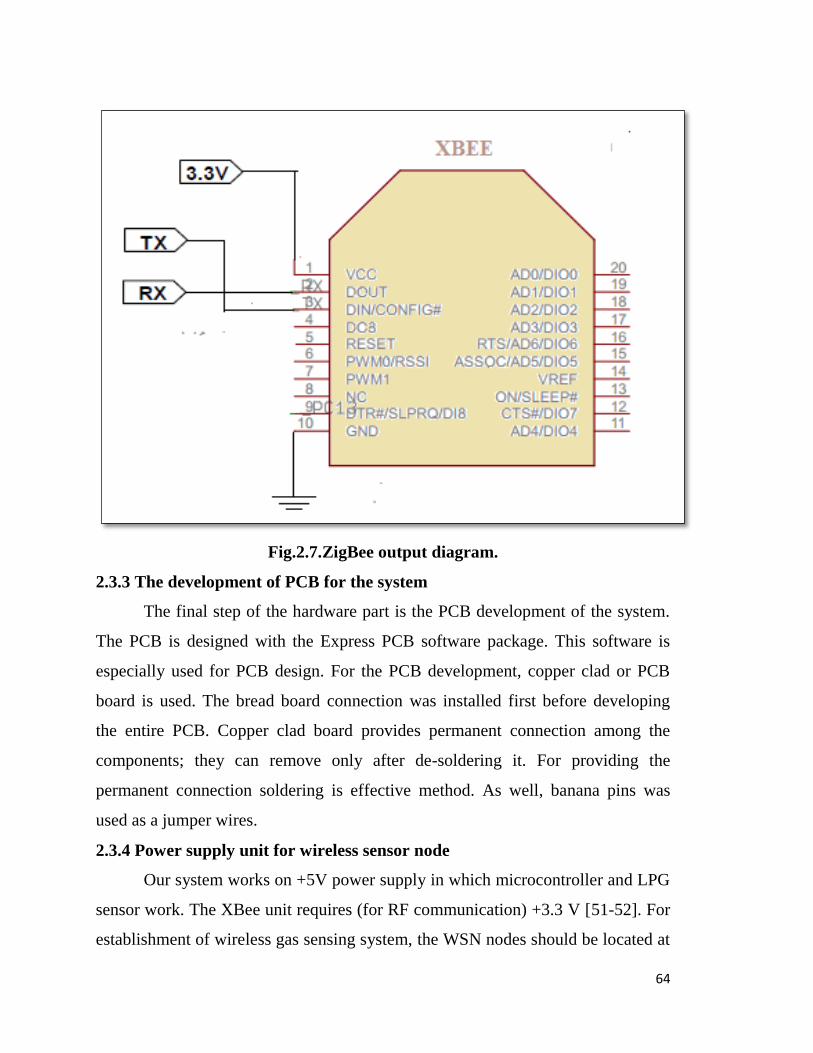
64
Fig.2.7.ZigBee output diagram.
2.3.3 The development of PCB for the system
The final step of the hardware part is the PCB development of the system.
The PCB is designed with the Express PCB software package. This software is
especially used for PCB design. For the PCB development, copper clad or PCB
board is used. The bread board connection was installed first before developing
the entire PCB. Copper clad board provides permanent connection among the
components; they can remove only after de-soldering it. For providing the
permanent connection soldering is effective method. As well, banana pins was
used as a jumper wires.
2.3.4 Power supply unit for wireless sensor node
Our system works on +5V power supply in which microcontroller and LPG
sensor work. The XBee unit requires (for RF communication) +3.3 V [51-52]. For
establishment of wireless gas sensing system, the WSN nodes should be located at
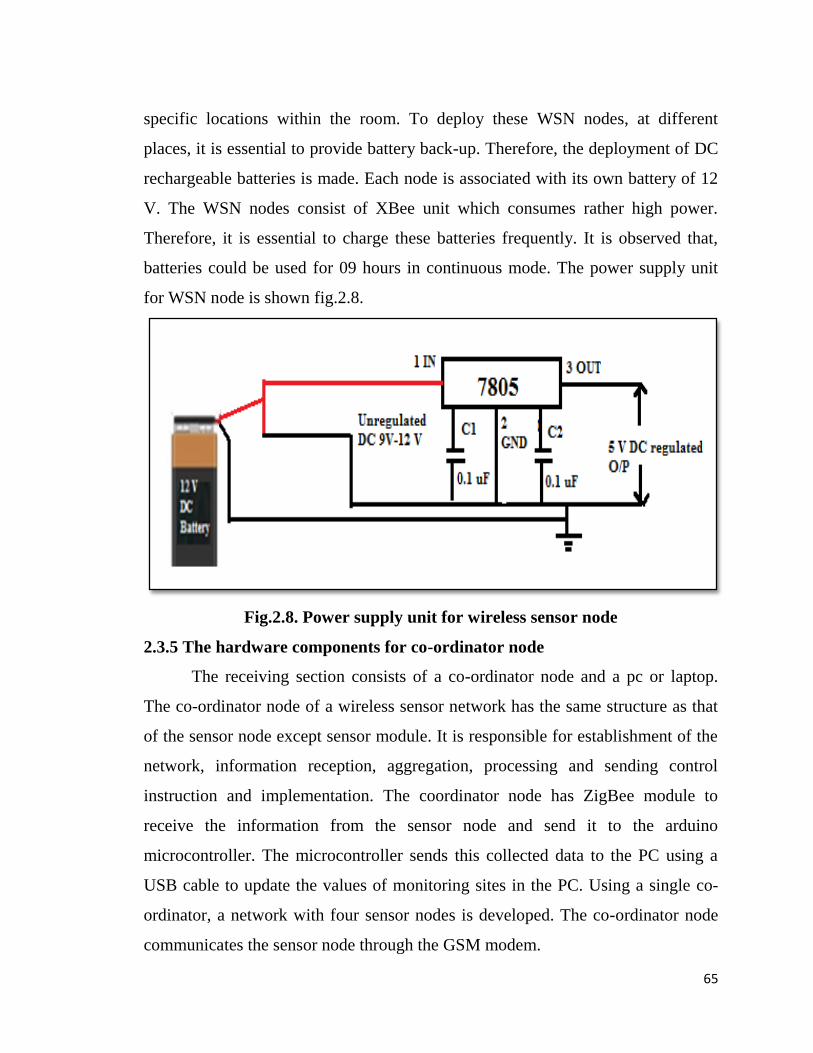
65
specific locations within the room. To deploy these WSN nodes, at different
places, it is essential to provide battery back-up. Therefore, the deployment of DC
rechargeable batteries is made. Each node is associated with its own battery of 12
V. The WSN nodes consist of XBee unit which consumes rather high power.
Therefore, it is essential to charge these batteries frequently. It is observed that,
batteries could be used for 09 hours in continuous mode. The power supply unit
for WSN node is shown fig.2.8.
Fig.2.8. Power supply unit for wireless sensor node
2.3.5 The hardware components for co-ordinator node
The receiving section consists of a co-ordinator node and a pc or laptop.
The co-ordinator node of a wireless sensor network has the same structure as that
of the sensor node except sensor module. It is responsible for establishment of the
network, information reception, aggregation, processing and sending control
instruction and implementation. The coordinator node has ZigBee module to
receive the information from the sensor node and send it to the arduino
microcontroller. The microcontroller sends this collected data to the PC using a
USB cable to update the values of monitoring sites in the PC. Using a single co-
ordinator, a network with four sensor nodes is developed. The co-ordinator node
communicates the sensor node through the GSM modem.
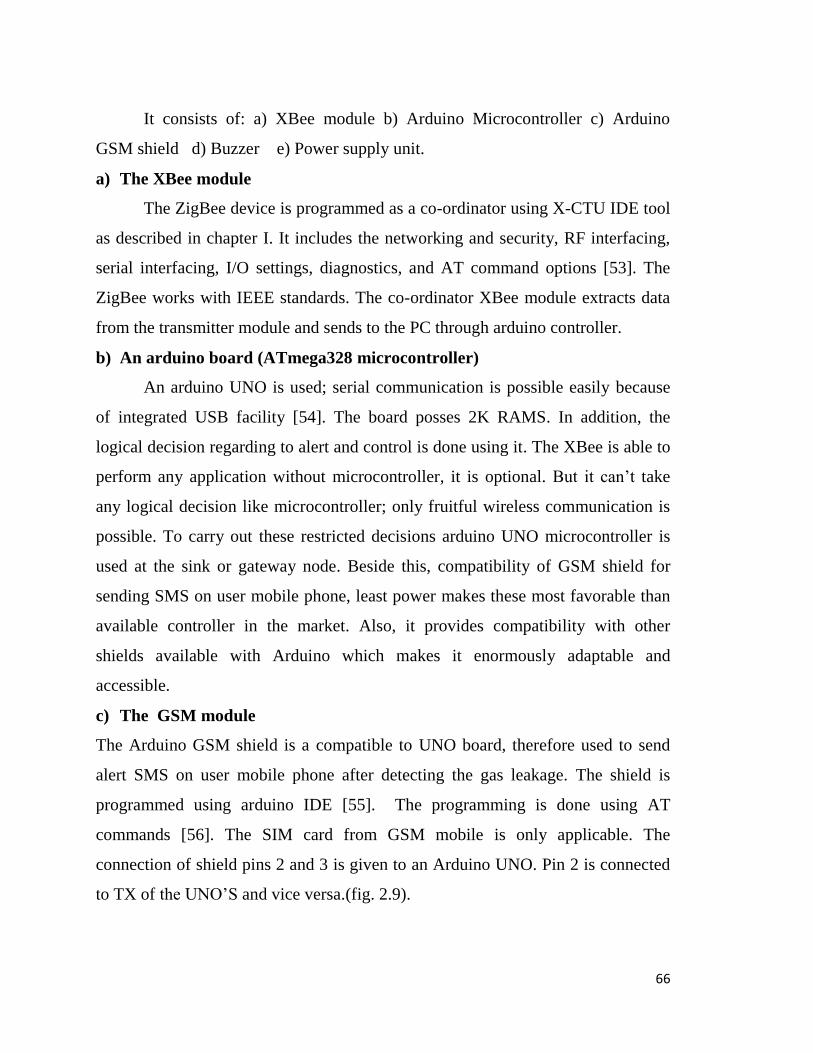
66
It consists of: a) XBee module b) Arduino Microcontroller c) Arduino
GSM shield d) Buzzer e) Power supply unit.
a) The XBee module
The ZigBee device is programmed as a co-ordinator using X-CTU IDE tool
as described in chapter I. It includes the networking and security, RF interfacing,
serial interfacing, I/O settings, diagnostics, and AT command options [53]. The
ZigBee works with IEEE standards. The co-ordinator XBee module extracts data
from the transmitter module and sends to the PC through arduino controller.
b) An arduino board (ATmega328 microcontroller)
An arduino UNO is used; serial communication is possible easily because
of integrated USB facility [54]. The board posses 2K RAMS. In addition, the
logical decision regarding to alert and control is done using it. The XBee is able to
perform any application without microcontroller, it is optional. But it can’t take
any logical decision like microcontroller; only fruitful wireless communication is
possible. To carry out these restricted decisions arduino UNO microcontroller is
used at the sink or gateway node. Beside this, compatibility of GSM shield for
sending SMS on user mobile phone, least power makes these most favorable than
available controller in the market. Also, it provides compatibility with other
shields available with Arduino which makes it enormously adaptable and
accessible.
c) The GSM module
The Arduino GSM shield is a compatible to UNO board, therefore used to send
alert SMS on user mobile phone after detecting the gas leakage. The shield is
programmed using arduino IDE [55]. The programming is done using AT
commands [56]. The SIM card from GSM mobile is only applicable. The
connection of shield pins 2 and 3 is given to an Arduino UNO. Pin 2 is connected
to TX of the UNO’S and vice versa.(fig. 2.9).
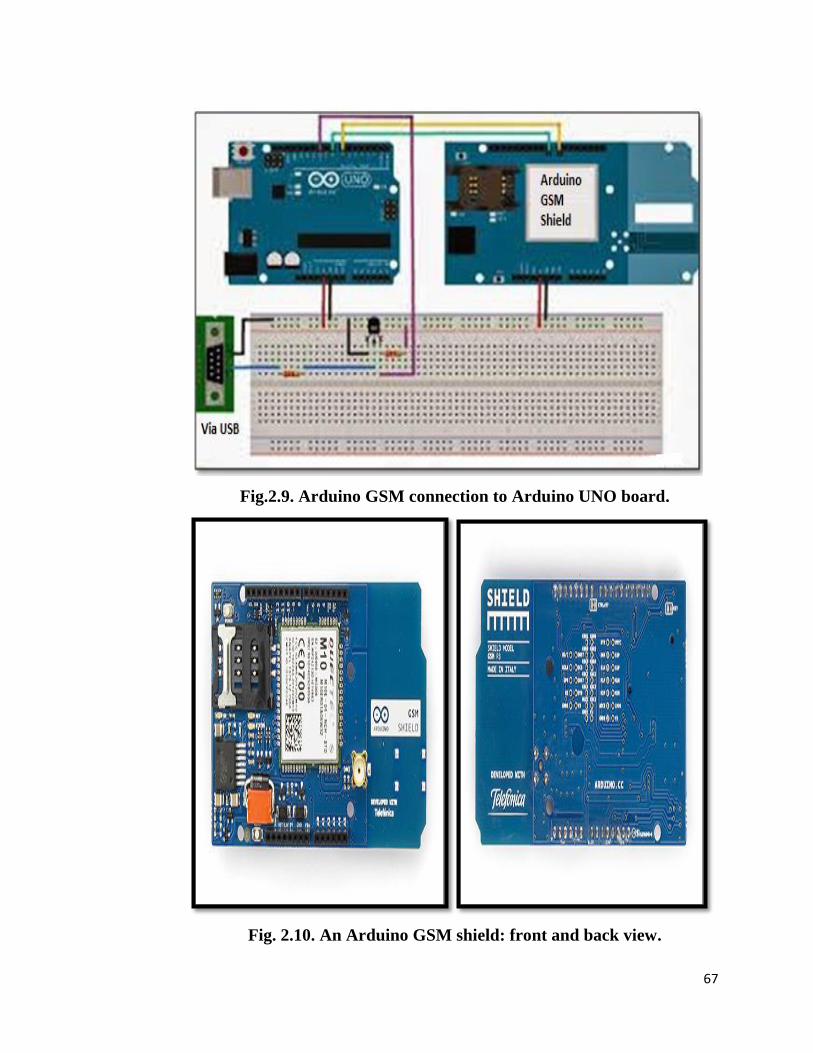
67
Fig.2.9. Arduino GSM connection to Arduino UNO board.
Fig. 2.10. An Arduino GSM shield: front and back view.
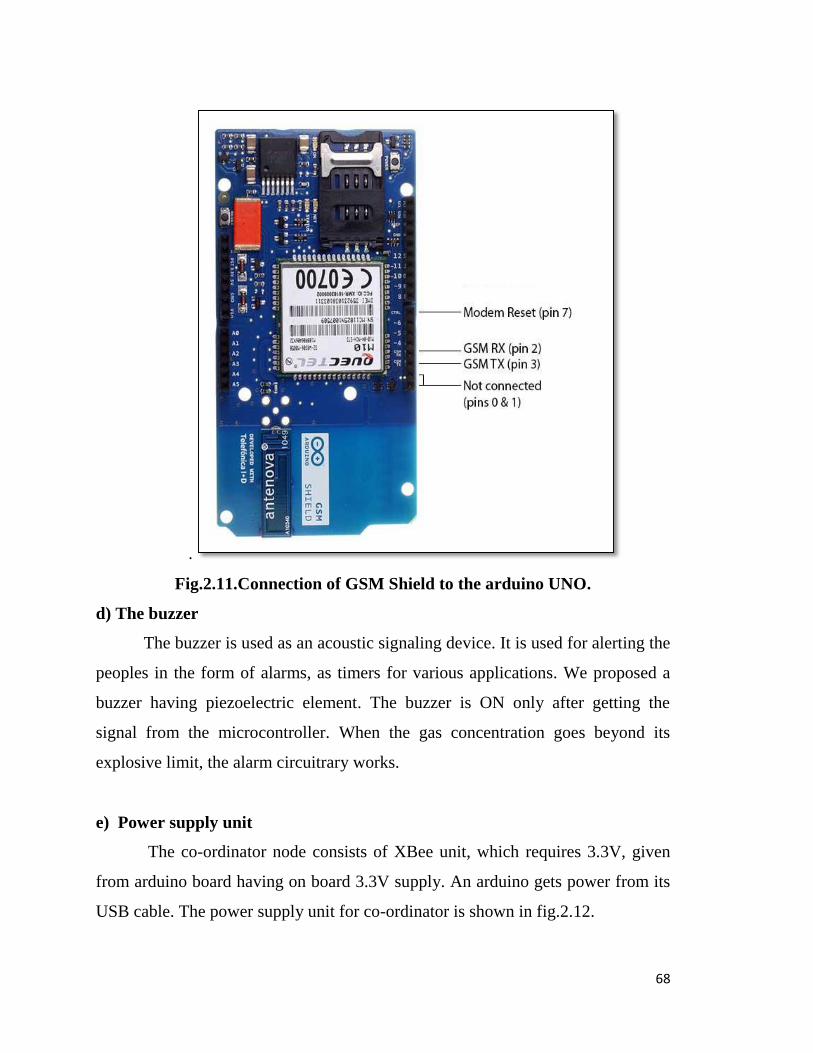
68
.
Fig.2.11.Connection of GSM Shield to the arduino UNO.
d) The buzzer
The buzzer is used as an acoustic signaling device. It is used for alerting the
peoples in the form of alarms, as timers for various applications. We proposed a
buzzer having piezoelectric element. The buzzer is ON only after getting the
signal from the microcontroller. When the gas concentration goes beyond its
explosive limit, the alarm circuitrary works.
e) Power supply unit
The co-ordinator node consists of XBee unit, which requires 3.3V, given
from arduino board having on board 3.3V supply. An arduino gets power from its
USB cable. The power supply unit for co-ordinator is shown in fig.2.12.
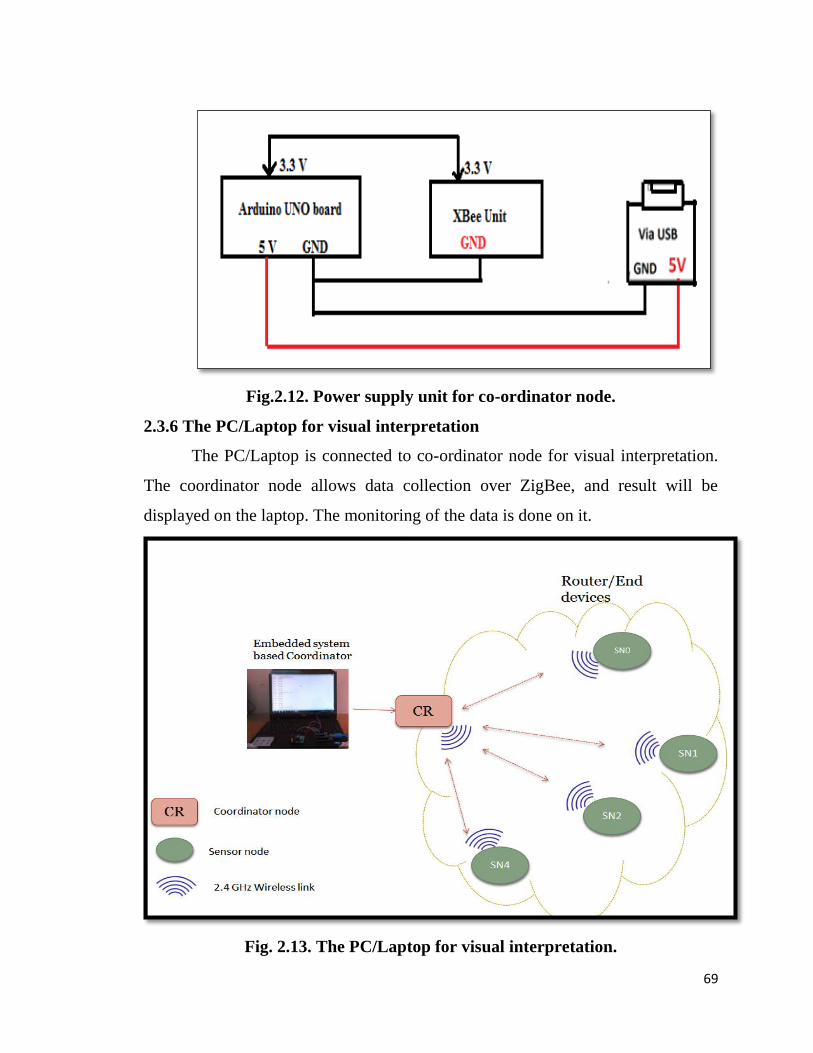
69
Fig.2.12. Power supply unit for co-ordinator node.
2.3.6 The PC/Laptop for visual interpretation
The PC/Laptop is connected to co-ordinator node for visual interpretation.
The coordinator node allows data collection over ZigBee, and result will be
displayed on the laptop. The monitoring of the data is done on it.
Fig. 2.13. The PC/Laptop for visual interpretation.
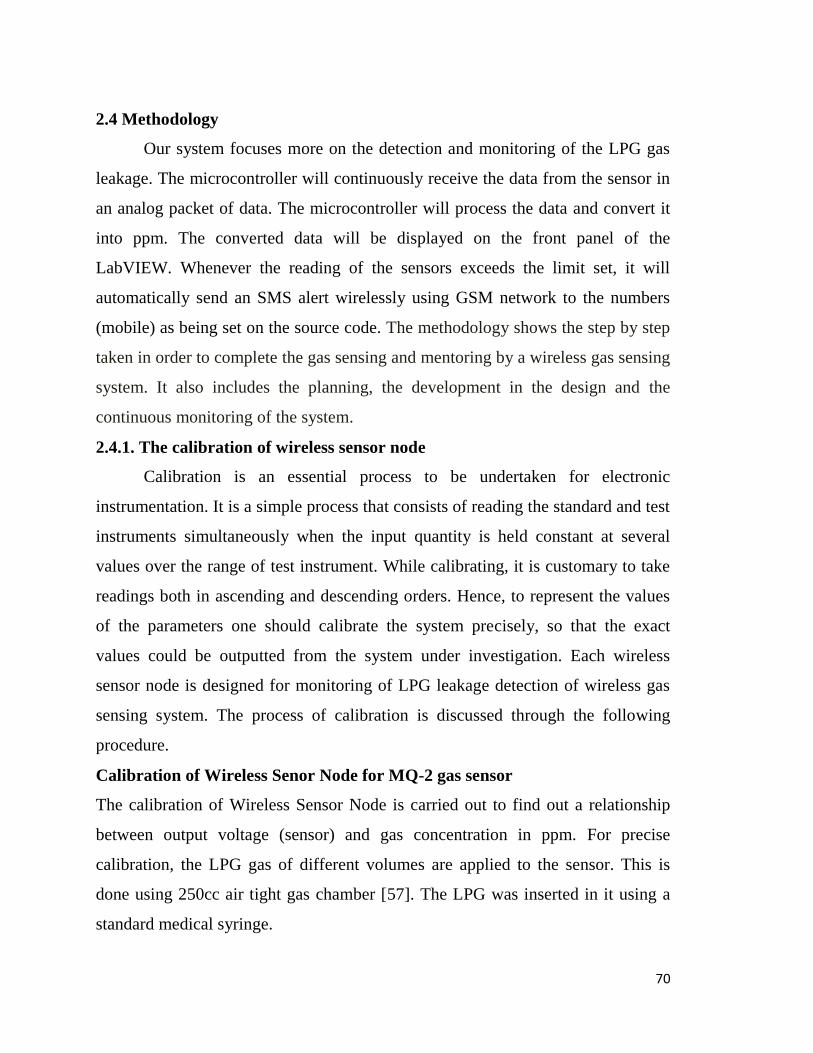
70
2.4 Methodology
Our system focuses more on the detection and monitoring of the LPG gas
leakage. The microcontroller will continuously receive the data from the sensor in
an analog packet of data. The microcontroller will process the data and convert it
into ppm. The converted data will be displayed on the front panel of the
LabVIEW. Whenever the reading of the sensors exceeds the limit set, it will
automatically send an SMS alert wirelessly using GSM network to the numbers
(mobile) as being set on the source code. The methodology shows the step by step
taken in order to complete the gas sensing and mentoring by a wireless gas sensing
system. It also includes the planning, the development in the design and the
continuous monitoring of the system.
2.4.1. The calibration of wireless sensor node
Calibration is an essential process to be undertaken for electronic
instrumentation. It is a simple process that consists of reading the standard and test
instruments simultaneously when the input quantity is held constant at several
values over the range of test instrument. While calibrating, it is customary to take
readings both in ascending and descending orders. Hence, to represent the values
of the parameters one should calibrate the system precisely, so that the exact
values could be outputted from the system under investigation. Each wireless
sensor node is designed for monitoring of LPG leakage detection of wireless gas
sensing system. The process of calibration is discussed through the following
procedure.
Calibration of Wireless Senor Node for MQ-2 gas sensor
The calibration of Wireless Sensor Node is carried out to find out a relationship
between output voltage (sensor) and gas concentration in ppm. For precise
calibration, the LPG gas of different volumes are applied to the sensor. This is
done using 250cc air tight gas chamber [57]. The LPG was inserted in it using a
standard medical syringe.
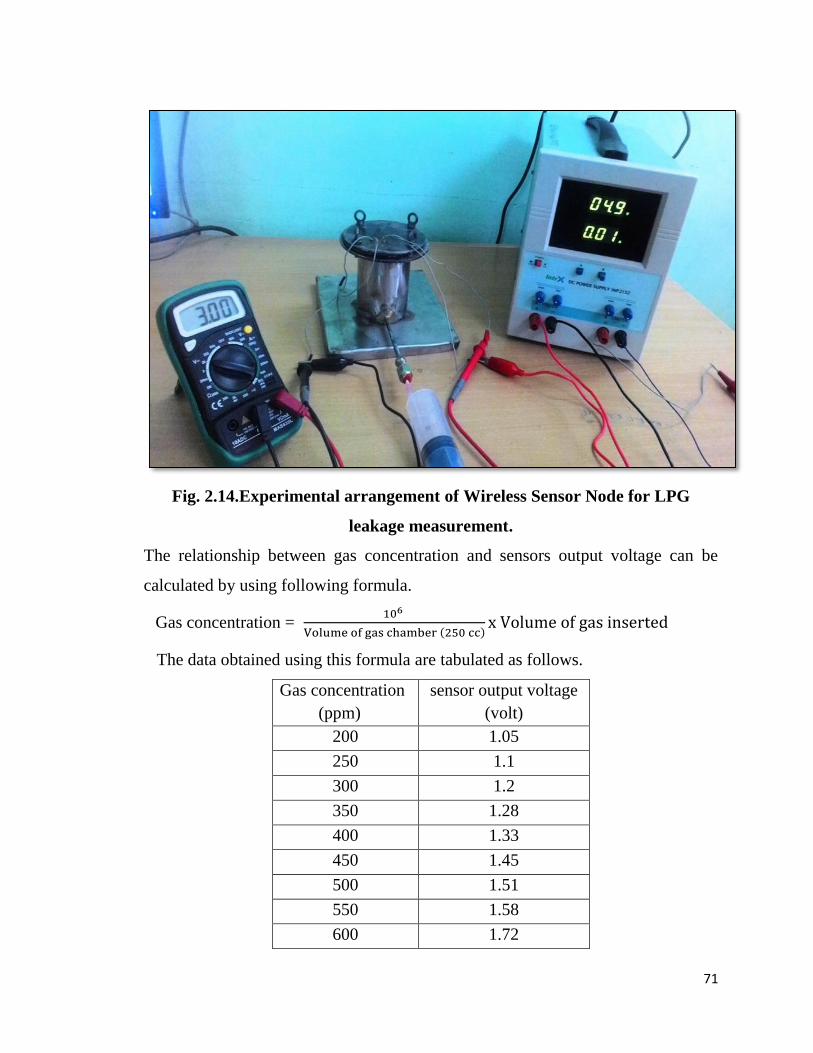
71
Fig. 2.14.Experimental arrangement of Wireless Sensor Node for LPG
leakage measurement.
The relationship between gas concentration and sensors output voltage can be
calculated by using following formula.
Gas concentration = 106
Volume of gas chamber (250 cc)x Volume of gas inserted
The data obtained using this formula are tabulated as follows.
Gas concentration
(ppm)
sensor output voltage
(volt)
200 1.05
250 1.1
300 1.2
350 1.28
400 1.33
450 1.45
500 1.51
550 1.58
600 1.72
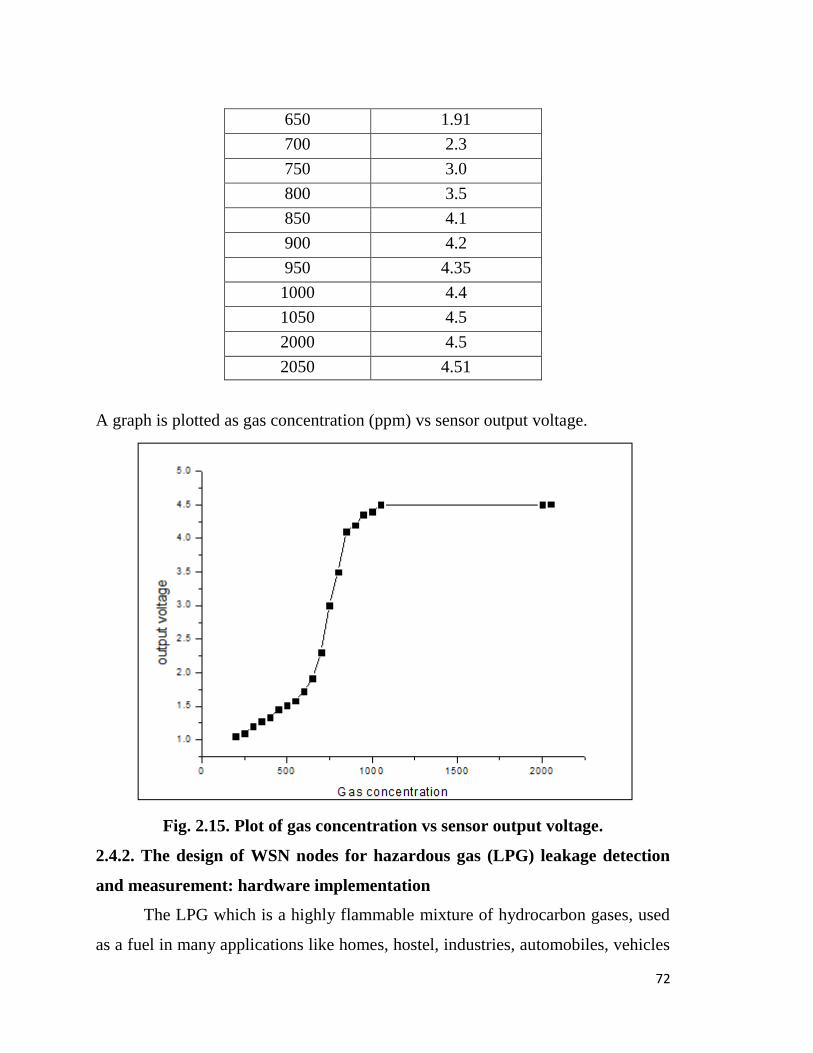
72
650 1.91
700 2.3
750 3.0
800 3.5
850 4.1
900 4.2
950 4.35
1000 4.4
1050 4.5
2000 4.5
2050 4.51
A graph is plotted as gas concentration (ppm) vs sensor output voltage.
Fig. 2.15. Plot of gas concentration vs sensor output voltage.
2.4.2. The design of WSN nodes for hazardous gas (LPG) leakage detection
and measurement: hardware implementation
The LPG which is a highly flammable mixture of hydrocarbon gases, used
as a fuel in many applications like homes, hostel, industries, automobiles, vehicles
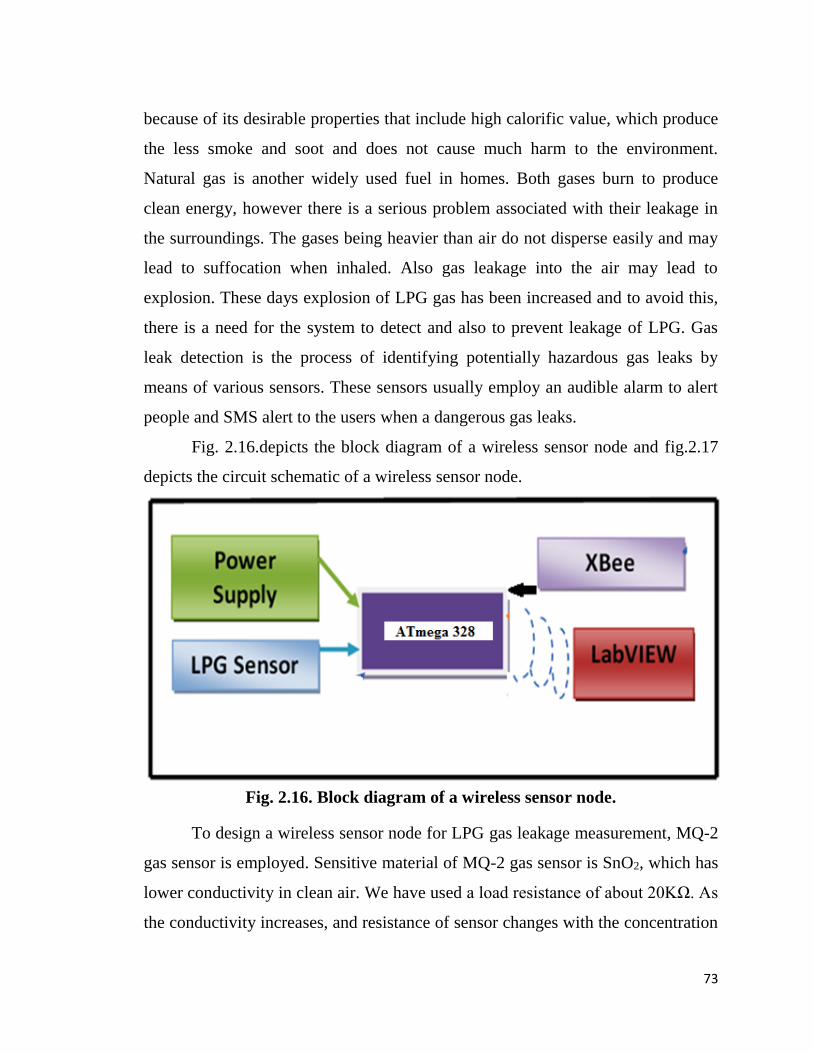
73
because of its desirable properties that include high calorific value, which produce
the less smoke and soot and does not cause much harm to the environment.
Natural gas is another widely used fuel in homes. Both gases burn to produce
clean energy, however there is a serious problem associated with their leakage in
the surroundings. The gases being heavier than air do not disperse easily and may
lead to suffocation when inhaled. Also gas leakage into the air may lead to
explosion. These days explosion of LPG gas has been increased and to avoid this,
there is a need for the system to detect and also to prevent leakage of LPG. Gas
leak detection is the process of identifying potentially hazardous gas leaks by
means of various sensors. These sensors usually employ an audible alarm to alert
people and SMS alert to the users when a dangerous gas leaks.
Fig. 2.16.depicts the block diagram of a wireless sensor node and fig.2.17
depicts the circuit schematic of a wireless sensor node.
Fig. 2.16. Block diagram of a wireless sensor node.
To design a wireless sensor node for LPG gas leakage measurement, MQ-2
gas sensor is employed. Sensitive material of MQ-2 gas sensor is SnO2, which has
lower conductivity in clean air. We have used a load resistance of about 20KΩ. As
the conductivity increases, and resistance of sensor changes with the concentration

74
of combustible gases, a simple electronic circuit can be used to convert the change
in resistance to change in concentration of the combustible gases. The sensor
works with a 5 volt power supply.
Fig.2.17.The circuit schematic of a wireless sensor node.
The typical characteristics of a MQ-2 sensor are as follows:
Model No. MQ-2
Sensor Type Semiconductor
Detection Gas LPG
Concentration
range
200-5000 ppm
Load Resistance 20 KΩ(5 KΩ -47 KΩ )
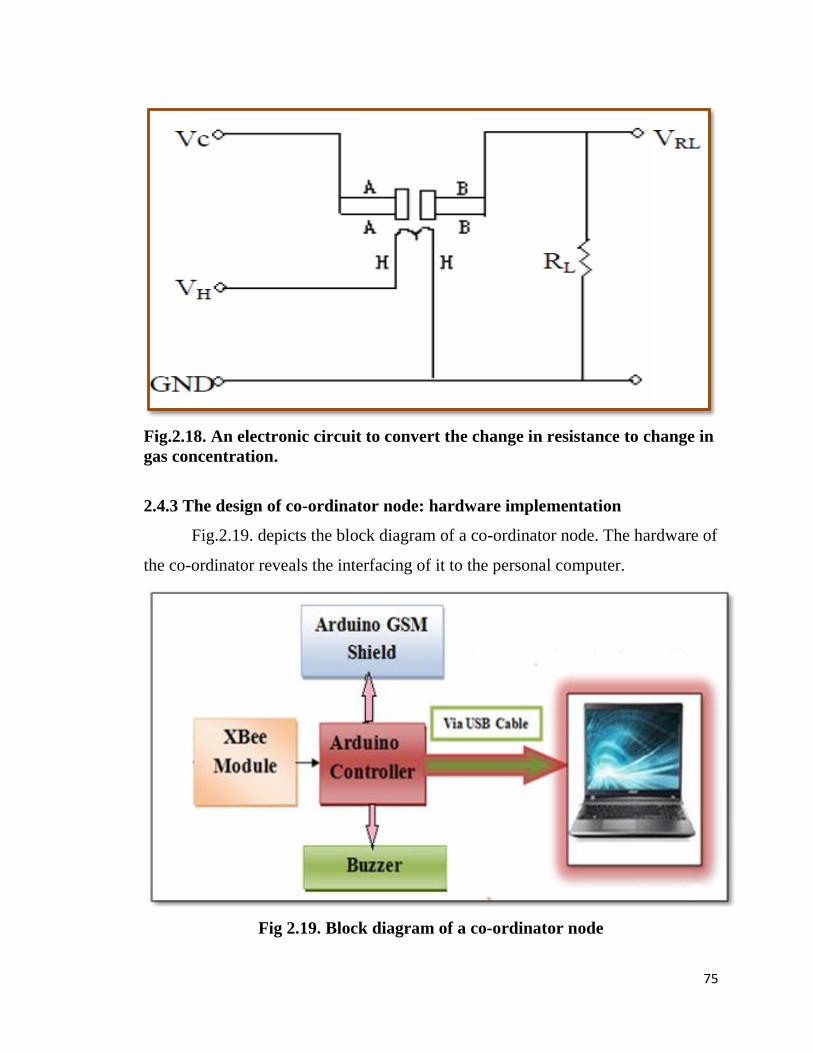
75
Fig.2.18. An electronic circuit to convert the change in resistance to change in
gas concentration.
2.4.3 The design of co-ordinator node: hardware implementation
Fig.2.19. depicts the block diagram of a co-ordinator node. The hardware of
the co-ordinator reveals the interfacing of it to the personal computer.
Fig 2.19. Block diagram of a co-ordinator node
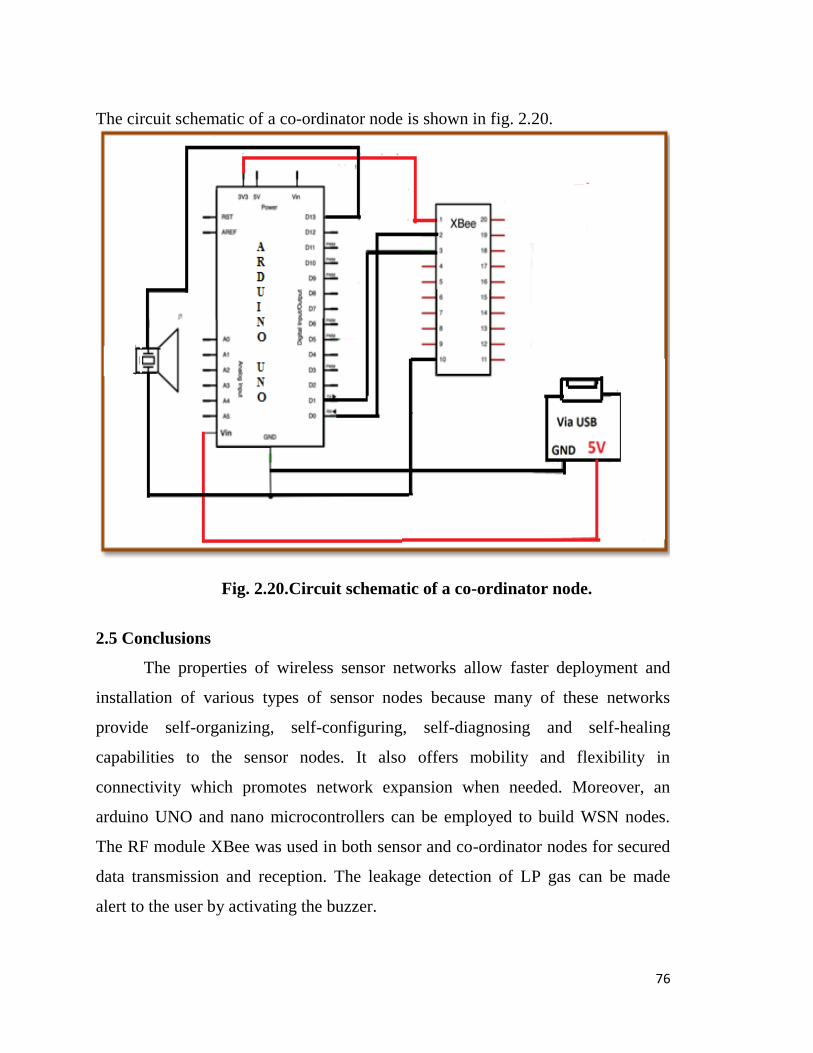
76
The circuit schematic of a co-ordinator node is shown in fig. 2.20.
Fig. 2.20.Circuit schematic of a co-ordinator node.
2.5 Conclusions
The properties of wireless sensor networks allow faster deployment and
installation of various types of sensor nodes because many of these networks
provide self-organizing, self-configuring, self-diagnosing and self-healing
capabilities to the sensor nodes. It also offers mobility and flexibility in
connectivity which promotes network expansion when needed. Moreover, an
arduino UNO and nano microcontrollers can be employed to build WSN nodes.
The RF module XBee was used in both sensor and co-ordinator nodes for secured
data transmission and reception. The leakage detection of LP gas can be made
alert to the user by activating the buzzer.
77
References
1. L. Friwan, K. Lweesy, A. B. Salma, N. Mani, “A Wireless Home Safety Gas
Leakage Detection System”, 1st Middle East conference on (MECBME- 2011),
Feb. 21-24, pp.11-14.
2. http:/www.ti.com/lit/ml/sszy008/sszy008.pdf.
3. http:/ www.cse.msu.edu/glxing/docs/icdcs-aim.pdf.
4. D. Chapman, “Water Quality Assesments - A Guide to use of Biota, Sediments
and water in Environment Monitoring, (UNESCO), World Health Organization
United Nations Environment Programme, (1992).
5. V. Ramya, B. Palaniappan, “Embedded system for Hazardous Gas detection
and Alerting”, International Journal of Distributed and Parallel Systems
(IJDPS), 3(2012) 287-300.
6. A. Somov, A. Baranov, A. Savkin, D. Spirjakin, A. Spirjakin, R. Passerone,
“Development of Wireless Sensor Network for Combustible Gas Monitoring”,
Sensors and Actuators A: Physical 171(2011) 398–405.
7. Z. Shao-jie, W. Hai-tao, L. Zhi-feng, “Ad Hoc network technology” [M],
Beijing: Post & Telecom Press, 2005.
8. S. Li-min, L.I. Jian-zhong, C.Yu, “Wireless sensor networks”, [M],
Beijing:Tsinghua University Press, 2005, pp. 14-16.
9. M. Z.chang, S. Y. ning, MEI Tao, “Survey on wireless sensors network [J],
Journal of China Institute of Communications 25 (2004) 114-124.
10. A.J. Goldsmith and S.B. Wicker, “Design challenges for energy-constrained ad
hoc wireless networks”, IEEE Wireless Commun., 9 (2002) 1-22.
11. Z. Xiaoqiang, Z. Zuhou, “Development of Remote Waste Gas Monitor
System” International Conference on (ICMTMA-2010), March 13-14, pp.
1105–1108.
78
12. S. Nakano, K. Yokosawa, Y. Goto, K.Tsukada, “Hydrogen Gas Detection
System Prototype with Wireless Sensor Networks”, 4th Conference on Sensors,
USA, (2005), Oct 30 – Nov.30, pp. 159–162
13. X. Haibo, Z. Laibin, “Development Actualities of Pipeline Leak-detection
Technologies at Home and Abroad”, Oil& Gas Storage and Transportation, 20
(2001) 1-5.
14. B. B. Li and Z. F. Yuan, “Research on Banknote Printing Wastewater
Monitoring System Based on Wireless Sensor Network”, Journal of Physics:
Conference Series 48(2006) 1190-1194.
15. Characteristics, Design& Detectors, M., Technical Information on Usage of
TGS Sensors for LPG, 1-12.
16. M. F. Jan, Q. Habib and M. Irfan, “Carbon Monoxide Detection and
Autonomous Countermeasure System for a Steel Mill using Wireless Sensor
and Actuator Network”, 6 ( 2010) 405-409,
17. L.Wang and Q. Xu, “GPS-Free Localization for Wireless Sensor Network”,
Sensors, 10(2010) 5899-5926.
18. T. Panda, N. K. Kamila and R.R. Patra, “Energy Efficient Anchor- Based
Localization Algorithm for Wireless Sensor Network”, Journal of Computer
Engineering13 (2012) 13-20.
19. V. Yadav, M. K. Mishra, A. K. Singh and M. M. Gore, “Localization Scheme
for Three Dimensional Wireless Sensor Network using GPS Enabled Mobile
Sensor Nodes”, International Journal of Next-Generation Networks, 11(2009)
60-72.
20. http:/ www.cs.viginia.edu/ stankovic/ psfiles/wisec 095q-mi-/.pdf.
21. http:/www.math.uszeged.hu/mmaroti/pdf/2012/Wireless Sensor Node.pdf.
22. L. Lakshman and D. C. Tomar, “Location Dependent Rb Multicast Routing in
Wireless Sensor Network using GPS Based System”, Indian Streams Research
Journal, 41 (2014).

79
23. H. Fu, T. Wang, C. Yang, "Gas monitoring system based on the multi-sensor
information fusion," 9th International Conference on(ICEMI-2009). Aug 16-19,
pp.2.930-2.933
24. A. Kumar, I.P Singh, S.K. Sud, “Indoor environment gas monitoring system
based on the digital signal processor",9th International Conference on
(ICMSPCT-2009), March 14-16, pp.245-249,
25. X. Qian and X. Wang, "Design of Temperature Humidity and Toxic Gas
Monitoring System of Underground Garage", (ISA 2009), May23-24, pp.1-3,
26. D. Bhattacharjee, S. Kumar, A. Kumar, S. Choudhary, “Design and
Development of Wireless Sensor Node”, (IJCSE) International Journal on
Computer Science and Engineering, 02 (2010) 2431-2438.
27. T. Conrad, P. Reimann, A. Schutze, “A hierarchical strategy for under- ground
early fire detection based on a T-cycled semiconductor gas sensor”, IEEE
Sensors Conference, Oct 29-31, 2007.
28. Z. Xiaoqiang, Z. Zuhou, “Development of Remote Waste Gas Monitor
System”, International Conference on (MTMA-2010), pp. 1105–1108
29. S.Nakano, K.Yokosawa, Y.Goto, K. Tsukada, “Hydrogen Gas Detection
System Prototype with Wireless Sensor Networks”, 4th Conference on Sensors,
(2005), pp. 159–162.
30. D. Chengjun, L. Ximao, D.Ping, “Development on Gas Leak Detection and
Location System Based on Wireless Sensor Networks”, 3rd International
Conference on (ICMTMA, 2011), Jan 6-7, pp. 1067-1070.
31. A. Somov, D. Spirjakin, M. Ivanov, I. Khromushin, R. Passerone, A.Baranov,
A. Savkin, “Combustible Gases and Early Fire Detection: an Autonomous
System for Wireless Sensor Networks”, 1st International Conference on
(EECN-2010), pp. 85–93.
32. I. Stoianov, L. Nachman, S. Madden, T. Tokmouline, M. Csail, “A Wireless
Sensor Network for Pipeline Monitoring”, 6th International Symposium on
80
(IPSN-2007), pp. 264 – 273.
33. D. Bhattacharjee “Design and Development of Wireless Sensor Node” (IJCSE)
International Journal on Computer Science and Engineering, 02(2010) 2431-
2438.
34. V. Ramya, B. Palaniappan and A. Kumari, “Embedded Patient Monitoring
System”, International Journal of Embedded System and Application, 12
(2011) 51-63.
35. S. E. Jero, A. B. Ganesh, “PIC18LF4620 Based Customizable Wireless Sensor
Node to Detect Hazardous Gas Pipeline Leakage”, Proceedings of (ICETECT -
2011), 563-566.
36. D. Bhattacharjee, P. Bhatnagar, S. choudhury, “Design and Development of a
Flexible Reliable Smart Gas Detection System”, International Journal of
Computer Applications, 31 (2011) 1-8.
37. R. Singh, S. Mishra and A. Joshi, “Wireless personal area network node design
and simulation of alcohol sensor using ZigBee transceiver module”,
International Journal of Engineering Research and Applications (IJERA), 2
(2012) 133-138.
38. L. Chen, S. Yang, Y. Xi, "Based on ZigBee wireless sensor network the
monitoring system design for chemical production process toxic and harmful
gas", International Conference on (CMCE- 2010), vol.4, Aug 24-26, pp.425-
428.
39. Y. W. Zhu, X. X. Zhong and J. F. Shi, “The Design of Wireless Sensor
Network System Based on ZigBee Technology for Greenhouse”, Journal of
Physics, Conference Series 48(2006) 1195–1199.
40. G.A. Kumar, K. Rajasekhar, “Gas Leakage Detection and Location Finding
System Using ARM7 and ZigBee”, International Journal of Engineering
Research & Technology (IJERT), 1 (2012) 1-4.
81
41. B. WeiNing, H.S. Yin, X.R. Liu, “Design of Gas Monitoring System of Coal
Mine Based on Wireless Sensor Networks”, Industry and Mine
automation,1(2010) 70-72.
42. A. Somov, A. Baranov, A. Savkin, M. Ivanov, L.Calliari, R.Passerone, Е.
Karpov, and А. Suchkov, “Energy-Aware Gas Sensing Using Wireless Sensor
Networks”, EWSN 2012, LNCS 7158, 2012, pp. 245–260.
43. Z. Yu-jie, J. long and W. Rui, “Design of Equipment Room Environment
Monitoring System Based on LPC2378”, Journal of Jingnan University, 3
(2009) 1-7.
44. C. Otto, A. Milenkovic, C. Sanders and E. Jovanov, “System Architecture of a
Wireless Body Area Sensor Network For Ubiquitous Health Monitoring”,
Journal of Mobile Multimedia, 14 (2006) 307-326.
45. A. Milenkovic, C. Otto and E. Jovanov, “Wireless Sensor Networks for
Personal Health Monitoring: Issues and Implementation”, Computer
Communications, 29 (2006) 2521-2533.
46. K. sagar. M. Dange, R. Patil, “Design of Monitoring System for Coal Mine
Safety Based on MSP430”, International Journal of Engineering Science
Invention, 7 (2013) 14-19.
47. H. Daingade, S. Shinde, V. Patil, M. Kumbhar, “MSP430 based mine
monitoring and control using wireless sensor network” IRIJET, 2(2015) 259-
262.
48. https://www.arduino.cc/en/uploads/Main/ArduinoNanoManual23.pdf
49. M. E. Nelson Æ M. A. MacIver, “Sensory acquisition in active sensing
systems”, J Comp Physiol A, 192 (2006) 573–586.
50. Datasheet MQ-2 (Hanwei) Semiconductor Sensor for LPG, 2-4.
51. C. Sasikumar, D. Manivannan, “Gas Leakage Detection and Monitoring
Based on Low Power Microcontroller and XBee” International Journal of
Engineering and Technology (IJET), 5(2013) 58-62.
82
52. I. Hwang, D. Lee, J. Baek, “Home Network Configuring Scheme for All
Electric Appliances Using ZigBee-based Integrated Remote Controller”,IEEE
Transactions on Consumer Electronics, 55 (2009)1300-1307.
53. XBee/XBee-Pro OEM RF Modules, Maxstream, Inc., Lindon, UT, 2007.
54. Margolis, Michael, Arduino Cookbook, Ed. 1, O’REILLY® Media, Inc.,
March 2011, pp. 81-213.
55. Using AT commands to control TCP/IP stack on SM5100 module, 2008.
56. T.H. Mujawar, V.D. Bachuwar, A. D. Shaligram, L.P. Deshmukh “Wireless
sensor network system: gas leakage detection and monitoring”, International
Journal of Current Research, 7 (2015)18445-18450.
57. T.H. Mujawar, V.D. Bachuwar, M.S.Kasbe, A. D. Shaligram, L.P. Deshmukh
“Development of wireless sensor network system for LPG gas leakage
detection system”, International Journal of Scientific & Engineering Research,
6(2015) 558-563.
83
CHAPTER III
TECHNOLOGICAL PLATFORMS AND
DEVELOPMENT TOOLS
3.1 Introduction 85
3.2 The Programming Tools 85
3.2.1 An arduino integrated development environment(IDE) 86
a) Downloading the software 86
b) Using the arduino IDE 87
3.2.2 The LabVIEW 88
a) G –code 88
b) Hardware compatibility with LabVIEW 89
c) The tools in LabVIEW 89
d) Technology concepts in LabVIEW 89
e) Mathematical functions 89
3.3 The X-CTU Software 90
3.3.1 Programming with the ZigBee for wireless gas sensing
system
90
3.3.2 AT communication modes 96
a) Transparent mode 96
b) Command mode
96
3.3.3 API communication mode 96
3.4 Flowchart for Wireless Gas Sensing System 97
3.5 Software Implementation 97
3.5.1 Gas concentration calculation 99
3.5.2 Arduino programming 100
a) For gas sensor 100
b) For arduino GSM shield 104
84
3.5.3 The programming for wireless access 109
3.5.4 Star topology implementation 112
3.6 Alert System 113
a) SMS on user mobile phone 114
b) Buzzer 114
3.7 Main Program 115
References 121
85
CHAPTER III
TECHNOLOGICAL PLATFORMS AND DEVELOPMENT TOOLS
3.1 Introduction
The technology of Wireless Sensor Networks (WSNs) is in the front part of
the investigation of the computer networks and it could be the next technological
market of a huge sum of money [1]. Sensor nodes have limited processing power,
storage, bandwidth and energy. This limitation makes provision of the security in
sensor networks, not an easy task [1]. The availability of cheap, low power and
miniatured embedded processors, radios, sensors and actuators, often integrated on
a single chip, are leading to the use of wireless communication and computing for
interacting with the physical world in applications such as wireless gas sensing
system. As sensor nodes as well as co-ordinator reveal the embedded philosophy,
both hardware and software should be co-designed. To perform this pre-defined
task, microcontroller has to play with the real world. For this purpose, embedded
software is required. The present WSN sensor nodes are designed using an arduino
microcontroller and hence software required for the present system is designed in
python environment using an Arduino IDE, ZAP 2.0.5.
As the sensor nodes are embedded systems, they should work stand alone.
For this purpose one has to employ a proper operating system. To furnish the
needs of an operating system, the present system makes the use of super loop [2-
4]. To develop the firmware, the development tool must consists of tools such as
compiler, an assembler, editor, debugger, simulator, emulators, etc [5-8].The
present system uses XBee for wireless communication; therefore, the firmware
should cover the function of wireless communication. The co-ordinator node is
interfaced to the laptop and develops an effective GUI for it using LabVIEW tool.
The chapter deals with software development of a wireless gas sensing system.
3.2 The Programming Tools
The LabVIEW and an Arduino IDE are the programming tools used for this
86
system. But, the writing programming is mostly used in arduino. Meanwhile,
LabVIEW uses a programming type of block diagram.
3.2.1. An arduino integrated development environment
An integrated development environment (IDE) is a software application
that provides comprehensive facilities to computer programmers for software
development. An IDE normally consists of a source code editor, build automation
tools and a debugger. Arduino is an open-source prototype platform based on
easy-to-use hardware and software. Arduino boards are able to read inputs - light
on a sensor, a finger on a button, or a Twitter message - and turn it into an output -
activating a motor, turning on a LED, publishing something online. All this is
defined by a set of instructions programmed through the Arduino software (IDE).
The software of Arduino platform is the Arduino Integrated Development
Environment (IDE). The first step in the IDE checks whether the C or C++ code is
correct. After checking whether the code is correct, the IDE passes the code to a
compiler (avr-gcc) to change it from human readable to machine readable
instructions. Then, the code is combined with the Arduino libraries code, which
provides a basic function. The result of this process is a single hex file. This file
contains the specific bytes and it is ready to write to the program memory on the
Arduino board, which is transmitted to the Arduino over a USB port or serial
connection.
a) Downloading the software
The Arduino is programmed using an open source application that runs on
your computer. This is known as the IDE (integrated development environment)
and can download it for free directly from the Arduino website’s software area.
The Arduino development environment contains a text editor for writing code, a
message area, a text console, a toolbar with buttons for common functions, and a
series of menus. It connects the Arduino hardware to upload programs and
communicate with them. This software comes with the Arduino or can be
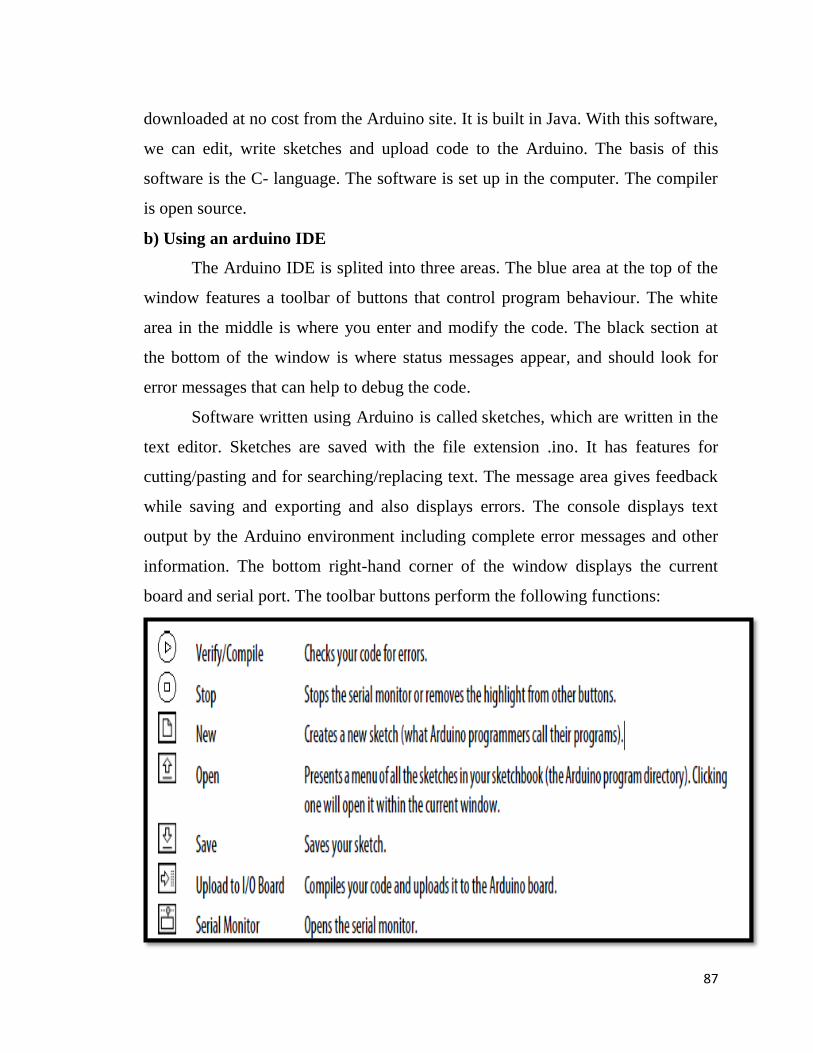
87
downloaded at no cost from the Arduino site. It is built in Java. With this software,
we can edit, write sketches and upload code to the Arduino. The basis of this
software is the C- language. The software is set up in the computer. The compiler
is open source.
b) Using an arduino IDE
The Arduino IDE is splited into three areas. The blue area at the top of the
window features a toolbar of buttons that control program behaviour. The white
area in the middle is where you enter and modify the code. The black section at
the bottom of the window is where status messages appear, and should look for
error messages that can help to debug the code.
Software written using Arduino is called sketches, which are written in the
text editor. Sketches are saved with the file extension .ino. It has features for
cutting/pasting and for searching/replacing text. The message area gives feedback
while saving and exporting and also displays errors. The console displays text
output by the Arduino environment including complete error messages and other
information. The bottom right-hand corner of the window displays the current
board and serial port. The toolbar buttons perform the following functions:
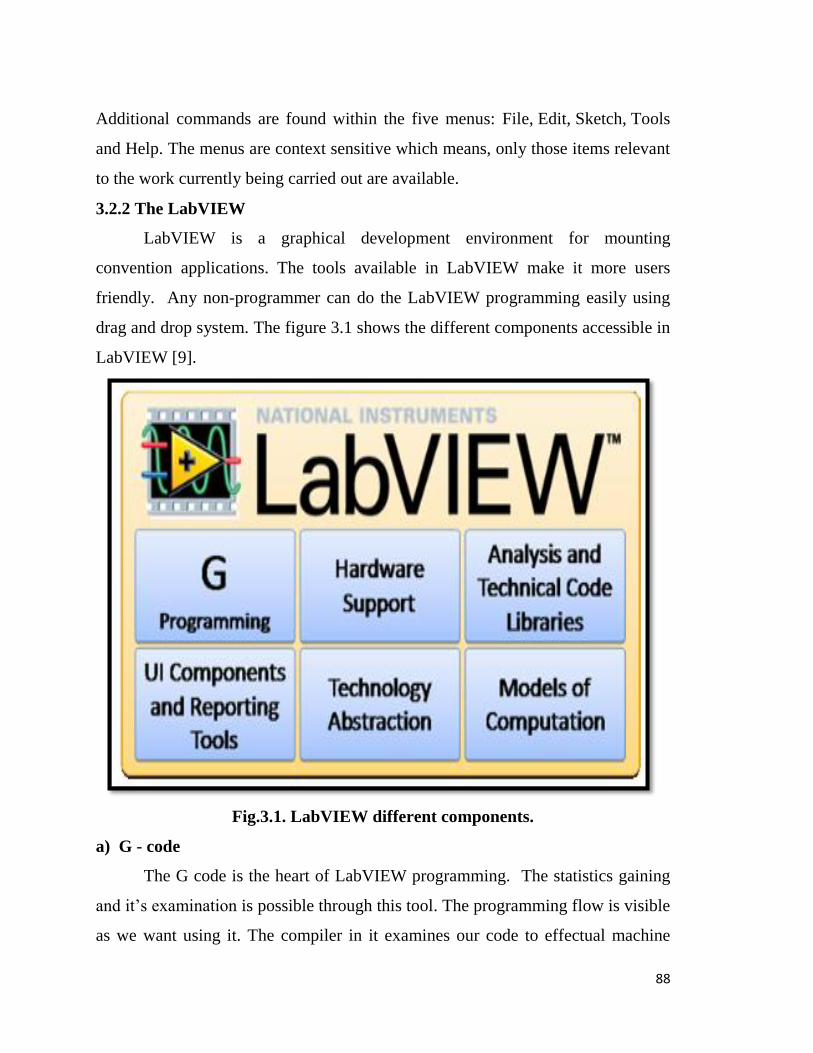
88
Additional commands are found within the five menus: File, Edit, Sketch, Tools
and Help. The menus are context sensitive which means, only those items relevant
to the work currently being carried out are available.
3.2.2 The LabVIEW
LabVIEW is a graphical development environment for mounting
convention applications. The tools available in LabVIEW make it more users
friendly. Any non-programmer can do the LabVIEW programming easily using
drag and drop system. The figure 3.1 shows the different components accessible in
LabVIEW [9].
Fig.3.1. LabVIEW different components.
a) G - code
The G code is the heart of LabVIEW programming. The statistics gaining
and it’s examination is possible through this tool. The programming flow is visible
as we want using it. The compiler in it examines our code to effectual machine
89
code, which makes it unique [9]. The G-code created by LabVIEW is more
perceptive to use than other programming languages [10]. A reduced amount of
time is required to run the G-code.
b) Hardware compatibility with LabVIEW
It hold up for number of devices in concert with data acquirement, signal
conditioning devices, equipment control device (such as GPIB, PXI) etc. The
freeware obtainable drivers for different types of hardware’s make the LabVIEW
most intuitive [11]. The driverless hardware can be used low -level
communication device.
c) The tools in LabVIEW
LabVIEW possess different types of tools to make the system interactive
[12]. The tools in the LabVIEW such as programming, instrument I/O, signal
processing, mathematics etc. have its own function to create G-code regarding to
this. Many of the controls like modern, classic, express used to create facile and
effective GUI. LabVIEW has graphical palettes to create and run VI’s. Any
complex programming can be done easily using the tools available in this
software. The present wireless gas sensing system uses the web publishing tool in
LabVIEW to display the monitored data on the web page for remote monitoring.
d) Technology concept in LabVIEW
If we want to create a multifunction code for carrying out on multicore
processors, can be done using NI’s LabVIEW tool [12]. Without knowing this
multi-threaded language, anyone can do this programming using tools existing in
LabVIEW. The equivalent applies to new operating system also.
e) Mathematical functions
90
With LabVIEW, any mathematical problem can be solved speedily without
doing complex matrix and calculations.
The formula node perform mathematical operations using formulae in our code
The math script tool used to write functions and script in mathematical
programming. Its syntax is similar to MATLAB.
Simulation diagrams are helpful for real time monitoring and controlling.
The strip chart shows tracing similar to oscilloscope.
These calculation models allow selection of the proper tool for the exacting
crisis.
3.3 X-CTU Software
X-CTU software is needed to run the programming with ZigBee. X-CTU is
designed to function with all Windows-based computers running Microsoft
Windows 98 SE and above. This program was designed to interact with the
firmware files found on Digi’s RF products and to provide a simple-to-use
graphical user interface to them. When launched, four tabs across the top of the
program can be seen. Each of these tabs has a different function.
3.3.1 Programming with the ZigBee for wireless gas sensing system
The present wireless gas sensing system consists of a total of five sensor
nodes. Out of these four sensor nodes are configured as routers and one is
configured as co-ordinator. As shown in fig.3.6, the modem configuration window
should be selected for programming the ZigBee. While programming, as stated
above, the default setting of the devices should be read. Before beginning with the
configuration, the device must be selected. Here, the device XB24-ZB is selected.
Then, the function for which the device is to be programmed is selected. The X-
CTU windows for configuration of ZigBee devices as router are shown in fig.3.2,
whereas X-CTU windows for configuration of ZigBee as co-ordinator are shown
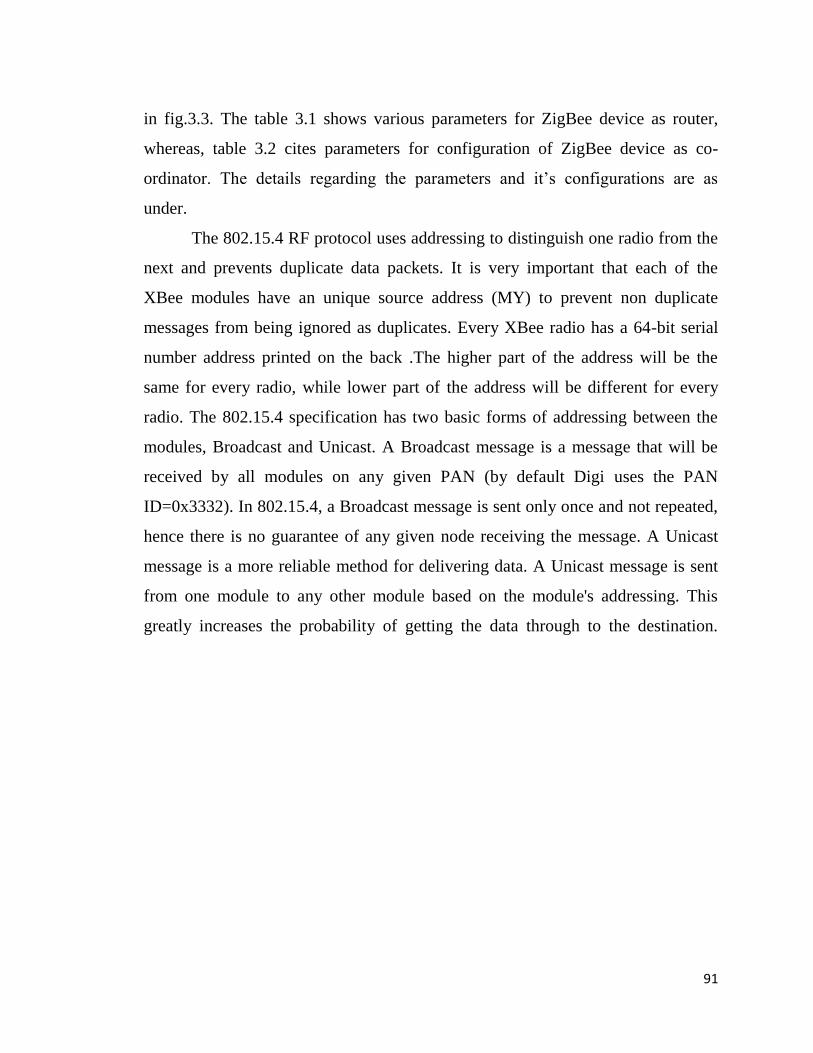
91
in fig.3.3. The table 3.1 shows various parameters for ZigBee device as router,
whereas, table 3.2 cites parameters for configuration of ZigBee device as co-
ordinator. The details regarding the parameters and it’s configurations are as
under.
The 802.15.4 RF protocol uses addressing to distinguish one radio from the
next and prevents duplicate data packets. It is very important that each of the
XBee modules have an unique source address (MY) to prevent non duplicate
messages from being ignored as duplicates. Every XBee radio has a 64-bit serial
number address printed on the back .The higher part of the address will be the
same for every radio, while lower part of the address will be different for every
radio. The 802.15.4 specification has two basic forms of addressing between the
modules, Broadcast and Unicast. A Broadcast message is a message that will be
received by all modules on any given PAN (by default Digi uses the PAN
ID=0x3332). In 802.15.4, a Broadcast message is sent only once and not repeated,
hence there is no guarantee of any given node receiving the message. A Unicast
message is a more reliable method for delivering data. A Unicast message is sent
from one module to any other module based on the module's addressing. This
greatly increases the probability of getting the data through to the destination.
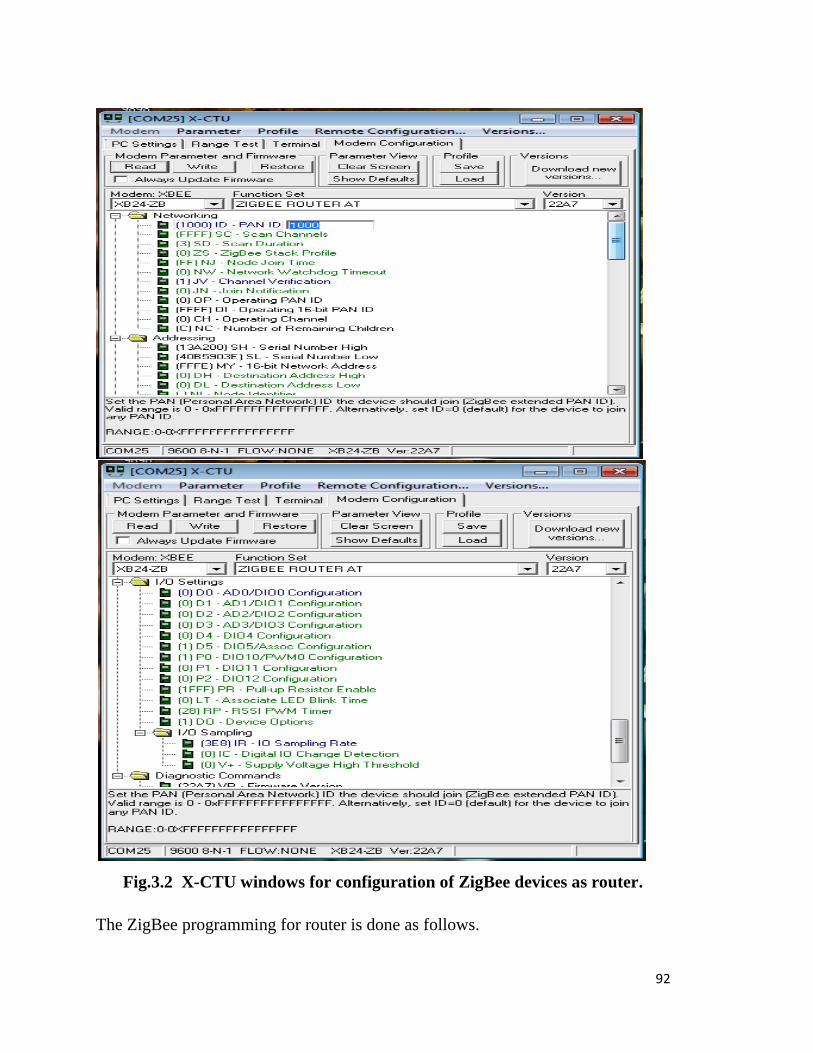
92
Fig.3.2 X-CTU windows for configuration of ZigBee devices as router.
The ZigBee programming for router is done as follows.
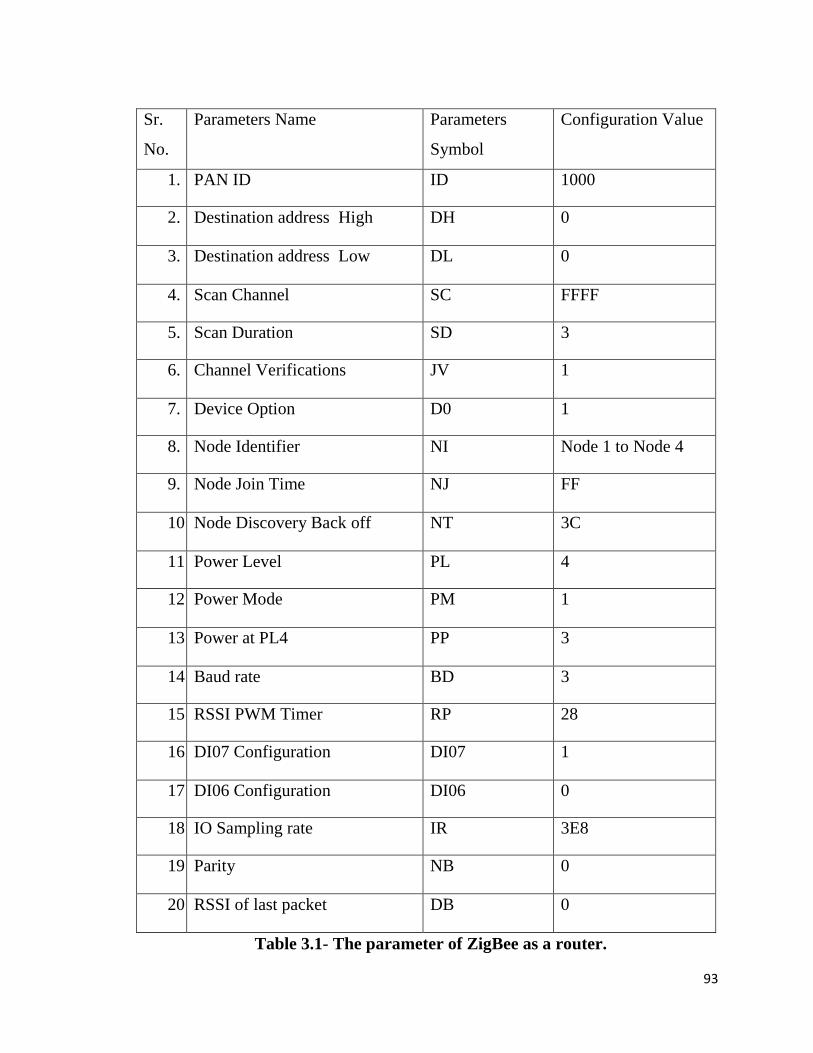
93
Sr.
No.
Parameters Name Parameters
Symbol
Configuration Value
1. PAN ID ID 1000
2. Destination address High DH 0
3. Destination address Low DL 0
4. Scan Channel SC FFFF
5. Scan Duration SD 3
6. Channel Verifications JV 1
7. Device Option D0 1
8. Node Identifier NI Node 1 to Node 4
9. Node Join Time NJ FF
10. Node Discovery Back off NT 3C
11. Power Level PL 4
12. Power Mode PM 1
13. Power at PL4 PP 3
14. Baud rate BD 3
15. RSSI PWM Timer RP 28
16. DI07 Configuration DI07 1
17. DI06 Configuration DI06 0
18. IO Sampling rate IR 3E8
19. Parity NB 0
20. RSSI of last packet DB 0
Table 3.1- The parameter of ZigBee as a router.
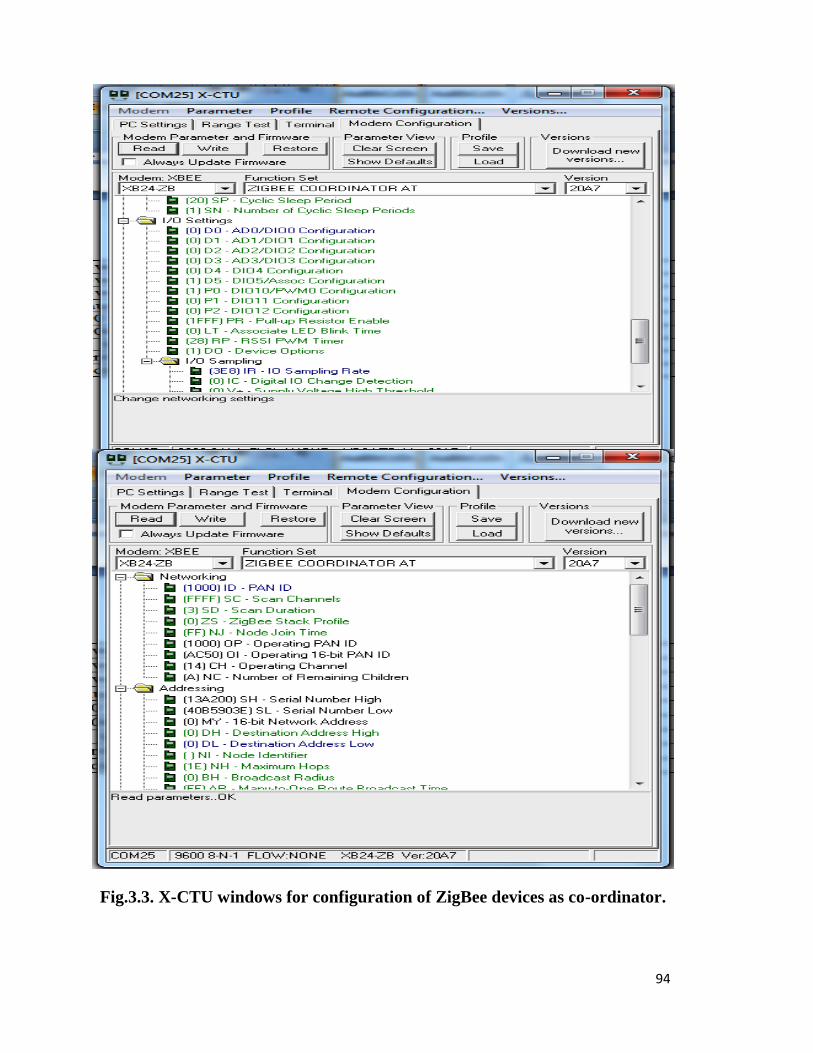
94
Fig.3.3. X-CTU windows for configuration of ZigBee devices as co-ordinator.
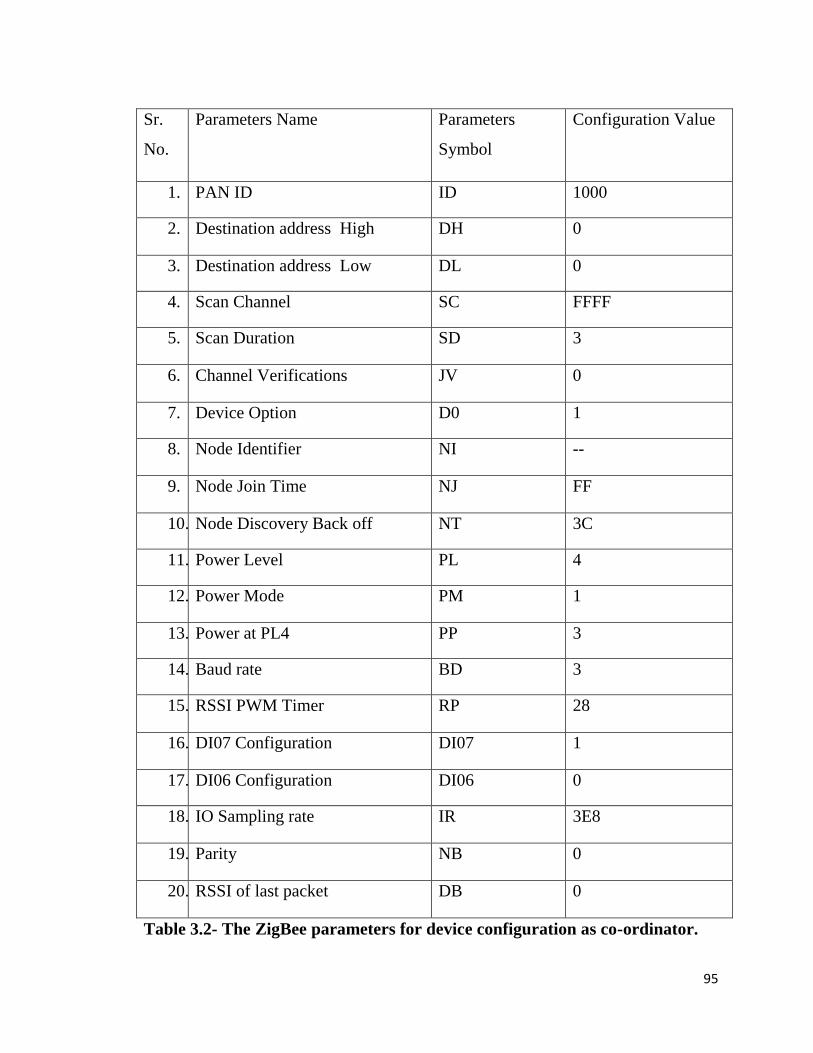
95
Sr.
No.
Parameters Name Parameters
Symbol
Configuration Value
1. PAN ID ID 1000
2. Destination address High DH 0
3. Destination address Low DL 0
4. Scan Channel SC FFFF
5. Scan Duration SD 3
6. Channel Verifications JV 0
7. Device Option D0 1
8. Node Identifier NI --
9. Node Join Time NJ FF
10. Node Discovery Back off NT 3C
11. Power Level PL 4
12. Power Mode PM 1
13. Power at PL4 PP 3
14. Baud rate BD 3
15. RSSI PWM Timer RP 28
16. DI07 Configuration DI07 1
17. DI06 Configuration DI06 0
18. IO Sampling rate IR 3E8
19. Parity NB 0
20. RSSI of last packet DB 0
Table 3.2- The ZigBee parameters for device configuration as co-ordinator.
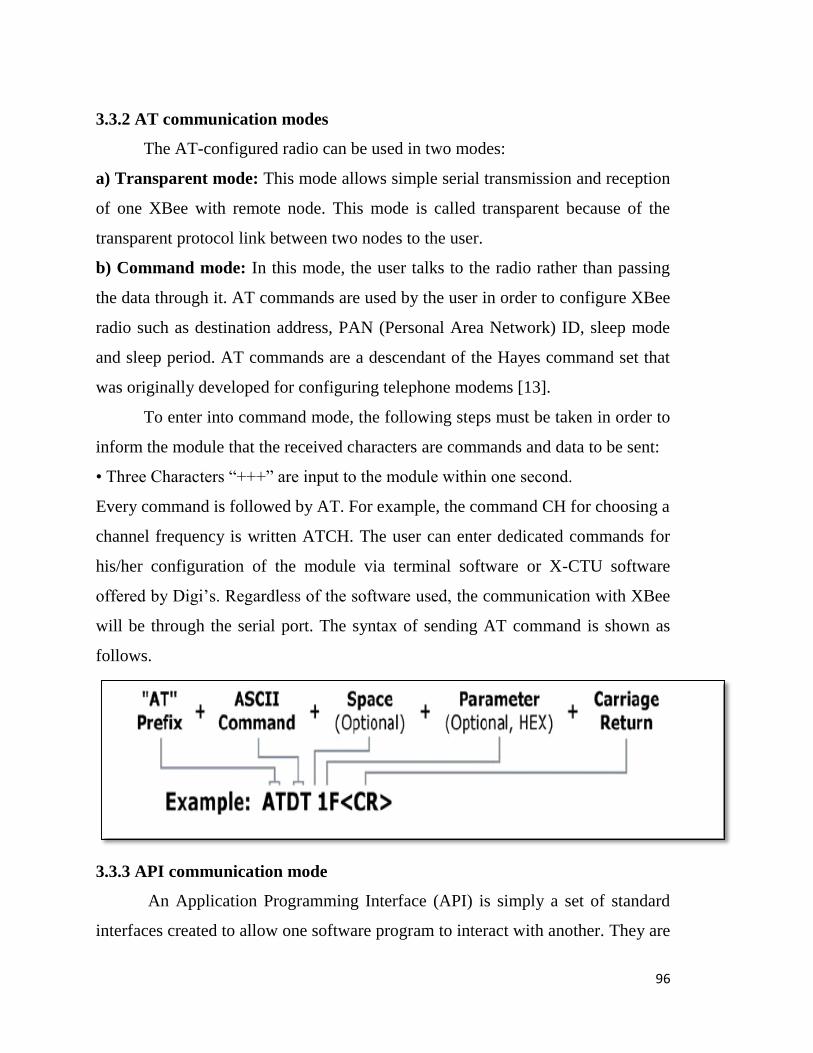
96
3.3.2 AT communication modes
The AT-configured radio can be used in two modes:
a) Transparent mode: This mode allows simple serial transmission and reception
of one XBee with remote node. This mode is called transparent because of the
transparent protocol link between two nodes to the user.
b) Command mode: In this mode, the user talks to the radio rather than passing
the data through it. AT commands are used by the user in order to configure XBee
radio such as destination address, PAN (Personal Area Network) ID, sleep mode
and sleep period. AT commands are a descendant of the Hayes command set that
was originally developed for configuring telephone modems [13].
To enter into command mode, the following steps must be taken in order to
inform the module that the received characters are commands and data to be sent:
• Three Characters “+++” are input to the module within one second.
Every command is followed by AT. For example, the command CH for choosing a
channel frequency is written ATCH. The user can enter dedicated commands for
his/her configuration of the module via terminal software or X-CTU software
offered by Digi’s. Regardless of the software used, the communication with XBee
will be through the serial port. The syntax of sending AT command is shown as
follows.
3.3.3 API communication mode
An Application Programming Interface (API) is simply a set of standard
interfaces created to allow one software program to interact with another. They are
97
generally not designed for direct human interaction. In API mode, the programmer
packages the data with necessary information, such as destination address, type of
packet, and checksum value. Also, the receiving node accepts the data with
information such as source address, type of packet, signal strength and checksum
value. The advantages are that the user can build a packet that includes important
data, such as destination address and that the receiving node can pull from the
packet information such as source address of the data. While more programming
intensive, API mode allows the user greater flexibility and increased reliability in
some cases [14]. They use API mode to implement their operations such as:
• Addressing different nodes without entering the command mode.
• Automatic retries and acknowledgements of transmissions.
• Collision avoidance.
• Identification of the source address of each received packet.
• A checksum.
3.4. Flowchart for Wireless Gas Sensing System
This system focuses more on the study case and monitoring the wireless gas
sensing system. The microcontroller will continuously receive the data from
various sensor nodes. It will process the data and convert it into ppm. The
converted data will be displayed on the web browser. Whenever the reading of the
sensors exceeds the limit set, it will automatically send an SMS alert wirelessly by
using GSM network to the numbers as being set on the source code. The project
methodology shows the step by step taken in order to complete this wireless gas
sensing system and includes the planning, the development of the design and the
management of the system.
3.5 Software Implementation
This section will specifically discuss the methodology to interface the
sensor and hardware module. The most important part is to enable the analog
sensor to send the analog data to arduino and then transfer to the LabVIEW.
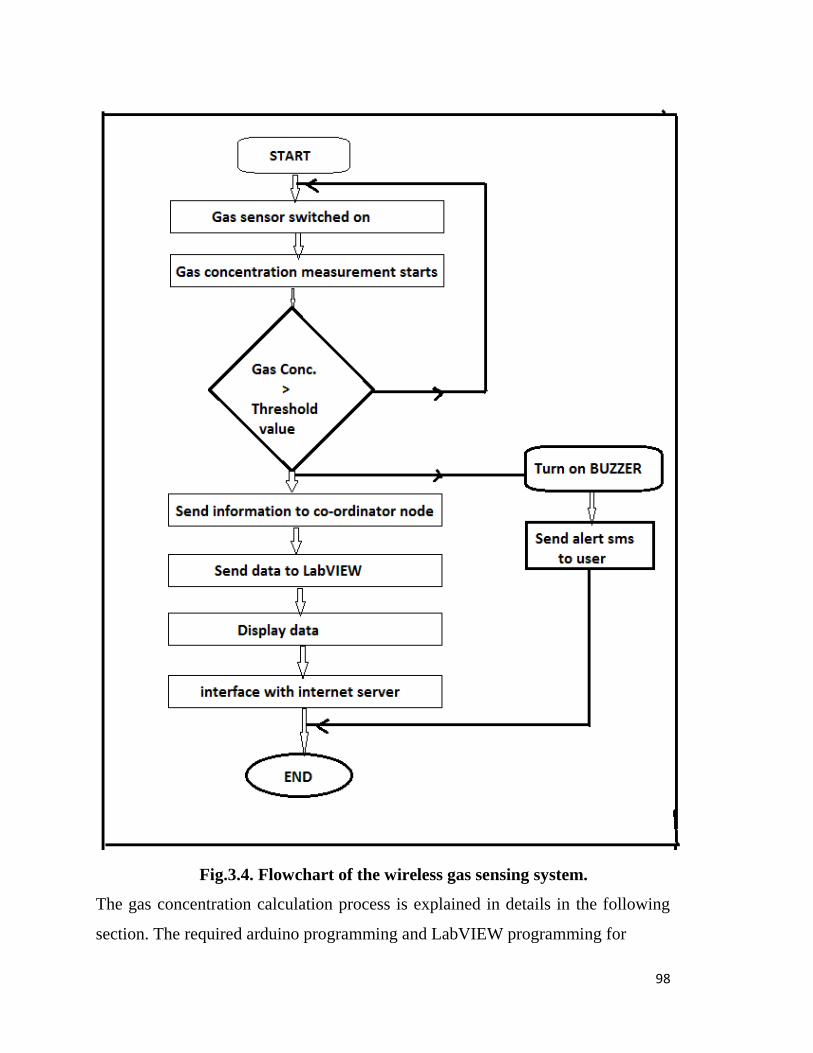
98
Fig.3.4. Flowchart of the wireless gas sensing system.
The gas concentration calculation process is explained in details in the following
section. The required arduino programming and LabVIEW programming for
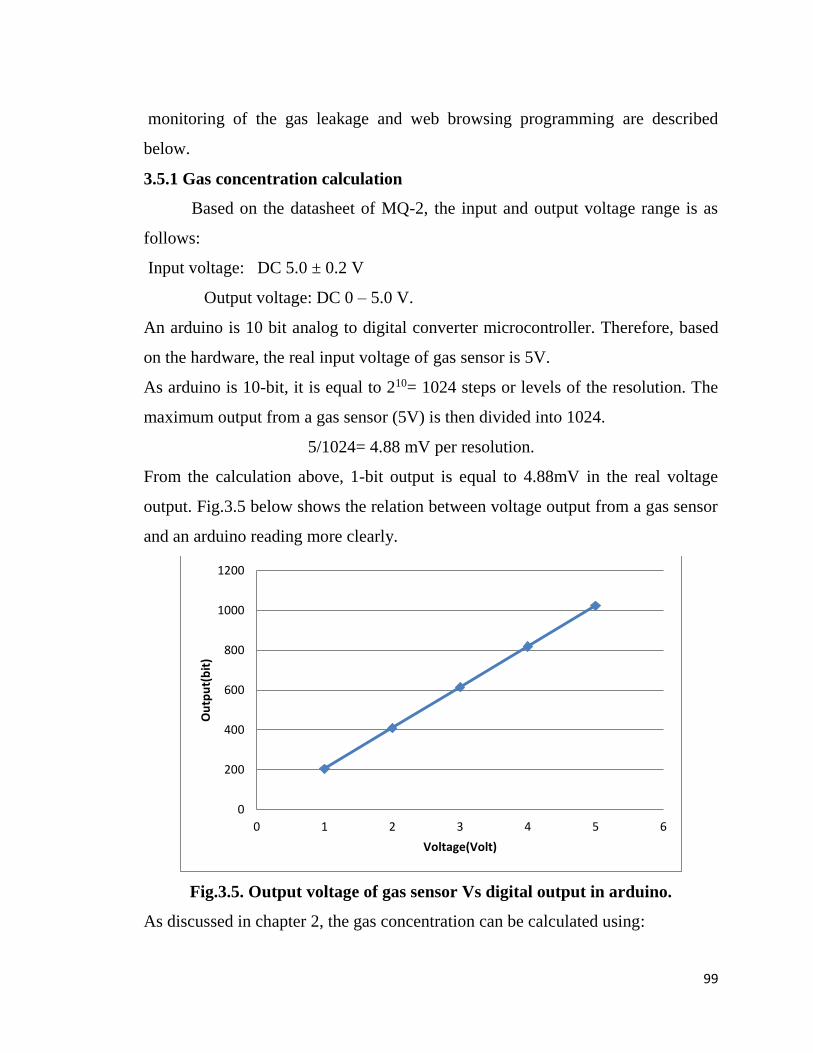
99
monitoring of the gas leakage and web browsing programming are described
below.
3.5.1 Gas concentration calculation
Based on the datasheet of MQ-2, the input and output voltage range is as
follows:
Input voltage: DC 5.0 ± 0.2 V
Output voltage: DC 0 – 5.0 V.
An arduino is 10 bit analog to digital converter microcontroller. Therefore, based
on the hardware, the real input voltage of gas sensor is 5V.
As arduino is 10-bit, it is equal to 210= 1024 steps or levels of the resolution. The
maximum output from a gas sensor (5V) is then divided into 1024.
5/1024= 4.88 mV per resolution.
From the calculation above, 1-bit output is equal to 4.88mV in the real voltage
output. Fig.3.5 below shows the relation between voltage output from a gas sensor
and an arduino reading more clearly.
Fig.3.5. Output voltage of gas sensor Vs digital output in arduino.
As discussed in chapter 2, the gas concentration can be calculated using:
0
200
400
600
800
1000
1200
0 1 2 3 4 5 6
Output(bit)
Voltage(Volt)
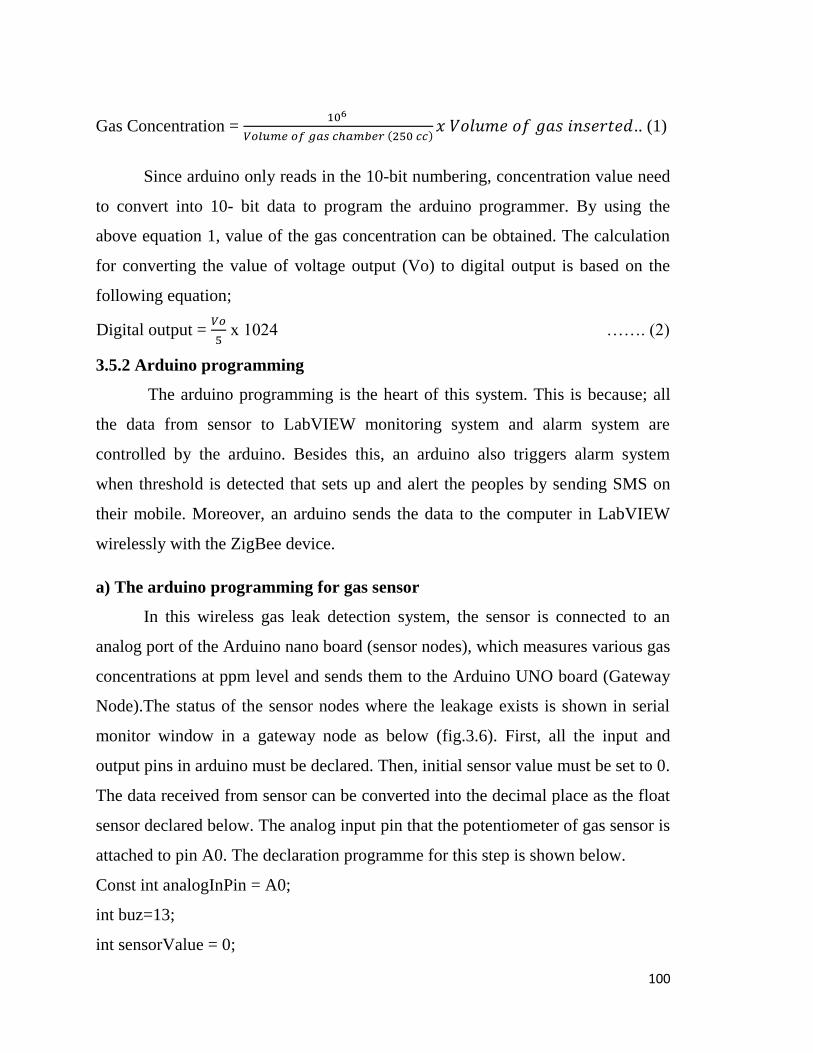
100
Gas Concentration = 106
𝑉𝑜𝑙𝑢𝑚𝑒 𝑜𝑓 𝑔𝑎𝑠 𝑐ℎ𝑎𝑚𝑏𝑒𝑟 (250 𝑐𝑐)𝑥 𝑉𝑜𝑙𝑢𝑚𝑒 𝑜𝑓 𝑔𝑎𝑠 𝑖𝑛𝑠𝑒𝑟𝑡𝑒𝑑.. (1)
Since arduino only reads in the 10-bit numbering, concentration value need
to convert into 10- bit data to program the arduino programmer. By using the
above equation 1, value of the gas concentration can be obtained. The calculation
for converting the value of voltage output (Vo) to digital output is based on the
following equation;
Digital output = 𝑉𝑜
5 x 1024 ……. (2)
3.5.2 Arduino programming
The arduino programming is the heart of this system. This is because; all
the data from sensor to LabVIEW monitoring system and alarm system are
controlled by the arduino. Besides this, an arduino also triggers alarm system
when threshold is detected that sets up and alert the peoples by sending SMS on
their mobile. Moreover, an arduino sends the data to the computer in LabVIEW
wirelessly with the ZigBee device.
a) The arduino programming for gas sensor
In this wireless gas leak detection system, the sensor is connected to an
analog port of the Arduino nano board (sensor nodes), which measures various gas
concentrations at ppm level and sends them to the Arduino UNO board (Gateway
Node).The status of the sensor nodes where the leakage exists is shown in serial
monitor window in a gateway node as below (fig.3.6). First, all the input and
output pins in arduino must be declared. Then, initial sensor value must be set to 0.
The data received from sensor can be converted into the decimal place as the float
sensor declared below. The analog input pin that the potentiometer of gas sensor is
attached to pin A0. The declaration programme for this step is shown below.
Const int analogInPin = A0;
int buz=13;
int sensorValue = 0;
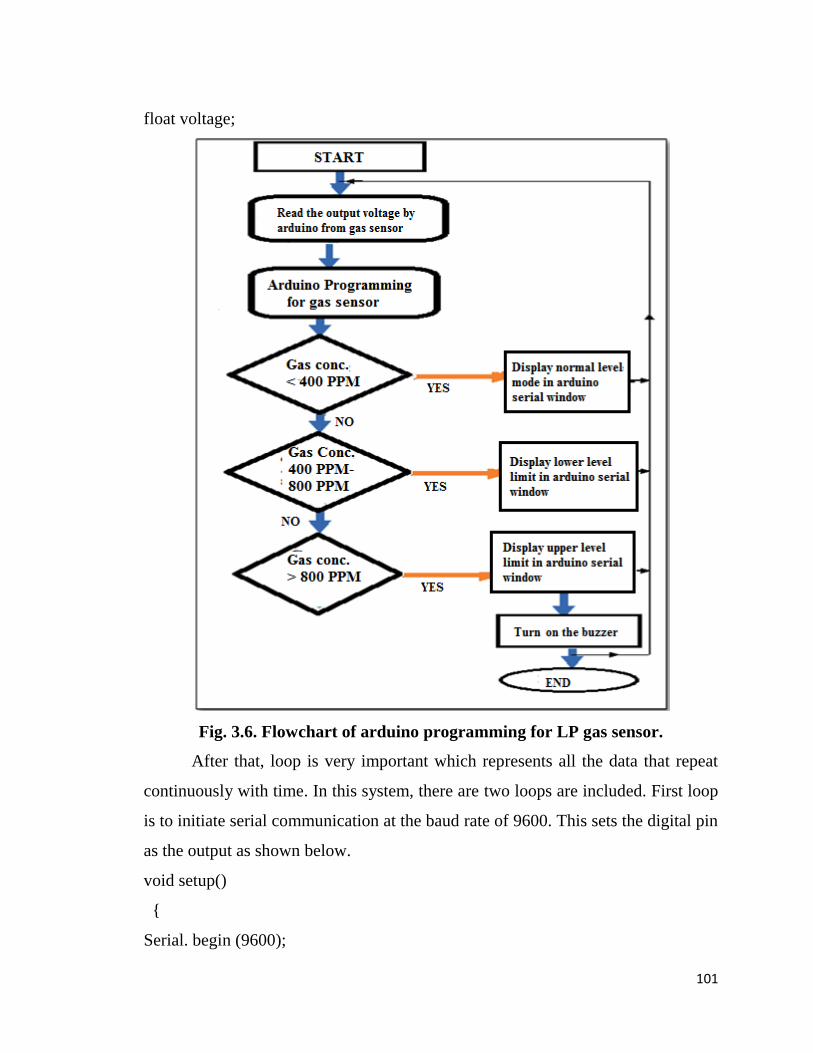
101
float voltage;
Fig. 3.6. Flowchart of arduino programming for LP gas sensor.
After that, loop is very important which represents all the data that repeat
continuously with time. In this system, there are two loops are included. First loop
is to initiate serial communication at the baud rate of 9600. This sets the digital pin
as the output as shown below.
void setup()
Serial. begin (9600);
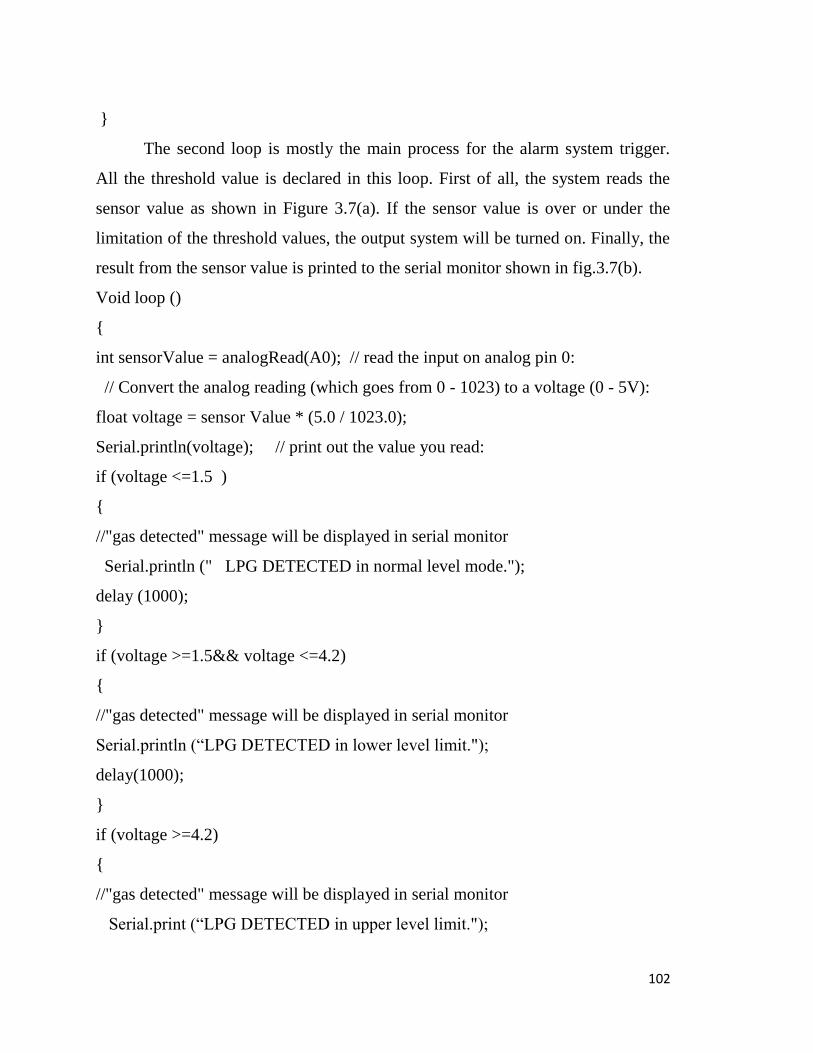
102
The second loop is mostly the main process for the alarm system trigger.
All the threshold value is declared in this loop. First of all, the system reads the
sensor value as shown in Figure 3.7(a). If the sensor value is over or under the
limitation of the threshold values, the output system will be turned on. Finally, the
result from the sensor value is printed to the serial monitor shown in fig.3.7(b).
Void loop ()
int sensorValue = analogRead(A0); // read the input on analog pin 0:
// Convert the analog reading (which goes from 0 - 1023) to a voltage (0 - 5V):
float voltage = sensor Value * (5.0 / 1023.0);
Serial.println(voltage); // print out the value you read:
if (voltage <=1.5 )
//"gas detected" message will be displayed in serial monitor
Serial.println (" LPG DETECTED in normal level mode.");
delay (1000);
if (voltage >=1.5&& voltage <=4.2)
//"gas detected" message will be displayed in serial monitor
Serial.println (“LPG DETECTED in lower level limit.");
delay(1000);
if (voltage >=4.2)
//"gas detected" message will be displayed in serial monitor
Serial.print (“LPG DETECTED in upper level limit.");
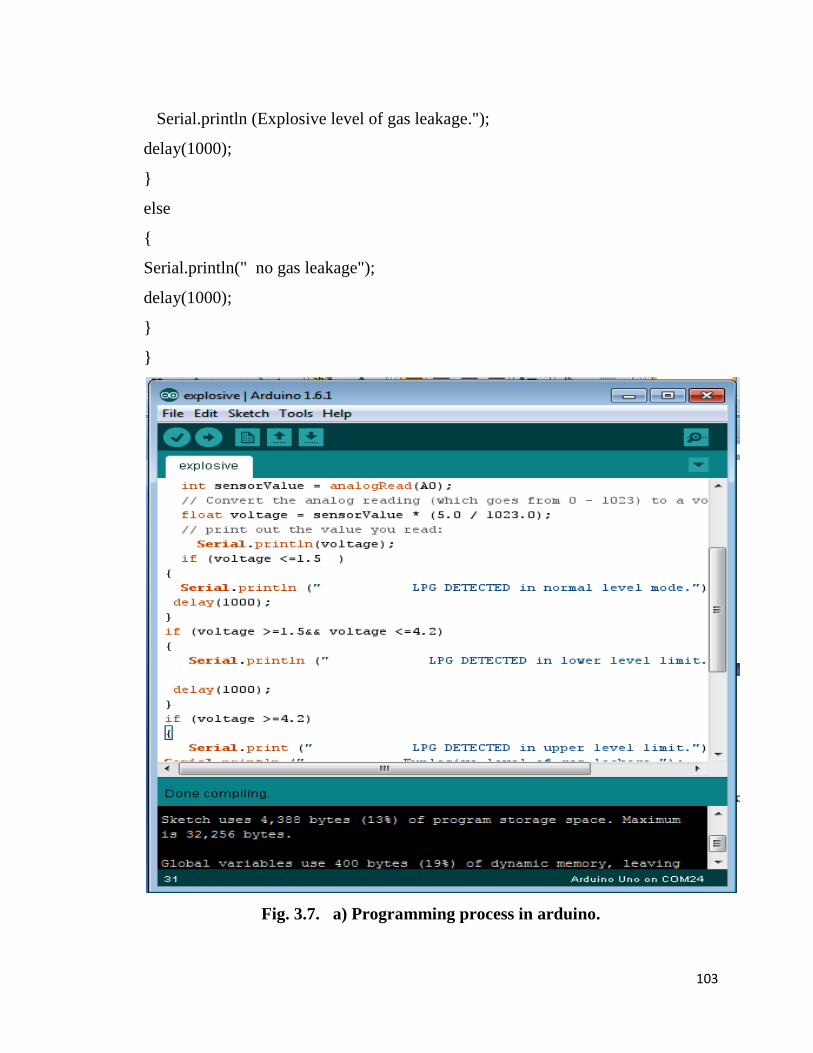
103
Serial.println (Explosive level of gas leakage.");
delay(1000);
else
Serial.println(" no gas leakage");
delay(1000);
Fig. 3.7. a) Programming process in arduino.
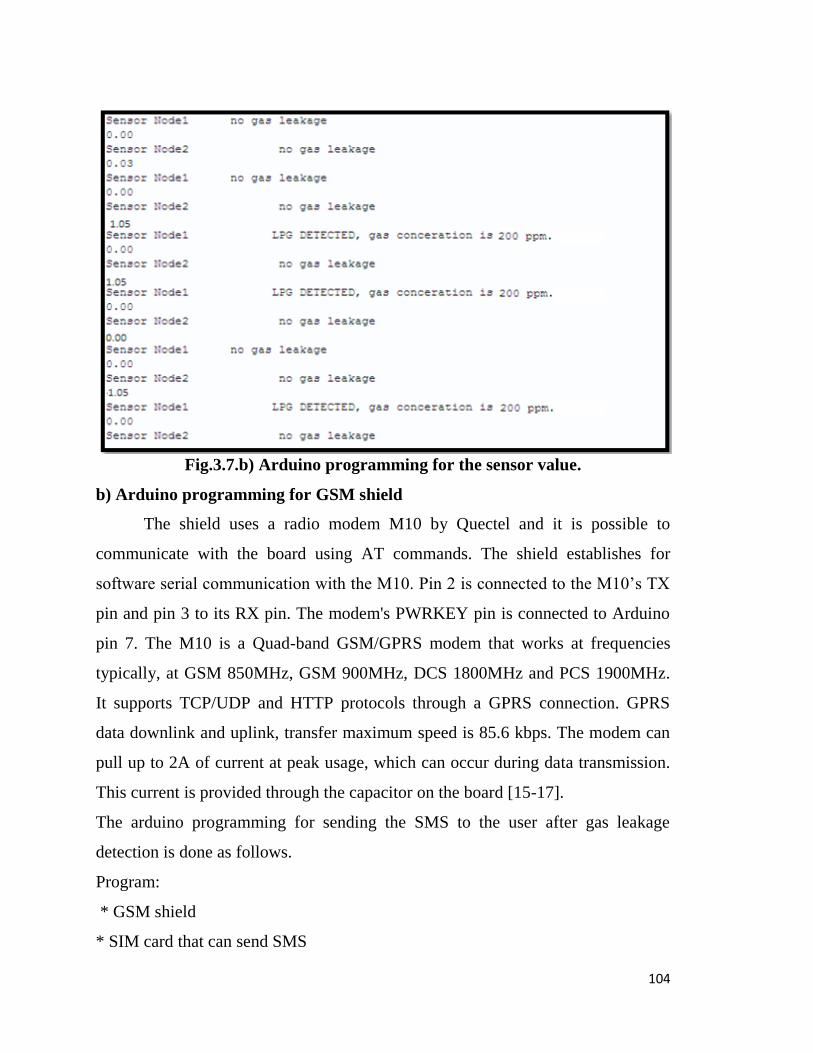
104
Fig.3.7.b) Arduino programming for the sensor value.
b) Arduino programming for GSM shield
The shield uses a radio modem M10 by Quectel and it is possible to
communicate with the board using AT commands. The shield establishes for
software serial communication with the M10. Pin 2 is connected to the M10’s TX
pin and pin 3 to its RX pin. The modem's PWRKEY pin is connected to Arduino
pin 7. The M10 is a Quad-band GSM/GPRS modem that works at frequencies
typically, at GSM 850MHz, GSM 900MHz, DCS 1800MHz and PCS 1900MHz.
It supports TCP/UDP and HTTP protocols through a GPRS connection. GPRS
data downlink and uplink, transfer maximum speed is 85.6 kbps. The modem can
pull up to 2A of current at peak usage, which can occur during data transmission.
This current is provided through the capacitor on the board [15-17].
The arduino programming for sending the SMS to the user after gas leakage
detection is done as follows.
Program:
* GSM shield
* SIM card that can send SMS
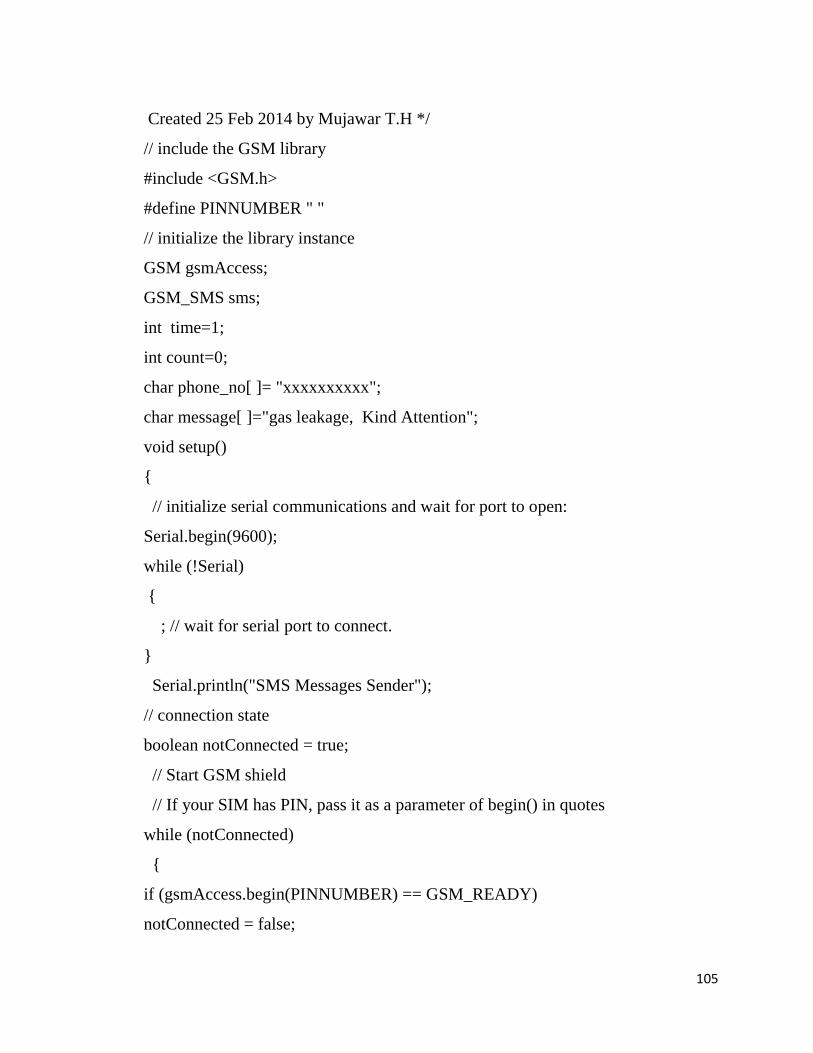
105
Created 25 Feb 2014 by Mujawar T.H */
// include the GSM library
#include <GSM.h>
#define PINNUMBER " "
// initialize the library instance
GSM gsmAccess;
GSM_SMS sms;
int time=1;
int count=0;
char phone_no[ ]= "xxxxxxxxxx";
char message[ ]="gas leakage, Kind Attention";
void setup()
// initialize serial communications and wait for port to open:
Serial.begin(9600);
while (!Serial)
; // wait for serial port to connect.
Serial.println("SMS Messages Sender");
// connection state
boolean notConnected = true;
// Start GSM shield
// If your SIM has PIN, pass it as a parameter of begin() in quotes
while (notConnected)
if (gsmAccess.begin(PINNUMBER) == GSM_READY)
notConnected = false;
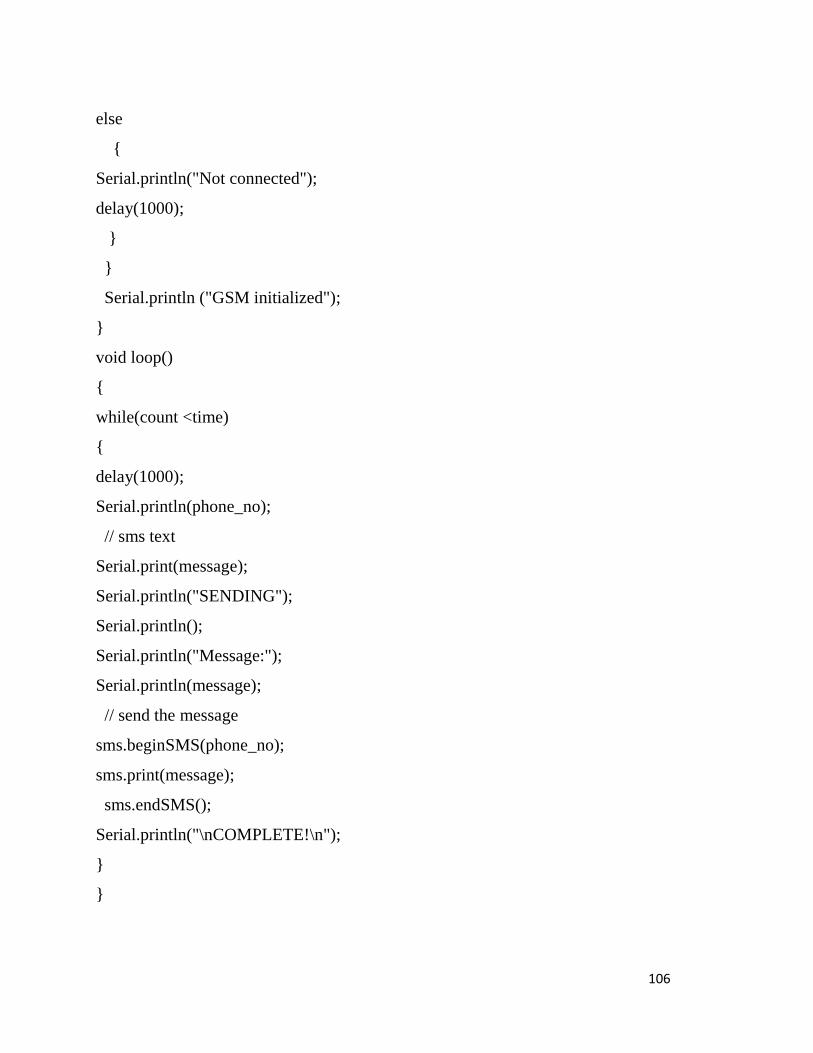
106
else
Serial.println("Not connected");
delay(1000);
Serial.println ("GSM initialized");
void loop()
while(count <time)
delay(1000);
Serial.println(phone_no);
// sms text
Serial.print(message);
Serial.println("SENDING");
Serial.println();
Serial.println("Message:");
Serial.println(message);
// send the message
sms.beginSMS(phone_no);
sms.print(message);
sms.endSMS();
Serial.println("\nCOMPLETE!\n");
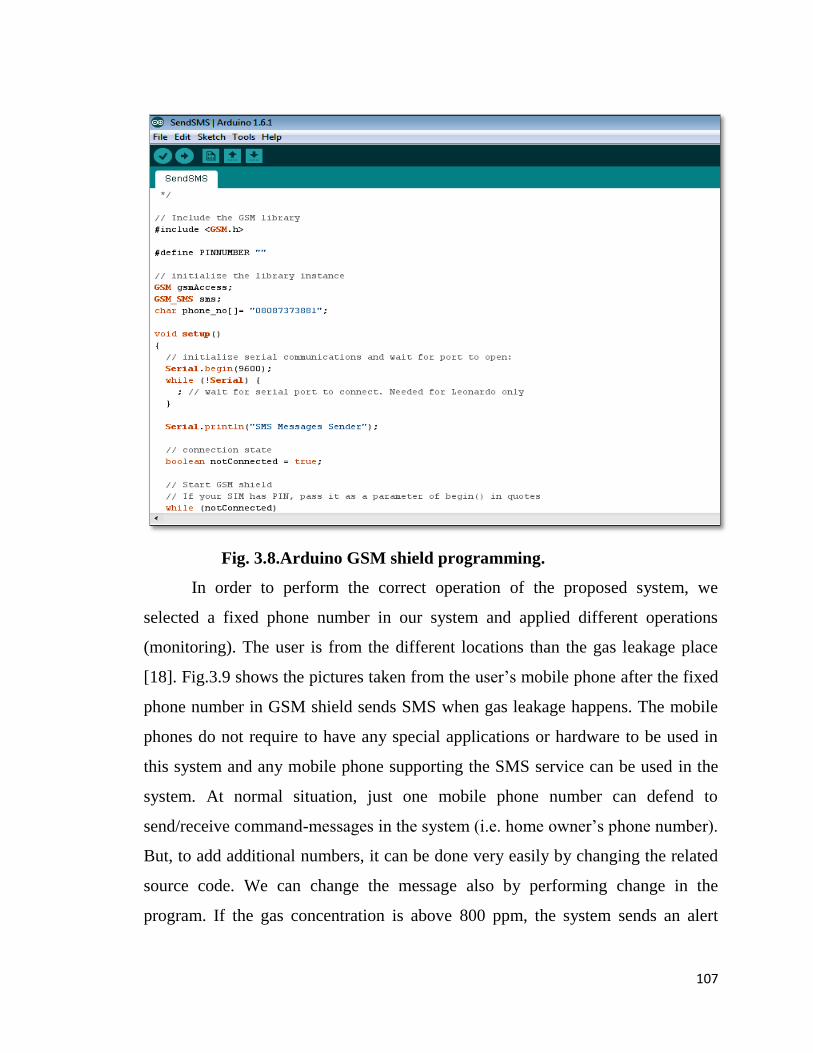
107
Fig. 3.8.Arduino GSM shield programming.
In order to perform the correct operation of the proposed system, we
selected a fixed phone number in our system and applied different operations
(monitoring). The user is from the different locations than the gas leakage place
[18]. Fig.3.9 shows the pictures taken from the user’s mobile phone after the fixed
phone number in GSM shield sends SMS when gas leakage happens. The mobile
phones do not require to have any special applications or hardware to be used in
this system and any mobile phone supporting the SMS service can be used in the
system. At normal situation, just one mobile phone number can defend to
send/receive command-messages in the system (i.e. home owner’s phone number).
But, to add additional numbers, it can be done very easily by changing the related
source code. We can change the message also by performing change in the
program. If the gas concentration is above 800 ppm, the system sends an alert
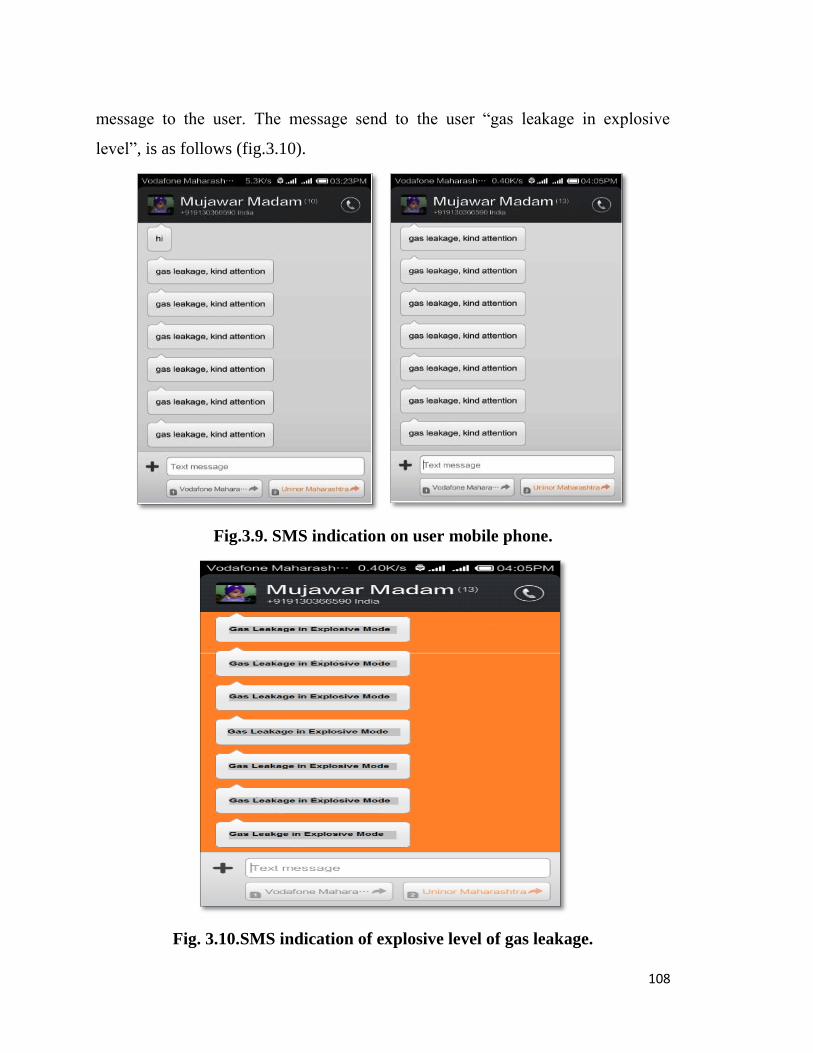
108
message to the user. The message send to the user “gas leakage in explosive
level”, is as follows (fig.3.10).
Fig.3.9. SMS indication on user mobile phone.
Fig. 3.10.SMS indication of explosive level of gas leakage.
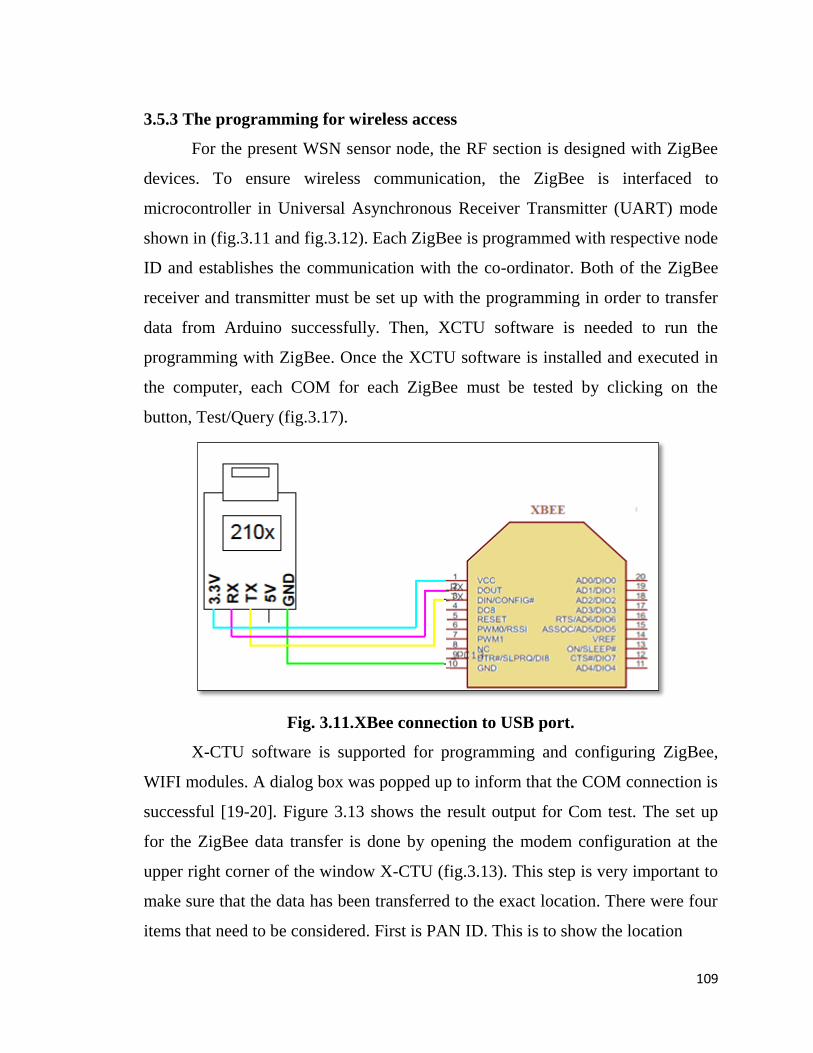
109
3.5.3 The programming for wireless access
For the present WSN sensor node, the RF section is designed with ZigBee
devices. To ensure wireless communication, the ZigBee is interfaced to
microcontroller in Universal Asynchronous Receiver Transmitter (UART) mode
shown in (fig.3.11 and fig.3.12). Each ZigBee is programmed with respective node
ID and establishes the communication with the co-ordinator. Both of the ZigBee
receiver and transmitter must be set up with the programming in order to transfer
data from Arduino successfully. Then, XCTU software is needed to run the
programming with ZigBee. Once the XCTU software is installed and executed in
the computer, each COM for each ZigBee must be tested by clicking on the
button, Test/Query (fig.3.17).
Fig. 3.11.XBee connection to USB port.
X-CTU software is supported for programming and configuring ZigBee,
WIFI modules. A dialog box was popped up to inform that the COM connection is
successful [19-20]. Figure 3.13 shows the result output for Com test. The set up
for the ZigBee data transfer is done by opening the modem configuration at the
upper right corner of the window X-CTU (fig.3.13). This step is very important to
make sure that the data has been transferred to the exact location. There were four
items that need to be considered. First is PAN ID. This is to show the location
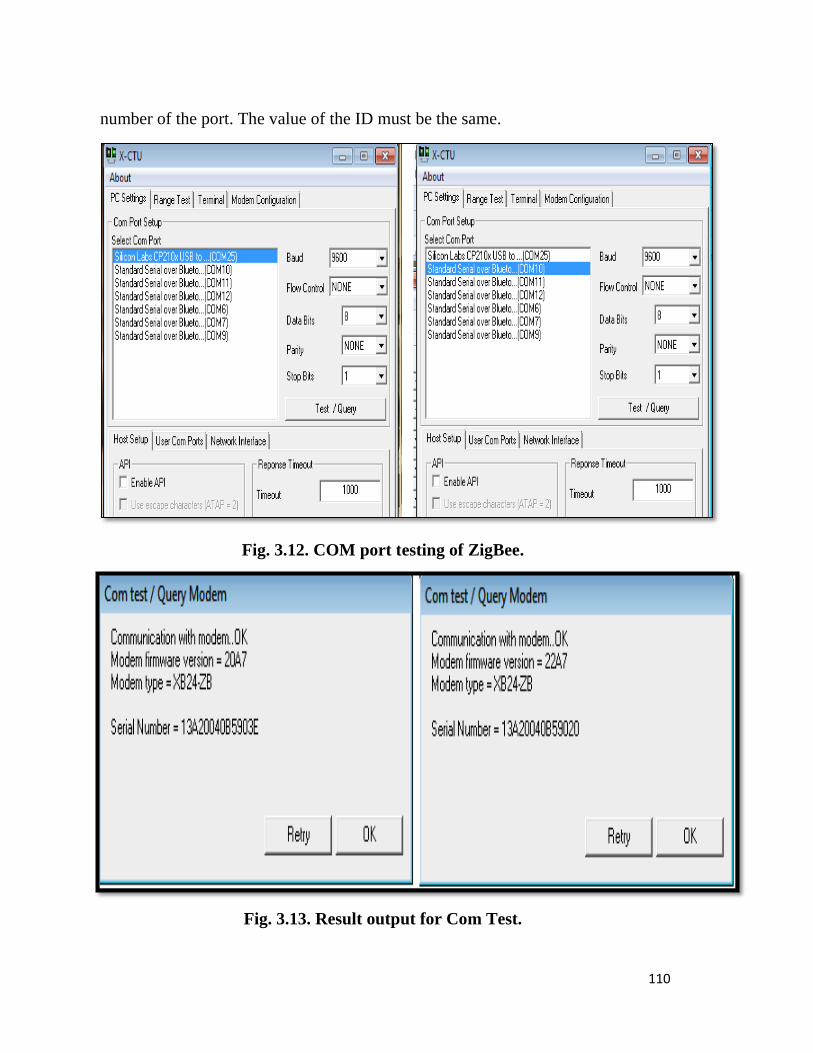
110
number of the port. The value of the ID must be the same.
Fig. 3.12. COM port testing of ZigBee.
Fig. 3.13. Result output for Com Test.
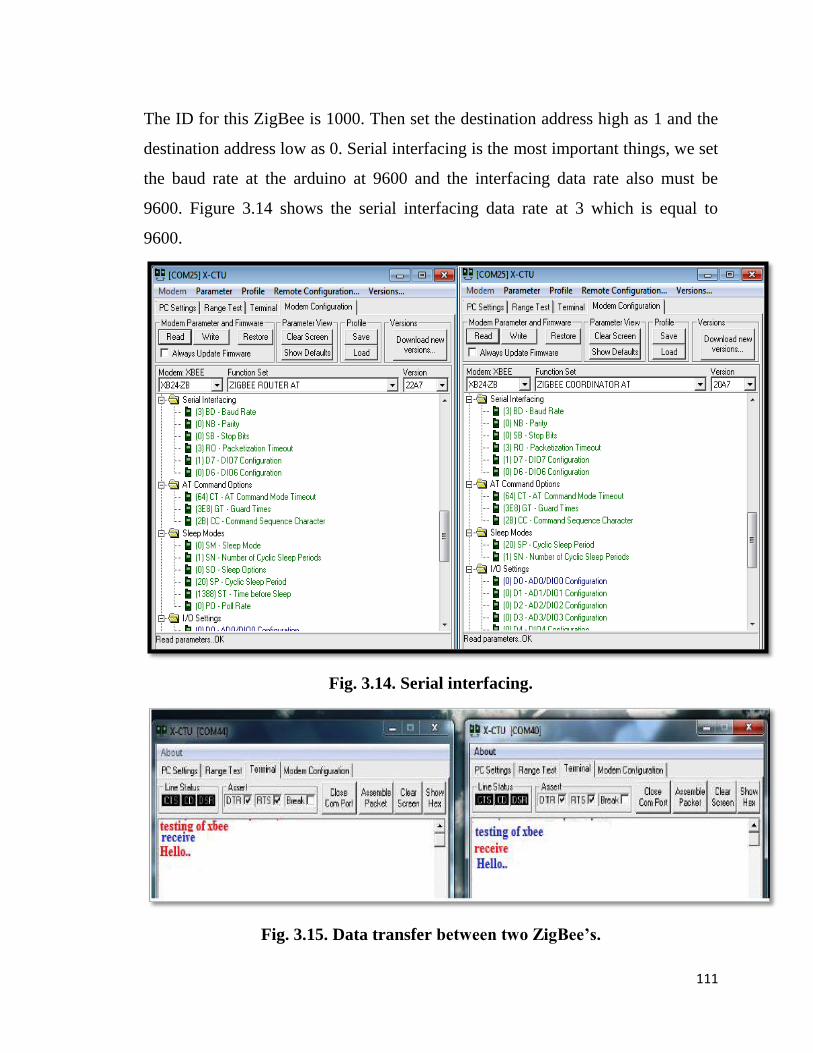
111
The ID for this ZigBee is 1000. Then set the destination address high as 1 and the
destination address low as 0. Serial interfacing is the most important things, we set
the baud rate at the arduino at 9600 and the interfacing data rate also must be
9600. Figure 3.14 shows the serial interfacing data rate at 3 which is equal to
9600.
Fig. 3.14. Serial interfacing.
Fig. 3.15. Data transfer between two ZigBee’s.
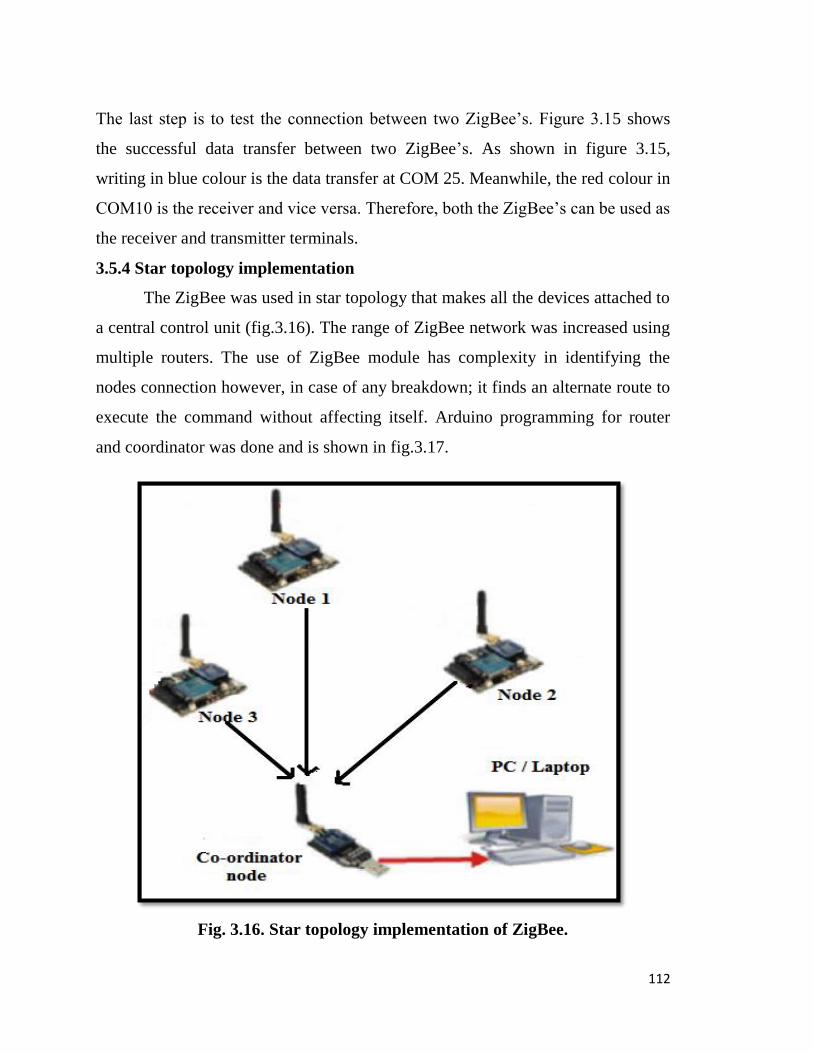
112
The last step is to test the connection between two ZigBee’s. Figure 3.15 shows
the successful data transfer between two ZigBee’s. As shown in figure 3.15,
writing in blue colour is the data transfer at COM 25. Meanwhile, the red colour in
COM10 is the receiver and vice versa. Therefore, both the ZigBee’s can be used as
the receiver and transmitter terminals.
3.5.4 Star topology implementation
The ZigBee was used in star topology that makes all the devices attached to
a central control unit (fig.3.16). The range of ZigBee network was increased using
multiple routers. The use of ZigBee module has complexity in identifying the
nodes connection however, in case of any breakdown; it finds an alternate route to
execute the command without affecting itself. Arduino programming for router
and coordinator was done and is shown in fig.3.17.
Fig. 3.16. Star topology implementation of ZigBee.
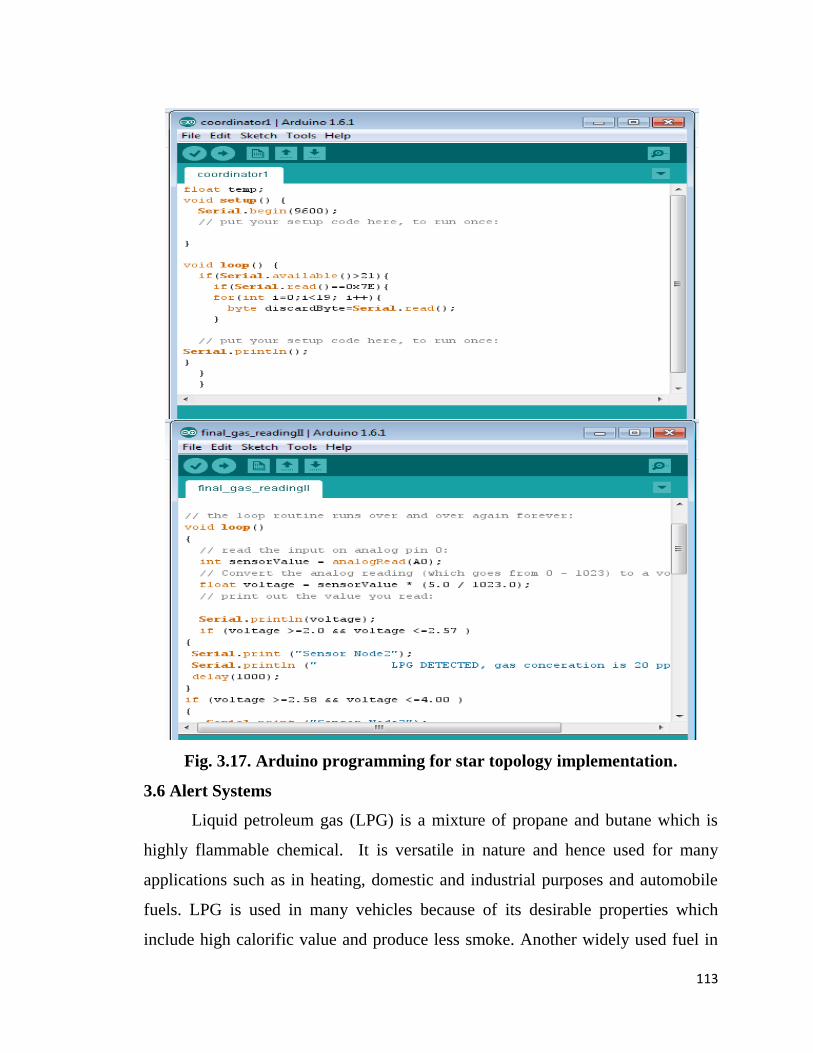
113
Fig. 3.17. Arduino programming for star topology implementation.
3.6 Alert Systems
Liquid petroleum gas (LPG) is a mixture of propane and butane which is
highly flammable chemical. It is versatile in nature and hence used for many
applications such as in heating, domestic and industrial purposes and automobile
fuels. LPG is used in many vehicles because of its desirable properties which
include high calorific value and produce less smoke. Another widely used fuel in
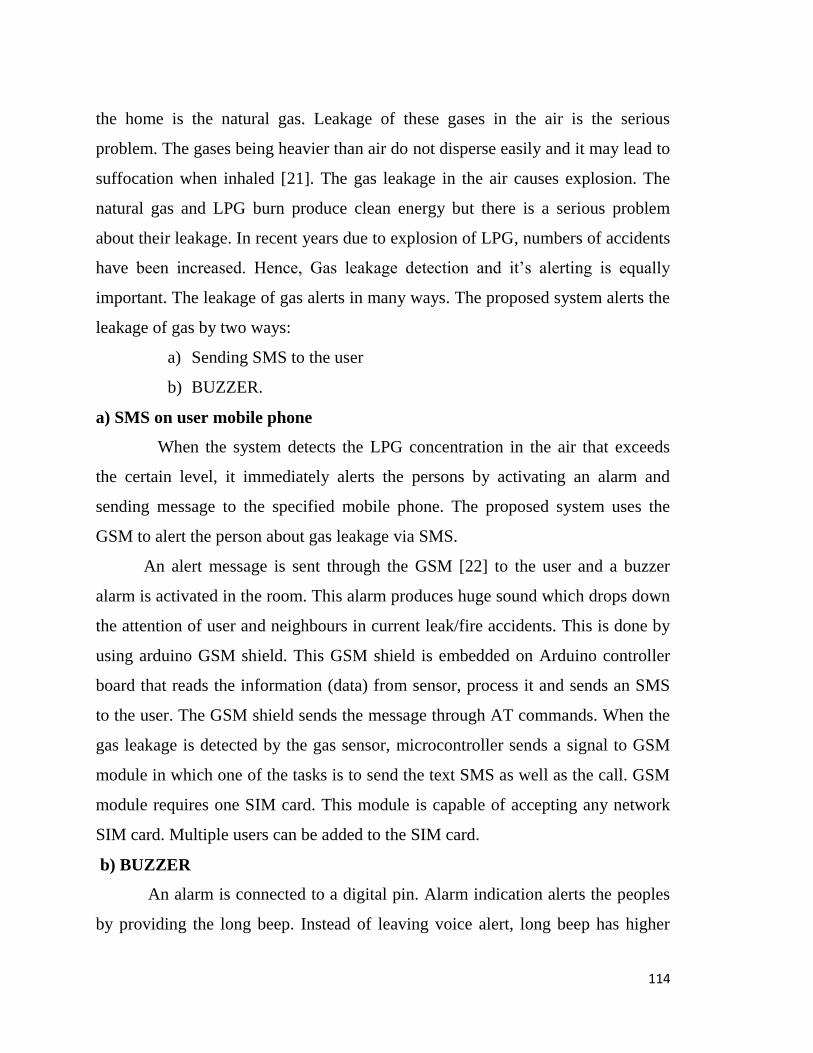
114
the home is the natural gas. Leakage of these gases in the air is the serious
problem. The gases being heavier than air do not disperse easily and it may lead to
suffocation when inhaled [21]. The gas leakage in the air causes explosion. The
natural gas and LPG burn produce clean energy but there is a serious problem
about their leakage. In recent years due to explosion of LPG, numbers of accidents
have been increased. Hence, Gas leakage detection and it’s alerting is equally
important. The leakage of gas alerts in many ways. The proposed system alerts the
leakage of gas by two ways:
a) Sending SMS to the user
b) BUZZER.
a) SMS on user mobile phone
When the system detects the LPG concentration in the air that exceeds
the certain level, it immediately alerts the persons by activating an alarm and
sending message to the specified mobile phone. The proposed system uses the
GSM to alert the person about gas leakage via SMS.
An alert message is sent through the GSM [22] to the user and a buzzer
alarm is activated in the room. This alarm produces huge sound which drops down
the attention of user and neighbours in current leak/fire accidents. This is done by
using arduino GSM shield. This GSM shield is embedded on Arduino controller
board that reads the information (data) from sensor, process it and sends an SMS
to the user. The GSM shield sends the message through AT commands. When the
gas leakage is detected by the gas sensor, microcontroller sends a signal to GSM
module in which one of the tasks is to send the text SMS as well as the call. GSM
module requires one SIM card. This module is capable of accepting any network
SIM card. Multiple users can be added to the SIM card.
b) BUZZER
An alarm is connected to a digital pin. Alarm indication alerts the peoples
by providing the long beep. Instead of leaving voice alert, long beep has higher
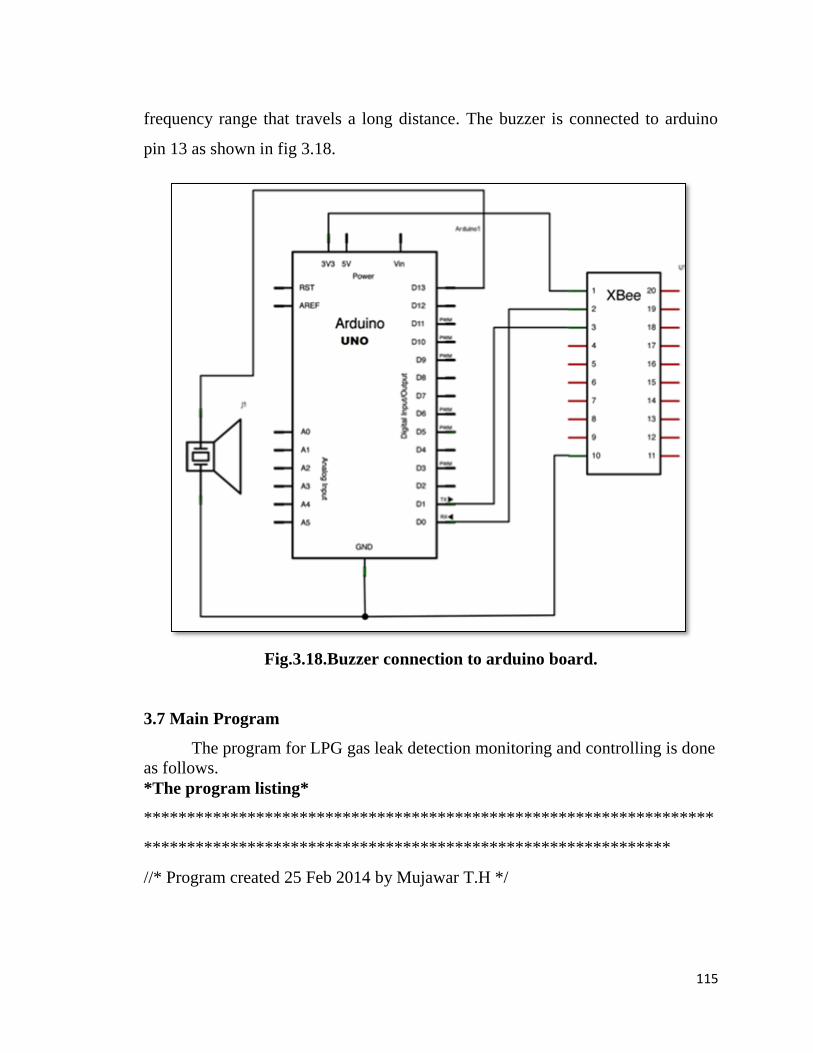
115
frequency range that travels a long distance. The buzzer is connected to arduino
pin 13 as shown in fig 3.18.
Fig.3.18.Buzzer connection to arduino board.
3.7 Main Program
The program for LPG gas leak detection monitoring and controlling is done
as follows.
*The program listing*
******************************************************************
*************************************************************
//* Program created 25 Feb 2014 by Mujawar T.H */
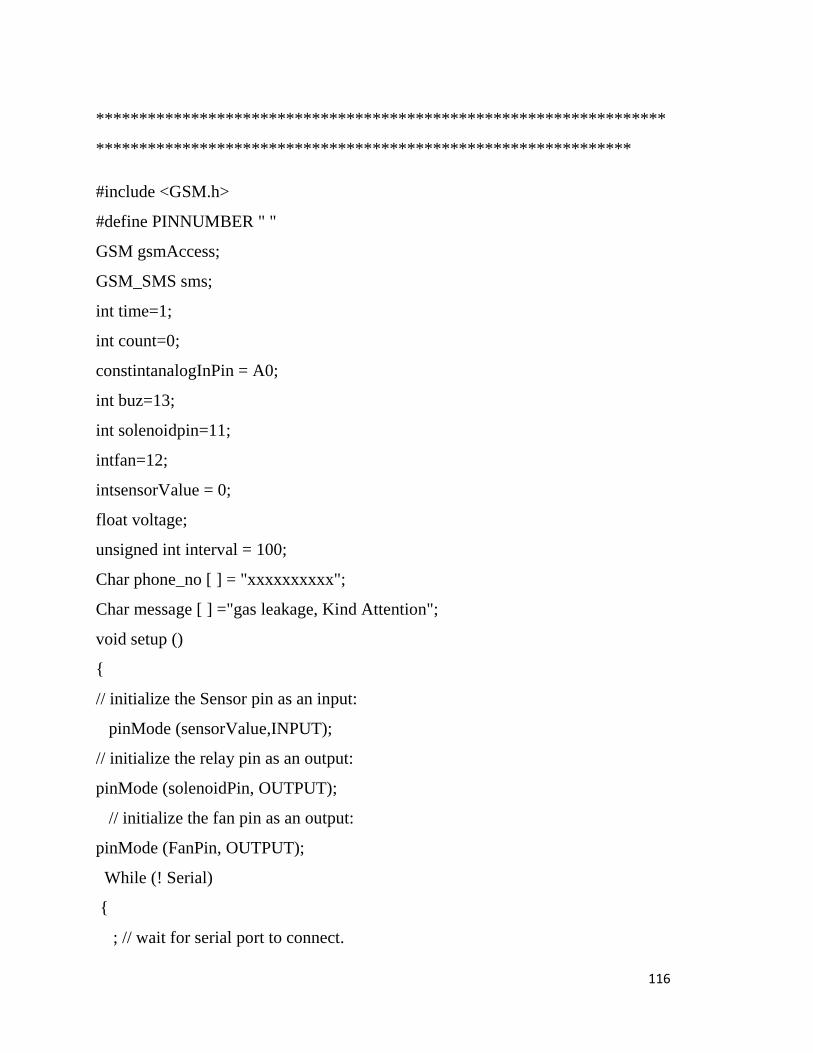
116
******************************************************************
**************************************************************
#include <GSM.h>
#define PINNUMBER " "
GSM gsmAccess;
GSM_SMS sms;
int time=1;
int count=0;
constintanalogInPin = A0;
int buz=13;
int solenoidpin=11;
intfan=12;
intsensorValue = 0;
float voltage;
unsigned int interval = 100;
Char phone_no [ ] = "xxxxxxxxxx";
Char message [ ] ="gas leakage, Kind Attention";
void setup ()
// initialize the Sensor pin as an input:
pinMode (sensorValue,INPUT);
// initialize the relay pin as an output:
pinMode (solenoidPin, OUTPUT);
// initialize the fan pin as an output:
pinMode (FanPin, OUTPUT);
While (! Serial)
; // wait for serial port to connect.
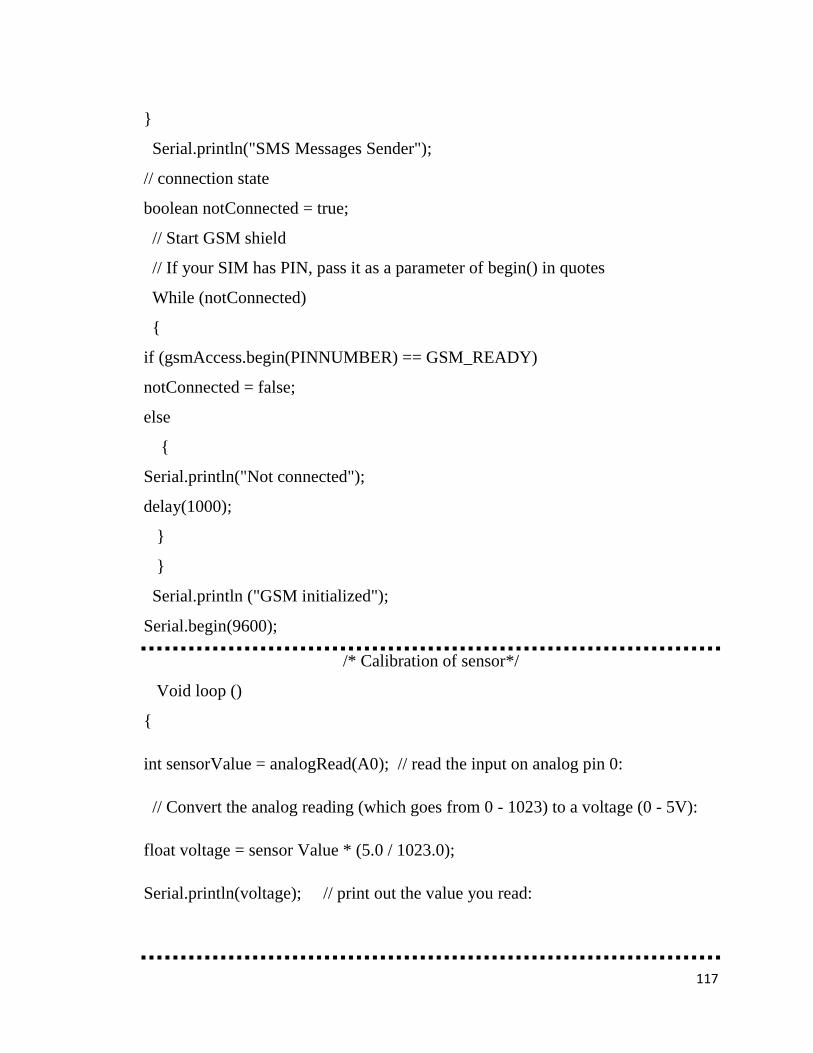
117
Serial.println("SMS Messages Sender");
// connection state
boolean notConnected = true;
// Start GSM shield
// If your SIM has PIN, pass it as a parameter of begin() in quotes
While (notConnected)
if (gsmAccess.begin(PINNUMBER) == GSM_READY)
notConnected = false;
else
Serial.println("Not connected");
delay(1000);
Serial.println ("GSM initialized");
Serial.begin(9600);
/* Calibration of sensor*/
Void loop ()
int sensorValue = analogRead(A0); // read the input on analog pin 0:
// Convert the analog reading (which goes from 0 - 1023) to a voltage (0 - 5V):
float voltage = sensor Value * (5.0 / 1023.0);
Serial.println(voltage); // print out the value you read:
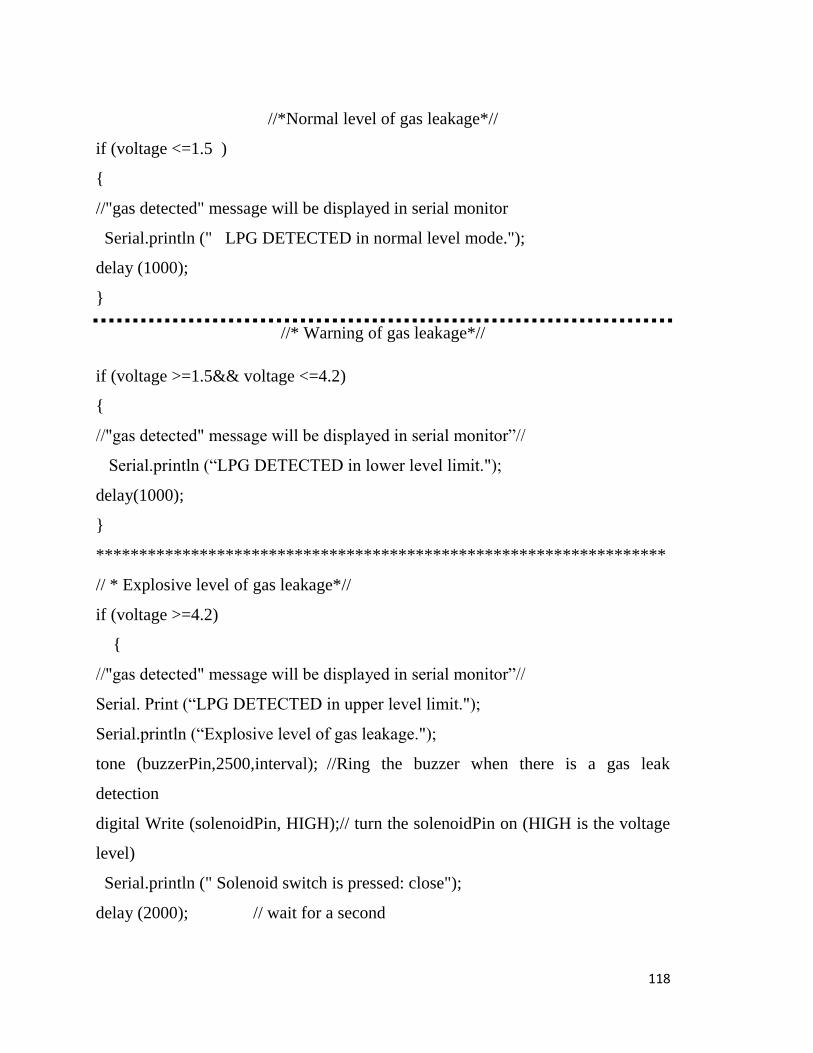
118
//*Normal level of gas leakage*//
if (voltage <=1.5 )
//"gas detected" message will be displayed in serial monitor
Serial.println (" LPG DETECTED in normal level mode.");
delay (1000);
//* Warning of gas leakage*//
if (voltage >=1.5&& voltage <=4.2)
//"gas detected" message will be displayed in serial monitor”//
Serial.println (“LPG DETECTED in lower level limit.");
delay(1000);
******************************************************************
// * Explosive level of gas leakage*//
if (voltage >=4.2)
//"gas detected" message will be displayed in serial monitor”//
Serial. Print (“LPG DETECTED in upper level limit.");
Serial.println (“Explosive level of gas leakage.");
tone (buzzerPin,2500,interval); //Ring the buzzer when there is a gas leak
detection
digital Write (solenoidPin, HIGH);// turn the solenoidPin on (HIGH is the voltage
level)
Serial.println (" Solenoid switch is pressed: close");
delay (2000); // wait for a second
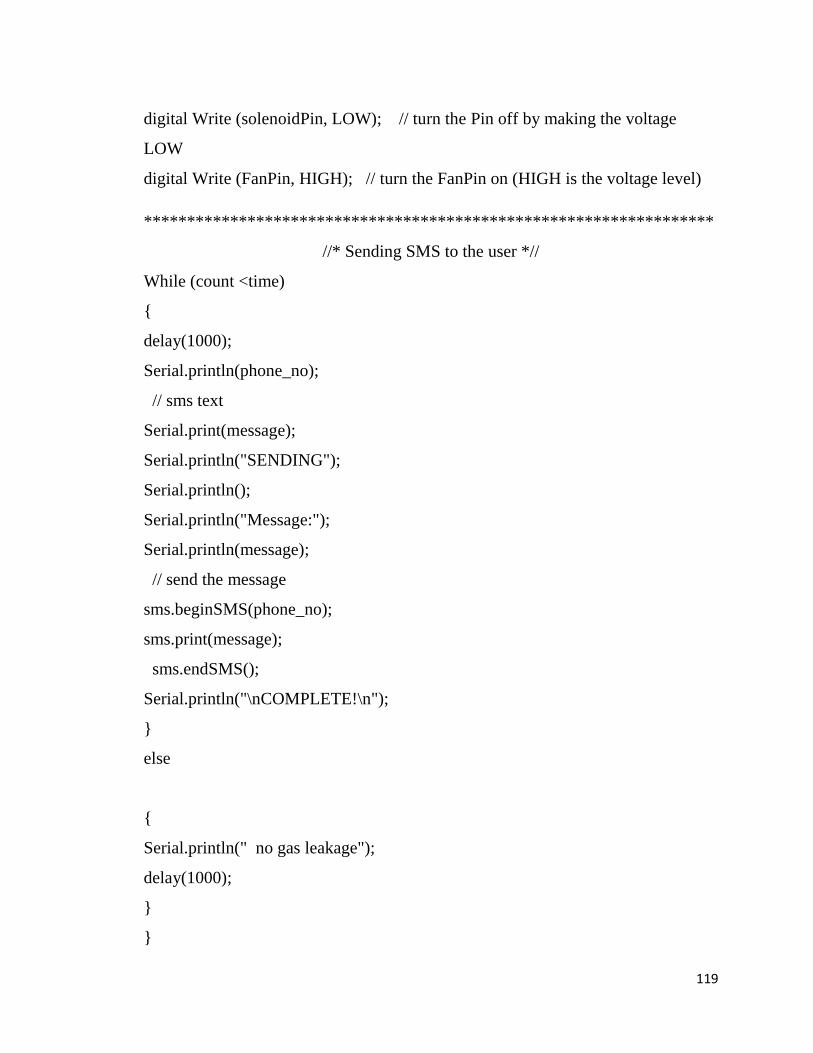
119
digital Write (solenoidPin, LOW); // turn the Pin off by making the voltage
LOW
digital Write (FanPin, HIGH); // turn the FanPin on (HIGH is the voltage level)
******************************************************************
//* Sending SMS to the user *//
While (count <time)
delay(1000);
Serial.println(phone_no);
// sms text
Serial.print(message);
Serial.println("SENDING");
Serial.println();
Serial.println("Message:");
Serial.println(message);
// send the message
sms.beginSMS(phone_no);
sms.print(message);
sms.endSMS();
Serial.println("\nCOMPLETE!\n");
else
Serial.println(" no gas leakage");
delay(1000);
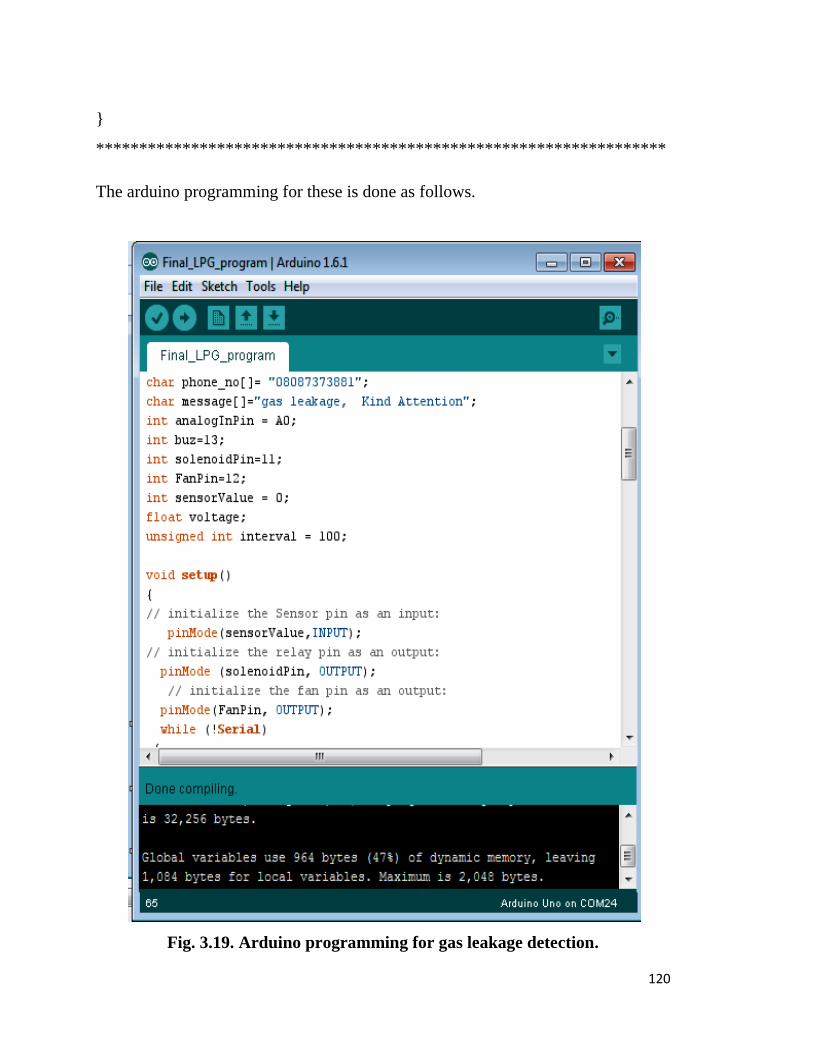
120
******************************************************************
The arduino programming for these is done as follows.
Fig. 3.19. Arduino programming for gas leakage detection.
121
References
1.Q. A. Al-Haija, "Toward Secure Non-Deterministic Distributed Wireless
Sensor Network Using Probabilistic Key Management Approaches", Journal of
Information Assurance and Security 6 (2011) 010-018.
2. G. Park, Y.Kim, J.Kwon, Y. Lee and H. Kim, “Development of the Gas Safety
Management System using an Intelligent Gasmeter with Wireless ZigBee
Network”, WASET, 40(2010) 186-188.
3.Rohani and H.R. Zarandi, “An analysis of Fault Effects and propagations in
AVR Microcontroller AT Mega 103(L)”, International conference on
Availability, Reliability and Security, 1(2009) 166-172.
4. H.Will, K. Schleiser and J. Schiller, “A Real-Time Kernel for Wireless Sensor
Networks Employed in Rescue Scenarios”, 4th IEEE International Workshop on
(SenseApp- 2009),October 20-23.
5. O. Chipara, C. Lu, G. Roman, “Real-time Query Scheduling forWireless
Sensor Networks”,Proceedings of IEEE Explorer, Real time systems
symposium,2007, 28th IEEE international conference, 1-11.
6. http:// link.springer.com/chapter/10. 1007/978-/ -4020-9436-1-2
7. V. Zivojnovic and H.Meyr, “Compiled HW/SW co-simulation”, 33rd
conference on annual design automation, 690-695.
8. M.Dolinskey, “High-level design of embedded hardware-software systems”,
Advances in Engineering Software, 31(2000) 197-201.
9. C. Elliott, V. Vijayakumar, W. Zink, and R. Hansen, “National Instrument
LabVIEW: A programming environment for laboratory automation and
measurement, the association for Laboratory Automation”, 2007.
10. Bitter, Rick, T. Mohiuddin and M. Narocki “LabVIEW Advanced
Programming Techniques “Boca Raton: CRC Press LLC, 2001
11. LabVIEW User Manual, April 2003 Edition, National Instruments
12. http://www.ni.com/labview/

122
13. M.Schell, M.G.Guvench, “Development of a general purpose XBee series-2
API-mode communication library for LabVIEW”, Northeast section
Conference (ASEE-2012), April 27-28. PP. 1-8.
14. J.R.Silva, F.C. Delicato, “PRISMA: A Publish Subscribe and Resource
Oriented Middleware for Wireless Sensor Network”, 10th international
conference on (AICT-2014), pp.87-97.
15. A.Shrivastava, R.Prabhaker, R.Kumar and R.Verma, “GSM Based Gas
Leakage Detecton System”, International Journal of Emerging Trends in
Electrical and Electronics, 3(2013) 4-11.
16. C.Sasikumar, D.Manivannan,” Gas Leakage Detection and Monitoring
Based on Low Power Microcontroller and XBee” International Journal of
Engineering and Technology (IJET), 5(2013) 58-62.
17.http://www.engineersgarage.com/contribution/microcontroller-based-lpg-gas-
detector-using-gsm-module.
18. L. Fraiwan, K. Lweesy, B. Salma, A.Mani, “A wireless home safety gas
leakage detection system”, Proc. of 1st Middle East, Conference on
(BE -2011), pp.11-14.
19. J. Zhang, G. Song “Design of a Wireless Sensor Network based Monitoring
System for Home Automation” 2011 International Conference on Future
Computer Sciences and Application.
20. Y. Li, J.Maorong, “Design of Home Automation System based on ZigBee
Wireless Sensor Network” The 1st International Conference on Information
Science and Engineering (ICISE2009).
21. S.Rajitha, T.Swapna,Electronics and Communication Engineering, AP, India
in September-October 2012.
22. T. Murugan, A. Periasamy and S. Muruganand, “Embedded Based Industrial
temperature monitoring system using GSM”, International Journal of computer
application, Nov. 2012.
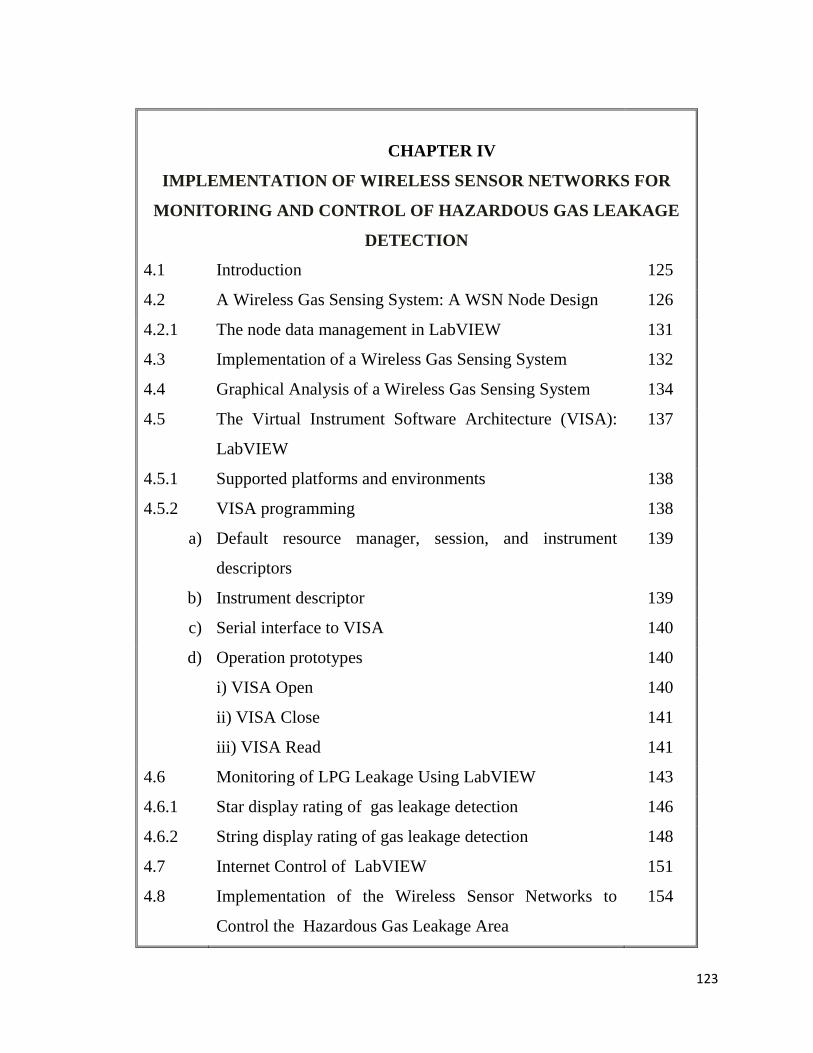
123
CHAPTER IV
IMPLEMENTATION OF WIRELESS SENSOR NETWORKS FOR
MONITORING AND CONTROL OF HAZARDOUS GAS LEAKAGE
DETECTION
4.1 Introduction 125
4.2 A Wireless Gas Sensing System: A WSN Node Design 126
4.2.1 The node data management in LabVIEW 131
4.3 Implementation of a Wireless Gas Sensing System 132
4.4 Graphical Analysis of a Wireless Gas Sensing System 134
4.5 The Virtual Instrument Software Architecture (VISA):
LabVIEW
137
4.5.1 Supported platforms and environments 138
4.5.2 VISA programming 138
a) Default resource manager, session, and instrument
descriptors
139
b) Instrument descriptor 139
c) Serial interface to VISA 140
d) Operation prototypes 140
i) VISA Open 140
ii) VISA Close 141
iii) VISA Read 141
4.6 Monitoring of LPG Leakage Using LabVIEW 143
4.6.1 Star display rating of gas leakage detection 146
4.6.2 String display rating of gas leakage detection 148
4.7 Internet Control of LabVIEW 151
4.8 Implementation of the Wireless Sensor Networks to
Control the Hazardous Gas Leakage Area
154
124
4.9
The Control Unit Circuit Diagram
155
4.9.1 Control using solenoid valve 156
a)
Specifications
157
b) Solenoid valve drive circuit 157
c) Flowchart for the control algorithm 160
d) Control using exhaust fan 161
4.10 Testing and Results 162
4.11 Conclusions 162
References 163
125
CHAPTER IV
IMPLEMENTATION OF WIRELESS SENSOR NETWORKS TO
MONITORING AND CONTROL OF HAZARDOUS GAS LEAKAGE
DETECTION
4.1 Introduction
Wireless networking and distributed data processing of the embedded
sensing / actuating nodes under tight energy constraints demand new approaches
to the protocol design and hardware / software integration. The wireless sensor
network (WSN), is emerging as a powerful platform for distributed embedded
computing and data management [1-4]. It therefore, plays a vital role for real time
applications. Since the last decade, significant research covering the areas such as
routing and Medium Access Control protocols, sensor device designs,
implementation, energy management, operating systems, simulation, security,
localization, deployment etc is underway in the field of WSN [5-7]. Moreover,
sensor networks share a number of challenges such as energy constraints and
routing. Compared to the use of a few expensive (but highly accurate) sensors, the
strategy of deploying a large number of inexpensive sensors has significant
advantages, at smaller or comparable total system cost, much higher spatial
resolution, higher robustness against failures through distributed operation,
uniform coverage, small obtrusiveness, ease of deployment, reduced energy
consumption, and consequently increased system lifetime. The main aim of the
wireless sensor network is to collect data from densely deployed WSN nodes in
the homogeneous or heterogeneous way [8-9].As the sensor nodes are battery
operated, rendering energy must be wisely managed in order to extend the lifetime
of the network. Therefore, during implementation, the use of energy efficient
protocol must be considered [10-12]. The sensor node is designed to detect the
leakage of the gas. Thus, the response of the gas leakage detection can be obtained
immediately and managed to obtain data from a scene of accident and display it in
126
the monitoring system. The present system uses a LabVIEW tool to monitor the
leakage of gases. Also, GUI created using LabVIEW tool is more interactive,
facile and effective. The chapter also deals with the complete implementation of
WSN nodes and monitoring of the wireless gas sensing system.
4.2 A Wireless Gas Sensing System: A WSN Node Design
The Wireless Sensor Nodes, by designing both hardware and
firmware and calibration are ready for establishment. Moreover, the co-ordinator
node was also designed and made available for the system. The system was
implemented with a star network topology consisting of five nodes. Four nodes
were used for the detection of gas leakage and one node was used as a co-
ordinator node to alert the users by sending SMS on their mobile phone. The data
acquired from rest of the nodes (except the co-ordinator) were transmitted
wirelessly using ZigBee protocol to the co-ordinator node and was kept on the
web server for accessing the data through internet from anywhere. The WSN
nodes were termed as the sensor node 1, sensor node 2, sensor node 3, sensor node
4 and a co-ordinator node. The hardware design modules designed using various
hardware components are presented in figures 4.2, 4.3, 4.4 and 4.5, which show
the hardware modules developed for the wireless gas sensing system. The PCB
design and its layouts for WSN nodes are shown in fig.4.1 (a, b).
The wireless sensor node for LPG gas detection and monitoring is
implemented in this thesis based on an arduino nano microcontroller that utilizes
XBee S2 protocol to create sensing phenomena. Thus implementing a WSN
model, we study some design factors that affect the system design. Although the
design of sensor nodes differs from application- to- application, the basic structure
is similar. The architecture of sensor node consists of a processing unit which is
responsible for collection and processing the data sensed by a sensor. A radio
transceiver works as the communication unit among sensors and a battery is the
power supply unit in this system.
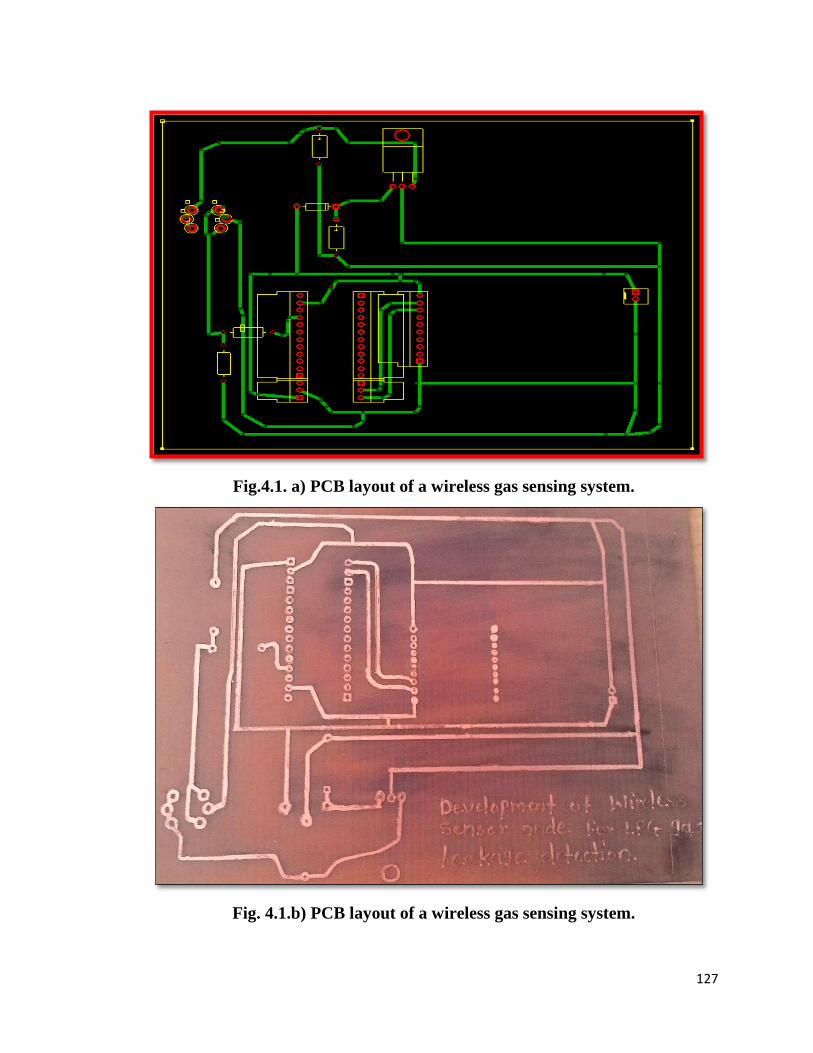
127
Fig.4.1. a) PCB layout of a wireless gas sensing system.
Fig. 4.1.b) PCB layout of a wireless gas sensing system.
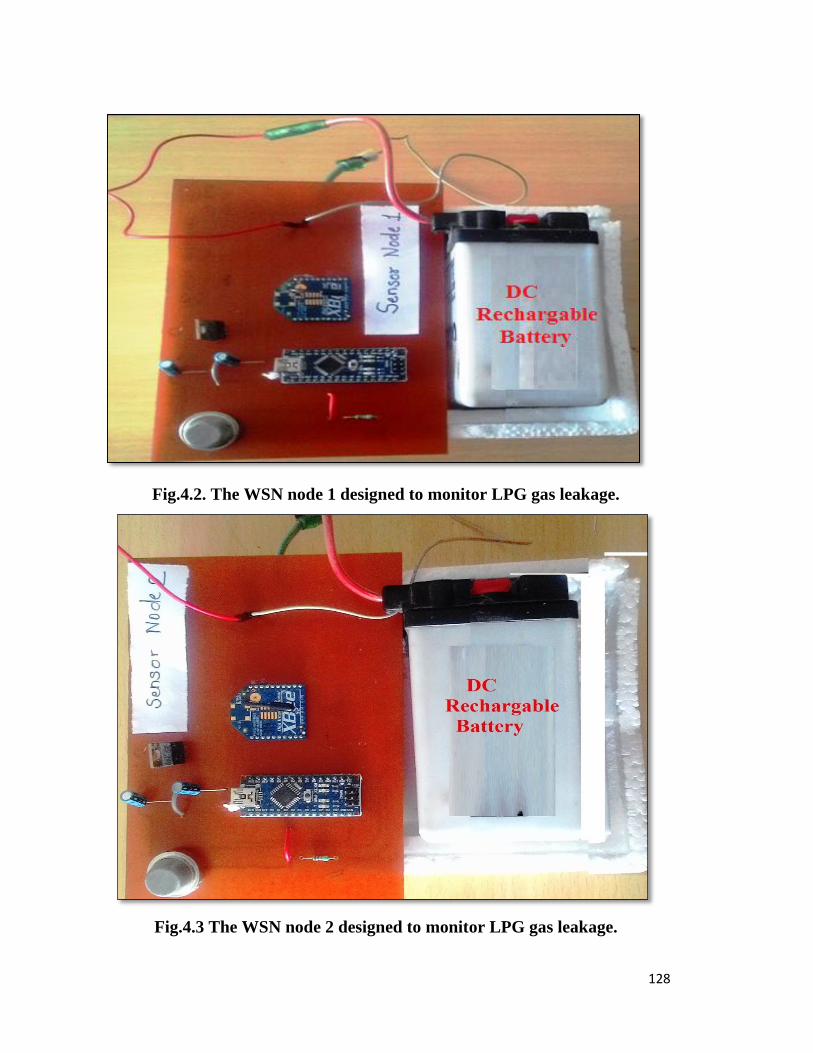
128
Fig.4.2. The WSN node 1 designed to monitor LPG gas leakage.
Fig.4.3 The WSN node 2 designed to monitor LPG gas leakage.
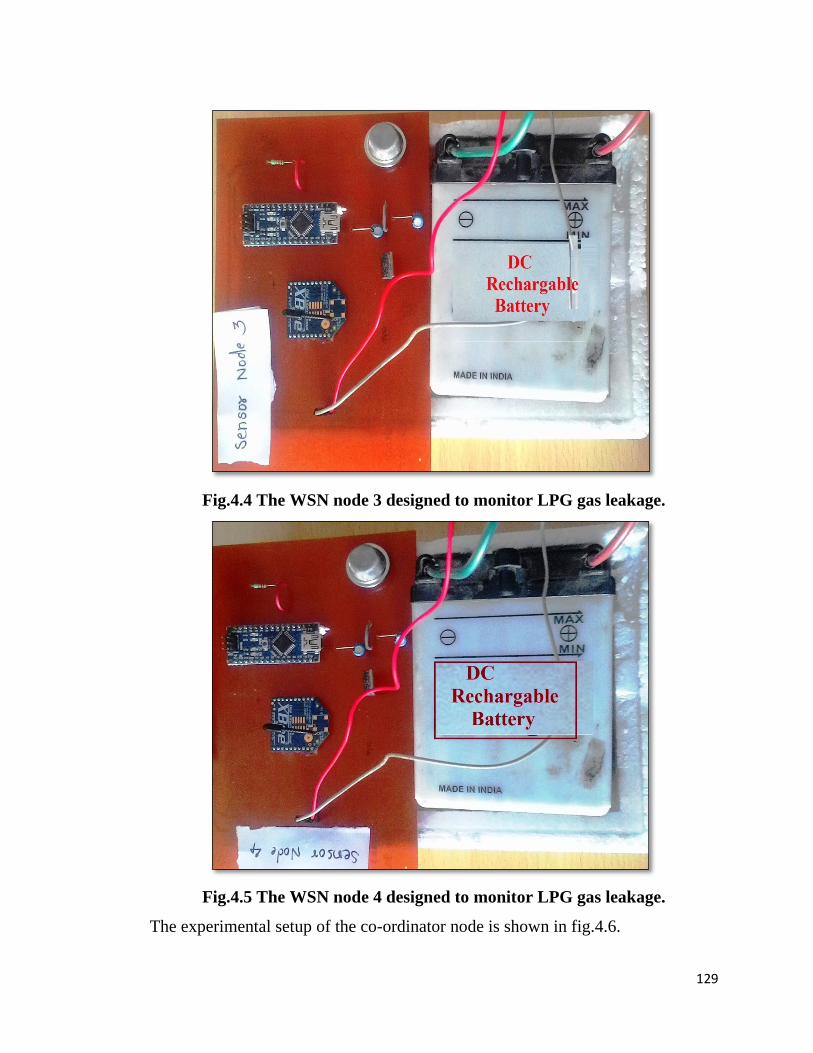
129
Fig.4.4 The WSN node 3 designed to monitor LPG gas leakage.
Fig.4.5 The WSN node 4 designed to monitor LPG gas leakage.
The experimental setup of the co-ordinator node is shown in fig.4.6.
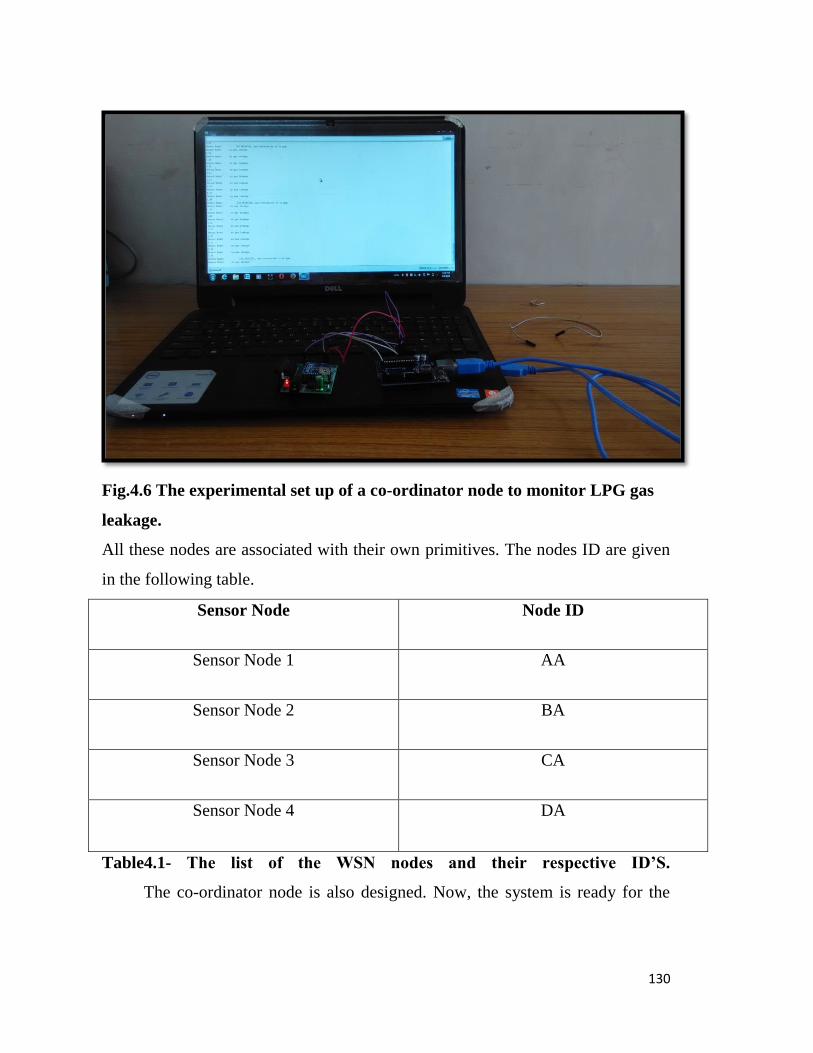
130
Fig.4.6 The experimental set up of a co-ordinator node to monitor LPG gas
leakage.
All these nodes are associated with their own primitives. The nodes ID are given
in the following table.
Sensor Node Node ID
Sensor Node 1 AA
Sensor Node 2 BA
Sensor Node 3 CA
Sensor Node 4 DA
Table4.1- The list of the WSN nodes and their respective ID’S.
The co-ordinator node is also designed. Now, the system is ready for the
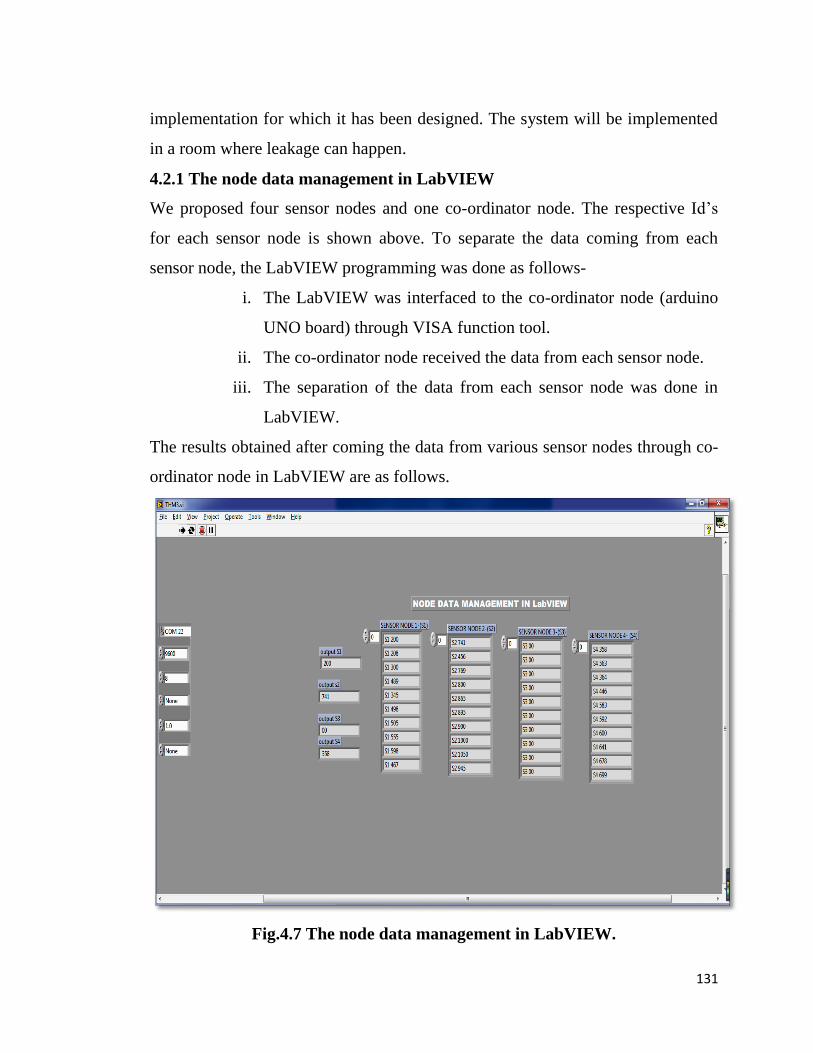
131
implementation for which it has been designed. The system will be implemented
in a room where leakage can happen.
4.2.1 The node data management in LabVIEW
We proposed four sensor nodes and one co-ordinator node. The respective Id’s
for each sensor node is shown above. To separate the data coming from each
sensor node, the LabVIEW programming was done as follows-
i. The LabVIEW was interfaced to the co-ordinator node (arduino
UNO board) through VISA function tool.
ii. The co-ordinator node received the data from each sensor node.
iii. The separation of the data from each sensor node was done in
LabVIEW.
The results obtained after coming the data from various sensor nodes through co-
ordinator node in LabVIEW are as follows.
Fig.4.7 The node data management in LabVIEW.
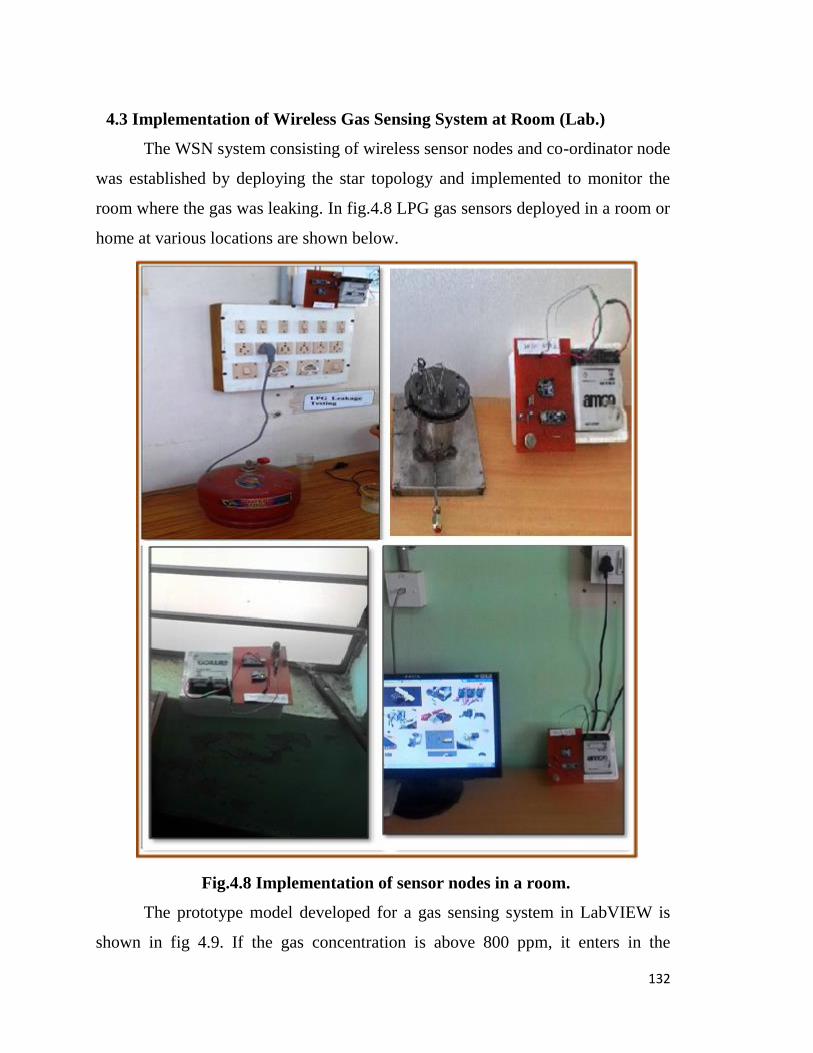
132
4.3 Implementation of Wireless Gas Sensing System at Room (Lab.)
The WSN system consisting of wireless sensor nodes and co-ordinator node
was established by deploying the star topology and implemented to monitor the
room where the gas was leaking. In fig.4.8 LPG gas sensors deployed in a room or
home at various locations are shown below.
Fig.4.8 Implementation of sensor nodes in a room.
The prototype model developed for a gas sensing system in LabVIEW is
shown in fig 4.9. If the gas concentration is above 800 ppm, it enters in the
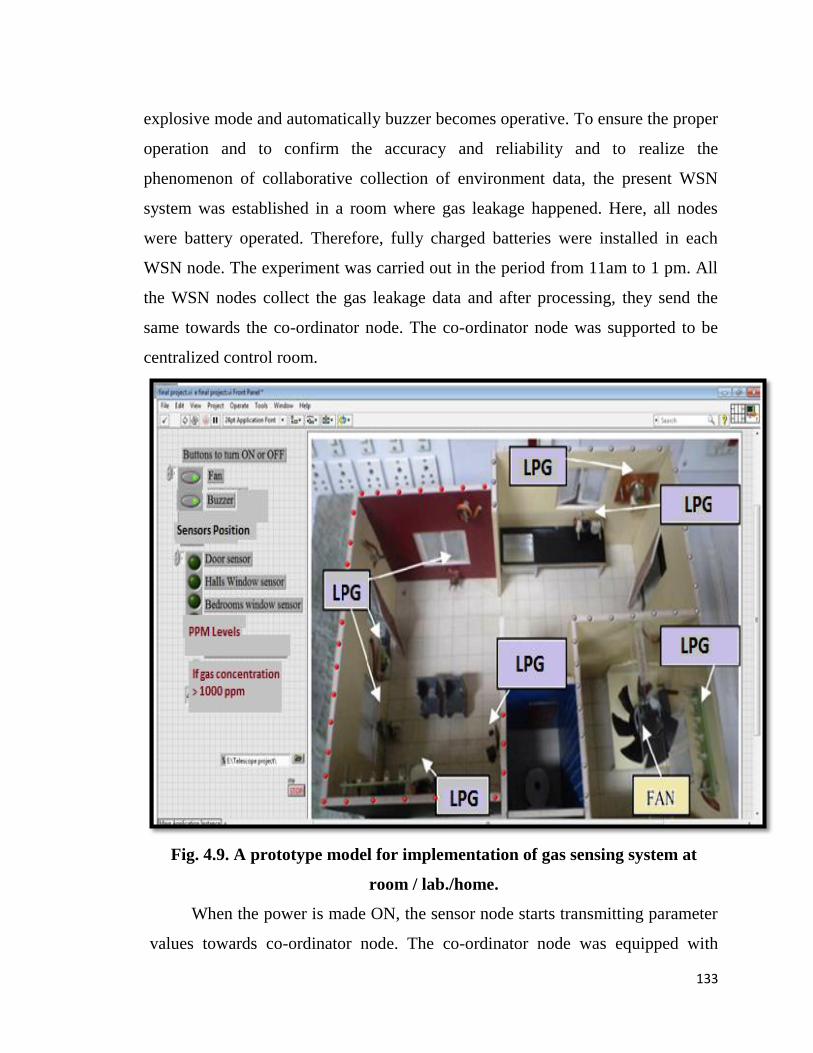
133
explosive mode and automatically buzzer becomes operative. To ensure the proper
operation and to confirm the accuracy and reliability and to realize the
phenomenon of collaborative collection of environment data, the present WSN
system was established in a room where gas leakage happened. Here, all nodes
were battery operated. Therefore, fully charged batteries were installed in each
WSN node. The experiment was carried out in the period from 11am to 1 pm. All
the WSN nodes collect the gas leakage data and after processing, they send the
same towards the co-ordinator node. The co-ordinator node was supported to be
centralized control room.
Fig. 4.9. A prototype model for implementation of gas sensing system at
room / lab./home.
When the power is made ON, the sensor node starts transmitting parameter
values towards co-ordinator node. The co-ordinator node was equipped with
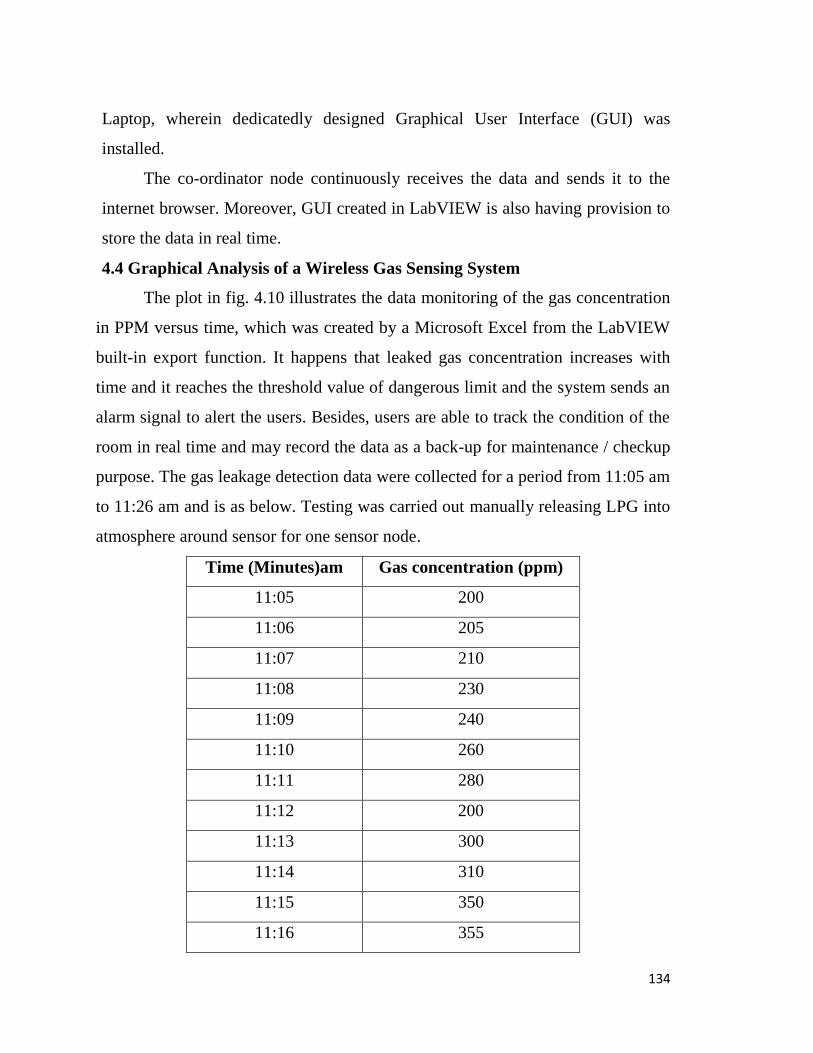
134
Laptop, wherein dedicatedly designed Graphical User Interface (GUI) was
installed.
The co-ordinator node continuously receives the data and sends it to the
internet browser. Moreover, GUI created in LabVIEW is also having provision to
store the data in real time.
4.4 Graphical Analysis of a Wireless Gas Sensing System
The plot in fig. 4.10 illustrates the data monitoring of the gas concentration
in PPM versus time, which was created by a Microsoft Excel from the LabVIEW
built-in export function. It happens that leaked gas concentration increases with
time and it reaches the threshold value of dangerous limit and the system sends an
alarm signal to alert the users. Besides, users are able to track the condition of the
room in real time and may record the data as a back-up for maintenance / checkup
purpose. The gas leakage detection data were collected for a period from 11:05 am
to 11:26 am and is as below. Testing was carried out manually releasing LPG into
atmosphere around sensor for one sensor node.
Time (Minutes)am Gas concentration (ppm)
11:05 200
11:06 205
11:07 210
11:08 230
11:09 240
11:10 260
11:11 280
11:12 200
11:13 300
11:14 310
11:15 350
11:16 355
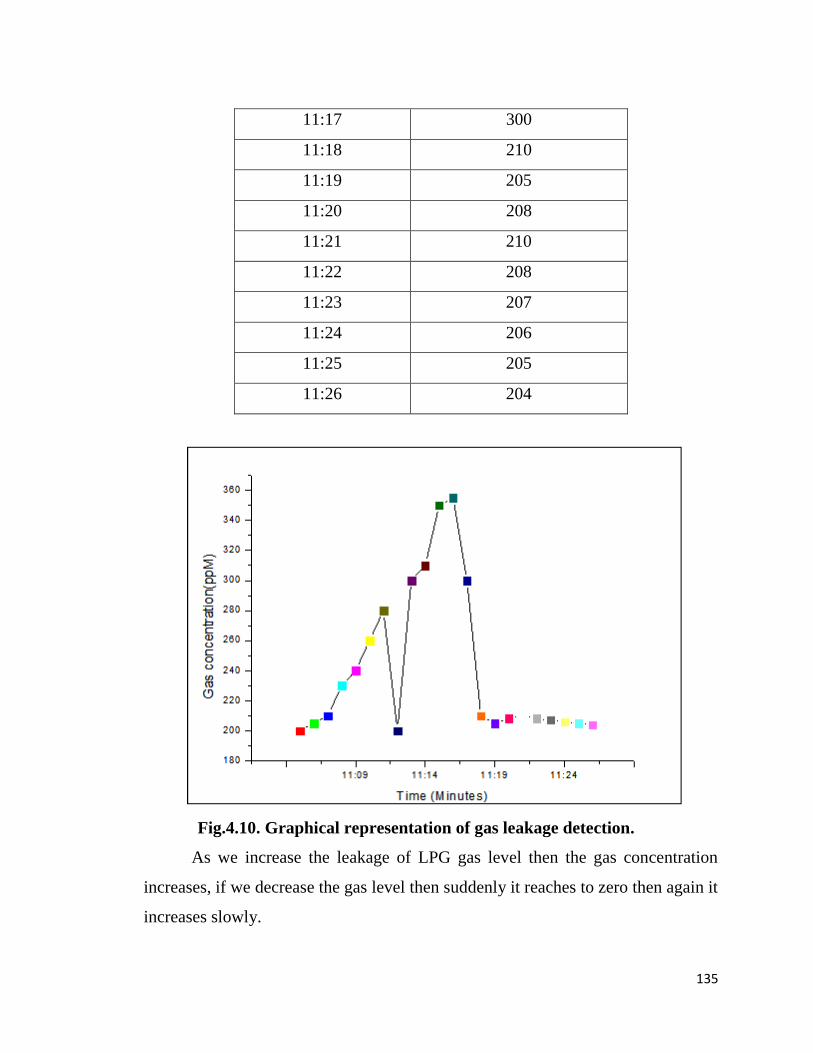
135
11:17 300
11:18 210
11:19 205
11:20 208
11:21 210
11:22 208
11:23 207
11:24 206
11:25 205
11:26 204
Fig.4.10. Graphical representation of gas leakage detection.
As we increase the leakage of LPG gas level then the gas concentration
increases, if we decrease the gas level then suddenly it reaches to zero then again it
increases slowly.
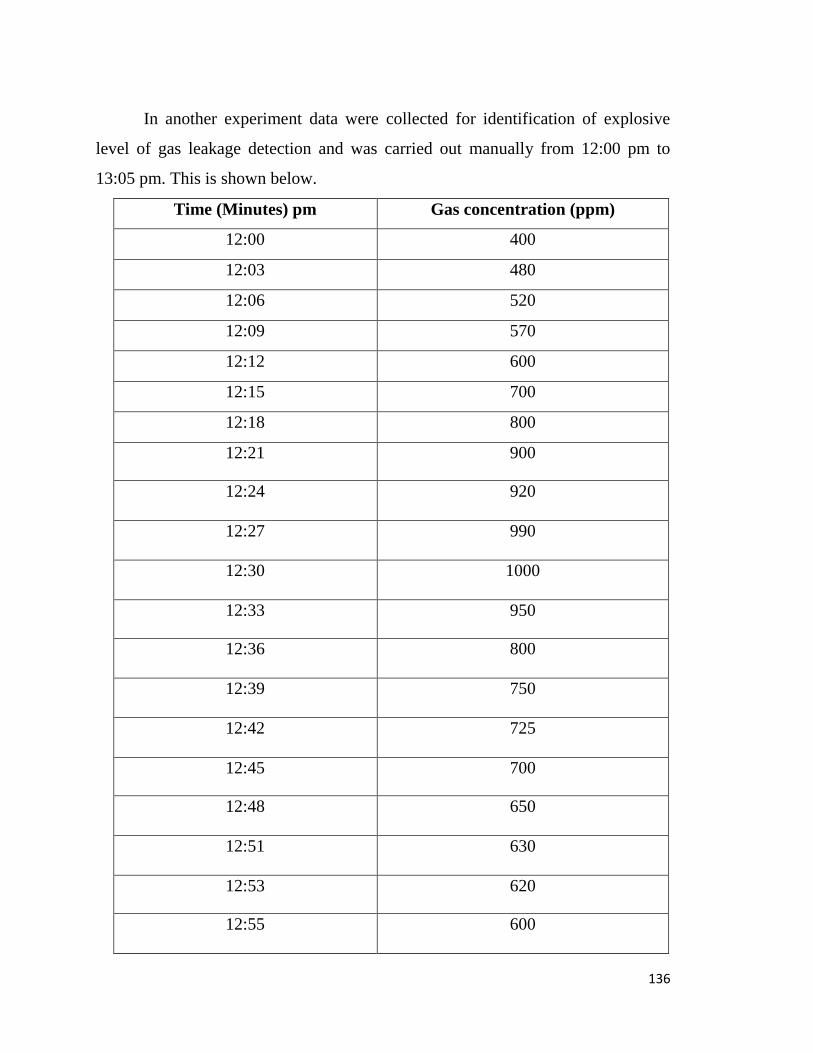
136
In another experiment data were collected for identification of explosive
level of gas leakage detection and was carried out manually from 12:00 pm to
13:05 pm. This is shown below.
Time (Minutes) pm Gas concentration (ppm)
12:00 400
12:03 480
12:06 520
12:09 570
12:12 600
12:15 700
12:18 800
12:21 900
12:24 920
12:27 990
12:30 1000
12:33 950
12:36 800
12:39 750
12:42 725
12:45 700
12:48 650
12:51 630
12:53 620
12:55 600
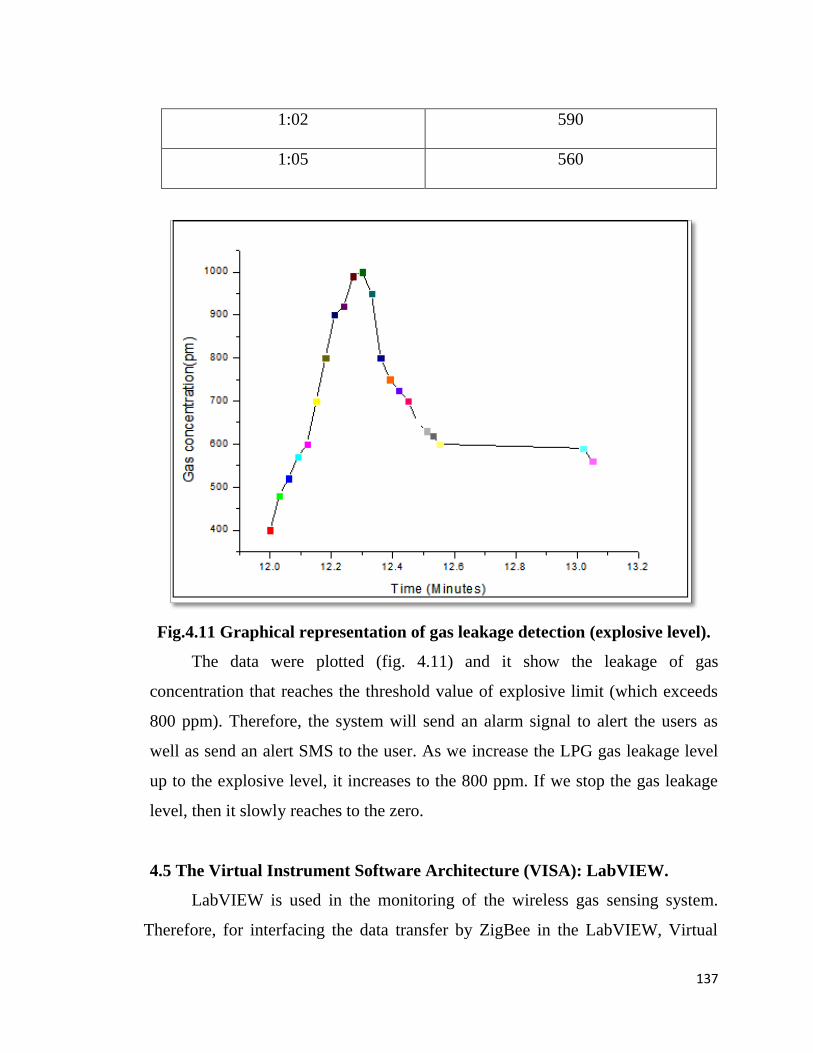
137
1:02 590
1:05 560
Fig.4.11 Graphical representation of gas leakage detection (explosive level).
The data were plotted (fig. 4.11) and it show the leakage of gas
concentration that reaches the threshold value of explosive limit (which exceeds
800 ppm). Therefore, the system will send an alarm signal to alert the users as
well as send an alert SMS to the user. As we increase the LPG gas leakage level
up to the explosive level, it increases to the 800 ppm. If we stop the gas leakage
level, then it slowly reaches to the zero.
4.5 The Virtual Instrument Software Architecture (VISA): LabVIEW.
LabVIEW is used in the monitoring of the wireless gas sensing system.
Therefore, for interfacing the data transfer by ZigBee in the LabVIEW, Virtual
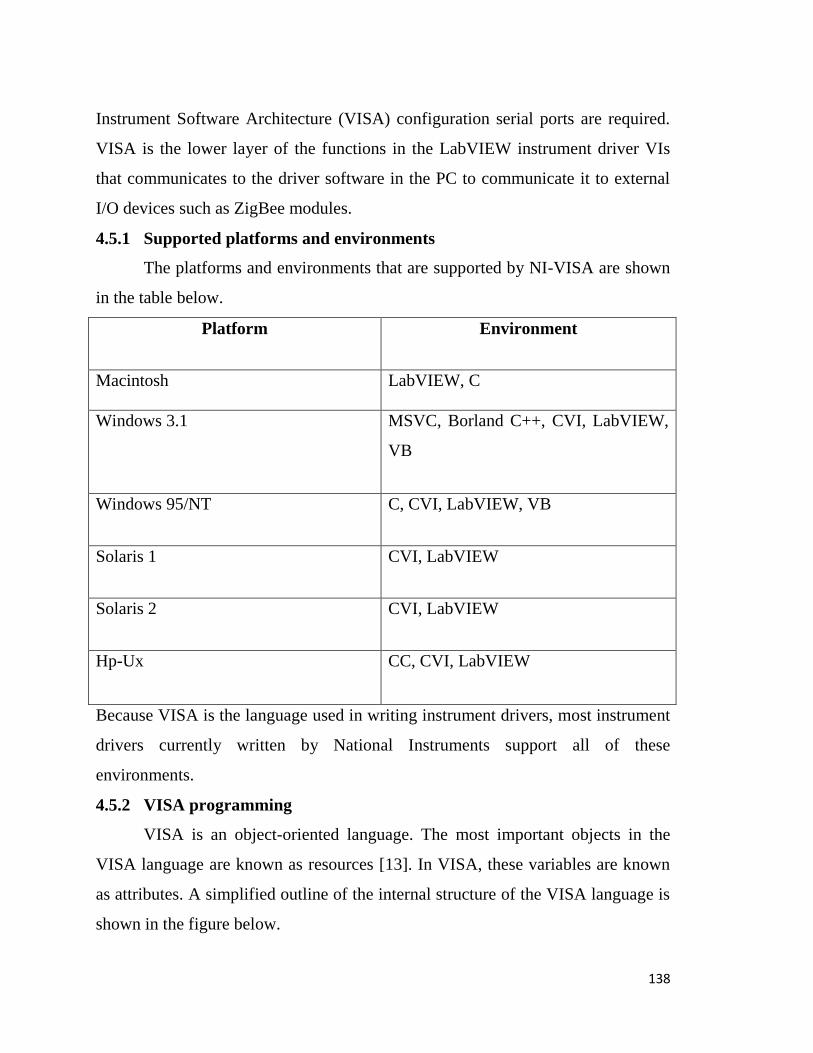
138
Instrument Software Architecture (VISA) configuration serial ports are required.
VISA is the lower layer of the functions in the LabVIEW instrument driver VIs
that communicates to the driver software in the PC to communicate it to external
I/O devices such as ZigBee modules.
4.5.1 Supported platforms and environments
The platforms and environments that are supported by NI-VISA are shown
in the table below.
Platform Environment
Macintosh LabVIEW, C
Windows 3.1 MSVC, Borland C++, CVI, LabVIEW,
VB
Windows 95/NT C, CVI, LabVIEW, VB
Solaris 1 CVI, LabVIEW
Solaris 2 CVI, LabVIEW
Hp-Ux CC, CVI, LabVIEW
Because VISA is the language used in writing instrument drivers, most instrument
drivers currently written by National Instruments support all of these
environments.
4.5.2 VISA programming
VISA is an object-oriented language. The most important objects in the
VISA language are known as resources [13]. In VISA, these variables are known
as attributes. A simplified outline of the internal structure of the VISA language is
shown in the figure below.
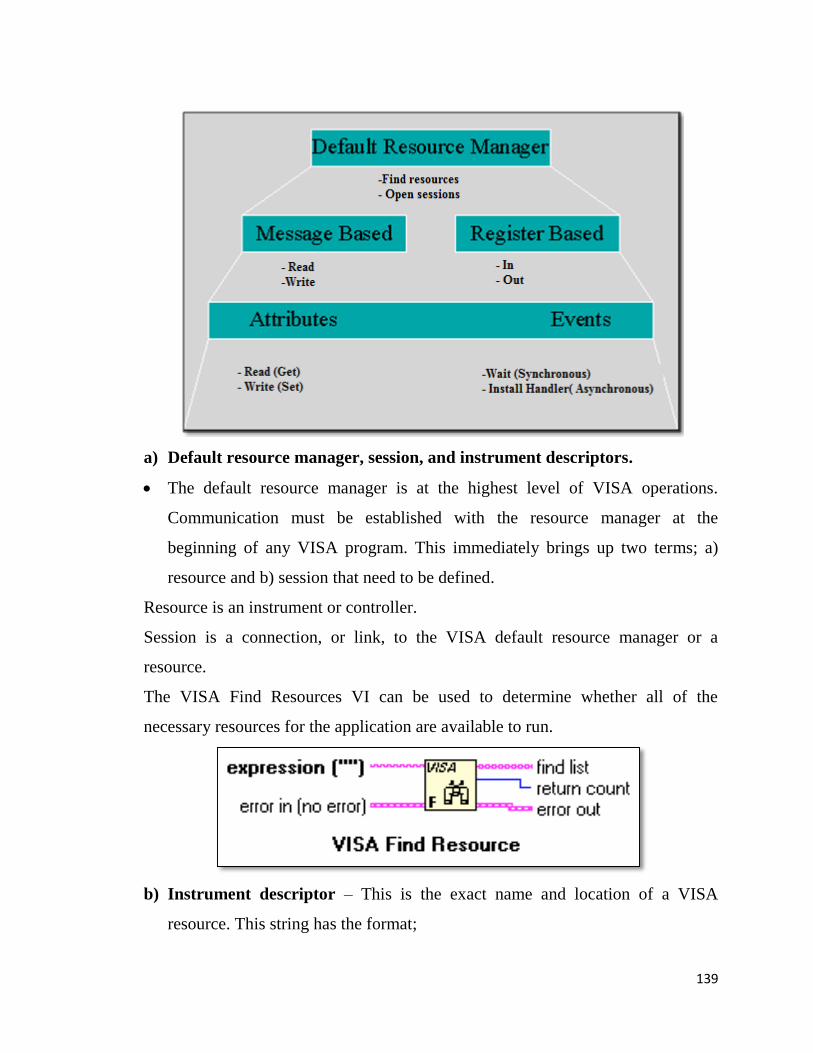
139
a) Default resource manager, session, and instrument descriptors.
The default resource manager is at the highest level of VISA operations.
Communication must be established with the resource manager at the
beginning of any VISA program. This immediately brings up two terms; a)
resource and b) session that need to be defined.
Resource is an instrument or controller.
Session is a connection, or link, to the VISA default resource manager or a
resource.
The VISA Find Resources VI can be used to determine whether all of the
necessary resources for the application are available to run.
b) Instrument descriptor – This is the exact name and location of a VISA
resource. This string has the format;
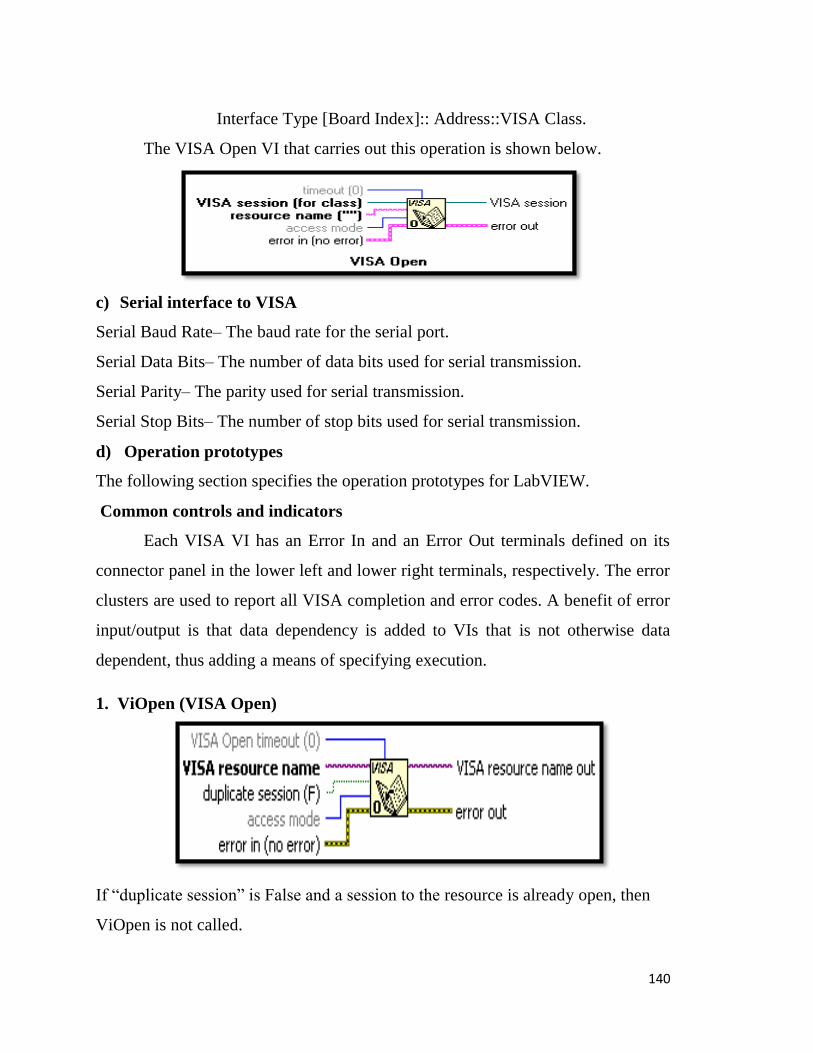
140
Interface Type [Board Index]:: Address::VISA Class.
The VISA Open VI that carries out this operation is shown below.
c) Serial interface to VISA
Serial Baud Rate– The baud rate for the serial port.
Serial Data Bits– The number of data bits used for serial transmission.
Serial Parity– The parity used for serial transmission.
Serial Stop Bits– The number of stop bits used for serial transmission.
d) Operation prototypes
The following section specifies the operation prototypes for LabVIEW.
Common controls and indicators
Each VISA VI has an Error In and an Error Out terminals defined on its
connector panel in the lower left and lower right terminals, respectively. The error
clusters are used to report all VISA completion and error codes. A benefit of error
input/output is that data dependency is added to VIs that is not otherwise data
dependent, thus adding a means of specifying execution.
1. ViOpen (VISA Open)
If “duplicate session” is False and a session to the resource is already open, then
ViOpen is not called.
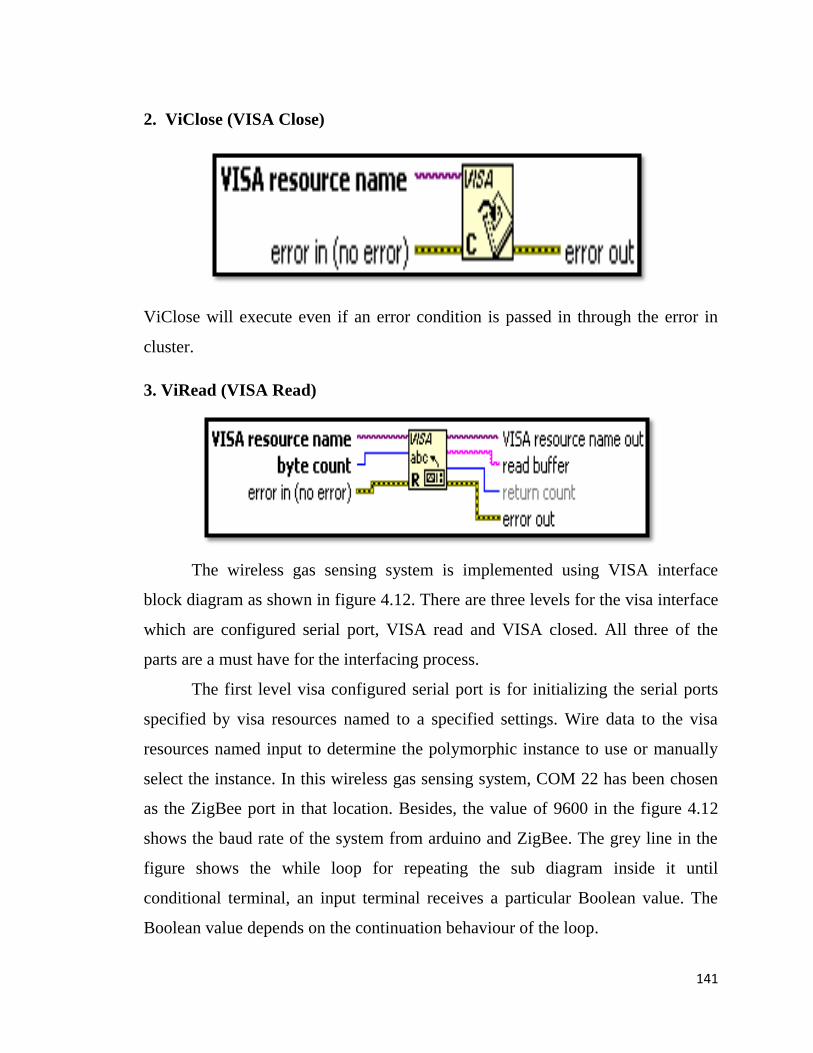
141
2. ViClose (VISA Close)
ViClose will execute even if an error condition is passed in through the error in
cluster.
3. ViRead (VISA Read)
The wireless gas sensing system is implemented using VISA interface
block diagram as shown in figure 4.12. There are three levels for the visa interface
which are configured serial port, VISA read and VISA closed. All three of the
parts are a must have for the interfacing process.
The first level visa configured serial port is for initializing the serial ports
specified by visa resources named to a specified settings. Wire data to the visa
resources named input to determine the polymorphic instance to use or manually
select the instance. In this wireless gas sensing system, COM 22 has been chosen
as the ZigBee port in that location. Besides, the value of 9600 in the figure 4.12
shows the baud rate of the system from arduino and ZigBee. The grey line in the
figure shows the while loop for repeating the sub diagram inside it until
conditional terminal, an input terminal receives a particular Boolean value. The
Boolean value depends on the continuation behaviour of the loop.
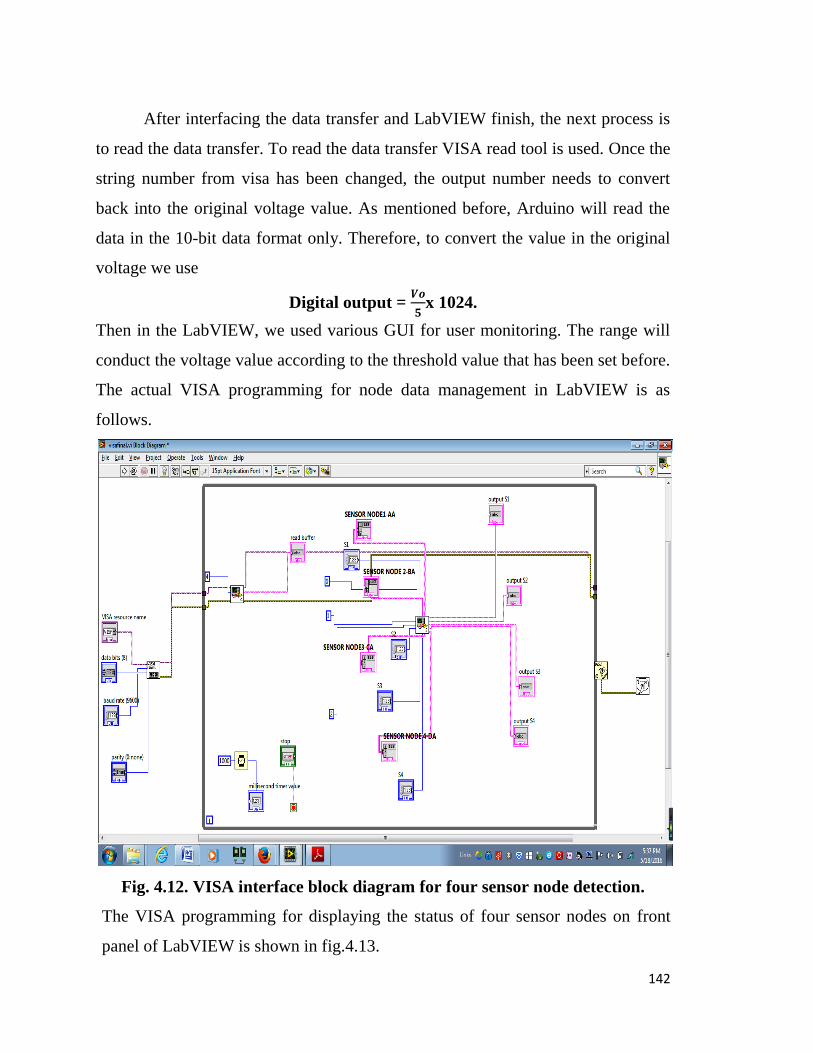
142
After interfacing the data transfer and LabVIEW finish, the next process is
to read the data transfer. To read the data transfer VISA read tool is used. Once the
string number from visa has been changed, the output number needs to convert
back into the original voltage value. As mentioned before, Arduino will read the
data in the 10-bit data format only. Therefore, to convert the value in the original
voltage we use
Digital output = 𝑽𝒐
𝟓x 1024.
Then in the LabVIEW, we used various GUI for user monitoring. The range will
conduct the voltage value according to the threshold value that has been set before.
The actual VISA programming for node data management in LabVIEW is as
follows.
Fig. 4.12. VISA interface block diagram for four sensor node detection.
The VISA programming for displaying the status of four sensor nodes on front
panel of LabVIEW is shown in fig.4.13.
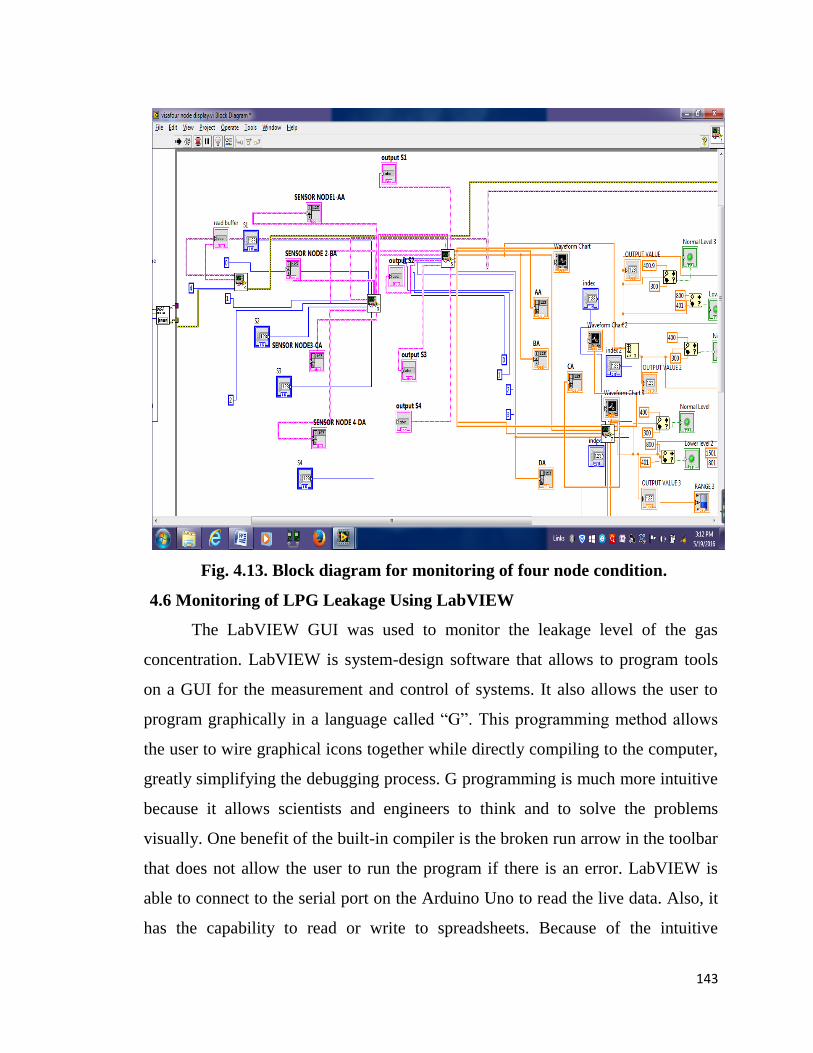
143
Fig. 4.13. Block diagram for monitoring of four node condition.
4.6 Monitoring of LPG Leakage Using LabVIEW
The LabVIEW GUI was used to monitor the leakage level of the gas
concentration. LabVIEW is system-design software that allows to program tools
on a GUI for the measurement and control of systems. It also allows the user to
program graphically in a language called “G”. This programming method allows
the user to wire graphical icons together while directly compiling to the computer,
greatly simplifying the debugging process. G programming is much more intuitive
because it allows scientists and engineers to think and to solve the problems
visually. One benefit of the built-in compiler is the broken run arrow in the toolbar
that does not allow the user to run the program if there is an error. LabVIEW is
able to connect to the serial port on the Arduino Uno to read the live data. Also, it
has the capability to read or write to spreadsheets. Because of the intuitive
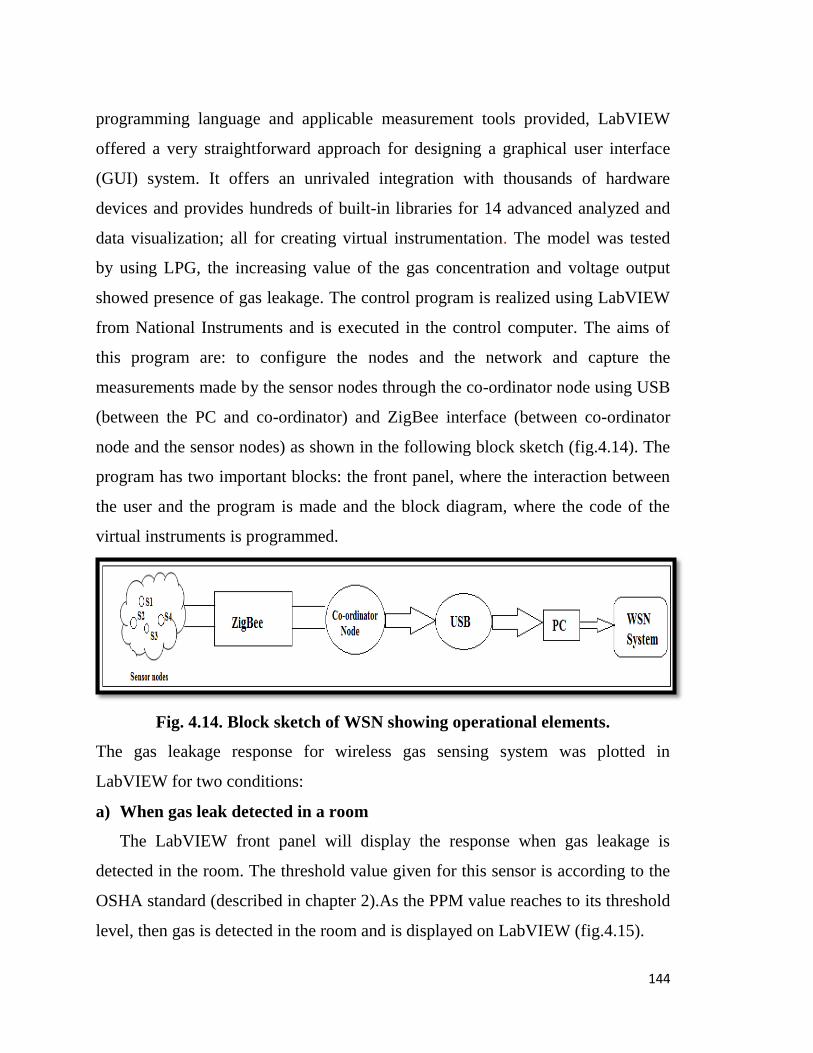
144
programming language and applicable measurement tools provided, LabVIEW
offered a very straightforward approach for designing a graphical user interface
(GUI) system. It offers an unrivaled integration with thousands of hardware
devices and provides hundreds of built-in libraries for 14 advanced analyzed and
data visualization; all for creating virtual instrumentation. The model was tested
by using LPG, the increasing value of the gas concentration and voltage output
showed presence of gas leakage. The control program is realized using LabVIEW
from National Instruments and is executed in the control computer. The aims of
this program are: to configure the nodes and the network and capture the
measurements made by the sensor nodes through the co-ordinator node using USB
(between the PC and co-ordinator) and ZigBee interface (between co-ordinator
node and the sensor nodes) as shown in the following block sketch (fig.4.14). The
program has two important blocks: the front panel, where the interaction between
the user and the program is made and the block diagram, where the code of the
virtual instruments is programmed.
Fig. 4.14. Block sketch of WSN showing operational elements.
The gas leakage response for wireless gas sensing system was plotted in
LabVIEW for two conditions:
a) When gas leak detected in a room
The LabVIEW front panel will display the response when gas leakage is
detected in the room. The threshold value given for this sensor is according to the
OSHA standard (described in chapter 2).As the PPM value reaches to its threshold
level, then gas is detected in the room and is displayed on LabVIEW (fig.4.15).
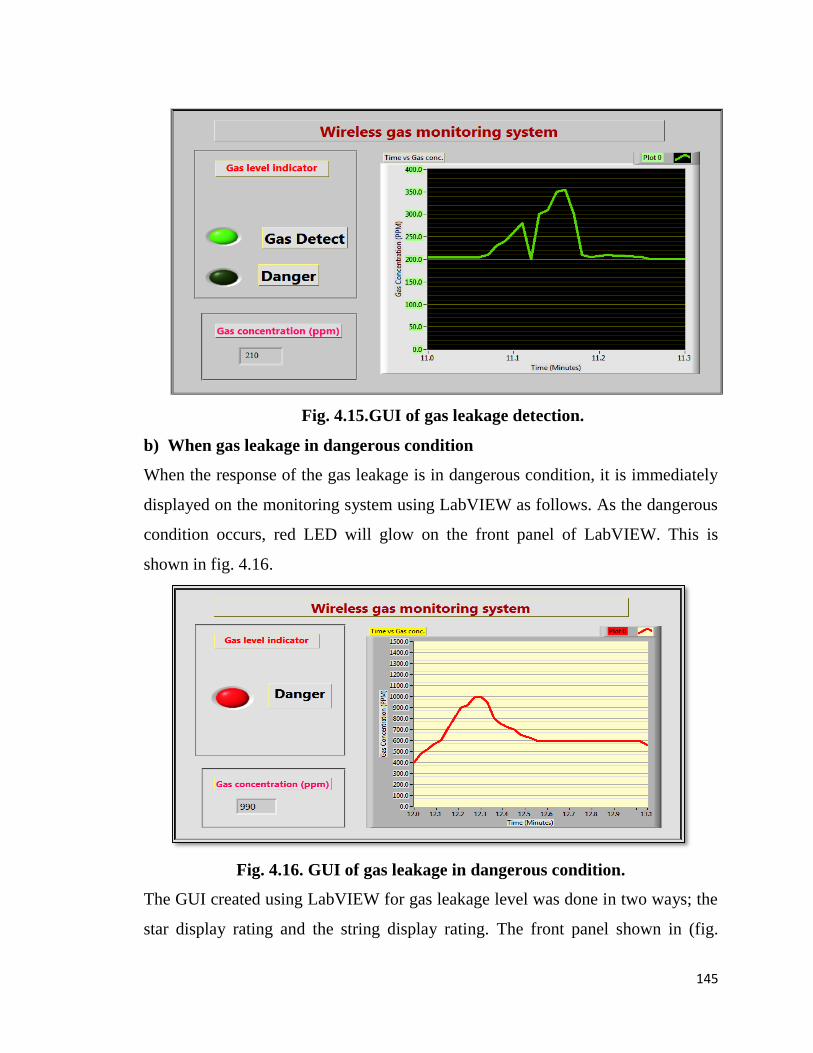
145
Fig. 4.15.GUI of gas leakage detection.
b) When gas leakage in dangerous condition
When the response of the gas leakage is in dangerous condition, it is immediately
displayed on the monitoring system using LabVIEW as follows. As the dangerous
condition occurs, red LED will glow on the front panel of LabVIEW. This is
shown in fig. 4.16.
Fig. 4.16. GUI of gas leakage in dangerous condition.
The GUI created using LabVIEW for gas leakage level was done in two ways; the
star display rating and the string display rating. The front panel shown in (fig.
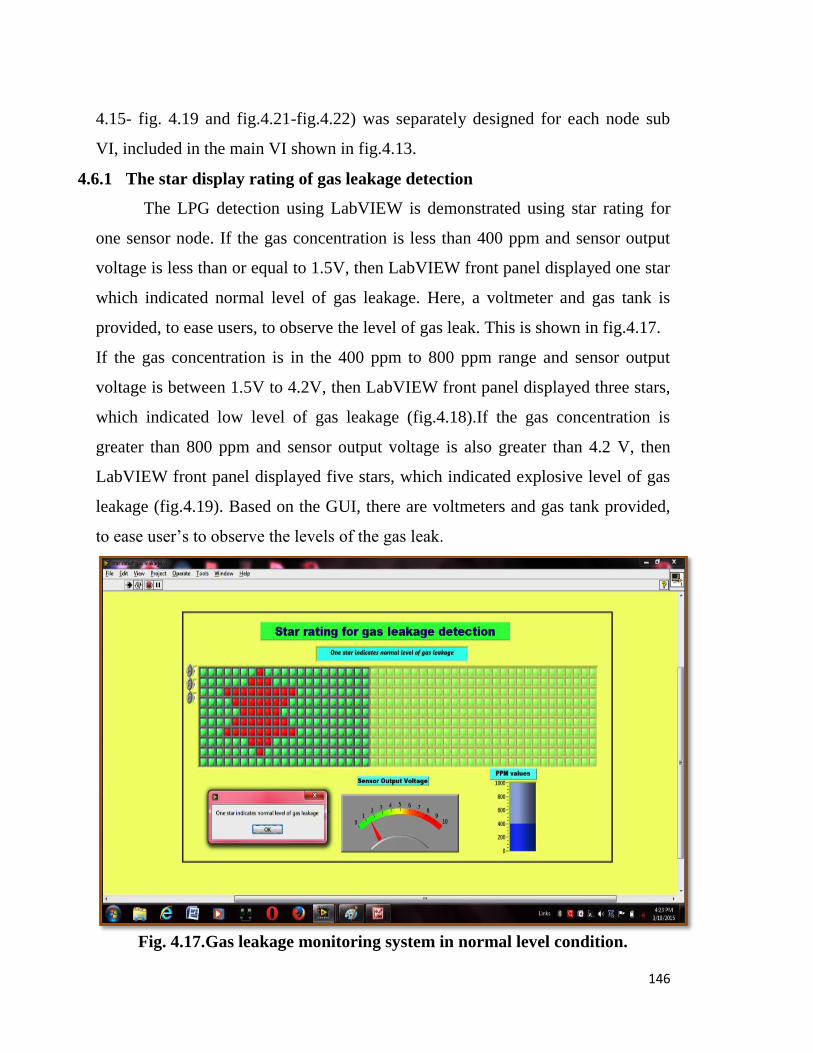
146
4.15- fig. 4.19 and fig.4.21-fig.4.22) was separately designed for each node sub
VI, included in the main VI shown in fig.4.13.
4.6.1 The star display rating of gas leakage detection
The LPG detection using LabVIEW is demonstrated using star rating for
one sensor node. If the gas concentration is less than 400 ppm and sensor output
voltage is less than or equal to 1.5V, then LabVIEW front panel displayed one star
which indicated normal level of gas leakage. Here, a voltmeter and gas tank is
provided, to ease users, to observe the level of gas leak. This is shown in fig.4.17.
If the gas concentration is in the 400 ppm to 800 ppm range and sensor output
voltage is between 1.5V to 4.2V, then LabVIEW front panel displayed three stars,
which indicated low level of gas leakage (fig.4.18).If the gas concentration is
greater than 800 ppm and sensor output voltage is also greater than 4.2 V, then
LabVIEW front panel displayed five stars, which indicated explosive level of gas
leakage (fig.4.19). Based on the GUI, there are voltmeters and gas tank provided,
to ease user’s to observe the levels of the gas leak.
Fig. 4.17.Gas leakage monitoring system in normal level condition.
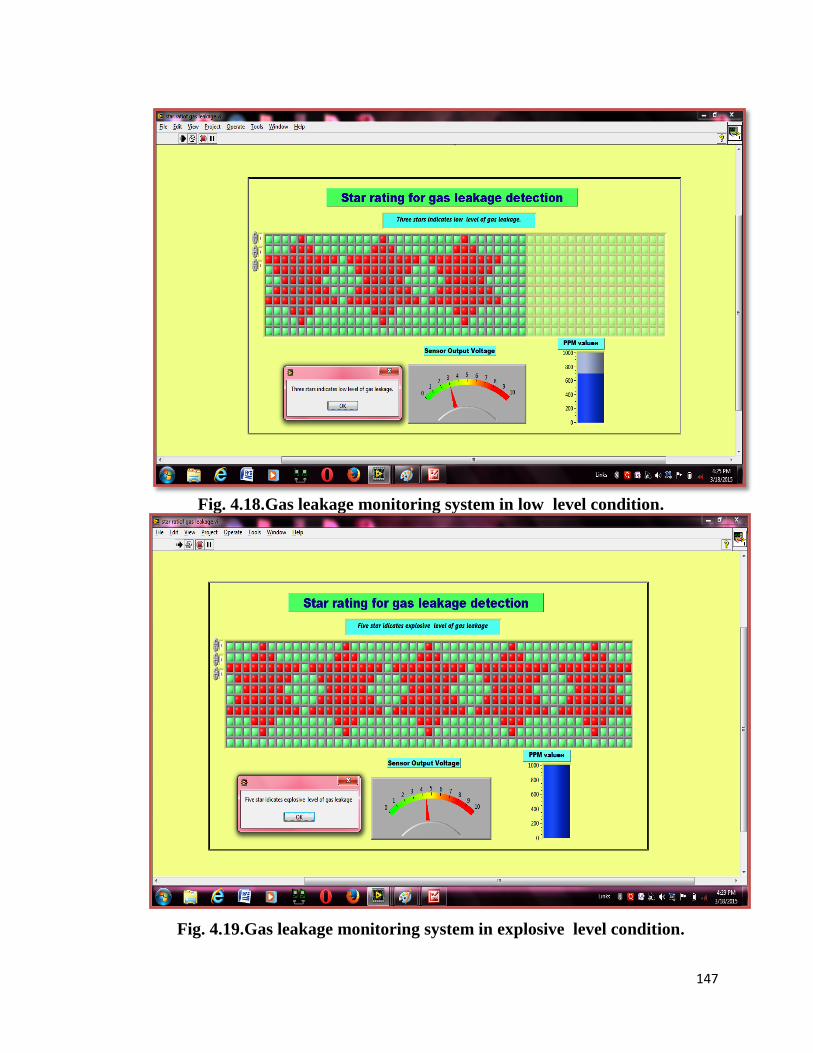
147
Fig. 4.18.Gas leakage monitoring system in low level condition.
Fig. 4.19.Gas leakage monitoring system in explosive level condition.
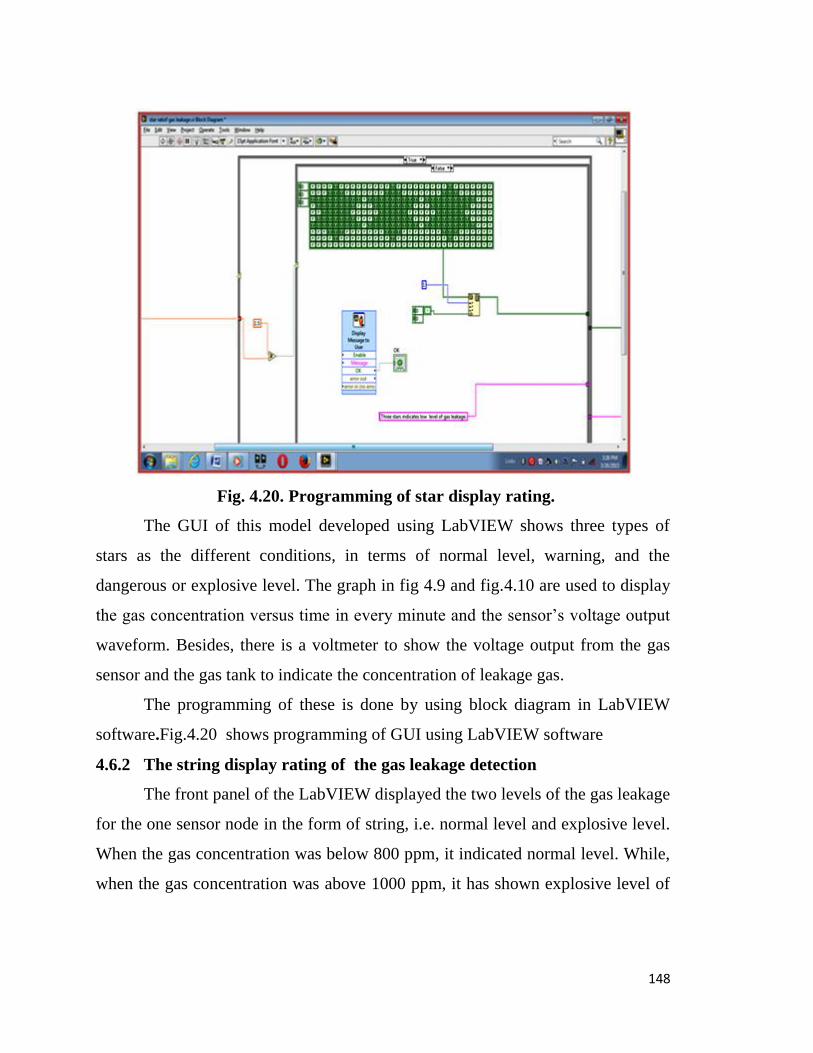
148
Fig. 4.20. Programming of star display rating.
The GUI of this model developed using LabVIEW shows three types of
stars as the different conditions, in terms of normal level, warning, and the
dangerous or explosive level. The graph in fig 4.9 and fig.4.10 are used to display
the gas concentration versus time in every minute and the sensor’s voltage output
waveform. Besides, there is a voltmeter to show the voltage output from the gas
sensor and the gas tank to indicate the concentration of leakage gas.
The programming of these is done by using block diagram in LabVIEW
software.Fig.4.20 shows programming of GUI using LabVIEW software
4.6.2 The string display rating of the gas leakage detection
The front panel of the LabVIEW displayed the two levels of the gas leakage
for the one sensor node in the form of string, i.e. normal level and explosive level.
When the gas concentration was below 800 ppm, it indicated normal level. While,
when the gas concentration was above 1000 ppm, it has shown explosive level of
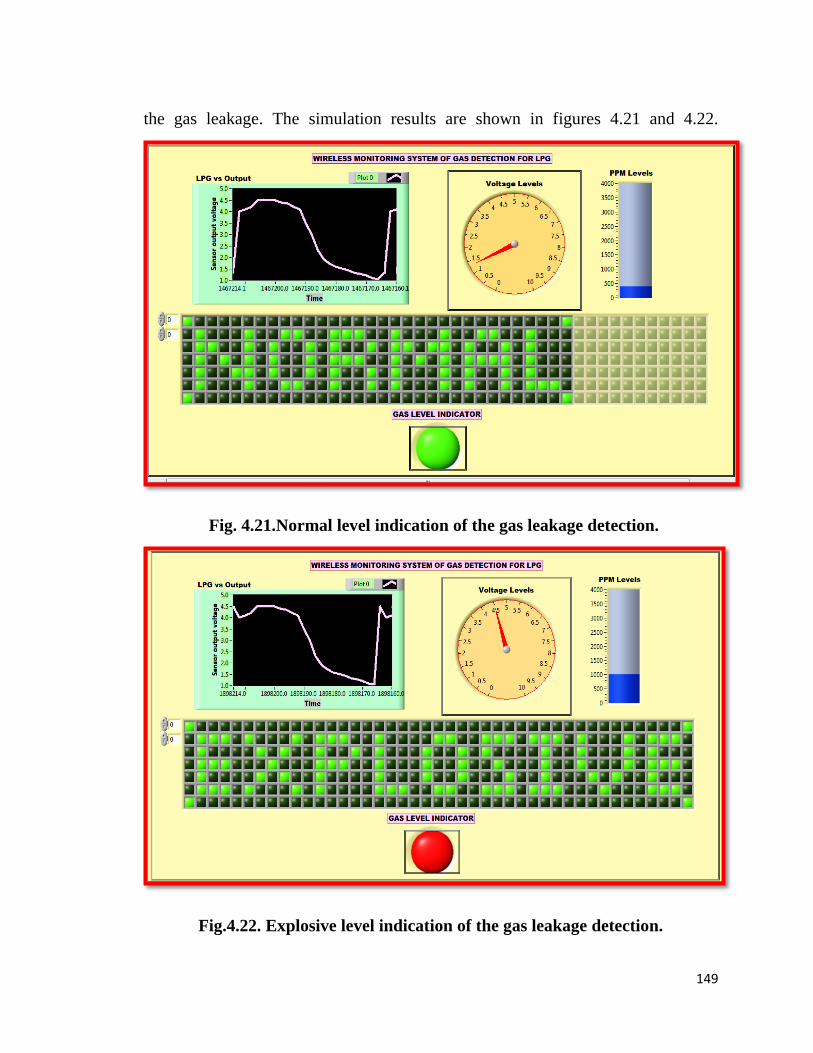
149
the gas leakage. The simulation results are shown in figures 4.21 and 4.22.
Fig. 4.21.Normal level indication of the gas leakage detection.
Fig.4.22. Explosive level indication of the gas leakage detection.
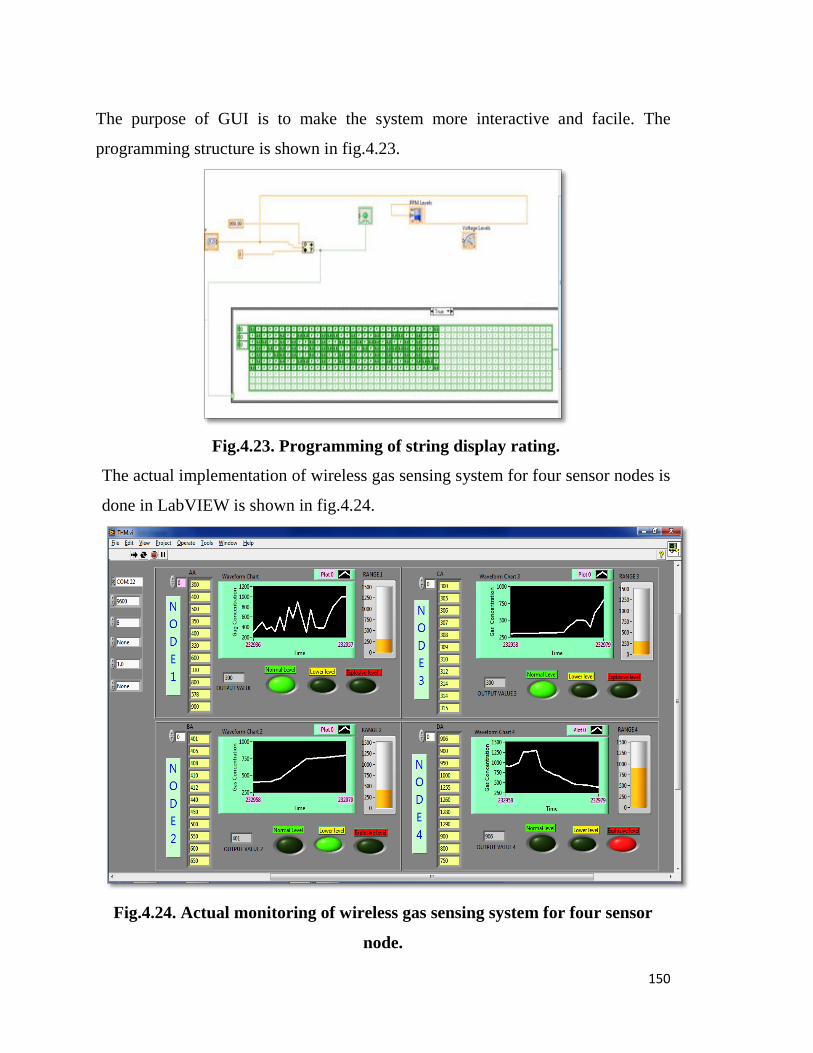
150
The purpose of GUI is to make the system more interactive and facile. The
programming structure is shown in fig.4.23.
Fig.4.23. Programming of string display rating.
The actual implementation of wireless gas sensing system for four sensor nodes is
done in LabVIEW is shown in fig.4.24.
Fig.4.24. Actual monitoring of wireless gas sensing system for four sensor
node.
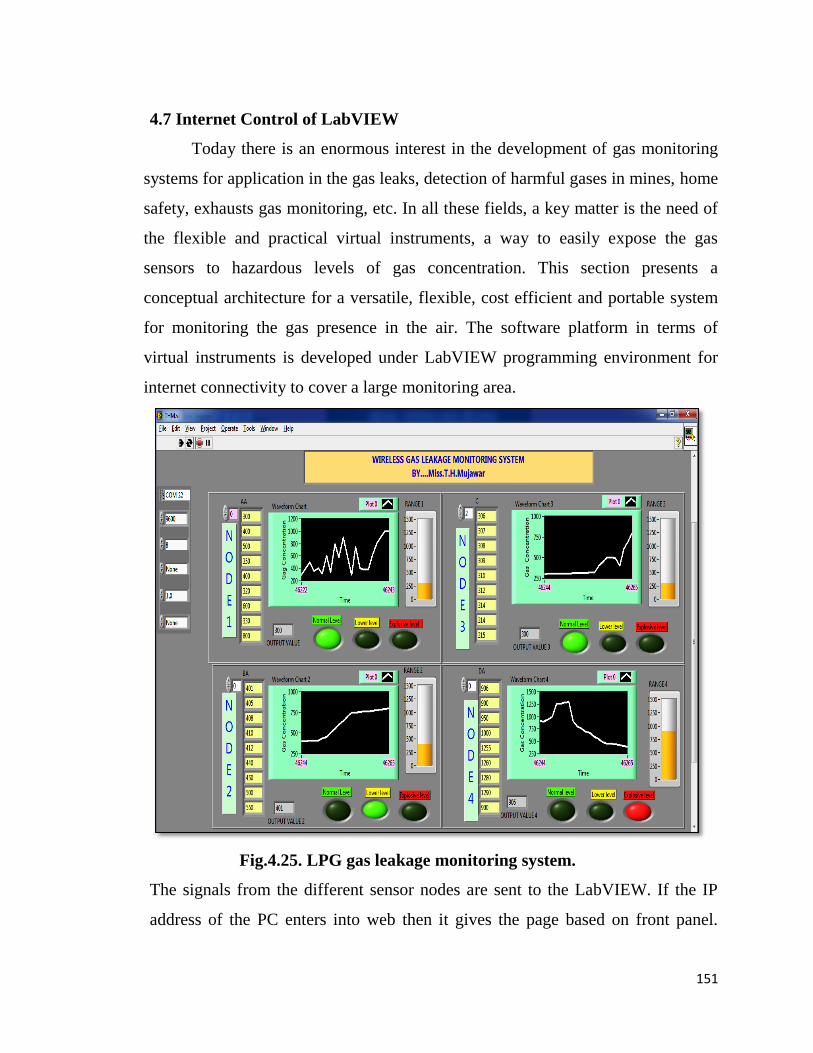
151
4.7 Internet Control of LabVIEW
Today there is an enormous interest in the development of gas monitoring
systems for application in the gas leaks, detection of harmful gases in mines, home
safety, exhausts gas monitoring, etc. In all these fields, a key matter is the need of
the flexible and practical virtual instruments, a way to easily expose the gas
sensors to hazardous levels of gas concentration. This section presents a
conceptual architecture for a versatile, flexible, cost efficient and portable system
for monitoring the gas presence in the air. The software platform in terms of
virtual instruments is developed under LabVIEW programming environment for
internet connectivity to cover a large monitoring area.
Fig.4.25. LPG gas leakage monitoring system.
The signals from the different sensor nodes are sent to the LabVIEW. If the IP
address of the PC enters into web then it gives the page based on front panel.
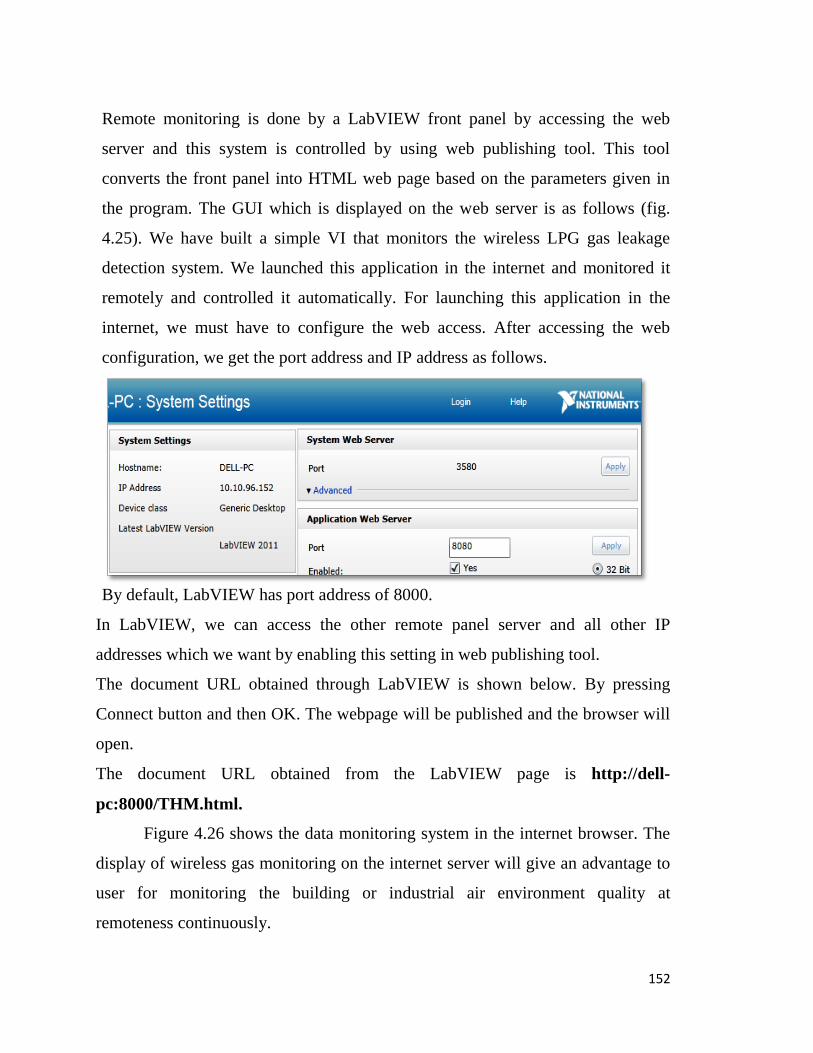
152
Remote monitoring is done by a LabVIEW front panel by accessing the web
server and this system is controlled by using web publishing tool. This tool
converts the front panel into HTML web page based on the parameters given in
the program. The GUI which is displayed on the web server is as follows (fig.
4.25). We have built a simple VI that monitors the wireless LPG gas leakage
detection system. We launched this application in the internet and monitored it
remotely and controlled it automatically. For launching this application in the
internet, we must have to configure the web access. After accessing the web
configuration, we get the port address and IP address as follows.
By default, LabVIEW has port address of 8000.
In LabVIEW, we can access the other remote panel server and all other IP
addresses which we want by enabling this setting in web publishing tool.
The document URL obtained through LabVIEW is shown below. By pressing
Connect button and then OK. The webpage will be published and the browser will
open.
The document URL obtained from the LabVIEW page is http://dell-
pc:8000/THM.html.
Figure 4.26 shows the data monitoring system in the internet browser. The
display of wireless gas monitoring on the internet server will give an advantage to
user for monitoring the building or industrial air environment quality at
remoteness continuously.
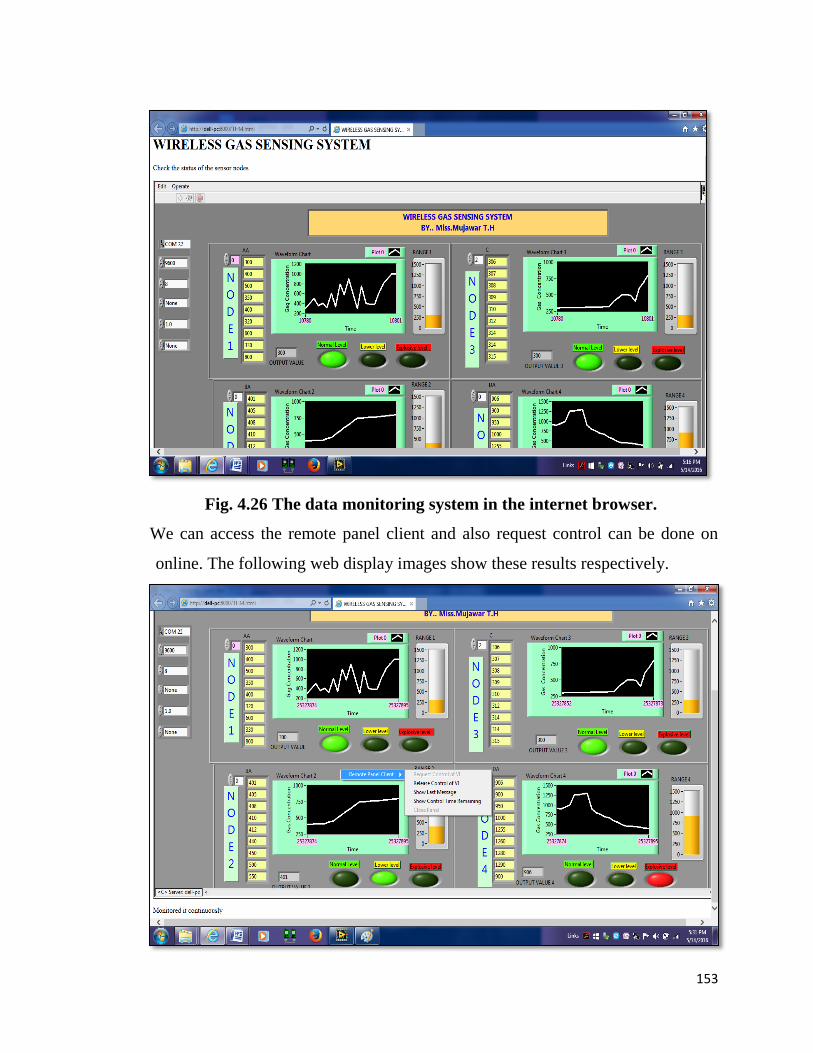
153
Fig. 4.26 The data monitoring system in the internet browser.
We can access the remote panel client and also request control can be done on
online. The following web display images show these results respectively.
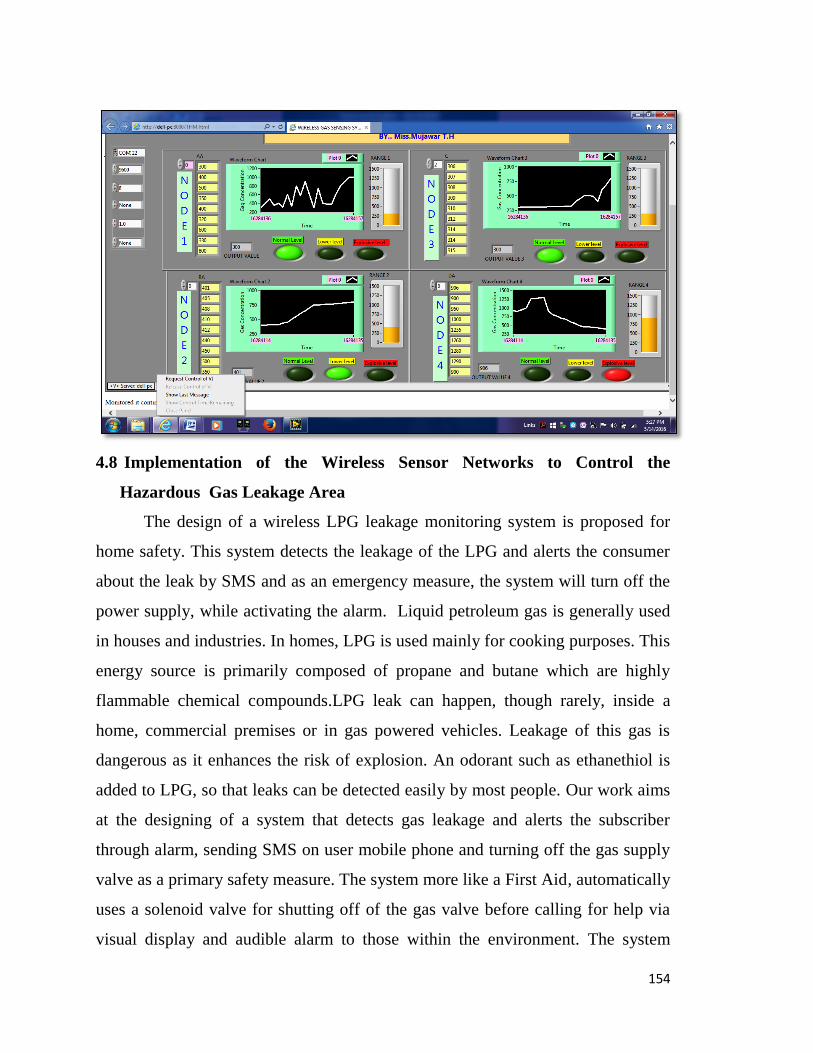
154
4.8 Implementation of the Wireless Sensor Networks to Control the
Hazardous Gas Leakage Area
The design of a wireless LPG leakage monitoring system is proposed for
home safety. This system detects the leakage of the LPG and alerts the consumer
about the leak by SMS and as an emergency measure, the system will turn off the
power supply, while activating the alarm. Liquid petroleum gas is generally used
in houses and industries. In homes, LPG is used mainly for cooking purposes. This
energy source is primarily composed of propane and butane which are highly
flammable chemical compounds.LPG leak can happen, though rarely, inside a
home, commercial premises or in gas powered vehicles. Leakage of this gas is
dangerous as it enhances the risk of explosion. An odorant such as ethanethiol is
added to LPG, so that leaks can be detected easily by most people. Our work aims
at the designing of a system that detects gas leakage and alerts the subscriber
through alarm, sending SMS on user mobile phone and turning off the gas supply
valve as a primary safety measure. The system more like a First Aid, automatically
uses a solenoid valve for shutting off of the gas valve before calling for help via
visual display and audible alarm to those within the environment. The system
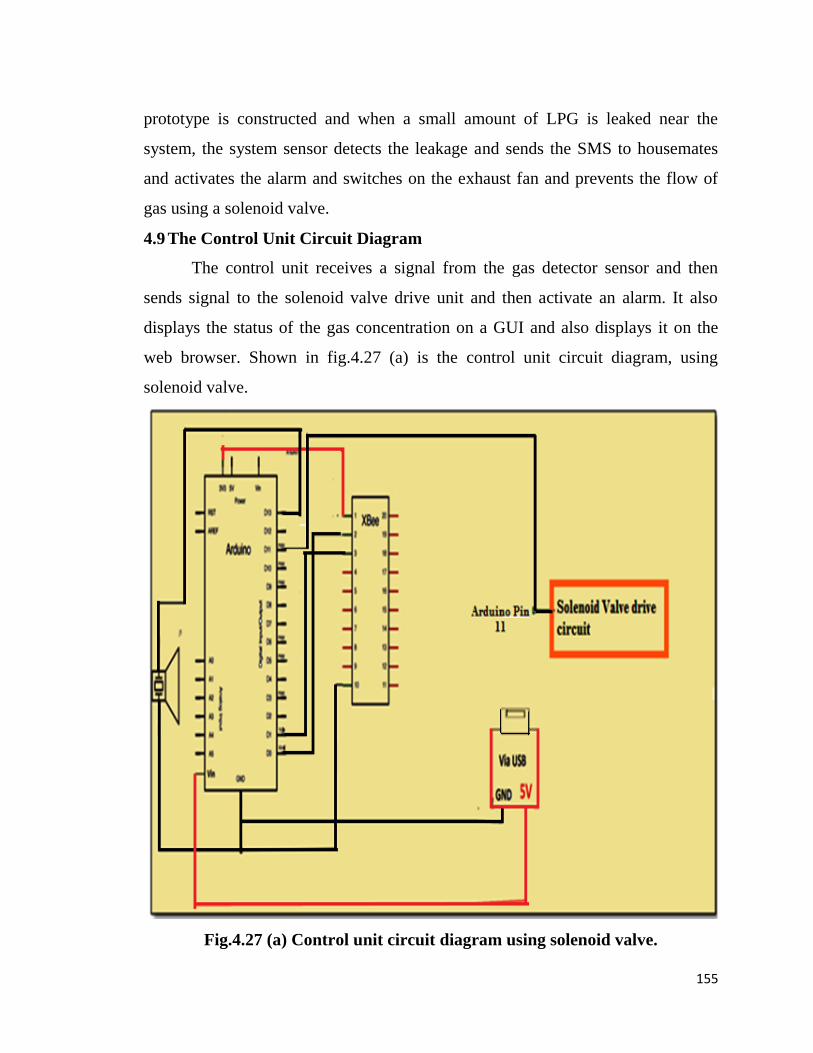
155
prototype is constructed and when a small amount of LPG is leaked near the
system, the system sensor detects the leakage and sends the SMS to housemates
and activates the alarm and switches on the exhaust fan and prevents the flow of
gas using a solenoid valve.
4.9 The Control Unit Circuit Diagram
The control unit receives a signal from the gas detector sensor and then
sends signal to the solenoid valve drive unit and then activate an alarm. It also
displays the status of the gas concentration on a GUI and also displays it on the
web browser. Shown in fig.4.27 (a) is the control unit circuit diagram, using
solenoid valve.
Fig.4.27 (a) Control unit circuit diagram using solenoid valve.
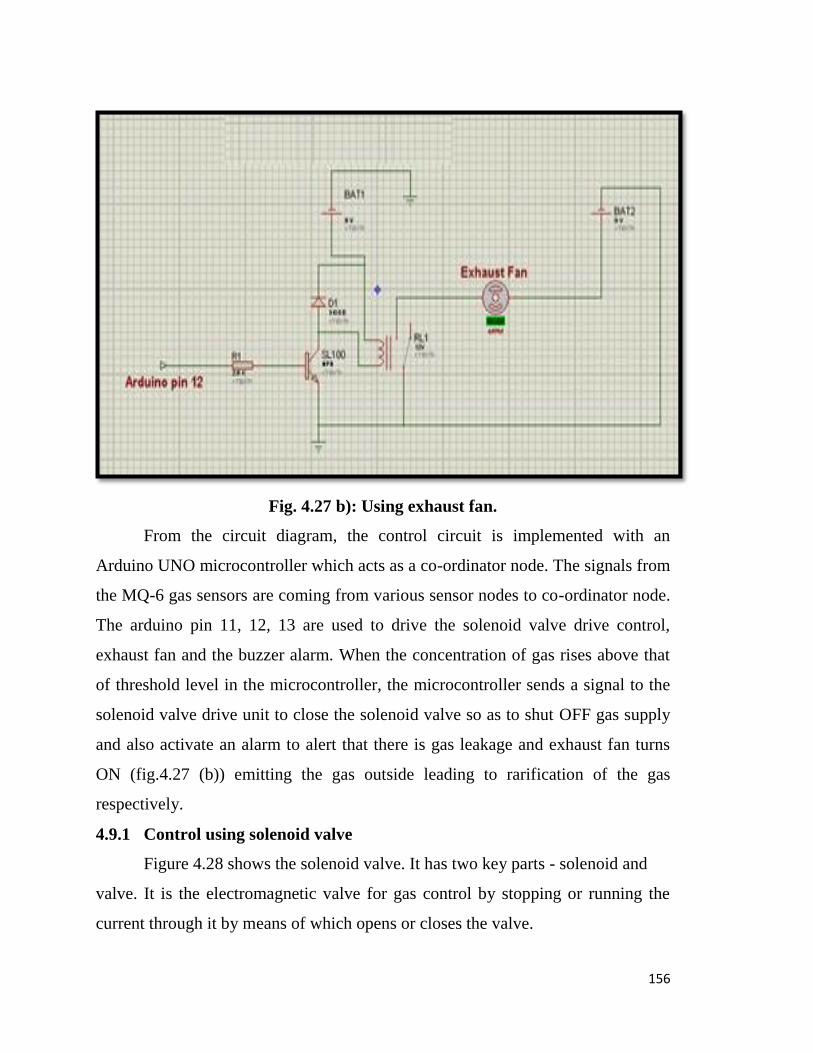
156
Fig. 4.27 b): Using exhaust fan.
From the circuit diagram, the control circuit is implemented with an
Arduino UNO microcontroller which acts as a co-ordinator node. The signals from
the MQ-6 gas sensors are coming from various sensor nodes to co-ordinator node.
The arduino pin 11, 12, 13 are used to drive the solenoid valve drive control,
exhaust fan and the buzzer alarm. When the concentration of gas rises above that
of threshold level in the microcontroller, the microcontroller sends a signal to the
solenoid valve drive unit to close the solenoid valve so as to shut OFF gas supply
and also activate an alarm to alert that there is gas leakage and exhaust fan turns
ON (fig.4.27 (b)) emitting the gas outside leading to rarification of the gas
respectively.
4.9.1 Control using solenoid valve
Figure 4.28 shows the solenoid valve. It has two key parts - solenoid and
valve. It is the electromagnetic valve for gas control by stopping or running the
current through it by means of which opens or closes the valve.
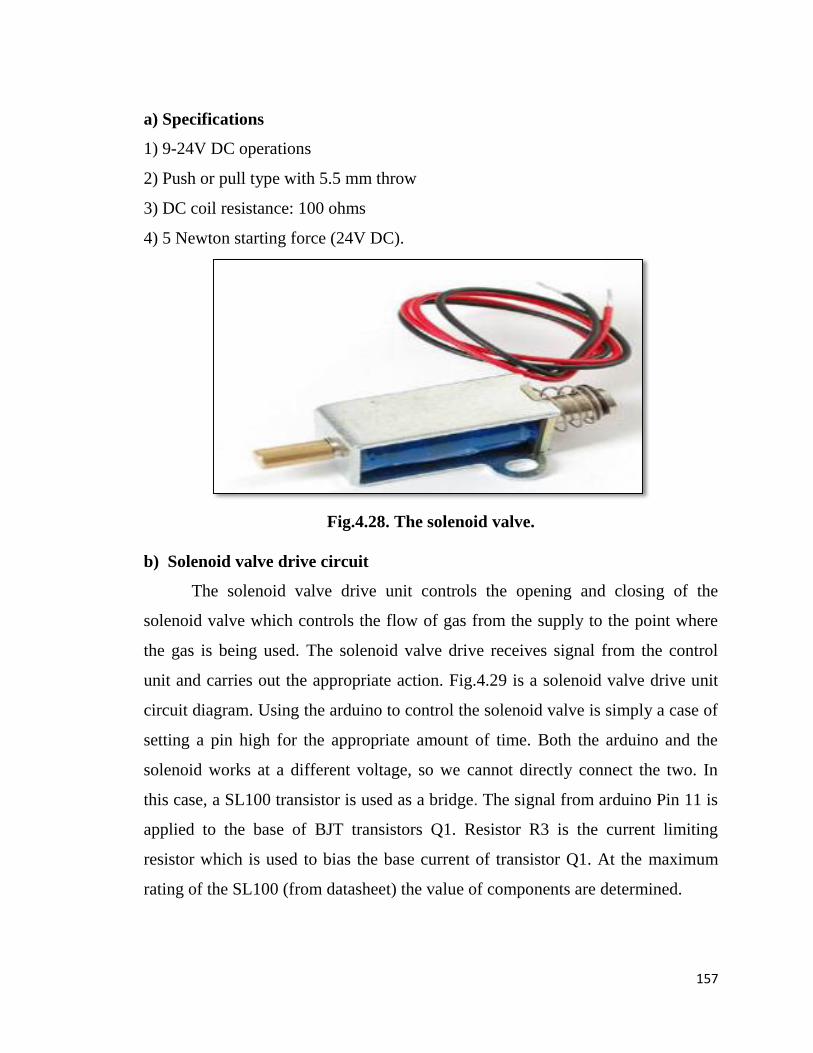
157
a) Specifications
1) 9-24V DC operations
2) Push or pull type with 5.5 mm throw
3) DC coil resistance: 100 ohms
4) 5 Newton starting force (24V DC).
Fig.4.28. The solenoid valve.
b) Solenoid valve drive circuit
The solenoid valve drive unit controls the opening and closing of the
solenoid valve which controls the flow of gas from the supply to the point where
the gas is being used. The solenoid valve drive receives signal from the control
unit and carries out the appropriate action. Fig.4.29 is a solenoid valve drive unit
circuit diagram. Using the arduino to control the solenoid valve is simply a case of
setting a pin high for the appropriate amount of time. Both the arduino and the
solenoid works at a different voltage, so we cannot directly connect the two. In
this case, a SL100 transistor is used as a bridge. The signal from arduino Pin 11 is
applied to the base of BJT transistors Q1. Resistor R3 is the current limiting
resistor which is used to bias the base current of transistor Q1. At the maximum
rating of the SL100 (from datasheet) the value of components are determined.
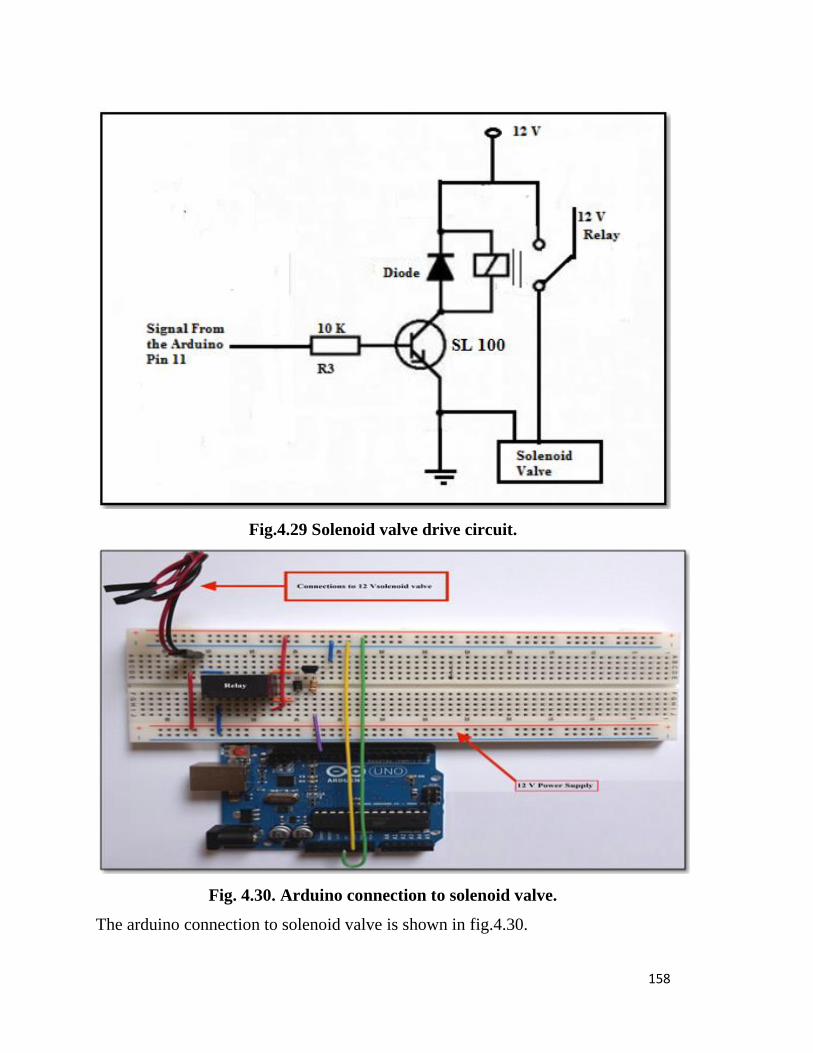
158
Fig.4.29 Solenoid valve drive circuit.
Fig. 4.30. Arduino connection to solenoid valve.
The arduino connection to solenoid valve is shown in fig.4.30.
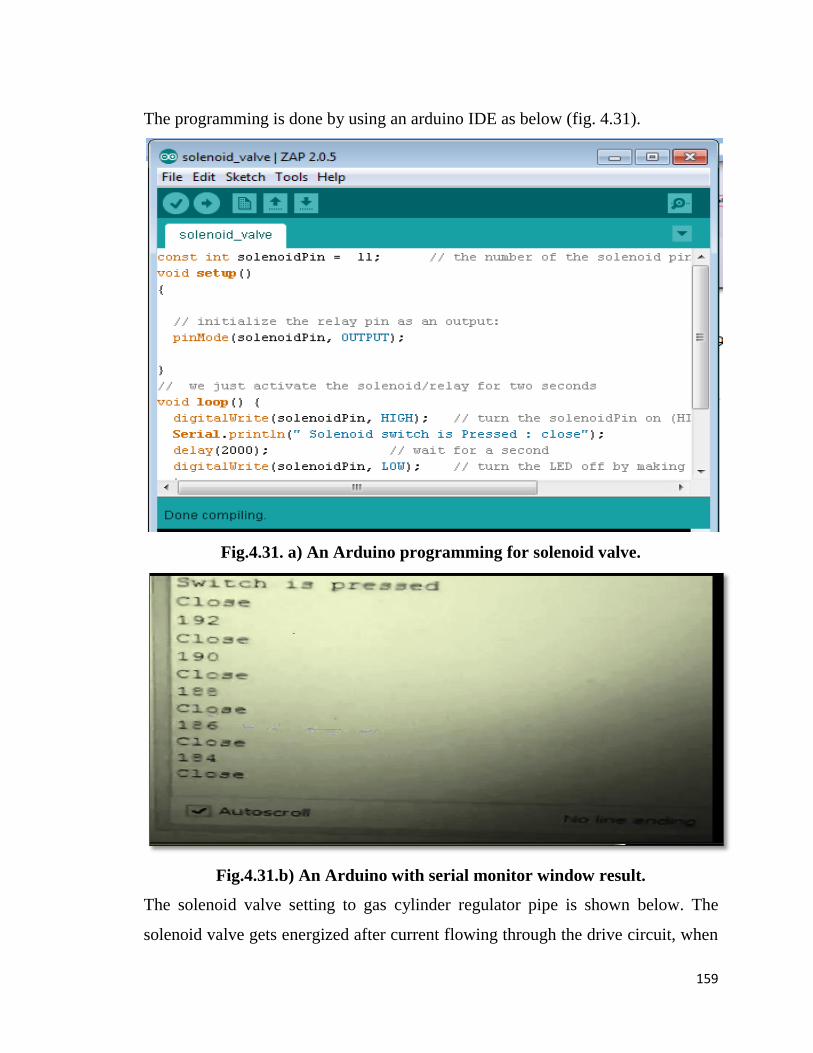
159
The programming is done by using an arduino IDE as below (fig. 4.31).
Fig.4.31. a) An Arduino programming for solenoid valve.
Fig.4.31.b) An Arduino with serial monitor window result.
The solenoid valve setting to gas cylinder regulator pipe is shown below. The
solenoid valve gets energized after current flowing through the drive circuit, when
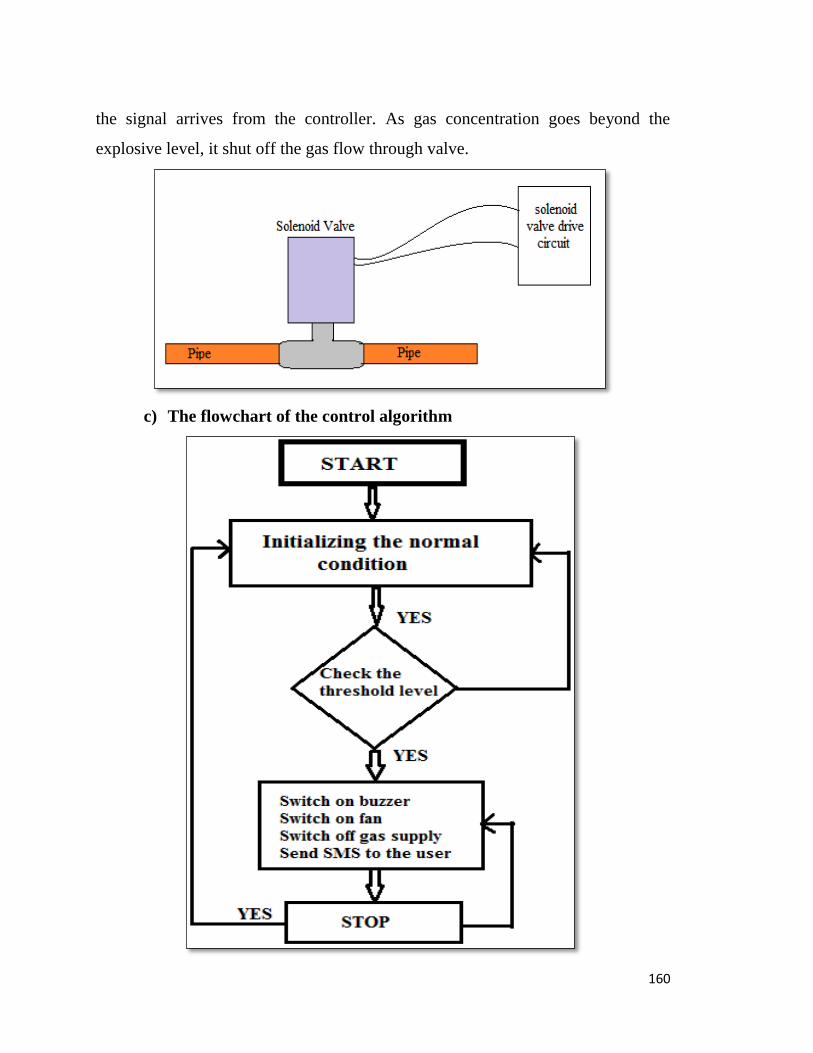
160
the signal arrives from the controller. As gas concentration goes beyond the
explosive level, it shut off the gas flow through valve.
c) The flowchart of the control algorithm
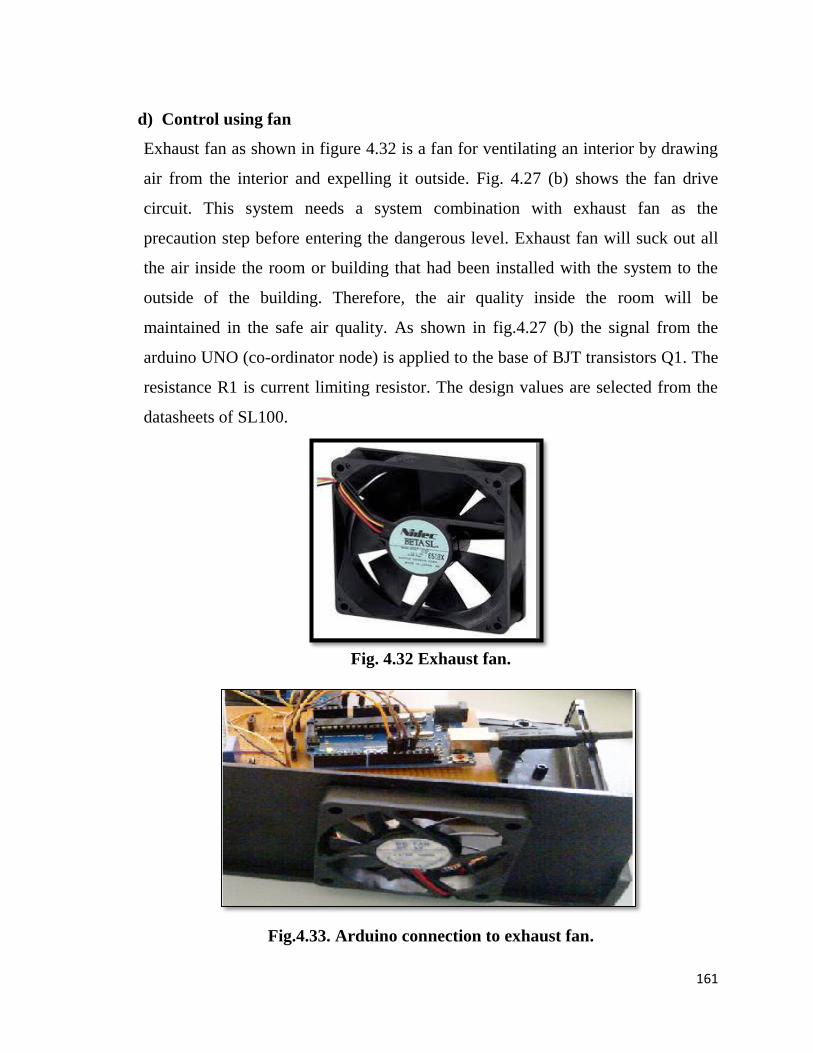
161
d) Control using fan
Exhaust fan as shown in figure 4.32 is a fan for ventilating an interior by drawing
air from the interior and expelling it outside. Fig. 4.27 (b) shows the fan drive
circuit. This system needs a system combination with exhaust fan as the
precaution step before entering the dangerous level. Exhaust fan will suck out all
the air inside the room or building that had been installed with the system to the
outside of the building. Therefore, the air quality inside the room will be
maintained in the safe air quality. As shown in fig.4.27 (b) the signal from the
arduino UNO (co-ordinator node) is applied to the base of BJT transistors Q1. The
resistance R1 is current limiting resistor. The design values are selected from the
datasheets of SL100.
Fig. 4.32 Exhaust fan.
Fig.4.33. Arduino connection to exhaust fan.
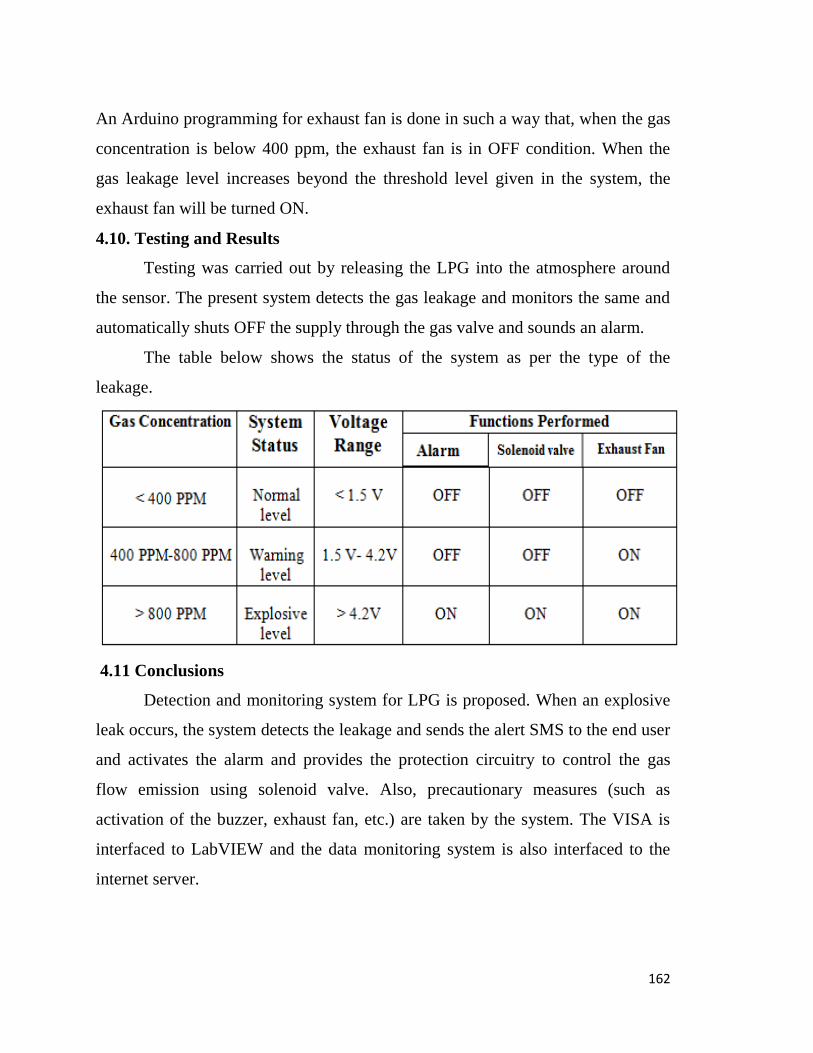
162
An Arduino programming for exhaust fan is done in such a way that, when the gas
concentration is below 400 ppm, the exhaust fan is in OFF condition. When the
gas leakage level increases beyond the threshold level given in the system, the
exhaust fan will be turned ON.
4.10. Testing and Results
Testing was carried out by releasing the LPG into the atmosphere around
the sensor. The present system detects the gas leakage and monitors the same and
automatically shuts OFF the supply through the gas valve and sounds an alarm.
The table below shows the status of the system as per the type of the
leakage.
4.11 Conclusions
Detection and monitoring system for LPG is proposed. When an explosive
leak occurs, the system detects the leakage and sends the alert SMS to the end user
and activates the alarm and provides the protection circuitry to control the gas
flow emission using solenoid valve. Also, precautionary measures (such as
activation of the buzzer, exhaust fan, etc.) are taken by the system. The VISA is
interfaced to LabVIEW and the data monitoring system is also interfaced to the
internet server.
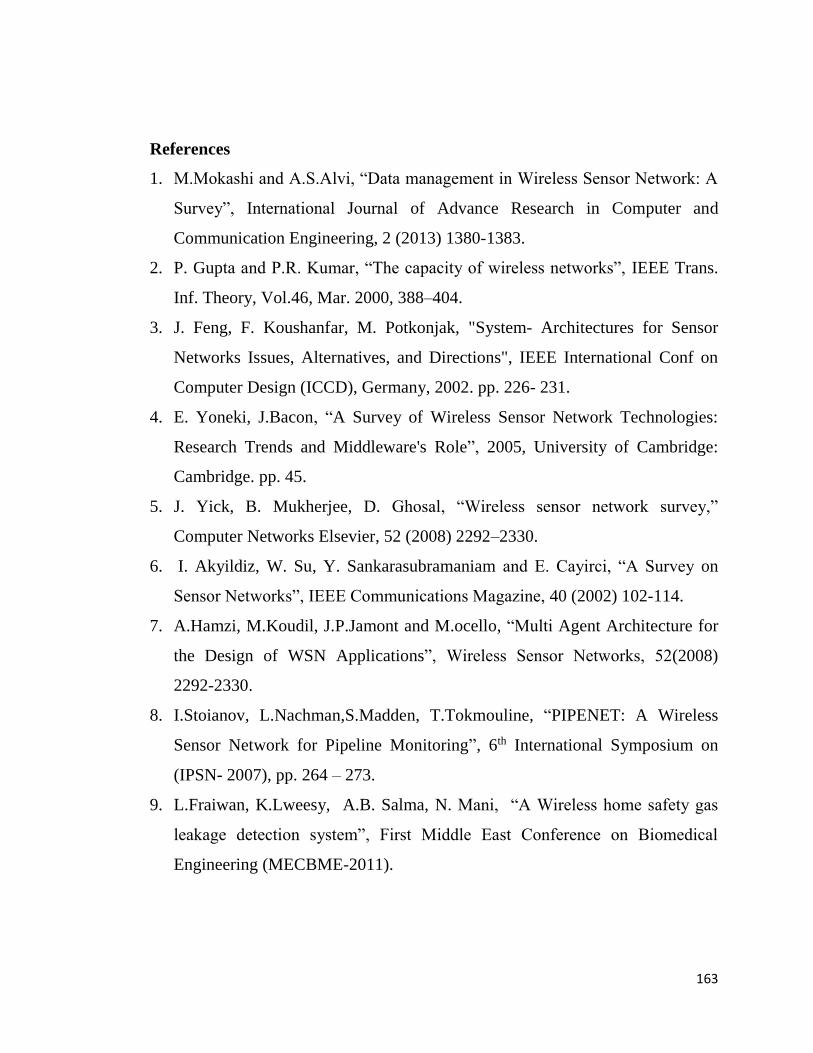
163
References
1. M.Mokashi and A.S.Alvi, “Data management in Wireless Sensor Network: A
Survey”, International Journal of Advance Research in Computer and
Communication Engineering, 2 (2013) 1380-1383.
2. P. Gupta and P.R. Kumar, “The capacity of wireless networks”, IEEE Trans.
Inf. Theory, Vol.46, Mar. 2000, 388–404.
3. J. Feng, F. Koushanfar, M. Potkonjak, "System- Architectures for Sensor
Networks Issues, Alternatives, and Directions", IEEE International Conf on
Computer Design (ICCD), Germany, 2002. pp. 226- 231.
4. E. Yoneki, J.Bacon, “A Survey of Wireless Sensor Network Technologies:
Research Trends and Middleware's Role”, 2005, University of Cambridge:
Cambridge. pp. 45.
5. J. Yick, B. Mukherjee, D. Ghosal, “Wireless sensor network survey,”
Computer Networks Elsevier, 52 (2008) 2292–2330.
6. I. Akyildiz, W. Su, Y. Sankarasubramaniam and E. Cayirci, “A Survey on
Sensor Networks”, IEEE Communications Magazine, 40 (2002) 102-114.
7. A.Hamzi, M.Koudil, J.P.Jamont and M.ocello, “Multi Agent Architecture for
the Design of WSN Applications”, Wireless Sensor Networks, 52(2008)
2292-2330.
8. I.Stoianov, L.Nachman,S.Madden, T.Tokmouline, “PIPENET: A Wireless
Sensor Network for Pipeline Monitoring”, 6th International Symposium on
(IPSN- 2007), pp. 264 – 273.
9. L.Fraiwan, K.Lweesy, A.B. Salma, N. Mani, “A Wireless home safety gas
leakage detection system”, First Middle East Conference on Biomedical
Engineering (MECBME-2011).
164
10. W.B. Heinzelman, A.P. Chandrakasan, and H. Balakrishnan, “An application-
specific protocol architecture for wireless microsensor networks”, IEEE
Trans. Wireless Commun., Oct. 2002, 660–670.
11. J. Kulik, W. Heinzelman and H. Balakrishnan, “Negotiation-based protocols
for disseminating information in wireless sensor networks”, Wireless
Networks, 8, March–May 2002, 169–185.
12. J.E. Wieselthier, G.D. Nguyen and A. Ephremides, “On the construction of
energy-efficient broadcast and multicast trees in wireless networks”, IEEE
INFOCOM, Tel Aviv, Israel, Mar. 2000, 585–594.
13. http://www.ni.com/pdf/manuals/370423a.pdf
165
CHAPTER V
RANGE TESTING OF THE XBEE AND RESULTS
5.1 Introduction 167
5.2 XBee Testing and Configuration 167
5.2.1 XBee testing 168
5.2.2 Testing of communication between two XBee’s 169
5.3 Range Testing and Range Test Measurements 170
5.3.1 Range testing 170
5.3.2 Range test measurements 172
a) Inside the laboratory- no barriers 172
b) Range test with barriers between two XBee modules-AT
configurations
176
5.4 Results 178
5.4.1 Maximum range reception 179
5.5 Conclusions 180
References 181

166
167
CHAPTER V
RANGE TESTING OF THE XBEE AND RESULTS
5.1 Introduction
Through our wireless gas sensing system, we built a single-hop XBee
network with several XBee wireless nodes where each node consists of a XBee
module and an Arduino microcontroller. The arduino consists of a simple open
hardware design for a single-board microcontroller with embedded I/O support
and a standard programming language; C/C++ language is the main programming
language of the Arduino [1]. Communication with XBee modules is done either
via an Arduino or via an USB dongle, which is connected to a computer. For a
successful deployment of wireless network, we need to evaluate some basic
performance parameters such as radio performance (e.g., received signal strength,
coverage ranges and link failure probability), packet delays and throughputs. For
our system, we focus on the measurement of Received Signal Strength Indicator
(RSSI). The range test consists of the effect of the distance, power emitted and
disturbance effect of different electronic devices and barriers on the reception of
the XBee modules. Many instruments are used in these tests. Some of the tests are
repeated to ensure the correctness of the results and reliability. Tools used in
testing the range are an Arduino –XBee module programmed to send back a
message that is send from a computer using X-CTU. Different configurations and
environments were chosen. Normally, a loop back test is performed for the range
test [2-4].
5.2 XBee Testing and Configuration
In this measurement, we aimed to study the actual coverage range of the
XBee- S2 in real life conditions. For our measurements, we used a loop back test
which was performed by X-CTU in order to measure the relationship between
received signal strength (RSSI) and the distance for a point to point link.
communication between the PC and XBee is an integral part of our system, where
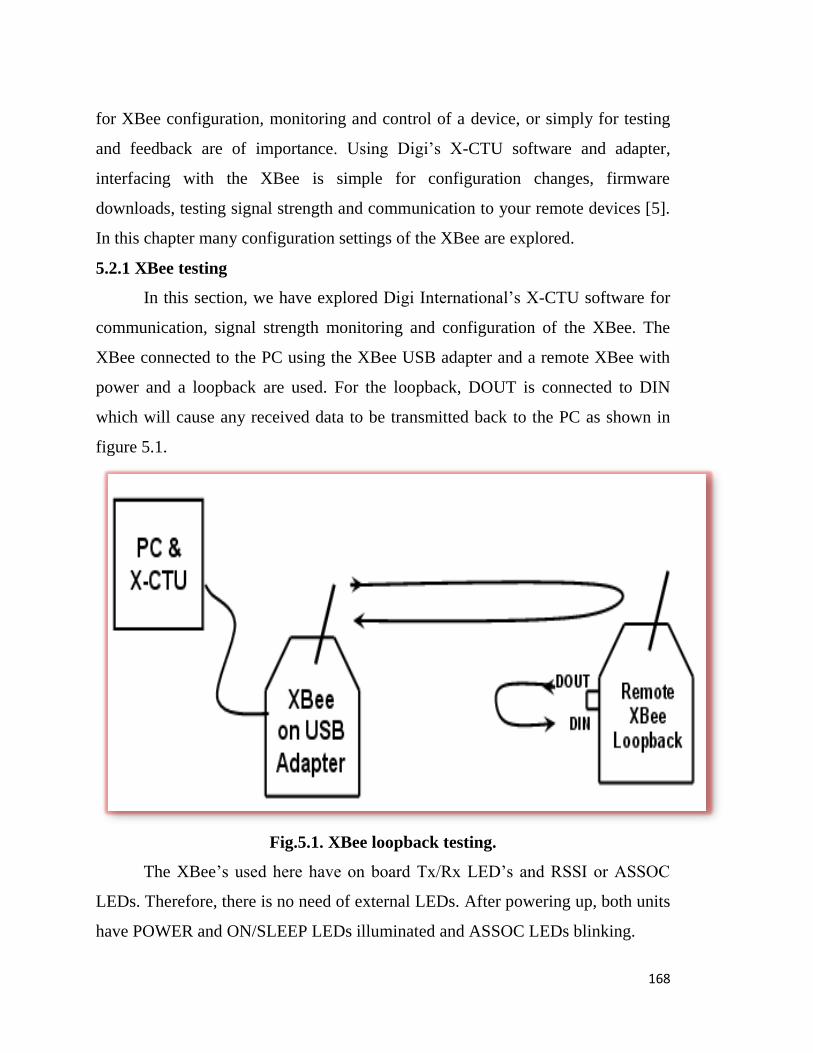
168
for XBee configuration, monitoring and control of a device, or simply for testing
and feedback are of importance. Using Digi’s X-CTU software and adapter,
interfacing with the XBee is simple for configuration changes, firmware
downloads, testing signal strength and communication to your remote devices [5].
In this chapter many configuration settings of the XBee are explored.
5.2.1 XBee testing
In this section, we have explored Digi International’s X-CTU software for
communication, signal strength monitoring and configuration of the XBee. The
XBee connected to the PC using the XBee USB adapter and a remote XBee with
power and a loopback are used. For the loopback, DOUT is connected to DIN
which will cause any received data to be transmitted back to the PC as shown in
figure 5.1.
Fig.5.1. XBee loopback testing.
The XBee’s used here have on board Tx/Rx LED’s and RSSI or ASSOC
LEDs. Therefore, there is no need of external LEDs. After powering up, both units
have POWER and ON/SLEEP LEDs illuminated and ASSOC LEDs blinking.
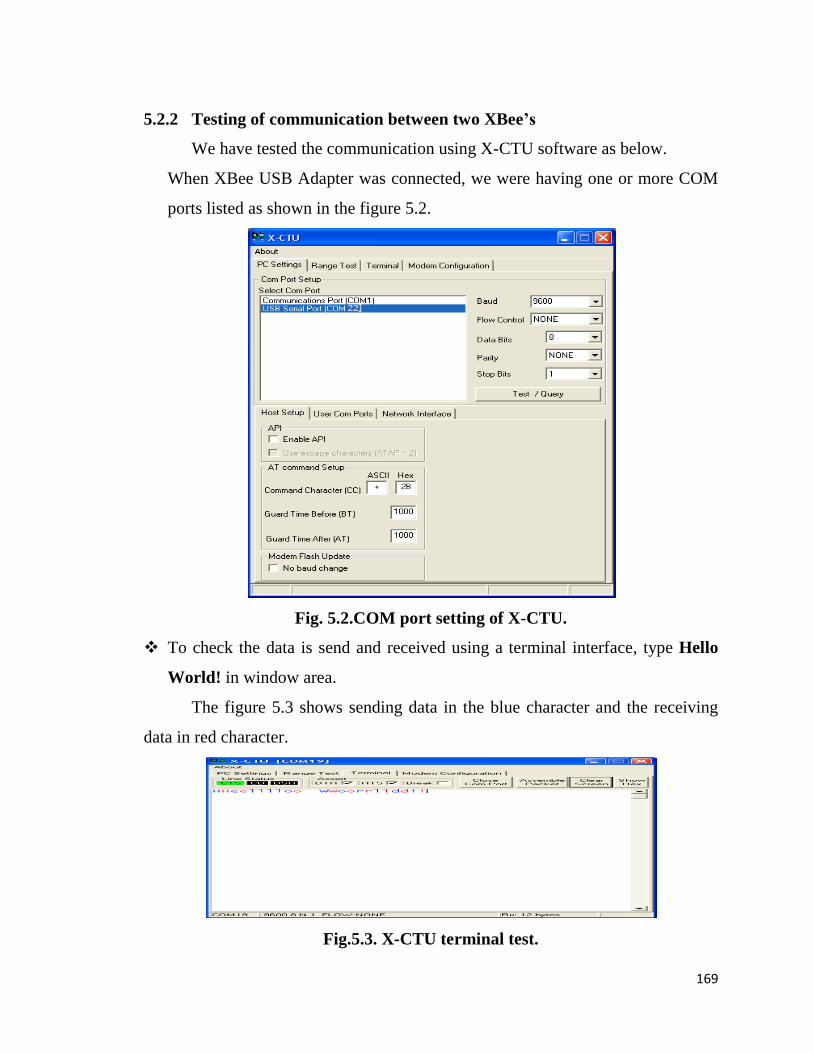
169
5.2.2 Testing of communication between two XBee’s
We have tested the communication using X-CTU software as below.
When XBee USB Adapter was connected, we were having one or more COM
ports listed as shown in the figure 5.2.
Fig. 5.2.COM port setting of X-CTU.
To check the data is send and received using a terminal interface, type Hello
World! in window area.
The figure 5.3 shows sending data in the blue character and the receiving
data in red character.
Fig.5.3. X-CTU terminal test.
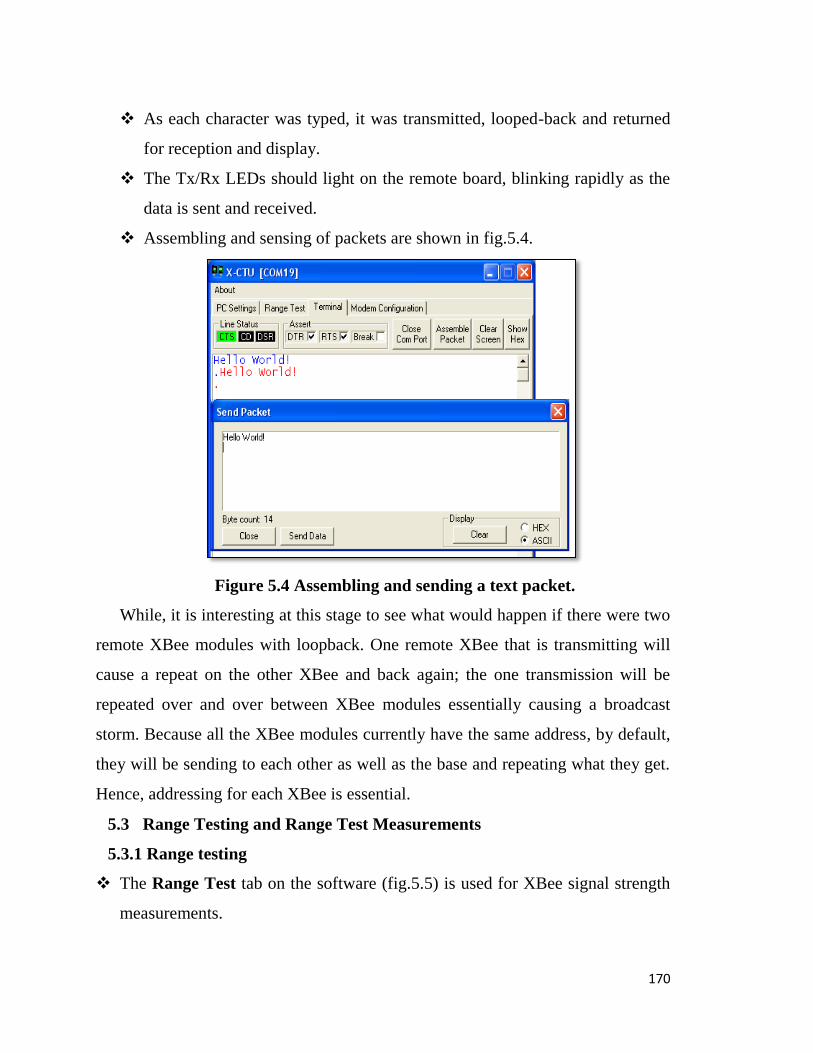
170
As each character was typed, it was transmitted, looped-back and returned
for reception and display.
The Tx/Rx LEDs should light on the remote board, blinking rapidly as the
data is sent and received.
Assembling and sensing of packets are shown in fig.5.4.
Figure 5.4 Assembling and sending a text packet.
While, it is interesting at this stage to see what would happen if there were two
remote XBee modules with loopback. One remote XBee that is transmitting will
cause a repeat on the other XBee and back again; the one transmission will be
repeated over and over between XBee modules essentially causing a broadcast
storm. Because all the XBee modules currently have the same address, by default,
they will be sending to each other as well as the base and repeating what they get.
Hence, addressing for each XBee is essential.
5.3 Range Testing and Range Test Measurements
5.3.1 Range testing
The Range Test tab on the software (fig.5.5) is used for XBee signal strength
measurements.
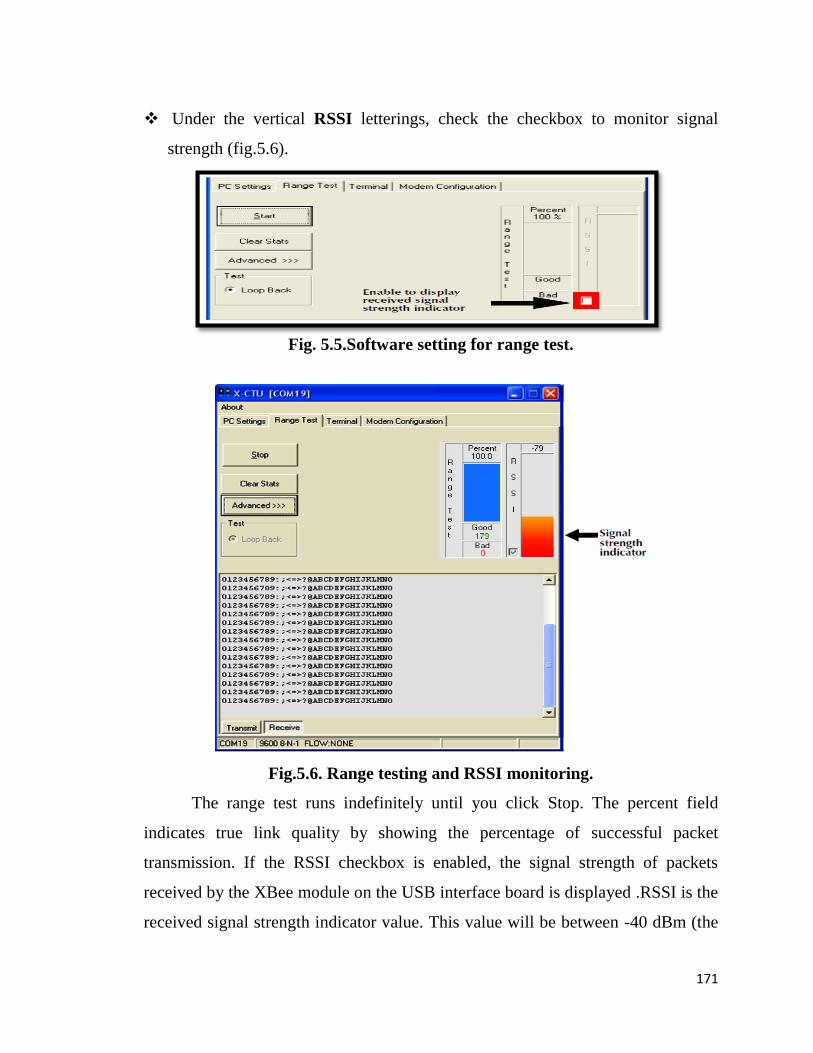
171
Under the vertical RSSI letterings, check the checkbox to monitor signal
strength (fig.5.6).
Fig. 5.5.Software setting for range test.
Fig.5.6. Range testing and RSSI monitoring.
The range test runs indefinitely until you click Stop. The percent field
indicates true link quality by showing the percentage of successful packet
transmission. If the RSSI checkbox is enabled, the signal strength of packets
received by the XBee module on the USB interface board is displayed .RSSI is the
received signal strength indicator value. This value will be between -40 dBm (the
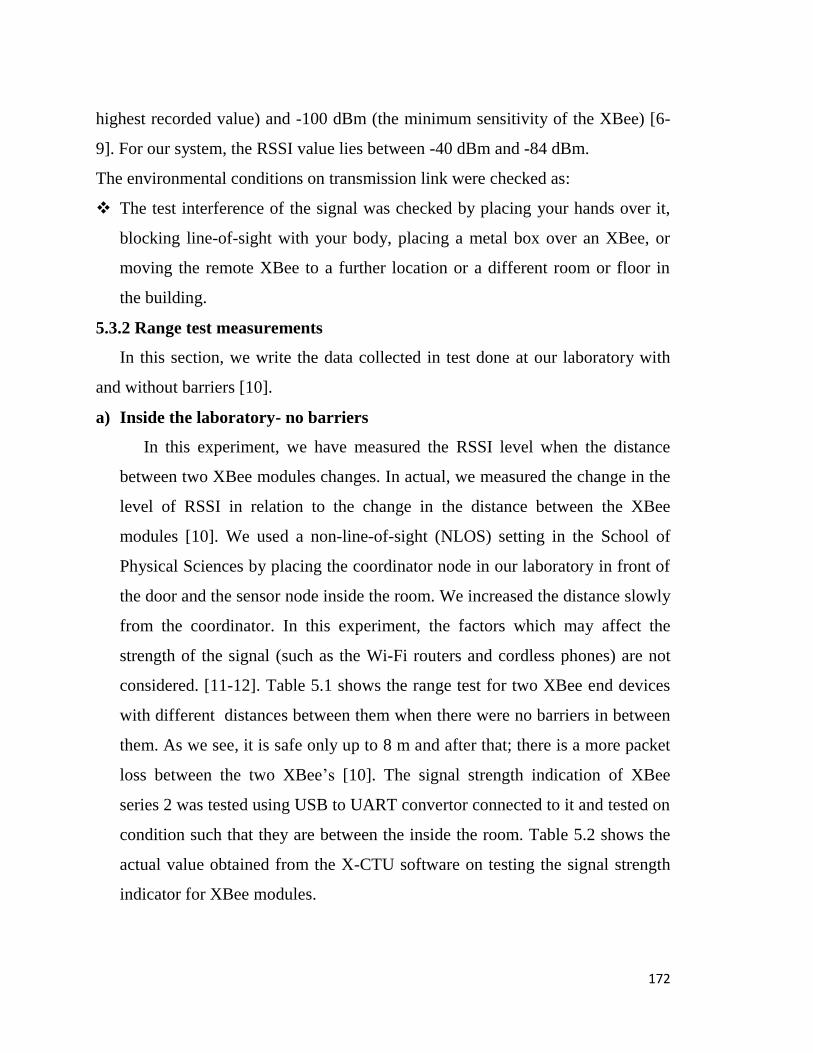
172
highest recorded value) and -100 dBm (the minimum sensitivity of the XBee) [6-
9]. For our system, the RSSI value lies between -40 dBm and -84 dBm.
The environmental conditions on transmission link were checked as:
The test interference of the signal was checked by placing your hands over it,
blocking line-of-sight with your body, placing a metal box over an XBee, or
moving the remote XBee to a further location or a different room or floor in
the building.
5.3.2 Range test measurements
In this section, we write the data collected in test done at our laboratory with
and without barriers [10].
a) Inside the laboratory- no barriers
In this experiment, we have measured the RSSI level when the distance
between two XBee modules changes. In actual, we measured the change in the
level of RSSI in relation to the change in the distance between the XBee
modules [10]. We used a non-line-of-sight (NLOS) setting in the School of
Physical Sciences by placing the coordinator node in our laboratory in front of
the door and the sensor node inside the room. We increased the distance slowly
from the coordinator. In this experiment, the factors which may affect the
strength of the signal (such as the Wi-Fi routers and cordless phones) are not
considered. [11-12]. Table 5.1 shows the range test for two XBee end devices
with different distances between them when there were no barriers in between
them. As we see, it is safe only up to 8 m and after that; there is a more packet
loss between the two XBee’s [10]. The signal strength indication of XBee
series 2 was tested using USB to UART convertor connected to it and tested on
condition such that they are between the inside the room. Table 5.2 shows the
actual value obtained from the X-CTU software on testing the signal strength
indicator for XBee modules.
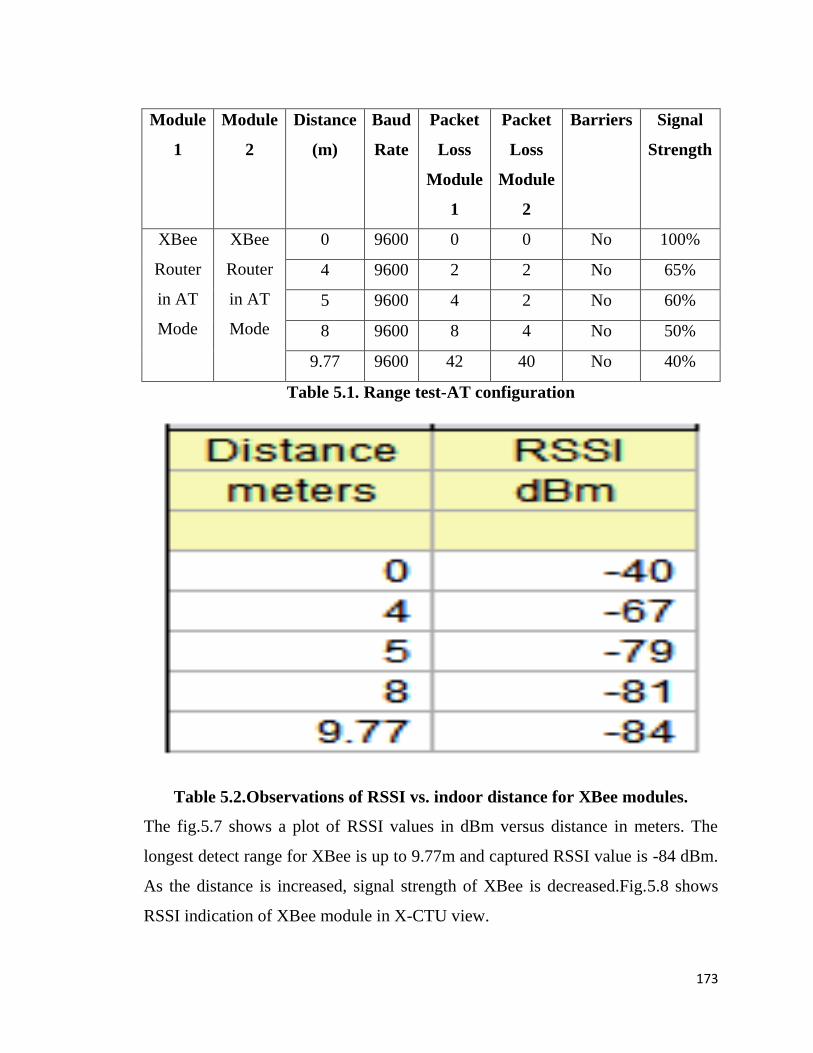
173
Module
1
Module
2
Distance
(m)
Baud
Rate
Packet
Loss
Module
1
Packet
Loss
Module
2
Barriers Signal
Strength
XBee
Router
in AT
Mode
XBee
Router
in AT
Mode
0 9600 0 0 No 100%
4 9600 2 2 No 65%
5 9600 4 2 No 60%
8 9600 8 4 No 50%
9.77 9600 42 40 No 40%
Table 5.1. Range test-AT configuration
Table 5.2.Observations of RSSI vs. indoor distance for XBee modules.
The fig.5.7 shows a plot of RSSI values in dBm versus distance in meters. The
longest detect range for XBee is up to 9.77m and captured RSSI value is -84 dBm.
As the distance is increased, signal strength of XBee is decreased.Fig.5.8 shows
RSSI indication of XBee module in X-CTU view.
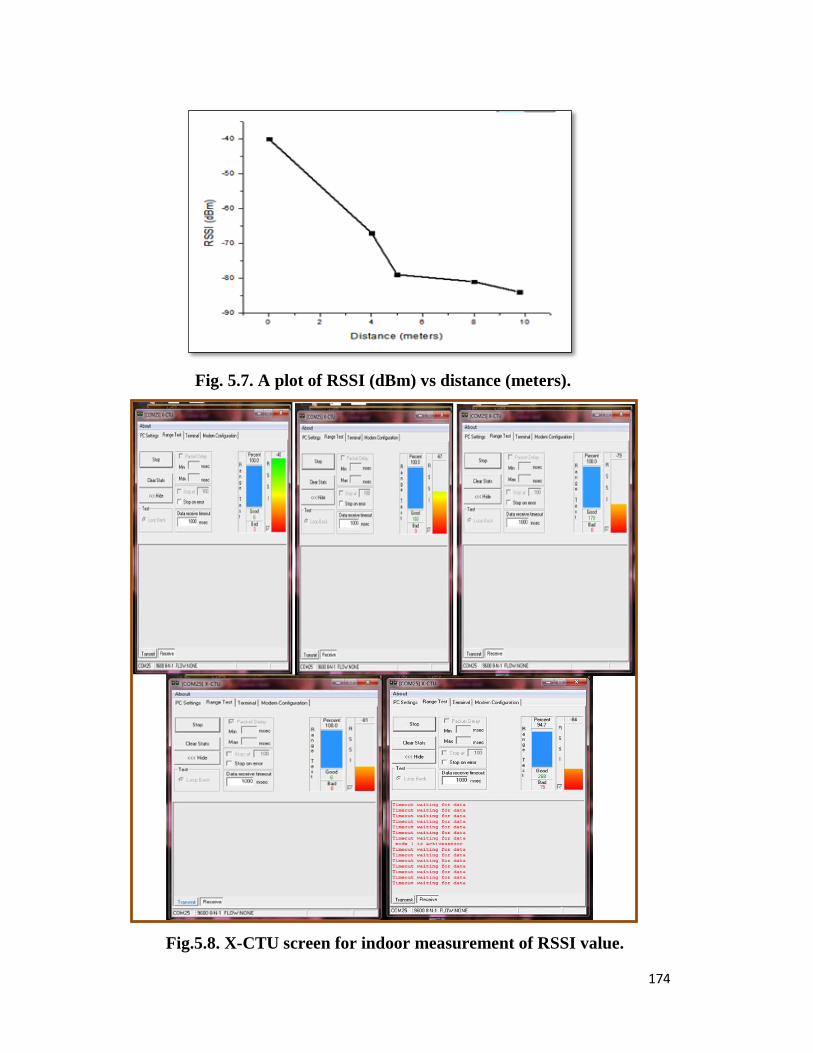
174
Fig. 5.7. A plot of RSSI (dBm) vs distance (meters).
Fig.5.8. X-CTU screen for indoor measurement of RSSI value.
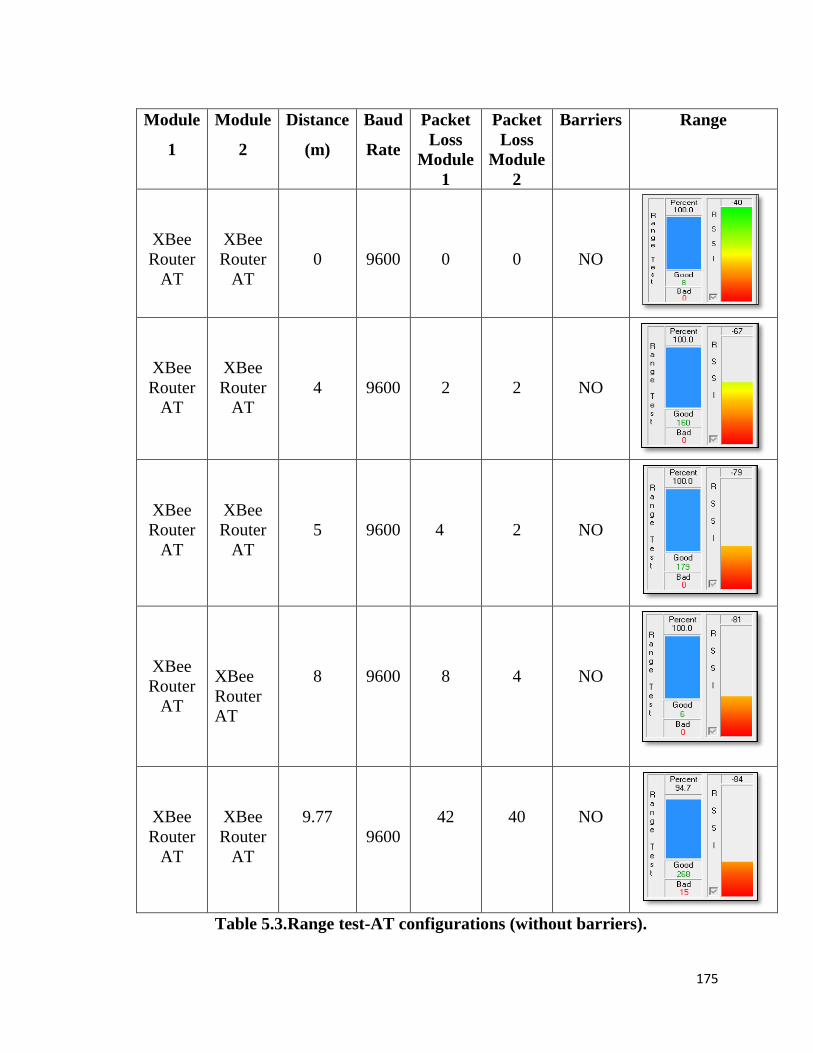
175
Module
1
Module
2
Distance
(m)
Baud
Rate
Packet
Loss
Module
1
Packet
Loss
Module
2
Barriers Range
XBee
Router
AT
XBee
Router
AT
0
9600
0
0
NO
XBee
Router
AT
XBee
Router
AT
4
9600
2
2
NO
XBee
Router
AT
XBee
Router
AT
5
9600
4
2
NO
XBee
Router
AT
XBee
Router
AT
8
9600
8
4
NO
XBee
Router
AT
XBee
Router
AT
9.77
9600
42
40
NO
Table 5.3.Range test-AT configurations (without barriers).
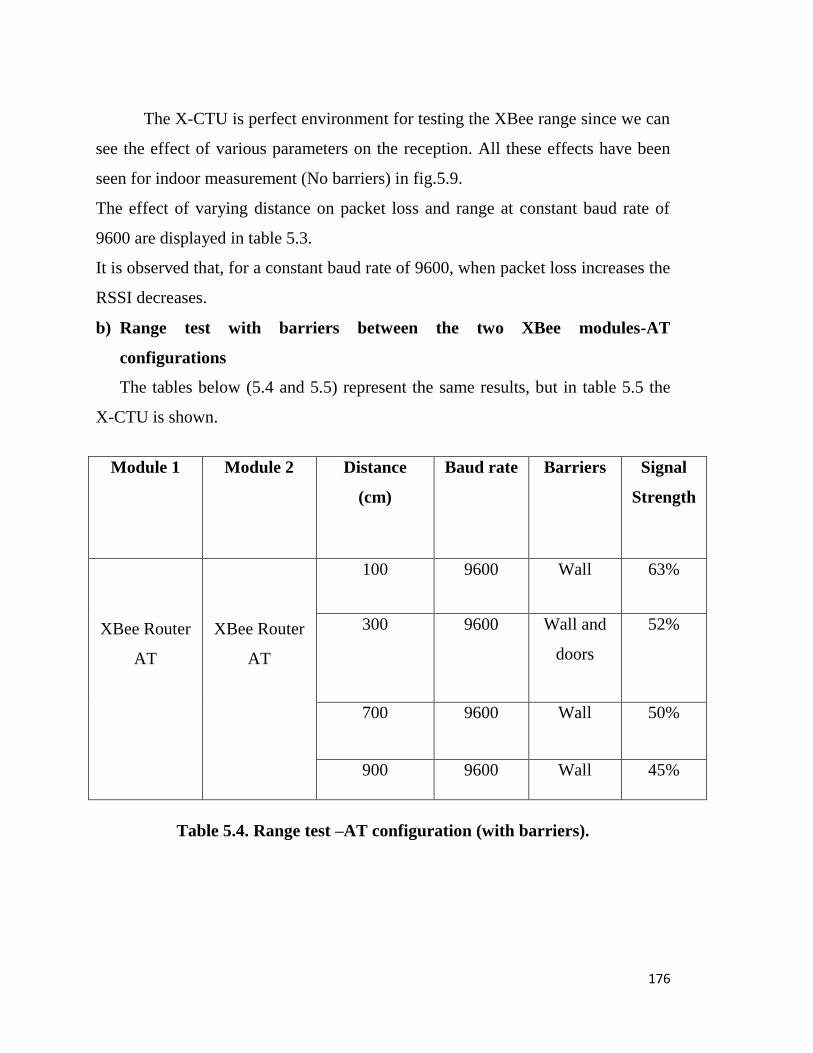
176
The X-CTU is perfect environment for testing the XBee range since we can
see the effect of various parameters on the reception. All these effects have been
seen for indoor measurement (No barriers) in fig.5.9.
The effect of varying distance on packet loss and range at constant baud rate of
9600 are displayed in table 5.3.
It is observed that, for a constant baud rate of 9600, when packet loss increases the
RSSI decreases.
b) Range test with barriers between the two XBee modules-AT
configurations
The tables below (5.4 and 5.5) represent the same results, but in table 5.5 the
X-CTU is shown.
Table 5.4. Range test –AT configuration (with barriers).
Module 1 Module 2 Distance
(cm)
Baud rate Barriers Signal
Strength
XBee Router
AT
XBee Router
AT
100 9600 Wall 63%
300 9600 Wall and
doors
52%
700 9600 Wall 50%
900 9600 Wall 45%
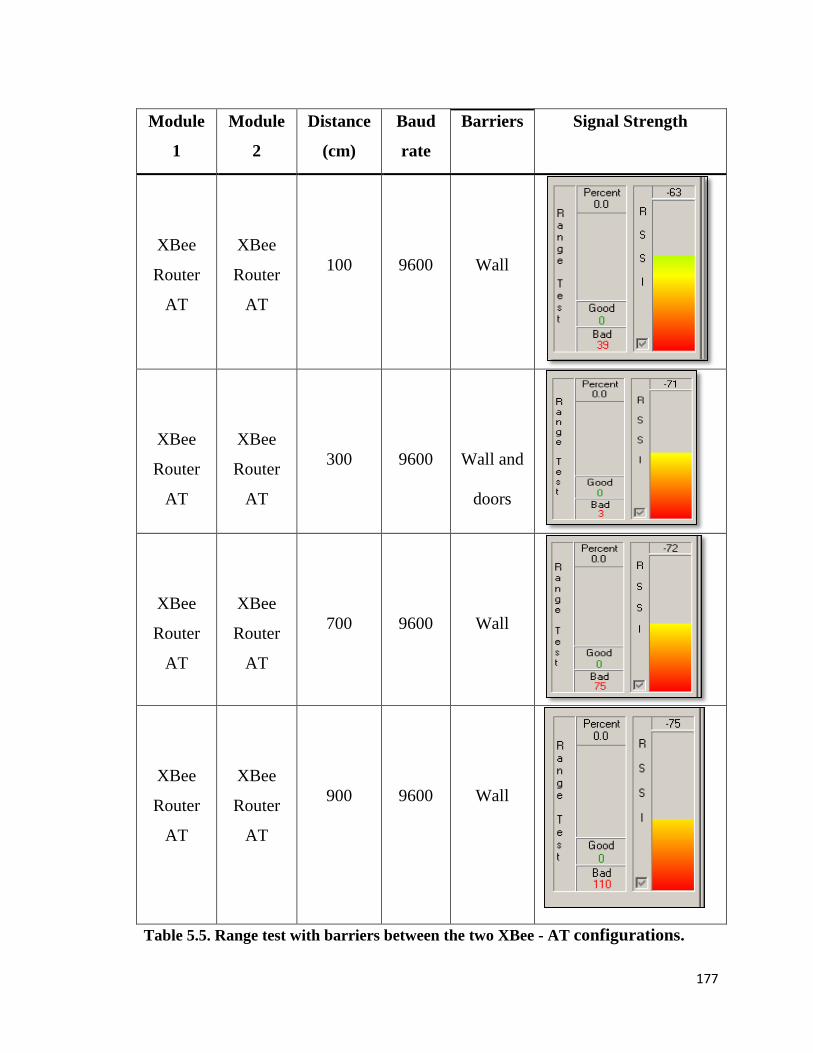
177
Module
1
Module
2
Distance
(cm)
Baud
rate
Barriers Signal Strength
XBee
Router
AT
XBee
Router
AT
100
9600
Wall
XBee
Router
AT
XBee
Router
AT
300
9600
Wall and
doors
XBee
Router
AT
XBee
Router
AT
700
9600
Wall
XBee
Router
AT
XBee
Router
AT
900
9600
Wall
Table 5.5. Range test with barriers between the two XBee - AT configurations.
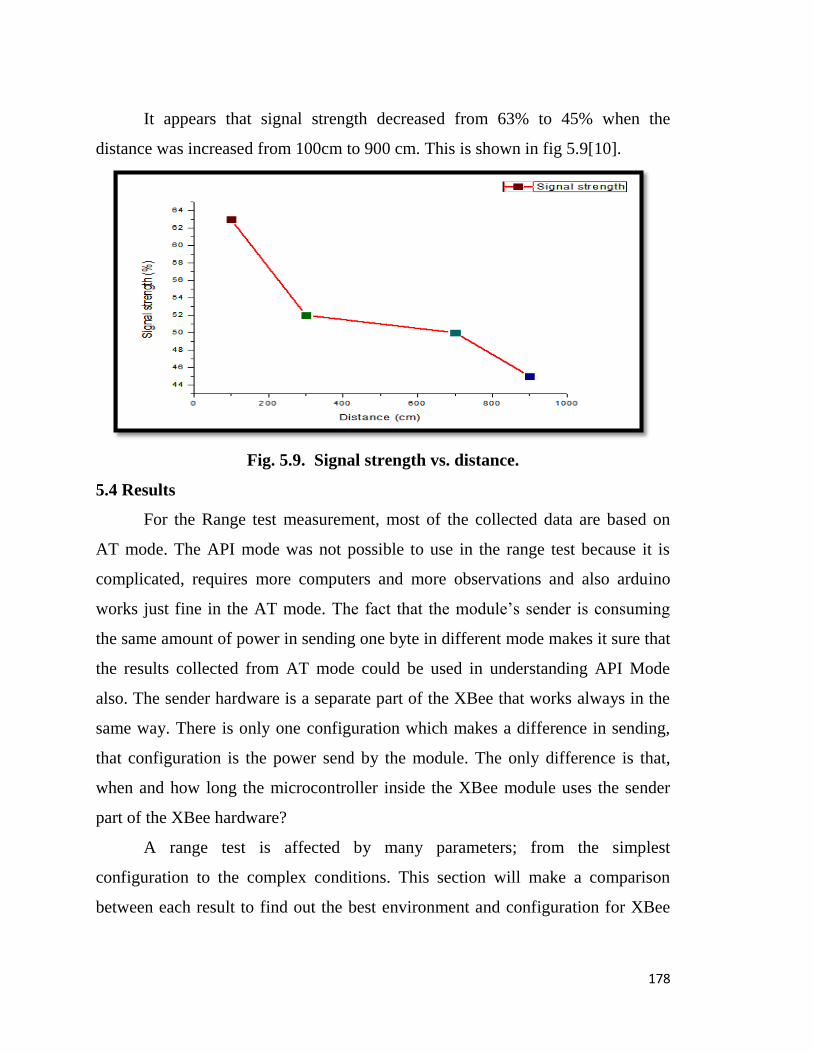
178
It appears that signal strength decreased from 63% to 45% when the
distance was increased from 100cm to 900 cm. This is shown in fig 5.9[10].
Fig. 5.9. Signal strength vs. distance.
5.4 Results
For the Range test measurement, most of the collected data are based on
AT mode. The API mode was not possible to use in the range test because it is
complicated, requires more computers and more observations and also arduino
works just fine in the AT mode. The fact that the module’s sender is consuming
the same amount of power in sending one byte in different mode makes it sure that
the results collected from AT mode could be used in understanding API Mode
also. The sender hardware is a separate part of the XBee that works always in the
same way. There is only one configuration which makes a difference in sending,
that configuration is the power send by the module. The only difference is that,
when and how long the microcontroller inside the XBee module uses the sender
part of the XBee hardware?
A range test is affected by many parameters; from the simplest
configuration to the complex conditions. This section will make a comparison
between each result to find out the best environment and configuration for XBee
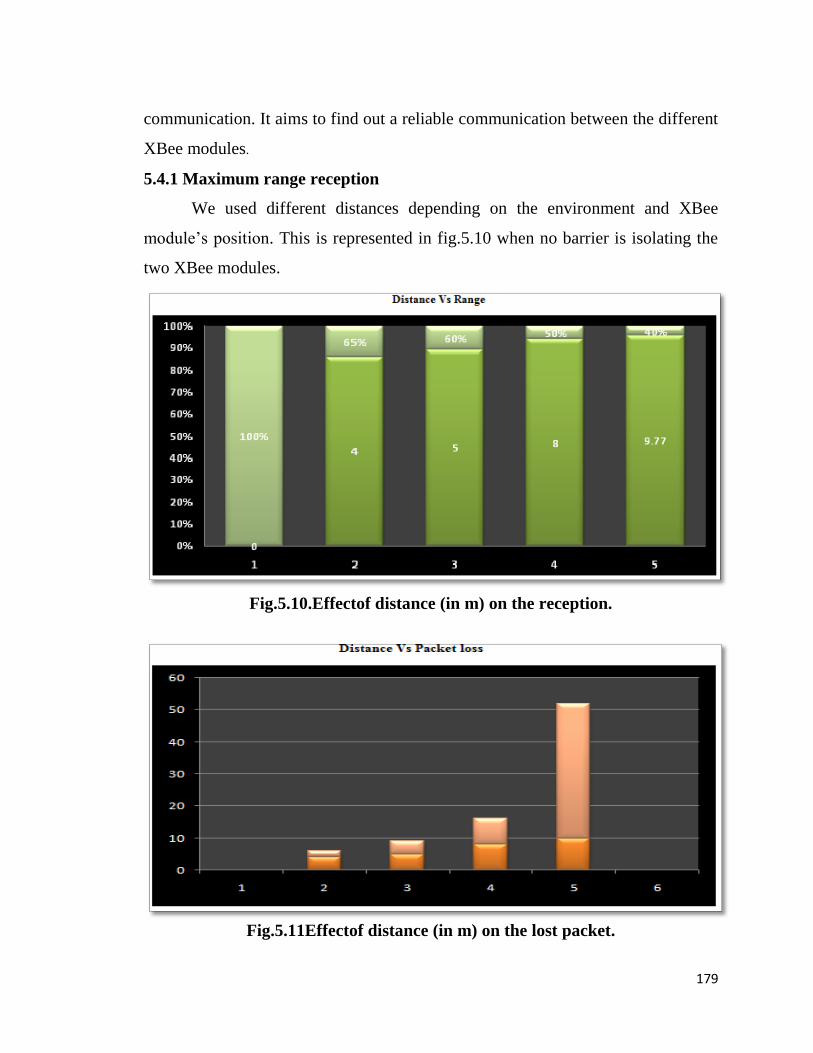
179
communication. It aims to find out a reliable communication between the different
XBee modules.
5.4.1 Maximum range reception
We used different distances depending on the environment and XBee
module’s position. This is represented in fig.5.10 when no barrier is isolating the
two XBee modules.
Fig.5.10.Effectof distance (in m) on the reception.
Fig.5.11Effectof distance (in m) on the lost packet.
180
5.5 Conclusions
The loopback test is an excellent means of testing communication and
various configurations. The XBee has a multitude of configuration settings to deal
with addressing, interfacing and input and output controls. Using X-CTU,
interface allows range testing with loopback, modem configuration and a terminal
window for communication, testing and configuration. We measured a
relationship between RSSI and distance for a point-to-point link in non-line-of-
sight (NLOS) environment. The secured range is about 9.77m. Up to 8 m distance
(without barriers), there will less packet loss.
181
References
1. Arduino. [Online]. Available: http://arduino.cc/
2. A. Manjhi, S. Nath and P .Gibbons, “Tributaries and deltas: Efficient and
robust aggregation in sensor network streams”. SIGMOD, 2005.
3. L. Ni, Y.Liu, Y.Lau and A.Patil, “LANDMARC: Indoor location
sensing using active RFID”, Wireless Networks, 10 (2004).
4. I. Solis and K. obraczka, “Efficient continuous mapping in sensor
networks using isolines”, Mobiquitous, 2005.
5. X-CTU Configuration and Test Utility Software: User’s Guide, Digi
International Inc., Aug. 2008.
6. L. Liu, Z.Wang and Y.X Sun, “Survey on Coverage in Wireless Sensor
Networks Deployment”,Journal of Electronics & Information
Technology,28(2006) 1752-1757.
7. Z. Fang, Z.Zhao, P. Guo, and Y.G.Zhang, “Analysis of Distance
Measurement Based on RSSI”, Chinese Journal of Sensors and
Actuators,20(2007) 2526-2530.
8. C.H. Wu and Y.C Chung, “Heterogeneous Wireless Sensor Network
Deployment and Topology Control Based on Irregular Sensor Model”,
Advances in Grid and Pervasive Computing, 4459(2007) 78-88.
9. G.Zhou, T.He, S. Krishnamurthy and J.A.Stankovic, “Models and
Solutions for Radio Irregularity in Wireless Sensor Networks”,ACM
Transactions on Sensor Networks (TOSN), 2(2006) 221-262.
10. T.H.Mujawar, V.D.Bachuwar, M.S.Kasbe, L.P.Deshmukh, ”Wireless
sensor network system: gas leakage detection and monitoring” IJCR,
7(2015) 18445-18450.
11. T.He, C.Huang, B.M Blum, J.A. Stankovic, and T. Abdelzaher, “Range-
Free Localization Schemes for Large Scale Sensor Networks”,

182
Proceedings of the 9th Annual International Conference on (MobiCom-
2003), San Diego, September 14-19, pp.81-95.
12. L. SeongPeng and G. H. Yeap, “Centralized Smart Home Control
System via XBee Transceivers”, ISBN: 978-1-4673-0020-9, IEEE 2011.
183
CHAPTER VI
SUMMARY AND CONCLUSIONS
185

184
185
CHAPTER VI
SUMMARY AND CONCLUSIONS
The recent proliferation of small and low-powered hardware platforms that
integrate sensing, computation and wireless communication has led to the
widespread interest and utility in the design and development of wireless sensor
networks (WSN). Such networks have key role applications in a variety of sectors
such as medical, industry, military, defense, surveillance, home, etc. Wireless
sensors allow otherwise impossible sensor applications, e.g. monitoring
dangerous, hazardous and unwired remote areas and locations. The technology
provides nearly unlimited installation flexibility for sensors and increased network
robustness. Furthermore, wireless technology reduces maintenance complexity
and costs. WSN’S allow faster deployment and installation of various types of
sensors because many of these networks provide self-organizing, self-configuring,
self-diagnosing and self-healing capabilities to the sensor nodes. Some of them
also allow flexible extension of the network. Most wireless sensors have signal
conditioning and processing units installed at the location of the sensors and
transmit signals in the digital form. As a result, noise pick-up becomes a less
significant issue. Moreover, since wire connections are deleted from the
transreceiving processes, reliability of the signal transmission and receiving is
enhanced.
On investigation, it is found that various wireless standards have been
established. Among them, the IEEE 802.15.4 (ZigBee) are used more widely for
measurement and automation applications. These standards use the
instrumentation, scientific and medical (ISM) radio bands. The 2.4 GHz band has
a wider bandwidth that allows more channels and frequency hopping and permits
compact antennas.
The literature survey showed that, most of the research work has been
carried out on gas leakage detection using wired networks. However, wired
186
sensors and monitoring systems, have many shortcomings: a long deployment
time, high maintenance cost, dependence on cable telemetry systems, the inability
of cables to resist to various damages, as well as large demand in cable supplies.
In addition, in remote places, power supply may not be available to implement the
monitoring system. Therefore, the present research work was carried out using a
WSN to replace incompatible wired network systems. Moreover, the advanced
microcontrollers with low power consumption are available to make smart WSN
nodes. Taking the above facts into account and considering out laboratory limits, it
was proposed to design and develop a system that would be able for reliable
communication without the use of wired instrumentation and process control.
Accordingly, we have chosen a system, ”Development of Wireless Sensor
Network for Hazardous Gas Leakage Detection and Alert System”, the objectives
of which are to design and develop a suitable system and methodology that can
detect presence of a natural LPG gas and send SMS alert to the end user. The
design of system being dynamic, monitoring and controlling is also of importance.
The system was designed and implemented for the detection of a natural LPG gas.
The results of implementation are interpreted adequately. In actual, we have
proposed the deployment of ZigBee technology to ensure wireless communication
needed to establish a Wireless Sensor Network. To emphasize the ZigBee
technology, an architectural details regarding ZigBee device and its programming
are extensively studied and given in chapter II .On comparative studies of various
wireless technologies, it is found that the ZigBee technology is most suitable and
plays a commendable role in the development of Wireless Sensor Network [4-
6].According to the architecture; there are two groups of ZigBee devices; the
ZigBee series 1 and ZigBee series 2. For our studies series 2 devices were
employed. Employing a highly sophisticated IDE, “The X-CTU”, the ZigBee
devices are programmed in the desired mode. Therefore, the salient features of this
IDE have been studied and understood thoroughly. The programming tool, “XBee
187
configuration and test utility” provided by the Digi corporation was used to
configure the ZigBee devices in either sensor node or co-ordinator ode
configurations. Our WSN has four sensor nodes and one co-ordinator node.
Various parameters of this ZigBee are configured. The process of configuration is
elaborated in third chapter. All these devices are configured in ultra low power
mode.
As pointed out earlier, wireless gas sensing system comprises of sensor
nodes designed for collecting gas leakage data and these nodes depict the use of an
embedded technology, wherein both hardware and software have equal
significance. The hardware for WSN node is designed and its issues are discussed
in chapter II. It is able to measure the leakage of LPG gas in the industries,
chemical plants, kitchen, etc. The design of the sensor node and co-ordinator node
are studied separately. Also, the basic study of an arduino GSM shield is described
in detail.
The gas leakages in households through the word as CNG and LPG are
very commonly used domestic gases that cause fatal accident during the leakage of
the gas. As in most cases, these gases are odourless making detection impossible
for human olfactory senses. Thus this system describes LPG gas leakage detection,
alert, monitoring and controlling. On extensive studies of different LPG sensors, it
is found that, the MQ-6 sensor is very low cost sensor, which helped to reduce the
cost of the WSN nodes and hence that of the WSN. The calibration of the sensor is
successfully done and implemented. Monitoring of the system is done using
LabVIEW tool.
The computing is the main part of the WSN node and is wired about an
arduino nano microcontroller. This microcontroller is having on chip analog to
digital converter with 10 bit resolution. To realize autonomous operation, the
WSN nodes are powered with 12 V DC rechargeable batteries. Thus, the WSN
nodes are designed and the results of implementation support the preciseness and
188
reliability of the hardware designed. The circuit is wired on a PCB designed in our
laboratory itself (home made). The chapter III deals with the software
development of our wireless gas sensing system. The present system uses XBee
for wireless communication; therefore, the firmware should cover the function of
wireless communication. The co-ordinator node is interfaced to the laptop and this
develops an effective GUI for it using a LabVIEW tool. This chapter is also
devoted to the discussion on the development of firmware for the WSN nodes and
co-ordinator node.
The chapter IV is devoted to the implementation of WSN to monitor the
hazardous gas leakage detection. It describes the complete WSN node designed for
wireless gas sensing system. To demonstrate the gas leakage data on the monitor
of the co-ordinator node, a smart Graphical User Interface (GUI) is developed in
NI’s LabVIEW tool. Moreover, since the system is designed for measurement of
the combustible gas leakage, calibration of the sensor is an essential task. After
calibration, the nodes are ready for implementation to the design system. Then the
WSN system is established and implemented. The results of implementation are
described at length. For interfacing the data transfer by ZigBee in the LabVIEW, a
required Virtual Instrument Software Architecture (VISA) configuration serial
port is described in detail. The GUI created is displayed on the web browser using
the web publishing tool. Our system (WSN) works in star topology. The GUI is
also facilitated to store the data in real time. The values of parameters, collected by
WSN nodes, are described graphically. This chapter highlights also the control of
gas leakage at where leakage happens. This system detects the leakage of the LPG
and alerts the consumer about the leak by SMS and as an emergency measure, the
system will turn off the power supply while activating the alarm. The system is
more like a First Aid, automatically uses a normally closed solenoid valve for
shutting off of the gas valve before calling for help via visual display and audible
alarm to those within the environment. Also, to turn on the exhaust fan, Arduino
189
programming for exhaust fan is provided in such a way that, when the gas
concentration is below 500 ppm exhaust fan is in off condition. When the gas
leakage level increases beyond the explosive level, the exhaust fan turns on
automatically. The required drive circuit for solenoid valve and exhaust fan are
also described in this chapter. The arduino interfacing to solenoid valve and
exhaust fan are also described carefully in this topic.
Chapter V was aimed to study the actual coverage range of the XBee- S2 in
real life conditions. For our measurements we used a loop back test which is
performed by X-CTU in order to measure the relationship between the Received
Signal Strength (RSSI) and the distance for a point to point link. Communication
between the PC and XBee is an integral part of our system. Use of Digi’s X-CTU
software and adapter interfacing with the XBee are simple for configurable
changes, firmware downloads, testing signal strength and communication to your
remote devices. In this chapter, many configuration settings of the XBee are
explored. The relationship between RSSI and distance for a point-to-point link in a
non-line-of-sight (NLOS) environment is successfully carried out. The range tests
of sensor nodes with and without barrier are successfully carried out and studied.
The effects of distance on the range are also elegantly studied and explored.
It is concluded that, as per the objectives, the Wireless Sensor Network
system is successfully designed, developed and implemented to monitor and
control the LPG gas leakage. There are various types of projects using the similar
ideas in different fields of application. However, this system has many fold useful
features compared to others, e.g., 1) Monitoring system is developed using a
LabVIEW GUI, 2)ZigBee transceiver is used to monitor the gas concentration, 3)
Alarm system built by using buzzer to alert the workers, 4) In the autonomous
control ,system triggers the exhaust fan in order to ventilate the dangerous gases in
the room as well as auto shuts down the gas supply upon the leakage happens

190
and5) This system is built for the purpose of life-saving that many people in a
wide range of industries rely on the alert to them.
Future Implementations
1. The LPG gas release/detection alarm system safety features can also be
improved by adding another function to check the sensor’s condition in case the
sensor is not working properly or if the sensor’s calibration has been displaced/
deliberately changed.
2. In near future, our motto is to add automatic windows opening system
application when the gas leakage is detected within the room / home.
3. To implement android apps.

191
INDIVIDUAL PROFILE
[Miss. Mujawar Tabbsum Hanif]
-----------------------------------------------------------------------------------------
1. Personal Information
Name: Mujawar Tabbsum Hanif
D.O.B: 20th April 1988
Marital Status: Married
Permanent Address: A/P Kalman, Tal-North solapur, Dist.- solapur
Nationality: Indian
Languages: English, Hindi, Marathi
Religion cast: Muslim
Hobbies: Reading
2. Educational Qualifications Degree University Year
Percentage
S.S.C. Latur Board Mar – 2003 89.66%
H.S.C. Pune Board Feb – 2005 83.83%
B.Sc. (Electronics) Solapur University, Solapur
Apr – 2008 82.33%
M.Sc. (Electronics) Shivaji University, Kolhapur
Apr - 2010 76.20%
SET(Electronics Sciences)
University of Pune, Pune Aug-2010 -------
NET(Electronics Sciences)
UGC-CBSE Dec-2014 --------
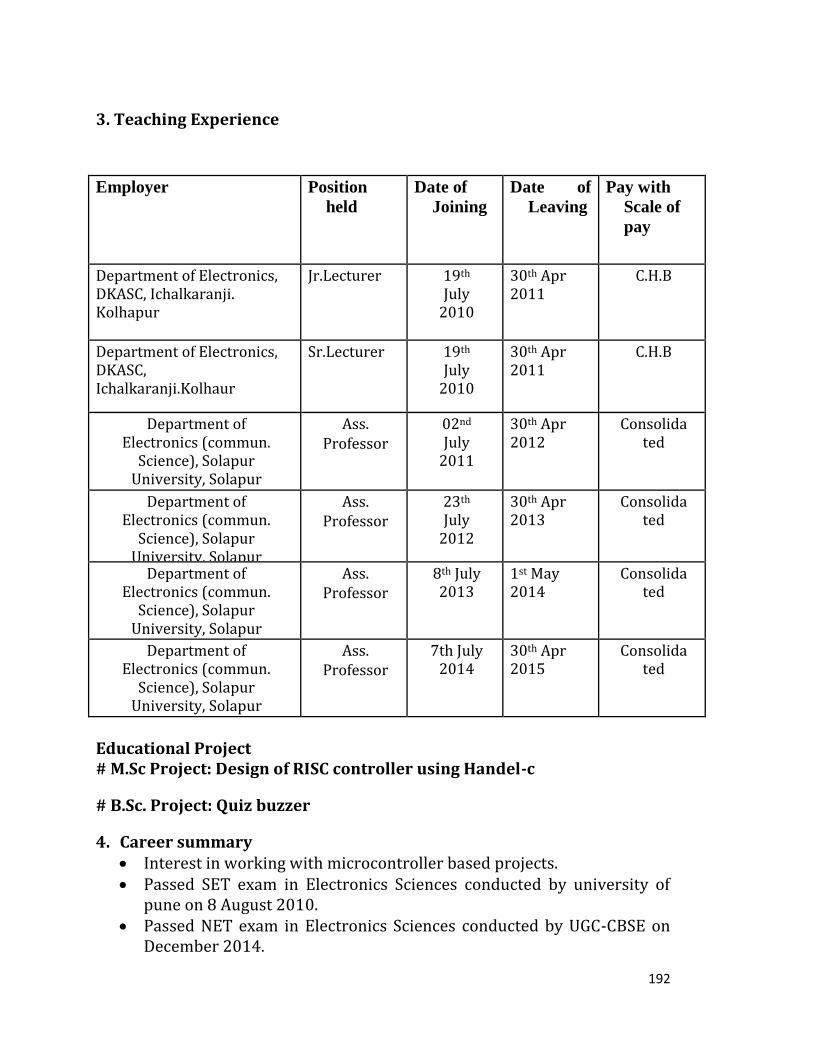
192
3. Teaching Experience
Employer
Position
held
Date of
Joining
Date of
Leaving
Pay with
Scale of
pay
Department of Electronics, DKASC, Ichalkaranji. Kolhapur
Jr.Lecturer 19th July
2010
30th Apr 2011
C.H.B
Department of Electronics, DKASC, Ichalkaranji.Kolhaur
Sr.Lecturer 19th July
2010
30th Apr 2011
C.H.B
Department of Electronics (commun.
Science), Solapur University, Solapur
Ass. Professor
02nd July
2011
30th Apr 2012
Consolidated
Department of Electronics (commun.
Science), Solapur University, Solapur
Ass. Professor
23th July
2012
30th Apr 2013
Consolidated
Department of Electronics (commun.
Science), Solapur University, Solapur
Ass. Professor
8th July 2013
1st May 2014
Consolidated
Department of Electronics (commun.
Science), Solapur University, Solapur
Ass. Professor
7th July 2014
30th Apr 2015
Consolidated
Educational Project # M.Sc Project: Design of RISC controller using Handel-c
# B.Sc. Project: Quiz buzzer
4. Career summary Interest in working with microcontroller based projects. Passed SET exam in Electronics Sciences conducted by university of
pune on 8 August 2010. Passed NET exam in Electronics Sciences conducted by UGC-CBSE on
December 2014.

193
Career Objective
My prime objective is to work for growth & development of organization
where my knowledge & skills would be my assets. I have communication and
interpersonal skills, good work ethic and the ability to work well in a team or
individual environment. My sincere efforts will give my best to organization I
join.
5. Member of Professional Bodies
Life member of Society for Promotion of Excellence in Electronics Discipline
(SPEED), 2014.
6. AWARDS AND HONOURS
1. Certificate of Merit Scholarship (April 2010) for meritorious performance in the subject of Electronics at M.Sc –I examination, Shivaji University, Kolhapur, Maharashtra, India.
2. “Late Shantaram Narayan Waigankar Paritoshik” for securing highest number of marks in the subject of Electronics at M.Sc examination held in April 2010.
3. Best First Paper Presentation Award “Development of Wireless Sensor Network for Hazardous Gas Leakage Detection”, National Conference on Recent Trends in Electronics and Instrumentation-[NCRTEI-2013], Organized by Dept. of Electronics and Instrumentation, BHARTATHIAR UNIVERSITY, COIMBATORE (T.N).
4. “Rank Certificate” :Secured 6th Rank in shivaji university amongst the examination held in April 2010 examination
7. Computer Skills
Languages
Known: C, C++, Embedded c
194
Software’s
known:
MPLAB, keil, AVR studio, proteus, ISE project
Navigator, MATLAB, CCS,X-CTU,WSN Planner
Extra work Reading Books
8. Extra Curricular Activities
1. Acted as a staff member and committee member for smooth conduct of Workshop on “Hands on Training on microcontroller” held in the year 2011-12 by Solapur University, Solapur.
2. Acted as a staff member and committee member for smooth conduct of on “MATLAB and Simulink” held in the year 2012-13 by Solapur University, Solapur.
3. Acted as a staff member and committee member for smooth conduct of Workshop on “Latest trends in material characterization techniques” held in the year 2014-15 by Solapur University, Solapur.
5. Active member of Workshop on “Latest Trends in Fundamental
Research” held in the year 2014-15 by Solapur University, Solapur.
6. Appointed as a moderator in the subject of “Mobile computing” at the M.CA (Solapur university, Solapur) on 11-1-14.
7. Appointed as a moderator in the subject of “Mobile computing” at the M.Sc Computer Science (Solapur university, Solapur) on 11-1-14.
7. Delivered a Guest lecture on “Mobile Communication” in V.P Polytechnique College, Indapur on 16-09-2011.
8. Delivered a Guest lecture on “Basics of 8051 microcontroller” in V.P Polytechnique College, Indapur on 13-02-2012.

195
9. One Year teaching experience in Junior and Senior College of DKASC College, Ichalkaranji on 19thJuly 2010 to 30th 2011.
10. Contributed as a resource person in the one day workshop
organized by department of electronics, Sangmeshwar College, Solapur on on 30/01/2015.
11. Contributed as a resource person in the one day workshop organized by department of electronics, DBF College, Solapur on 08/02/2015.
12.
Co-PI of the project submitted to the DST “Design and Development of wireless sensor network for agriculture: water irrigation management.
13.
Visited KBP Pandharpur, S.S.M Barshi, Dayanand college, Solapur and Sangmeshwar college, Solapur with a moto to explain role of Electronics(Communication Science) in S& T, Job opportunities in industrial sector.
Declaration
I hereby declare that, the particulars mentioned above are correct to the
best of my knowledge and belief.
Date:-
Place: - Solapur
Yours faithfully
(Miss.Mujawar T.H)