Embed Size (px)
Citation preview

Chapter 21
OPERATIONAL OCEANOGRAPHY IN THE U.S. NAVY: A GODAE PERSPECTIVE
John Harding and James Rigney U.S. Naval Oceanographic Office, Stennis Space Center, Mississippi, USA
Abstract: Operational oceanography, throughout its long history, has continually evolved in order to remain relevant to the changing operational needs of the U.S. Navy. This transformation continues today as operational oceanography plays a key role in the rapidly shrinking tactical decision timelines of the naval warfighter. Understanding the warfighter’s tactical questions and translating the information available from the ocean sciences into tactically useful answers is key to this transformation. Appreciating and applying advances in oceanography, such as those provided by the international Global Ocean Data Assimilation Experiment (GODAE), assures the highest technical quality of these answers. We address these transformation and translation processes and the nature of U.S. Navy operational oceanography today with specific emphasis on its interaction with GODAE.
Keywords: Operational oceanography, GODAE, U.S. Navy.
1. Introduction
Transformation, in response to the U.S. naval warfighter’s changing environmental needs, captures the essence of the evolution of U.S. Naval operational oceanography. From its 19th century genesis under Matthew Fontaine Maury and his immediate predecessors to the 21st century needs of today, operational oceanography has continued to adapt. U.S. naval oceanography first grew from Navy concerns for safety of navigation, more specifically the creation and archiving of navigational charts.
By the middle of the 20th century, World War II required increasing oceanographic support for mine warfare (MIW), amphibious warfare (AW), and antisubmarine warfare (ASW) (Pinsel, 1982). With the threat of undersea launched nuclear missiles, ASW became the dominant concern of naval operational oceanography in the last half of the 20th century through the end of the Cold War in the late 1980s.

468 JOHN HARDING AND JAMES RIGNEY
With the Cold War over, Navy leadership again reemphasized the importance of nearshore warfare requirements (Dalton et al., 1994; Kelso et al., 1992) such as MIW and AW and with a growing important role for naval special warfare (NSW). ASW, no longer the dominant warfare area, remained a significant requirement and again has arisen in importance in the 21st century (Kreisher, 2004). Technological change has greatly influenced the nature of these transformations. The longer time scales of navigational charting and ocean data base creation, while still important, are being superseded by more immediate response capabilities where near-real-time oceanographic knowledge can now provide relevant environmental information within the warfighter’s tactical decision loop (Burnett et al., 2002).
Key to this faster response time is the operational oceanographer’s ability to understand the language and needs of the warfighter. This ability allows the translation of oceanographic knowledge into operationally significant information, allowing the warfighter to more efficiently and safely perform his job.
Participation by the U.S. Navy in the Global Ocean Data Assimilation Experiment (GODAE) is a key element in providing these relevant, real-time products. While the regions within ~200 km of coastal regions are presently major concerns for the U.S. Navy, the GODAE emphasis, namely the creation of assimilative global and regional ocean prediction capability (Smith and Lefebvre, 1997), is also required. These larger domain prediction systems can supply important information to open-ocean ASW needs, provide boundary conditions to high resolution coastal models, and eventually supply global capability of sufficiently high horizontal resolution to be directly applicable to the warfighter in nearshore areas.
2. What is operational oceanography?
For the U.S. Navy, operational oceanography encompasses the fields of physical and optical oceanography, hydrography, bathymetry, acoustics, and marine geophysics. However, we will limit our discussion mainly to that sub-discipline of primary interest to GODAE, namely physical oceanography.
“Providing relevant oceanographic knowledge to the warfighter” succinctly summarizes the goal of U.S. Navy operational oceanography. To accomplish this requires smart data collection, focused analysis, and responsive delivery. The essential data must be collected either ahead of an operation, based on anticipated operational needs, or in near-real-time, directly associated with a specific operation. The specific analysis may focus on direct processing of these data via either statistical methods or more effectively through their assimilation into dynamic ocean models, thus resulting in an ocean prediction system. Finally, the results of this analysis

US NAVY OPERATIONAL OCEANOGRAPHY 469 must be returned to the warfighter within his decision timelines and in a form that he can readily understand and use.
How is operational oceanography distinct from oceanography performed in a research and development (R&D) environment? The U.S. naval operational oceanographer has a defined customer, namely the fleet user, whereas the R&D oceanographer focuses more on the scientific question(s) he seeks to answer. The operational product supports actual naval operations and exercises. The warfighter expects a timely and useful product derived from specific product requests pertaining to his operation. The operational oceanographer typically must rely on “operational” vice “research” quality data when attempting to answer a warfighter question. That is, he must make use of the limited data available rather than have the advantage of a systematic, preplanned research effort targeted at a specific scientific question. Similarly, the operational oceanographer must typically rely on rapid analyses that, given the limited data available, may not approach the statistical rigor of analyses required of publication in scientific journals. Finally, the operational oceanographer requires the capability for rapid, near-real-time monitoring and assessment of ocean product performance in order to quickly gauge its value in answering a warfighter request.
Who, more specifically, is this warfighter requesting environmental information and what sort of questions might he ask? Naval Special Clearance Team swimmers engaged in neutralizing mines in a nearshore MIW operation may ask if their operation will be limited by currents too strong or water depths too shallow. This holds true for any swimmer or low speed vehicle in the water, such as an NSW swimmer approaching a harbor or a deployed autonomous vehicle measuring nearshore bathymetry. Navy surface ships evacuating noncombatants from hostile territory, amphibious ship commanders planning amphibious assaults, or the joint (Army/Navy) warfighter planning logistics support across the beach after a successful amphibious operation may all ask if their respective operations will likely be adversely affected by surface waves and surf too large or tides too low for safe operations. ASW or MIW sonar operators searching for an adversary’s submarines or mines, respectively, may ask for the marine acoustic environment to best understand detection ranges or even what search patterns to conduct. Submarine operators or NSW swimmer delivery vehicle drivers may want to know the threat of broaching due to internal wave or soliton-induced density changes. An NSW swimmer might ask whether bioluminescence will compromise his surreptitious approach to a harbor by leaving a luminous wake trailing behind as he approaches shore. This limited sampling of warfighter questions, while only beginning to address the numerous possibilities of environmental impact on naval operations, provides a flavor of the potential impact of operational oceanography.

470 JOHN HARDING AND JAMES RIGNEY 3. U.S. NAVY operational oceanography structure
Burnett et al. (2002) provides a comprehensive description of how the U.S. Navy conducts operational oceanography with two production centers and several geographically-distributed regional centers and detachments associated with the various U.S. fleets around the world. In keeping with the history of changing requirements and the necessity to provide ever more user-focused, ocean information within the warfighter’s decision loop, this geographic-centered approach began changing in late 2004 (Rear Admiral Timothy McGee, Commander, Naval Meteorology and Oceanography Command (CNMOC), personal communication). From its former regional product delivery structure, U.S. naval operational oceanography is now transforming into a more centralized, efficient business model specifically focused on nine warfare (or warfare-supporting) disciplines. These include ASW, NSW, MIW, and Navigation, each with its own military program director. The Naval Oceanographic Office (NAVOCEANO), the primary production center for Navy oceanographic products, is already structured by technical discipline and matrixed by warfare area thus allowing it to readily adapt to this new approach. This current structure is shown in figure 1.
Both short-term requests from naval warfighters as well as longer term requirements, based on future anticipated warfighter needs, are coordinated through the Plans, Programs, and Requirements Department, currently the unifying node shown at the center of figure 1. NAVOCEANO warfare area program managers currently within this department work with the CNMOC warfare area directors to coordinate the specific warfighter requirements with the remainder of the NAVOCEANO, discipline-focused departments. The following description provides a brief synopsis of the various department activities with more departmental detail available at https://www.navo.navy.mil/pao/other/departments.htm.
From a GODAE-centric view, the Oceanography Department most closely overlaps with GODAE-related activities by collecting and processing real-time oceanographic data and assimilating these data into ocean prediction models. This, however, is only a limited subset of the department’s activities that will be related in more detail later. The Hydrography Department primarily collects and processes both shallow water and deep water bathymetry to support safety of navigation but also provides the bathymetric data bases specifically required for ocean prediction models. The Geophysics/Acoustics Department collects and processes data on water column and bottom properties primarily related to ASW and MIW and is therefore a consumer of the GODAE-related oceanographic predictions from the Oceanography Department. The Warfighting Support Center primarily engages in remotely-sensed imagery analysis but also creates composite products, especially of use to NSW, incorporating Oceanography Department data bases and model output. The Ocean Projects Department collects and analyzes targeted environmental

US NAVY OPERATIONAL OCEANOGRAPHY 471 data focused on short-term projects with special emphasis on exploring future technologies applicable to the other departments. One such example is the use of long-range autonomous underwater vehicles for potential applications in order to increase hydrographic survey efficiencies. The final three technical departments serve primarily in critical support roles to the others. The Survey Operations Center coordinates the use of NAVOCEANO’s major collection assets including the seven-ship survey fleet as well as the high-bandwidth, near-real-time ingest of survey data from the ships. Survey Operations also coordinates both shipboard and airborne buoy deployments including the NAVOCEANO participation in the international ARGO drifting buoy program (Roemmich and Owens, 2000). The Engineering Department provides support to all the sensors used on the survey ships, coordinates the primary in-house information technology support, and also maintains the environmental software libraries designed for on-scene use.
Hydrography
Oceanography Geophysics/Acoustics
SurveyOperations
Center
Engineering
OceanProjects
Warfighting Support Center
MSRC
Plans, Programs& Requirements
•Warfare Area P.M.•Short Term Fleet Requests
•Long Term Fleet Reqts.
Figure 1. Current NAVOCEANO departmental structure designed to coordinate warfighter-related “business lines” to ocean science disciplines.
The final department deserves special attention as it provides the critical computing capability required to conduct GODAE-related, real-time ocean predictions within the Oceanography Department. The Major Shared Resource Center (MSRC) is a U.S. Department of Defense R&D high performance computing (HPC) activity housed at NAVOCEANO. NAVOCEANO manages this facility and, in return for a 15% Navy

472 JOHN HARDING AND JAMES RIGNEY investment, has use of 15% of this terascale computing resource for its operational oceanographic applications, primarily numerical ocean prediction. The MSRC is one of the most capable HPC environments in the world and, given its bi-annual hardware refresh rate, regularly ranks in the top 10 computer centers globally. This facility serves a nationwide user community of over 4,000 scientists and engineers and currently includes a cumulative 30 teraop computing resource combined with petabyte hierarchical storage and multi-gigabit local/wide area network.
4. NAVOCEANO oceanography and GODAE
The Oceanography Department’s efforts in ocean prediction depend on numerous interrelated factors outlined in figure 2. The primary technology transfer of ocean prediction capability transitions via the research and development activities of the Naval Research Laboratory Oceanography Division. These activities in turn take advantage of the larger investment in academic science and technology funded via the Office of Naval Research and others (Harding et al., 1999).
NRL & ONRfor
R&D
Models &Models &Expert OceanExpert OceanForecastersForecasters
------------------------------------------------------
Ocean PredictionOcean Prediction
MSRCfor
Computation FNMOCfor
Atmos Forcing
IntegratedBuoy Program
forOngoing QC
SatelliteSST & Altimetry forData Assimilation
NAVO Surveysfor
1) In depth Evaluations2) Hydro/Bathy
Collection
Synoptic In Situ Data forData Assimilation &
QC
BathymetryCustomized for
Lower BoundaryCondition
Figure 2. Operational ocean prediction relationships and dependencies.
Oceanographic information collected during NAVOCEANO oceanographic surveys provides data for in-depth evaluations of ocean prediction products as well as the creation of ocean climatologies used directly or indirectly by the forecast systems. Bathymetry comes from the
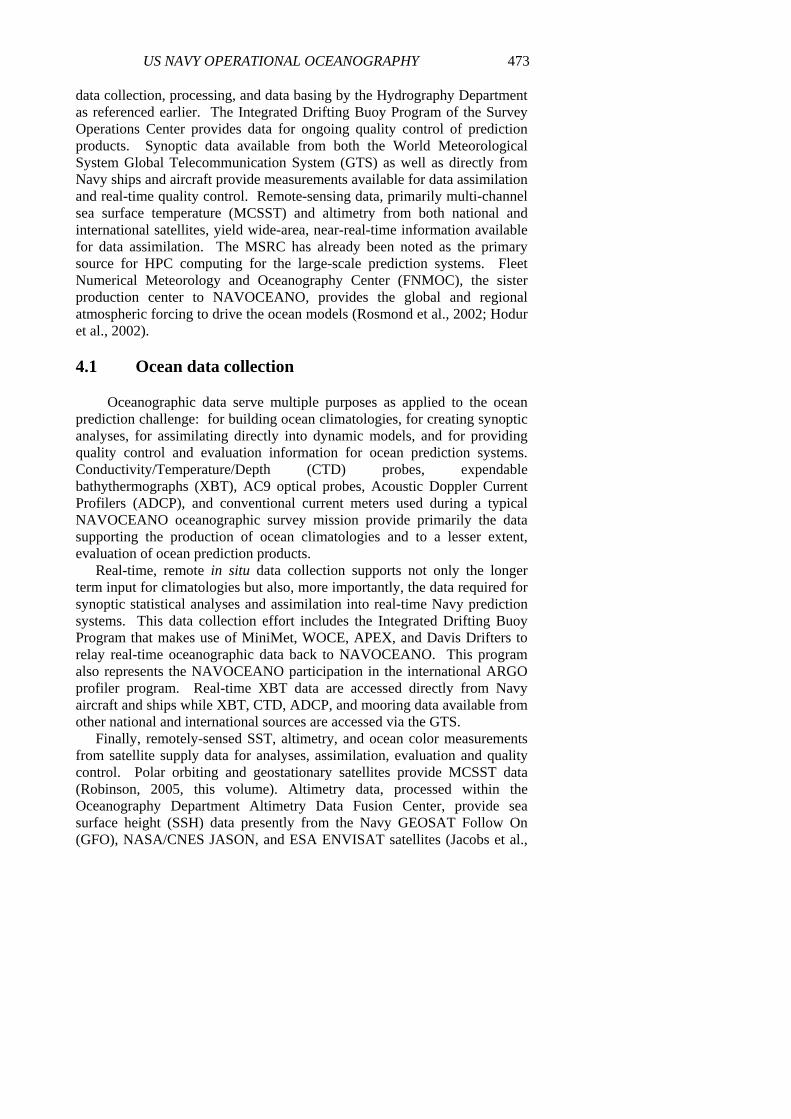
US NAVY OPERATIONAL OCEANOGRAPHY 473 data collection, processing, and data basing by the Hydrography Department as referenced earlier. The Integrated Drifting Buoy Program of the Survey Operations Center provides data for ongoing quality control of prediction products. Synoptic data available from both the World Meteorological System Global Telecommunication System (GTS) as well as directly from Navy ships and aircraft provide measurements available for data assimilation and real-time quality control. Remote-sensing data, primarily multi-channel sea surface temperature (MCSST) and altimetry from both national and international satellites, yield wide-area, near-real-time information available for data assimilation. The MSRC has already been noted as the primary source for HPC computing for the large-scale prediction systems. Fleet Numerical Meteorology and Oceanography Center (FNMOC), the sister production center to NAVOCEANO, provides the global and regional atmospheric forcing to drive the ocean models (Rosmond et al., 2002; Hodur et al., 2002).
4.1 Ocean data collection
Oceanographic data serve multiple purposes as applied to the ocean prediction challenge: for building ocean climatologies, for creating synoptic analyses, for assimilating directly into dynamic models, and for providing quality control and evaluation information for ocean prediction systems. Conductivity/Temperature/Depth (CTD) probes, expendable bathythermographs (XBT), AC9 optical probes, Acoustic Doppler Current Profilers (ADCP), and conventional current meters used during a typical NAVOCEANO oceanographic survey mission provide primarily the data supporting the production of ocean climatologies and to a lesser extent, evaluation of ocean prediction products.
Real-time, remote in situ data collection supports not only the longer term input for climatologies but also, more importantly, the data required for synoptic statistical analyses and assimilation into real-time Navy prediction systems. This data collection effort includes the Integrated Drifting Buoy Program that makes use of MiniMet, WOCE, APEX, and Davis Drifters to relay real-time oceanographic data back to NAVOCEANO. This program also represents the NAVOCEANO participation in the international ARGO profiler program. Real-time XBT data are accessed directly from Navy aircraft and ships while XBT, CTD, ADCP, and mooring data available from other national and international sources are accessed via the GTS.
Finally, remotely-sensed SST, altimetry, and ocean color measurements from satellite supply data for analyses, assimilation, evaluation and quality control. Polar orbiting and geostationary satellites provide MCSST data (Robinson, 2005, this volume). Altimetry data, processed within the Oceanography Department Altimetry Data Fusion Center, provide sea surface height (SSH) data presently from the Navy GEOSAT Follow On (GFO), NASA/CNES JASON, and ESA ENVISAT satellites (Jacobs et al.,
474 JOHN HARDING AND JAMES RIGNEY 2002). Finally, while not yet assimilated, ocean color data yield useful synoptic analyses as well as near-real-time evaluation capability for certain dynamic features in the ocean prediction models.
4.2 Data processing and relevance to NAVY applications
As noted in the introduction, the tendency for U.S. naval operational oceanography has been toward more synoptic and real-time capabilities with less emphasis on ocean climatologies that support longer-term requirements. In this light, there has been growing emphasis toward surge efforts directly supporting warfare areas such as ASW, NSW, and MIW. Today, emphasis is placed on rapid response capabilities for description of ocean parameters such as currents, temperature and salinity, waves, and optical properties. A key change is the emphasis on including forecasters in the process in order to interpret prediction model output and to generate targeted products of immediate use to the warfighter.
OceanForecaster
Oce
an M
odel
s
Bathymetry,Imagery
Real-time data
OceanClimatologies
Historical Observations
Tide Prediction, Ferna ndina Be ach NOAA vs. RMA2 (7/9/02 - 7/10/02)
-0.20
0.20.40.60.8
11.21.41.61.8
22.22.4
0 24 48
Time (hours)
Sea
Sur
face
Ele
vatio
n (m
)
NOAA Prediction
RMA2 Prediction
Dat
a Pr
oces
sing
&
Ass
imila
tion
TacticalProduct
OceanographicPredictions • Graphics
• Data Fields• Information
Atmos.Forcing
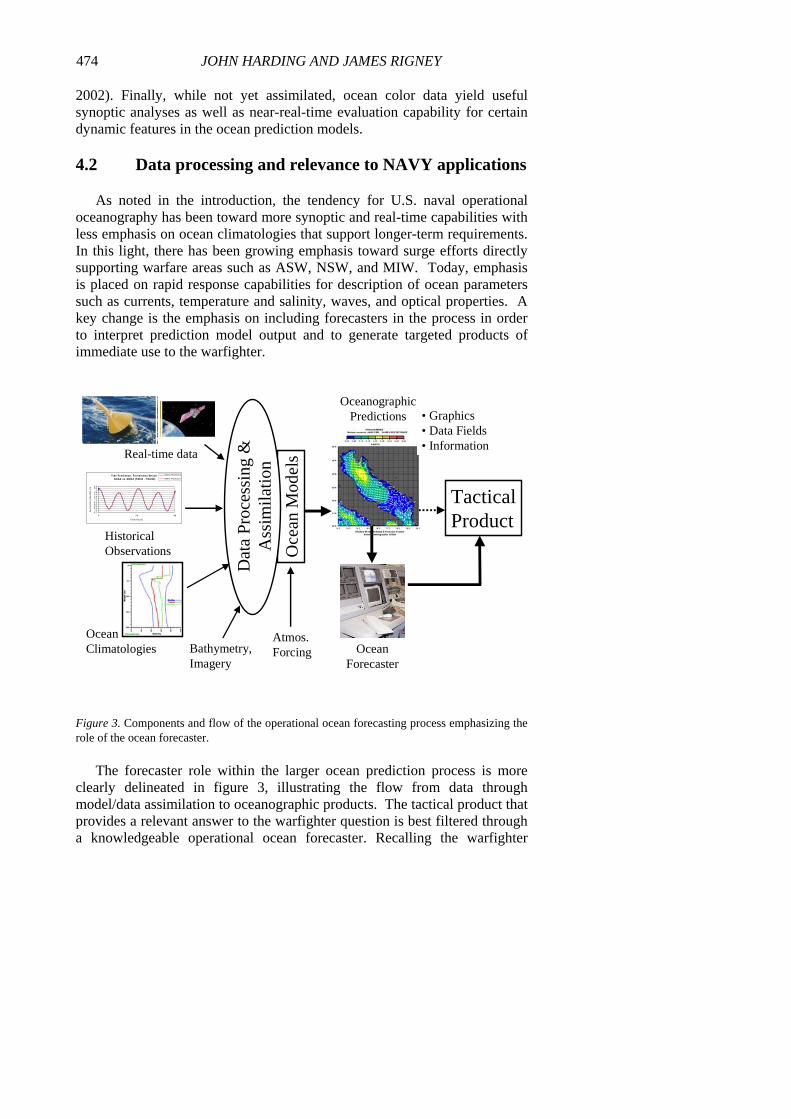
Figure 3. Components and flow of the operational ocean forecasting process emphasizing the role of the ocean forecaster.
The forecaster role within the larger ocean prediction process is more clearly delineated in figure 3, illustrating the flow from data through model/data assimilation to oceanographic products. The tactical product that provides a relevant answer to the warfighter question is best filtered through a knowledgeable operational ocean forecaster. Recalling the warfighter

US NAVY OPERATIONAL OCEANOGRAPHY 475 questions identified earlier, what are some of the specific naval applications of these ocean prediction models? A sampling includes currents and depths for diver/swimmer mission windows; currents for underwater vehicle operations, mine drift, and scour prediction; waves and tides for NSW small boat and amphibious operations; currents and waves for oil/contaminant spill prediction; and sound speed for mine and submarine detection.
Drift issues were of particular concern during operations in the Persian Gulf both in 2003 as well as in the early 1990s. At that time, the NAVOCEANO Shallow Water Analysis and Forecast System (Horton et al., 1994), based on the sigma coordinate Princeton Ocean Model design of Blumberg and Mellor (1987), provided outputs allowing both forecasts and hindcasts of objects or substances in the water. Applied to an oil drift problem in the Persian Gulf in the early 1990s, the SWAFS combined with the Navy regional atmospheric prediction capability (Hodur et al., 2002) and the NOAA oil fates code GNOME, provided guidance in protecting Saudi desalinization facilities.
Observed vs. PredictionWater Surface Elevation
1
1.5
2
2.5
3
3.5
4
4.5
5
5.5
0 24 48 72 9Time (hours)
Wat
er S
urfa
ce E
leva
tion
(m)
6
ObservedPredicted
-1.5
-1
-0.5
0
0.5
1
1.5
0 24 48 72 96Time (hours)
Wat
er S
urfa
ce E
leva
tion
(m)
SUR
FAC
E EL
EV
AT
ION
Observed vs. PredictionWater Surface Elevation
-2
-1.5
-1
-0.5
0
0.5
1
1.5
2
0 24 48 72 96Time (hours)
Wat
er S
urfa
ce E
leva
tion
(m)
ObservedPredicted
Velocity Magnitude
0
0.1
0.2
0.3
0.4
0.5
0.6
0 24 48 72 96Time (hours)
Vel
ocity
Mag
nitu
de (
knot
s)
Speed
Validation Point
Observation Point
Tidal Forcing
Depths > mean
Speeds < 1/8 m/s
Warfighter Question: When are dive windows with currents low and water level high?
0 24 48 72 96TIME (hrs)
SUR
FAC
E EL
EVA
TIO
N (m
)
SUR
FAC
E EL
EV
AT
ION
(m)
TIME
TIME (hrs)0 24 48 72 96
0.3
0.2
0.1SPEE
D (m
/s)
0
2
-2
0
Figure 4. Answering warfighter questions - an example from counter-mine warfare. When are my safe dive windows?
During Operation Iraqi Freedom, a tidally-driven, finite-element, riverine/coastal model in use at NAVOCEANO, developed by the U.S. Army Corps of Engineers, provided guidance for appropriate dive windows for mine clearance divers to remove tethered mines that were restricting relief supplies from reaching civilians in Um Qsar. The upper right-hand

476 JOHN HARDING AND JAMES RIGNEY side of figure 4 illustrates the good agreement of modeled tide heights relative to those from a historical tide gauge station. The lower left-hand side of figure 4 illustrates, with the vertical shaded bands, those time periods when speeds would be low and water level high in order to provide the safest environment for the divers responsible for eliminating the mine threat. As noted earlier, R&D-quality evaluation data are rarely available in this sort of operational situation; however, anecdotal feedback from the MIW squadron responsible suggested this environmental information reduced the mine countermeasure operations by 2 to 3 months (Steve Haeger, NAVOCEANO, personal communication).
4.3 Link to GODAE
While U.S. naval oceanography has a major focus on nearshore, high-resolution capabilities, a key issue connects it to the GODAE effort. The U.S. Navy has global responsibilities with different geographic areas having potentially different dominant ocean dynamics affecting the warfighter. For instance, in a limited domain such as the northern Persian Gulf, tides and wind-forced currents may be the dominant oceanographic impact on NSW diver operations. In a more open coastal area like the U.S. west coast, front and eddy features associated with mesoscale dynamics or coastally trapped waves generated by meteorological events hundreds or even thousands of kilometers distant may add significant time-dependent variability that can affect a coastal mission. Until computer resources become sufficient to run a global model at resolutions to accurately describe the required dynamics, a nesting approach (figure 5) is required. Burnett et al. (2002) provides a table of current operational or near-operational prediction systems, from ocean currents to thermal structure to surface waves, and how they are used. The present global, dynamic ocean prediction capability is based on a combination of the Navy Layered Ocean Model (NLOM) and the global application of the Navy Coastal Ocean Model (NCOM) as described by Rhodes et al. (2002). By 2007, NAVOCEANO plans to operationally run a system based on the Hybrid Coordinate Ocean Model (HYCOM) as described by Chassignet et al. (2005, this volume). The present operational, regional capability, SWAFS, was described earlier with several regional applications of NCOM planned for transition. For high-resolution coastal domains, NAVOCEANO presently uses several models with the expected future direction focusing increasingly on the finite element approach used in the ADvanced CIRCulation model (ADCIRC) (Blain et al., 2002). In general, the Navy must be prepared to take a global view to get a coastal environmental description.
An obvious example is the propagation of swell energy generated from southern Pacific storms that can affect surf forecasts on the U.S. West Coast. Westward propagating mesoscale eddies can bring open-ocean mesoscale energy into the South China Sea through the Luzon Strait from the Pacific

US NAVY OPERATIONAL OCEANOGRAPHY 477 (Metzger and Hurlburt, 2001) or affect the southeast coast of the Arabian Peninsula after propagating westward across the Arabian Sea. Global prediction capabilities are also important to operational forecasters in areas where a rapid answer may be required and a higher resolution coastal model is not available.
Global Regional EstuaryGlobal Regional Estuary
Nesting Approach:Coastal Emphasis
Figure 5. The U.S. Navy nested model approach to ocean prediction.
Until computing resources allow operational global models to attain sufficiently high resolution, large-area regional models, also related to the GODAE effort, are equally important. A real-time Gulf of Mexico/Caribbean NCOM, currently run in R&D context by NRL and planned for transition to NAVOCEANO, supplies an example. Dr. Dong Shan Ko of NRL provides skill assessments of computed storm surge by comparing model-predicted coastal ocean heights to independent tide gauge measurements along the northern Gulf. Ko also demonstrates predictability of the mesoscale eddy structure of the Gulf of Mexico/Caribbean by comparing it to independent ocean color data. For more detail see www.oceans.nrlssc.navy.mil/iasfcst.
Fox et al. (2002) provides examples of the impact of such mesoscale oceanography on both acoustic ray paths and propagation loss, demonstrating the difference when one uses a climatological data base compared to the current real-time operational statistical interpolation system. When crossing a Gulf Stream-like frontal feature, the real-time result provides increased probability of detection due to bottom bounce ray paths

478 JOHN HARDING AND JAMES RIGNEY while at the same time potentially missing a detection of a near-surface adversary as the surface acoustic duct disappears.
Internal waves/ solitons can also have a significant impact, altering surface layer depth both temporally as they propagate through an area and directionally depending if acoustic propagation is along or across crests. Sperry et al. (2003) describe “interesting time-and-range-variable population of the acoustic normal modes” due to tidally generated soliton packets in the shelf-slope region off the eastern United States. Ramp et al. (2002) present the interesting result that some of the largest soliton signals in the northeastern South China Sea are generated, not locally in the South China Sea but in the Luzon Strait, another example of the importance of remote forcing. NAVOCEANO, in partnership with ONR and Dave Fratantoni of Woods Hole Oceanographic Institution, deployed Slocum Gliders in the Philippine Sea in 2004. They found internal waves to be a notable temporal signal in the upper ocean thermal structure in the open western Pacific with significant impact on the sound speed structure of the upper ocean (Lorens, 2004, personal communication). Figure 6 compares the primarily tidal temporal variability associated with one such glider with a regional East Asian Seas NCOM including tidal forcing and global NCOM without tides. The overall qualitative agreement of the global model with the measured thermal structure is reasonable, although the thermostad between 50-100 m in the data is not well represented. The regional model provides a better comparison, albeit again without the thermostad, where the tidal signal begins to appear but without the expected amplitude.

US NAVY OPERATIONAL OCEANOGRAPHY 479
22
24
26
28
Dep
th (m
)
Temperature (Deg C) Glider0
50
100
150
200
22
24
26
28
Dep
th (m
)
Temperature (Deg C) EAS NCOM at Glider0
50
100
150
200
22
24
26
28
Dep
th (m
)
Temperature (Deg C) Global NCOM at Glider
Date(month/day/2004) GMT05/09 05/10 05/11 05/12 05/13 05/14 05/15 05/16
0
50
100
150
200
Figure 6. Measured western Pacific temperature profiles vs. time compared to global NCOM, without tidal input, and a regional NCOM, including tides, illustrating the need for additional ocean prediction R&D (Courtesy Dr. Rob Lorens, Oceanography Department, NAVOCEANO).
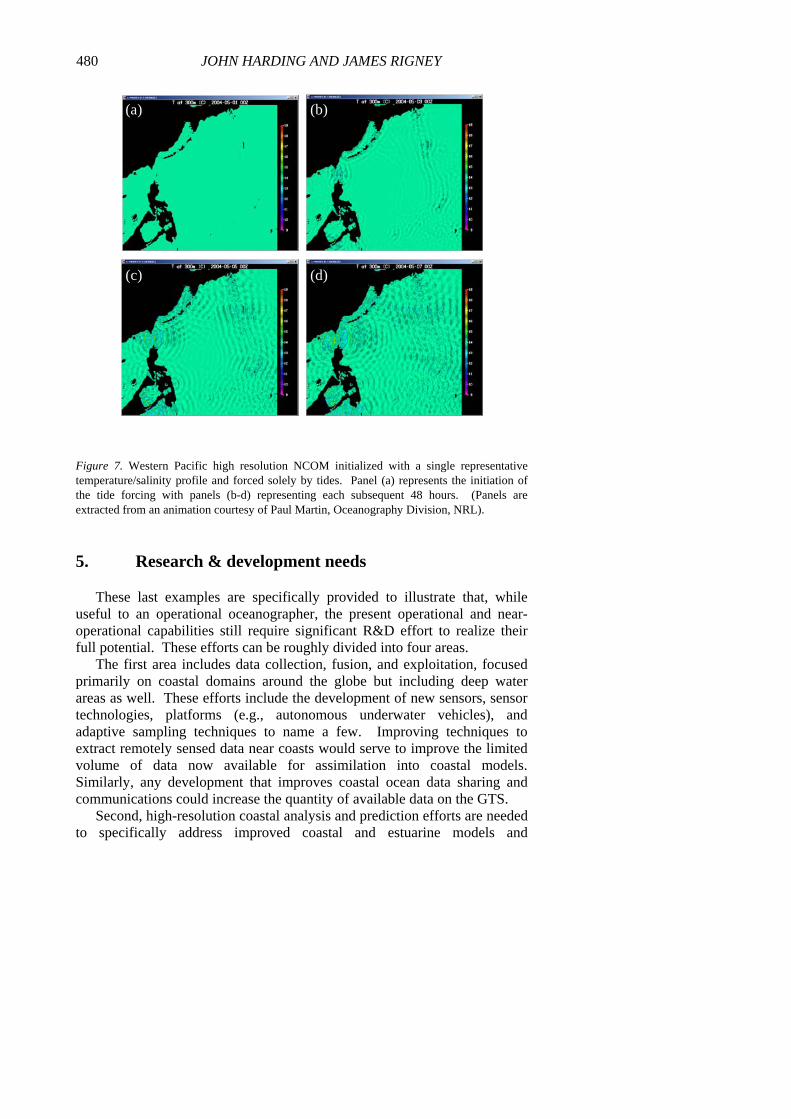
Higher horizontal resolution and especially improved data assimilation may be required to better resolve what appears to be the result of a tidal/topographic interaction (figure 7). A non-assimilative, regional, western Pacific NCOM tidal simulation with ~5 km resolution suggests that topographic interaction is the source for these open-ocean internal wave signals (Paul Martin, NRL, personal communication). Initialized with representative uniform stratification and forced solely by barotropic tides, the simulation yields reasonable amplitudes and complex interference patterns in the 300 m temperature with the generation zones appearing at the locations of significant bathymetric features. Panel (a) represents the initiation of the tide forcing with panels (b-d) representing each subsequent 48 hours. Note especially the strong variability associated with the Luzon Strait consistent with the strong South China Sea soliton generation region proposed by Ramp et al. (2002). The strong signals in the open waters of the Philippine Sea are similarly consistent with the temporal thermocline variability in figure 6.
480 JOHN HARDING AND JAMES RIGNEY
(a)
(c)
(b)
(d)
Figure 7. Western Pacific high resolution NCOM initialized with a single representative temperature/salinity profile and forced solely by tides. Panel (a) represents the initiation of the tide forcing with panels (b-d) representing each subsequent 48 hours. (Panels are extracted from an animation courtesy of Paul Martin, Oceanography Division, NRL).
5. Research & development needs
These last examples are specifically provided to illustrate that, while useful to an operational oceanographer, the present operational and near-operational capabilities still require significant R&D effort to realize their full potential. These efforts can be roughly divided into four areas.
The first area includes data collection, fusion, and exploitation, focused primarily on coastal domains around the globe but including deep water areas as well. These efforts include the development of new sensors, sensor technologies, platforms (e.g., autonomous underwater vehicles), and adaptive sampling techniques to name a few. Improving techniques to extract remotely sensed data near coasts would serve to improve the limited volume of data now available for assimilation into coastal models. Similarly, any development that improves coastal ocean data sharing and communications could increase the quantity of available data on the GTS.
Second, high-resolution coastal analysis and prediction efforts are needed to specifically address improved coastal and estuarine models and

US NAVY OPERATIONAL OCEANOGRAPHY 481 assimilation techniques. One key area is the need for improved quality control techniques for coastal data to minimize the amount discarded. This would partially alleviate the lack of adequate coastal information available for assimilation and validation in many regions.
Third, and most closely related to GODAE, are the global/regional analysis and prediction R&D efforts targeting improvements to global and regional models and assimilation techniques. The need to account for dynamic processes with high temporal and spatial variability, as highlighted at the end of the previous section, provides a notable example.
The fourth and final area covers real-time and near-real-time evaluation, visualization, and applications. The operational oceanographer needs tools to rapidly evaluate prediction system output in order to assign confidence measures to any product sent to the warfighter. Direct warfighter applications are also required, such as the drift tools for search and rescue.
6. Summary
U.S. naval operational oceanography has a long history of evolving as different ocean warfare challenges arise, fade, and rise again. The role of the operational oceanographer is to translate the available oceanographic knowledge into accurate information relevant to the warfighter, namely within his tactical decision loop and specifically focused on his particular warfare challenge. Finally, GODAE plays a key role providing state-of-the-science, global capability supporting open-ocean warfighter issues including ASW, as well as providing boundary conditions to high resolution, coastal prediction systems applicable to those warfare areas with greater shallow water emphasis such as NSW, AW, and MIW.
Acknowledgements
The authors greatly thank Dr. Rob Lorens of the NAVOCEANO Oceanography Department for providing the basis for figure 6 and Paul Martin of the NRL Oceanography Division for the animation used to create figure 7. Special thanks are due to Veronica Nichols of the NAVOCEANO technical publications group for her extensive editing of the original manuscript.
References
Blain, C.A., Preller, R.H., and Rivera, A.P., 2002, Tidal prediction using the Advanced Circulation Model (ADCIRC) and a relocateable PC-based system, Oceanography, 15: 77-87.

482 JOHN HARDING AND JAMES RIGNEY Blumberg, A.F. and Mellor, G.L., 1987, A description of a three-dimensional coastal
circulation model, In: Three-Dimensional Coastal Circulation Models, ed. N. Heaps, pp. 208, Washington, American Geophysical Union.
Burnett, W., Harding, J., and Heburn, G., 2002, Overview of operational ocean forecasting in the U.S. Navy: Past, present & future, Oceanography, 15: 4-12.
Dalton, J.H., Boorda, J.M., and Mundy, C.E., 1994, Forward… From the sea, Proceedings of the United States Naval Institute, December: 46-49.
Fox, D.N., Barron, C.N., Carnes, M.R., Booda, M., Peggion, G, and Van Gurley, J, 2002, The Modular Ocean Data Assimilation System, Oceanography, 15: 22-28.
Harding J.M., Carnes, M.C., Preller, R.H. and Rhodes, R., 1999, The Naval Research Laboratory role in naval ocean prediction. MTS Jour., 33, 67-79.
Hodur, R.M., Pullen, J., Cummings, J., Hong, X., Doyle, J.D., Martin, P., Rennick, M.A., 2002, The Coupled Ocean/Atmosphere Mesoscale Prediction System (COAMPS), Oceanography, 15: 88-97.
Horton, C., Clifford, M., Schmitz, W., Hester, B., 1994, SWAFS: Shallow Water Analysis and Forecast System overview and status report, Technical Report, Naval Oceanographic Office, Stennis Space Center, MS 39522, pp. 53.
Jacobs, G.A., Barron, C.N., Fox. D.N., Whitmer, K.R., Klingenberger, S., May, D., and Blaha, J.P., 2002, Operational altimeter sea level products, Oceanography, 15: 13-21.
Kelso, F.B., Mundy, C.E. and O’Keefe, S., 1992, … From the sea. Proceedings of the United States Naval Institute, November, 93-96.
Kreisher, O., 2004, An underwater threat re-emerges, Navy renews emphasis on ASW, Sea Power, October, http://www.military.com/NewContent/0,13190,NL_ASW_100404-P1,00.html.
Metzger, E.J. and Hurlburt, H.E., 2001, The importance of high horizontal resolution and accurate coastline geometry in modeling South China Sea inflow, Geophys. Res, Let., 28:1059-1062.
Pinsel, M.I., 1982, 150 Years of Service on the Seas, A Pictorial History of the U.S. Naval Oceanographic Office, Superintendent of Documents, U.S. Government Printing Office, Washington, D.C. 20402, pp. 56-69.
Ramp, S.R., Chiu, C.S., Bahr, F.L., Lynch, J., Duda, T., Tang, D., Liu, A.K., 2002, Tracking the generation sites and packet variability of internal solitons in the south China Sea, J. Acoust. Soc. Am., 12: 2449.
Rhodes, R.C., Hurlburt, H.E., Wallcraft, A.J., Barron, C.N., Martin, P.J., Metzger, E.J., Shriver, J.F., Ko, D.S., O.M., Cross, S.L., and Kara, A.B., 2002, Navy real-time global modeling systems, Oceanography, 15: 29-43.
Roemmich, D. and W.B. Owens, 2000, The ARGO Project: Global ocean observations for understanding and prediction of climate variability. Oceanography, 13, 45-56.
Rosmond, T.E., Teixeira, J., Peng, M., Hogan, T.F., and Pauley, R., 2002, Navy Operational Global Atmospheric Prediction System (NOGAPS), Oceanography, 15: 99-108.
Smith, N, and Lefebvre, M., 1997, The Global Ocean Data Assimilation Experiment (GODAE). Monitoring the oceans in the 2000s: an integrated approach. International Symposium, Biarritz, October 15-17.
Sperry, B.J., Lynch, J.F., Gawarkiewicz, G., Chiu, C.S., Newhall, A., 2003, Characteristics of acoustic propagation to the eastern vertical line array receiver during the summer 1996 New England shelfbreak PRIMER experiment, IEEE/JOE, 28: 729-749.