Embed Size (px)
Citation preview
CHAPTER FIVE
Working Capital and Current Asset Management
“The airline industry confronts some of the most challenging economic and operating
conditions it has ever known. More than ever, airlines must reduce costs, maximize asset utilization, and enhance the customer experience so that they can retain and grow their
customer base in an intensely competitive environment.” - Oracle Corporation
In order to operate effectively, airlines must be aware of the short-term financial decision-making process. Concepts such as managing cash and working capital, short-term financing, current assets and liabilities management, and managing inventory are all important to the everyday operation of an airline. In order for an airline or any business to operate, the business must be able to pay their liabilities as they come due. Current assets, in particular cash, are used to pay current liabilities. It is important to have enough cash on hand to pay liabilities, but how much cash is enough? Can there be such a problem as having too much cash? We answer these questions and discuss other issues surrounding current assets and liabilities in this chapter.
The following topics are covered in this chapter:
o Working Capital Policy
o Cash Management
o Cash Shortages
o Cash Surpluses
§ Liquidity (Cash) Management Models
o Fluctuations in Cash Flow
o Foreign Exchange
o Operating Cycle
o Accounts Receivable
o Current Liabilities Management
o Terms of Credit
o Inventory Control Models
o Inventory Carrying (Holding) Costs
o Economic Ordering Quantity (EOQ)
o Just-In-Time (JIT)
o ABC Inventory Control
Draft 3/27/2009
2
Working Capital Policy
"We believe that we currently have adequate cash on hand to meet our operating needs."
-Chief Executive Sean Menke,
Frontier Airlines, the day Frontier filed for bankruptcy
Before discussing the management of current assets, the concept of working capital must be
explained. Working capital (WC) is defined as the difference between current assets and current
liabilities. Therefore, WC is the amount of current assets left over after subtracting current
liabilities. It is also the amount of current assets that is being financed by long-term liabilities or
equity. Without a working capital margin an airline is likely to have problems paying its short-
term liabilities which may include fuel bills, wages, or current rent for facilities. A company that
is unable to pay its bills in a timely manner is likely to not be able to receive credit from other
companies. There have even been occasions in history where airlines been refused refueling due
to issues with credit (Serling, 2008) or the airline’s company credit card, causing pilots and/or
passengers to pay for the fuel on their own credit cards or with their own cash (The Ottawa
Citizen, 1988, September 12). Maintaining working capital is so crucial for a company that many
companies develop a working capital policy.
Developing a working capital policy is crucial to maintaining adequate reserves of
current assets in order to pay current liabilities.
Current Assets include:
• Cash
• Marketable Securities
• Accounts Receivable
• Inventory
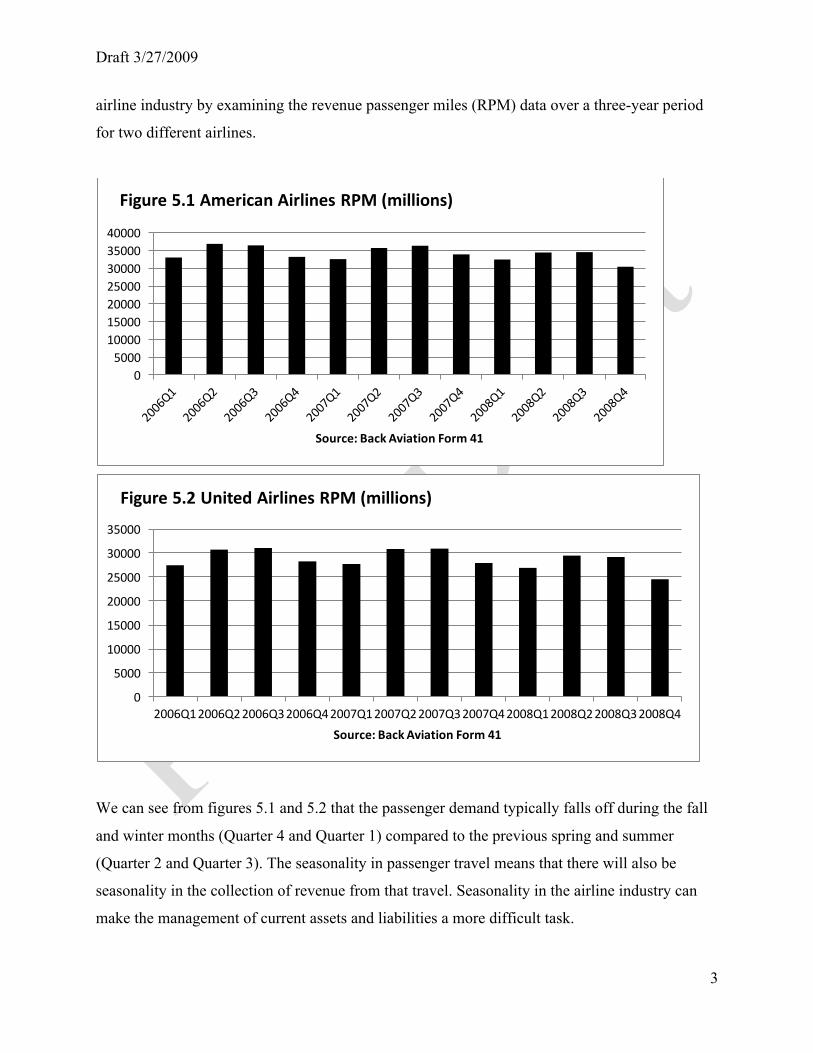
The airline industry is a good example of companies with seasonal and fluctuating demand. By
the nature of the travel industry, demand is strong during holiday periods. In addition, certain
seasons of the year experience heavier traffic than others. For example, heavy travel occurs in
the spring and summer seasons. In figures 5.1 and 5.2 we see the seasonality that occurs in the
Draft 3/27/2009
3
airline industry by examining the revenue passenger miles (RPM) data over a three-year period
for two different airlines.
We can see from figures 5.1 and 5.2 that the passenger demand typically falls off during the fall
and winter months (Quarter 4 and Quarter 1) compared to the previous spring and summer
(Quarter 2 and Quarter 3). The seasonality in passenger travel means that there will also be
seasonality in the collection of revenue from that travel. Seasonality in the airline industry can
make the management of current assets and liabilities a more difficult task.
05000
10000150002000025000300003500040000
Source: Back Aviation Form 41
Figure 5.1 American Airlines RPM (millions)
0
5000
10000
15000
20000
25000
30000
35000
2006Q12006Q22006Q32006Q42007Q12007Q22007Q32007Q42008Q12008Q22008Q32008Q4Source: Back Aviation Form 41
Figure 5.2 United Airlines RPM (millions)
Draft 3/27/2009
4
Airlines must decide the necessary monetary safeguard between current assets and
current liabilities and can do so in one of two methods. The first of these is a working capital
policy that is based on the current ratio of assets to liabilities. For example, a company may have
policy that the current ratio should be greater than or equal to 1.5 to 1. A working capital policy
that states that the current ratio must be greater than or equal to 1.5 means that for every $1 in
current liabilities there must be $1.50 in current assets.
Current Ratio ≥ 1.5
Current Liabilities = $1,000,000
Current Assets ≥ $1,500,000
The other method of developing a working capital policy is to develop a flat amount that must be
maintained as a margin. For instance a working capital policy may state that working capital will
always be at least $1,000,000.
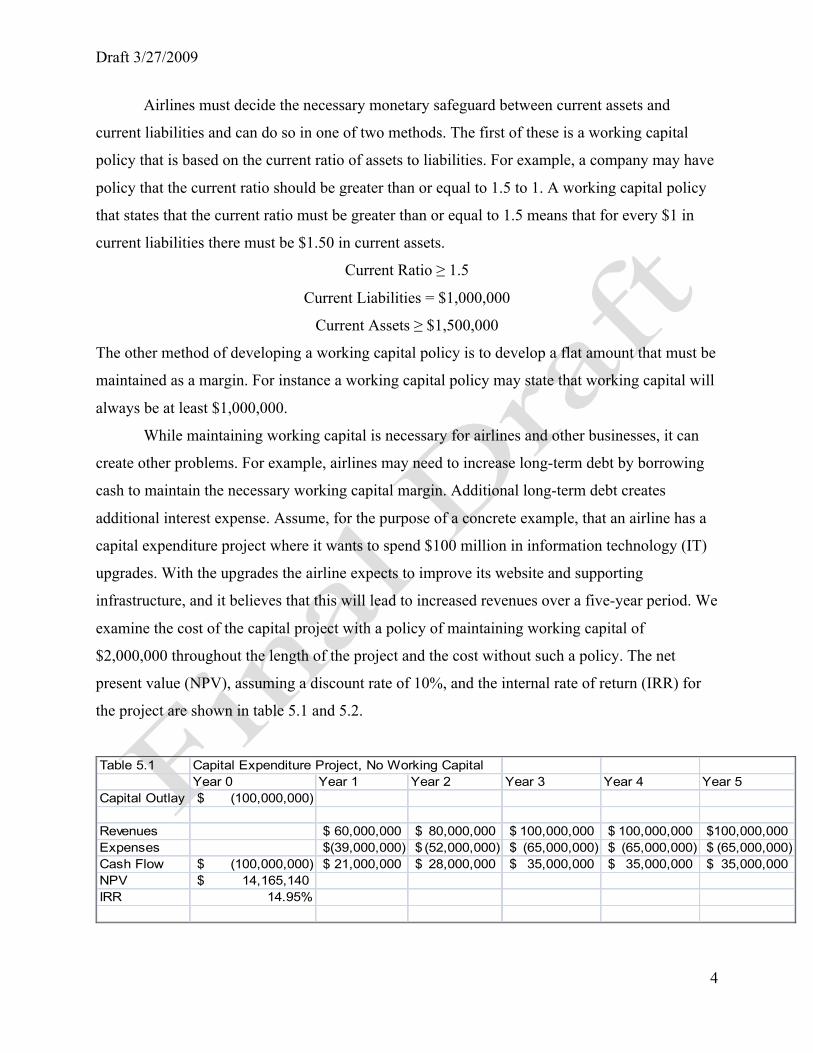
While maintaining working capital is necessary for airlines and other businesses, it can
create other problems. For example, airlines may need to increase long-term debt by borrowing
cash to maintain the necessary working capital margin. Additional long-term debt creates
additional interest expense. Assume, for the purpose of a concrete example, that an airline has a
capital expenditure project where it wants to spend $100 million in information technology (IT)
upgrades. With the upgrades the airline expects to improve its website and supporting
infrastructure, and it believes that this will lead to increased revenues over a five-year period. We
examine the cost of the capital project with a policy of maintaining working capital of
$2,000,000 throughout the length of the project and the cost without such a policy. The net
present value (NPV), assuming a discount rate of 10%, and the internal rate of return (IRR) for
the project are shown in table 5.1 and 5.2.
Table 5.1 Capital Expenditure Project, No Working Capital
Year 0 Year 1 Year 2 Year 3 Year 4 Year 5Capital Outlay (100,000,000)$
Revenues 60,000,000$ 80,000,000$ 100,000,000$ 100,000,000$ 100,000,000$ Expenses (39,000,000)$ (52,000,000)$ (65,000,000)$ (65,000,000)$ (65,000,000)$ Cash Flow (100,000,000)$ 21,000,000$ 28,000,000$ 35,000,000$ 35,000,000$ 35,000,000$ NPV 14,165,140$ IRR 14.95%
Draft 3/27/2009
5
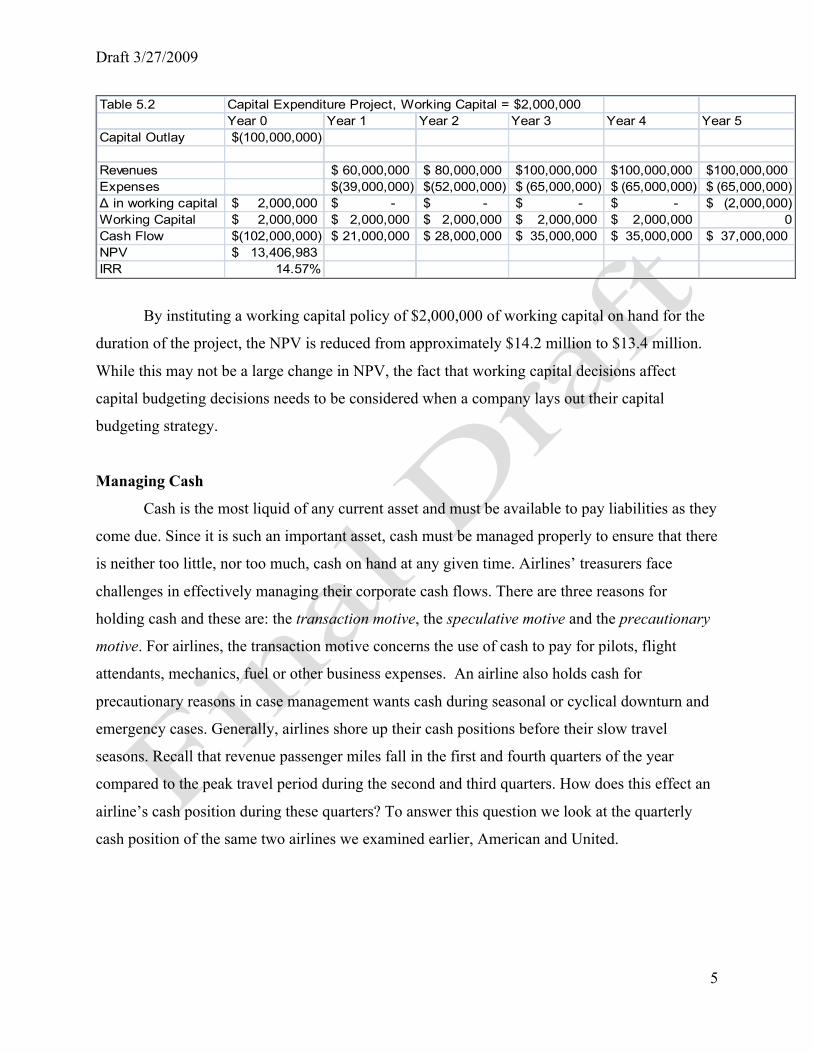
Table 5.2 Capital Expenditure Project, Working Capital = $2,000,000Year 0 Year 1 Year 2 Year 3 Year 4 Year 5
Capital Outlay (100,000,000)$
Revenues 60,000,000$ 80,000,000$ 100,000,000$ 100,000,000$ 100,000,000$ Expenses (39,000,000)$ (52,000,000)$ (65,000,000)$ (65,000,000)$ (65,000,000)$ Δ in working capital 2,000,000$ -$ -$ -$ -$ (2,000,000)$ Working Capital 2,000,000$ 2,000,000$ 2,000,000$ 2,000,000$ 2,000,000$ 0Cash Flow (102,000,000)$ 21,000,000$ 28,000,000$ 35,000,000$ 35,000,000$ 37,000,000$ NPV 13,406,983$ IRR 14.57%
By instituting a working capital policy of $2,000,000 of working capital on hand for the
duration of the project, the NPV is reduced from approximately $14.2 million to $13.4 million.
While this may not be a large change in NPV, the fact that working capital decisions affect
capital budgeting decisions needs to be considered when a company lays out their capital
budgeting strategy.
Managing Cash
Cash is the most liquid of any current asset and must be available to pay liabilities as they
come due. Since it is such an important asset, cash must be managed properly to ensure that there
is neither too little, nor too much, cash on hand at any given time. Airlines’ treasurers face
challenges in effectively managing their corporate cash flows. There are three reasons for
holding cash and these are: the transaction motive, the speculative motive and the precautionary
motive. For airlines, the transaction motive concerns the use of cash to pay for pilots, flight
attendants, mechanics, fuel or other business expenses. An airline also holds cash for
precautionary reasons in case management wants cash during seasonal or cyclical downturn and
emergency cases. Generally, airlines shore up their cash positions before their slow travel
seasons. Recall that revenue passenger miles fall in the first and fourth quarters of the year
compared to the peak travel period during the second and third quarters. How does this effect an
airline’s cash position during these quarters? To answer this question we look at the quarterly
cash position of the same two airlines we examined earlier, American and United.
Draft 3/27/2009
6
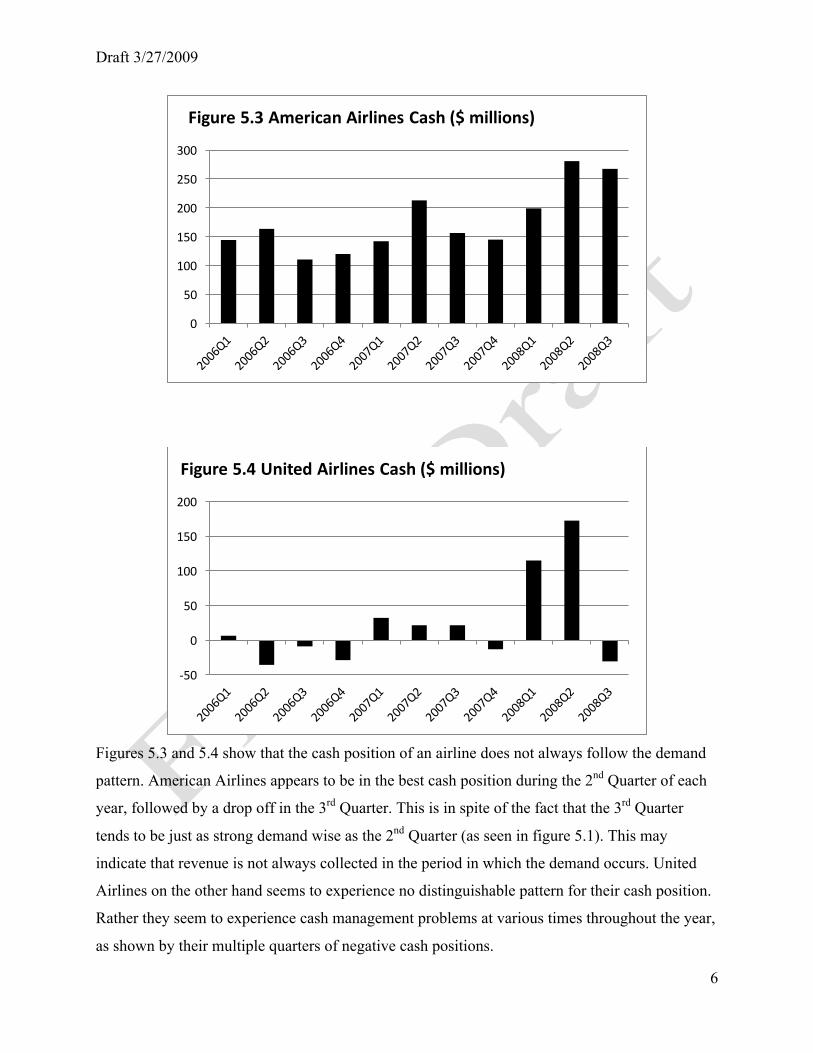
Figures 5.3 and 5.4 show that the cash position of an airline does not always follow the demand
pattern. American Airlines appears to be in the best cash position during the 2nd Quarter of each
year, followed by a drop off in the 3rd Quarter. This is in spite of the fact that the 3rd Quarter
tends to be just as strong demand wise as the 2nd Quarter (as seen in figure 5.1). This may
indicate that revenue is not always collected in the period in which the demand occurs. United
Airlines on the other hand seems to experience no distinguishable pattern for their cash position.
Rather they seem to experience cash management problems at various times throughout the year,
as shown by their multiple quarters of negative cash positions.
0
50
100
150
200
250
300
Figure 5.3 American Airlines Cash ($ millions)
-‐50
0
50
100
150
200
Figure 5.4 United Airlines Cash ($ millions)
Draft 3/27/2009
7
A slowing economy and high fuel prices forced many airlines such as Aloha Airlines,
ATA, and Champion Air out of business (International Herald Tribune, 2008, April 8).
Therefore, airlines hold precautionary motive cash balances as a financial reserve in the event of
unanticipated change in cash outflows or cash inflows. A healthy precautionary cash balance
may keep an airline from bankruptcy in more difficult financial times. Finally, airlines hold cash
to be in the right position to take advantage of attractive investment opportunities that might
arise. For example, if some carriers go out of business, then the remaining airlines may be able to
take advantage of market opportunities if they have cash available for expansion. After the
failure of Aloha and ATA, Southwest Airlines took out additional cash reserves both as a
precautionary measure and for the speculative motive that other carriers might fail. If this
occurred then the strong cash reserves could leave Southwest with an opportunity to expand
quickly (SmartBrief, 2008).
There are four basic problems that companies can experience with cash management:
• Shortage of Cash • Surplus of Cash • Fluctuations in Cash Flow • Foreign Exchange
Cash Shortages:
Generally, cash deposits do not produce any great returns, but many airlines view the
cash as a buffer against potential future insolvency. An airline with little cash may face potential
insolvency if current liabilities outweigh the airline’s ability to pay. The aim of cash
management is to allow airlines to have enough cash to pay the interest on their debt, as well as
other current liabilities, and at the same time make investments in short term interest bearing
assets (Besley and Brigham, 2000).
Companies can end up short on cash for a number of reasons. The first reason that a
shortage of cash could occur is if somebody either within or outside the organization is pilfering
(stealing) cash. Therefore, management generally places strong restrictions over who has access
to cash and checks. Cash is usually locked in a safe or put in a bank or other secure location.
Checks normally require two signatures by officers of the company to be valid and they remain
locked in a secure location. In today’s technology driven economy, fraud can also be committed
Draft 3/27/2009
8
through computers. Access to financial information is heavily secured by a company’s
information technology through the use of encryption, passwords, and biometric technology such
as fingerprints and facial recognition software.
While fraud and theft can be a problem for companies, mismanagement of cash is just as
likely to be a problem. Managers have many different tools they can use so that a company does
not become short on cash. In the short-term managers can use tools such as:
§ Cash Forecasting
§ Developing Relationships with Lenders
§ Free Financing
§ Credit Control
Managers can forecast the amount of cash they will receive each month based on historical
projections of sales, collections of accounts receivable, payments made to suppliers/creditors,
supplies needed, demand forecasts, etc. Producing a cash forecast, also called the cash budget, is
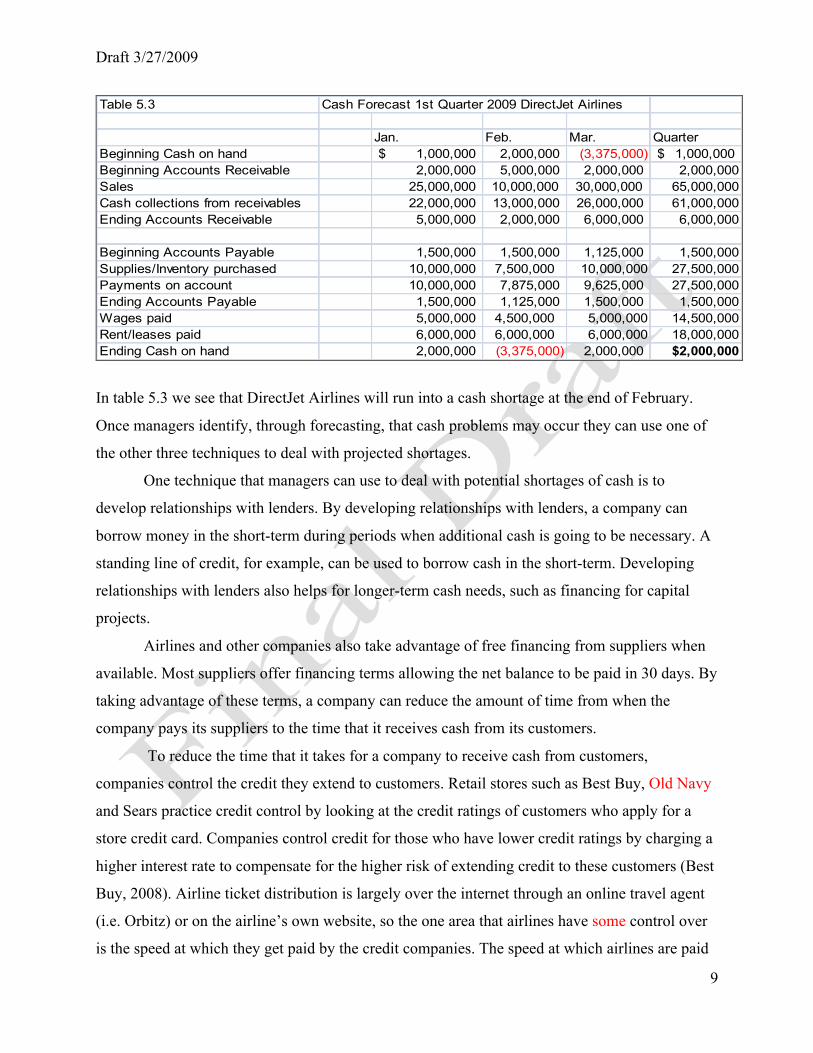
one of a managers most important tools in properly managing cash (Wensveen, 2007). Table 5.3
shows what a cash forecast might look like for DirectJet Airlines in the first quarter of 2009.1
1 The data in the table assumes: 80% of Accounts Receivable (A/R) is retrieved in the month it is generated and 20% the next month. 85% of Accounts Payable (A/P) is paid in the month it is incurred, 15% the following month
All sales are credit sales and all supply purchases are on credit At the beginning of the quarter cash on hand is $1,000,000, A/R is $2,000,000 and A/P is $1,500,000
Draft 3/27/2009
9
Table 5.3 Cash Forecast 1st Quarter 2009 DirectJet Airlines
Jan. Feb. Mar. QuarterBeginning Cash on hand 1,000,000$ 2,000,000 (3,375,000) 1,000,000$ Beginning Accounts Receivable 2,000,000 5,000,000 2,000,000 2,000,000Sales 25,000,000 10,000,000 30,000,000 65,000,000Cash collections from receivables 22,000,000 13,000,000 26,000,000 61,000,000Ending Accounts Receivable 5,000,000 2,000,000 6,000,000 6,000,000
Beginning Accounts Payable 1,500,000 1,500,000 1,125,000 1,500,000Supplies/Inventory purchased 10,000,000 7,500,000 10,000,000 27,500,000Payments on account 10,000,000 7,875,000 9,625,000 27,500,000Ending Accounts Payable 1,500,000 1,125,000 1,500,000 1,500,000Wages paid 5,000,000 4,500,000 5,000,000 14,500,000Rent/leases paid 6,000,000 6,000,000 6,000,000 18,000,000Ending Cash on hand 2,000,000 (3,375,000) 2,000,000 $2,000,000
In table 5.3 we see that DirectJet Airlines will run into a cash shortage at the end of February.
Once managers identify, through forecasting, that cash problems may occur they can use one of
the other three techniques to deal with projected shortages.
One technique that managers can use to deal with potential shortages of cash is to
develop relationships with lenders. By developing relationships with lenders, a company can
borrow money in the short-term during periods when additional cash is going to be necessary. A
standing line of credit, for example, can be used to borrow cash in the short-term. Developing
relationships with lenders also helps for longer-term cash needs, such as financing for capital
projects.
Airlines and other companies also take advantage of free financing from suppliers when
available. Most suppliers offer financing terms allowing the net balance to be paid in 30 days. By
taking advantage of these terms, a company can reduce the amount of time from when the
company pays its suppliers to the time that it receives cash from its customers.
To reduce the time that it takes for a company to receive cash from customers,
companies control the credit they extend to customers. Retail stores such as Best Buy, Old Navy
and Sears practice credit control by looking at the credit ratings of customers who apply for a
store credit card. Companies control credit for those who have lower credit ratings by charging a
higher interest rate to compensate for the higher risk of extending credit to these customers (Best
Buy, 2008). Airline ticket distribution is largely over the internet through an online travel agent
(i.e. Orbitz) or on the airline’s own website, so the one area that airlines have some control over
is the speed at which they get paid by the credit companies. The speed at which airlines are paid
Draft 3/27/2009
10
is determined through contracts called covenants with banks and other financial institutions;
typically, all of an airline’s credit card transactions are processed by a limited number of banks
or other financial institutions. The financial company holds back a percentage of the revenue as
collateral in case the individual credit companies do not pay the full amounts that their customers
have charged. If airlines can demonstrate that a very high percentage of accounts receivable from
their customers are collected, the company in charge of processing these transactions and
collecting payment will generally hold back a lower percentage of the airline’s revenue. For
example, United Airlines announced that it was able to reach such an agreement with one of its
credit card processors, Paymentech, and it is estimated that the agreement gives United $350
million in additional available cash (United Airlines, 2008, July 22). Therefore, airlines can
potentially increase the amount of cash on hand by negotiating with the credit card processing
companies.
Cash Surplus:
While not having enough cash can be a major problem for airlines and other aviation
companies, having too much cash is also a problem. When a company has more cash than is
needed, it means that cash is sitting idle when it could be invested and creating a return for the
company. If a company has more cash on hand than is necessary to pay current liabilities, that
cash should be invested into marketable securities. Marketable securities are short-term
investments that can easily be sold and converted into cash; marketable securities are typically
lower-yielding than bonds or stocks that are held for the long-term (Brigham & Gapenski, 1994).
The idea behind investing in marketable securities is not to generate a huge rate of return but
rather to gain some return, rather than having cash sitting idle. The marketable security can then
be sold in a period where the company needs cash to pay current liabilities. Some examples of
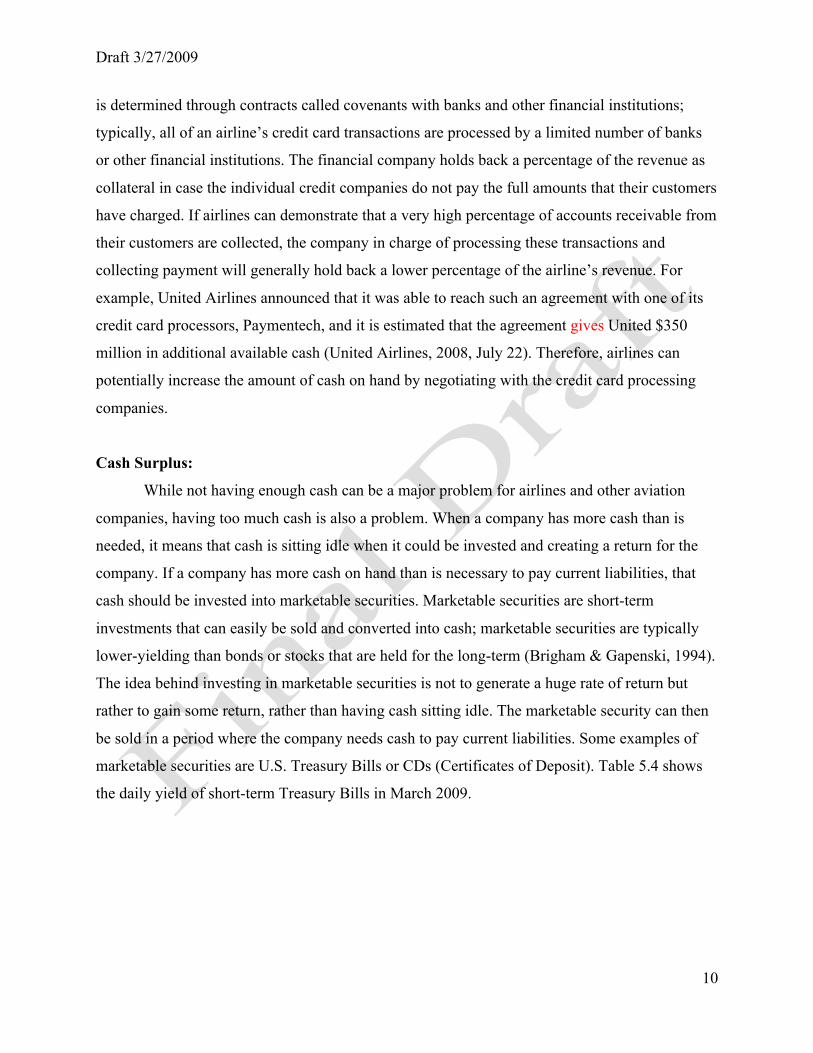
marketable securities are U.S. Treasury Bills or CDs (Certificates of Deposit). Table 5.4 shows
the daily yield of short-term Treasury Bills in March 2009.
Draft 3/27/2009
11
Table 5.4 Daily Treasury Bill Yields- March 20092
4 WEEKS 13 WEEKS 26 WEEKS 52 WEEKS
DATE BANK DISCOUNT
COUPON EQUIVALENT
BANK DISCOUNT
COUPON EQUIVALENT
BANK DISCOUNT
COUPON EQUIVALENT
BANK DISCOUNT
COUPON EQUIVALENT
03/02/2009 0.15 0.15 0.28 0.28 0.44 0.45 0.64 0.65
03/03/2009 0.14 0.14 0.27 0.27 0.43 0.44 0.65 0.66
03/04/2009 0.14 0.14 0.26 0.26 0.43 0.44 0.67 0.68
03/05/2009 0.10 0.10 0.20 0.20 0.39 0.40 0.63 0.64
03/06/2009 0.08 0.08 0.20 0.20 0.38 0.39 0.63 0.64
03/09/2009 0.11 0.11 0.23 0.23 0.46 0.47 0.66 0.67
03/10/2009 0.14 0.14 0.24 0.24 0.46 0.47 0.70 0.71
03/11/2009 0.14 0.14 0.23 0.23 0.45 0.46 0.70 0.71
03/12/2009 0.10 0.10 0.21 0.21 0.44 0.45 0.69 0.70
03/13/2009 0.08 0.08 0.19 0.19 0.41 0.42 0.66 0.67
03/16/2009 0.09 0.09 0.24 0.24 0.45 0.46 0.67 0.68
03/17/2009 0.14 0.14 0.24 0.24 0.44 0.45 0.67 0.68
03/18/2009 0.15 0.15 0.21 0.21 0.39 0.40 0.58 0.59
03/19/2009 0.09 0.09 0.20 0.20 0.39 0.40 0.58 0.59
03/20/2009 0.08 0.08 0.21 0.21 0.40 0.41 0.58 0.59
03/23/2009 0.08 0.08 0.22 0.22 0.40 0.41 0.58 0.59
03/24/2009 0.05 0.05 0.21 0.21 0.41 0.42 0.60 0.61
03/25/2009 0.02 0.02 0.19 0.19 0.40 0.41 0.58 0.59
03/26/2009 0.01 0.01 0.15 0.15 0.38 0.39 0.55 0.56
Source: U.S. Department of Treasury
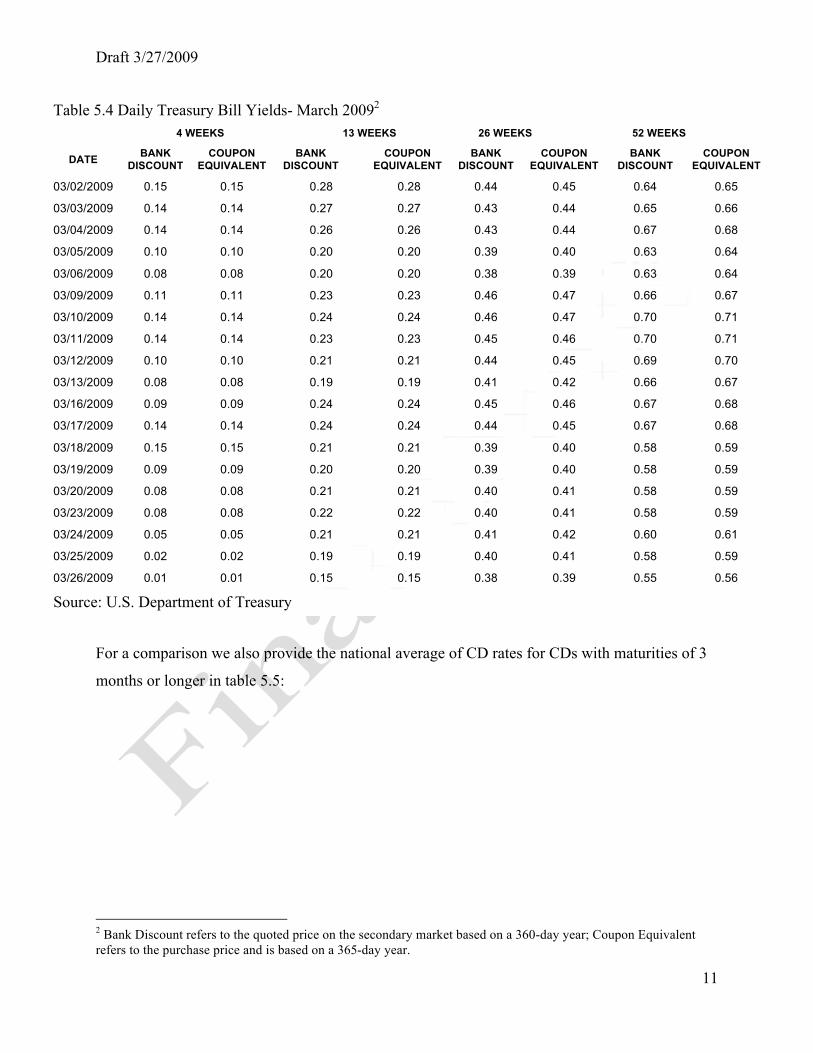
For a comparison we also provide the national average of CD rates for CDs with maturities of 3
months or longer in table 5.5:
2 Bank Discount refers to the quoted price on the secondary market based on a 360-day year; Coupon Equivalent refers to the purchase price and is based on a 365-day year.
Draft 3/27/2009
12
Table 5.5 U.S. Certificate of Deposit (CD) averages as of 3/27/2009Term Rate3 months 3.15%5 months 3.12%6 months 3.23%9 months 3.05%12 months 2.94%18 months 3.02%24 months 3.02%30 months 3.13%36 months 3.08%48 months 3.42%60 months 3.33%Source: http://www.best-certificate-rates.com/site/national_averages
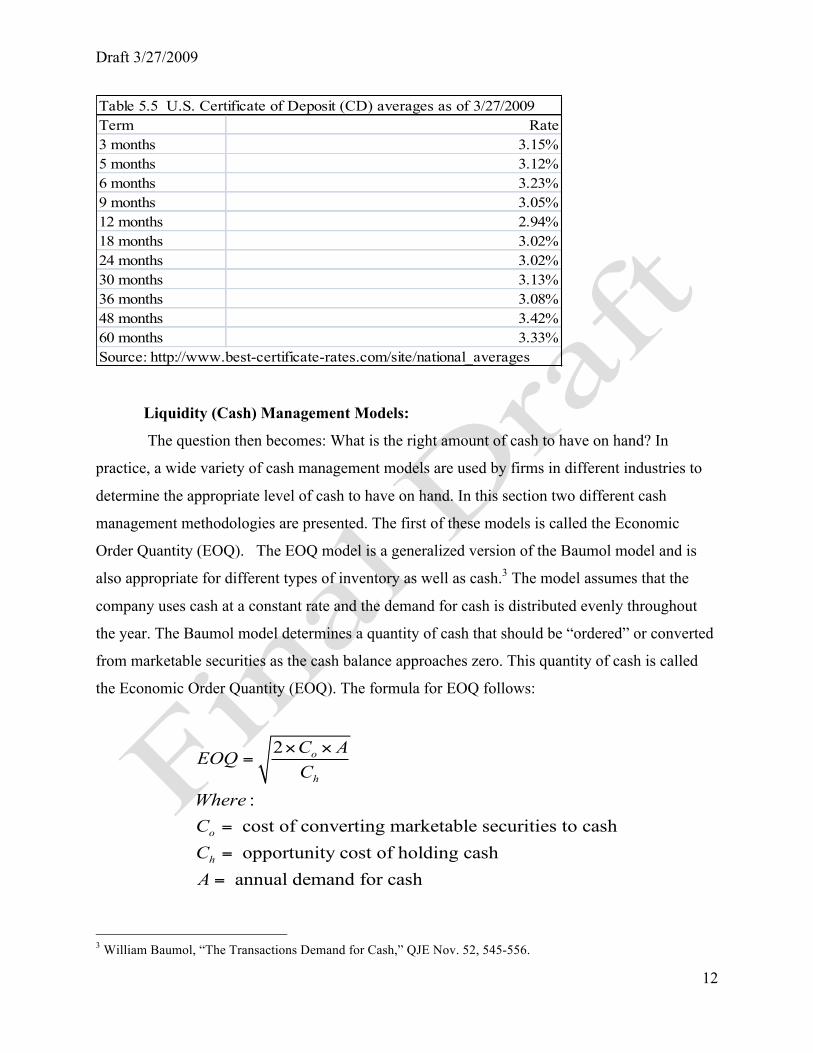
Liquidity (Cash) Management Models:
The question then becomes: What is the right amount of cash to have on hand? In
practice, a wide variety of cash management models are used by firms in different industries to
determine the appropriate level of cash to have on hand. In this section two different cash
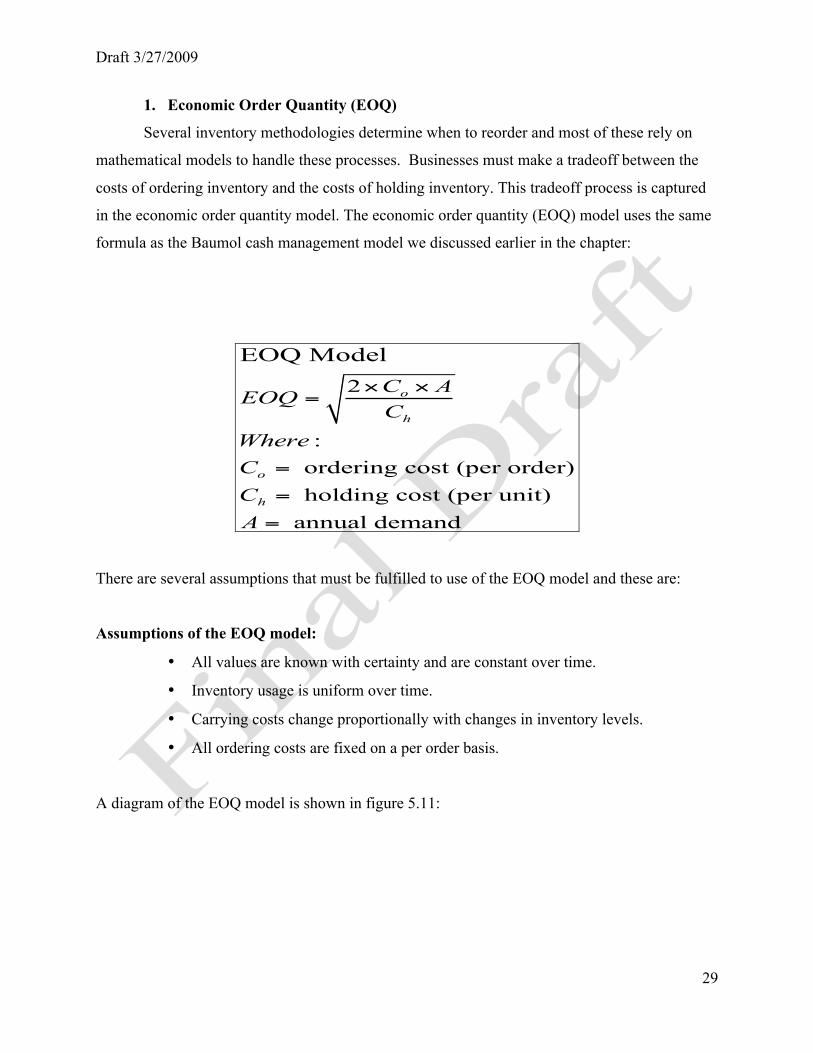
management methodologies are presented. The first of these models is called the Economic
Order Quantity (EOQ). The EOQ model is a generalized version of the Baumol model and is
also appropriate for different types of inventory as well as cash.3 The model assumes that the
company uses cash at a constant rate and the demand for cash is distributed evenly throughout
the year. The Baumol model determines a quantity of cash that should be “ordered” or converted
from marketable securities as the cash balance approaches zero. This quantity of cash is called
the Economic Order Quantity (EOQ). The formula for EOQ follows:
2
: cost of converting marketable securities to cash opportunity cost of holding cash
annual demand for cash
o
h
o
h
C AEOQC
WhereCCA
× ×=
=
=
=
3 William Baumol, “The Transactions Demand for Cash,” QJE Nov. 52, 545-556.
Draft 3/27/2009
13
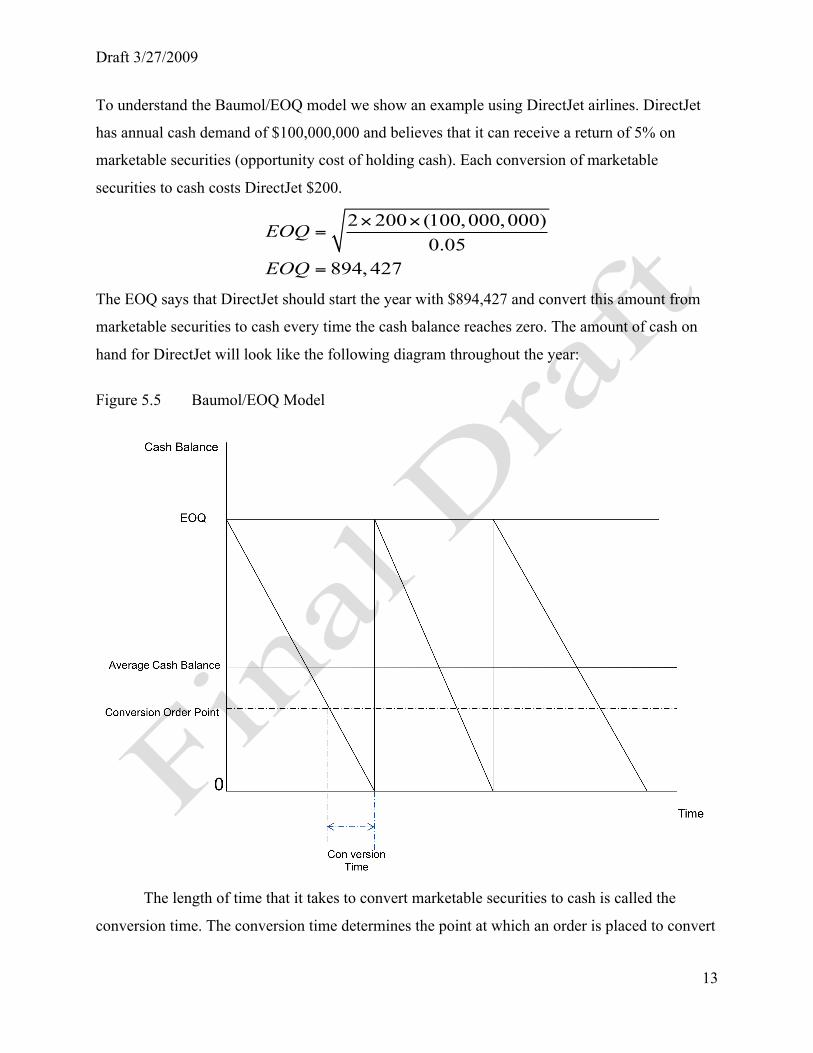
To understand the Baumol/EOQ model we show an example using DirectJet airlines. DirectJet
has annual cash demand of $100,000,000 and believes that it can receive a return of 5% on
marketable securities (opportunity cost of holding cash). Each conversion of marketable
securities to cash costs DirectJet $200.
2 200 (100,000,000)0.05
894,427
EOQ
EOQ
× ×=
=
The EOQ says that DirectJet should start the year with $894,427 and convert this amount from
marketable securities to cash every time the cash balance reaches zero. The amount of cash on
hand for DirectJet will look like the following diagram throughout the year:
Figure 5.5 Baumol/EOQ Model
The length of time that it takes to convert marketable securities to cash is called the
conversion time. The conversion time determines the point at which an order is placed to convert
Draft 3/27/2009
14
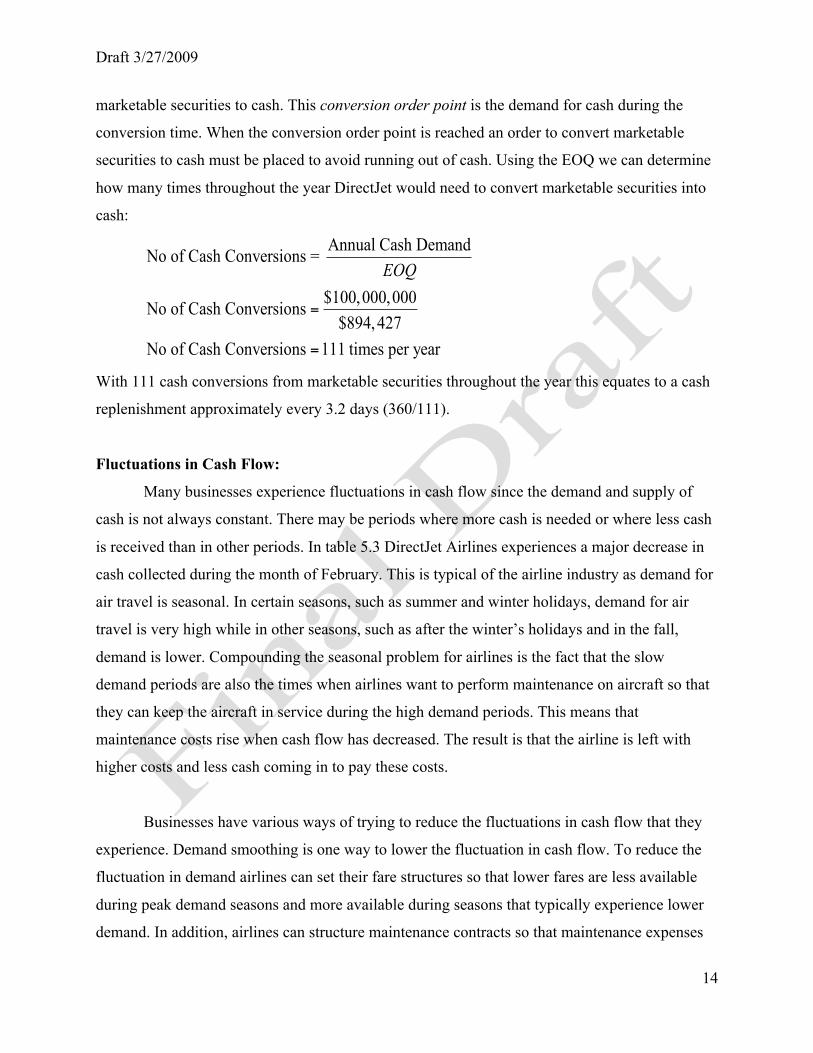
marketable securities to cash. This conversion order point is the demand for cash during the
conversion time. When the conversion order point is reached an order to convert marketable
securities to cash must be placed to avoid running out of cash. Using the EOQ we can determine
how many times throughout the year DirectJet would need to convert marketable securities into
cash:
Annual Cash DemandNo of Cash Conversions =
$100,000,000No of Cash Conversions$894,427
No of Cash Conversions 111 times per year
EOQ
=
=
With 111 cash conversions from marketable securities throughout the year this equates to a cash
replenishment approximately every 3.2 days (360/111).
Fluctuations in Cash Flow:
Many businesses experience fluctuations in cash flow since the demand and supply of
cash is not always constant. There may be periods where more cash is needed or where less cash
is received than in other periods. In table 5.3 DirectJet Airlines experiences a major decrease in
cash collected during the month of February. This is typical of the airline industry as demand for
air travel is seasonal. In certain seasons, such as summer and winter holidays, demand for air
travel is very high while in other seasons, such as after the winter’s holidays and in the fall,
demand is lower. Compounding the seasonal problem for airlines is the fact that the slow
demand periods are also the times when airlines want to perform maintenance on aircraft so that
they can keep the aircraft in service during the high demand periods. This means that
maintenance costs rise when cash flow has decreased. The result is that the airline is left with
higher costs and less cash coming in to pay these costs.
Businesses have various ways of trying to reduce the fluctuations in cash flow that they
experience. Demand smoothing is one way to lower the fluctuation in cash flow. To reduce the
fluctuation in demand airlines can set their fare structures so that lower fares are less available
during peak demand seasons and more available during seasons that typically experience lower
demand. In addition, airlines can structure maintenance contracts so that maintenance expenses
Draft 3/27/2009
15
for a year are divided into twelve equal payments per month, rather than having the cost for each
month dependent on the amount of work that is done.
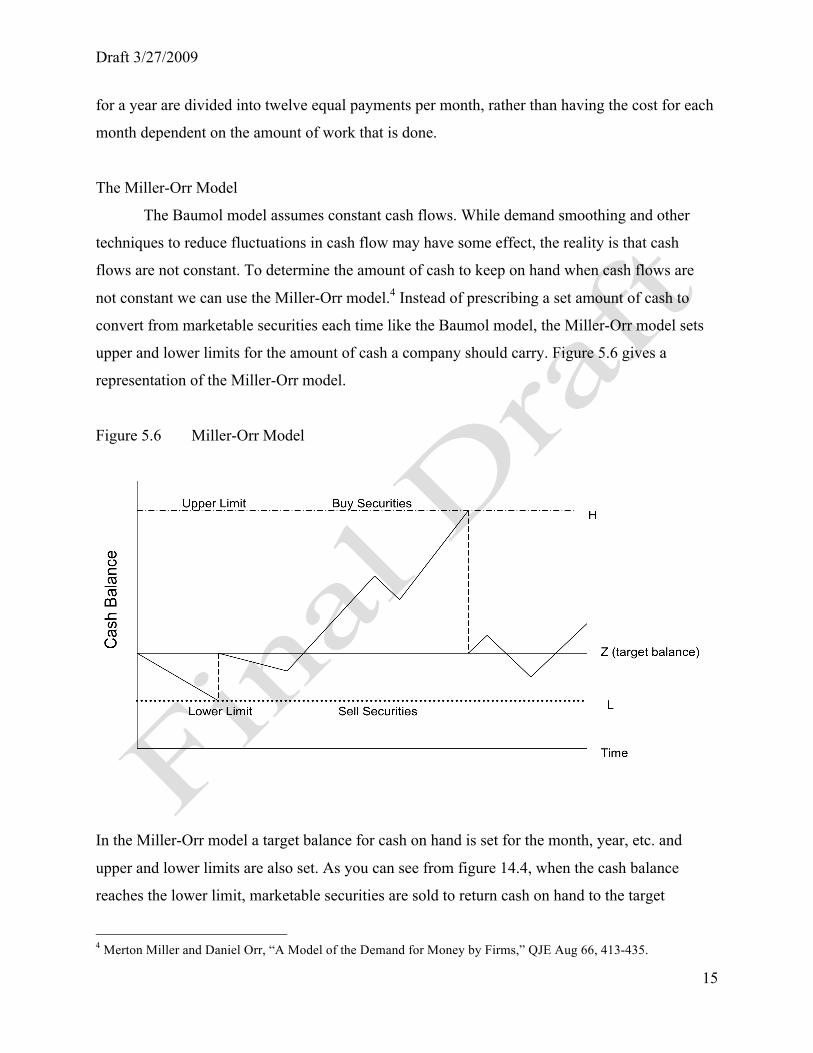
The Miller-Orr Model
The Baumol model assumes constant cash flows. While demand smoothing and other
techniques to reduce fluctuations in cash flow may have some effect, the reality is that cash
flows are not constant. To determine the amount of cash to keep on hand when cash flows are
not constant we can use the Miller-Orr model.4 Instead of prescribing a set amount of cash to
convert from marketable securities each time like the Baumol model, the Miller-Orr model sets
upper and lower limits for the amount of cash a company should carry. Figure 5.6 gives a
representation of the Miller-Orr model.
Figure 5.6 Miller-Orr Model
In the Miller-Orr model a target balance for cash on hand is set for the month, year, etc. and
upper and lower limits are also set. As you can see from figure 14.4, when the cash balance
reaches the lower limit, marketable securities are sold to return cash on hand to the target
4 Merton Miller and Daniel Orr, “A Model of the Demand for Money by Firms,” QJE Aug 66, 413-435.
Draft 3/27/2009
16
balance. Conversely, when the cash balance reaches the upper limit, marketable securities are
bought and the cash balance is returned to its target.
The target balance of a firm using the Miller-Orr model is established by comparing
conversion cost and opportunity cost using an equation similar to the EOQ equation in the
Baumol model. In addition to conversion cost and opportunity cost, the variance of cash flows
must also be known in order to calculate the target balance. Also, a lower limit (L) for the cash
balance must be set. The lower limit may already be established by a financial institution through
a minimum balance requirement in a checking account for example. The equation for the target
cash balance (Z) of a firm is shown in the equation below:
33 conversion cost
4 daily opportunity cost Z Lσ× ×= +
×
After a target balance and lower limit of cash has been determined the firm can use the following
equation to establish the upper limit (H) of their cash balance:
3 2H Z L= −
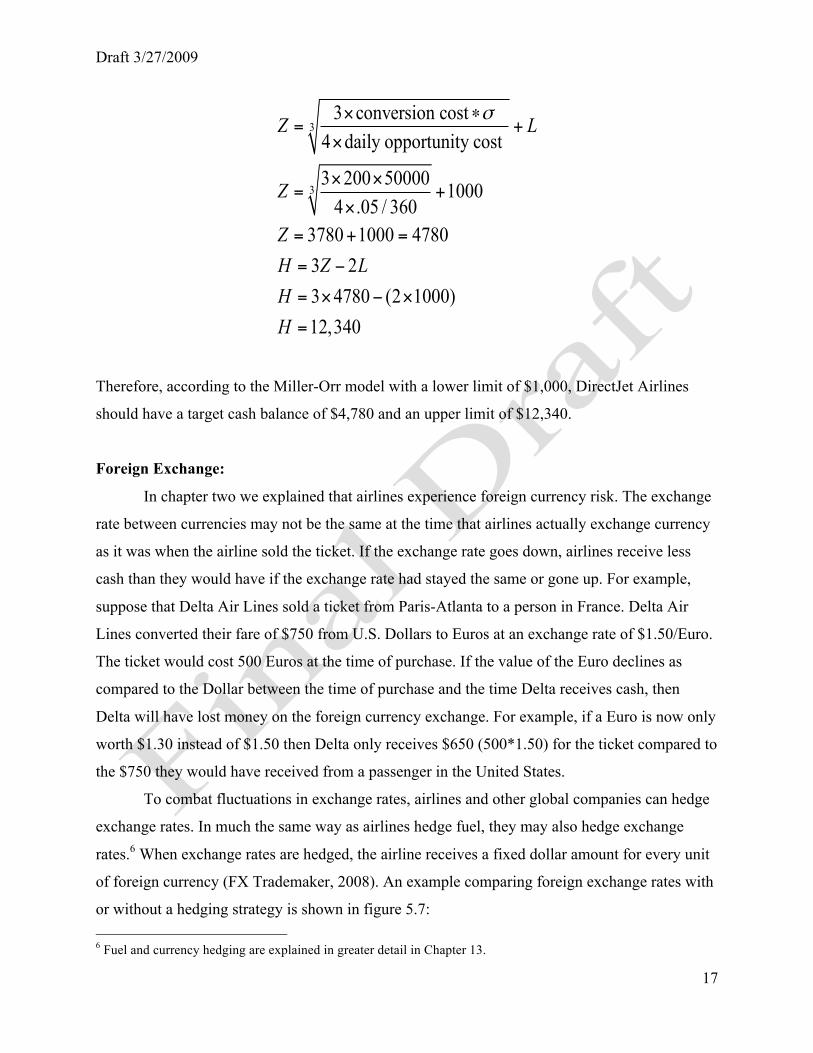
To demonstrate calculating the target balance and upper limit using the Miller-Orr model return
to the DirectJet example used for the Baumol model.5 In addition to conversion costs of $200
and an annual return of 5%, DirectJet’s bank requires a minimum balance of $1,000. The
variance of daily cash flows is assumed to be $50,000:
5 For more information on Miller-Orr model, see D. Mullins and R. Homonoff, “Applications of Inventory Cash Management Models,” in S.C. Myers, ed., Modern Developments in Financial Management, Frederick A. Praeger, Inc., New York, 1976.
Draft 3/27/2009
17
3
3
3 conversion cost4 daily opportunity cost
3 200 50000 10004 .05 / 360
3780 1000 47803 23 4780 (2 1000)12,340
Z L
Z
ZH Z LHH
σ× ∗= +
×
× ×= +
×= + =
= −
= × − ×
=
Therefore, according to the Miller-Orr model with a lower limit of $1,000, DirectJet Airlines
should have a target cash balance of $4,780 and an upper limit of $12,340.
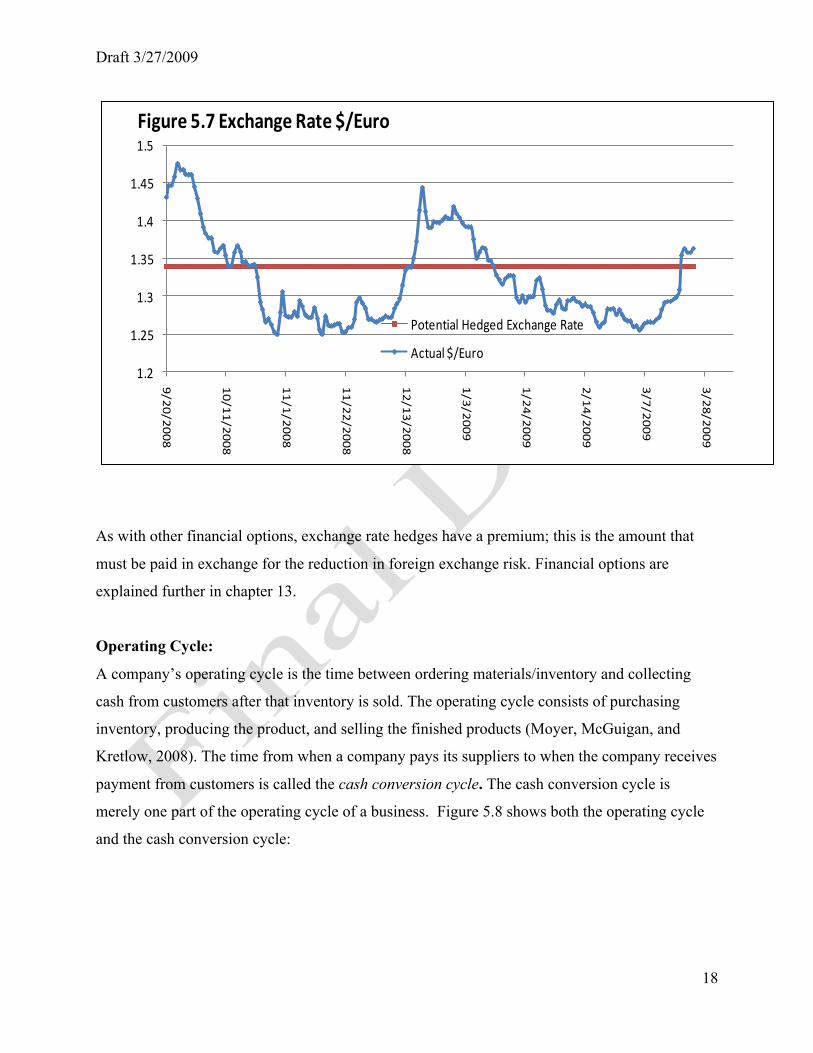
Foreign Exchange:
In chapter two we explained that airlines experience foreign currency risk. The exchange
rate between currencies may not be the same at the time that airlines actually exchange currency
as it was when the airline sold the ticket. If the exchange rate goes down, airlines receive less
cash than they would have if the exchange rate had stayed the same or gone up. For example,
suppose that Delta Air Lines sold a ticket from Paris-Atlanta to a person in France. Delta Air
Lines converted their fare of $750 from U.S. Dollars to Euros at an exchange rate of $1.50/Euro.
The ticket would cost 500 Euros at the time of purchase. If the value of the Euro declines as
compared to the Dollar between the time of purchase and the time Delta receives cash, then
Delta will have lost money on the foreign currency exchange. For example, if a Euro is now only
worth $1.30 instead of $1.50 then Delta only receives $650 (500*1.50) for the ticket compared to
the $750 they would have received from a passenger in the United States.
To combat fluctuations in exchange rates, airlines and other global companies can hedge
exchange rates. In much the same way as airlines hedge fuel, they may also hedge exchange
rates.6 When exchange rates are hedged, the airline receives a fixed dollar amount for every unit
of foreign currency (FX Trademaker, 2008). An example comparing foreign exchange rates with
or without a hedging strategy is shown in figure 5.7: 6 Fuel and currency hedging are explained in greater detail in Chapter 13.
Draft 3/27/2009
18
1.2
1.25
1.3
1.35
1.4
1.45
1.5
9/20/2008
10/11/2008
11/1/2008
11/22/2008
12/13/2008
1/3/2009
1/24/2009
2/14/2009
3/7/2009
3/28/2009Figure 5.7 Exchange Rate $/Euro
Potential Hedged Exchange Rate
Actual $/Euro
As with other financial options, exchange rate hedges have a premium; this is the amount that
must be paid in exchange for the reduction in foreign exchange risk. Financial options are
explained further in chapter 13.
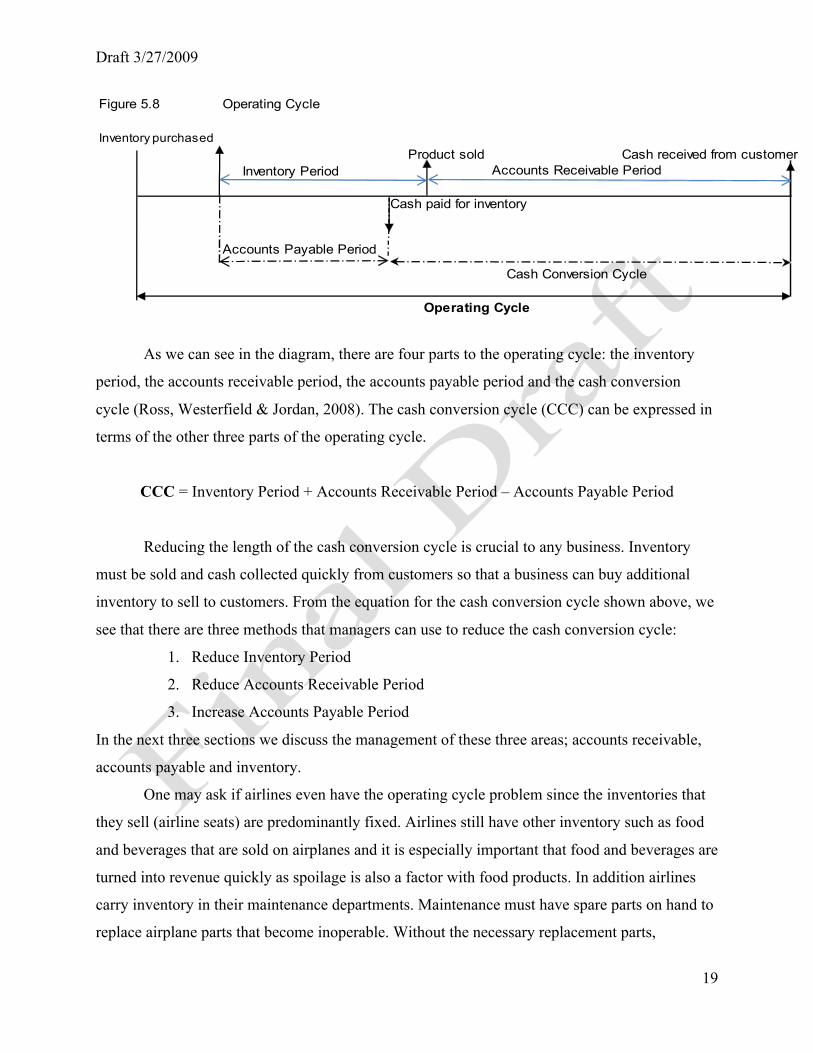
Operating Cycle:
A company’s operating cycle is the time between ordering materials/inventory and collecting
cash from customers after that inventory is sold. The operating cycle consists of purchasing
inventory, producing the product, and selling the finished products (Moyer, McGuigan, and
Kretlow, 2008). The time from when a company pays its suppliers to when the company receives
payment from customers is called the cash conversion cycle. The cash conversion cycle is
merely one part of the operating cycle of a business. Figure 5.8 shows both the operating cycle
and the cash conversion cycle:
Draft 3/27/2009
19
Figure 5.8 Operating Cycle
Inventory purchasedProduct sold Cash received from customer
Inventory Period
Cash paid for inventory
Accounts Payable Period
Operating Cycle
Cash Conversion Cycle
Accounts Receivable Period
As we can see in the diagram, there are four parts to the operating cycle: the inventory
period, the accounts receivable period, the accounts payable period and the cash conversion
cycle (Ross, Westerfield & Jordan, 2008). The cash conversion cycle (CCC) can be expressed in
terms of the other three parts of the operating cycle.
CCC = Inventory Period + Accounts Receivable Period – Accounts Payable Period
Reducing the length of the cash conversion cycle is crucial to any business. Inventory
must be sold and cash collected quickly from customers so that a business can buy additional
inventory to sell to customers. From the equation for the cash conversion cycle shown above, we
see that there are three methods that managers can use to reduce the cash conversion cycle:
1. Reduce Inventory Period
2. Reduce Accounts Receivable Period
3. Increase Accounts Payable Period
In the next three sections we discuss the management of these three areas; accounts receivable,
accounts payable and inventory.
One may ask if airlines even have the operating cycle problem since the inventories that
they sell (airline seats) are predominantly fixed. Airlines still have other inventory such as food
and beverages that are sold on airplanes and it is especially important that food and beverages are
turned into revenue quickly as spoilage is also a factor with food products. In addition airlines
carry inventory in their maintenance departments. Maintenance must have spare parts on hand to
replace airplane parts that become inoperable. Without the necessary replacement parts,
Draft 3/27/2009
20
maintenance problems will not get fixed and airplanes will be stuck on the ground; airplanes on
the ground cost airlines tremendous amounts of lost revenue.
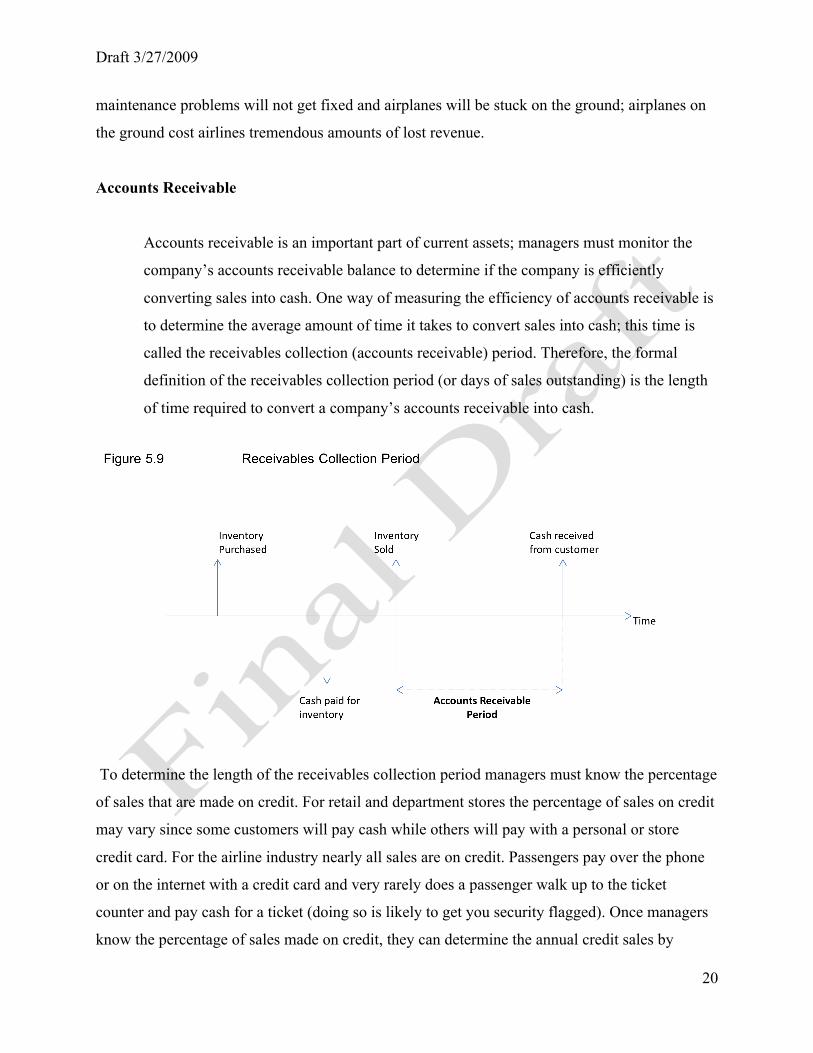
Accounts Receivable
Accounts receivable is an important part of current assets; managers must monitor the
company’s accounts receivable balance to determine if the company is efficiently
converting sales into cash. One way of measuring the efficiency of accounts receivable is
to determine the average amount of time it takes to convert sales into cash; this time is
called the receivables collection (accounts receivable) period. Therefore, the formal
definition of the receivables collection period (or days of sales outstanding) is the length
of time required to convert a company’s accounts receivable into cash.
To determine the length of the receivables collection period managers must know the percentage
of sales that are made on credit. For retail and department stores the percentage of sales on credit
may vary since some customers will pay cash while others will pay with a personal or store
credit card. For the airline industry nearly all sales are on credit. Passengers pay over the phone
or on the internet with a credit card and very rarely does a passenger walk up to the ticket
counter and pay cash for a ticket (doing so is likely to get you security flagged). Once managers
know the percentage of sales made on credit, they can determine the annual credit sales by
Draft 3/27/2009
21
multiplying the percentage by total annual sales. Annual credit sales are then used to calculate
the average receivables collection period using the following equation:
Accounts Receivable Accounts ReceivableReceivables Collection Period = Annual Credit Sales Average Daily Credit Sales
360
=⎛ ⎞⎜ ⎟⎝ ⎠
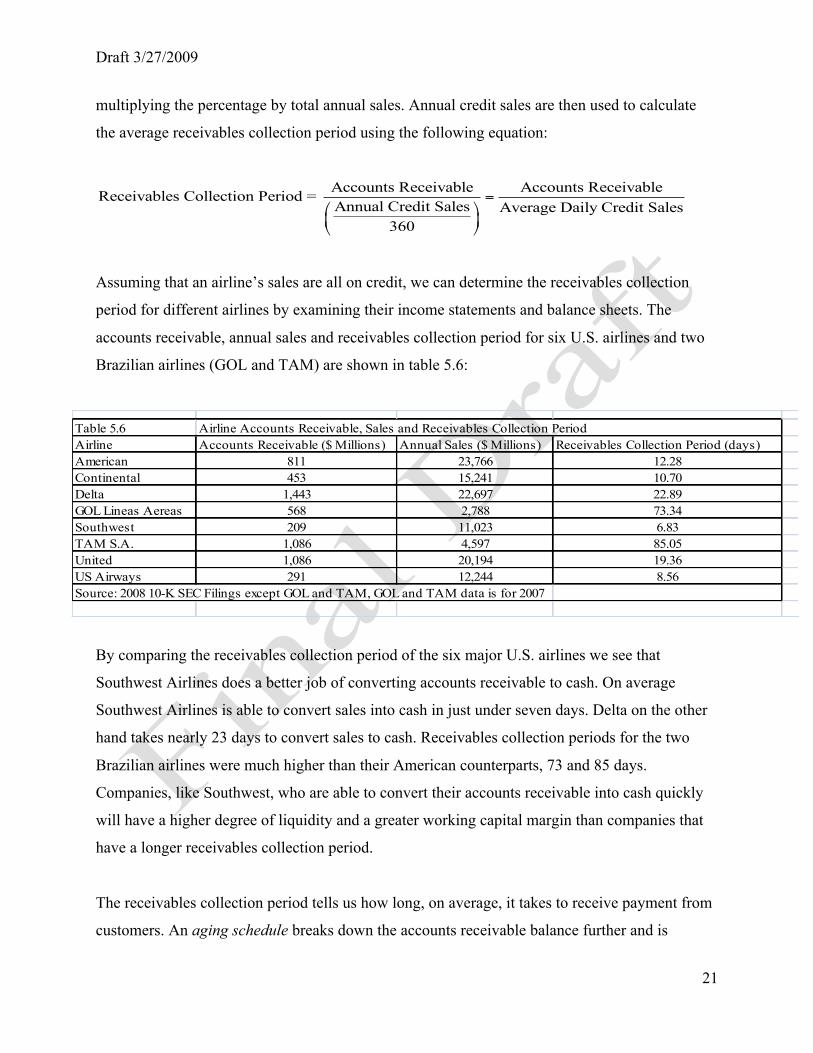
Assuming that an airline’s sales are all on credit, we can determine the receivables collection
period for different airlines by examining their income statements and balance sheets. The
accounts receivable, annual sales and receivables collection period for six U.S. airlines and two
Brazilian airlines (GOL and TAM) are shown in table 5.6:
Table 5.6 Airline Accounts Receivable, Sales and Receivables Collection PeriodAirline Accounts Receivable ($ Millions) Annual Sales ($ Millions) Receivables Collection Period (days)American 811 23,766 12.28Continental 453 15,241 10.70Delta 1,443 22,697 22.89GOL Lineas Aereas 568 2,788 73.34Southwest 209 11,023 6.83TAM S.A. 1,086 4,597 85.05United 1,086 20,194 19.36US Airways 291 12,244 8.56Source: 2008 10-K SEC Filings except GOL and TAM, GOL and TAM data is for 2007
By comparing the receivables collection period of the six major U.S. airlines we see that
Southwest Airlines does a better job of converting accounts receivable to cash. On average
Southwest Airlines is able to convert sales into cash in just under seven days. Delta on the other
hand takes nearly 23 days to convert sales to cash. Receivables collection periods for the two
Brazilian airlines were much higher than their American counterparts, 73 and 85 days.
Companies, like Southwest, who are able to convert their accounts receivable into cash quickly
will have a higher degree of liquidity and a greater working capital margin than companies that
have a longer receivables collection period.
The receivables collection period tells us how long, on average, it takes to receive payment from
customers. An aging schedule breaks down the accounts receivable balance further and is
Draft 3/27/2009
22
necessary to develop cash forecast. The accounts receivable aging schedule tells a company,
based on historical data, what percentage of accounts receivable is collected in the same month
as sales, what percentage is collected in the following months, in two months, etc.
Table 5.7 is an example of an aging schedule for DirectJet Airlines, assuming all sales are
credit sales. Sales last January were $10,000,000 and the cash collected in each month for
January’s accounts receivable are shown in the table:
Table 5.7 Accounts Receive Collections-DirectJet Airlines
Sales (January) 10,000,000$ January February March April
Cash Collections (January's sales) 1,500,000$ 5,000,000$ 3,000,000$ 500,000$
Table 5.7 shows that DirectJet collected 15% (1,500,000/10,000,000) of January sales in
January, 50% in February, 30% in March and 5% in April. If this collection pattern holds true for
other months then DirectJet’s aging schedule is the following:
• 15% of accounts receivable is received in the month of sales
• 50% of accounts receivable is collected in the month following sales
• 30% is collected two months after sales
• 5% is collected three months after sales
Managing accounts receivable is important for any business because there is an
opportunity cost associated with carrying accounts receivable. In order to extend credit to
customers, businesses may need to borrow cash from financial institutions to maintain enough
cash on hand to pay its own creditors. The cost of carrying accounts receivable (A/R) is shown in
the following equation:
Cost of carrying receivables = Cost of debt (% of A/R financed A/R)× ×
Draft 3/27/2009
23
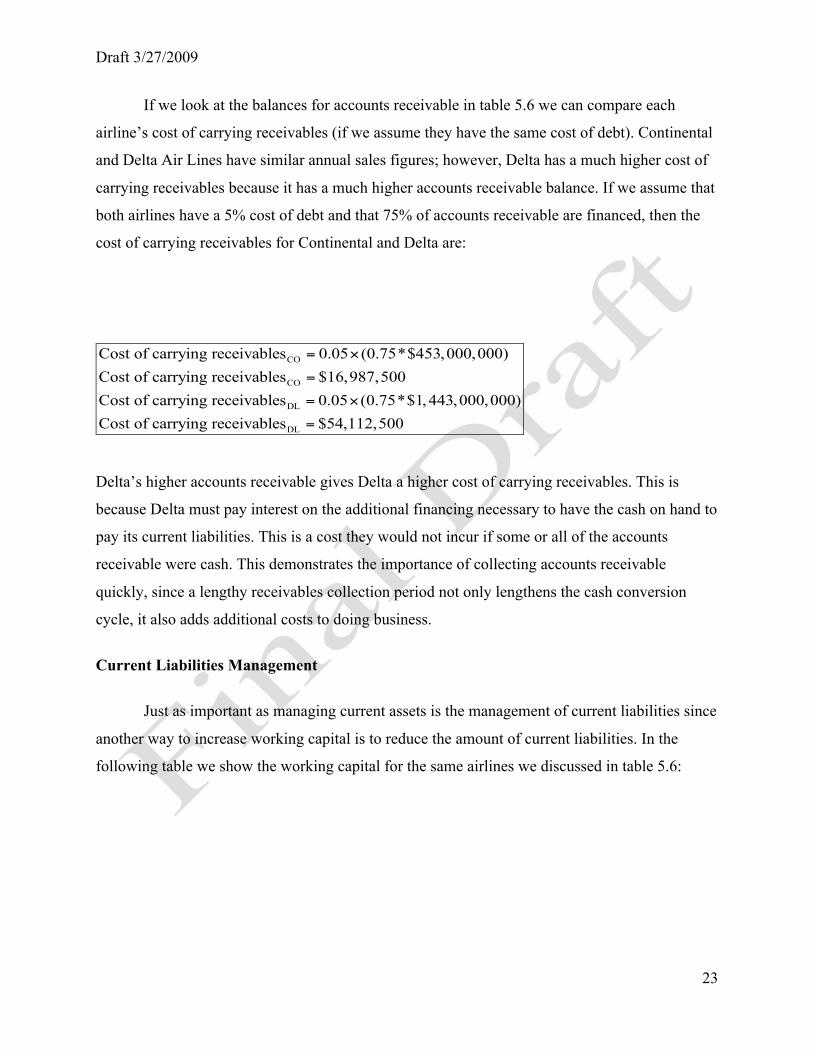
If we look at the balances for accounts receivable in table 5.6 we can compare each
airline’s cost of carrying receivables (if we assume they have the same cost of debt). Continental
and Delta Air Lines have similar annual sales figures; however, Delta has a much higher cost of
carrying receivables because it has a much higher accounts receivable balance. If we assume that
both airlines have a 5% cost of debt and that 75% of accounts receivable are financed, then the
cost of carrying receivables for Continental and Delta are:
CO
CO
DL
DL
Cost of carrying receivables 0.05 (0.75*$453,000,000)Cost of carrying receivables $16,987,500Cost of carrying receivables 0.05 (0.75*$1,443,000,000)Cost of carrying receivables $54,112,500
= ×
=
= ×
=
Delta’s higher accounts receivable gives Delta a higher cost of carrying receivables. This is
because Delta must pay interest on the additional financing necessary to have the cash on hand to
pay its current liabilities. This is a cost they would not incur if some or all of the accounts
receivable were cash. This demonstrates the importance of collecting accounts receivable
quickly, since a lengthy receivables collection period not only lengthens the cash conversion
cycle, it also adds additional costs to doing business.
Current Liabilities Management
Just as important as managing current assets is the management of current liabilities since
another way to increase working capital is to reduce the amount of current liabilities. In the
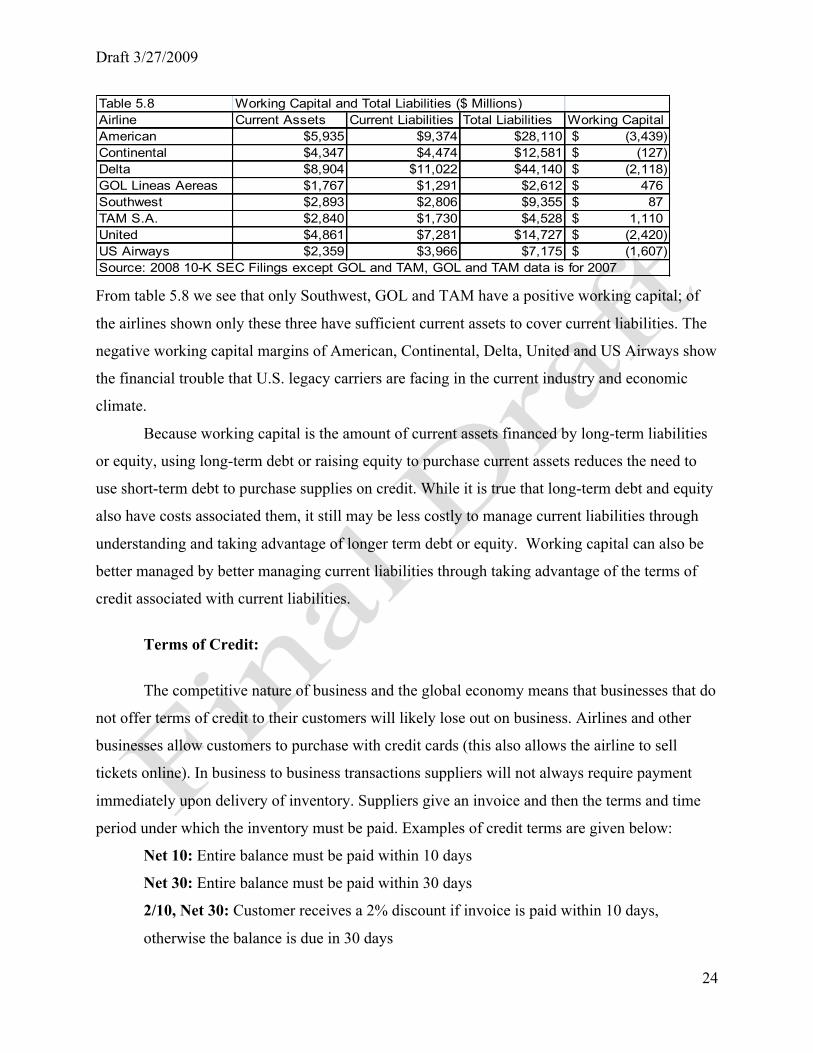
following table we show the working capital for the same airlines we discussed in table 5.6:
Draft 3/27/2009
24
Table 5.8 Working Capital and Total Liabilities ($ Millions)Airline Current Assets Current Liabilities Total Liabilities Working CapitalAmerican $5,935 $9,374 $28,110 (3,439)$ Continental $4,347 $4,474 $12,581 (127)$ Delta $8,904 $11,022 $44,140 (2,118)$ GOL Lineas Aereas $1,767 $1,291 $2,612 476$ Southwest $2,893 $2,806 $9,355 87$ TAM S.A. $2,840 $1,730 $4,528 1,110$ United $4,861 $7,281 $14,727 (2,420)$ US Airways $2,359 $3,966 $7,175 (1,607)$ Source: 2008 10-K SEC Filings except GOL and TAM, GOL and TAM data is for 2007 From table 5.8 we see that only Southwest, GOL and TAM have a positive working capital; of
the airlines shown only these three have sufficient current assets to cover current liabilities. The
negative working capital margins of American, Continental, Delta, United and US Airways show
the financial trouble that U.S. legacy carriers are facing in the current industry and economic
climate.
Because working capital is the amount of current assets financed by long-term liabilities
or equity, using long-term debt or raising equity to purchase current assets reduces the need to
use short-term debt to purchase supplies on credit. While it is true that long-term debt and equity
also have costs associated them, it still may be less costly to manage current liabilities through
understanding and taking advantage of longer term debt or equity. Working capital can also be
better managed by better managing current liabilities through taking advantage of the terms of
credit associated with current liabilities.
Terms of Credit:
The competitive nature of business and the global economy means that businesses that do
not offer terms of credit to their customers will likely lose out on business. Airlines and other
businesses allow customers to purchase with credit cards (this also allows the airline to sell
tickets online). In business to business transactions suppliers will not always require payment
immediately upon delivery of inventory. Suppliers give an invoice and then the terms and time
period under which the inventory must be paid. Examples of credit terms are given below:
Net 10: Entire balance must be paid within 10 days
Net 30: Entire balance must be paid within 30 days
2/10, Net 30: Customer receives a 2% discount if invoice is paid within 10 days,
otherwise the balance is due in 30 days
Draft 3/27/2009
25
There are two ways in which businesses can use terms of credit from suppliers to help
manage current liabilities. The first method is to use the full term to pay the liability. If the terms
of the invoice are Net 30, there is no reason to pay the supplier in 5 days. The reason that a
business would want to use the full term to pay the invoice is to reduce the cash conversion cycle
(CCC). By waiting to pay the supplier, the business increases the accounts payable period of the
operating cycle thereby reducing the cash conversion cycle (CCC = Inventory period + Accounts
Receivable period – Accounts Payable period). The other reason that businesses should not pay
invoices before they are due is that they are foregoing the opportunity cost of using the cash that
was used to pay the inventory. The cash could be earning a return as a marketable security until
the time that the invoice is due.
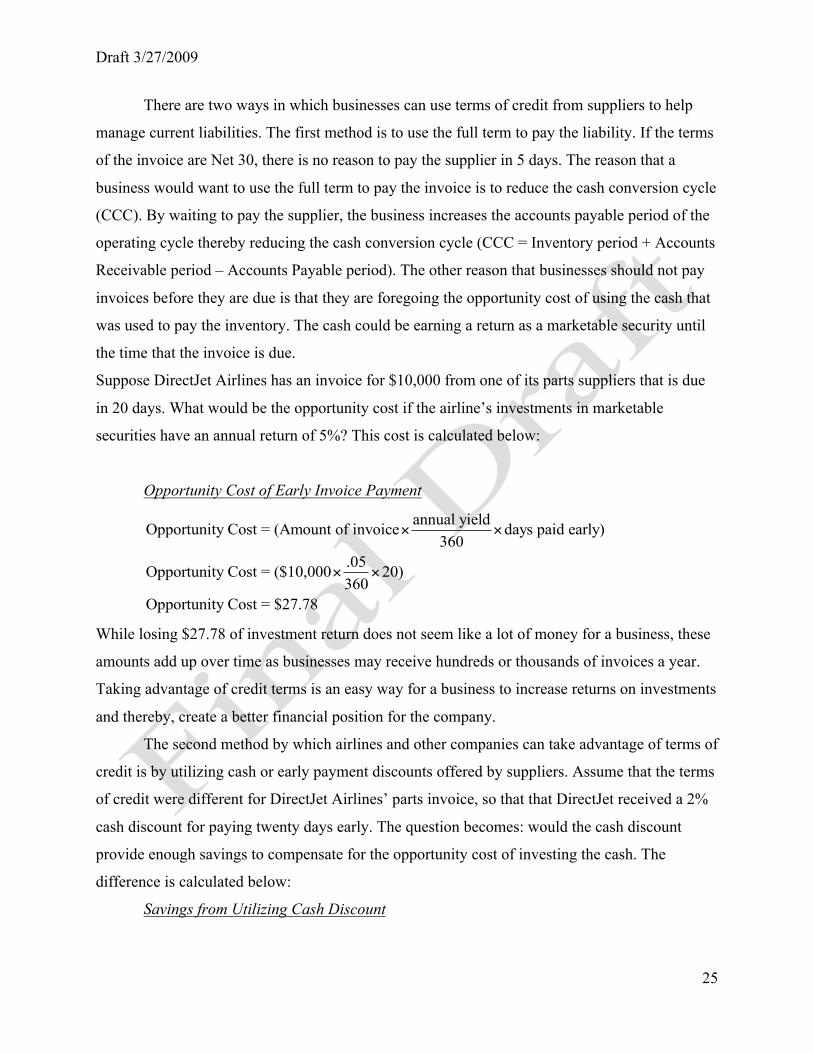
Suppose DirectJet Airlines has an invoice for $10,000 from one of its parts suppliers that is due
in 20 days. What would be the opportunity cost if the airline’s investments in marketable
securities have an annual return of 5%? This cost is calculated below:
Opportunity Cost of Early Invoice Payment
annual yieldOpportunity Cost = (Amount of invoice days paid early)360
.05Opportunity Cost = ($10,000 20)360
Opportunity Cost = $27.78
× ×
× ×
While losing $27.78 of investment return does not seem like a lot of money for a business, these
amounts add up over time as businesses may receive hundreds or thousands of invoices a year.
Taking advantage of credit terms is an easy way for a business to increase returns on investments
and thereby, create a better financial position for the company.
The second method by which airlines and other companies can take advantage of terms of
credit is by utilizing cash or early payment discounts offered by suppliers. Assume that the terms
of credit were different for DirectJet Airlines’ parts invoice, so that that DirectJet received a 2%
cash discount for paying twenty days early. The question becomes: would the cash discount
provide enough savings to compensate for the opportunity cost of investing the cash. The
difference is calculated below:
Savings from Utilizing Cash Discount
Draft 3/27/2009
26
Cash discount - Opportunity cost(.02*$10,000) $27.78$200 $27.78$172.22
SavingsSavingsSavingsSavings
=
= −
= −
=
DirectJet should take advantage of the cash discount for early payment since it will net DirectJet
$172.22 in savings. Taking advantage of the cash discount not only eliminates current liabilities
from the balance sheet, it also increases net working capital by the amount of the savings (cash
discount – opportunity cost).
In this section we have discussed two seemingly opposite strategies; one in which
companies should take the full payment period to pay off invoices, and the other which states
that companies should pay early when a cash discount is involved. How does a company know
which strategy to use? If a cash discount is not offered for early payment do not pay early.
Paying early adds the opportunity cost of cash not being able to be invested over that time
period. If a cash discount for early payment is offered, calculate the net savings of the cash
discount (discount – opportunity cost). If net savings is positive, take advantage of the cash
discount and pay early.
Inventory Control Models
To many businesses inventory represents a necessary evil. Businesses don’t want to have
stacks of inventory piled up in stores, warehouses or factories; however, businesses also know
that if they do not have inventory available when customers want to purchase they will lose the
sale. Inventory has costs associated with it and these are: the cost of purchasing the products
from suppliers, the costs to place an order for inventory, the costs of holding the inventory and
the costs of having a stock out (not having inventory available when a customer wants it).
Inventory management then is the managing of inventory costs. Businesses want to be able to
have enough inventories on hand to satisfy customer demand but at the same time keep inventory
levels down to reduce costs.
Sometimes it is assumed that once the inventory has been purchased that the cost of the
purchase is the only cost associated with inventory. However, in reality there are many other
costs associated with holding inventory. Some of these are listed below:
Draft 3/27/2009
27
Inventory Carrying (Holding) Costs
• Cost of capital- The cash used to pay for inventory that could be invested in
capital projects or marketable securities
• Taxes & Insurance- Inventory is an asset therefore any inventory that is on the
balance sheet incurs taxes for the company. Insurance may be taken out on
inventory to protect against damage or theft.
• Spoilage, Theft, Obsolescence- While waiting to be sold inventory may spoil
(become unusable) or fall victim to theft or obsolescence. Obsolescence occurs
when new and better versions of the product or similar products become available
to customers. For example, when Boeing introduced the 737NG, the 737 Classic
became somewhat obsolete since the 737NGs had better fuel efficiency.
• Cost of Storage- Inventory must be stored somewhere and a company may need
to pay rent for a storage facility. In addition there must be employees to man the
storage facility and move inventory. Also, security guards may also be hired to
protect the company from theft of inventory. Increased wages for the manpower
associated with holding inventory can be a major cost for a company.
In addition to holding costs, businesses also incur ordering costs each time they order inventory.
The cost of ordering inventory arises from the fact that it takes the time of management, the
purchasing department, or some other employee of the company to fill out the order forms,
inspect the inventory for damage when it arrives and to pay the bill for the inventory when it
comes due. In addition suppliers may charge an order processing fee with each order.
But airlines don’t have a physical product to sell; air travel is a service, so airlines don’t
have to deal with inventory issues, right? In a sense airline seats are inventory, but a very
perishable inventory. Once a flight leaves with empty seats, those seats can no longer be filled.
While the number of seats on an airplane is relatively fixed, airlines can carry too many seats in
their inventory; we call this overcapacity. That is, there may be too many planes with unfilled
seats and this can be quite costly. In addition, many of the support activities of an airline must
carry inventory. The maintenance department must carry spare parts to have them available if an
aircraft needs a new part. Therefore, the maintenance department of an airline must make critical
Draft 3/27/2009
28
decisions about inventory levels of spare parts. Also, airlines must make inventory decisions on
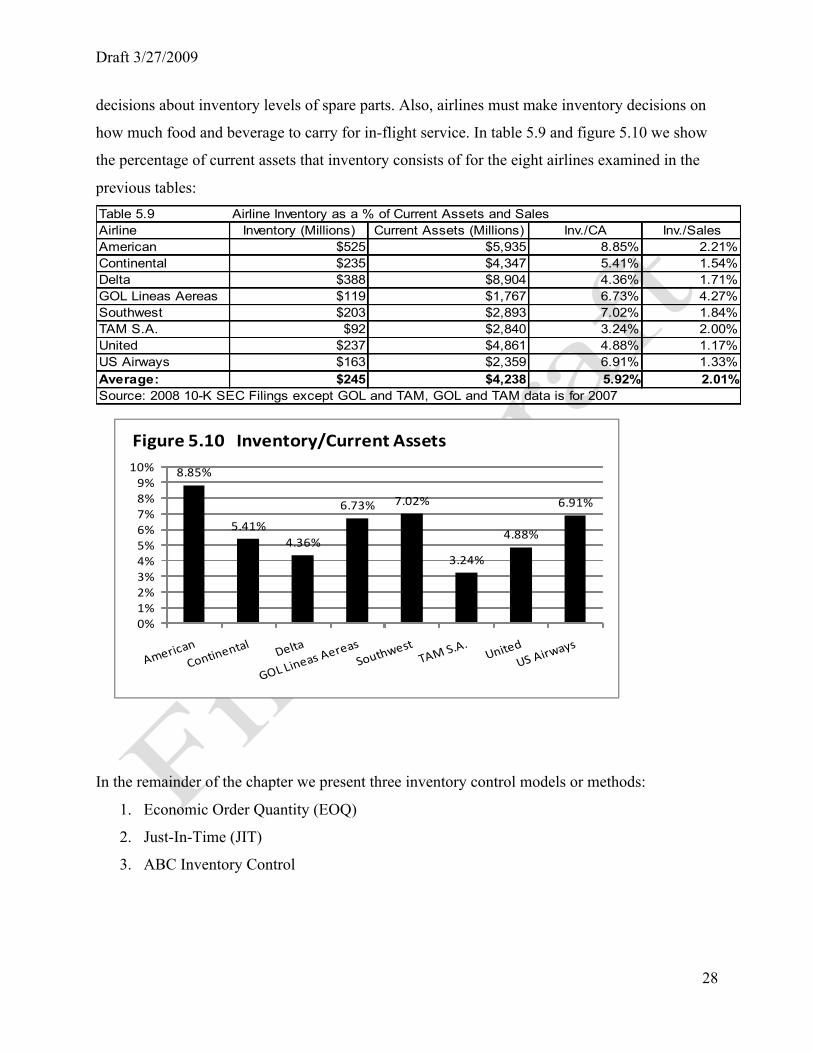
how much food and beverage to carry for in-flight service. In table 5.9 and figure 5.10 we show
the percentage of current assets that inventory consists of for the eight airlines examined in the
previous tables: Table 5.9 Airline Inventory as a % of Current Assets and SalesAirline Inventory (Millions) Current Assets (Millions) Inv./CA Inv./SalesAmerican $525 $5,935 8.85% 2.21%Continental $235 $4,347 5.41% 1.54%Delta $388 $8,904 4.36% 1.71%GOL Lineas Aereas $119 $1,767 6.73% 4.27%Southwest $203 $2,893 7.02% 1.84%TAM S.A. $92 $2,840 3.24% 2.00%United $237 $4,861 4.88% 1.17%US Airways $163 $2,359 6.91% 1.33%Average: $245 $4,238 5.92% 2.01%Source: 2008 10-K SEC Filings except GOL and TAM, GOL and TAM data is for 2007
8.85%
5.41%4.36%
6.73% 7.02%
3.24%
4.88%
6.91%
0%1%2%3%4%5%6%7%8%9%
10%
Figure 5.10 Inventory/Current Assets
In the remainder of the chapter we present three inventory control models or methods:
1. Economic Order Quantity (EOQ)
2. Just-In-Time (JIT)
3. ABC Inventory Control
Draft 3/27/2009
29
1. Economic Order Quantity (EOQ)
Several inventory methodologies determine when to reorder and most of these rely on
mathematical models to handle these processes. Businesses must make a tradeoff between the
costs of ordering inventory and the costs of holding inventory. This tradeoff process is captured
in the economic order quantity model. The economic order quantity (EOQ) model uses the same
formula as the Baumol cash management model we discussed earlier in the chapter:
2
: ordering cost (per order) holding cost (per unit)
annual demand
EOQ Model
o
h
o
h
C AEOQC
WhereCCA
× ×=
=
=
=
There are several assumptions that must be fulfilled to use of the EOQ model and these are:
Assumptions of the EOQ model:
• All values are known with certainty and are constant over time.
• Inventory usage is uniform over time.
• Carrying costs change proportionally with changes in inventory levels.
• All ordering costs are fixed on a per order basis.
A diagram of the EOQ model is shown in figure 5.11:
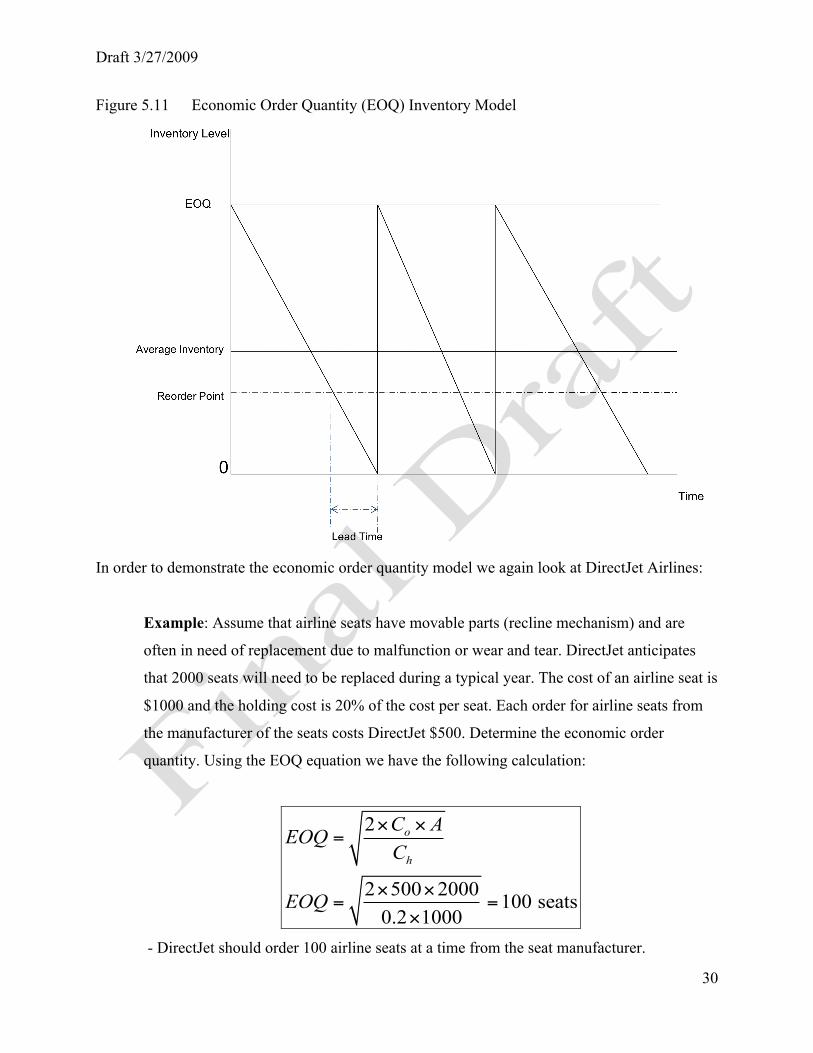
Draft 3/27/2009
30
Figure 5.11 Economic Order Quantity (EOQ) Inventory Model
In order to demonstrate the economic order quantity model we again look at DirectJet Airlines:
Example: Assume that airline seats have movable parts (recline mechanism) and are
often in need of replacement due to malfunction or wear and tear. DirectJet anticipates
that 2000 seats will need to be replaced during a typical year. The cost of an airline seat is
$1000 and the holding cost is 20% of the cost per seat. Each order for airline seats from
the manufacturer of the seats costs DirectJet $500. Determine the economic order
quantity. Using the EOQ equation we have the following calculation:
2
2 500 2000 100 seats0.2 1000
o
h
C AEOQC
EOQ
× ×=
× ×= =
×
- DirectJet should order 100 airline seats at a time from the seat manufacturer.
Draft 3/27/2009
31
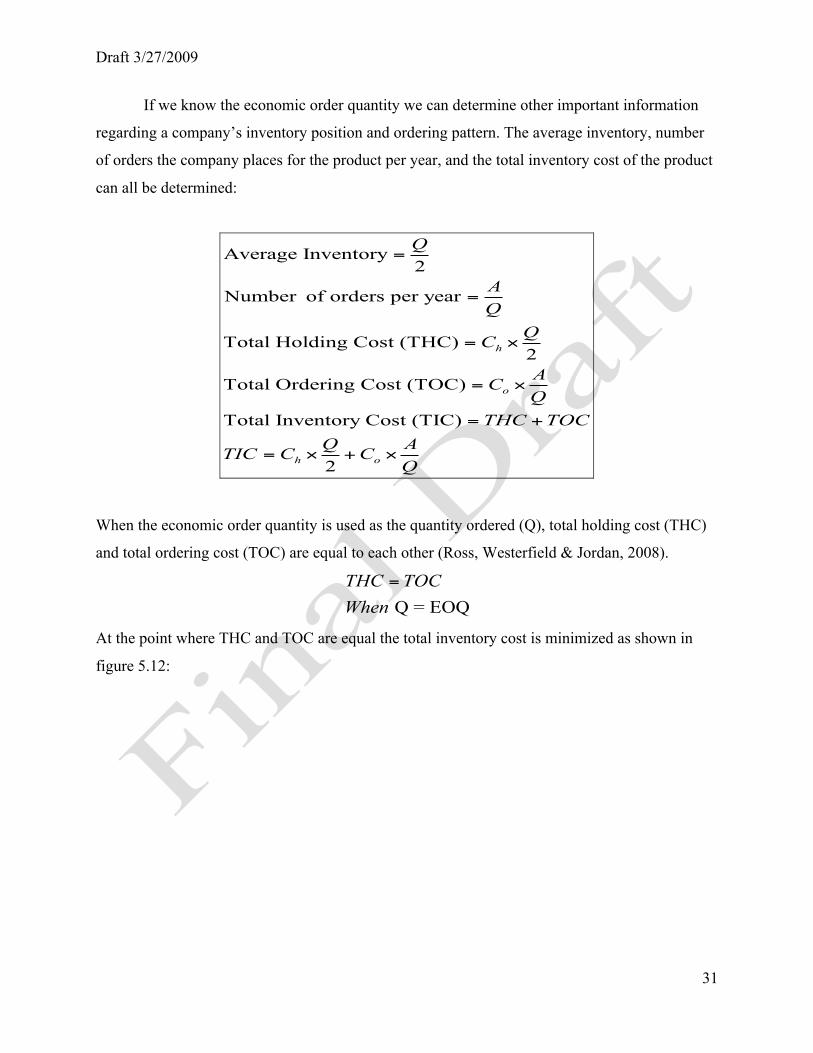
If we know the economic order quantity we can determine other important information
regarding a company’s inventory position and ordering pattern. The average inventory, number
of orders the company places for the product per year, and the total inventory cost of the product
can all be determined:
Average Inventory2
Number of orders per year
Total Holding Cost (THC)2
Total Ordering Cost (TOC)
Total Inventory Cost (TIC)
2
h
o
h o
Q
AQ
QC
ACQ
THC TOCQ ATIC C C
Q
=
=
= ×
= ×
= +
= × + ×
When the economic order quantity is used as the quantity ordered (Q), total holding cost (THC)
and total ordering cost (TOC) are equal to each other (Ross, Westerfield & Jordan, 2008).
Q = EOQTHC TOCWhen
=
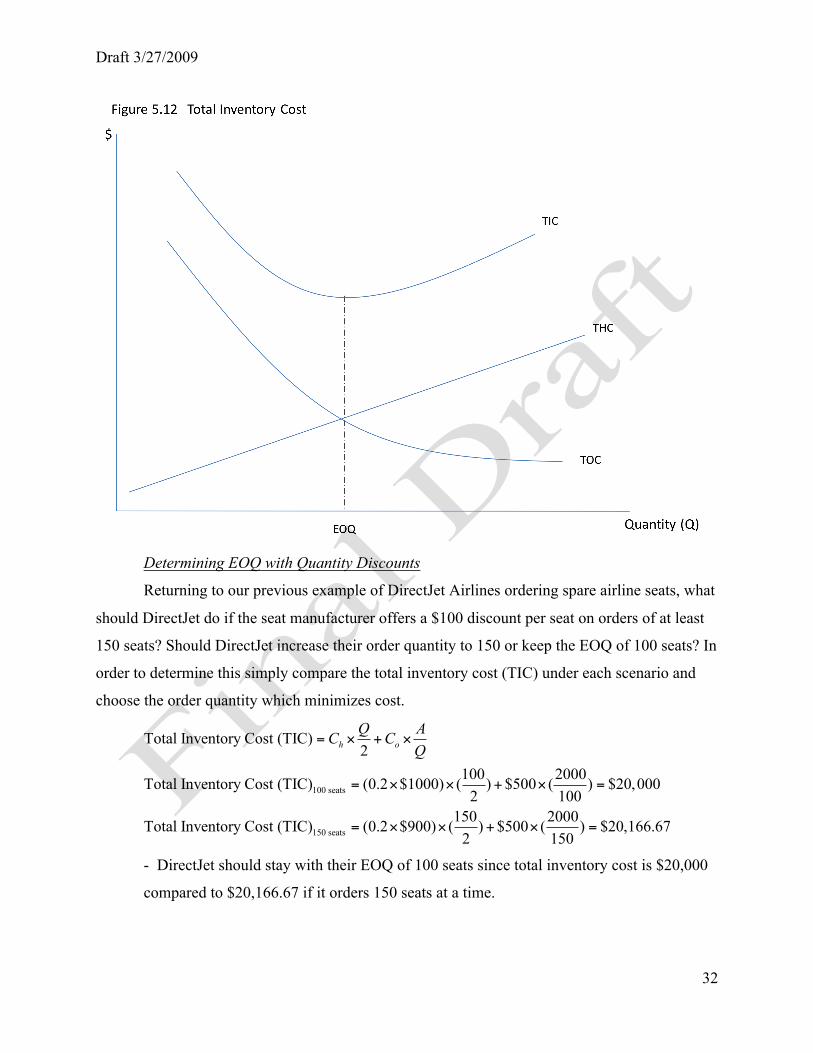
At the point where THC and TOC are equal the total inventory cost is minimized as shown in
figure 5.12:
Draft 3/27/2009
32
Determining EOQ with Quantity Discounts
Returning to our previous example of DirectJet Airlines ordering spare airline seats, what
should DirectJet do if the seat manufacturer offers a $100 discount per seat on orders of at least
150 seats? Should DirectJet increase their order quantity to 150 or keep the EOQ of 100 seats? In
order to determine this simply compare the total inventory cost (TIC) under each scenario and
choose the order quantity which minimizes cost.
100 seats
150 seats
Total Inventory Cost (TIC)2
100 2000Total Inventory Cost (TIC) (0.2 $1000) ( ) $500 ( ) $20,0002 100
150 2000Total Inventory Cost (TIC) (0.2 $900) ( ) $500 ( ) $20,166.672 150
h oQ AC C
Q= × + ×
= × × + × =
= × × + × =
- DirectJet should stay with their EOQ of 100 seats since total inventory cost is $20,000
compared to $20,166.67 if it orders 150 seats at a time.
Draft 3/27/2009
33
Reorder Point
Once an appropriate order quantity has been determined the next step in inventory
management is to determine the reorder point. The reorder point is based on demand and the
length of time of it takes from the time an order is placed to the time the order is received (lead
time). Therefore the reorder point is the inventory level at which an order is placed to replenish
inventory that has been used to fill customer demand.
The formula to determine the reorder point is:
Returning to our airline seats example, if the lead time for spare airline seats is two weeks, at
what inventory level should DirectJet reorder spare airline seats?
Reorder point = Weekly Demand lead time
Reorder point = 2 weeks52 weeks/year2000Reorder point = 2 77 seats52
A×
×
× ≈
- DirectJet should place their order for the EOQ of 100 seats when their inventory level
reaches 77 seats.
In order to protect against stock outs some businesses implement an inventory policy that
incorporates the element of safety stock. Safety stock is additional inventory that is carried to
insure that when there is customer demand the product will not be out of stock. Safety stock is
common in businesses because demand is not always constant. Airline maintenance is a great
example of the fluctuations in demand. A part for an engine may need to be replaced on five
different engines in one week but not needed on any engines the next week. Airlines may
incorporate safety stock into parts inventory to ensure that the part will always be available.
Because additional inventory is being held; the use of safety stock increases inventory holding
costs and, subsequently, the total inventory cost. In addition, the reorder point is also increased
by the amount of safety stock. The formula changes as follows:
Reorder point= Demand*lead time
Draft 3/27/2009
34
Total Holding Cost (THC) ( )2
Reorder point= (Demand lead time)+SS
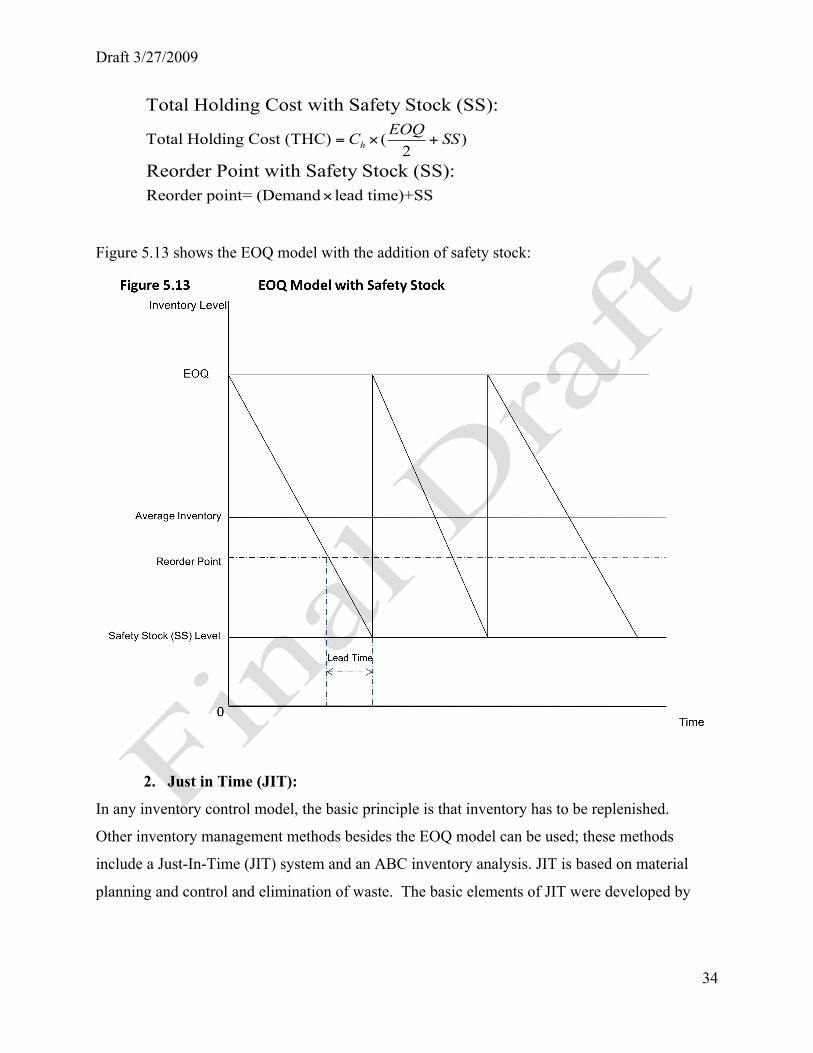
Total Holding Cost with Safety Stock (SS):
Reorder Point with Safety Stock (SS): h
EOQC SS= × +
×
Figure 5.13 shows the EOQ model with the addition of safety stock:
2. Just in Time (JIT):
In any inventory control model, the basic principle is that inventory has to be replenished.
Other inventory management methods besides the EOQ model can be used; these methods
include a Just-In-Time (JIT) system and an ABC inventory analysis. JIT is based on material
planning and control and elimination of waste. The basic elements of JIT were developed by
Draft 3/27/2009
35
Toyota in the 1950's, and became known as the Toyota Production System (TPS).7 In a JIT
system a business works closely with suppliers to ensure that inventory arrives only when it is
needed to satisfy customer demand. The goal of a JIT inventory system is to operate without
holding inventory or by holding as minimal inventory as possible. In a JIT environment each
unit is organized so that parts arrive for the next job just when the others are completed, and
therefore, the manufacturing process proceeds quickly. One prominent example of a JIT system
is Dell Computers. Dell works closely with suppliers to reduce lead time and only orders
computer components based on actual customer orders for computers (Woodgrange
Technologies, 2007). There are three components that are necessary to implement a JIT system:
- Close coordination with suppliers
- Consistent quality production (no waste)
- Near zero lead time
Just as JIT has many strong points, there are also weaknesses as well. In this model everything is
interdependent and each process relies on all the others (Greenberg, 2002). This means that, if
one process fails, then all others fail as well. However if a high degree of reliability in the
individual processes can be achieved then just-in-time is a source of great strategic advantage
and can provide large savings. Therefore, there are a great number of companies and industries
that have implemented JIT inventory systems.
3. ABC Inventory Control Model
An ABC inventory system classifies different items in a company’s inventory into three
different categories that are based on the cost, importance and frequency of use of each inventory
item. In an ABC inventory system, inventory that is worth a greater dollar amount and is of great
importance to the company is placed in the A category (the category with the highest level of
oversight and control). Less important inventory items are then categorized together and
inventory levels are monitored less closely (Block and Hirt, 2005). The ABC model is an
inventory management model where the inventory is divided into three categories:
• A Category- Inventory that has the highest value, usage or importance to the
company. Inventory levels of “A” items are kept higher and are monitored more
closely.
7 Chase, Jacobs, and Aquilano, Operations Management, 11th edition, Irwin/McGraw-Hill
Draft 3/27/2009
36
• B Category- Inventory items that have less importance, value or demand than the
A items. There is less control and monitoring of inventory levels than the A
category.
• C Category- Inventory items that have the lowest value or importance. For these
items there is minimal control and monitoring of inventory levels.
Many airline maintenance departments find that the ABC inventory approach works best for
them. Critical aircraft parts are placed in the A category and inventories of these parts are kept
high and monitored daily or weekly. More common, less-expensive items like nuts and bolts
may be put in the C classification and placed in a bin for easy access and/or retrieval. An order
to replace C inventory items may not be made until the bin is near empty.
Summary
This chapter has discussed the basics of working capital and current asset management. The
major topics discussed included: Cash management, inventory theory and operating cycle. Cash
is the most important current asset to manage as it is used to pay current liabilities but at the
same time, it does not yield a return to the company unless invested. Other current assets, such
as accounts receivable and inventory, must also be managed effectively since insufficient
management of accounts receivable and inventory can result in additional costs that airlines and
other businesses should avoid.
Draft 3/27/2009
37
References
Baumol, W. (1952). “The Transactions Demand for Cash,” QJE Nov. 545-556.
Besley, S. and E. Brigham (2000), Essentials of Managerial Finance, 12th ed. Harcourt College
Publishers, the McGraw-Hill Companies.
Best Buy (2008). Financing offers. Retrieved September 16, 2008 from
http://www.bestbuy.com/site/olspage.jsp?id=cat12125&type=page&fCode=10#.
Block, S. and G. Hirt. (2005). Foundations of Financial Management, 11th Edition.
Brigham, E. F. & Gapenski, L.C. (1994). Financial Management: Theory and practice
(7). Dryden Press, Orlando.
Chase, R., Jacobs, R., and J Aquilano. (2005). Operations Management for Competitive
Advantage, 11th Edition, McGraw-Hill/Irwin.
FX Trademaker (2008). Hedging Forex. Retrieved September 18, 2008 from
http://www.fxtrademaker.com/hedging_forex.htm#
Greenberg, D. (2002). “Just-In-Time Inventory System Proves Vulnerable to Labor
Strife.” Los Angeles Business Journal. October 7, 2002.
International Herald Tribune (2008, April 8). String of airline bankruptcies prompts
questions of which carrier could be next. Retrieved September 30, 2008 from
http://www.iht.com/articles/ap/2008/04/08/business/NA-FIN-US-Airline-
Bankruptcies.php?page=1
Merton M. and D. Orr. (1966). “A Model of the Demand for Money by Firms,” QJE Aug
413-435.
Moyer, C. McGuigan, J. and W. Kretlow. (2008). Contemporary Financial Management,
(10). Cengage Learning.
Ross, S.A., Westerfield, R.W. & Jordan, B.D. (2008). Fundamentals of Corporate
Finance (8). McGraw-Hill/Irwin, New York.
Serling, R.J. (2008). Character & Characters: The spirit of Alaska Airlines.
Documentary Media, Seattle.
SmartBrief (2008). Southwest bolsters cash position with $600 million in loans.
SmartBrief, Inc. Retrieved September 30, 2008 from
http://www.smartbrief.com/news/ASTA/companyData.jsp?companyId=679&c=s
ummary2005
Draft 3/27/2009
38
The Ottawa Citizen (1988, September 12). Pilot credit card refused, passengers chip in for fuel,
p.D17. Retrieved September 12, 2008, from ProQuest Newsstand database.
United Airlines (2008, July 22). United Airlines reaches agreement in principle to enhance
liquidity by approximately $1.2 Billion. UAL Corporation, Chicago.
Weensven, J.G. (2007). Air Transport: A management perspective (6). Ashgate Publishing.
Woodgrange Technologies (2007). Business2000 case study: Dell- A different way of doing
business. Woodgrange Technologies, Ltd. Retrieved October 1, 2008 from
http://www.business2000.ie/cases/cases/case409.htm