Embed Size (px)
Citation preview
148�
CHAPTER 9
INFLUENCE OF SMOOTHING ALGORITHMS IN MONTE
CARLO DOSE CALCULATIONS OF CYBERKNIFE
TREATMENT PLANS: A LUNG PHANTOM STUDY
9.1 INTRODUCTION
9.1.1 Dose Calculation Algorithms
Dose calculation algorithms are used in the TPS for determining the
dose distribution in radiotherapy. Accuracy of the treatment dose calculations
is determined by the algorithm used in the TPS. In a homogeneous medium
these algorithms are calculating nearly similar dose distributions. However
they are not yielding similar results in heterogeneous media (Fotina et al
2009; Knöös et al 1995). There are several algorithms introduced to improvise
the dose calculations in a heterogeneous interface or medium (Krieger and
Sauer 2005; Vanderstraeten et al 2006; Carrasco et al 2004; Deng et al 2003;
Deng et al 2004; Francescon et al 2009). Monte Carlo algorithm is considered
to be the finest of the dose calculating algorithms among all other
commercially available algorithms (Wilcox et al 2010; Wilcox and Daskalov
2008).
CyberKnife radiosurgery is performed for intracranial as well as
extra cranial targets. Lung target is one among the extracranial site which is
treated with dedicated tracking methods. Anatomy of lung is highly
inhomogeneous and it requires accurate dose calculation algorithms like
Monte Carlo algorithm.
149�
9.1.2 Monte Carlo Dose Calculation Algorithm in CyberKnife
Treatment Planning
Multiplan is the dedicated CyberKnife stereotactic radiosurgery
TPS. Multiplan TPS is one among the treatment planning systems which uses
Monte Carlo dose calculation algorithm. Multiplan system has Ray Tracing
dose calculations algorithm also, in addition with the Monte Carlo algorithm.
There are few studies available on implementation of Monte Carlo
algorithms in CyberKnife treatment planning (Wilcox et al 2010; Wilcox and
Daskalov 2008; Yamamoto et al 2002; Sánchez-Doblado et al 2003; Yu et al
2004, Araki 2006; Sharma et al 2010; Sharma et al 2011; Craig et al 2008).
According to Wilcox et al (2010) the discrepancies between the Ray tracing
and Monte Carlo algorithms are larger for plans using smaller collimator
sizes.
Depth dose studies of Yamamoto et al (2002) state that the
discrepancy between the Monte Carlo calculated and measured depth dose
curve increases with decreasing field size. According to Sharma et al (2010)
there can be significant differences between Ray tracing and Monte Carlo
calculations in a heterogeneous medium.
9.1.3 Monte Carlo Dose Smoothing Algorithms
The Monte Carlo calculations in the Multiplan treatment planning
system are associated with a smoothing algorithm. These algorithms are prone
to create discrepancy in the final dose distribution as the smoothing principles
are different in each smoothing algorithm. The influence of these Monte Carlo
dose smoothing algorithms are not yet studied in depth. The present study is
to analyze the influence of these Monte Carlo dose smoothing algorithms in a
lung phantom which has the greater extent of heterogeneity.
150�
9.2 MATERIALS AND METHODS
9.2.1 The Lung Phantom
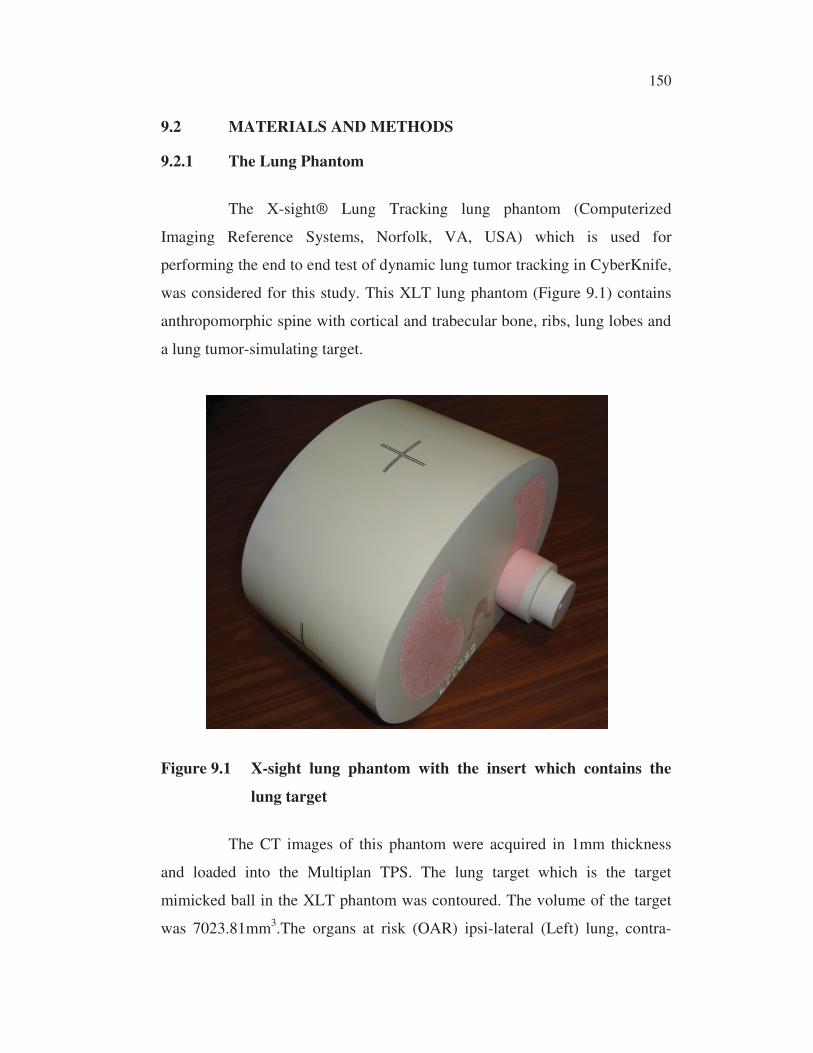
The X-sight® Lung Tracking lung phantom (Computerized
Imaging Reference Systems, Norfolk, VA, USA) which is used for
performing the end to end test of dynamic lung tumor tracking in CyberKnife,
was considered for this study. This XLT lung phantom (Figure 9.1) contains
anthropomorphic spine with cortical and trabecular bone, ribs, lung lobes and
a lung tumor-simulating target.
Figure 9.1 X-sight lung phantom with the insert which contains the
lung target
The CT images of this phantom were acquired in 1mm thickness
and loaded into the Multiplan TPS. The lung target which is the target
mimicked ball in the XLT phantom was contoured. The volume of the target
was 7023.81mm3.The organs at risk (OAR) ipsi-lateral (Left) lung, contra-

151�
lateral (Right) lung, and spine were also marked on the CT images. The
treatment plans were made for this target with proper constraints to the OARs.
9.2.2 Treatment Planning and the Dose Calculations for the Lung
Phantom in the Multiplan TPS
All the CyberKnife treatment plans are associated with a tracking
method. The lung tumors having definite size can also be used as a tracking
object and this lung tracking method is called as X-sight lung tracking.
Though it is lung tracking method the initial alignment is done by aligning the
spine. As the part of the planning, the initial Spine Tracking Volume was
contoured. Then the alignment of the spine in the DRR (generated by the
TPS) was confirmed. The lung tumor simulating the target was taken as the
Tumor Tracking Volume. The sequential optimization was selected for the
treatment planning. The collimators were selected by the automatic collimator
selection tool for optimal conformity.This tool suggested 10mm and 15mm
collimator for the lung target. Then four dose limiting shell volumes were
created around the target.
The first shell covered a radial width of 2 mm around the target.
The second shell covered 3mm radial width around the first shell. The third
shell covered 5mm from the second shell. Similarly the final fourth shell
covered a radial with of 15mm around the third shell. The dose limit set for
the first shell was 100% of the target dose. Similarly the limiting dose of 85%,
60% and 25% of the target dose were set for the second shell, third shell and
the fourth shell respectively. The goal to the target dose coverage was set as
60Gy in 4 fractions and it was set for optimal conformity. The Ray tracing
algorithm was selected for the dose calculations. The optimization was
executed in low resolution. Once the optimization was completed the high
resolution calculations were performed. In Multiplan planning system the
maximum dose was taken as the default normalization dose. The isodose
152�
covering the 95% of the target was selected for prescription and the
prescription dose in this study was 60 Gy.
In CyberKnife the Monte Carlo dose calculations are performed
after the basic dose calculations by the Ray tracing algorithm. Hence the high
resolution Ray tracing doses were introduced for Monte Carlo calculations
with the same beam parameters estimated by the basic Ray tracing based
sequential optimization. The Monte Carlo doses were smoothed by the
smoothing algorithms. The smoothing algorithms available in Multiplan TPS
are Average, Weighted average, Gaussian, Clipped Gaussian and Desparkled-
Only algorithm.
9.2.3 Principles of the Dose Smoothing Algorithms
The average smoothing algorithm computes the average value
within a 3x3x3- voxel cube surrounding the calculation voxel.
Weighted averagealso does the same but with weighting factors
which decreases with distance from the central voxel.
Gaussian algorithm gives the convolution of the dose distribution
with a 3D Gaussian function and the standard deviation � of the Gaussian
function can be selected by the user. Two different standard deviations (� =
0.2 and � = 3) are taken for the present study.
Clipped Gaussian also does the same but the outcome of the
Gaussian function is modified so that the difference between the raw dose and
the smoothed dose exists within the statistical uncertainty in dose calculation
at each voxel.
Desparkled-Only algorithm removes the artificial hot spots at
voxels with greater uncertainty.
153�
All the smoothing algorithms were introduced in the Monte Carlo
dose calculations independently and the results were analyzed and compared.
9.2.4 Treatment Plan Evaluation for Comparison
The CyberKnife treatment plans of different Monte Carlo dose
smoothing algorithms were evaluated for target coverage and sparing of the
OAR.
The formulae used to calculate the conformity index and the
homogeneity index are given below.
Conformity index CI = (VRI / TVRI) x (TV/ TVRI)
Where, VRI is the actual volume including the target, receiving the
prescription isodose or more, TV is the volume of the target, and TVRI is the
volume of the target which receives the prescription isodose or more.
The homogeneity index is given by,
Homogeneity Index HI = (D2% -D 98%)/ D 50%
Where, D2% is the dose received by only 2% of the target volume, D98% is the
dose received by 98% of the target volume and D 50% is the dose received by
50% of the target volume.
For the OARs spine, ipsi- lateral lung and contra lateral lung the
V100%, V80%, V50%, V30%, V10%, V5% were evaluated in terms of the volume in
cubic millimeters.
The P-values were calculated from the two tailed Student’s T test
and tabulated accordingly.
154�
9.3 RESULTS
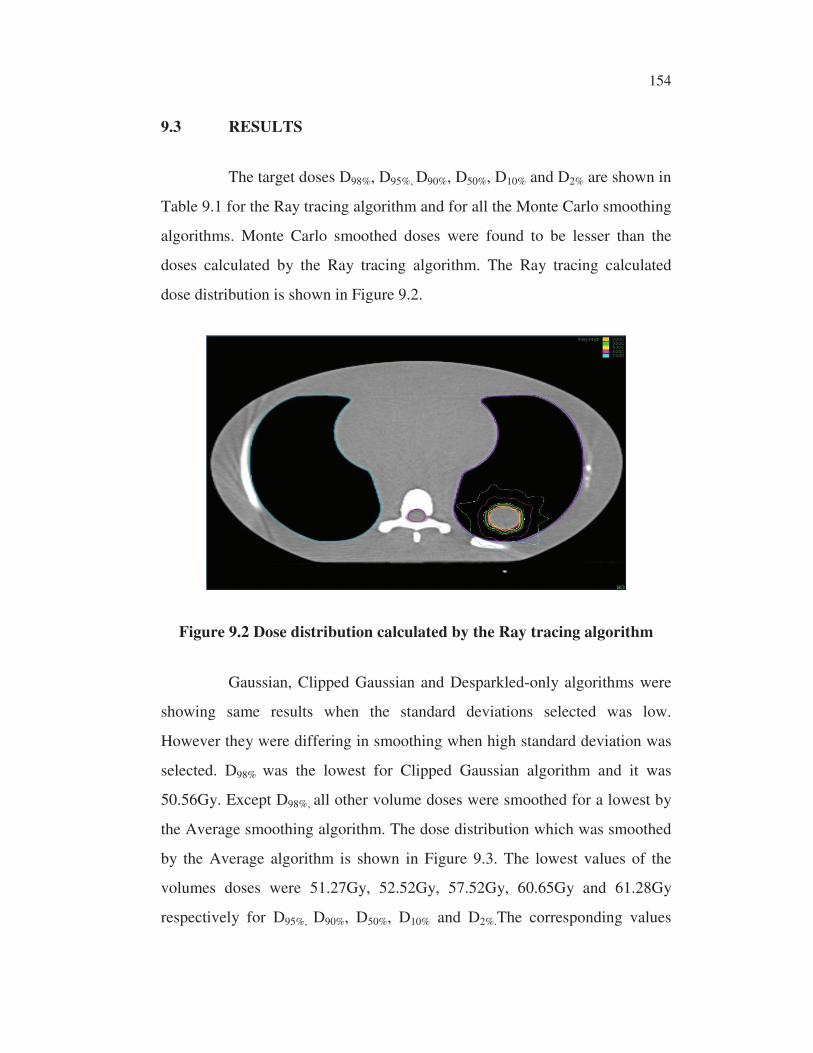
The target doses D98%, D95%, D90%, D50%, D10% and D2% are shown in
Table 9.1 for the Ray tracing algorithm and for all the Monte Carlo smoothing
algorithms. Monte Carlo smoothed doses were found to be lesser than the
doses calculated by the Ray tracing algorithm. The Ray tracing calculated
dose distribution is shown in Figure 9.2.
Figure 9.2 Dose distribution calculated by the Ray tracing algorithm
Gaussian, Clipped Gaussian and Desparkled-only algorithms were
showing same results when the standard deviations selected was low.
However they were differing in smoothing when high standard deviation was
selected. D98% was the lowest for Clipped Gaussian algorithm and it was
50.56Gy. Except D98%, all other volume doses were smoothed for a lowest by
the Average smoothing algorithm. The dose distribution which was smoothed
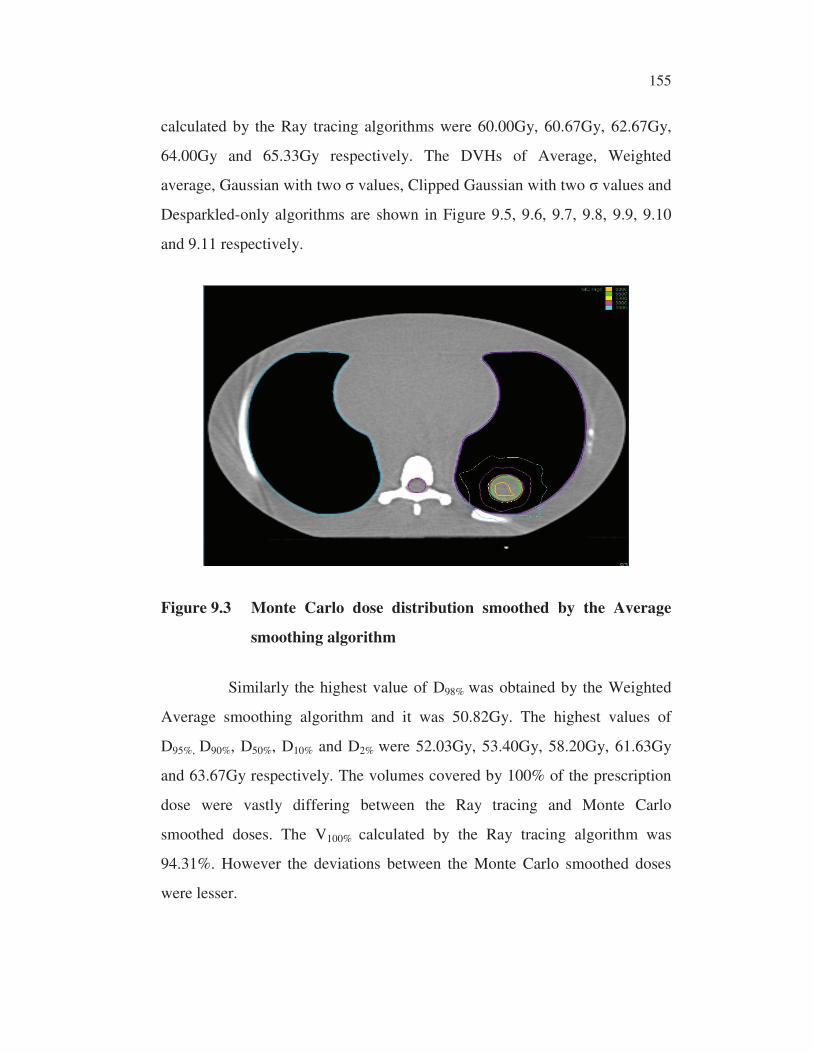
by the Average algorithm is shown in Figure 9.3. The lowest values of the
volumes doses were 51.27Gy, 52.52Gy, 57.52Gy, 60.65Gy and 61.28Gy
respectively for D95%, D90%, D50%, D10% and D2%.The corresponding values
155�
calculated by the Ray tracing algorithms were 60.00Gy, 60.67Gy, 62.67Gy,
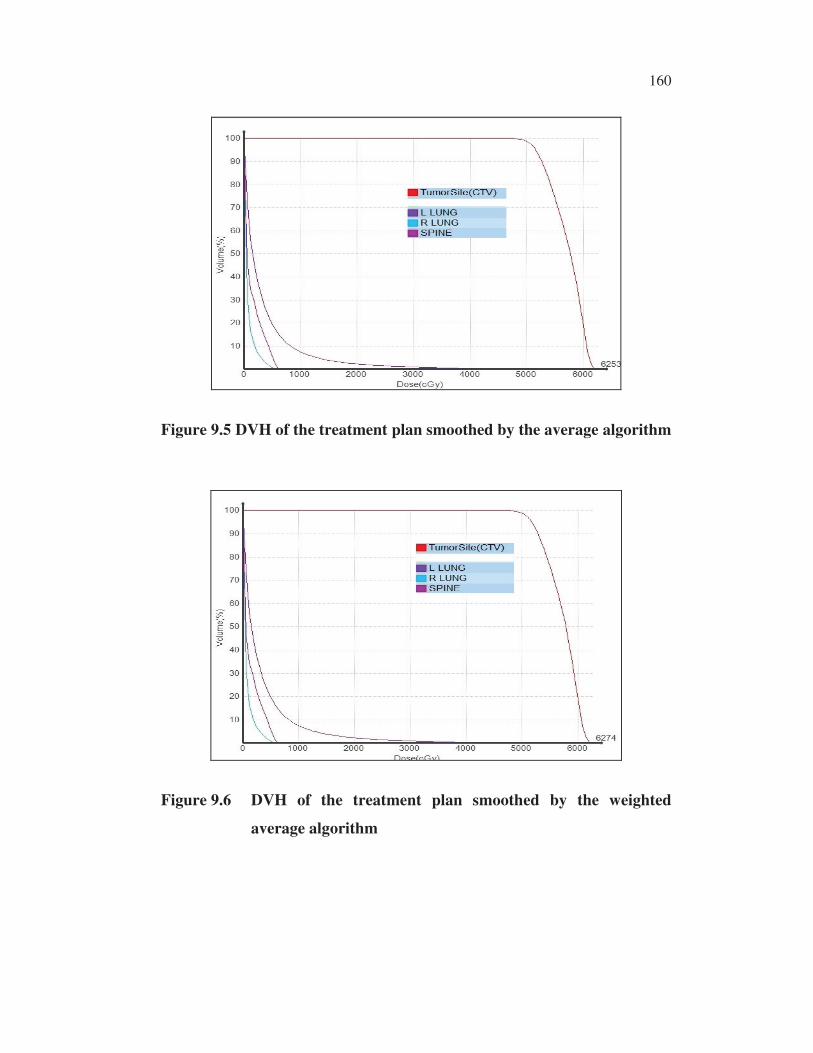
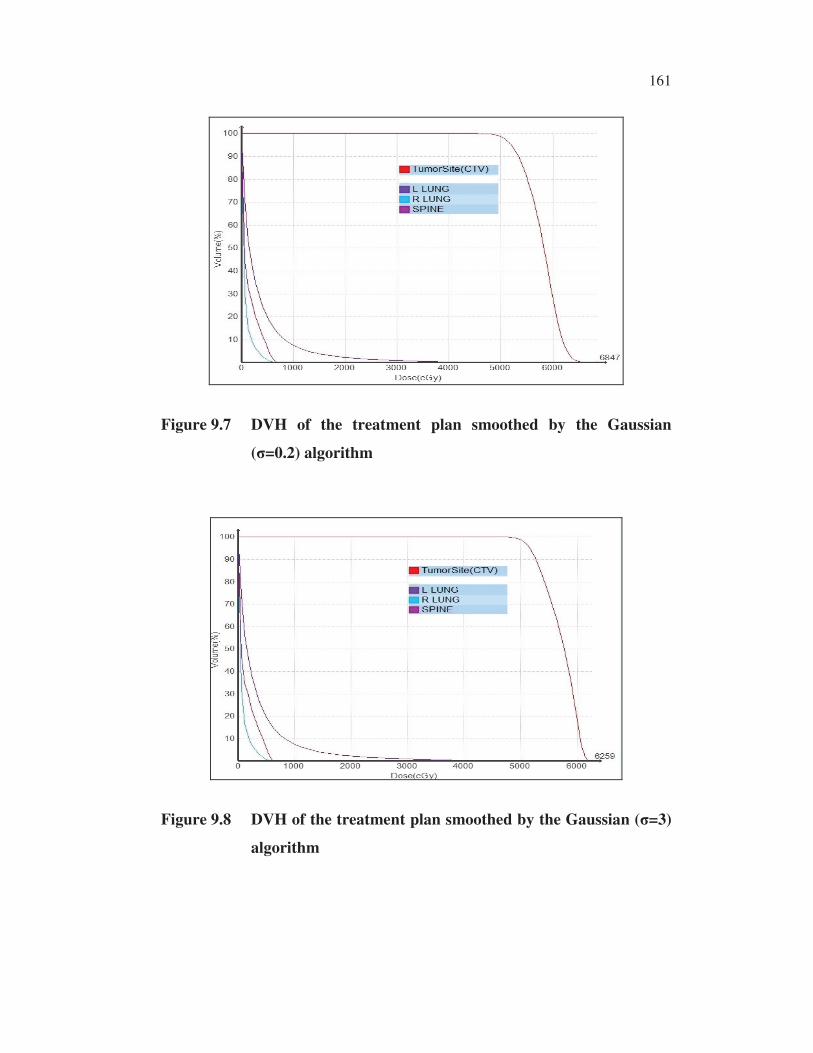
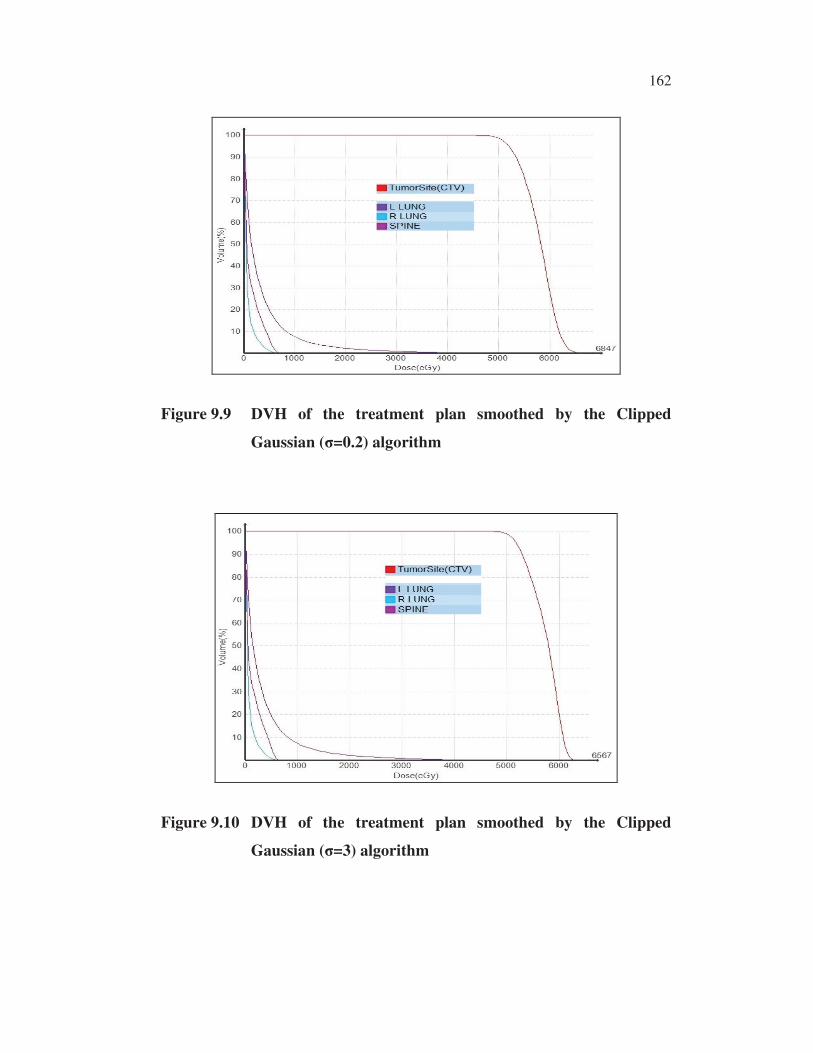
64.00Gy and 65.33Gy respectively. The DVHs of Average, Weighted
average, Gaussian with two � values, Clipped Gaussian with two � values and
Desparkled-only algorithms are shown in Figure 9.5, 9.6, 9.7, 9.8, 9.9, 9.10
and 9.11 respectively.
Figure 9.3 Monte Carlo dose distribution smoothed by the Average
smoothing algorithm
Similarly the highest value of D98% was obtained by the Weighted
Average smoothing algorithm and it was 50.82Gy. The highest values of
D95%, D90%, D50%, D10% and D2% were 52.03Gy, 53.40Gy, 58.20Gy, 61.63Gy
and 63.67Gy respectively. The volumes covered by 100% of the prescription
dose were vastly differing between the Ray tracing and Monte Carlo
smoothed doses. The V100% calculated by the Ray tracing algorithm was
94.31%. However the deviations between the Monte Carlo smoothed doses
were lesser.
156�
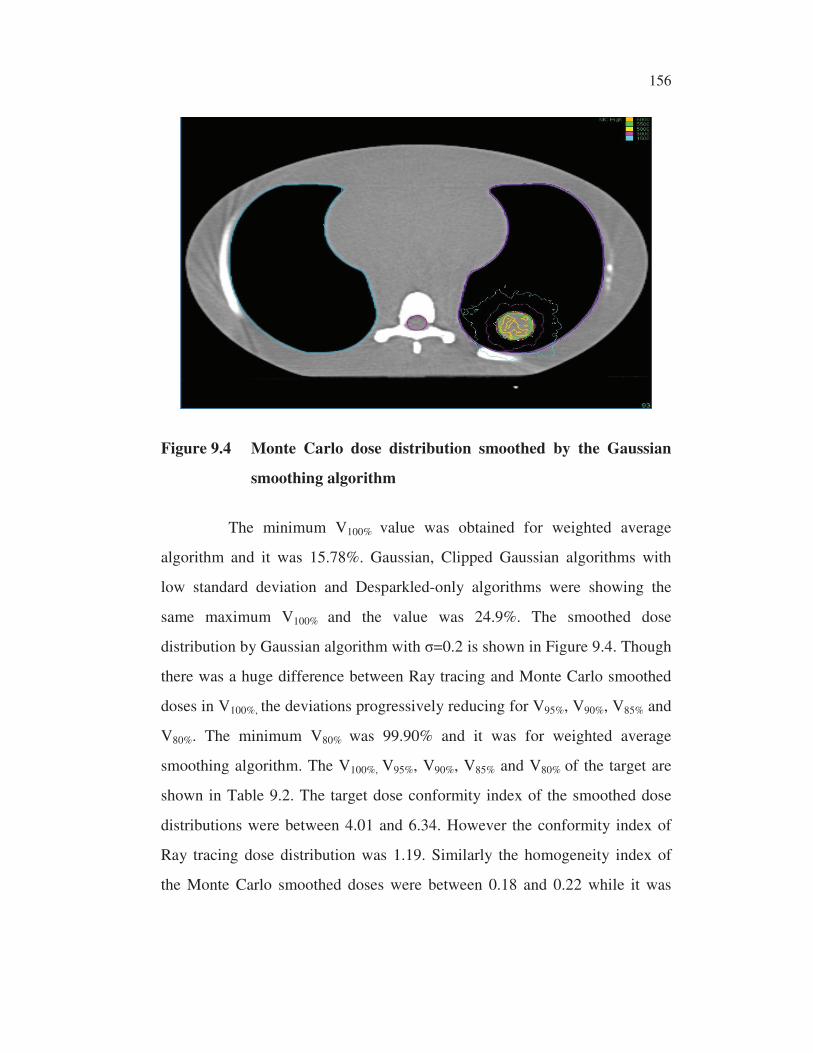
Figure 9.4 Monte Carlo dose distribution smoothed by the Gaussian
smoothing algorithm
The minimum V100% value was obtained for weighted average
algorithm and it was 15.78%. Gaussian, Clipped Gaussian algorithms with
low standard deviation and Desparkled-only algorithms were showing the
same maximum V100% and the value was 24.9%. The smoothed dose
distribution by Gaussian algorithm with �=0.2 is shown in Figure 9.4. Though
there was a huge difference between Ray tracing and Monte Carlo smoothed
doses in V100%, the deviations progressively reducing for V95%, V90%, V85% and
V80%. The minimum V80% was 99.90% and it was for weighted average
smoothing algorithm. The V100%, V95%, V90%, V85% and V80% of the target are
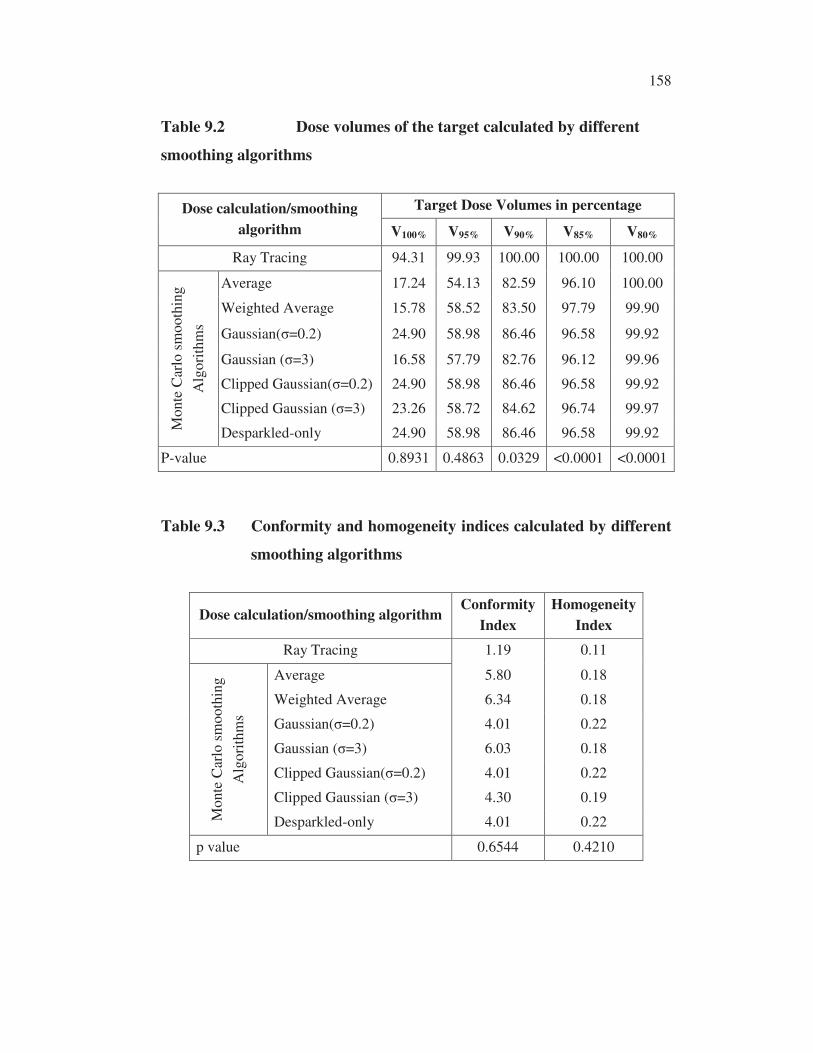
shown in Table 9.2. The target dose conformity index of the smoothed dose
distributions were between 4.01 and 6.34. However the conformity index of
Ray tracing dose distribution was 1.19. Similarly the homogeneity index of
the Monte Carlo smoothed doses were between 0.18 and 0.22 while it was
157�
0.11 for Ray tracing. The conformity index and homogeneity index are
tabulated in Table 9.3.
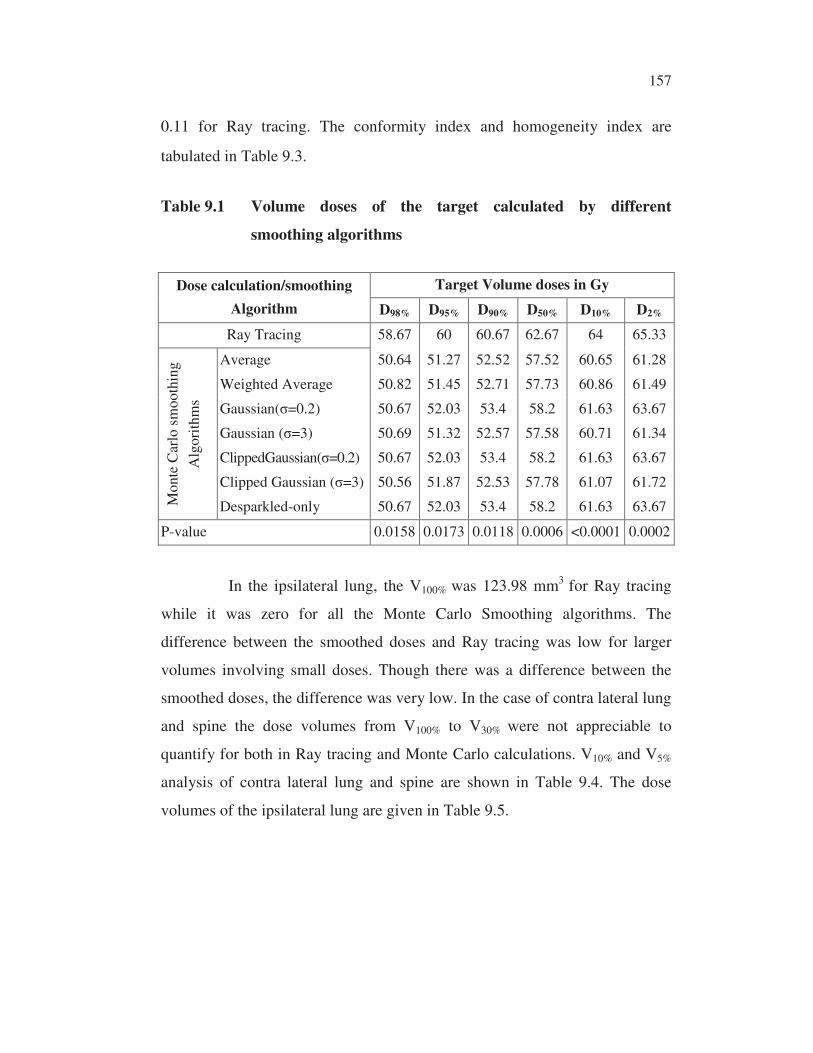
Table 9.1 Volume doses of the target calculated by different
smoothing algorithms
Dose calculation/smoothing
Algorithm
Target Volume doses in Gy
D98% D95% D90% D50% D10% D2%
Ray Tracing 58.67 60 60.67 62.67 64 65.33
Mo
nte
Car
lo s
mo
oth
ing
Alg
ori
thm
s
Average 50.64 51.27 52.52 57.52 60.65 61.28
Weighted Average 50.82 51.45 52.71 57.73 60.86 61.49
Gaussian(�=0.2) 50.67 52.03 53.4 58.2 61.63 63.67
Gaussian (�=3) 50.69 51.32 52.57 57.58 60.71 61.34
ClippedGaussian(�=0.2) 50.67 52.03 53.4 58.2 61.63 63.67
Clipped Gaussian (�=3) 50.56 51.87 52.53 57.78 61.07 61.72
Desparkled-only 50.67 52.03 53.4 58.2 61.63 63.67
P-value 0.0158 0.0173 0.0118 0.0006 <0.0001 0.0002
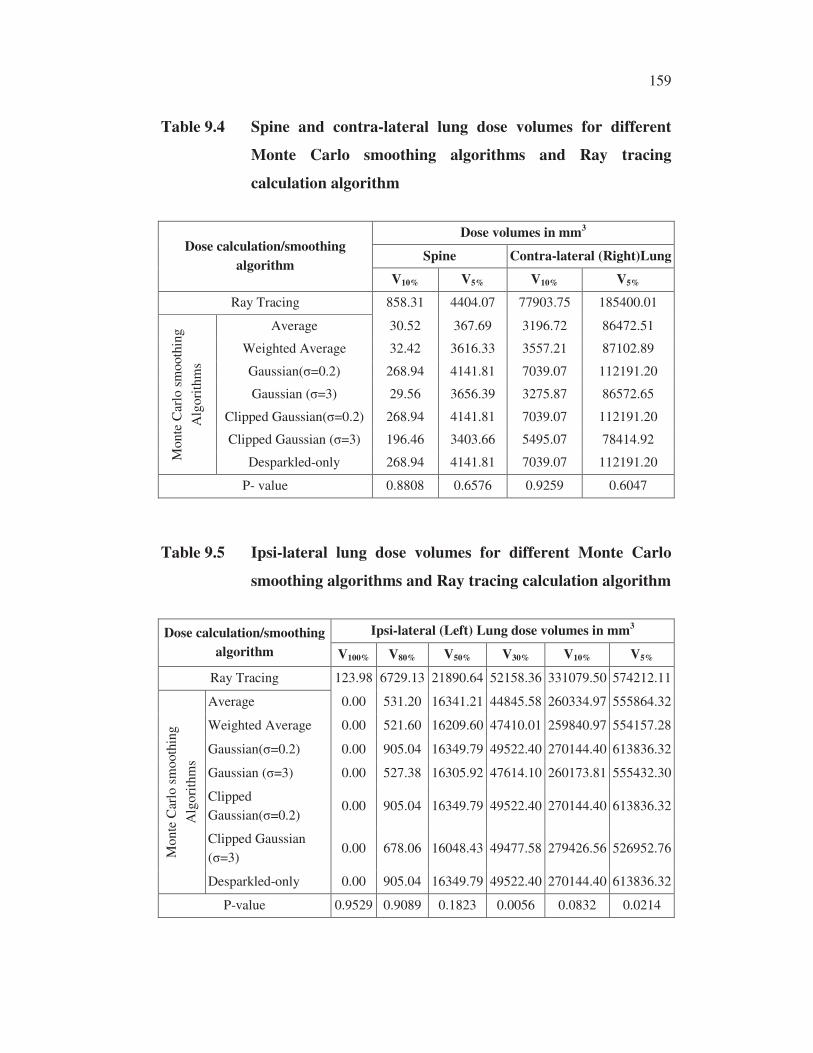
In the ipsilateral lung, the V100% was 123.98 mm3
for Ray tracing
while it was zero for all the Monte Carlo Smoothing algorithms. The
difference between the smoothed doses and Ray tracing was low for larger
volumes involving small doses. Though there was a difference between the
smoothed doses, the difference was very low. In the case of contra lateral lung
and spine the dose volumes from V100% to V30% were not appreciable to
quantify for both in Ray tracing and Monte Carlo calculations. V10% and V5%
analysis of contra lateral lung and spine are shown in Table 9.4. The dose
volumes of the ipsilateral lung are given in Table 9.5.
158�
Table 9.2 Dose volumes of the target calculated by different
smoothing algorithms
Dose calculation/smoothing
algorithm
Target Dose Volumes in percentage
V100% V95% V90% V85% V80%
Ray Tracing 94.31 99.93 100.00 100.00 100.00
Mo
nte
Car
lo s
mo
oth
ing
Alg
ori
thm
s
Average 17.24 54.13 82.59 96.10 100.00
Weighted Average 15.78 58.52 83.50 97.79 99.90
Gaussian(�=0.2) 24.90 58.98 86.46 96.58 99.92
Gaussian (�=3) 16.58 57.79 82.76 96.12 99.96
Clipped Gaussian(�=0.2) 24.90 58.98 86.46 96.58 99.92
Clipped Gaussian (�=3) 23.26 58.72 84.62 96.74 99.97
Desparkled-only 24.90 58.98 86.46 96.58 99.92
P-value 0.8931 0.4863 0.0329 <0.0001 <0.0001
Table 9.3 Conformity and homogeneity indices calculated by different
smoothing algorithms
Dose calculation/smoothing algorithm Conformity
Index
Homogeneity
Index
Ray Tracing 1.19 0.11
Mo
nte
Car
lo s
mo
oth
ing
Alg
ori
thm
s
Average 5.80 0.18
Weighted Average 6.34 0.18
Gaussian(�=0.2) 4.01 0.22
Gaussian (�=3) 6.03 0.18
Clipped Gaussian(�=0.2) 4.01 0.22
Clipped Gaussian (�=3) 4.30 0.19
Desparkled-only 4.01 0.22
p value 0.6544 0.4210
159�
Table 9.4 Spine and contra-lateral lung dose volumes for different
Monte Carlo smoothing algorithms and Ray tracing
calculation algorithm
Dose calculation/smoothing
algorithm
Dose volumes in mm3
Spine Contra-lateral (Right)Lung
V10% V5% V10% V5%
Ray Tracing 858.31 4404.07 77903.75 185400.01
Mo
nte
Car
lo s
mo
oth
ing
Alg
ori
thm
s
Average 30.52 367.69 3196.72 86472.51
Weighted Average 32.42 3616.33 3557.21 87102.89
Gaussian(�=0.2) 268.94 4141.81 7039.07 112191.20
Gaussian (�=3) 29.56 3656.39 3275.87 86572.65
Clipped Gaussian(�=0.2) 268.94 4141.81 7039.07 112191.20
Clipped Gaussian (�=3) 196.46 3403.66 5495.07 78414.92
Desparkled-only 268.94 4141.81 7039.07 112191.20
P- value 0.8808 0.6576 0.9259 0.6047
Table 9.5 Ipsi-lateral lung dose volumes for different Monte Carlo
smoothing algorithms and Ray tracing calculation algorithm
Dose calculation/smoothing
algorithm
Ipsi-lateral (Left) Lung dose volumes in mm3
V100% V80% V50% V30% V10% V5%
Ray Tracing 123.98 6729.13 21890.64 52158.36 331079.50 574212.11
Mo
nte
Car
lo s
mo
oth
ing
Alg
ori
thm
s
Average 0.00 531.20 16341.21 44845.58 260334.97 555864.32
Weighted Average 0.00 521.60 16209.60 47410.01 259840.97 554157.28
Gaussian(�=0.2) 0.00 905.04 16349.79 49522.40 270144.40 613836.32
Gaussian (�=3) 0.00 527.38 16305.92 47614.10 260173.81 555432.30
Clipped
Gaussian(�=0.2) 0.00 905.04 16349.79 49522.40 270144.40 613836.32
Clipped Gaussian
(�=3) 0.00 678.06 16048.43 49477.58 279426.56 526952.76
Desparkled-only 0.00 905.04 16349.79 49522.40 270144.40 613836.32
P-value 0.9529 0.9089 0.1823 0.0056 0.0832 0.0214
160�
Figure 9.5 DVH of the treatment plan smoothed by the average algorithm
Figure 9.6 DVH of the treatment plan smoothed by the weighted
average algorithm
161�
Figure 9.7 DVH of the treatment plan smoothed by the Gaussian
(�=0.2) algorithm
Figure 9.8 DVH of the treatment plan smoothed by the Gaussian (�=3)
algorithm
162�
Figure 9.9 DVH of the treatment plan smoothed by the Clipped
Gaussian (�=0.2) algorithm
Figure 9.10 DVH of the treatment plan smoothed by the Clipped
Gaussian (�=3) algorithm
163�
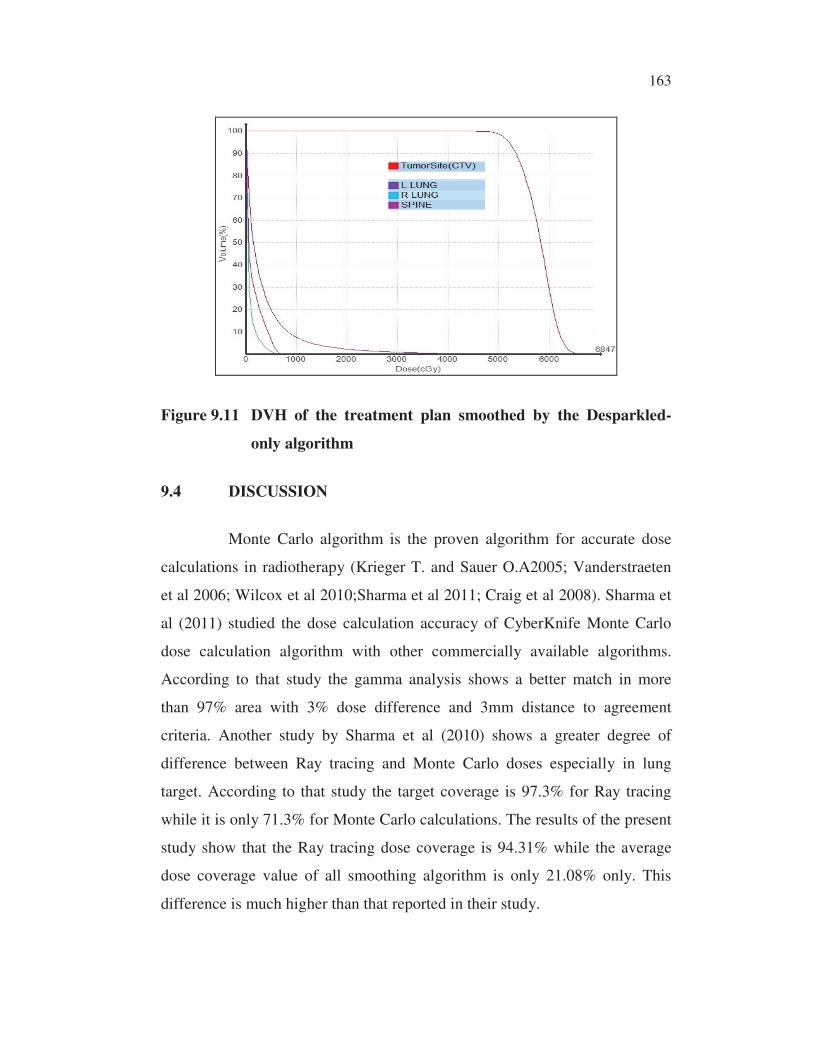
Figure 9.11 DVH of the treatment plan smoothed by the Desparkled-
only algorithm
9.4 DISCUSSION
Monte Carlo algorithm is the proven algorithm for accurate dose
calculations in radiotherapy (Krieger T. and Sauer O.A2005; Vanderstraeten
et al 2006; Wilcox et al 2010;Sharma et al 2011; Craig et al 2008). Sharma et
al (2011) studied the dose calculation accuracy of CyberKnife Monte Carlo
dose calculation algorithm with other commercially available algorithms.
According to that study the gamma analysis shows a better match in more
than 97% area with 3% dose difference and 3mm distance to agreement
criteria. Another study by Sharma et al (2010) shows a greater degree of
difference between Ray tracing and Monte Carlo doses especially in lung
target. According to that study the target coverage is 97.3% for Ray tracing
while it is only 71.3% for Monte Carlo calculations. The results of the present
study show that the Ray tracing dose coverage is 94.31% while the average
dose coverage value of all smoothing algorithm is only 21.08% only. This
difference is much higher than that reported in their study.
164�
Studies by Wilcox et al (2010) say that the maximum doses
calculated by the Ray tracing are higher than the Monte Carlo plans by up to a
factor of 1.63. In the present study the D98% of Ray tracing dose is 97.8% and
the mean D98% value of all smoothing algorithms is 84.5%. This difference is
lesser than the difference quoted by Wilcox et al (2010).
Gaussian smoothing algorithm with standard deviation of 1 is taken
in those studies by Sharma et al (2010). However the role of all other dose
smoothing algorithms in CyberKnife Monte Carlo calculations is not
addressed explicitly in any of the Monte Carlo studies reported till now. The
present study shows that there is a disparity in the conformity index among
the different dose smoothing algorithms.
The dose conformity index is the measure of conformity of the
prescribed dose to the target. Variation in the conformity index shows that
there is a non-uniformity in the dose coverage between the Monte Carlo
smoothed dose distributions. The values are more than 4 indicate the degree
of under coverage of the prescribed dose. The weighted average algorithm
gives the least dose conformity with a maximum conformity index of 6.34.
For an ideal dose distribution, the conformity index should be 1. Interestingly
the conformity index of Ray tracing calculation is closer to 1 and it is 1.19.
Homogeneity in dose distribution within the target is quantified
with the homogeneity index. For an ideal dose distribution the homogeneity
index should be zero. This means the D2% and D98% should be the same for an
ideal dose distribution. In reality for a good plan the homogeneity index
should be closer to zero. In the present study the homogeneity index for the
Ray tracing algorithm is 0.11. However the homogeneity index for all the
Monte Carlo smoothing algorithms it is about 0.20. The least value of
homogeneity index is obtained for Average, Weighted average and Gaussian
(�=3) algorithms with a homogeneity index of 0.18. Though there is a
165�
difference in the target covering dose, the difference among the smoothing
algorithms in the D95%, D90%, D50% and D2% are found to be small.
Disparity between the Monte Carlo smoothing algorithms is higher
for V100% values than the V80% values. This is seen in the OAR dose
distributions too. These results are showing that the smoothing algorithms are
creating appreciable discrepancies in the higher dose regions than in the lower
dose regions.
According to Sharma et al (2010) the difference between the Ray
tracing and Monte Carlo doses are also decided by the location of the tumor in
the lung. The present study is a phantom study and the target position at
different places couldn’t be accounted. Further studies on real patient should
be made to analyze the role of location in Monte Carlo Smoothing algorithms.
8.5 CONCLUSION
Monte Carlo smoothed doses for all the five available algorithms in
the Multiplan treatment planning system are resulting in reduced doses when
compared with the Ray tracing doses. The differences between the algorithms
are predominant in the higher doses regions and in the target dose conformity
index. In regions of lower doses the smoothing algorithms are giving similar
results with lesser discrepancy. Desparkled only and Gaussian, Clipped
Gaussian algorithms with smaller standard deviation are yielding same
results. However they are differing when the selected standard deviation is in
the higher side. As the dose smoothing algorithms are creating discrepancies
in the final dose distributions in lung targets, it is essential to select an
accurate and optimal dose smoothing algorithm in Monte Carlo dose
calculations of CyberKnife radiosurgery treatment planning of lung cancer.
Inappropriate choice of smoothing algorithm may lead to under or over
dosage in lung targets.