Embed Size (px)
Citation preview

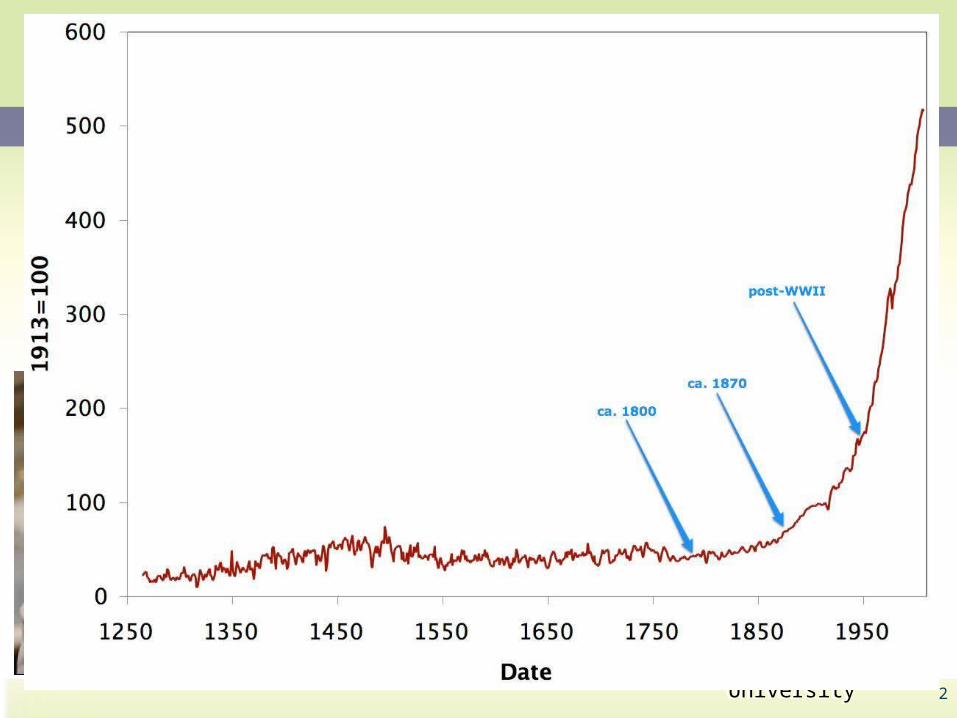
Chapter 9Economic Growth
and Rising Living Standards
CHAPTER
1
2
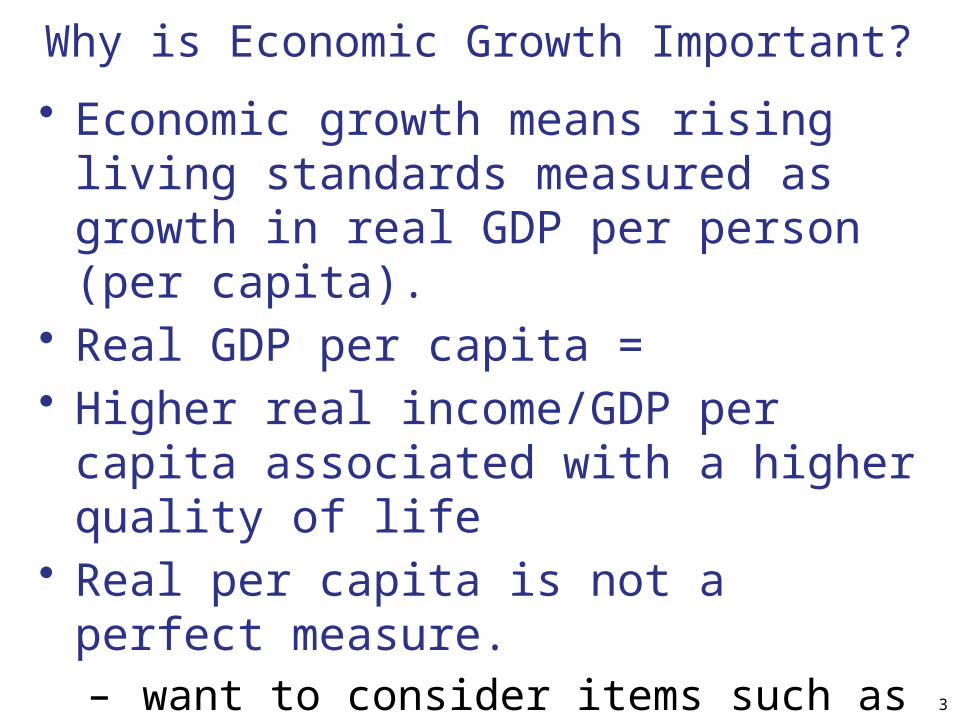
Why is Economic Growth Important?
• Economic growth means rising living standards measured as growth in real GDP per person (per capita).
• Real GDP per capita = • Higher real income/GDP per capita
associated with a higher quality of life • Real per capita is not a perfect measure.
– want to consider items such as education, environment, good health, leisure time
– distribution of income3
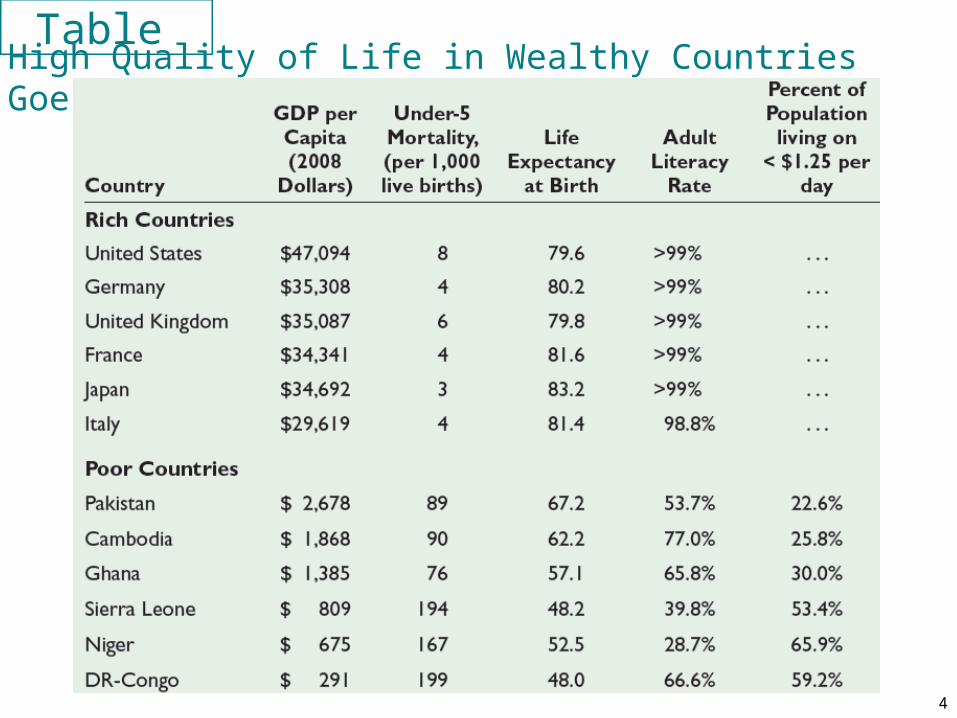
High Quality of Life in Wealthy Countries Goes Beyond GDP
4
Importance of Economic Growth
• Small differences in GDP growth rate matter a lot over time
• The rule of 70– if a variable is growing by X percent per
year it will double in approximately 70 / X years
– 70/2 = 35 years (2% growth per year)– 70/4 = 17.5 years (4% growth per year)
5
Meaning and Importance of Economic Growth
• US real GDP per capita in 2013 was $50,000
• At 2% annual growth, this will grow to $50,000(1.02)20 =$74,300 in 20 years
• At 3% annual growth, this will grow to $50,000(1.03)20 =$90,300 in 20 years
6
How about investment returns?• Suppose you have $50,000 to invest -• At 2% annual growth, say in a savings
account, this will grow to $50,000(1.02)20
=$74,300 in 20 years
• At 7%, in the stock market, $50,000(1.07)20 =$193,480 in 20 years
• Growth rates matter!
7
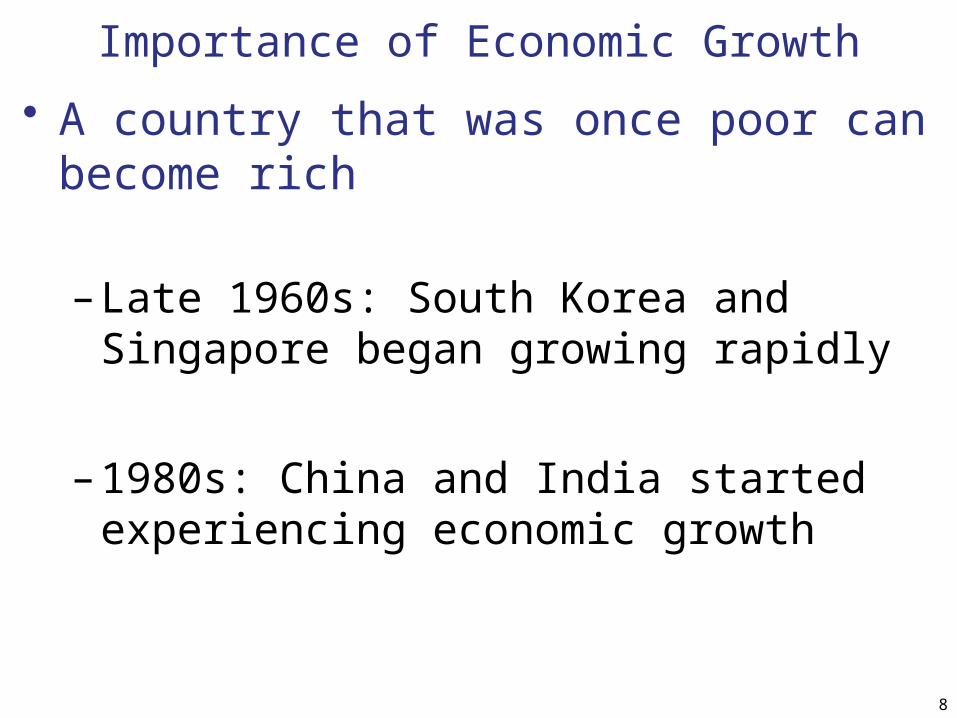
Importance of Economic Growth
• A country that was once poor can become rich
– Late 1960s: South Korea and Singapore began growing rapidly
– 1980s: China and India started experiencing economic growth
8
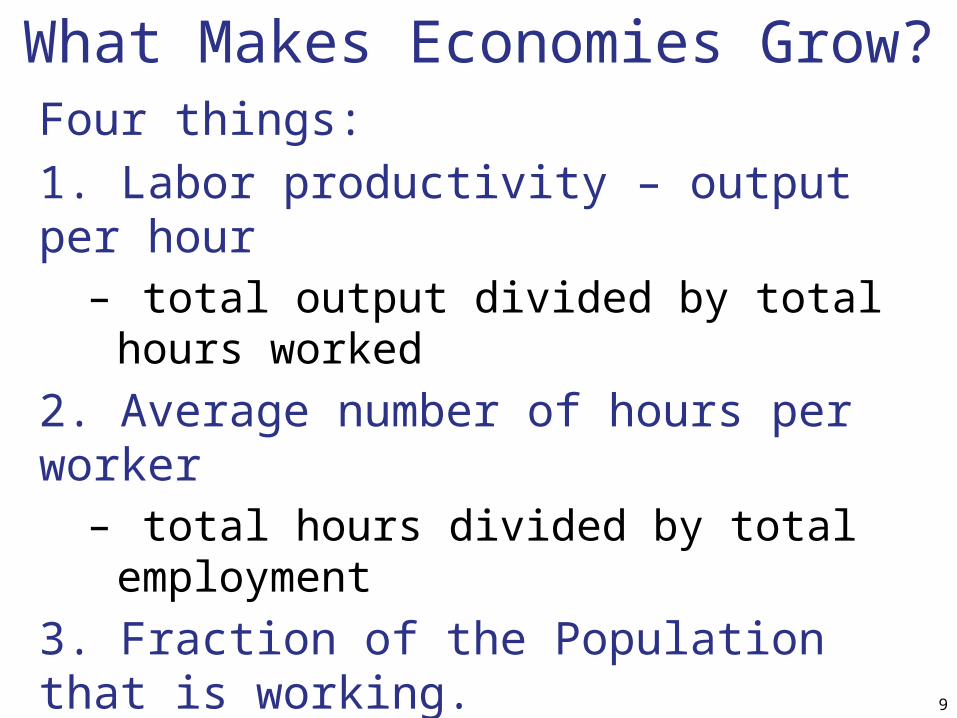
What Makes Economies Grow?Four things:
1. Labor productivity – output per hour– total output divided by total hours worked
2. Average number of hours per worker– total hours divided by total employment
3. Fraction of the Population that is working.
• The Employment–population ratio (EPR) • Total employment divided by total population
4. The size of the population9
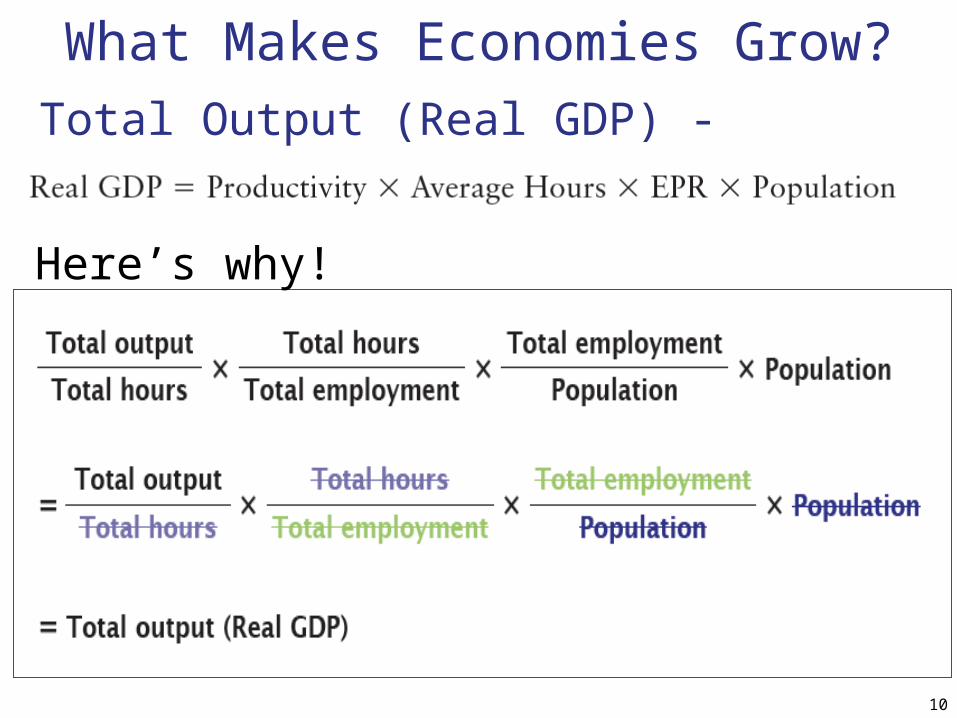
What Makes Economies Grow?
Total Output (Real GDP) -
10
Here’s why!
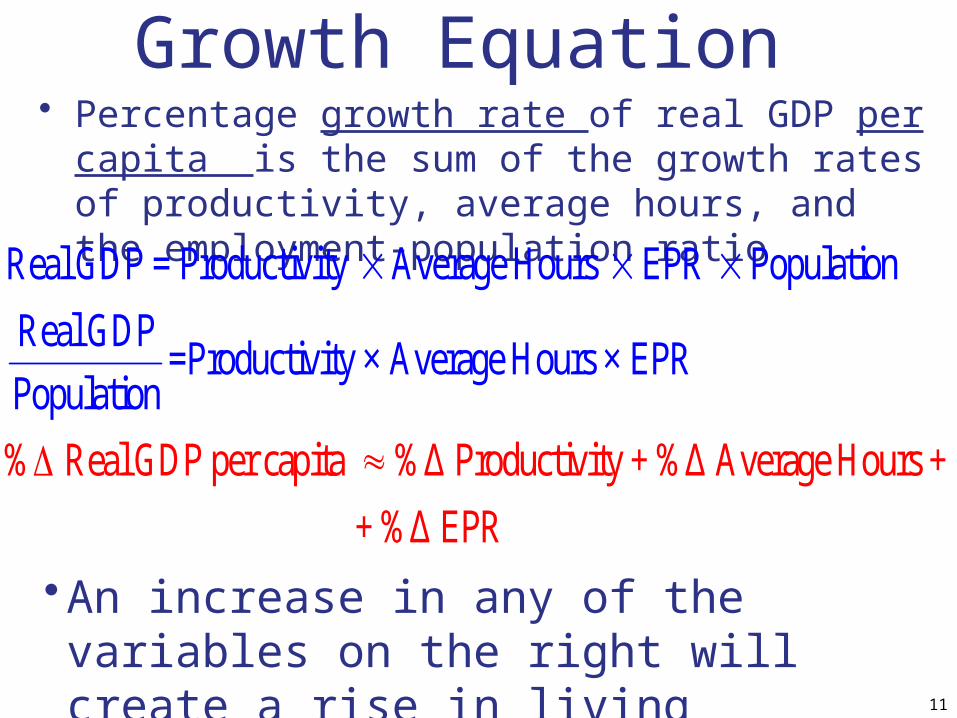
Growth Equation • Percentage growth rate of real GDP per capita is
the sum of the growth rates of productivity, average hours, and the employment-population ratio
11
Real GDP = Productivity Average Hours EPR Population
Real GDP=Productivity × Average H
% Real GDP per capita %Δ Productivity + %Δ Average Hours +
o
ur
s ×
EPRPopula
t
n
io
+ %Δ EPR
•An increase in any of the variables on the right will create a rise in living standards
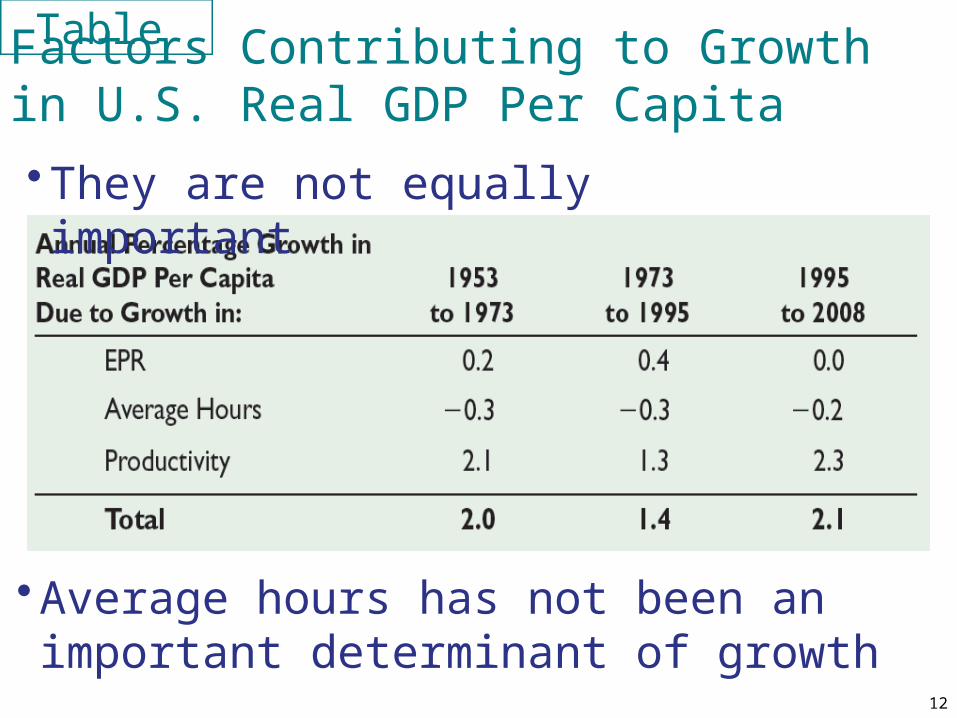
Factors Contributing to Growth in U.S. Real GDP Per Capita
12
•They are not equally important
•Average hours has not been an important determinant of growth
Growth in the EPR • Employment-population ratio, EPR,
increases when total employment rises at a faster rate than the population
13
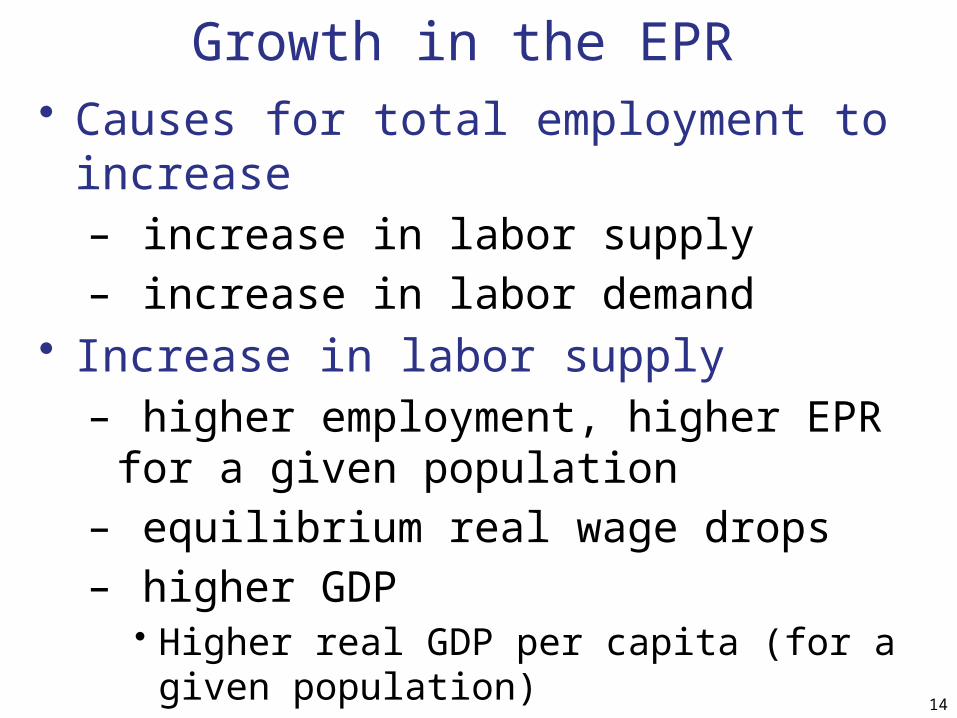
Growth in the EPR • Causes for total employment to increase
– increase in labor supply– increase in labor demand
• Increase in labor supply– higher employment, higher EPR for a
given population– equilibrium real wage drops– higher GDP
• Higher real GDP per capita (for a given population)
14
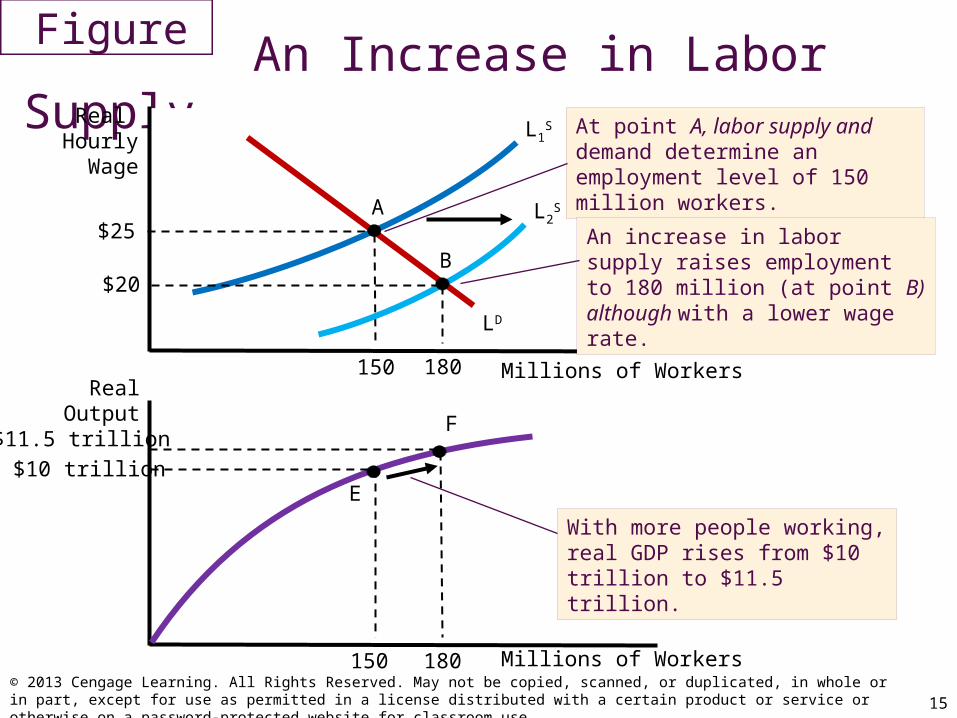
An Increase in Labor Supply
15© 2013 Cengage Learning. All Rights Reserved. May not be copied, scanned, or duplicated, in whole or in part, except for use as permitted in a license distributed with a certain product or service or otherwise on a password-protected website for classroom use.
Millions of Workers
Real Hourly Wage
LD
$25
150
At point A, labor supply and demand determine an employment level of 150 million workers.
Millions of Workers
Real Output
150
$10 trillion
L1S
A
E
L2S
B
180
$20
An increase in labor supply raises employment to 180 million (at point B) although with a lower wage rate.
180
F$11.5 trillion
With more people working, real GDP rises from $10 trillion to $11.5 trillion.
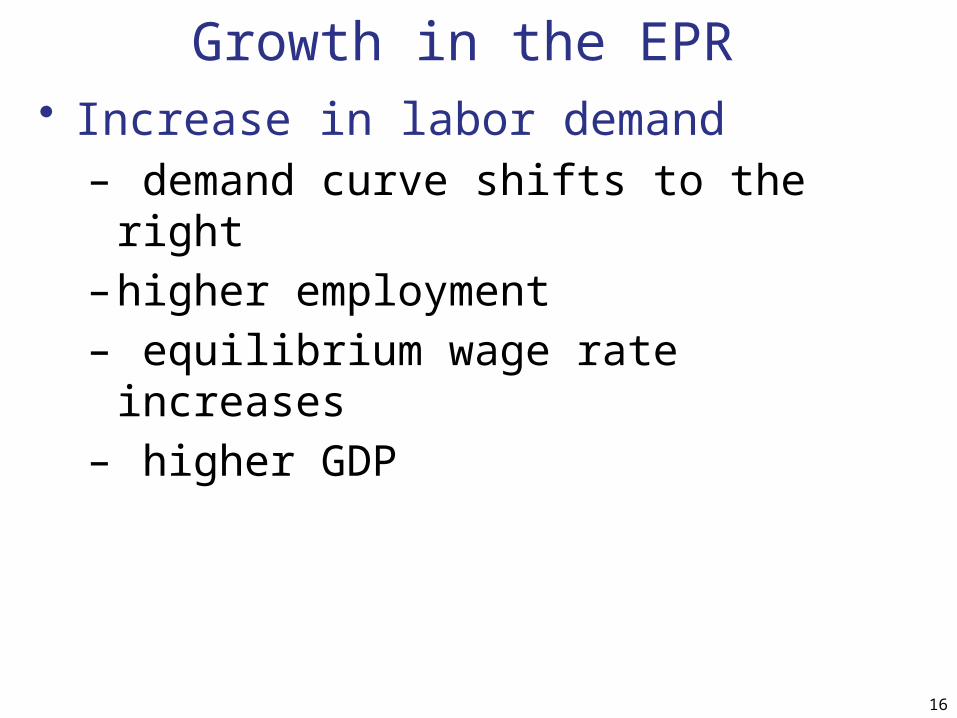
Growth in the EPR • Increase in labor demand
– demand curve shifts to the right – higher employment– equilibrium wage rate increases– higher GDP
16
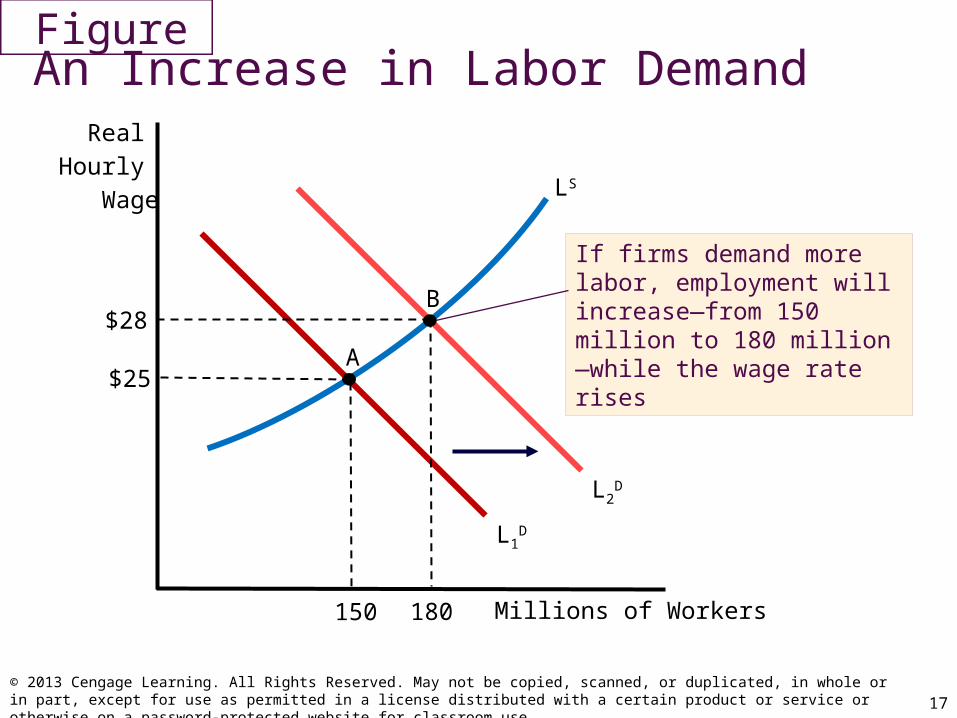
An Increase in Labor Demand
17© 2013 Cengage Learning. All Rights Reserved. May not be copied, scanned, or duplicated, in whole or in part, except for use as permitted in a license distributed with a certain product or service or otherwise on a password-protected website for classroom use.
Millions of Workers
Real
Hourly
Wage
L1D
$28
150
LS
A
180
$25
If firms demand more labor, employment will increase—from 150 million to 180 million—while the wage rate rises
L2D
B
Can Government Policy increase Employment?• Implement policies to increase the growth of
labor supply
• Implement policies to increase the growth of labor demand
18
Policies to Increase the Growth of Labor Supply
• Decrease income tax rates (marginal tax rate)– Increase take home pay of workers.– Do people want to work more and do more
people want to work if take home pay increases? – This is a Big Question!
– Marginal tax rate, tax paid on each extra dollar earned.
– if effective, this policy would shift the labor supply curve to the right => total output (GDP) increases
19

Policies to Increase the Growth of Labor Supply
• Cut government benefit programs– Do benefit programs such as
unemployment insurance and welfare payment create disincentives to work?
– European countries have cut benefit programs
– Clinton administration reform of welfare programs
20
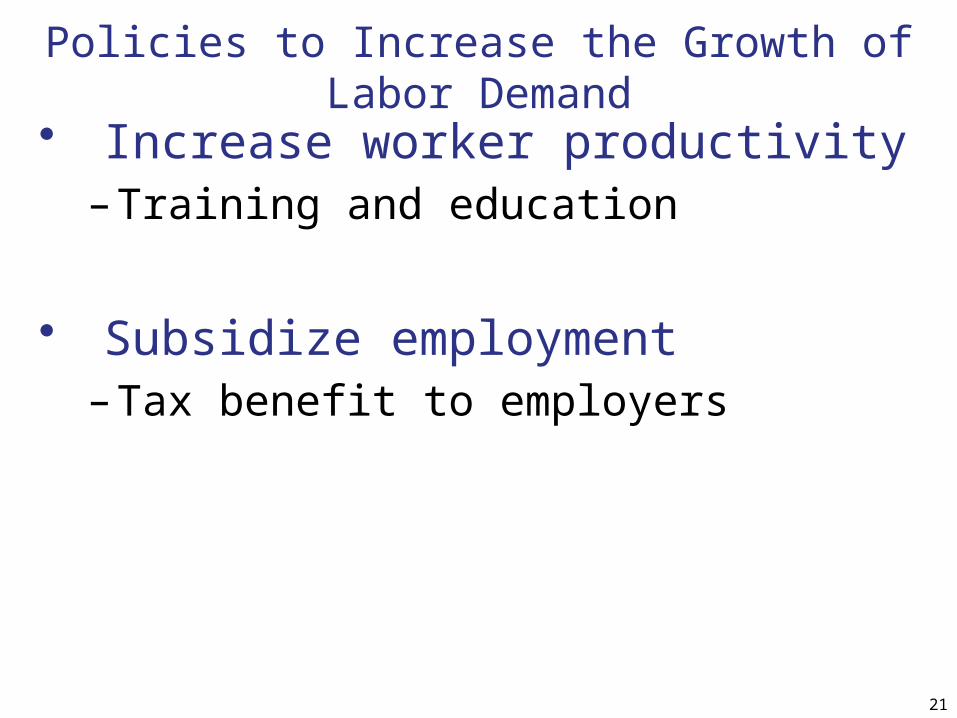
Policies to Increase the Growth of Labor Demand
• Increase worker productivity– Training and education
• Subsidize employment– Tax benefit to employers
21
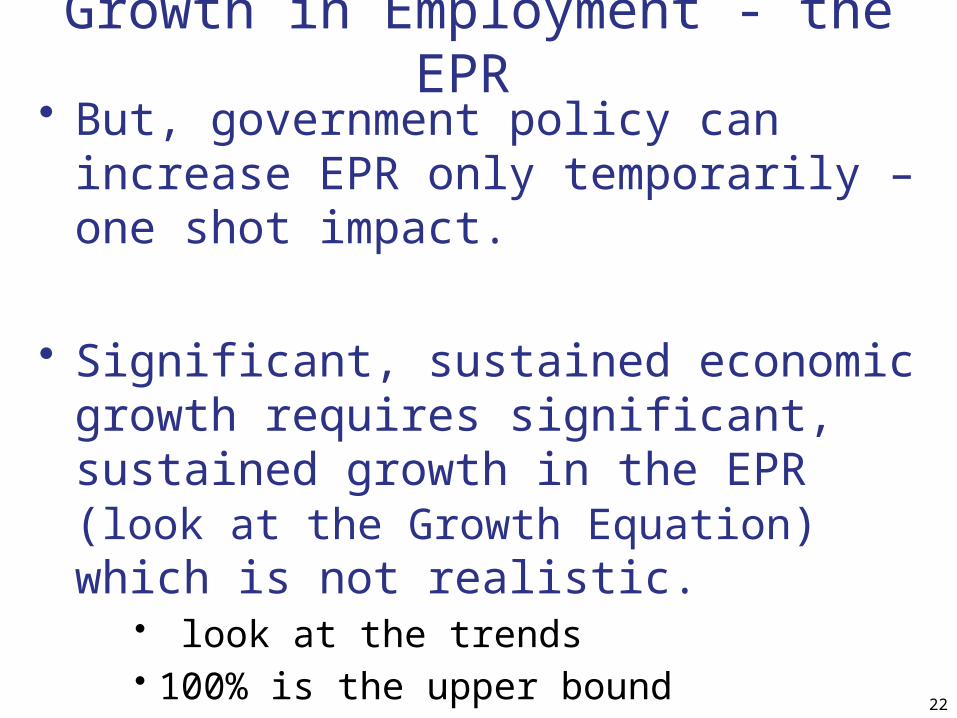
Growth in Employment - the EPR • But, government policy can increase EPR
only temporarily – one shot impact.
• Significant, sustained economic growth requires significant, sustained growth in the EPR (look at the Growth Equation) which is not realistic.
• look at the trends• 100% is the upper bound
22
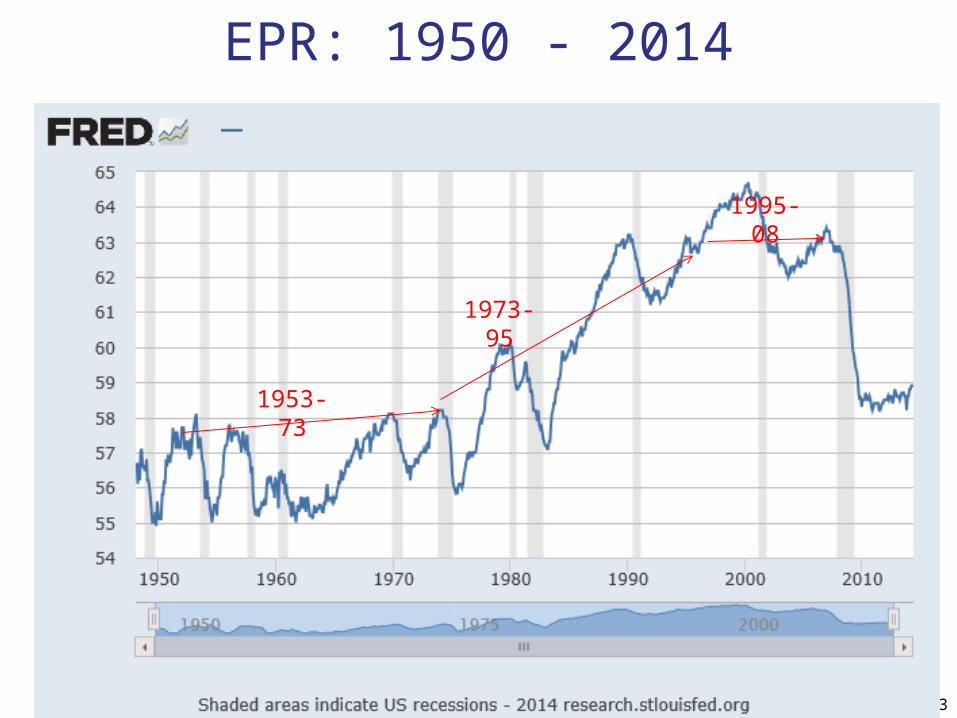
EPR: 1950 - 2014
23
1953-73
1973-95
1995-08
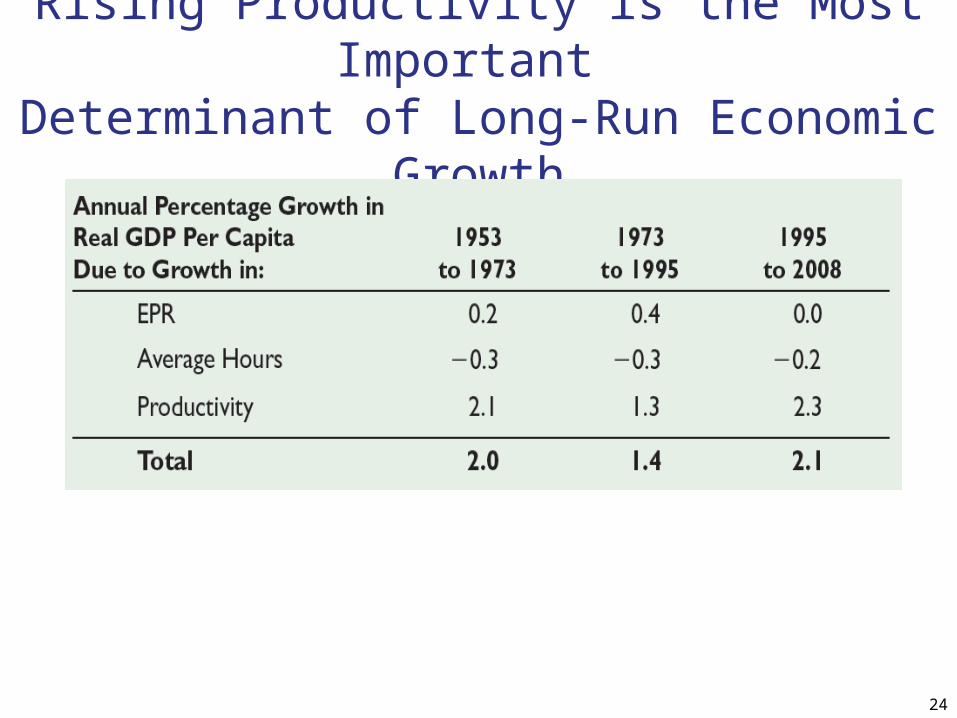
Rising Productivity is the Most Important Determinant of Long-Run Economic Growth
24
How to Increase productivity?• An increase the capital stock, increases
capital per worker and increases productivity
• Capital per worker – Total capital stock divided by total
employment
25
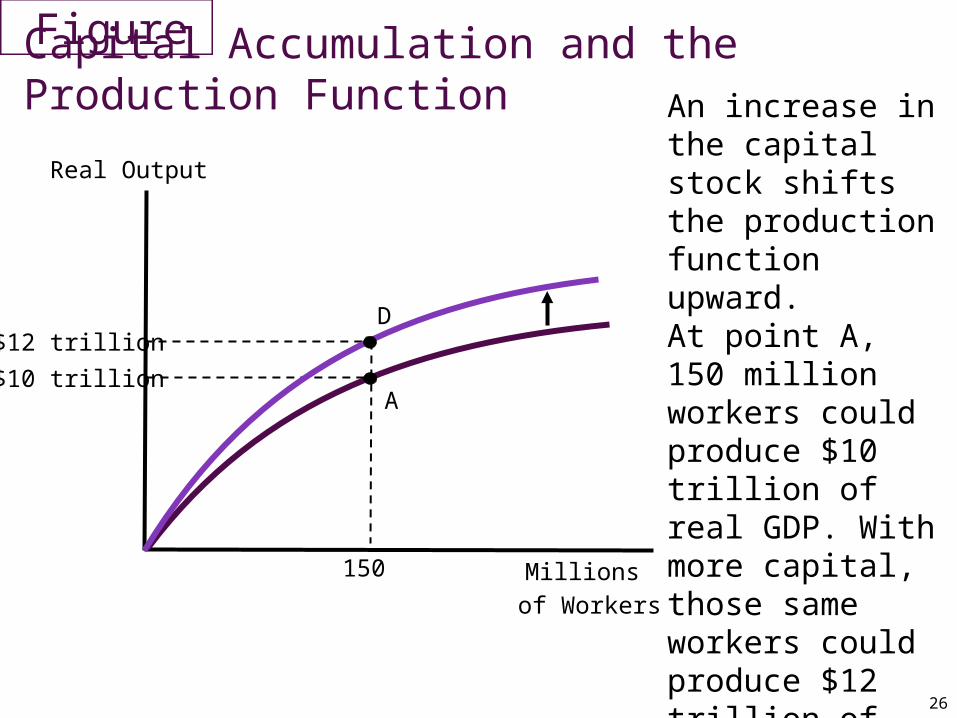
An increase in the capital stock shifts the production function upward. At point A, 150 million workers could produce $10 trillion of real GDP. With more capital, those same workers could produce $12 trillion of real GDP. Workers are more productive.
Capital Accumulation and the Production Function
26
Millions
of Workers
Real Output
150
$10 trillionA
$12 trillionD
What Determines How Fast the Capital Stock Rises? • Planned investment spending (IP)
– recall this is a flow variable. – the capital stock is a stock variable
• A higher rate of investment spending causes:– faster growth in capital per worker which
increases the growth in productivity– faster growth in GDP - the standard of
living
27
Capital Stock and Investment• Suppose capital stock is $1000 billion at
the beginning of 2010• Investment spending in 2010 is $100
billion• Depreciation is $20 billion.• What is the capital sock at the end of
2010?• Capital stock = $1000 + $100 – $20
= $1080
28

Big Question - How to Increase Investment?
• Government could do three things– increase incentives for businesses to
invest – increase incentives for households to save– shrink the government budget deficit
• Think about the loanable funds model presented in Chapter 8
29
How to Increase Investment
1. increase incentive for business to invest– Lower Corporate profits tax
• A tax on the profits earned by corporations
– Give Investment tax credit• A reduction in taxes for firms that invest in new
capital
30
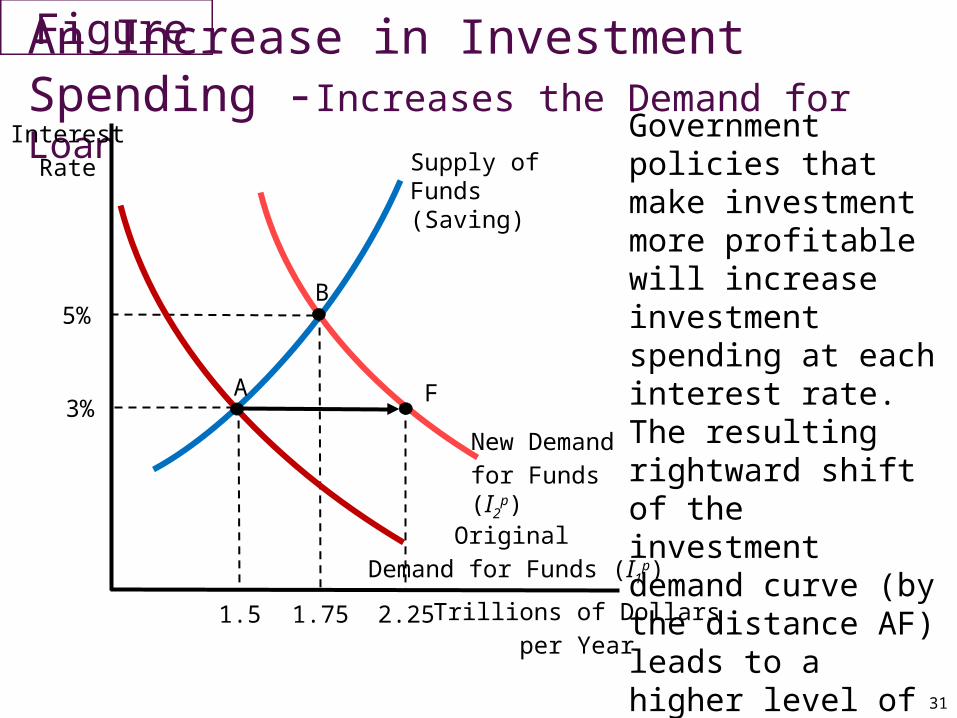
Government policies that make investment more profitable will increase investment spending at each interest rate. The resulting rightward shift of the investment demand curve (by the distance AF) leads to a higher level of investment spending, at point B.
An Increase in Investment Spending -Increases the Demand for Loanable Funds
31
Trillions of Dollars
per Year
Interest
Rate
5%
1.5
Supply of Funds (Saving)
1.75
3%
Original
Demand for Funds (I1p)
New Demand
for Funds (I2p)
FA
B
2.25
How to Increase Investment
2. Increase incentive for households to save• Decrease capital gains tax rate
- Capital gain is the increase in value of an asset.
• Switch to a consumption tax
32
How to Increase Investment• Lower Capital Gains Tax
– Tax on profits earned when a financial asset is sold at a gain
• Consumption tax – rather than a tax on household income,
tax the part of income that households spend. Result: • more household saving• more funds available for investment• faster growth in the capital stock• faster growth in living standards
33
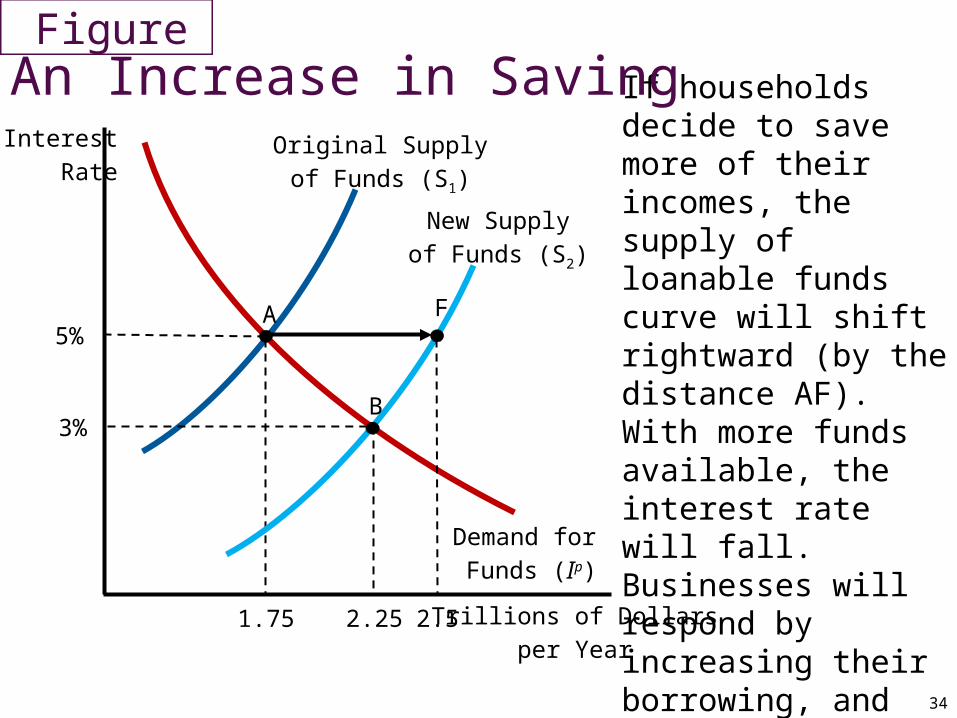
If households decide to save more of their incomes, the supply of loanable funds curve will shift rightward (by the distance AF). With more funds available, the interest rate will fall. Businesses will respond by increasing their borrowing, and investment will increase from $1.75 trillion to $2.25 trillion.
An Increase in Saving
34
Trillions of Dollars
per Year
Interest
Rate
5%
Original Supply
of Funds (S1)
1.75
3%
Demand for
Funds (Ip)
A
2.25
New Supply
of Funds (S2)
2.5
F
B
How to Increase Investment
3. Decrease in the budget deficit– this will reduce the demand for loanable
funds– reduce interest rates, – increase investment spending and the
growth in the capital stock
• But, the impact of deficit reduction on economic growth depends on which government programs are cut
35
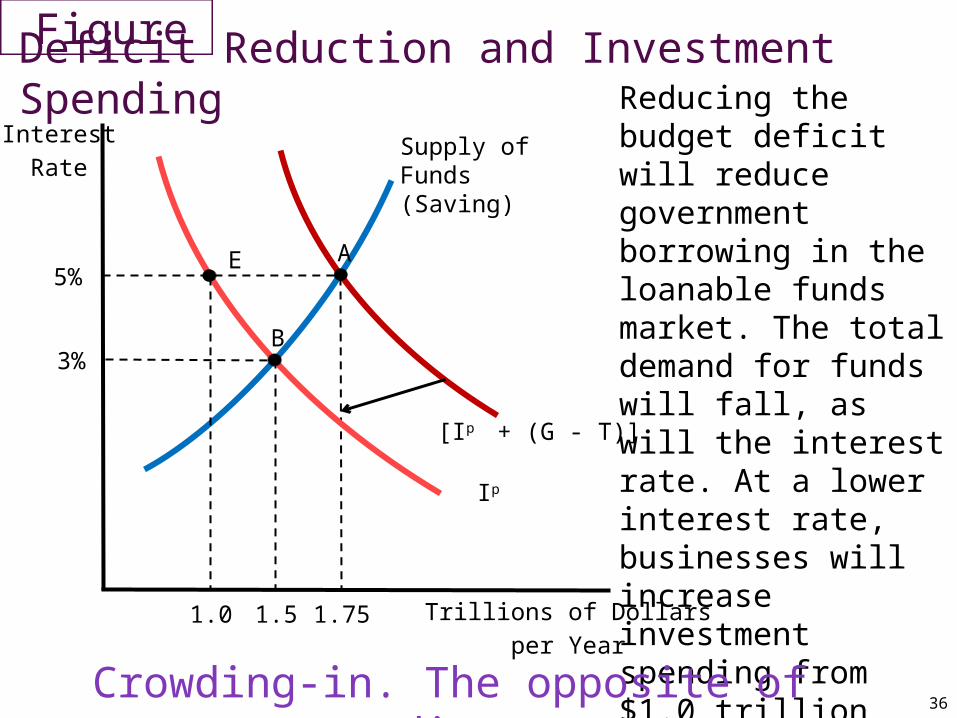
Reducing the budget deficit will reduce government borrowing in the loanable funds market. The total demand for funds will fall, as will the interest rate. At a lower interest rate, businesses will increase investment spending from $1.0 trillion (point E) to $1.5 trillion (point B).
Deficit Reduction and Investment Spending
36
Trillions of Dollars
per Year
Interest
Rate
5%
1.5
Supply of Funds (Saving)
1.75
3%
Ip
[Ip + (G - T)]
E A
B
1.0
Crowding-in. The opposite of crowding-out
Human Capital and Economic Growth• An increase in human capital
– Works like an increase in physical capital to increase output
– Causes production function to shift upward
– Can raise productivity and living standards• Increase of investment in human capital
– investment in education– benefits take a long time to be realized.
37
Limits to Growth From New Capital
– Diminishing returns
– Depreciation
– Thus, increases in the capital stock alone cannot create permanent high rates of economic growth
38
Technological Change• Technological change
– Invention and use of new inputs, new outputs, or new production methods
– Extra boost to production from the new, productivity-enhancing technology.
• The faster the rate of technological change– The greater the growth rate of productivity– The faster the rise in living standards
39
The Costs of Economic Growth• Nothing is Free! Unavoidable tradeoffs –
• Promoting economic growth requires some groups, or the nation as a whole, to give up something else that is valued
• Properly targeted tax cuts (such as capital gains or corporate profit)can increase the rate of economic growth but force us to either redistribute the tax burden or cut government programs
40
The Costs of Economic Growth• Greater investment in physical capital,
human capital, and R&D – faster economic growth and higher living
standards in the future– but, fewer consumer goods to enjoy in the
present
• Increased saving today- means less consumption today
- higher consumption in the future.
41
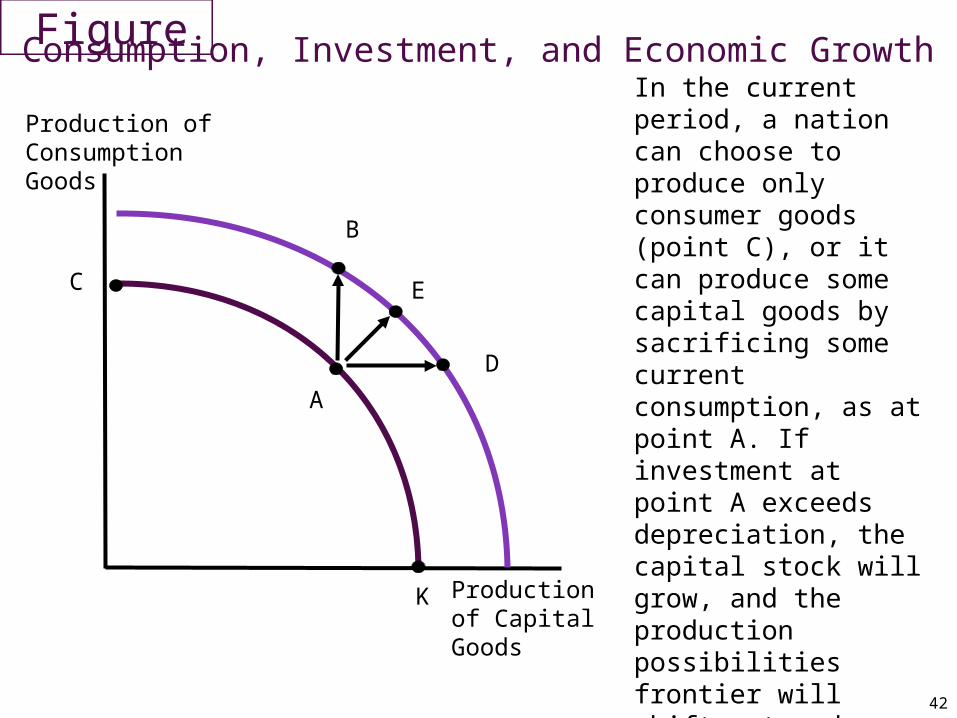
In the current period, a nation can choose to produce only consumer goods (point C), or it can produce some capital goods by sacrificing some current consumption, as at point A. If investment at point A exceeds depreciation, the capital stock will grow, and the production possibilities frontier will shift outward. After it does, the nation can produce more consumption goods (point B), more capital goods (point D), or more of both (point E).
Consumption, Investment, and Economic Growth
42
Production of Capital Goods
Production of Consumption Goods
A
C
K
D
E
B