Embed Size (px)
Citation preview

CHAPTER THREE
Has Rising Inequality Reduced Middle-Class Income Growth?
Lane Kenworthy
A "top-heavy" rise in income inequality tends to reduce middle-class households' relative incomes, leading them to fall even farther behind those at the top of the income distribution. But what about their absolute incomes? Household income growth is not a zero-sum game because the pie tends to get larger over time. Disproportionately large gains at the top, however, are likely to come at least partly at the expense of those in the middle, resulting in slower growth of income than would have been the case in the absence of rising inequality (Billitteri 2009; Kumhof and Ranciere 2010; Reich 2010; Kenworthy 2011a; Thompson and Leight 2011; Stiglitz 2012).
The U.S. experience fits this hypothesis. Income inequality has increased sharply over the past generation, and income growth for American households in the middle of the distribution has been slow (Mishel, Bernstein, and Shierholz 2009; Kenworthy 2010b). Does this hold if we compare across countries? Has middle-class income growth been slower in countries with larger increases in top-heavy income inequality?
Figure 3.1 shows trends in top-heavy income inequality from the late 1970s to the mid-2000s in six affluent countries. Inequality is measured as the top 1 percent's share of pre-tax income. (Post-tax data on the top 1 percent's share are not available for most countries.) These data are from tax records (Atkinson, Piketty, and Saez 2011; Alvaredo et al. 2012). In the first two countries, the United States and the United Kingdom, top-heavy income inequality soared. In the next two, Canada and Finland, inequality increased moderately. In the last two countries, Germany and the Netherlands, we see little or no rise in inequality.
101

102 Lane Kenworthy
1980 1990 2000 1980 1990 2000
18 United States United Kingdom
~
?ft. - 1-.., 4
8 Canada Finland 0
u .s 18 >< rl b
~ ~ - 1-
.... c.. 0 ..,
.... "' ..a "' ·"' ?ft. 4 ,....
Germany Netherlands c.. ~ 18
~
4 I I
1980 . 1990 2000 1980 1990 2000
Year
Figure 3.1. Trends in top-heavy income inequality, six countries, late 1970s to rnid-2000s
souRcE: Author's compilation using data from Alvaredo et al. (2012).
18
4
18
4
18
4
NoTE: Top two countries: large rise in top-heavy income inequality. Middle two countries: moderate rise in inequality. Bottom two countries: no rise in inequality.
Given these trends in inequality, we might expect to find middle-class incomes growing slowest in the United States and the United Kingdom, at an intermediate pace in Canada and Finland, and fastest in Germany and the Netherlands. But this expectation turns out to be wrong. Figure 3.2 shows trends in inflation-adjusted post-tax and post-transfer household income at the 25th, 50th (median), and 75th percentiles of the income dis-
Has Inequality Reduced Middle-Class Income? 103
1980 1990 2000 . 1980 1990 2000 I I I I
2.5 United States United Kingdom
., 2.0 s 0 u 1.5 .5
0 .,., P.. 1.0 .... "' .,
--------~ -:;-. 0.5 ]
2.5 :s Canada Finland
8 "' 2.0 s 0 u 1.5 .5
-o B 1.0 "' ::I :.0
------- ~ ~ --------"' 0.5 6 0 ·;::: 2.5 "'
Germany Netherlands
""' .5 '+< 2.0 0
.g 1.5 "' ~ 1.0
-
~ - -------- ~ ------0.5 1980 1990 2000 1980 1990 2000
Year
Figure 3.2. Trends in real incomes of middle-income (25th, 50th, and 75th percentiles) households, six countries, late 1970s to mid-2000s
f-.
1-
1-
1-
1-
1-
2.5
2.0
1.5
1.0
0.5
2.5
2.0
1.5
1.0
0.5
2.5
2.0
1.5
1.0
0.5
souRcE: Author's calculations from the LIS Database, Waves I.to VI, and the OECD. NOTE: Lower lines: 25th percentile; middle lines: 50th percentile; top lines: 75th percentile. Post-tax and post-transfer income adjusted for household size.
tribution. In each of the three groups of countries, we observe stagnant middle-class incomes in one country and rapidly growing incomes in the other. Trends in income inequality are of no use in predicting trends in the absolute incomes of middle-class households .in these six countries. To understand why, we need a more systematic analysis.
104 Lane Kenworthy
ANALYTICAL STRATEGY
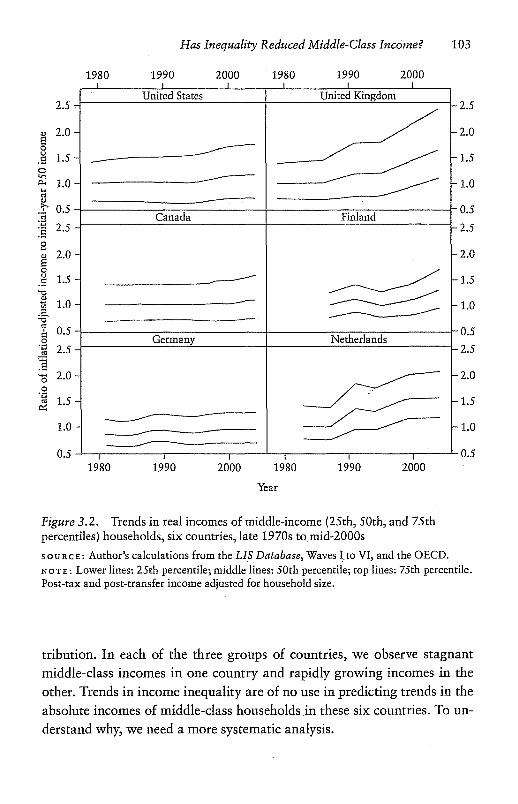
Research on income inequality's consequences has examined countries, regions or states, cities, and individuals. I focus on countries for two reasons. First, countries are the main unit of interest from a policy perspective. Most of the relevant levers for influencing income inequality are at the level of the national government rather than the region or city. Second, the country level is where we now have the best data on income inequality and middle-class incomes. I examine 15 affluent, non-tiny, democratic countries for which data on top-heavy income inequality and middle-class incomes are available: Australia, Canada, Denmark, Finland, France, Germany, Ireland, Italy, the Netherlands, Norway, Spain, Sweden, Switzerland, the United Kingdom, and the United States.
Much existing analysis of the effects of income inequality is comparative but static; it is based on associations across countries or regions at a single point in time (e.g., Wilkinson and Pickett 2009). Cross-sectional correlations can be informative, but they are potentially problematic because countries differ in a variety of ways that we cannot measure very well and that might be the true cause of differences in outcomes such as income growth.
In studying the effects of income inequality in rich countries, there is a better approach. For many countries, we have data for both income inequality and middle-class income growth over a period of nearly three decades. During this period, the degree to which inequality changed varied markedly across these countries. For analytical purposes, this "difference in differences" is useful. If countries with larger increases in inequality experienced more change in the outcome, we can have greater confidence that a causal relationship exists (Allison 1990; Halaby 2004; Angrist and Pischke 2008; Firebaugh 2008; Kenworthy 2011b). Perhaps most important, examining the relationship between changes (first differences, or change scores) in the cause and changes in the outcome takes country "fixed effects"potentially influential time-invariant factors such as culture-out of play.
Analyzing changes also is more informative for policy analysis. From a policy maker's perspective, knowing that income inequality is bad for middle-class income growth leads to an inference that reducing income inequality (or halting or slowing its rise) would produce a better outcome. But if we have not actually examined what happens when inequality changes, that inference is on less firm footing.
Has Inequality Reduced Middle-Class Income? 105
With this type of analysis, the longer the time series, the better. I examine only the period since the 1970s due to data limitations and because many things changed in the rich countries in the 1970s, from productivity slowdown to globalization to massive cultural shifts. These changes were so pronounced that it makes sense to consider the economic and political context since the 1970s as fundamentally different from the period from the 1940s through the 1960s. Rather than maximize the number of data points by including those earlier decades, I take the more cautious approach of confining the analyses to the post-1970s period.
A differences-in-differences analysis presumes that the effect of the cause on the outcome will show up within the measured time period. In some instances we have reason to expect an immediate impact, but that is unlikely to be the case for income inequality. For that reason, the following analysis focuses on change over two and a half decades rather than during a single year or over a five-year period.
THE IMPACT OF RISING TOP INCOME SHARES
ON GROWTH OF MIDDLE-CLASS INCOMES
Figure 3.3 shows changes in median (50th percentile) post-transfer-posttax household income by changes in the top 1 percent's share of pre-tax income. The actual period covered differs across the countries, so changes in median income and inequality are calculated on an annualized basis. We do not see the expected negative relationship. Moving from the six countries included in Figures 3.1 and 3.2 to a larger set of countries does not alter the conclusion.
In calculating the regression line, Ireland and Norway are omitted because these two countries are statistical outliers. Both had very rapid economic growth during these years, which contributed to a substantial rise in median income. In Norway the source was oil, and in Ireland it was massive foreign investment. Given the exceptional degree of economic growth in these two countries, the pattern across the group of countries as a whole is likely to be more accurately revealed with these two nations excluded.
Why do we not see a negative association in Figure 3.3 between change in top-heavy income inequality and change in middle-class absolute income? One possibility is that the share of income going to those at the top of the distribution actually has no impact on the absolute amount that goes

106 Lane Kenworthy
1,500
0)
s 0 u .s ;.<
£ "' 0 0..
-o c:: "' ... ~ "' NL c:: "' J:j .!.. "' 0 0..
0
"' 0..
.s DK 5h c:: "' ..c
FR u DE
CH
ES SE
IT
FI
CA
AU
IE*
NO*
UK
us
0 L-,-----------------------------------~ -0.05 0.35
Annualized change in top 1 %'s pre-tax income share
Figure 3.3. Change in median household income by change in top-heavy income inequality, 15 countries, late 1970s to mid-2000s
souRcE: Author's calculations from the LIS Database, Waves I to VI (household income), the OECD (inflation, PPPs), and Alvaredo et al. (2012) (income inequality). NoTE: Actual years vary somewhat depending on the country, so change is calculated per year. The regression line is calculated with Ireland and Norway excluded. Change in median household income: average change per year in post-tax and post-transfer 50th percentile household income, adjusted for household size and for inflation and converted into U.S. dollars using purchasing power parities. Change in top-heavy income inequality: average change per year in the top 1 percent's income share. For country abbreviations, see Appendix Table A1 in the Introduction to this volume.
to those in the middle. But as noted earlier, that seems unlikely. The other possibility is that there is a negative effect, but it is overshadowed by other factors that influence middle-class incomes.
One such factor could be economic growth. The pace of economic growth has varied across these countries. Even if a rise in top-heavy inequality means that the middle class gets a smaller share of the income gains
Has Inequality Reduced Middle-Class Income? 107
produced by economic growth, this effect might be swamped by variation across the countries in the pace of economic growth. A good measure of economic growth is change in gross domestic product (GDP) per capita. I use data from the Organisation for Economic Co-operation and Development (OECD) database to calculate per-year change in GDP per capita for each country over the same time period used in Figure 3.3. The first panel in Figure 3.4 shows change in median household income by economic growth. As expected, we see a strong positive association.
Is it a simple mathematical truism that median household income adjusted for change in GDP per capita will rise more slowly in countries in which top-heavy income inequality has grown more rapidly? The answer is no. A rising income share for the richest need not automatically come at the expense of the middle class. It might instead come at the expense of the near rich-say, those in the 90th to 99th percentiles-or at the expense of the poor.
What about the possibility that rising inequality boosts economic growth? If it does, we would not want to control for growth (it is endogenous). Is income inequality good for economic growth? This is a longstanding hypothesis, much debated since the publication of Arthur Okun's (1975) "equality-efficiency tradeoff" book in the mid-1970s. Recent empirical studies have yielded mixed findings (Kenworthy 2004; Voitchovsky 2005; Andrews, Jencks, and Leigh 2011). We thus have no clear answer. Across the 13 countries included in the first chart in Figure 3.4, we see a modestly strong positive association between change in the top 1 percent's share of income and change in GDP per capita (not shown). Whether that indicates a causal relationship is open to debate.
A second potential contributor to changes in median household income is government transfers. In an earlier study (Kenworthy 2010a), I examined the relationship between changes in the top 1 percent's income share and changes in the absolute incomes of households in the bottom 10 percent. It turns out that there is no association across the rich countries. The main determinant of whether and how much absolute incomes in the bottom 10 percent increased over the past generation is net government transferscash and near-cash government benefits received minus taxes paid. In some countries net transfers to households in the bottom 10 percent have increased over time, while in others they have tended to remain stagnant. This variation across the countries in changes in net government transfers is not

108 La11e Ke~tworthy
1bso 0 u
.5 UK X
£ ES SE 0 c. FI
-c c " ... il DK c g .!. 1l c.
0 .,., "" .5 AU " CH OJ) c " ...<:: 0 u
290 Annualized change in GDP per capita
NL
us
540
NL UK
SE
FI
us
CA DE
AU CH
70 420 Annualized change in net government transfers
Figure 3.4. Change in median household income by economic growth and by change in net government transfers, 13 countries, late 1970s to mid-2000s
souRcE: Author's calculations from the LIS Database, Waves I to VI (income, government transfers, taxes), and the OECD (economic growth, inflation, PPPs). NoTE: Actual years vary somewhat depending on the country, so change is calculated per year. Change in median household income: average change per year in post-tax and posttransfer 50th percentile household income, adjusted for household size and for inflation and converted into U.S. dollars using purchasing power parities. Change in GDP per capita: average change per year in per person gross domestic product. Change in net government transfers: average change per year in government transfers received minus taxes paid among households in the lower-middle-income quartile (25th to 50th percentiles). France, Italy, and Spain are missing in the second chart due to lack of net government transfer data.
correlated with changes in top-heavy income inequality. Political choices, rather than constraints or opportunities stemming from the share of income captured by those at the top, have determined the degree to which governments have increased net transfers to the poor.
This could be true in the middle of the income distribution as well. Middle-class households tend to be less reliant than the poor on government transfers, but transfers do account for part of their income. Some in this group receive public pensions and others get unemployment, sickness, or disability benefits. In another recent study (Kenworthy 2011c), I used LIS data to examine the sources of the increase in absolute income over time in households between the 25th and 50th percentiles of the income distribution. It turns out that changes in net government transfers have been nearly as important as changes in earnings in accounting for differences

Has Inequality Reduced Middle-Class Income? 109
across countries in overall income growth for these "lower-middle-income" households.
Indeed, an influential hypothesis predicts that a rise in income inequality in a country will trigger a shift in government policy to increase redistribution, via taxes and transfers, to those in the middle (Meltzer and Richard 1981). This view, often termed the "median-voter theorem," suggests that election outcomes are determined by the median-income voter. When income inequality increases, the median voter will benefit more from redistribution than she or he previously did. Recognizing this, political parties will increase redistribution in order to enhance their electoral fortunes. If this is correct, countries in which the pre-tax. income share of the top 1 percent rises will redistribute a growing portion of that group's income to the middle class. This would partially or fully offset the rise in pre-tax income inequality. It could thereby help to account for the lack of association in Figure 3.3 between change in the top 1 percent's pre-tax income share and change in the absolute income of the median household. Then again, earlier studies have found little support for the over-time pattern predicted by the median-voter theorem (Kenworthy and Pontusson.2005; Kenworthy and McCall2008).
The measure used here is annualized change in average net government transfers received by households between the 25th and 50th percentilesthe lower-middle-quartile group of the income distribution. Again, net government transfers refer to cash and near-cash transfers received minus taxes paid. Unfortunately, this calculation is possible for only ten countries. (For the other countries, earnings and income are reported net of taxes, so it is not possible to cleanly separate out transfers and tax payments.)
The second panel in Figure 3.4 shows a positive association between change in net transfers received by lower-middle-income households and change in median household income. This might help to account for why Finland and the United Kingdom are fairly high on the vertical axis in Figure 3.3 despite relatively sharp increases in their top 1 percent's income share. Net government transfers to lower-middle-income households increased more in these two countries than in most others, helping to offset the declining share of pre-tax income going to those in the middle.
Does controlling for economic growth and change in net government transfers reveal a negative impact of rising top-heavy income inequality on median household income growth? The answer is yes. Figure 3.5 replicates

" a 0 u .s )<
s ~
"' 0 0.
-o c '" ... ~ "' c '" ! "' 0 0.
0 .,., !'!..
.s 6l:. c '" ..<:: u
-o E "' ::l
:.0 ~
High
Low
NL DK
DE
-0.05
SE
FI
AU
UK
Annualized change in top 1 %'s pre-tax income share
us
0.35
Figure 3.5. Economic growth and net government transfer adjusted change in median household·income by change in top-heavy income inequality, ten countries, late 1970s to rnid-2000s
souRcE: Author's calculations from the LIS Database, Waves I to VI (income, government transfers, taxes), the OECD (economic growth, inflation, PPPs), and Alvaredo et al. (2012) (income inequality). NOTE: Actual years vary somewhat depending on the country, so change is calculated per year. Adjusted change in median household income: average change per year in post-tax and post-transfer 50th percentile household income, adjusted for household size and for inflation, converted into U.S. dollars using purchasing power parities, and adjusted for the country's change in GDP per capita and change in net government transfers to households in the lower-middle-income quartile. Change in income inequality: average change per year in the top 1 percent's income share. France, Italy, and Spain are missing due to lack of net government transfer data.

Has Inequality Reduced Middle-Class Income? 111
Figure 3.3, but the vertical axis now is change in median household income adjusted for change in GDP per capita and change in net government transfers. (The values on the vertical axis are the residuals from a regression of change in median household income on change in per capita GDP and change in net government transfers.) We now see the expected negative association.
For the ten countries shown in Figure 3.5, a regression of change in median household income on change in the top 1 percent's income share yields a coefficient very close to zero. If we add controls for change in GDP per capita and change in net government transfers, the coefficient for change in the top 1 percent's income share is -530. This suggests that an increase of 1 percentage point in the top 1 percent's share of pre-tax income reduced growth of income for the median household by about USD530. In the most extreme case-the United States-the top 1 percent's pre-tax share increased by 8 percentage points between 1979 and 2004. According to this estimate, that may have reduced median household income growth by a little more than USD4,000. The actual rise in the United States during those years was USD8,000, so the estimated impact of rising income inequality is not trivial.
At the same time, the data suggest that the income-reducing impact of a rise in top-heavy inequality has been overshadowed by the income-boosting impact of economic growth and of increases in net government transfers. That is why we see no (bivariate) association in Figures 3.1, 3.2, and 3.3. And the wide dispersion of the countries around the line in Figure 3.5 tells us that even after adjusting for these other influences, change in top-heavy inequality is not a very good predictor of growth in middle-class incomes.
CONCLUSION
The experience of the world's rich democracies over the past several decades suggests that rising top-heavy income inequality has tended to reduce middle-class income growth. But it also suggests that inequality has not been the key determinant of that growth. Should this lessen our concern about rising inequality?
The sources of worry are threefold. One has to do with fairness, justice, and the influence of luck (Rawls 1971; Jencks et al. 1972). Much of what determines people's earnings and income-intelligence, creativity, physical and social skills, motivation, persistence, confidence, connections,

112 Lane Kenworthy
inherited wealth, discrimination-are products ofgenetics, parents' financial assets and traits, and the quality of one's childhood neighborhood and schools. With few exceptions, these things are not chosen; they are a matter of luck. A non-trivial portion of earnings inequality and income inequality can therefore be said to be undeserved.
Second, an increase in income inequality may cause an increase in inequality of other social, economic, or political outcomes, such as educational attainment, health, and political influence (Neckerman 2004; Bartels 2008; Gilens 2012). The gap in life expectancy or infant mortality between those with high and low incomes may widen. The same is true for college graduation. Perhaps most worrisome, inequality of influence on government policy may rise.
Third, a rise in income inequality may contribute to a worsening of overall or average outcomes (Wilkinson and Pickett 2009). The average level of life expectancy or college completion may decline or rise less rapidly than it otherwise would have. Crime may accelerate. Trust and community may weaken. The middle class may fare worse economically. This brings us back to middle-class income growth. Looking across countries, inequality's effect so far has been overshadowed by the impact of economic growth and of changes in net government transfers. Yet, that will not necessarily hold going forward. Moreover, income is only a partial indicator of living standards. There· are other ways in which rising top-heavy income inequality might adversely affect the well-being of middle-class households. Some analysts, most notably Robert Frank (2007), have suggested that inequality hurts the middle class mainly by encouraging excessive spending rather than by reducing income growth.
REFERENCES
Allison, Paul. D. 1990. "Change Scores as Dependent Variables in Regression Analysis." In Sociological Methodology, edited by Clifford C. Clogg, 93-114. Oxford: Blackwell.
Alvaredo, Facundo, Anthony B. Atkinson, Thomas Piketty, and Emmanuel Saez. 2012. The World Top Incomes Database. http://g-mond.parisschoolofeco nomics.eultopincomes.
Andrews, Dan, Christopher Jencks, and Andrew Leigh. 2011. "Do Rising Top Incomes Lift All Boats?" B.E. Journal of Economic Analysis and Policy 11(1): 6.
Has Inequality Reduced Middle-Class Income? 113
Angrist, Joshua D., and Jorn-Steffen Pischke. 2008. Mostly Harmless Econometrics. Princeton, NJ: Princeton University Press.
Atkinson, Anthony B., Thomas Piketty, and Emmanuel Saez. 2011. "Top Incomes in the Long Run of History." Journal of Economic Literature 49(1): 3-71.
Bartels, Larry M. 2008. Unequal Democracy. Princeton, NJ/New York: Princeton University Press/Russell Sage Foundation.
Billitteri, Thomas J. 2009. "Middle-Class Squeeze." CQ Researcher 19(9): 201-24.
Firebaugh, Glenn. 2008. Seven Rules for Social Research. Princeton, NJ: Princeton University Press.
Frank, Robert H. 2007. Falling Behind: How Rising Inequality Hurts the Middle Class. Berkeley: University of California Press.
Gilens, Martin. 2012. Affluence and Influence. Princeton, NJ: Princeton University Press.
Halaby, Charles N. 2004. "Panel Models in Sociological Research: Theory into Practice." Annual Review of Sociology 30: 507-44.
Jencks, Christopher, Marshall Smith, Henry Acland, Mary Jo Bane, David Cohen, Herbert Gintis, Barbara Heyns, and Stephan Michelson. 1972. Inequality: A Reassessment of the Effect of Family and Schooling in America. New York: Basic Books.
Kenworthy, Lane. 2004. Egalitarian Capitalism. New York: Russell Sage Foundation.
---. 2010a. "Rising Inequality, Public Policy, and America's Poor." Challenge 53(6): 93-109.
--. 2010b. "The Best Inequality Graph, Updated." http://lanekenworthy .net/2010/07/20/the-best-inequality-graph-updated/.
--. 2011a. "Is Winner-Take-All Bad or Good for the Middle Class?" http:// lanekenworthy.net/2011/01/11/is-winner-take-all-bad-or-good-for-themiddle-class-evidence-from-baseball/.
---. 2011b. "Step Away from the Pool." Newsletter of the American Political Science Association Organized Section for Qualitath:-e and Multi-Method Research, Fall.
---. 2011c. "When Does Economic Growth Benefit People on Low to Middle Incomes-And Why?" London: Commission on Living Standards, Resolution Foundation, November.
Kenworthy, Lane, and Leslie McCall. 2008. "Inequality, Public Opinion, and Redistribution." Socio-Economic Review 6(1): 35-68.
Kenworthy, Lane, and Jonas Pontusson. 2005. "Rising Inequality and the Politics of Redistribution in Affluent Countries." Perspectives on Politics 3(3): 449-71.
Kumhof, Michael, and Romain Ranciere. 2010. "Leveraging Inequality." Finance and Development 7(4): 28-31.
Luxembourg Income Study (LIS) Database, http://www.lisdatacenter.org (multiple countries; microdata last accessed May 2012). Luxembourg: LIS.
114 Lane Kenworthy
Meltzer, Allan H., and Scott F. Richard. 1981. "A Rational Theory of the Size of Government." Journal of Political Economy 89(5): 914-27.
Mishel, Lawrence, Jared Bernstein, and Heidi Shierholz. 2009. The State of Working America, 2008/2009. An Economic Policy Institute Book. Ithaca, NY: ILR Press.
Neckerman, Kathryn M., ed. 2004. Social Inequality. New York: Russell Sage Foundation.
Okun, Arthur. 1975. Equality and Efficiency: The Big Tradeoff. Washington, DC: Brookings Institution.
Organisation for Economic Co-operation and Development (OECD) Database. http://stats.oecd.org (multiple countries; 2012). Paris: OECD.
Rawls, John. 1971. A Theory of Justice. Cambridge, MA: Harvard University Press.
Reich, Robert B. 2010. Aftershock. New York: Knopf. Stiglitz, Joseph. 2012. The Price of Inequality. New York: Norton. Thompson, Jeffrey, and Elias Leight. 2011. "Searching for the Supposed Benefits
of Higher Inequality: Impacts of Rising Top Shares on the Standard of Living of Low and Middle-Income Families." Working paper 258. Amherst, MA: Political Economy Research Institute, University of Massachusetts-Amherst.
Voitchovsky, Sarah. 2005. "Does the Profile of Income Inequality Matter for Economic Growth?" Journal of Economic Growth 10(3): 273-96.
Wilkinson, Richard, and Kate Pickett. 2009. The Spirit Level: Why Greater Equality Makes Societies Stronger. New York: Bloomsbury.

Economic Disparities and the Middle Class in Affluent Countries
Edited by Janet C. Gornick and Markus ]antti
STANFORD UNIVERSITY PRESS
STANFORD, CALIFORNIA