Embed Size (px)
Citation preview
Copyright © Big Ideas Learning, LLC All rights reserved.
Chapter 8: Graphing Quadratic Functions Students will…
• Identify characteristics of quadratic functions. • Graph quadratic functions. • Find the foci of parabolas. • Write equations of parabolas with vertices at
the origin given the foci. • Graph quadratic functions of the form
and compare to the graph of
• Find the axes of symmetry and the vertices of
graphs. • Graph quadratic functions of the form
• Find maximum and minimum values. • Graph quadratic functions of the form
and compare to the graph
of • Identify linear, quadratic, and exponential
functions using graphs or tables. • Compare graphs of linear, quadratic, and
exponential functions. • Solve real-life problems.
Essential Questions
• What are the characteristics of the graph of the quadratic function How does
the value of a affect the graph of • Why do satellite dishes and spotlight
reflectors have parabolic shapes? • How does the value of c affect the graph of
• How can you find the vertex of the graph of • How can you compare the growth rates of linear, exponential, and
quadratic functions?
Game
• Transform Me
This is available online in the Game Closet at www.bigideasmath.com.
Key Terms
A quadratic function is a nonlinear function that can be written in the standard form where
The U-shaped graph of a quadratic function is called a parabola.
The lowest or highest point on a parabola is the vertex.
The vertical line that divides a parabola into two symmetric parts is the axis of symmetry.
The focus of a parabola is a fixed point on the interior of a parabola that lies on the axis of symmetry.
A zero of a function is an x-value for which
The y-coordinate of the vertex of the graph is the maximum value of the function when a < 0 or the minimum value when a > 0.
The vertex form of a quadratic function is where
Standards California Common Core: F.BF.3, F.IF.4, F.IF.6, F.IF.7a, F.LE.3
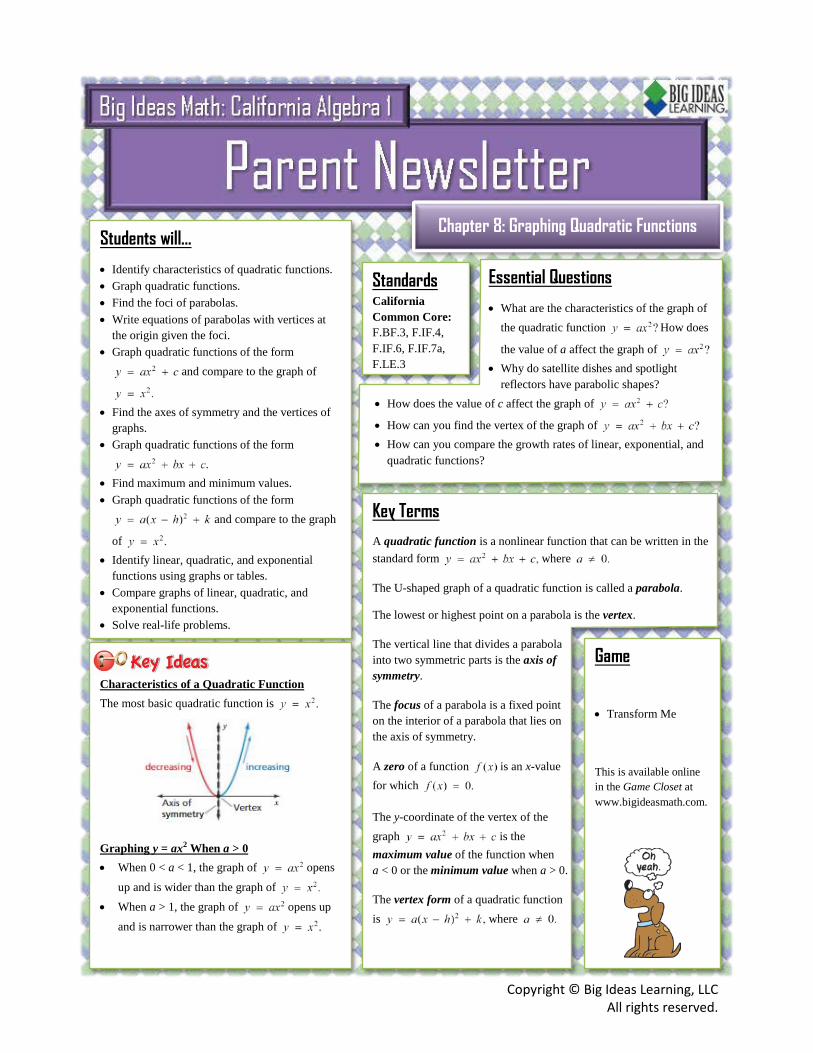
Characteristics of a Quadratic Function The most basic quadratic function is Graphing y = ax2 When a > 0 • When 0 < a < 1, the graph of opens
up and is wider than the graph of • When a > 1, the graph of opens up
and is narrower than the graph of
Copyright © Big Ideas Learning, LLC All rights reserved.
Graphing y = ax2 When a < 0 • When −1 < a < 0, the graph of opens down and is
wider than the graph of
• When a < −1, the graph of opens down and is
narrower than the graph of
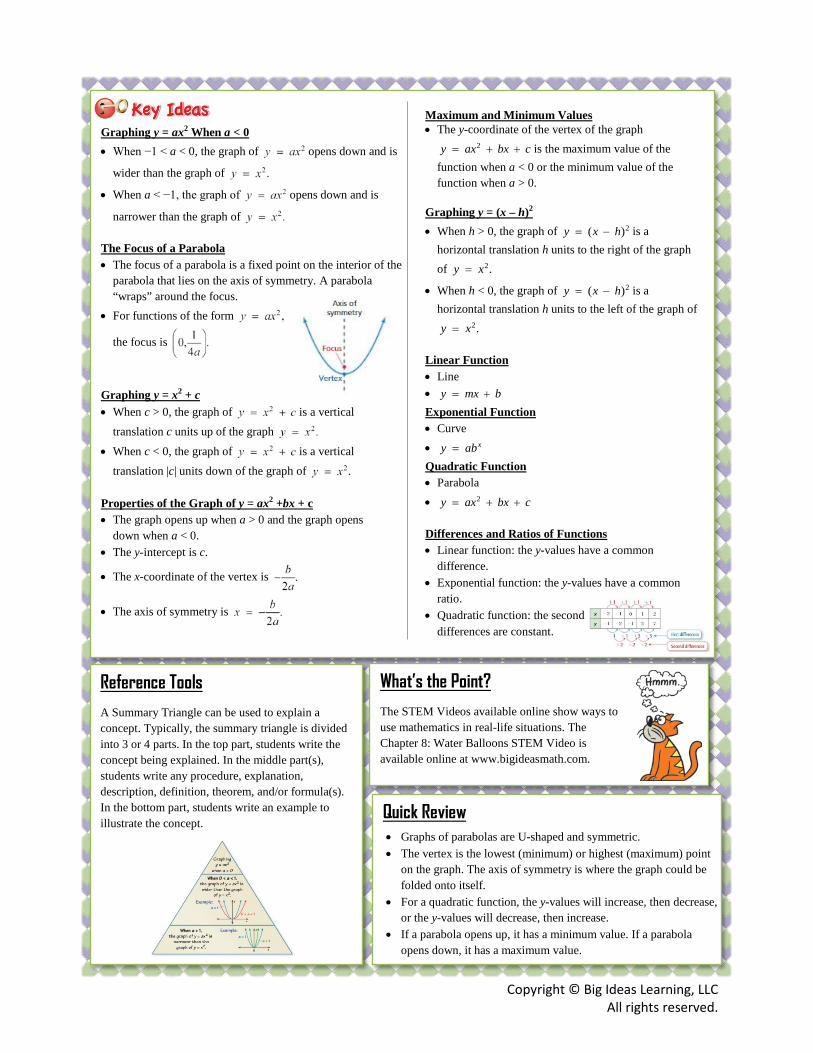
The Focus of a Parabola • The focus of a parabola is a fixed point on the interior of the
parabola that lies on the axis of symmetry. A parabola “wraps” around the focus.
• For functions of the form
the focus is
Graphing y = x2 + c • When c > 0, the graph of is a vertical
translation c units up of the graph
• When c < 0, the graph of is a vertical translation |c| units down of the graph of
Properties of the Graph of y = ax2 +bx + c • The graph opens up when a > 0 and the graph opens
down when a < 0. • The y-intercept is c.
• The x-coordinate of the vertex is
• The axis of symmetry is
Maximum and Minimum Values • The y-coordinate of the vertex of the graph
2y ax bx c= + + is the maximum value of the function when a < 0 or the minimum value of the function when a > 0.
Graphing y = (x – h)2 • When h > 0, the graph of 2( )y x h= − is a
horizontal translation h units to the right of the graph of 2.y x=
• When h < 0, the graph of 2( )y x h= − is a horizontal translation h units to the left of the graph of
2.y x=
Linear Function • Line • y mx b= + Exponential Function • Curve • xy ab= Quadratic Function • Parabola • 2y ax bx c= + +
Differences and Ratios of Functions • Linear function: the y-values have a common
difference. • Exponential function: the y-values have a common
ratio. • Quadratic function: the second
differences are constant.
Reference Tools A Summary Triangle can be used to explain a concept. Typically, the summary triangle is divided into 3 or 4 parts. In the top part, students write the concept being explained. In the middle part(s), students write any procedure, explanation, description, definition, theorem, and/or formula(s). In the bottom part, students write an example to illustrate the concept.
What’s the Point? The STEM Videos available online show ways to use mathematics in real-life situations. The Chapter 8: Water Balloons STEM Video is available online at www.bigideasmath.com.
Quick Review
• Graphs of parabolas are U-shaped and symmetric. • The vertex is the lowest (minimum) or highest (maximum) point
on the graph. The axis of symmetry is where the graph could be folded onto itself.
• For a quadratic function, the y-values will increase, then decrease, or the y-values will decrease, then increase.
• If a parabola opens up, it has a minimum value. If a parabola opens down, it has a maximum value.