Embed Size (px)
Citation preview

Chapter 7
Treatment Outcome Expectations Scale (TOES)
Treatment Process Expectations Index (TPEI)
Background
Purpose The Treatment Outcome Expectations Scale (TOES) is a measure of client and caregiver expectations about mental health treatment. Specifically, the TOES assesses expectations about the outcomes of treatment. Expectations about treatment refer to “…anticipatory beliefs that clients bring to treatment and can encompass beliefs about procedures, outcomes, therapists, or any other facet of the intervention and its delivery.” (Nock & Kazdin, 2001, p. 155) By this definition, expectancies are thought to be a pretreatment client characteristic. The Treatment Process Expectations Index (TPEI) is a set of nine additional items that assesses the youth’s expectations about their role in counseling and the counseling process itself. Client expectations about treatment are an important factor in establishing how treatment will proceed, and have been linked to both treatment process and outcomes.
Theory Historically, two types of expectations have been described in the literature: role and outcome expectancies. Role expectations refer to “patterns of behavior viewed as appropriate or expected of a person who occupies a particular position...clients have role expectations both of themselves and of the therapist” (Arnkoff, Glass & Shapiro, 2002, p. 336). Outcome expectations refer to “expectations that therapy will lead to change” (p. 335). More recent research has focused on process expectations—for example, the activities involved in and feelings elicited by treatment (Dew & Bickman, 2005). Research supports the importance of addressing client expectations about treatment, repeatedly linking expectations to the therapeutic alliance (see Al-Darmaki & Kivlighan, 1993; Joyce & Piper, 1998; Meyer et al., 2002) and client improvement (see Friedman, 1963; Goldstein & Shipman, 1961; Meyer et al.; Tollinton, 1973; Safren, Heimburg & Juster, 1997; Sotsky et al., 1991). Studies generally suggest more positive outcome expectations are associated with building more positive therapeutic alliances and better client outcomes (see Dew & Bickman,2005 for a review). Additional studies also suggest that role expectancies are linked to therapy process and outcomes, though far fewer studies have examined these relationships. Recent research suggests the therapeutic alliance mediates the relationship between expectations and client improvement (e.g., Meyer et al., 2002). Taken altogether, this suggests that assessing expectations may have important clinical implications.
Peabody Treatment Progress Battery 2007.1
77

There are currently no widely used measures of expectations about treatment. Existing adult measures have many deficits, including a lack of reported psychometric properties and poor consideration of contextual characteristics (e.g., cultural sensitivity, sensitivity to treatment setting) (Dew & Bickman, 2005). These measures also reflect diversity in content assessed, including role and outcome expectations, process expectations, expectations about the specific treatment being used, and non-expectancy content (e.g., credibility of treatment, preference for treatment). This lack of agreement on what constitutes treatment expectations may have contributed to decreased reliability of measurement. A review of the literature led to the identification of eight measures of youth and/or caregiver expectations about roles, process, and/or outcomes of therapy. Overall, these measures took developmental considerations into account when creating items and/or interpreting results of analyses. However, sensitivity to culture, presenting problem, and treatment were largely absent in these measures. Further, we found problems similar to those reviewed in the adult literature. For some youth and/or caregiver measures, there was no report of psychometric properties (Bonner & Everett, 1982; Weiss & Dlugokinski, 1974) or a lack of clarity on the meaning of summary scores derived from the measure (Bonner & Everett, 1982; 1986; Day & Reznikoff, 1980; Plunkett, 1984; Shuman & Shapiro, 2002). When psychometric properties were reported, some measures did not perform as expected, evidenced by insufficient divergent validity (Waas & Anderson, 1991) or poor internal consistency and predictive validity (Morrissey-Kane, 2000; Shuman & Shapiro, 2002). Nock and Kazdin (2001) developed the Parent Expectations for Therapy Scale to assess the role and outcome expectancies of caregivers as well as the perceived credibility of the treatment in which their children were participating. Although this measure generally performed well, demonstrating adequate psychometric properties, and yielding subscale scores for each factor, the inclusion of non-expectation content (i.e., perceived credibility of treatment) led to imprecise measurement. In addition, multiple items assessed expectations about the specific treatment being utilized, which made the measure less generalizable. This suggests the need for a reliable, valid measure of treatment expectations that would be applicable for both youth and caregivers, and would be generalizable across treatment contexts.
History of Development The development of the TOES began with the aforementioned review of the relevant literature on treatment expectations. After establishing the need for a new measure of expectations and determining the best direction for measurement, an initial pool of items was generated to describe expectations about role, process and outcomes of treatment, with parallel forms for youth and caregivers. After an internal review by our research team and an external review by the clinical advisory board of our partner organization, a preliminary measure with 19 items was included in the psychometric study described in Chapter 2. Initial analyses suggested that this preliminary measure had inadequate psychometric properties, so we turned back to the conceptualization of expectancies and used this information in conjunction with the preliminary results to guide our revisions. Because outcome expectations
Peabody Treatment Progress Battery 2007.1
78

have been most consistently linked to both therapeutic alliance and client improvement, they represent a potentially useful area for assessment. In addition, measures of outcome expectations have clear meaning because expectations can easily be valued (i.e., positive, neutral and negative expectations about outcome are each meaningful). This is in contrast to role and process expectations, which are not as easily valued. Thus, following initial analysis, outcome expectancies were targeted as the primary area of interest for the TOES. Items retained assess anticipated impact of treatment on: the youth-caregiver relationship, youth thoughts, feelings and behaviors, youth ability to cope, and youth functioning. In developing the initial pool of items, it became clear that there were additional aspects of expectations that were both interesting and potentially useful, despite them not being facets of outcome expectations. These items assess various aspects of working with the counselor (e.g., collaboration, confidentiality), and participation in treatment (e.g., amount of work and change needed for improvement, whether supplemental treatments will be necessary). Because these nine items yield useful information, they were retained for use and comprise the supplemental Treatment Process Expectations Index (TPEI). Initial analysis suggested that these items do not form a coherent, meaningful scale, thus psychometric analyses will not be reported for the TPEI. However, a brief description of the structure and item-level interpretive suggestions is included in this chapter, following the discussion of the TOES. Existing descriptions of expectations and the initial analyses support the use of the TOES, with the TPEI providing supplemental information. Thus, expectations about treatment are assessed primarily through the TOES, which is a measure of expectations of outcomes that can be scored and interpreted quantitatively. The TPEI provides additional item-level information that can facilitate additional understanding about expectations. Information on the TOES is presented below, followed by detailed information on the TPEI.
Treatment Outcome Expectations Scale (TOES)
Structure The TOES consists of ten items assessing expectations about the anticipated outcomes of treatment. Each item is rated on a three-point Likert-type scale with a response range from one (I do not expect this) to three (I do expect this). Youth and adult caregivers respond to each item based on their expectations about what will happen in the future as a result of their counseling. The TOES Total Score describes overall youth and caregiver expectations about the outcomes of treatment, and represents the mean of the responses across all items if at least 85% of the items are completed. Factor analysis suggests that the TOES is best described by a one-factor model. The psychometric data that follow are based on the complete sample of the psychometric study. See Chapter 2 for more detail on the psychometric sample and test development procedures.
Peabody Treatment Progress Battery 2007.1
79

Administration The TOES has two versions, one to be completed by the youth and the other by the adult caregiver. As shown in Table 7.1, the TOES may be administered only during the intake phase.
Table 7.1 Administration of TOES by Phase Intake Treatment Discharge Follow-Up Y A C Y A C Y A C Y A C ■ ■
Y = Youth (age 11-18); A = Adult Caregiver; C = Clinician Suggested frequency: Once at Intake. The suggested administration schedule of all the measures in the Peabody Treatment Progress Battery is presented in Appendix A. All PTPB measures with self-scoring forms are available in Appendix B: Measures and Self-Scoring Forms.
Description
Basic Descriptives Descriptive statistics for youth and adult caregiver TOES Total Scores appear in Table 7.2. TOES Total Scores retain the original metric and range from one to three. Mean total scores in the sample were 2.5 for youth and 2.8 for adult caregivers. This corroborates with item-level descriptive data (see Tables 7.5 and 7.6 below), and suggests that TOES Total Scores are near the ceiling of possible scores, similar to results found with the Therapeutic Alliance Quality Scale (TAQS; see Chapter 8). These findings may be related, indicating a self-selection bias of participants whereby those who had positive expectations about the outcome of treatment were the same participants who had persevered in treatment and highly rated their relationship with their therapists. The relationship between the TOES and TAQS may look different when the TOES is administered at the outset of treatment, as intended, as opposed to concurrently, as was done with the psychometric study.
Peabody Treatment Progress Battery 2007.1
80

Table 7.2 Descriptive Statistics for TOES Summary Scores Scale N Mean Std Dev Kurtosis Skewness Min Max
Youth 514 2.5 0.4 0.4 -1.0 1.1 3.0
Adult Caregiver 428 2.8 0.3 5.8 -2.1 1.2 3.0
Quartiles Overall, adult caregiver scores were higher than for youth, indicating that caregivers in the psychometric sample had higher expectations for the outcome of treatment than did youth. Table 7.3 shows quartiles for the TOES Total Score for both youth and adult caregivers. High scores are those in the top quarter, with low scores in the bottom quarter. For the TOES Youth Total Score, a score greater than 2.8 is considered high, while a score less than 2.2 is considered low. For the TOES Adult Caregiver Total Score, a score less than 2.7 is low, whereas scores in the top range are blurred, with the highest score of 3.0 at the third quartile. This failure to distinguish upper scores shows a ceiling effect limitation, reflected in the comprehensive psychometric analysis presented in Tables 7.6 and 7.7. To aid interpretation, the quartiles were used to create low, medium, and high scores and percentile ranks based on comparison to the psychometric sample. This information is presented in the last section of this chapter. It should be noted that the restricted range of responses impacts both types of comparisons.
Table 7.3 TOES Quartiles
Quartile Youth Adult Caregiver
100% Max 3.0 3.0 75% Q3 2.8 3.0 50% Median 2.6 2.9 25% Q1 2.2 2.7 0% Min 1.1 1.2
Evidence of Reliability
Reliability Coefficients The Cronbach’s alpha internal consistency reliability correlations are presented in Table 7.4. These alphas suggest a satisfactory degree of internal consistency for both Youth and Adult Caregiver Total Scores.
Peabody Treatment Progress Battery 2007.1
81
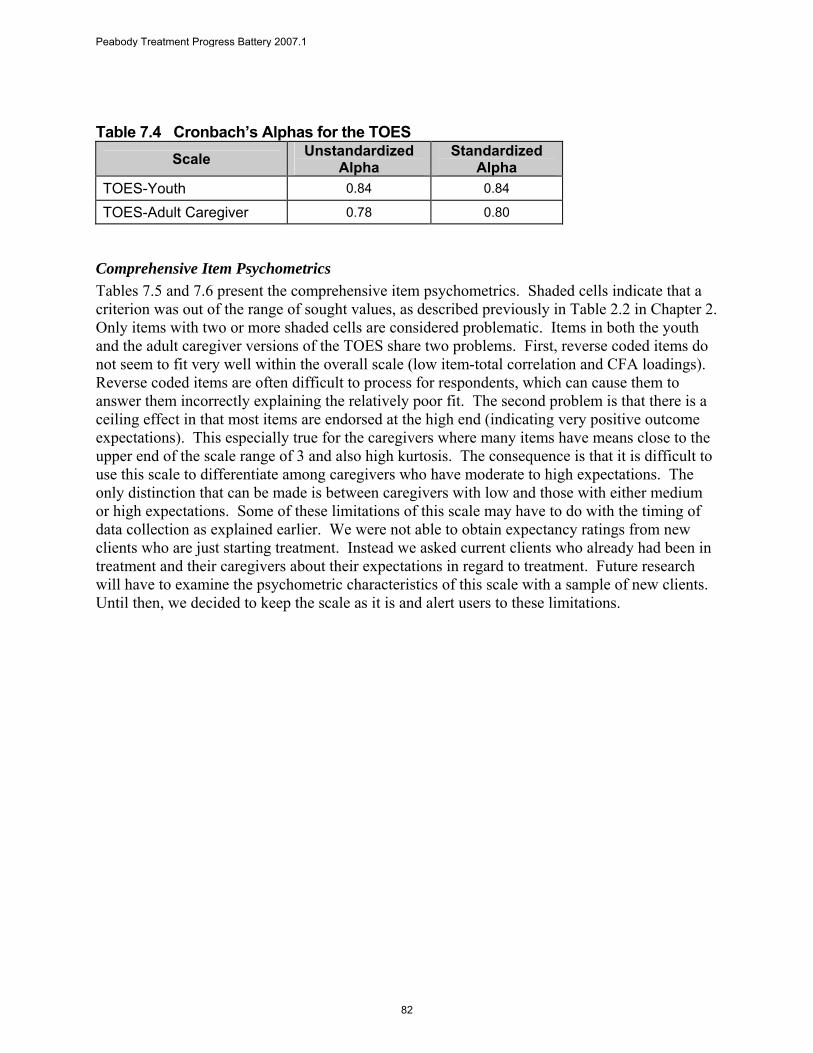
Table 7.4 Cronbach’s Alphas for the TOES Scale Unstandardized
Alpha Standardized
Alpha TOES-Youth 0.84 0.84
TOES-Adult Caregiver 0.78 0.80
Comprehensive Item Psychometrics Tables 7.5 and 7.6 present the comprehensive item psychometrics. Shaded cells indicate that a criterion was out of the range of sought values, as described previously in Table 2.2 in Chapter 2. Only items with two or more shaded cells are considered problematic. Items in both the youth and the adult caregiver versions of the TOES share two problems. First, reverse coded items do not seem to fit very well within the overall scale (low item-total correlation and CFA loadings). Reverse coded items are often difficult to process for respondents, which can cause them to answer them incorrectly explaining the relatively poor fit. The second problem is that there is a ceiling effect in that most items are endorsed at the high end (indicating very positive outcome expectations). This especially true for the caregivers where many items have means close to the upper end of the scale range of 3 and also high kurtosis. The consequence is that it is difficult to use this scale to differentiate among caregivers who have moderate to high expectations. The only distinction that can be made is between caregivers with low and those with either medium or high expectations. Some of these limitations of this scale may have to do with the timing of data collection as explained earlier. We were not able to obtain expectancy ratings from new clients who are just starting treatment. Instead we asked current clients who already had been in treatment and their caregivers about their expectations in regard to treatment. Future research will have to examine the psychometric characteristics of this scale with a sample of new clients. Until then, we decided to keep the scale as it is and alert users to these limitations.
Peabody Treatment Progress Battery 2007.1
82

Table 7.5 Comprehensive Item Analysis for the TOES–Youth
Item
N
Mea
n
St D
ev
Kur
tosi
s
Item
-Tot
al
Std
CFA
Mea
sure
Infit
Out
fit
Dis
crim
inat
ion
Counseling will make problems worse (R) 514 2.68 0.58 1.65 0.38 0.40 41.82 1.35 1.26 0.78
Help to solve problems 513 2.64 0.60 1.00 0.67 0.76 44.04 0.75 0.59 1.29
Learn to use strengths 515 2.59 0.63 0.46 0.59 0.63 46.26 0.91 0.90 1.11
Deal with bothering thoughts 514 2.58 0.68 0.41 0.61 0.70 46.61 1.00 0.90 1.12
Will improve home behavior 512 2.54 0.65 0.08 0.63 0.64 48.14 0.82 0.73 1.23
Help with painful feelings 514 2.52 0.68 -0.10 0.61 0.70 49.20 0.91 0.90 1.15
Counseling will help improve 513 2.48 0.66 -0.35 0.53 0.59 50.90 0.97 1.04 0.99
Will help with life I want 516 2.45 0.67 -0.47 0.61 0.62 51.67 0.84 0.85 1.16
Will improve school behavior 513 2.39 0.74 -0.78 0.54 0.59 53.73 1.07 0.98 1.00 Would improve w/o counseling (R) 516 1.95 0.72 -1.08 0.21 0.27 67.63 1.47 1.96 0.02
Note: Items listed in ascending order by item difficulty (Measure). (R) indicates reverse coded item.
Peabody Treatment Progress Battery 2007.1
83

Table 7.6 Comprehensive Item Analysis for the TOES-Adult Caregiver
Item
N
Mea
n
St D
ev
Kur
tosi
s
Item
-Tot
al
Std
CFA
Lo
adin
gs
Mea
sure
Infit
Out
fit
Dis
crim
inat
ion
Learn to use strengths 430 2.88 0.37 10.76 0.56 0.60 41.08 0.78 0.69 1.14
Help to solve problems 431 2.87 0.38 10.19 0.58 0.73 42.99 0.83 0.61 1.16
Help with painful feelings 432 2.88 0.40 10.86 0.52 0.67 43.29 0.92 0.80 1.12
Deal with bothering thoughts 427 2.85 0.45 8.28 0.48 0.52 46.14 1.15 0.92 1.03 Counseling will make problems worse (R) 432 2.84 0.46 7.70 0.30 0.31 47.27 1.45 1.19 0.84
Will improve home behavior 418 2.81 0.44 4.89 0.49 0.57 49.33 0.99 0.85 1.06
Counseling will help improve 429 2.75 0.53 3.37 0.42 0.46 51.84 1.18 1.10 0.91
Will improve school behavior 429 2.76 0.49 2.81 0.56 0.58 52.73 0.81 0.83 1.14
Will help with life wanted 432 2.68 0.53 1.09 0.46 0.54 56.93 0.88 0.92 1.06 Would improve w/o counseling (R) 432 2.43 0.66 -0.53 0.24 0.31 68.41 1.27 1.47 0.33
Note: Items listed in ascending order by item difficulty (Measure). (R) indicates reverse coded item.
Peabody Treatment Progress Battery 2007.1
84

Standard Errors of Measurement For the TOES Youth Total Score, the standard error of measurement (SEM) is 0.17 points. With 95% confidence, we can say that the true score is between approximately ± 2 SEMS, or 0.33 points on a one to three point scale. The SEM for the TOES Adult Caregiver Total Score is 0.13 points. With 95% confidence, we can say that the true score is between approximately ±2 SEMS, or 0.25 points on a one to three point scale.
Reliable Change Index The reliable change index (RCI) is not applicable with the suggested administration schedule of initial assessment only.
Test-Retest Reliability Not available at this time.
Evidence of Validity
Scree Plot The scree plot of eigenvalues (Figure 7.1) suggests that the TOES is a one-factor scale for both the youth and adult caregiver versions. Since the second eigenvalue is 0.97 for youth and 1.04 for adult caregivers, efforts to construct a second factor would likely fail. The final factor structure was tested using confirmatory factor analysis (CFA).
1 2 3 4 5 6 7 8 9 10
Eig
enva
lue
0
1
2
3
4
5
Youth Adult
1
2 3
Figure 7.1 Scree Plot of Eigenvalues for TOES
Peabody Treatment Progress Battery 2007.1
85

Confirmatory Factor Analysis) A confirmatory factor analysis (CFA) was conducted with SAS CALIS in a mode emulating Bentler & Wu’s (1995) EQS. We used a simple measurement model to see how well a one-factor model could explain the observed data. Results are shown in Table 7.7. For the Youth, standardized factor loadings on Factor I were large and positive (0.59 – 0.76) except for the two reversed items, whose loadings were lower (0.40 and 0.27). Adult ratings showed a similar pattern with higher standardized loadings for unreversed items (0.46 to 0.73) that for the two reversed ones (0.31 and 0.31). For the youth data, the results indicate that the fit of the one-factor model was satisfactory (except for RMSEA > 0.05). For the adult caregiver data, fit indices were less satisfactory, possibly because of the kurtosis of the data. These results suggest that there is a moderate departure from unidimensionality, especially for the adult form. However this departure would not be an important problem to clinicians using the instruments.
Table 7.7 Evaluation of the TOES Factor Structure
Scale Bentler CFI Joreskog GFI RMSEA
Youth – One-Factor Model 0.94 0.95 0.07
Adult Caregiver – One-Factor Model 0.85 0.92 0.09
For the CFI and GFI, values greater than 0.90 indicate good fit between a model and the data. For the RMSEA, a value of 0.05 indicates close fit, 0.08 fair fit, and 0.10 marginal fit (Browne & Cudeck, 1993).
Scoring the TOES Use Table 7.8 to calculate the TOES Total Score. Enter the value for the responses in fields A-J and calculate fields K and L as instructed. There are two reverse coded items in the TOES. The self-scoring form is also available in Appendix B: Measures and Self-Scoring Forms. Use the scoring form in the case where measures are fully completed (100% response rate). Otherwise, in cases with missing data, scoring can be done by computing the mean of completed items. Determining when too much missing data occurs for computing summary scores is at the discretion of the user. The analyses presented in this chapter required 85% of the items to have valid answers.
Peabody Treatment Progress Battery 2007.1
86

Table 7.8 TOES Self-Scoring Form
Values for Responses
Item I do not expect
this I am not sure I do expect this
Enter value for selected responses here and calculate
scores as instructed
1 1 2 3 A
2 1 2 3 B 3 1 2 3 C 4 1 2 3 D 5 3 2 1 E 6 1 2 3 F 7 1 2 3 G 8 1 2 3 H 9 1 2 3 I 10 3 2 1 J
Sum of A-J: K K / 10: L
TOES Total Score = L
Interpretation The TOES Total Score indicates how the youth or adult caregiver views expectations of treatment outcomes. In general, the scores of the TOES can range from one to three, where a three represents high expectations and a one indicates low expectations. The scores presented in Table 7.9 and percentile ranks in Table 7.10 help to judge whether a score should be considered relatively low, medium, or high. Youth or adult caregivers who rate their expectations as high anticipate a positive impact of treatment on the youth-caregiver relationship, youth thoughts, feelings and behaviors, youth ability to cope, and youth functioning. When youth or adult caregivers report low expectations, it does not necessarily mean that the treatment will have no effect; it shows that the youth or caregiver does not anticipate that treatment will have those outcomes. However, if the youth or caregiver is not expecting positive outcomes, this may be a warning sign to counselors that the youth or caregiver may be less motivated and invested in or resistant to treatment. In turn, youth or adult caregivers with low outcome expectations may be less likely to engage in treatment activities (e.g., efforts to change behavior or teach coping skills). Administration of the TOES prior to beginning treatment can assist clinicians in facilitating a discussion of outcome expectations, identifying youth or caregiver misconceptions and concerns.
Peabody Treatment Progress Battery 2007.1
87
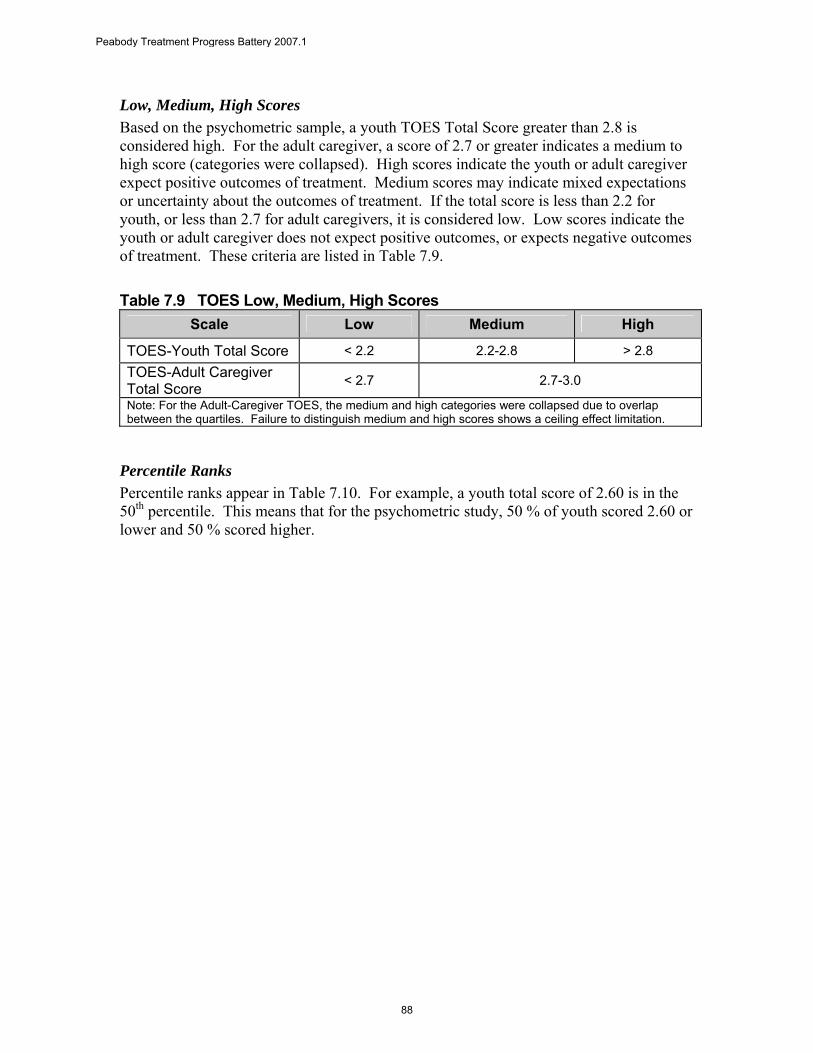
Low, Medium, High Scores Based on the psychometric sample, a youth TOES Total Score greater than 2.8 is considered high. For the adult caregiver, a score of 2.7 or greater indicates a medium to high score (categories were collapsed). High scores indicate the youth or adult caregiver expect positive outcomes of treatment. Medium scores may indicate mixed expectations or uncertainty about the outcomes of treatment. If the total score is less than 2.2 for youth, or less than 2.7 for adult caregivers, it is considered low. Low scores indicate the youth or adult caregiver does not expect positive outcomes, or expects negative outcomes of treatment. These criteria are listed in Table 7.9.
Table 7.9 TOES Low, Medium, High Scores Scale Low Medium High
TOES-Youth Total Score < 2.2 2.2-2.8 > 2.8 TOES-Adult Caregiver Total Score < 2.7 2.7-3.0
Note: For the Adult-Caregiver TOES, the medium and high categories were collapsed due to overlap between the quartiles. Failure to distinguish medium and high scores shows a ceiling effect limitation.
Percentile Ranks Percentile ranks appear in Table 7.10. For example, a youth total score of 2.60 is in the 50th percentile. This means that for the psychometric study, 50 % of youth scored 2.60 or lower and 50 % scored higher.
Peabody Treatment Progress Battery 2007.1
88
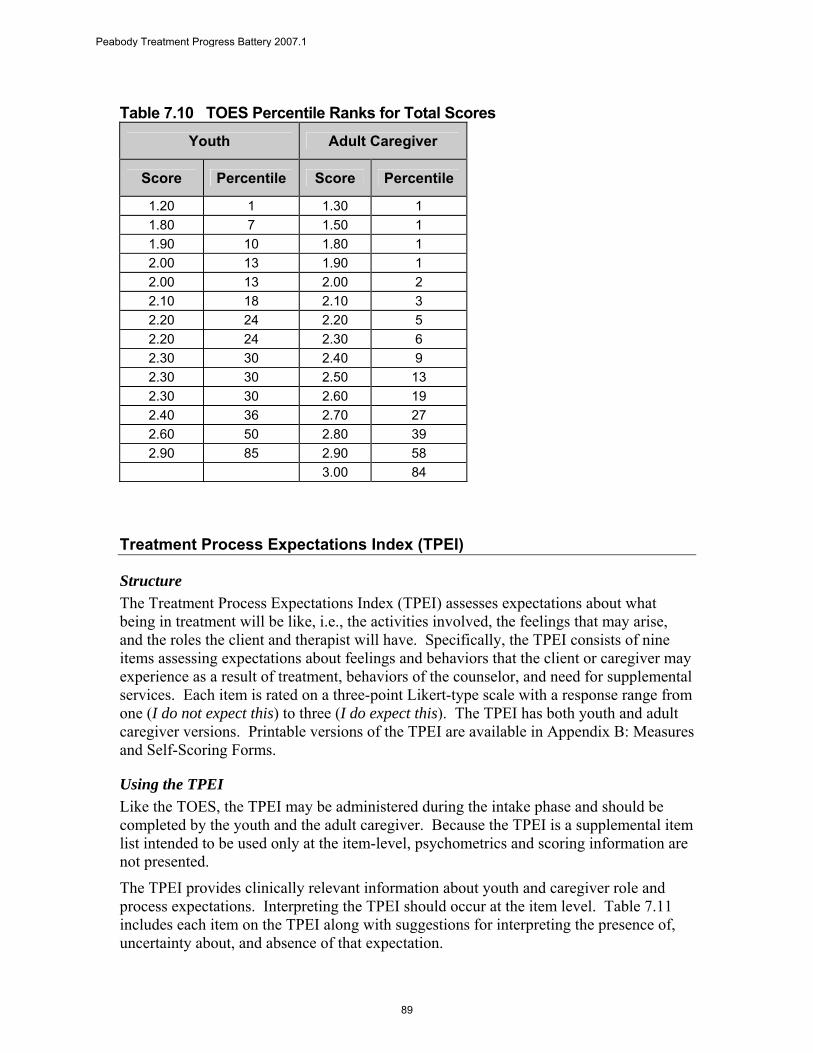
Table 7.10 TOES Percentile Ranks for Total Scores
Youth Adult Caregiver
Score Percentile Score Percentile
1.20 1 1.30 1 1.80 7 1.50 1 1.90 10 1.80 1 2.00 13 1.90 1 2.00 13 2.00 2 2.10 18 2.10 3 2.20 24 2.20 5 2.20 24 2.30 6 2.30 30 2.40 9 2.30 30 2.50 13 2.30 30 2.60 19 2.40 36 2.70 27 2.60 50 2.80 39 2.90 85 2.90 58
3.00 84
Treatment Process Expectations Index (TPEI)
Structure The Treatment Process Expectations Index (TPEI) assesses expectations about what being in treatment will be like, i.e., the activities involved, the feelings that may arise, and the roles the client and therapist will have. Specifically, the TPEI consists of nine items assessing expectations about feelings and behaviors that the client or caregiver may experience as a result of treatment, behaviors of the counselor, and need for supplemental services. Each item is rated on a three-point Likert-type scale with a response range from one (I do not expect this) to three (I do expect this). The TPEI has both youth and adult caregiver versions. Printable versions of the TPEI are available in Appendix B: Measures and Self-Scoring Forms.
Using the TPEI Like the TOES, the TPEI may be administered during the intake phase and should be completed by the youth and the adult caregiver. Because the TPEI is a supplemental item list intended to be used only at the item-level, psychometrics and scoring information are not presented.
The TPEI provides clinically relevant information about youth and caregiver role and process expectations. Interpreting the TPEI should occur at the item level. Table 7.11 includes each item on the TPEI along with suggestions for interpreting the presence of, uncertainty about, and absence of that expectation.
Peabody Treatment Progress Battery 2007.1
89

Table 7.11 Interpreting the TPEI Item Expectation Present Uncertain Expectation Absent
1 My counselor will not tell other people what I tell him/her.
Expects confidentiality, which may indicate some level of trust in the counselor
Uncertain about whether confidentiality will be maintained and whether the counselor can be trusted
Expects a lack of confidentiality, which may indicate a lack of trust in the counselor
2 For me to get better, I will have to change a lot.
Expects that making major changes will be necessary for client improvement, which may suggest high motivation and/or knowledge about treatment
Uncertain about whether making major changes will be necessary for client improvement
Does not expect that making major changes are necessary for client improvement, which may suggest low motivation and/or knowledge about treatment
3 My counselor and I will work together in counseling.
Expects to work collaboratively with his/her counselor, which may indicate expecting an active role in treatment
Uncertain about whether he/she will work collaboratively with his/her counselor
Does not expect to work collaboratively with counselor, which may indicate expecting a passive role in treatment
4 Being in counseling will be hard work for me.
Expects that participating in treatment will involve hard work, which may suggest high motivation and/or knowledge about treatment
Uncertain about whether participating in treatment will involve hard work
Does not expect that participating in treatment will involve hard work, which may suggest low motivation and/or knowledge about treatment
5 I will be very careful about what I tell my counselor.
Expects to be cautious about sharing with counselor, which may indicate a lack of trust or uncertainty about the counselor or treatment
Uncertain about whether he/she will be cautious about sharing with counselor
Does not expect to be cautious about sharing with counselor, which may indicate trust and believing in counselor or treatment
6 I will feel comfortable speaking up if I think counseling isn’t helping me.
Expects to feel comfortable to speak up in treatment, which may indicate he/she feels empowered and expects to work collaboratively
Uncertain about whether he/she will feel comfortable to speak up in treatment
Does not expect to feel comfortable to speak up in treatment, which may indicate he/she does not feel empowered or expects to be passive in treatment
7 Sometimes, I may have difficult thoughts and/or feelings because of my counseling sessions.
Expects that treatment may sometimes feel uncomfortable, which suggests an understanding or knowledge about the process
Uncertain about whether treatment will sometimes feel uncomfortable
Does not expect that treatment will feel uncomfortable, which suggests a lack of understanding or knowledge about the process
8 My counselor will respect my (or my family’s) customs and/or cultural background.
Expects that the counselor will be culturally sensitive
Uncertain about whether the counselor will be culturally sensitive
Does not expect counselor will be culturally sensitive
9 Counseling will be the only help I will need to deal with my problems.
Expects that counseling will be the only treatment needed
Uncertain about whether counseling will be the only treatment needed
Does not expect that counseling will be the only treatment needed; may expect that medication or additional services will be necessary. Also may suggest expectation of the need for informal supports such as religious or spiritual guidance, family or friend support, etc.
Peabody Treatment Progress Battery 2007.1
90

References
Al-Darmaki, F. & Kivilghan, D. M. (1993). Congruence in client-counselor expectations for relationship and the working alliance. Journal of Counseling Psychology, 40, 379-384.
Arnkoff, D. B., Glass, C. R., & Shapiro, S. J. (2002). Expectations and preferences. In J. C. Norcross (Ed.), Psychotherapy relationships that work: Therapist contributions and responsiveness to patients (pp. 335-356). London: Oxford Press.
Bentler, P. M. & Wu, E. J. C. (1995). EQS for Windows user’s guide. Encino, CA: Multivariate Software, Inc.
Bonner, B. L. & Everett, F. L. (1982). Influence of client preparation and therapist
prognostic expectations on children’s attitudes and expectations of psychotherapy. Journal of Clinical Child Psychology, 11, 202-208.
Bonner, B. L. & Everett, F. L. (1986). Influence of client preparation and problem severity on attitudes and expectations in child psychotherapy. Professional Psychology: Research and Practice, 17, 223-229.
Browne, M. W. & Cudeck, R. (1993). Alternative ways of accessing model fit. In K. A. Bollen & J. S. Long (Eds.), Testing structural equation models (pp. 136-162). Newbury Park: Sage.
Day, L. & Reznikoff, M. (1980). Social class, the treatment process, and parents’ and
childrens’ expectations about child psychotherapy. Journal of Clinical Child Psychology, 9, 195-198.
Dew, S. E. & Bickman, L. (2005). Client expectancies about therapy. Mental Health Services Research, 7, 21-33.
Friedman, H. J. (1963). Patient-expectancy and symptom reduction. Archives of General Psychology, 8, 61-67.
Goldstein, A. P. & Shipman, W. G. (1961). Patient expectancies, symptom reduction and aspects of the initial psychotherapeutic interview. Journal of Clinical Psychology, 17, 129-133.
Joyce, A. S. & Piper, W. E. (1998). Expectancy, the therapeutic alliance, and treatment outcome in short-term individual psychotherapy. Journal of Psychotherapy Practice and Research, 7, 236-248.
Meyer, B., Pilkonis, P. A., Krupnick, J.L., Egan, M. K., Simmens, S. J., & Sotsky, S. M. (2002). Treatment expectancies, patient alliance, and outcome: Further analyses
Peabody Treatment Progress Battery 2007.1
91

from the National Institute of Mental Health Treatment of Depression Collaborative Research Program. Journal of Consulting and Clinical Psychology, 70, 1051-1055.
Morrissey-Kane, E. E. (2000). Predicting engagement in child and adolescent treatment: The role of parental attributions and expectations. Dissertation Abstracts International, 60, 6376.
Nock, M. K., & Kazdin, A. E. (2001). Parent expectancies for child therapy: Assessment and relation to participation in treatment. Journal of Child and Family Studies, 10, 155-180.
Plunkett, J. W. (1984). Parents’ treatment expectations and attrition from a child psychiatric service. Journal of Clinical Psychology, 40, 372-377.
Safren, S. A., Heimburg, R. G. & Juster, H.R. (1997). Clients’ expectancies and their relationship to pretreatment symptomatology and outcome of cognitive-behavioral group treatment for social phobia. Journal of Consulting and Clinical Psychology, 65, 694-698.
Shuman, A. L. & Shapiro, J. P. (2002). The effects of preparing parents for child psychotherapy on accuracy of expectations and treatment attendance. Community Mental Health Journal, 38, 3-16.
Sotsky, S. M., Glass, D. R., Shea, M. T., Pilkonis, P. A., Collins, J. F., Elkin, I. et al. (1991). Patient predictors of response to psychotherapy and pharmacotherapy: Findings in the NIMH Treatment of Depression Collaborative Research Program. American Journal of Psychiatry, 148, 997-1008.
Tollinton, H.J. (1973). Initial expectations and outcome. British Journal of Medical Psychology, 46, 251-257.
Waas, G. A. & Anderson, G. P. (1991). Outcome expectancy and treatment acceptability: Perceptions of school-based interventions. Professional Psychology: Research and Practice, 22, 149-154.
Weiss, S. L. & Dlugokinski, E. L. (1974). Parental expectations of psychotherapy. Journal of Psychology, 86, 71-80.
Peabody Treatment Progress Battery 2007.1
92