Embed Size (px)
Citation preview

CHAPTER 7
Acceptance Sampling
Expected Outcomes
Determine the AOQ curve and the AOQL for a single sampling plan.
Determine single sampling plans for stipulated producers risk and for stipulated consumers
risk.
Briefly describe the different sampling plan systems.
2
Fundamental Aspects
Acceptance Sampling is a form
of inspection applied to lots or
batches of items before or after
a process to judge conformance
to predetermined standards.
3
Acceptance Sampling
Acceptance Sampling is very useful when:
Large numbers of items must be processed in a
short amount of time.
The cost of “passing defectives” is low.
Fatigue/boredom is caused by inspecting large
numbers of items.
4
Acceptance Sampling
Three important aspects of sampling:
Involves random sampling of the entire lot
Accept and Reject Lots (does not improve
the quality) “Lot Sentencing”
Audit Tool
Three approaches to “lot sentencing”:
Accept with no inspection
100% inspection
Acceptance Sampling

5
Acceptance Sampling
Advantages
Places responsibility where it belongs
Less expensive
Improves inspectors job.
Applies to destructive testing
Lots are not accepted giving motivation
for improvement

6
Sampling Plans
Sampling Plans specify the lot size, sample size,
number of samples and acceptance/rejection
criteria.
Sampling plans involve: Single sampling,
Double sampling, Multiple sampling, & Sequential
Random
sampleLot
7
Sampling Plans
Single Sampling Plan
N = lot size
n = sample size
c =acceptance number
If c or less non-conforming units are found in the
sample, the lot is accepted, else it is rejected.
8
Single Sampling Plan
A single sampling plan is one where:
A representative sample of n items is drawn
from a lot size of N items
Each item in the sample is examined and
classified as good/defective
If the number of defective exceeds a specified
rejection number (c) the whole lot is rejected;
otherwise the whole lot is accepted

9
Double Sampling Plan
A Double Sampling Plan allows to take a second sample if the results of the original sample are inconclusive. Specifies the lot size, size of the initial sample, the accept/reject/inconclusive criteria for the initial sample (N, n1, c1 (Ac), r1(Re)) Specifies the size of the second sample and the acceptance/rejection criteria based on the total nonconformities observed in both the first and second sample (n2,c2,r2)

Double Sampling Plan
A first sample is taken with three possible decisions:
If the quality is very good, ≤ c1 accept lot
If the quality is very bad, ≥ reject lot
If between c1 and r1, take a second sample
Second sample is accepted if the total
nonconformities are ≤ c2 or rejected if the total nonconformities are ≥ r2
10
11
Multiple Sampling Plan
A Multiple Sampling Plan is similar to the double sampling plan in that successive trials are made, each of which has acceptance, rejection and inconclusive options.
Decision on Which Plan to Use
Simplicity – Single would be best and sequential the poorest.
Administrative costs – Least under single and greatest under sequential.
Units inspected – Greatest under single and least under sequential.
Information – Best under single and poorest under sequential.
Psychological Impact – Best under double.
12
13
Lot Formation
Considerations before inspection:
Lots should be homogeneous
Larger lots are more preferable than smaller lots
Lots should be conformable to the materials-handling systems used in both the vendor and consumer facilities
14
Statistical Aspects
The Operating Characteristic Curve:
Measures the performance of an acceptance sampling plan
Plots the probability of accepting the lot versus the lot fraction defective
Shows the probability that a lot submitted with a certain fraction defective will be either accepted or rejected

15
FIGURE 10-3 OC Curve for the Single Sampling Plan N = 3000, n = 89, and c = 2
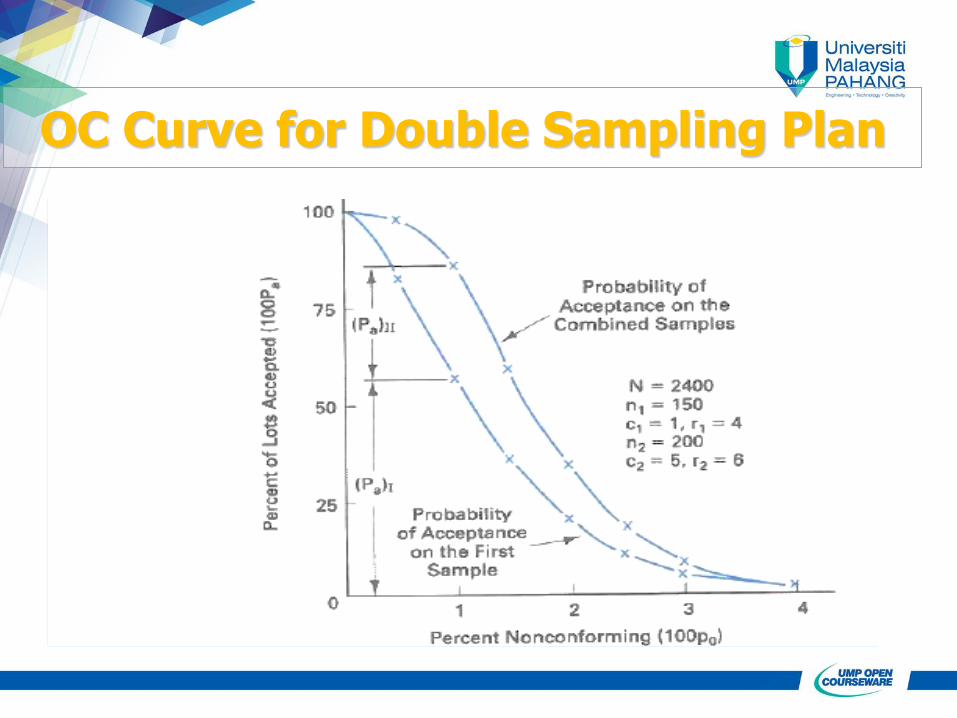
OC Curve for Double Sampling Plan
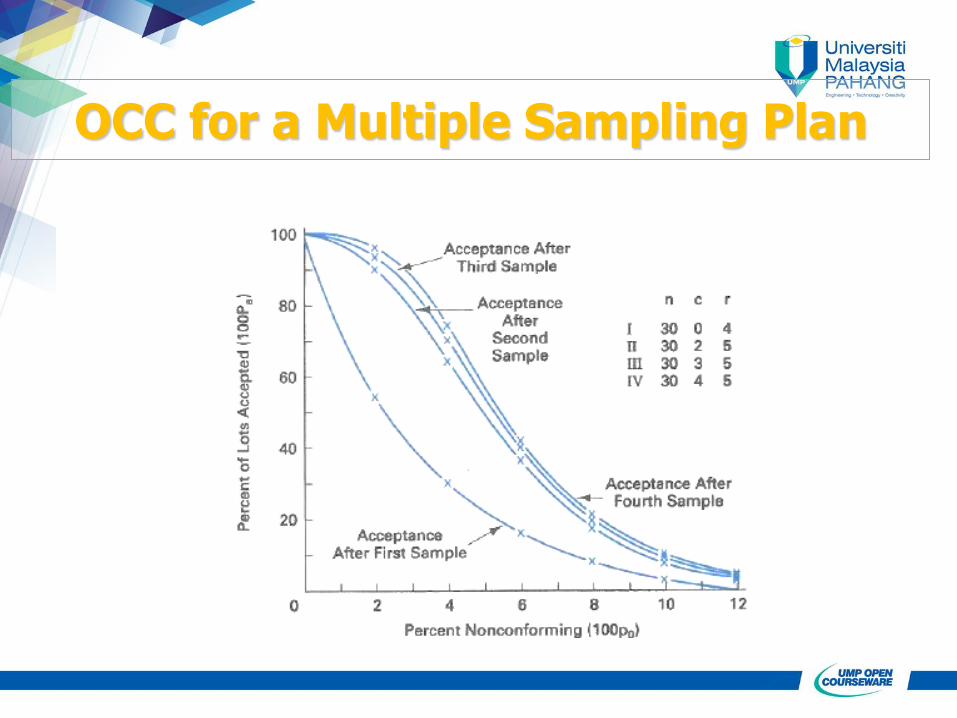
OCC for a Multiple Sampling Plan
18
OC Curves
There are two types of OC curves:
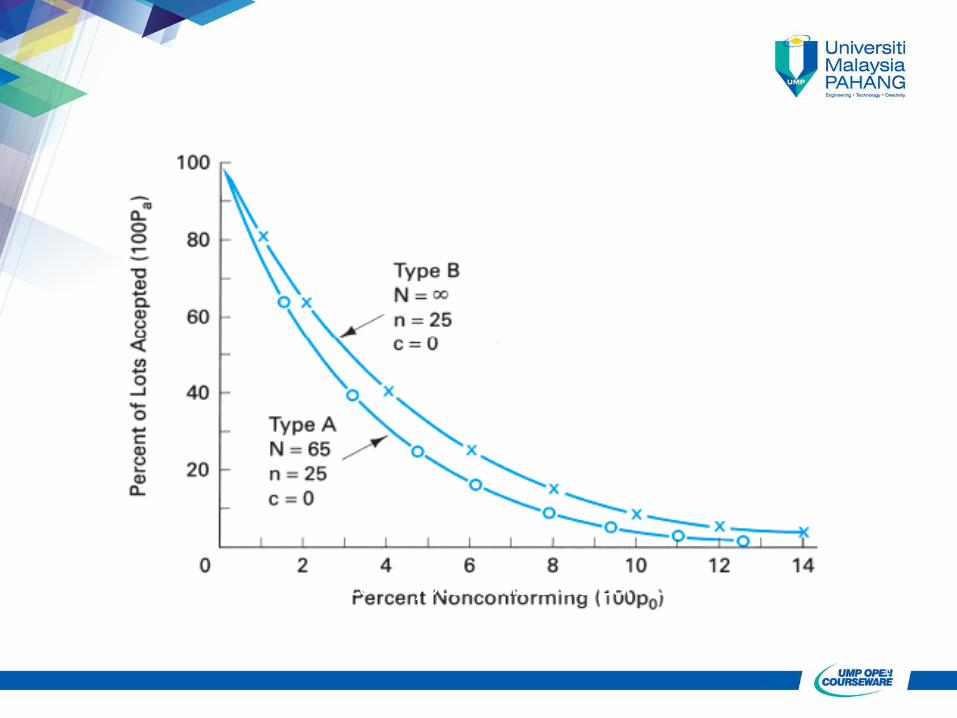
Type A
Gives the probability of acceptance of an individual lot coming from finite production
Type B
Gives the probability of acceptance for lots coming from a continuous production
19
FIGURE 10-7 Types A and B OC Curves
OC Curve Properties
Sample size as a fixed % of lot size.
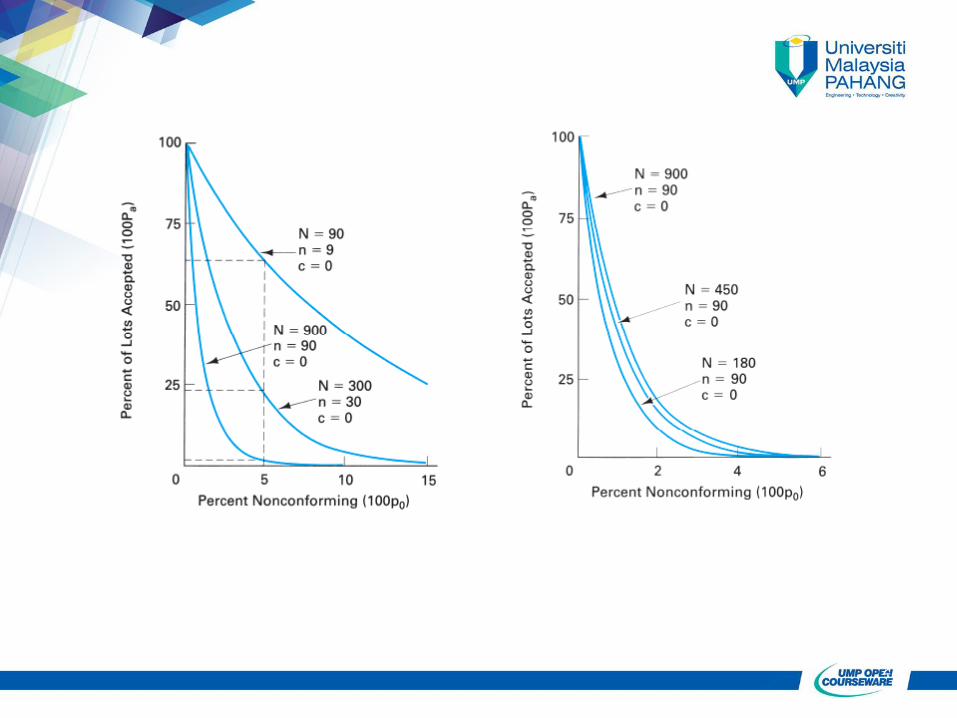
Sample size that is 10% of lot size.
Larger the sample size, the curve gets steeper.
Decrease the acceptance number, the the curve gets steeper.
20
IGURE 10-8 OC Curves for Sample Sizes that are 10% ofIGURE 10-8 OC Curves for Sample Sizes that are 10% of
21
FIGURE 10-8 OC Curves for Sample Sizes that are 10% of the Lot Size
FIGURE 10-9 OC Curves for Fixed Sample Size (Type A)
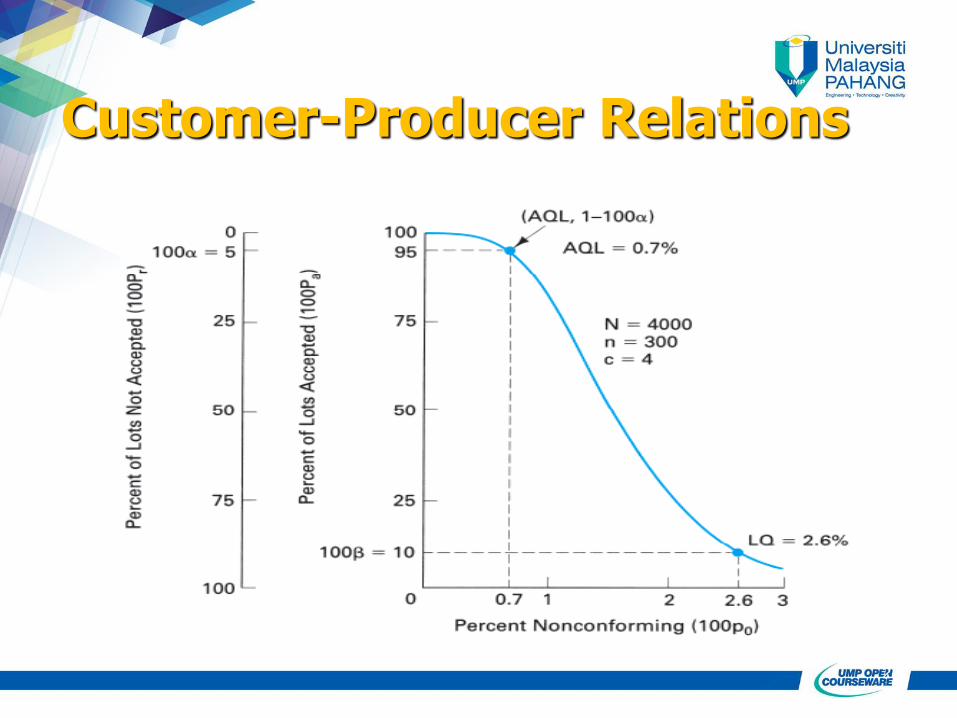
Customer-Producer Relations
22
23
Acceptable Quality Level (AQL)
The AQL is a percent defective that is the base line requirement for the quality of the producer's product. The producer would like to design a sampling plan such that there is a high probability of accepting a lot that has a defect level less than or equal to the AQL.
24
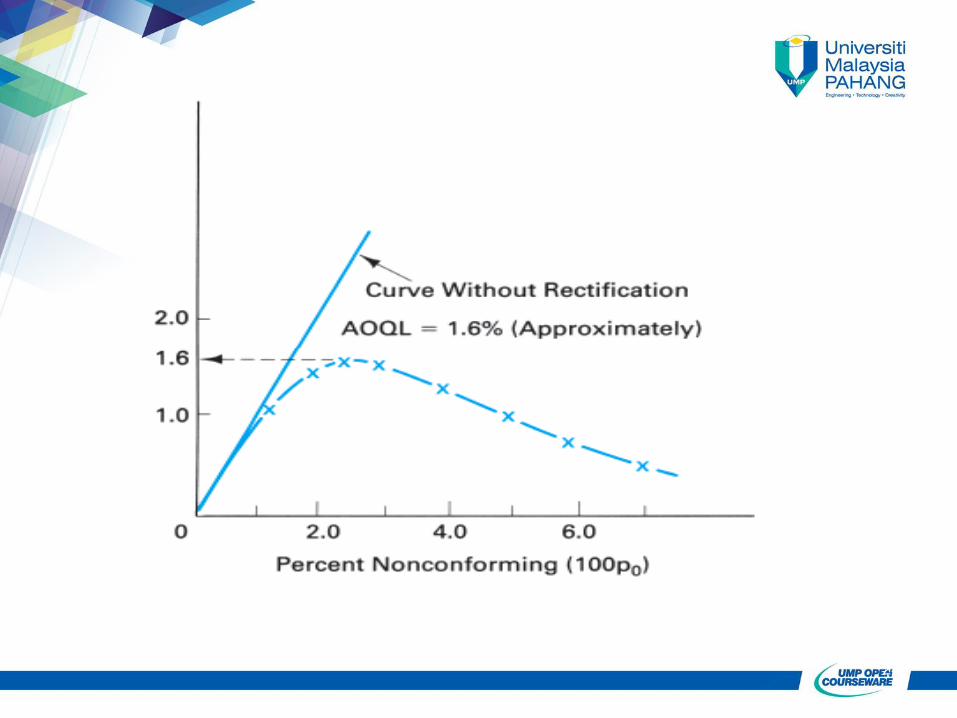
FIGURE 10-14 Average Outgoing Quality Curve for the Sampling Plan N = 3000, n = 89, and c = 2

A plot of the AOQ (Y-axis) versus the incoming lot p (X-axis) will start at 0 for p = 0, and return to 0 for p = 1 (where every lot is 100% inspected and rectified). In between, it will rise to a maximum. This maximum, which is the worst possible long term AOQ, is called the Average Outgoing Quality Limit AOQL.
Average Outgoing Quality Limit