Embed Size (px)
Citation preview

EM 1110-2-1003 1 Jan 02
Chapter 6 Planning and Processing Surveys for Civil Works Projects 6-1. General Scope Providing quality hydrographic data on dredging, navigation, and flood control projects requires careful planning and evaluation of all phases of the process. Those process considerations include: basic identification of areas to be surveyed and the conditions under which they will be surveyed, use of in-house hired labor or Architect-Engineer (A-E) service contract forces, dredging performance and time constraints, the most appropriate equipment to collect the data, data density requirements, development of a general survey plan and subsequent site specific survey plans, data processing, data presentation, and data archival and retrieval. Other general factors to be considered might include geodetic survey methods, hydrographic survey methods, computer systems design, acceptable vessel modifications, safe vessel operation, and regional knowledge of survey conditions. This chapter will discuss these items. The chapter is divided into four sections: Section I: General Guidance in Performing Hydrographic Surveys for Engineering and
Construction Section II: Planning Survey Coverage Section III: Data Processing, Editing, and Plotting Options Section IV: USACE Standards for Survey Coverage, Processing, and Plotting 6-2. General Planning Considerations A variety of resource options are available for ordering or procuring hydrographic surveys of USACE projects. These surveys may be obtained from either in-house (hired labor) forces or contracted forces. Contracted forces include A-E contractors or construction contractors--usually dredging firms. A-E contractors may be either specialized surveying firms or design firms with in-house or subcontracted surveying capabilities. The project engineer/manager must weigh the costs and benefits of these different source options. Although data quality is the most important consideration, cost often becomes a primary planning criteria. Some of the more critical factors are discussed below.
a. Project funding. Often only limited project or study funds are available for site plan mapping or surveying. Funding limits will often dictate the scope of work, often restricting the data density that can be collected and resultant data quality. Limited funds often necessitate a search for the most economical survey force. Survey costs can vary widely between in-house crews and between A-E contractors. Often geography, or mobilization distance to the project site, is a major factor. However, there are many other factors that can cause large cost differences between crews. Over-capability is one factor; e.g., using multibeam-equipped vessel with a 5-man crew to run single-line beach profiles that could be performed more efficiently by a 2-man topographic survey team. Obtaining optimum cost services may require comparisons between in-house and contracted survey forces, or even comparisons of capabilities and costs between survey crews.
b. Response time. Project or study milestones may put receipt of survey data on a critical path.
In-house or A-E contractors may have varying response capabilities that should be evaluated if rapid
6-1

EM 1110-2-1003 1 Jan 02
delivery of survey information is critical. Most field hydrographic survey crews have (or should have at this time) a "field-finish" capability. This means that a fully edited and processed survey can be delivered from the field--in MicroStation or AutoCad format--usually on the same day the survey is performed. When critical project milestones are dependent on site plan data, project engineers should expect a rapid response to a data request--including expedited "field-finish" deliverables. Ordering or procuring such service may often take longer than performing the work. In-house forces may not be immediately available. A-E contracting task orders can take from 2 to 6 weeks to process, depending on the command. Not all districts maintain A-E labor-hour contracts that allow immediate response. Alternative rapid response options include verbal notices to proceed by the Contracting Officer or credit card purchase of services. Dredging projects have strictly mandated deliverable milestones--see chapter on dredging support surveys for details. These time standards will often dictate whether in-house or contracted forces will be used to perform dredge measurement and payment surveys, based on response capabilities. c. Project scope and location. Many dredging payment surveys are relatively small projects, typically less than one-day effort with current surveying technology. Thus, it is not uncommon for mobilization and demobilization time to far exceed the actual survey time. This is especially true if the survey crew has a long travel distance to the work site. Small-scope survey projects always cost more per unit than large efforts, due to mobilization and general overhead costs, among other factors. To reduce costs, it is always desirable to bundle geographically close projects under one order. When this is not feasible, then the most capable survey crew nearest the work site should be located.
d. Survey performance and productivity capabilities. The survey crew selected for a project must
be capable of performing the work in accordance with the required accuracy and quality specifications, such as those in this manual. All in-house or contract survey forces have varying hydrographic surveying capabilities. These variations could involve equipment and/or personnel. Experience and capability must be demonstrated based on past performance. Assessing such capabilities is difficult and time consuming for a study/project manager--he must rely on the advise of someone familiar with the individual survey crews (in-house or A-E). Survey crews with updated technology and equipment is another indicator of performance capability. It is also a good productivity indicator. An example of productivity increases for a typical project is shown in Table 6-1. The table indicates that survey productivity has increased by a factor of about 75 times since the 1960s and about 10 times since 1993. This later increase is primarily due to implementation of DGPS positioning. However, the data density, accuracy, and quality have also significantly increased since 1993 (and especially since 1973) given that a full-bottom coverage (multibeam) survey was obtained on the latest survey. This table also illustrates that a 3-man survey crew today equals the output productivity of three to five crews in 1993.
Table 6-1. Annual Project Condition Survey--Tampa Harbor 43-Foot Project
Gulf of Mexico to Port of Tampa Field Survey Time Required to Perform Survey
Year Positioning Coverage Crew-Days Man-Days to 1973 Visual (tag line) 200 ft O/C 360 1800 to 1993 Microwave 100 ft O/C 40 280 to Date DGPS 100 % (Multibeam) 8 24 1 1 EMC, Inc (Greenville, MS) … 1997 (using 3-man crew) IMPACT: Decreased fieldwork…Increased data density, accuracy & data processing
6-2

EM 1110-2-1003 1 Jan 02
Section I General Guidance in Performing Hydrographic Surveys for Engineering and Construction The guidance provided in this section was developed by the Los Angles District whose coastal engineering construction projects, shallow- and deep-draft navigation projects, and inland reservoir projects are as varied as any other district in the Corps. The guidance focuses on some of the more critical aspects involved in planning, equipping, performing, and processing hydrographic surveys for engineering projects. Although developed from the perspective of the Los Angles District, many of the recommended planning considerations are applicable Corps-wide. 6-3. Survey Equipment and Instrumentation Requirements Relative to Project Scope It is important to have a good understanding of the areas that will be surveyed to make the necessary decisions on how to survey them. For example, if 90% of the hydrographic surveying is going to be in water less than 15 feet deep, it would be a waste of resources to use a multibeam system to perform the work (unless the survey is to locate small items). A better choice would be a multiple transducer swath system or a single-beam system. If the water depth exceeds 15 feet, then the multiple transducer swath system starts to become inappropriate and the single-head multibeam system becomes a better choice. Also, shallow water often precludes the use of deep draft vessels. The general classifications for survey conditions are: water depth, channel width, fresh or salt water, water current strength, tubidity, wave conditions, and weather. Each one of these can effect the type of vessel to use and the equipment that would be used aboard the vessel.
a. The most appropriate equipment for data collection is subject to many considerations. A single-head, multibeam-equipped survey boat will probably cost more than $400,000. This commitment of resources must be considered carefully. It is also required that commands obtain approval from HQUSACE prior to acquisition of multibeam equipment. Considerations are workload, type of work, skill level of personnel, safety, and data requirements. These items are tightly interrelated, but must be addressed. If just one of these items fails the whole survey system fails.
b. Workload must be sufficient to support the cost of the equipment and personnel. This is true of in-house work crews or contractors. A multibeam survey vessel should be programmed for most of the year. If the workload drops below 50% utilization then there may be a problem. In some circumstances the survey boat has other duties, or the limited requirement is sufficient to support the vessel.
c. The type of work relates to the different survey situations. Some situations warrant the use of a multibeam system and others may not. An example would be to acquire an in-house or contract multibeam vessel and use it to check the condition of non-critical depths in a channel, knowing that it would cost significantly less to utilize a different survey system. If all the work were in shallow water (less than 15 feet deep) it would not be a good use of a single-head, multibeam system to perform the survey. If the work were in rough open sea conditions, a multiple transducer swath system would be a poor choice of equipment.
d. However, key personnel will still need to be fully knowledgeable of the entire system and have a special knowledge of certain aspects of the data collection and processing systems. Without a complete knowledge of the entire process it will become difficult to efficiently survey or contract a survey in that particular district. It therefore follows that before acquiring a complex system such as multibeam, management must decide if sufficient personnel skills are available.
6-3

EM 1110-2-1003 1 Jan 02
e. Data requirements are always increasing in complexity. Several years ago there were no digital files, only the paper plot. Now the paper plot is not significant, only the digital file has a real use to the navigation community. With the advent of computer-aided drafting and design (CADD), and modern surfacing programs, providing digital data has become a necessity. This requirement has driven hydrographic surveying to the use of more complex survey systems. The current state-of-the-art system has a solid dedicated work boat (20-ft to 30-ft in length), a multibeam echo sounder, a single-beam digital echo sounder, digital compass, Global Positioning System (GPS) navigation, and a motion reference unit. It must also have onboard editing, data processing, and plotting capabilities--i.e., "field-finish" capabilities. It is clear that the future dictates that surveys cover the full bottom accurately and quickly.
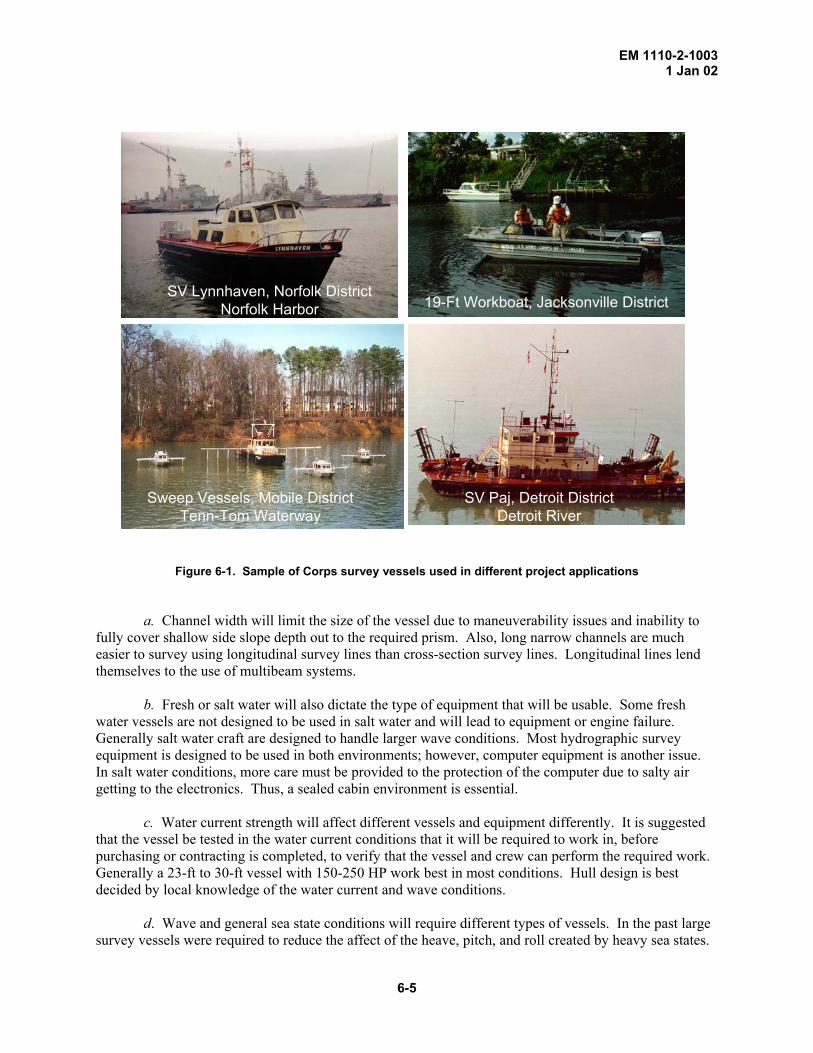
f. Turbidity and other water conditions have an effect on the type and make of the echo sounder to be used. Different echo sounders operate differently in turbid conditions. It is essential that the echo sounder used be initially tested in the working conditions that it will be expected to perform in. This test will provide an evaluation as to which type of equipment will generally meet the survey requirements. When contracting hydrographic surveying it is important to verify the type of echo sounder that will be used, and if unsure of its performance, request a test. If there are others in the area using the same equipment, they may be referenced and that may suffice for the evaluation. 6-4. Selection of Appropriate Survey Vessel for Project Area A wide variety and number of survey vessels are used throughout the Corps. This would be expected given the Corps is by far the largest agency or organization in the world performing hydrographic surveys, and the types of water resource projects surveyed are highly varied. Corps surveys are performed using conventional V-hull boats, catamarans, tugs, open skiffs, LARCs, pontoon boats, underwater sleds, air boats, surface-effect vessels, swamp tractors, converted barges, jack-up barges, aircraft, and jet skis. Sizes of these platforms range from 14 ft up to 120 ft. Some of these vessels are depicted on Figure 6-1. Each district has unique project features and working conditions that dictate the type of vessel used. These may include project depth, inland or coastal navigation channels, geographical range of projects, personnel, dredging program size, and typical sea states encountered, to name a few. Selection of the most appropriate type vessel for the project conditions is critical to both production and cost. Larger vessels (greater than 26-ft) are generally more effective (and safer) on open ocean entrance projects; however, their daily operating cost is high. Smaller, trailerable boats (less than 26-ft) are more efficient on inland navigation projects and coastal harbors and entrances. They also provide more flexibility to rapidly mobilize between projects. Their daily operating costs are significantly lower than larger platforms. Smaller vessels are more subject to sea state motion, which can adversely impact data quality. Smaller vessels may not be able to effectively or safely operate in outer entrance channels of deep-draft coastal projects. Thus, a number of factors must be considered in selecting a survey vessel for a particular application. Some of the more important factors are discussed below.
6-4
EM 1110-2-1003 1 Jan 02
Sweep Vessels, Mobile DistrictTenn-Tom Waterway
SV Paj, Detroit DistrictDetroit River
SV Lynnhaven, Norfolk DistrictNorfolk Harbor 19-Ft Workboat, Jacksonville District
Figure 6-1. Sample of Corps survey vessels used in different project applications
a. Channel width will limit the size of the vessel due to maneuverability issues and inability to fully cover shallow side slope depth out to the required prism. Also, long narrow channels are much easier to survey using longitudinal survey lines than cross-section survey lines. Longitudinal lines lend themselves to the use of multibeam systems.
b. Fresh or salt water will also dictate the type of equipment that will be usable. Some fresh water vessels are not designed to be used in salt water and will lead to equipment or engine failure. Generally salt water craft are designed to handle larger wave conditions. Most hydrographic survey equipment is designed to be used in both environments; however, computer equipment is another issue. In salt water conditions, more care must be provided to the protection of the computer due to salty air getting to the electronics. Thus, a sealed cabin environment is essential.
c. Water current strength will affect different vessels and equipment differently. It is suggested that the vessel be tested in the water current conditions that it will be required to work in, before purchasing or contracting is completed, to verify that the vessel and crew can perform the required work. Generally a 23-ft to 30-ft vessel with 150-250 HP work best in most conditions. Hull design is best decided by local knowledge of the water current and wave conditions.
d. Wave and general sea state conditions will require different types of vessels. In the past large survey vessels were required to reduce the affect of the heave, pitch, and roll created by heavy sea states.
6-5

EM 1110-2-1003 1 Jan 02
Now with state-of-the-art motion reference units being able to eliminate most of these sea state effects, smaller survey vessels can be used. However, the vessel must be able to have a cabin sufficient to house the survey equipment, the vessel operator, and the equipment operator. The design should be as low to the water line as possible to make the vessel less subject to pitch and roll as possible. Generally if the roll exceeds or is maintained at seven degrees the vessel becomes too uncomfortable for continued survey operations.
e. Safety is a consideration for both in-house and contracted surveys. The survey vessel must be sea worthy at all times it is in use. The vessel should be designed with the concept of it being a survey boat and have all of the needed brackets and electrical fixtures permanently placed on the boat. If the boat has an over the side transducer mount, it should be fixed so that the mount can pivot and swing back if an object is struck. This can be done with a shear-pin or other similar device. Items should not be mounted on the vessel that will cause it to be open to the water if an accident should happen. Through-the-hull designs for mounting equipment should have the top of the well open to the deck so that any water forced into the well will simply flow onto the deck and then back into the water. Assignments as to who is responsible for safety need to be made clear and documented. The vessel must be designed to operate in the waters were the survey are routinely performed. Survey equipment must be placed in the vessel so as not to interfere with emergency exits or the pilot’s view of traffic over 360 degrees. In open ocean areas, life saving provisions must be made for the crew should the vessel sink. These include raft, survival suits, emergency beacon, lights, water, food, flares, and emergency radio. In areas near shore or in inland navigation systems, other provisions can be made, but they should be clearly spelled out. A contractor should provide a report on how they will handle safety situations on the survey job.
f. Weather plays a major role in the vessel design. Most survey vessels are provided with an enclosed cabin; however, in severe weather it becomes a requirement. When contracting surveys weather conditions are a factor in vessel selection. For example, it would be prudent to carefully inspect a vessel coming from Florida to do hydrographic surveying in Alaska. Likewise, a Gulf Coast surveyor may not have the right equipment for the Pacific Northwest due to different wave conditions encountered in the Pacific. Another factor is work areas with high heat and humidity conditions--these areas require air-conditioning to keep the equipment running.
g. Logistics is one of the day-to-day problems that the surveyor must deal with. Contractors
realize that they must be able to mobilize their boat to the survey site. Some districts have specific areas that a boat works and thus mobilization is not such a large issue. However, for the most part, districts, dredging firms, and A-E contractors must move their survey boat and personnel to a location easily and quickly. This usually means that the boat must be trailerable. There are varying degrees of trailerable boats. Some are legal only with special permits, escorts, signage, and limited routes and times. It is clear that a boat that does not require any special handling is preferred--and will best ensure that it can get to the project site when needed. This means the use of a trailerable boat 20 ft to 30 ft in length. Such length vessels are by far the most common used in the Corps--see Figure 6-2.
6-6

EM 1110-2-1003 1 Jan 02
Figure 6-2. Corps standard trailerable survey boat with twin outboard engines and enclosed work cabin (Surveyboat Boyer, St. Louis District)
h. Weather is an issue that is regional in nature and thus the survey plan must address this issue
with specific attention to adequate vessel design, equipment mounting, equipment selection, personnel training, and formal weather procedures. The survey vessel must be able to handle any of the expected weather condition it is to work in. If not, then special planning needs to be taken to insure that personnel are not exposed to weather the vessel cannot handle. Equipment mounts that work well in calm conditions may come lose, or worse, cause hull damage in storm conditions. If a vessel gets caught in a storm condition, then the mountings must be strong enough to hold. Some equipment will work well in calm conditions, but in storm or rough water conditions they may be operating outside of their performance range. Personnel should be trained in simple first aid and CPR. Also, they should be trained in the use of all the onboard safety equipment. Management should set out a formal guideline on evaluation of weather hazards, and make sure that the crew is aware of them.
i. Daily operating costs for a survey boat, crew, and survey party is another major factor. The daily operating cost is a function of vessel length, crew licensing requirements, and size of survey crew attached to the vessel. These cost factors are described in the chapter on A-E contracting. Typical costs for operating various survey vessels in the southeast US are shown in Table 6-2 below:
6-7

EM 1110-2-1003 1 Jan 02
Table 6-2. Average Daily Crew Rates Relative to Vessel Size (1998) Single Transducer -- USCG DGPS Beacon positioning … SE CONUS USACE Arch-Engr Vessel & Crew Size In-House Contract Rate 26-Ft --4-man crew $1,590 $1,175 26-Ft --3-Man crew $1,340 $1,000 26-Ft --2-Man crew $1,090 $ 825 24-Ft --1-Man crew $ 687 $ 650 (est) 30-40 Ft -- 3-Man $2,200 n/a 50-65 Ft -- 4-6 man crew $3,350 to $4,100 n/a
The higher rates for the larger vessels are readily apparent in the above table. This is primarily due to the increased operation and maintenance costs and requirement for USCG licensed operators. Vessel utilization is another factor: there must be a sufficient deep-draft coastal workload to ensure a 65-foot vessel can be utilized year-round. Utilization is the main factor behind the lower rates for A-E contract forces.
j. Data processing and editing should be done on the boat if it has an enclosed cabin. Plotting
can be difficult in limited space or if humidity affects the paper and pens. If it is required to plot at the site, a better choice may be a trailer or van, with data being delivered periodically from the data collection boat. The person who collected the data should perform all editing and processing.
6-5. General and Specific Survey Planning Development of a general survey plan and subsequent site specific survey plans will create a more efficient survey. The general survey plan addresses the general way that surveys are planned, performed, and processed. This plan must be well thought out and robust to account for as many contingencies as possible. This plan includes training, software, equipment maintenance and upgrades, logistics, all data requirements, schedule, safety, and weather. It may seem that some of these items defy planning; however, the effort must be made. The site specific survey plan will address local notifications, survey lines, datum, data density, and specific equipment and personnel that will meet the general survey plan requirements.
a. Training is probably an ongoing consideration by any surveyor due to constant changes in technology. A complete training program should be laid out for each employee for the equipment and software that that employee is expected to use. As these items are updated, continuing education should be a standard issue in evaluating training needs. Contractors should provide their training background on their equipment and software when being evaluated. This is usually contained in the Standard Form (SF) 154/155 A-E evaluation submittals.
b. Software is critical to the overall survey system. It would take an entire manual to adequately detail software guidelines and requirements, and that is not the intent of this section. However, the software must be robust and free from errors in data collection and processing. The software must perform all required functions with a minimum of training and confusion. It is critical that the software provide data quality control in a fashion that allows real-time or near real-time quality control on the survey boat. And, as a minimum, it must provide X-Y-Z digital files that can be used in a surfacing program to create contours. It may be easier to construct survey lines in one piece of software, export
6-8

EM 1110-2-1003 1 Jan 02
those to the data collection software, then edit the collected data on a third piece of software, and produce final versions on a forth piece of software. This may be the quickest, but keep in mind that this requires acquiring, learning, upgrading, and maintaining four different software programs. Thus, a software package that encompasses most of these features is desired.
c. Equipment will have the largest initial cost, and locks the surveyor into a particular way of doing business. Some equipment will lend itself to particular types of surveys and others will be more general in use. It is paramount that a thorough general plan be in place and have USACE approval prior to purchase of equipment. The same holds for contractors: they will use the equipment they have or can obtain (lease or purchase) to do the work. It is important that their equipment meets the overall survey plan.
d. Data requirements are being set by different end users of the data. Some of the Corps of Engineer's customers are the harbor pilots, port authorities, levee boards, commercial tug and tow operators, harbor maintenance groups, National Oceanic and Atmospheric Administration (NOAA), coastal engineers, general recreational boaters, and environmentalists. Each user has a different use for the data and in some cases a different data requirement. The purpose for the survey will usually dictate the data requirement (data density, data coverage, and data precision). However, if there is no impact to cost and schedule, then as many requirements should be addressed as possible in the survey plan.
e. Schedule is often a critical element in a hydrographic survey plan. The data requirement usually has as a specific deliverable date assigned, such that the survey data collection and processing occur within a very specific time frame. This requires that the personnel and equipment resources be adequate to meet this need. In some cases, if the schedule cannot be met, then the survey simply will not be requested and other sources will be used. Considering this, it is important to plan and analyze all aspects of a general survey plan with the ability to meet schedule as a prime element of the plan. In evaluating contractors, it is also import to evaluate their ability to meet schedule and the district’s ability to contract in a timely manner.
f. Safety is a key element in any plan. This is true for surveying in general and, in particular, hydrographic surveying. It can not be emphasized enough to survey crews that safety is first and production is second. If the general survey plan or the site-specific plan omits or is lacking in safety then it is a bad plan. It is incumbent on the person in charge in the field to evaluate every situation for possible hazards. If there is an identified hazard, then it needs to be addressed before continuing with the activity. Contractors are held to the same degree of safety that Corps employees are held to. The Corps safety manual covers general safety, but does not address all of the safety issues that can happen aboard a survey vessel. These items need direct management input and resolution.
g. Notifications to the Coast Guard, and the local harbormaster office should be made with enough time to allow them to notify the local boaters of the survey. This notice should include a simple map showing the survey area.
h. Survey lines for multibeam surveys (showing the course the survey boat should travel while collecting data) should follow the contours of the harbor bottom. This will reduce the changes in bottom coverage created by different water depths. However, when using a single beam survey system, the lines should run perpendicular to contours. This will help in determining changes in the bottom relief. Survey lines for multibeam surveys should not be too long. Long lines will generate large data files that are difficult to edit. Thus a long entrance channel might be broken up into 10,000 ft segments. Multibeam survey lines also need to be spaced so as to achieve the proper amount of overlap or data density to meet the survey standard, as described in the following section in this chapter.
6-9

EM 1110-2-1003 1 Jan 02
i. Vertical project datum refers to the particular reference point or plan that the survey is measured from. These datums are commonly referenced to an elevation or a sea level. Rivers have slopes that must be correctly modeled in order to obtain a constant reference plane. Lake and reservoir datums differ based on their location. The Great Lakes has a datum that is unique to each major lake. The ocean has more than one datum. The most common to navigation is Mean Lower Low Water (MLLW). This datum is established by NOAA. NOAA's tidal monuments are the reference that must be used to establish MLLW or transfer it to other points in the project. When a survey is performed, an integral part of the data for that survey is the reference datum. It is required, by good survey practice, to clearly indicate by note on the published survey the actual vertical reference monument used, and the procedures used to establish the datum for the survey.
j. Data density will vary based on method of survey, water depth, and need. The method of survey will be determined by equipment available for the survey, the personnel, and survey site conditions. If only a single beam survey system is available, then data density will be less; unless the survey lines are about a half-meter apart and the boat operator can stay exactly on line. With a single head, multibeam system, the greater the water depth the less dense the data will be, unless multiple passes are made. It should be noted that data redundancy and data density are not the same thing. Data density is the number of soundings per unit of area, while data redundancy refers to data overlap or data collected at a different time at the same location. The type of survey defines data redundancy or data overlap requirements--refer to Chapter 3. Full coverage surveys deal more with data density insuring that the whole bottom is measured. These items need to be clearly understood by those requesting the survey and those doing the survey to insure compliance with the standards in this manual.
k. Specific equipment requirements fall into two groups. The first is operational equipment such as vehicles, safety gear, and radios. The second is survey equipment such as echo sounders, GPS, and lead lines. It is important in either case to standardize the equipment as much as possible to limit training, maintenance, and mistakes. Contractors that have mixed equipment must have their personnel trained in all the equipment to insure that mistakes will be limited. Management must have in place some sort of equipment plan for each type of project, and insure that the personnel are aware of that plan. Again, safety equipment is of no value if some personnel do not know of the equipment and/or how to use it.
l. Personnel for the survey must be qualified to perform the survey. Qualification can be determined by past experience if that experience is with equipment and methods being used for the particular survey mission. Another qualification is documented training in the equipment and methods. Training or experience, or both, must address all operational and survey equipment and procedures. The number of personnel required to perform a survey mission can vary due to survey method and operational concerns, but the minimum number required is the number to operate safely. 6-6. Data Management Data management relates to transporting, processing, presentation, and archival/retrieval of survey data. In modern hydrographic surveying vast amounts of quality data can be generated very quickly. With the advances in digital terrain modeling (DTM) programs and CADD, the need for this type of geospatial data is growing. A solid plan must be in place for moving data from place to place physically, processing the data, preparing the required deliverable product(s), and achieving this in such a way as to promote data retrieval and use.
a. Moving data physically or by some digital communications system is critical for the hydrographic surveyor. With modern data collection systems, collecting gigabytes of data per day is increasingly common--see Table 6-3 below. The general survey plan must have as a major component the movement of the data from the survey vessel to the office. This will vary from location to location,
6-10

EM 1110-2-1003 1 Jan 02
and the type of equipment in the survey vessel and the survey office. The system needs to be simple and yet robust due to the environment it is exposed to. It is important to always ensure the data is backed up in two places.
Table 6-3. Increase in Data Collection Density since 1960 1 Method Soundings/Hr Ratio Tag/Lead Line (<1960) 20 1 Topo/Total Station 40 2 S/B Echo Sounder >1960 21,600 1,080 Multibeam (EM-100) >1992 292,400 14,620 Multibeam (EM-1000) 324,400 16,200 Multibeam (EM-3000) 1,500,000 75,000
(450 MB/Hr) LIDAR/SHOALS > 1990 1,400,000 70,000
(3,000 MB/Hr) 1 per Survey Crew ... Drop from 5-7 persons (tag/lead line)
to 2-3 persons (multibeam)
b. Processing data in the district office must be carefully planned. It is easy to get confused and
inadvertently delete important data files or apply incorrect tides or velocity files. It is also important to train personnel not only in the use of the software, but also in the proper interpretation of the data. If at all possible, the data collector is the preferred data editor. It is important to not over-automate the editing processes and inadvertently remove objects that do exist. This will require prudent and limited use of automated editing features of the software, and ensure that each anomaly is identified by a qualified person. This is time consuming; however, the mistake of removing something like a large rock that actually exists from the survey is not acceptable.
c. Deliverable products can range from the raw data files to completed hydrographic maps with digital surfaces. The Corps is required to submit its survey data to NOAA for inclusion in their navigation charts. The format of that data changes from waterway to waterway and through time as NOAA updates their methods and products. It is important to stay current with NOAA and adjust the general survey plan to accommodate their needs. Once NOAA converts its charts to the metric system (they have not converted as of 2001) standards for data presentation will change to meet metric requirements. Some of those changes are that text height will be three millimeters, grid ticks will be every 0.1 meters on charts, plots will be on metric sized sheets, and that scales will be replaced by ratios. A rule of thumb is that data density for engineering purposes (volumes and contours) is an average of all edited soundings in a three meter square given the coordinate of the center of that square. Another rule is that plotting at ratios of 1:2,000 or 1:3,000, the density should be about one sounding every 15 meters, and this sounding should be the sounding closest to the center of the 15-meter square. The use of a non-averaged sounding near the cell center (or centroid) means that the plotted data represents real measurements and not calculated measurements. It is becoming more common in industry to supply digital data as the main product. This has the advantage of being more easily used in DTM and CADD programs; however, if there is a requirement to sign the deliverable or place a stamp or seal on it, then the digital file will have to be supplemented with a hard copy of the survey. This will change as electronic certification procedures are put in place.
d. Data archival and retrieval are required, and good business. The Corps has a FGDC mandate to make their hydrographic data available through the Internet. Equipment and systems must be in place or developed to move this data to the Internet to make it available to the public. Currently the best
6-11

EM 1110-2-1003 1 Jan 02
methods are to place the data in a district or USACE Internet server or on media such CD-ROM. The data must also be placed or referenced on the Geospatial Data Clearinghouse--refer to EM 1110-1-2909 (Geospatial Data and Systems) for details on USACE data archiving and retrieval requirements.
6-12

EM 1110-2-1003 1 Jan 02
Section II Planning Survey Coverage This section provides guidance for determining the amount of coverage needed for surveys of Corps navigation, coastal engineering, and flood control projects. It provides additional guidance to supplement the survey coverage requirements in Table 3-1. 6-7. Density of Data and Line Spacing Minimum requirements for survey coverage are prescribed in Table 3-1. These are minimum standards and may need to be adjusted based on project-specific requirements. The density of bathymetric data collected is determined by a number of project-dependent factors. Some of the considerations used to determine the required data density and the survey coverage needed to obtain that data density include:
• Type of construction project (dredging, rock placement, revetment construction, etc.) and related site investigation requirements.
• Survey data collection equipment (lead line, analog echo sounder, multiple-array acoustic
sweep system, automated data collection, etc.) capabilities and limitations.
• Subsurface relief (rock, sand, silt, probability of intermediate pinnacles or shoals requiring development, etc.).
• Project economics (costs of surveys relative to engineering and design costs and estimated
construction costs).
• Method of construction payment and/or computation thereof (in place, daily unit rate, average end area, triangulated irregular network, etc.).
a. Single-beam line spacing and alignment. From the above evaluation, a line spacing is selected which will provide the necessary density of coverage--or overlapping coverage in the case of swath survey systems. On dredging projects, the survey line spacing will govern the amount of coverage over a given project area, regardless of whether lines are run as cross-sections or run parallel to the project alignment (profiles or longitudinal lines). For single-beam cross-section surveys, data density usually covers less than five percent of the project by area. From this relatively low density, quantity computations are estimated, the major assumption being uniformity of terrain between successive survey lines or sections. This is normally a valid assumption. It becomes invalid if abrupt changes occur between lines, in turn causing inaccuracies in quantity take-offs made using average end area methods. The line spacing densities indicated in Table 3-1 are considered to be representative for USACE construction and dredging activities. Maintaining these criteria will ensure USACE-wide uniformity on contracted construction projects. In areas undergoing construction, or where shoals or other irregularities occur, the line spacing shall be made closer in order to detect and depict the full extent of irregularities. Far wider spacings are specified by project engineers for non-navigation surveys, such as river sections for hydraulic models, reservoir sedimentation studies, and coastal engineering transport studies. Cross-sections are nearly always run normal to the project's centerline alignment, as shown in Figure 6-3, or relative to a fixed baseline located ashore. These could include levee baselines or beach construction baselines or setback lines. Project alignments may be straight, circular curves, or transition curves--cross-sections are run normal to the line or curve tangent. Exceptions may occur in turning basins, wideners, or other irregular shaped areas.
6-13

EM 1110-2-1003 1 Jan 02
Sections must extendoutside channel toeto fully develop side slope(150 to 200 ft typical)
Cross-sectionsspaced 100 ftor 200 ft C/C)
40x400 ft channel
DREDGE PAYMENT SURVEYS
Figure 6-3. Cross-section coverage of a typical navigation project
(1) Data acquisition packages (such as HYPACK MAX) have a variety of features to set up survey lines relative to a project or channel alignment. These are found in its LINE EDITOR and CHANNEL DESIGN programs. Both straight or curved survey lines can be generated. Survey lines can be set up to cover turning basins--see example at Figure 6-4. Included with the cross-section alignments are the channel turning point coordinates along with side slope grades. This data is used for subsequent end-area volume computations.
6-14

EM 1110-2-1003 1 Jan 02
Figure 6-4 HYPACK MAX planned survey lines covering channel and adjacent turning basin including channel limits and side slope parameters
(2) HYPACK MAX can also be configured to optimize spacing of cross-sections through varying channel baseline alignments, as shown in Figure 6-5. This so-called SMART CORNERS option can be used to simplify average-end-area volume computations in these irregular areas; however, in this example, a TIN model might be an easier method of computing dredge quantities.
6-15

EM 1110-2-1003 1 Jan 02
Figure 6-5. HYPACK MAX "Smart Corners" generated planned survey lines covering irregular channel alignments--cross-section alignment varies over channel intersections
b. Multibeam coverage and line spacing. Acoustic multibeam sonar systems provide full-bottom coverage from a single acoustic transducer. Entire cross-sections of a channel can be generated many times a second. Multibeam systems are now capable of providing full-channel coverage surveys in near real-time, including on-board data processing, editing, color plots, and CADD files for direct import into MicroStation or AutoCad platform. Quantity computations using full digital terrain models acquired from multibeam data are significantly more accurate than average-end-area quantity take-offs from single beam cross-section surveys. These computations can also be performed directly in the field. The primary application for multibeam systems is for surveys of deep-draft navigation projects--typically those projects over 20 ft in depth. Multiple transducer systems are more effective in shallow draft projects when full-bottom coverage is required for channel or clearance requirements. Multibeam swath widths typically range from twice to seven times the water depth. Thus, for a 45-ft project, a 200- to 300-ft swath can be obtained with a single pass. Figure 6-6 depicts full swath survey coverage of a 400-ft-wide deep draft channel with two vessel passes.
6-16

EM 1110-2-1003 1 Jan 02
40x400 ft channel offsets
150 deg multibeam lines run parallel to channel centerline
0 +85-85
PROJECT CONDITION SURVEYS (Multibeam)
(-) 85 + 850
Figure 6-6. Project condition survey coverage of a deep-draft navigation project with two 150-deg multibeam passes
(1) Multibeam line spacing ("L") and the number of longitudinal lines ("N") for a typical navigation project can be computed using the methods shown in Figure 6-7. The depth (d) is the average project depth. The sidelap (s) should be set such that overlap exists between the parallel multibeam swath lines and the toes or side slope limits. Sidelap is intended to compensate for survey line steering limitations and/or duplicate coverage requirements. A 50% sidelap would provide duplicate bottom coverage if there were no steering misalignment. For a project condition survey where coverage is only required between the channel toes, an allowance should be made for vessel steering misalignment. If the steering accuracy is +20 ft, then the channel width should be increased by at least that amount to ensure full coverage between the toes. When duplicate bottom coverage is required throughout the channel (i.e., 50% sidelap), additional lines should be run on each channel toe.
6-17

EM 1110-2-1003 1 Jan 02
d
L
a
s
Channel width = W
Given:a = Multibeam swath angle (deg)d = depth beneath transducer (ft)s = swath sidelap (%)
Treat side slope coverage separately based on varying depth up slope (more compressed line spacing may be required)
Find: Number of Multibeam linesrequired in channel
Nominal line spacing “L”: L = 2 d tan (a/2)*(1 - s)
Required number of lines: N = | W / L | + 1
Figure 6-7. Computing multibeam line spacing on a navigation project given array width, project depth, and overlap requirements
(2) The following examples illustrate line spacing computations for multibeam surveys:
Given: Project Condition Survey of 40x400 ft channel (no coverage of side slopes required) 10% overlap between multibeam lines
a = 150 deg multibeam swath angle d = 40 ft project depth s = 10%
at 10% overlap, s = [2d tan (a/2)] · 10%) = 30 ft
Line Spacing: L = 2d tan (a/2) · (1-s) = 2 · 40 · tan (75 deg) · (1 - 0.1) = 269 ft … 270 ft
Number of lines: N = | 400 / 270 | + 1 = 2 Since the two lines easily cover the channel area, they would be spaced to provide overlap along the toes and with each other. If a 20-ft steering accuracy is assumed, then the two lines would be run along channel offsets (+) 85 ft and (-) 85 ft from the centerline. The line spacing in this case would only be 170 ft, resulting in considerable overlapping coverage in the channel center plus a 20-ft tolerance outside the toes. Running offsets + 100 ft would be adequate for this coverage as well. This line spacing is depicted back on Figure 6-6. If, in the above example, a more realistic 120 deg multibeam array is used, then the line spacing would be reduced as follows:
6-18

EM 1110-2-1003 1 Jan 02
Line Spacing: L = 2d tan (a/2) · (1-s) = 2 · 40 · tan (60 deg) · (1 - 0.1) = 125 ft The number of lines required to cover the channel between the toes is: Number of lines: N = | 400 / 125 | + 1 = 3 + 1 = 4 If the multibeam array is restricted to 90 deg, as might be the case in a pre/post dredging survey, then the following line spacing would result for the same project:
Line Spacing: L = 2d tan (a/2) · (1-s) = 2 · 40 · tan (45 deg) · (1 - 0.1) = 72 ft … use 75 ft The number of lines required to cover the channel between the toes is: Number of lines: N = | 400 / 75 | + 1 = 5 + 1 = 6 If duplicate coverage were required for this project, the sidelap would be increased to 50%, resulting in the following line spacing:
Line Spacing: L = 2d tan (a/2) · (1-s) = 2 · 40 · tan (45 deg) · (1 - 0.5) = 40 ft
Number of lines: N = | 400 / 40 | + 1 = 10 + 1 = 11 The above computation is based on coverage between the channel toes. Additional lines may be required for side slope coverage. For a dredging pay survey where multibeam side slope coverage is required, the line spacing computed above will have to be decreased to account for the shallower depths along the slope.
(3) From the computed number of lines, an estimate of total lineal multibeam survey miles can be computed. Given known survey speed and daily rates, the time and cost to conduct the overall survey can be determined.
c. Multibeam transducer arrays can be configured to obtain coverage in a variety of methods. These methods are highly project dependent. Swath systems for dredging work (i.e., developing pay quantities) generally are set vertically to cover twice water depth. The sensor can be tilted to map vertical bulkheads, flood walls, levees, bridge piers, and the area beneath moored vessels. Towed sensors can be used to detail deep excavations, pipelines, and other objects. Use of multiple sensors is also common.
d. Multibeam survey methods do have an advantage over the multiple transducer sweep systems in that the spacing of the boom-sweep transducers is required to be matched to the depth of the project being surveyed. If the transducers of a boom-sweep system are spaced for deep-water project surveys, the transducer spacing must be reconfigured for shallow water projects. If this is not done, large gaps in coverage could result. If the vessel normally is configured for shallow water surveys, then transducer interference may occur while surveying deeper areas of a project. On the other hand, multibeam coverage in shallow-draft navigation projects is limited, generally rendering these systems impractical to use. Multiple transducer boom systems are capable of providing more efficient full-bottom coverage in shallow-draft projects.
6-19

EM 1110-2-1003 1 Jan 02
6-8. Survey Alignment (Cross-Sections and Longitudinal Sections) Longitudinal section surveys are often more practical to conduct than cross-section surveys. Full sweep systems are normally always run longitudinal with the channel alignment. When single-beam echo sounders are used, cross-section surveys provide a more definitive depiction of the channel or bank's toes and slopes, which may be critical to engineering design and/or construction acceptance. In USACE, many districts run cross-section surveys for construction payment work and longitudinal surveys for general project condition reports. Although cross-section alignments are preferred, safety considerations in some areas may dictate that longitudinal alignments be run. River and coastal beach sections are normally run as sections perpendicular to the bank or flow. If construction is involved, survey alignment and payment methods must also be adequately described in the construction contract specifications. a. When single-beam longitudinal surveys are performed for contracted construction measurement and payment, a smaller line spacing should be specified than that shown in Table 3-1. Given the usually large excavations taken from the side slopes, 25-ft C/C spacing up each slope is usually required to obtain sufficient detail. Average end area volumes should be computed by mathematically cutting cross-sections from the longitudinal database. Sections should be derived at 100-ft C/C intervals; however, smaller intervals (25- or 50-ft spacing) may be used if end area variations are excessive. b. Swath survey systems are more effective if run in a longitudinal alignment. This includes multiple-transducer boom array systems and multibeam swath systems. These full sweep systems will provide 100% coverage, and all recorded data may be used to derive pay quantities. 6-9. Positioning Intervals The interval at which position fix updates are taken depends on whether manual or automated electronic positioning methods are employed. Tag line positions are typically taken at 25-ft intervals; automated EDM or DGPS positioning systems provide (and record) positions at intervals based on time or preset distances (e.g., every 1 sec or 10 ft). DGPS position outputs are typically 1-sec intervals. Systems updating positions at denser intervals should use (and record) the smallest interval available. 6-10. Depth Recording Density Sounding equipment shall be configured to record depths at the maximum possible rate. Depth collection density is usually input into a data acquisition system in microseconds. The entire database shall be used in computing pay quantities.
6-20
EM 1110-2-1003 1 Jan 02
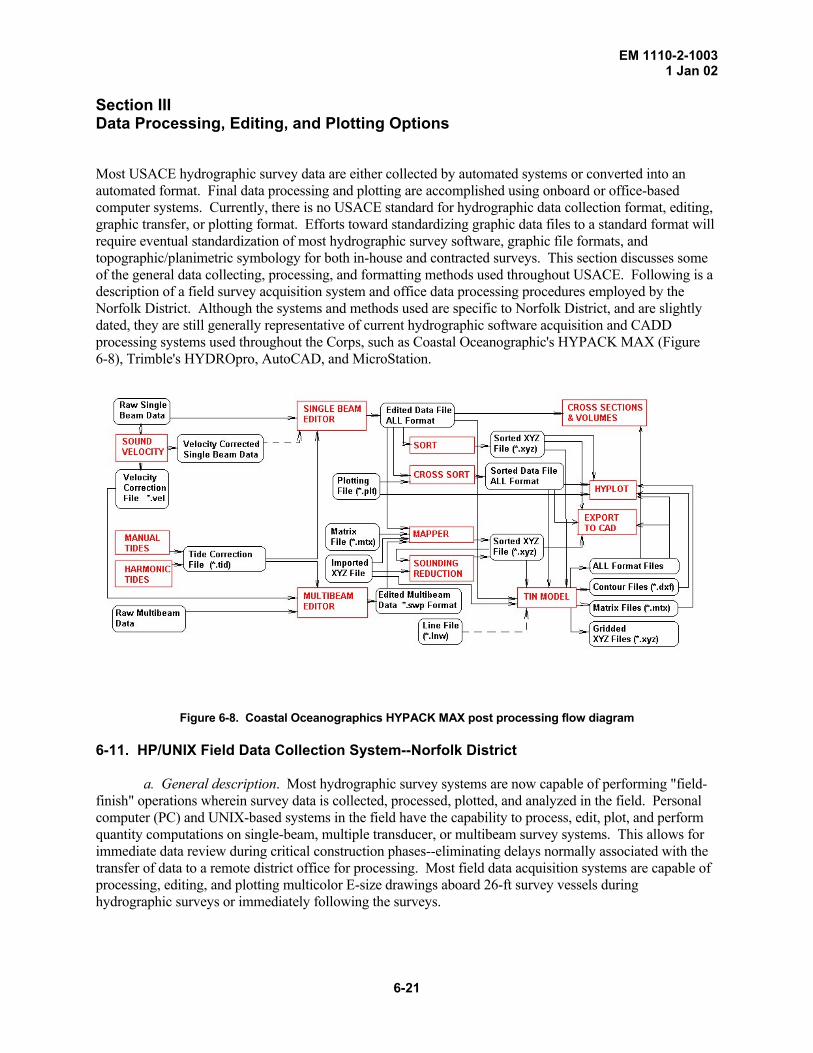
Section III Data Processing, Editing, and Plotting Options Most USACE hydrographic survey data are either collected by automated systems or converted into an automated format. Final data processing and plotting are accomplished using onboard or office-based computer systems. Currently, there is no USACE standard for hydrographic data collection format, editing, graphic transfer, or plotting format. Efforts toward standardizing graphic data files to a standard format will require eventual standardization of most hydrographic survey software, graphic file formats, and topographic/planimetric symbology for both in-house and contracted surveys. This section discusses some of the general data collecting, processing, and formatting methods used throughout USACE. Following is a description of a field survey acquisition system and office data processing procedures employed by the Norfolk District. Although the systems and methods used are specific to Norfolk District, and are slightly dated, they are still generally representative of current hydrographic software acquisition and CADD processing systems used throughout the Corps, such as Coastal Oceanographic's HYPACK MAX (Figure 6-8), Trimble's HYDROpro, AutoCAD, and MicroStation.
Figure 6-8. Coastal Oceanographics HYPACK MAX post processing flow diagram 6-11. HP/UNIX Field Data Collection System--Norfolk District
a. General description. Most hydrographic survey systems are now capable of performing "field-finish" operations wherein survey data is collected, processed, plotted, and analyzed in the field. Personal computer (PC) and UNIX-based systems in the field have the capability to process, edit, plot, and perform quantity computations on single-beam, multiple transducer, or multibeam survey systems. This allows for immediate data review during critical construction phases--eliminating delays normally associated with the transfer of data to a remote district office for processing. Most field data acquisition systems are capable of processing, editing, and plotting multicolor E-size drawings aboard 26-ft survey vessels during hydrographic surveys or immediately following the surveys.
6-21

EM 1110-2-1003 1 Jan 02
(1) The automated hydrographic survey system is based on the UNIX operating system, which allows it to be both multitasking and multi-user. This means that, along with the many on-line real-time abilities, when more than one operator is monitoring the real-time data collection, another may view and compare previous data. The on-line screen is capable of displaying a variety of information to both the surveyor and the boat operator. Distances to line, toes, and end point are displayed in feet and are color-coordinated to help in determining position. Speed (in knots) and depth (in feet) are shown in the lower left corner of the video screen. The lower right window is used to display various messages and outputs (discussed later). The middle right window is used to display a cross-sectional plot of the project; toes and other significant features can be input and displayed. The upper right window is used to display a real-time vertical plot of the cross-section. Toes are displayed in red. A depth (usually project depth) is displayed on this screen at a 75% position of the vertical screen. The toes and depth bar help to form a template to allow a fast assessment of data. A previous vertical display of the same cross-section can be loaded into memory and displayed in real-time to allow the system operator the opportunity to compare the historical and current cross-sections. All depths on this screen are corrected for tide, if the tide information was collected in real-time. (2) Data are collected in two types of formats: dense and plan. The dense depth information is collected at a rate of 5 soundings/sec. The dense positional information has an update cycle of once per second. During the post-plot, a position can be determined on any sounding by interpolation. Under normal survey speeds, depths are recorded approximately every 2 ft. Coordinates are provided approximately every 10 to 12 ft. The plan format of information is recorded at an operator-set distance relative to the navigation channel toes. For example, if the operator enters 25 ft for this distance parameter, a family of lines spaced 25 ft apart will be displayed to the video screen. As the vessel passes over the lines during a cross-section pass, the sounding closest to the line will be stored. Because the depth recorder outputs 10 soundings/sec (and the survey vessel speed is approximately 10 ft/sec), the soundings assigned to these positions are usually within 1 ft horizontally. (3) The system has several modes of operation and allows the operator to turn on or off these various functions: (a) AUTOMARK: The system will start logging data when the vessel reaches a pre-set distance from the navigation channel toes. (b) AUTOBREAK: The system will stop logging data when the vessel reaches a pre-set distance from the navigation channel toes. (c) TRIANGLES: The operator can remove any pair of distances used for the solution of the vessel's position. (d) BOTTOM SAMPLE: Another display is added to the upper left part of the screen, and this corresponds to the distance to the end of the line entered. This display changes colors when the survey vessel passes the point. (e) RECON: Surveying may be performed in a "recon" style. No toes are necessary, and sounding will start from keyboard initialization and end with a keyboard command. (f) SIDE-SCAN: Used when a fix mark is to be annotated on any other device than the depth recorder roll. (4) The operator also has a wide range of options to use to meet the specific requirements of the survey. The operator can determine the baseline relationships of the microwave positioning shore stations,
6-22

EM 1110-2-1003 1 Jan 02
edit parameters real-time, view and edit logged data, and display historical or pertinent data. The system operator, at any time, may ascertain the quality of his navigation system. When requested, the system will display a residual for each pair of ranges in use. This residual is the distance (in feet) by which the observed pair of ranges missed the final computed solution. The final computed solution is obtained by an angle-weighted least squares solution of the triangles in use (condition equations). Also displayed is the angle formed by each pair of the ranges used in the position solution. The operator may remove any range-pair considered too pointed (< 35 deg) or flat (> 145 deg) from the final coordinate position solution. Newer applications with DGPS positioning can provide GDOP, HDOP, or VDOP quality data to allow real-time assessment of positional accuracy. (5) All of the recorded data are logged onto the hard drive of the computer and then transferred to a floppy disk at a later time. Through the use of other programs aboard the boat, and by keeping the raw data on the computer hard drive, the operator is able to compare various surveys of the same site prior to submittal. This also provides insurance against lost data (lost floppies, office computer crashes, etc.).
b. Processing and plotting operations--Norfolk District office. After the initial field work is done, a survey must undergo several procedures and checks before it can be converted to a usable form. There are a wide variety of uses for a processed survey; this procedure outlines the necessary steps used at Norfolk District to convert raw field data into a finished survey with map and volume computations. Following are the major steps involved in processing a hydrographic survey. (1) Converting soundings to depths (coastal projects). On some jobs (usually when the vessel is surveying relatively close to the gage without the need for tidal zoning), the gage reading is entered directly into the computer following a reception of this information by radio. The gage reading is recorded to disk with the soundings. In this case, depths are computed directly from the sounding and tide information. Conversely, for project surveys at a distance from the gage, tidal zoning adjustments are necessary to align the tide staff readings with the tide state at the survey vessel location. In these cases the tide gage information must be entered by the processor in the office. The tide readings are adjusted first in time units and then in ratios of the tidal ranges at the staff and vessel locations. (2) Interpolating positions. Soundings are typically collected by the survey vessel at a rate of approximately 5/sec. Large amounts of data are being collected in a real-time mode, so the computer does not have time, nor is it necessary, to apply a coordinate value to every sounding. It therefore attaches a coordinate to every fifth sounding (one every second). Soundings are plotted on maps by coordinates, and all soundings are used when doing volume computations, so it is necessary that all soundings have coordinate values attached. A computer program is used to interpolate between soundings that have field-generated coordinates and then to apply coordinates to the intermediate soundings as necessary. (3) Sorting survey lines. A hydrographic survey consists of rows of soundings usually taken perpendicular to the centerline of the channel. Each row or line has a section number and a station number. In order to do volume computations and profiles, and overlap and check section comparisons, the surveys must start at the lowest station number and increase in ascending order. Due to field conditions and time restrictions the survey vessels usually cannot fulfill this requirement. Another processing program allows the processor to put lines in any order necessary to fulfill the requirements of the survey. (4) Scanning/editing bad soundings. While collecting soundings the depth recorder will, from time to time, generate some incorrect soundings. The most common causes for this are air bubbles or debris in the water column, temperature inversions, and even nearby sonar. A computer program is used to scan every sounding in the survey and display any soundings that fall outside the specified range. This allows the operator to either change the sounding or let it stand as is. This decision is based on the general trend of the surrounding soundings, where the suspect sounding is located within the section, the type of survey being
6-23

EM 1110-2-1003 1 Jan 02
scanned (condition, plans and specifications, before dredging or after dredging) and the operator's general knowledge of existing bottom conditions in that area. (5) Volume computations. Volume computations are necessary for a number of reasons, including payment to dredging contractors, beach and dike design, placement area capacities, channel design, and accretion rates, just to name a few. Depending on the purpose and the general shape of the surveyed area, one of three programs is used to determine volumes. On areas that are more or less rectangular in shape, volumes are computed with a program written in HP-UX BASIC using the average-end-area method. This program was written in-house and tailored to Norfolk District's specific needs. This program uses the processed survey (hydro) files to compute the number of cubic yards that occupy the user-defined templates. Although this program will compute up to four separate templates in the same run, they must be the same width and have the same side slopes. The only item that can vary is the depth. During program execution, a profile is drawn on the screen of each cross-section with the dredging template. A hard copy is generated showing the end areas of each cross-section at the design depth, the cumulative yardage at each cross-section at the depth, and the average distance between each section. On areas that are irregular in shape or have an unconventional dredging prism, a program by Accugraph Corp., MTX 900 (Mountain Top) is used. This is an interactive CADD/engineering package. There are currently two methods of computing volumes available within this program. Instead of using text files for their computations, both of these programs use DTM (digital terrain modeling) files. DTM files are nothing more than ASCII renditions (X-Y-Z point translation to CADD Files) of the hydrographic survey (X-Y-Z) text files. (a) The first method is included in the site design portion of the program and best lends itself to irregularly shaped areas. With this method the volumes are computed by geometric means and, therefore, no end areas or cumulative volumes per section are available, just the final volume. The CADD operator must first create a design surface to be compared to the surveyed bathymetry in order to generate a volume. (b) The second method comes under the "Roads" design portion of the program. Although only one template can be run at a time, the shape (number of bottom faces and/or side slopes) of the template does not matter. This program is best used when the dredging prism or design templates consist of more than one bottom at different elevations with numerous side slopes. The design template can actually include one or more arcs. With this method the computations are done by the average-end-area method and, consequently, the operator can specify a printout which will include the end area of the stations and cumulative volumes per station. In addition, the operator has the option to specify profiles of the sections plotted to any scale he wishes. The after-dredge survey must be compared to the proposed channel (design surface) in order to compute the volume. Although the figures were referenced from the road design method DTM using an average-end-area computation, the site design method using the irregular TIN computation could be used as well. (6) Creating a plot file. In order to plot the soundings on a map it is necessary to create a plot file. This is an ASCII text file that is created from the soundings in the hydro-file using HP-UX BASIC. The CADD system is then loaded, and the ASCII file is converted into an "easydata" file, which is a special Mountain Top drawing file. The entire file can now be handled like any other drawing file. The soundings now appear on the screen depicting the actual track lines that the boat took in the field. The size, interval, and rotation of the individual soundings are specified when the plot file is created and are determined by the scale and rotation of the map. Each sounding is located by Virginia State Plane Grid coordinates. This file can now be used in any mapping application desired. (7) Creating a DTM file. When creating a plot file the operator has the option to also create a DTM (digital terrain modeling) file. This is also a type of ASCII file; however, this file consists of nothing more than X-Y-Z points. These points, when read by the CADD system, are shown in only one size, and a point can have no rotation, so only the interval is controlled. Usually, the two files are created together and set up
6-24

EM 1110-2-1003 1 Jan 02
so that each sounding created for the plot file has a corresponding DTM point. As discussed earlier, a DTM file can be used for computing volumes, but it also has other uses, such as generating contours and 3-D models. (8) Contouring. When mapping hydrographic surveys, it is usually required that the survey be contoured at some given interval. The interval is based on the intended purpose of the survey. Using a DTM file, the CADD system has the ability to generate and label the contours at any interval specified by the operator. This feature is especially helpful on large jobs covering several linear miles. There are some limitations in this portion of the program, and it is important that the operator be aware of and know how to deal with them. Because most of the data is in the form of relatively straight lines anywhere from 100 to 400 ft apart, the computer is forced to draw contours across relatively large areas which are not supported by elevations. This problem usually manifests itself in the form of contours with large loops, contours crossing, contours passing through the same point, and contours with gaps. As all of these conditions are unacceptable, it is necessary for the operator to closely examine all computer-generated contours and correct them where necessary. Incorporating cross-check lines into the survey will eliminate most of these problems. (9) 3-D models. In many applications it is useful to create something other than a plan or elevation view of a project. The CADD system can be used to generate 3-D images of any DTM file. Several types of views can be created, ranging from perspective and isometric to triametric and orthographic. Having this type of versatility enables the object to be viewed at any angle, rotation, or elevation. After a wire drawing has been created, it can then be shaded to further enhance the 3-D effect. Although no valid horizontal positions or vertical elevations can be tied to these images, they are useful in giving the viewer an overall picture of terrain that may not be readily visible to the eye. Three-dimensional images are particularly helpful when implementing dike design for placement areas as well as beach replenishment designs. The operator is able to merge the dike or beach design with a DTM file of an existing survey of the area and then create a 3-D image showing the existing ground with the proposed structure in place. This is an extremely useful tool in conveying new concepts and/or ideas to persons not familiar with the project in question, or when trying to illustrate the impact (or lack of it) of a particular project on the surrounding area. (10) Use of layers. In recent years the drawing of maps has evolved from drafting tables to CADD workstations. Most state-of-the-art CADD systems have a feature called layering. The operator may put together any combination of elements in a drawing and set them to any of 256 different layers. This allows the operator to handle large amounts of information quickly and efficiently. Perhaps the biggest advantage for mapping purposes is that more than one survey can reside on a single base map. Due to limited storage space it is necessary to make the most efficient use of what space is available. Up to four surveys are put on a single base map by setting each survey and anything associated with that survey to their own series of layers. For example, along with the soundings that make up a plans and specification survey, the contours, navigation aids, typical sections, easements, dredging areas, notes and any other items associated with this survey would be set to a specific set of layers. Usually a spread of about ten layers is used for a survey and its related information. On a map containing multiple surveys, the operator need only turn off the layers he does not wish to view and he is left with a map tailored to the information and survey in question. After a map has been completed it is archived to an optical disk reserved for that purpose. The base sheet is then cleared of all surveys and related information and restored to the main mass storage to await the next series of surveys. (11) Plotting maps. A plot is usually begun by placing the channel lines on a blank sheet or computer screen in an orientation for maximum sheet coverage. Other easement boundaries that may impact construction are also shown. After a survey has been processed, the depths are placed on the sheet relative to the sheet rotation and the navigation channel alignment. Changes to navigation aids, adjacent shoreline, utilities, construction notes, and title blocks are made and placed on the drawing. The drawing is
6-25

EM 1110-2-1003 1 Jan 02
then plotted as a first draft with felt-tipped pens. The plotted drawing is circulated to engineers for final inspection or signature in the title block. Following this process the drawing is replotted with the final changes, signed, and distributed to the appropriate organizations. 6-12. Depiction on Drawings of Observed Positions and Depths Depths (or elevations) shall be plotted at the recorded position where they were taken. When fully automated hydrographic systems are used, positions/depths shall not be moved (i.e., smoothed) to the nominal track (cross-section) which was run. The depth shall be plotted at the observed coordinate obtained from the positioning system, and the decimal point shall represent the position. On manual positioning surveys in which no off-track deviation is recorded (e.g., tag line surveys), positions may be moved/smoothed to the nominal track run. Where sweep/swath systems are deployed, some data thinning may be required to plot individual elevations. Alternatively, color coding may be used in order to show all recorded depths. Cross-section plots (profile views) give the appearance of moved soundings, but the plots represent the projection of soundings along the best-fit cross-section (not the nominal section) through a measured survey section. Plot scales and formats should be selected to ensure clear delineation of desired details. Larger scale ratios should be used when needed to show survey information clearly. Depending on the nature or class of survey, any of three plotting formats may be used to depict hydrographic survey data. a. Plan. A vast majority of surveys are plotted in site plan mapping format. Dredge payment surveys are usually plotted at scales of 100 or 200 ft to the inch, depending on the structural detail required. For more detailed construction work, larger scales (e.g., 1 in. = 40 ft and 1 in. = 50 ft) are commonly used. The recommended plan scale is 100 ft to the inch; however, 200 ft/inch or 400 ft/inch may be used where routine maintenance work is involved. A disadvantage of plan format is the inability to portray all the collected data at a reasonable character size. To increase data density requires a scale reduction, which increases the number of sheets covering a project and subsequent reproduction costs. Plan data are usually contoured relative to an absolute reference datum or an intermediate face above grade. Planimetric data may be added to the drawings depending on the nature and purpose of the survey. b. Section. Section or profile views are used to depict dredging cross-sections. They are extremely useful in comparing and evaluating various surveys performed over the same cross-section, a common requirement in dredging work. Such comparisons are difficult to perform using plan views. Section views of channels and other construction work are typically drawn at scales of sufficient size to adequately detail construction placement/excavation. Horizontal scales of 20 ft/inch, 40 ft/inch, and 50 ft/inch are common for navigation projects. Vertical scales are usually exaggerated to either 5 ft/inch or 10 ft/inch in order to depict low-gradient side slopes (and provide a larger planimeter end area face). Usually, all recorded elevation data points can be plotted in section; however, the numerical value must be scaled from the drawing. Two-dimensional section plots cannot portray any along-section vessel misalignment. Section views are rarely used for project condition surveys. c. Profile. Profile sections from surveys run parallel (i.e., longitudinally) along the project alignment are typically constructed for project condition reports or centerline reconnaissance surveys/studies. Profiles of channel centerlines or quarter-points can depict an extensive amount of information in relatively compressed scales, and will readily portray critical above project grade spikes or shoals. The use of profile format can significantly reduce the number of sheets required to cover a given project. For example, a project condition survey requiring a total of 10 to 15 plan sheets at 1 inch = 200 ft can be effectively shown in one or two profile drawings at 1 inch = 5,000 ft.
d. Computer-generated drawings. The digital or hard-copy map or chart is the primary result of a project survey. However, each survey may generate other residual information sources, such as project field notes and geographic information system (GIS) or DTM databases of results. In the past, the graphical plot (in plan, section, and/or profile view) has been the finished product. However, with digital terrain mapping capabilities, the original survey data will reside in computer storage with an unlimited number of display
6-26

EM 1110-2-1003 1 Jan 02
and computational options available. When hard-copy drawings are generated from CADD files, the following general guidelines are prescribed.
(1) Conventional drawing size, content, and layout. Surveys should be plotted on a standard American National Standards Institute (ANSI) sheet size that is compatible with standard report and/or bid document sizes. The first sheet of a series shall contain the following data: project title and limits; construction contract number; reference grid system; vicinity and location maps; and the contractor's logo and certification/seal. In addition, horizontal and vertical control used for the survey should be shown by plan and/or tabulation. The classification, accuracy, quality control results (i.e., cross-line check results), and date of the surveys shall also be indicated.
(2) Grids. Coordinate grids should be plotted on each sheet so as not to exceed 5-in. spacing at final chart scale.
(3) Legend and notes. The first sheet of a series shall contain a legend indicating the physical interpretation of any symbols. Standard notes shall be added to describe all facets of the survey. General notes may be placed on the first sheet, and specific notes shall be placed on the applicable sheets. When two or more surveys are combined onto one sheet, the source and areas of the composite survey shall be shown by a note (or revision thereto). Information which is listed by note may include the following: horizontal control data (tabulate coordinates used); control survey techniques and equipment; source of control data; tabulation of benchmark elevations; vertical datum used with references and conversions; horizontal datum used (e.g., NAD 27 or NAD 83); state plane coordinate system and zone; depth measurement procedures and sectors where methods were employed; size and weight of sounding leads and plates used; navigational aid data (tabulated); positions in latitude and longitude; state plane coordinates, date located, location technique, and accuracy; referenced data sources (field book numbers and dates, database file for DTM data); field party information; survey vessel; firm; contracting agency and contract number; and drafting reviewers. The same data may also be inserted into the assigned Intergraph design file level when such a system is used. e. Data thinning routines. High density data sets cannot be plotted in plan view due to overlapping depths. High density sets may also be too large to efficiently process in volume routines. A number of methods are used in commercial data processing software to reduce the size of large data sets. These thinning routines typically use the TIN surface model to evaluate the terrain gradient in deciding which depths to eliminate. In flat areas, more depths can be eliminated without loss in overall model accuracy. In many cases, data reductions of 80% to 90% can be made in smooth terrain. Some software thinning routines use TIN contour density to eliminate data points in the TIN, as illustrated in Figure 6-9. Thinning of data sets for dredge volume computations is not recommended. These data sets may be thinned for plotting/display purposes.
6-27

EM 1110-2-1003 1 Jan 02
Not Necessary Because the Point Does Not Generate ANY Contour Crossings.
Necessary Since It Causes Contour Crossings
Figure 6-9. Contour thinning algorithm. The algorithm identifies those vertices not responsible for contributing to a single contour crossing in any of the triangles containing them. In addition, spikes can be automatically detected/removed by counting the number of contours enclosing an individual vertex within
one edge of that vertex. (Beacon Resources, Inc) 6-13. Data Transfer Standards and Formats Given the variety of automated hydrographic surveying systems in use throughout USACE (by both in-house and third-party contractor forces), it is not presently feasible or practical to specify a particular data format for recording field data. Recorded data elements should include, as a minimum, event date/time, adjusted position, and raw/ uncorrected depth (soundings). Related observations such as tide/stage/draft corrections, DGPS observables, calibration corrections, project orientation constants, and control station coordinates may also be optionally recorded in the database. Differential GPS systems can record geometry quality values (GDOP, PDOP, HDOP) which may vary during a survey. Automated systems should record uncorrected observations used to derive an adjusted depth. Corrections to these depth observations should be saved in a separate block or file or adequately recorded in a manual survey operation log. a. Spatial Data Transfer Standard (SDTS). This standard, which was developed and is supported by the U.S. Geological Survey (USGS) under the auspices of the Federal Geographic Data Committee (FGDC), is a feature-based standard that is intended to apply to any geographically referenced data. SDTS has been approved by the National Institute of Standards and Technology (NIST) and the American National Standards Institute (ANSI), and has a staff of personnel at USGS dedicated to maintenance of the standard. It has also been approved by the FGDC as a Federal Information Processing Standard (FIPS).
6-28

EM 1110-2-1003 1 Jan 02
SDTS is intended to enable complete and unambiguous digital data transfer between a sender and receiver. The standard is not required or intended for internal use, i.e., for transfer from field to office or contractor to office, although this use should be considered after the standard is further developed and becomes better suited to hydrographic data. (1) Because of its broad and abstract nature, SDTS requires application profiles, or specific sets of implementation rules and guidelines, for actual data transfer use. Currently, the only profile is the Topological Vector Profile, which is not well-suited to hydrographic survey data. However, an application profile for hydrographic data is being developed. (2) The designation of SDTS as a FIPS obligates all federal agencies to make their digital geographic data available to outside users in this format. Therefore, once a suitable application profile has been developed, districts that provide finished digital hydrographic survey data to non-USACE users need to embrace this standard, if the user requests data in this format. As stated above, this standard should also be considered for internal use. b. DX-90. The DX-90 Data Exchange Standard was developed primarily by the National Oceanic and Atmospheric Administration (NOAA) and has been adopted by the International Hydrographic Organization for hydrographic data. DX-90 is a feature-based standard and is similar to SDTS in many ways. However, DX-90 is intended solely for geographically referenced hydrographic data. An application profile within the standard is specifically for vector data from hydrographic surveys. DX-90 is well suited to coordinate data, such as hydrographic survey coordinates and point features. However, the standard has partial topology, meaning it may have difficulty transferring large, related geometric shapes, such as revetment outlines, complex shorelines, roads, etc. Note that DX-90 is not a FIPS, meaning that federal agencies are not obligated to use the standard for any application. However, use of this standard, when completed, for field-to-office transfer should also be considered for flexibility, efficiency, and independence of data processing systems. Note that when the standard is completed, software translators and detailed implementation guidance from USGS, NOAA, and/or USACE will be available. c. Proprietary and open standards. USACE districts currently use various CADD packages that each have their own proprietary graphics format, such as DGN (Intergraph) and DXF (AutoCad). Some of the more recent hydrographic survey systems may have the capability to output data in these or other formats. Software that creates Intergraph DGN files from ASCII X-Y-Z-Descriptor files is available through the U.S. Army Topographic Engineering Center to all USACE districts. This program, CVTPC (convert PC), enables the plotting of soundings and the placement of symbols in MicroStation. If a graphics file is not required for data transfer, then data in ASCII format is commonly recognized by survey system and CADD programs. Using such data, basic information, such as X-Y-Z coordinates, can usually be transferred in digital form. d. Terrain modeling. Most hydrographic data acquisition and processing software, and office CADD packages, now provide terrain modeling modules to allow input, modeling, editing, and analysis of 3-D models. A user has direct interface necessary to build a non-uniform space point files (XYZ file) that can be used to create triangulated models and/or gridded models. Triangulated models can be created by two methods, Triangulated Irregular Network (TIN) and Topological Triangle Network (TTN). A TIN file is a surface model created from an XYZ file. It is defined by a set of 3-D triangular facets, which are defined by lines drawn between the points that define the surface. The TTN file is a surface model created from an XYZ file and surface specific features, such as breaklines, obscure areas, faults and edges. These elements form an intelligent network that contains information about neighboring triangles. A grid file contains uniformly spaced data that can be derived from a number of sources including XYZ files, TIN and TTN files, digitized or scanned contours, or translated outside sources. After creating the appropriate files,
6-29

EM 1110-2-1003 1 Jan 02
the user can create and display the 3-D model. To interpret the terrain models, the operator has a variety of procedures available, including:
• 2-D and 3-D contour displays
• 3-D cross-sections
• 3-D profile models
• 2-D and 3-D triangulated models
• Color-coded elevation displays
• Color-scaled contours
• Shaded relief (both color and monographic)
• Stereo displays (3-D raised models)
The user also has the necessary procedures to edit the terrain model by adding, deleting, and moving points and inserting new profiles, area edits, noise removal, and arithmetic operations. Options are also available to perform analysis options, such as line-of-sight displays, intervisibility studies, volume calculations, and creation of slope or aspect models.
6-30

EM 1110-2-1003 1 Jan 02
Section IV USACE Standards for Survey Coverage, Processing, Plotting, and Archiving 6-14. Geospatial Data Standards and Requirements ER 11l0-l-8156, supplemented by EM 1110-1-2909 (Geospatial Data and Systems), establishes general criteria and presents policy and guidance for the acquisition, processing, storage, distribution, and utilization of non-tactical geospatial data throughout USACE. The policies contained in these documents apply to hydrographic survey data collected on navigation and flood control projects. These policies are in compliance with Executive Order 12906, Coordinating Geographic Data Acquisition and Access: The National Spatial Data Infrastructure (NSDI) and other appropriate standards, including the Spatial Data Transfer Standard/Federal Information Processing Standard 173, Federal Geographic Data Committee standards, and the CADD/GIS Technology Center (Tri-Service) Spatial Data Standards (SDS). EM 1110-1-2909 should be referred to for Corps policy on database development, data documentation, data quality assurance, data access, data archiving, data maintenance, data liability, data policies and coordination, and the appropriate use of Federal and Corps Geospatial data standards. Some of the highlights from ER 1110-1-8156 and EM 1110-1-2909 that specifically relate to hydrographic survey data are summarized below. . a. National Geospatial Data Clearinghouse (Clearinghouse). The Clearinghouse is a distributed, electronic network of geospatial data producers, managers, and users operating on the Internet. The Clearinghouse is a key element of EO 12906 and will allow its users to determine what geospatial data exist, find the data they need, evaluate the usefulness of the data for their applications, and obtain or order the data as economically as possible. USACE hydrographic surveys (especially project condition surveys and river charts) must be listed on this Clearinghouse.
b. USACE Clearinghouse Node. HQUSACE established and maintains a computer network server on the National Geospatial Data Clearinghouse. This node functions as the primary point of public entry to the USACE geospatial data discovery path in the Clearinghouse. A separate electronic data page for each USACE Command has been established on the server. The Internet Universal Resource Locator (URL) address for the USACE Clearinghouse node is http://corps_geol .usace.army.mil c. Database standards. EM 1110-1-2909 prescribes the following database standards, all of which have applicability to Corps hydrographic surveys.
(1) Data Format Standard -- FIPS PUB 173 Spatial Data Transfer Standard (2) Metadata Standard-- FGDC Content Standard for Digital Geospatial Metadata (3) Data Collection Standards-- EM 1110-1-2909, Chapter 11 (Accuracy Standards for
Engineering, Construction, and Facility Management Surveying and Mapping) and this manual (EM 1110-2-1003 (Hydrographic Surveying)
(4) Data Accuracy Standards -- EM 1110-1-2909, Chapter 11 (Accuracy Standards for
Engineering, Construction, and Facility Management Surveying and Mapping) and this manual (EM 1110-2-1003 (Hydrographic Surveying )
(5) Data Content Standards -- CADD/GIS Technology Center (Tri-Service) Spatial Data Standards and FGDC Bathymetric Subcommittee. National Hydrography Data Content Standard for Coastal and Inland Waterways – January 2000 (Draft)--see Appendix C.
6-31

EM 1110-2-1003 1 Jan 02
(6) Data Symbology Standard -- CADD/GIS Technology Center (Tri-Service) Spatial Data Standards.
d. Database specifications. According to EM 1110-2-2909, a database specification serves two purposes: (1) it provides a firm set of rules for data collection and database construction, and (2) it describes the database in sufficient detail to permit application development. The database specification document will permit use of the database inside and outside of the producing organization and result in a substantial cost savings to users. The database specification may take several forms, but at a minimum should include the following sections: (1) Scope -- a concise abstract of the coverage of the specification.
(2) Applicable Documents -- a bibliographic listing of the standards and references used in developing the specification.
(3) Database Description -- a summary of the information contained in and the structure/format of
the database and the intended use of the data. (4) Metadata -- a listing of the static metadata elements, including accuracy, datum,
scale/resolution, source, and projection (if applicable). (5) Data Format -- a detailed description of the data for-mat. (6) Data Dictionary - a dictionary of the feature and attribute codes used in the database.
e. Metadata. Metadata is defined as descriptive information about the data in a database.
Metadata describes the content, quality, fitness for use, access instructions, and other characteristics about the geospatial data. USACE requirements and policies for Metadata are in Chapter 8 (USACE and Executive Order 12906) of EM 1110-1-2909. A sample Metadata file for a hydrographic survey product is illustrated in that chapter. Metadata requirements are also outlined in paragraph 5.10 of Appendix B.
f. Computer-Aided Design and Drafting (CADD) standards. A/E/C CADD Standard has been
developed by the CADD/GIS (Tri-Service) Technology Center to reduce redundant CADD standardization efforts within the Army, Navy, Air Force and Corps of Engineers. This standard is part of an initiative to consolidate existing CADD drafting standards into a format generic enough to operate under various CADD software packages (such as MicroStation and AutoCAD) and to incorporate existing industry/national standards. The A/E/C CADD Standard includes presentation graphics, level/layer assignments, electronic file naming, and standard symbology. In the final phase of the standards development, platform-specific software will be provided to aid the user in implementing the standards. In addition, non-graphic attribute data will be developed as part of the standard. In 1995, the combined resources of the CADD/GIS Technology Center, the American Institute of Architects (AIA), the Construction Specifications Institute (CSI), the United States Coast Guard, the Sheet Metal and Air Conditioning Contractors National Association (SMACNA), the General Services Administration (GSA), and the National Institute of Building Sciences' (NIBS) Facilities Information Council began an effort to develop a single CADD standard for the United States--the "US National CAD Standard" Working together, these organizations agreed to develop an integrated set of documents that collectively would represent the United States The US National CAD Standard is now available from NIBS.
6-32
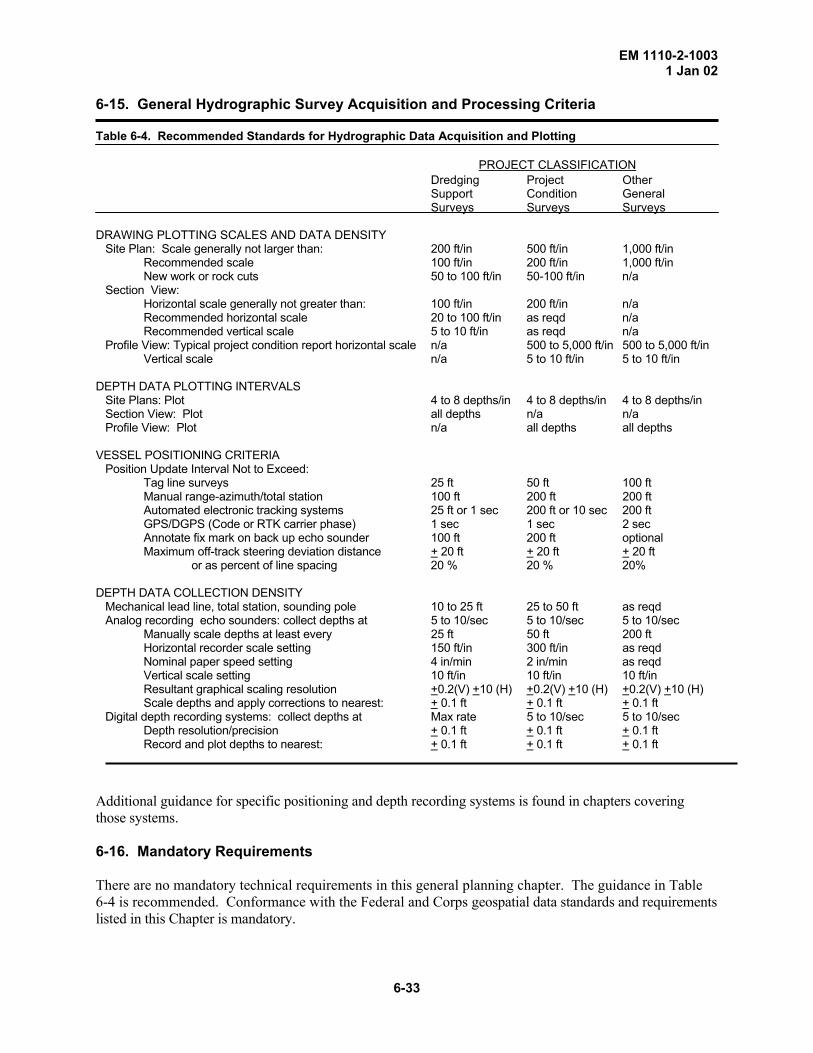
EM 1110-2-1003 1 Jan 02
6-15. General Hydrographic Survey Acquisition and Processing Criteria T able 6-4. Recommended Standards for Hydrographic Data Acquisition and Plotting
PROJECT CLASSIFICATION Dredging Project Other
Support Condition General Surveys Surveys Surveys
DRAWING PLOTTING SCALES AND DATA DENSITY Site Plan: Scale generally not larger than: 200 ft/in 500 ft/in 1,000 ft/in Recommended scale 100 ft/in 200 ft/in 1,000 ft/in New work or rock cuts 50 to 100 ft/in 50-100 ft/in n/a Section View: Horizontal scale generally not greater than: 100 ft/in 200 ft/in n/a Recommended horizontal scale 20 to 100 ft/in as reqd n/a Recommended vertical scale 5 to 10 ft/in as reqd n/a Profile View: Typical project condition report horizontal scale n/a 500 to 5,000 ft/in 500 to 5,000 ft/in Vertical scale n/a 5 to 10 ft/in 5 to 10 ft/in DEPTH DATA PLOTTING INTERVALS Site Plans: Plot 4 to 8 depths/in 4 to 8 depths/in 4 to 8 depths/in Section View: Plot all depths n/a n/a Profile View: Plot n/a all depths all depths VESSEL POSITIONING CRITERIA Position Update Interval Not to Exceed: Tag line surveys 25 ft 50 ft 100 ft Manual range-azimuth/total station 100 ft 200 ft 200 ft Automated electronic tracking systems 25 ft or 1 sec 200 ft or 10 sec 200 ft GPS/DGPS (Code or RTK carrier phase) 1 sec 1 sec 2 sec Annotate fix mark on back up echo sounder 100 ft 200 ft optional Maximum off-track steering deviation distance + 20 ft + 20 ft + 20 ft or as percent of line spacing 20 % 20 % 20% DEPTH DATA COLLECTION DENSITY Mechanical lead line, total station, sounding pole 10 to 25 ft 25 to 50 ft as reqd Analog recording echo sounders: collect depths at 5 to 10/sec 5 to 10/sec 5 to 10/sec Manually scale depths at least every 25 ft 50 ft 200 ft Horizontal recorder scale setting 150 ft/in 300 ft/in as reqd Nominal paper speed setting 4 in/min 2 in/min as reqd Vertical scale setting 10 ft/in 10 ft/in 10 ft/in Resultant graphical scaling resolution +0.2(V) +10 (H) +0.2(V) +10 (H) +0.2(V) +10 (H) Scale depths and apply corrections to nearest: + 0.1 ft + 0.1 ft + 0.1 ft Digital depth recording systems: collect depths at Max rate 5 to 10/sec 5 to 10/sec Depth resolution/precision + 0.1 ft + 0.1 ft + 0.1 ft Record and plot depths to nearest: + 0.1 ft + 0.1 ft + 0.1 ft Additional guidance for specific positioning and depth recording systems is found in chapters covering those systems. 6-16. Mandatory Requirements There are no mandatory technical requirements in this general planning chapter. The guidance in Table 6-4 is recommended. Conformance with the Federal and Corps geospatial data standards and requirements listed in this Chapter is mandatory.
6-33