Embed Size (px)
Citation preview

Chapter 6 Confidence Intervals
6.1 Confidence Intervals for the Mean
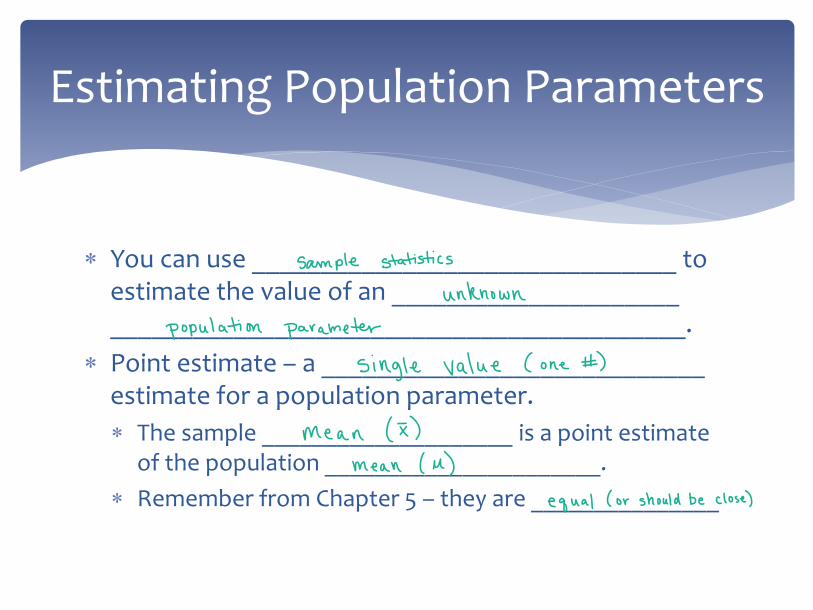
You can use _______________________________ to estimate the value of an _____________________ __________________________________________.
Point estimate – a ____________________________ estimate for a population parameter. The sample ____________________ is a point estimate
of the population ______________________. Remember from Chapter 5 – they are _______________
Estimating Population Parameters
Sample statisticsunknown
population parameter
single value one
mean xmean u
equal orshouldbeclose
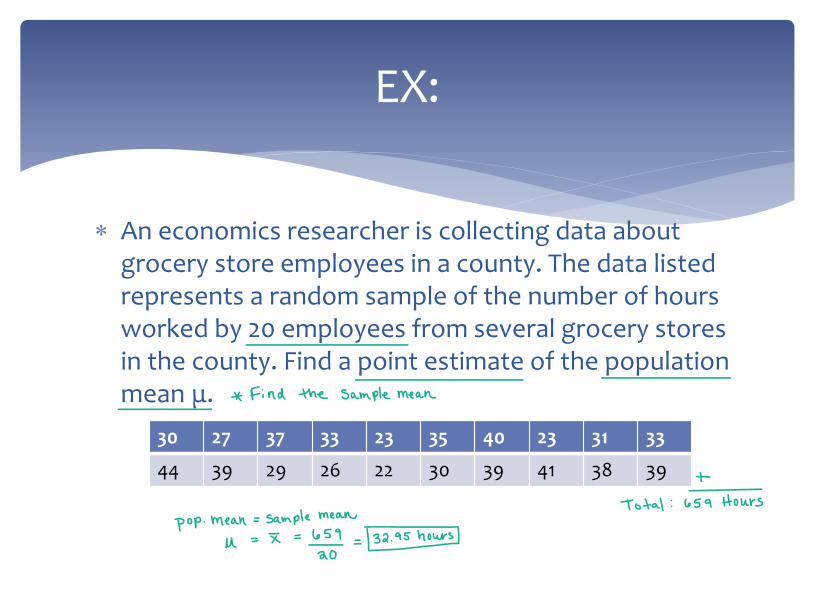
An economics researcher is collecting data about grocery store employees in a county. The data listed represents a random sample of the number of hours worked by 20 employees from several grocery stores in the county. Find a point estimate of the population mean μ.
EX:
30 27 37 33 23 35 40 23 31 33
44 39 29 26 22 30 39 41 38 39
Find the samplemean
tTotal 659Hours
popmean samplemeanµ I 6,501 32.95mi
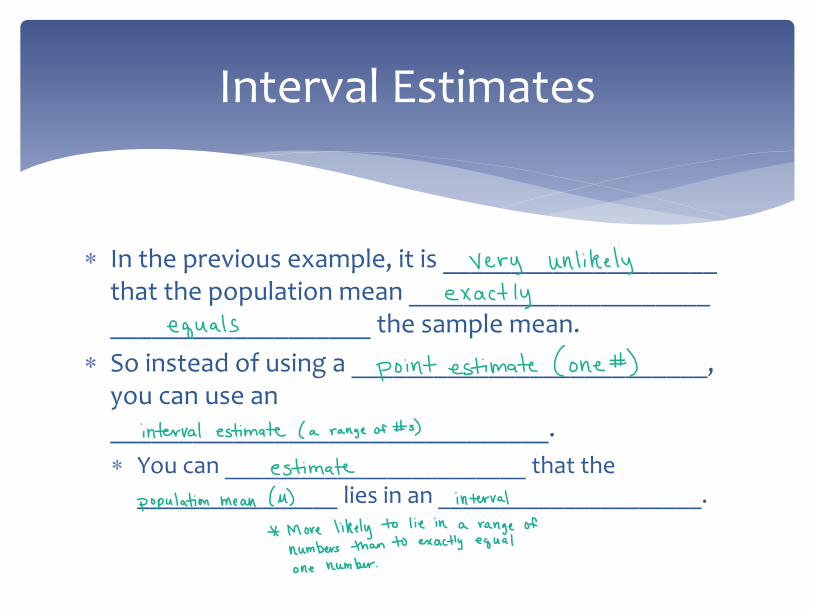
In the previous example, it is ____________________ that the population mean ______________________ ___________________ the sample mean.
So instead of using a __________________________, you can use an ________________________________. You can ________________________ that the
________________ lies in an _____________________.
Interval Estimates
Very unlikelyexactly
equalspointestimate one
interval estimate a rangeof s
estimatepopulationmean M interval
Morelikely to lie in a rangeofnumbers thanto exactlyequalonenumber
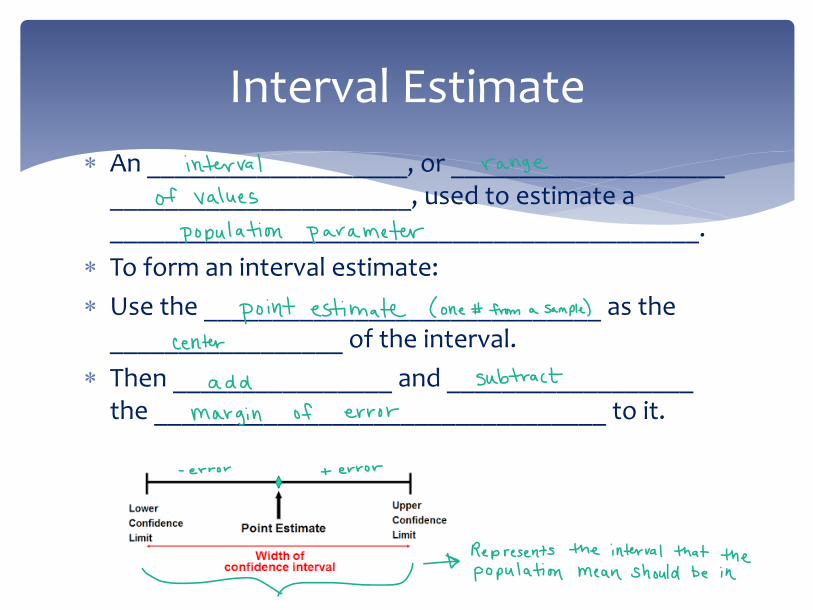
An ___________________, or ____________________ ______________________, used to estimate a ___________________________________________.
To form an interval estimate: Use the _____________________________ as the
_________________ of the interval. Then ________________ and __________________
the _________________________________ to it.
Interval Estimate interval range
of valuespopulation parameter
pointestimate one fromasample
Center
add subtractmargin of error
error error
Represents the interval that thepopulation meanshouldbe in
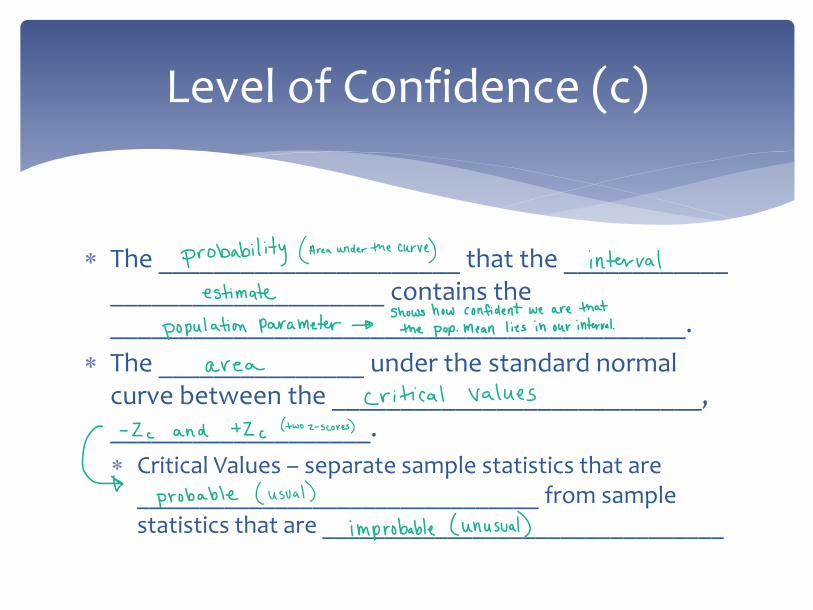
The ______________________ that the ____________ ____________________ contains the __________________________________________.
The _______________ under the standard normal curve between the ___________________________, ___________________. Critical Values – separate sample statistics that are
________________________________ from sample statistics that are ________________________________
Level of Confidence (c)
probability Areaunderthecurve intervalestimate
population parameterShowshowconfidentwearethatthepopmeanliesinourinterval
areacritical values
Zc and 1Zc two2scores
probable usual
improbable unusual
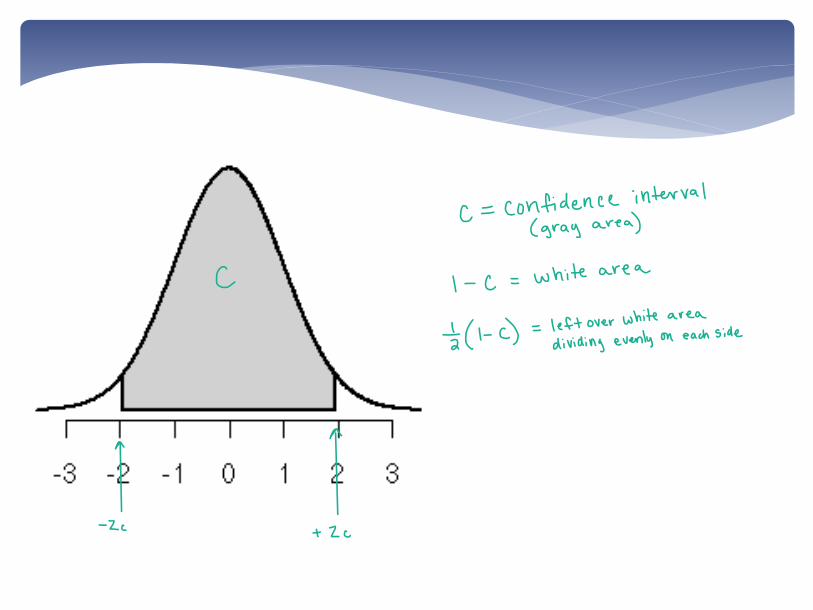
C confidenceintervalgray area
l C white area
f I c leftoverwhite areadividingevenlyoneachside
1 IZe t Zc
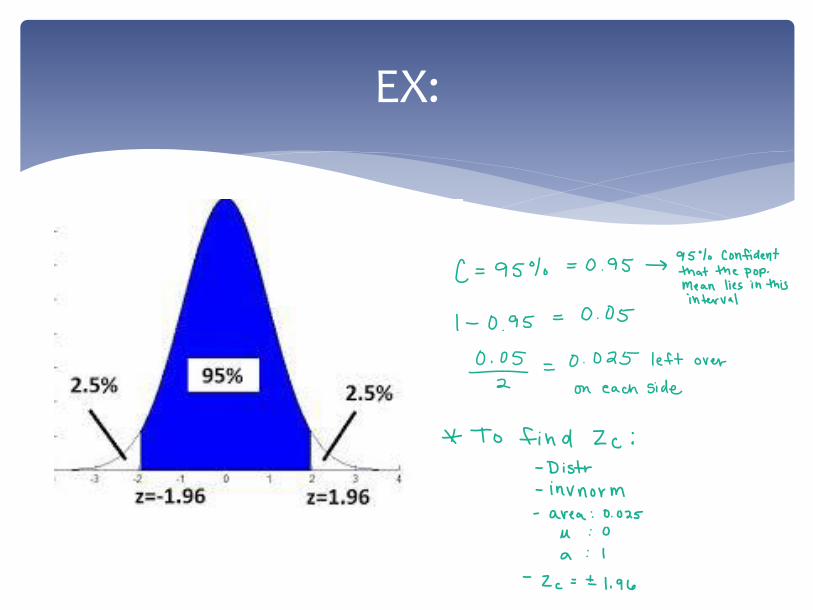
EX:
95 0.95 95 confidentthatthepopmeanliesinthis
l O 95 0.05interval
O 05 0 025 left over2 on eachside
To find 2CDistrinvnormarea 0.025µ on i lz I 1.96