Embed Size (px)
Citation preview
CASE STUDIES: UPGRADING FOR THE DOMESTIC MARKET AND FOR TRADITIONAL EXPORT COMMODITIES 79
ECONOMIC AND SECTOR WORK
Chapter 6: CASE STUDIES: UPGRADING FOR THE DOMESTIC MARKET AND FOR TRADITIONAL EXPORT COMMODITIES
INTRODUCTION
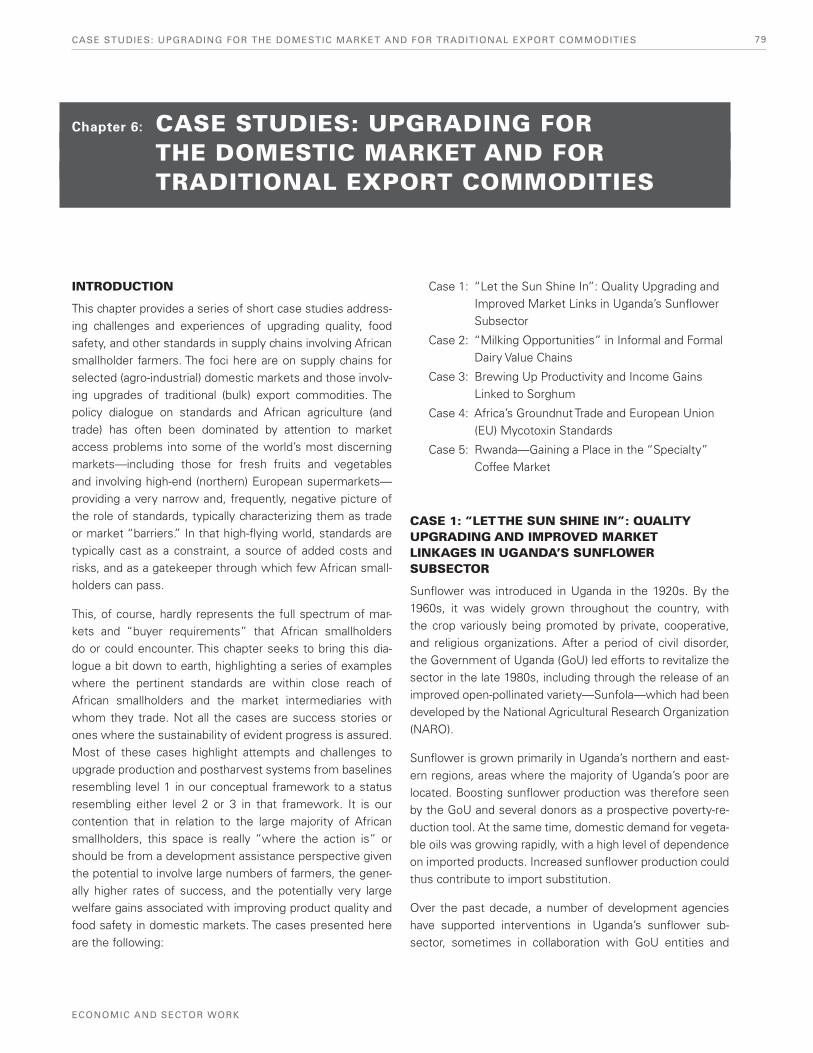
This chapter provides a series of short case studies address-ing challenges and experiences of upgrading quality, food safety, and other standards in supply chains involving African smallholder farmers. The foci here are on supply chains for selected (agro-industrial) domestic markets and those involv-ing upgrades of traditional (bulk) export commodities. The policy dialogue on standards and African agriculture (and trade) has often been dominated by attention to market access problems into some of the world’s most discerning markets—including those for fresh fruits and vegetables and involving high-end (northern) European supermarkets—providing a very narrow and, frequently, negative picture of the role of standards, typically characterizing them as trade or market “barriers.” In that high-flying world, standards are typically cast as a constraint, a source of added costs and risks, and as a gatekeeper through which few African small-holders can pass.
This, of course, hardly represents the full spectrum of mar-kets and “buyer requirements” that African smallholders do or could encounter. This chapter seeks to bring this dia-logue a bit down to earth, highlighting a series of examples where the pertinent standards are within close reach of African smallholders and the market intermediaries with whom they trade. Not all the cases are success stories or ones where the sustainability of evident progress is assured. Most of these cases highlight attempts and challenges to upgrade production and postharvest systems from baselines resembling level 1 in our conceptual framework to a status resembling either level 2 or 3 in that framework. It is our contention that in relation to the large majority of African smallholders, this space is really “where the action is” or should be from a development assistance perspective given the potential to involve large numbers of farmers, the gener-ally higher rates of success, and the potentially very large welfare gains associated with improving product quality and food safety in domestic markets. The cases presented here are the following:
Case 1: “Let the Sun Shine In”: Quality Upgrading and Improved Market Links in Uganda’s Sunflower Subsector
Case 2: “Milking Opportunities” in Informal and Formal Dairy Value Chains
Case 3: Brewing Up Productivity and Income Gains Linked to Sorghum
Case 4: Africa’s Groundnut Trade and European Union (EU) Mycotoxin Standards
Case 5: Rwanda—Gaining a Place in the “Specialty” Coffee Market
CASE 1: “LET THE SUN SHINE IN”: QUALITY UPGRADING AND IMPROVED MARKET LINKAGES IN UGANDA’S SUNFLOWER SUBSECTOR
Sunflower was introduced in Uganda in the 1920s. By the 1960s, it was widely grown throughout the country, with the crop variously being promoted by private, cooperative, and religious organizations. After a period of civil disorder, the Government of Uganda (GoU) led efforts to revitalize the sector in the late 1980s, including through the release of an improved open-pollinated variety—Sunfola—which had been developed by the National Agricultural Research Organization (NARO).
Sunflower is grown primarily in Uganda’s northern and east-ern regions, areas where the majority of Uganda’s poor are located. Boosting sunflower production was therefore seen by the GoU and several donors as a prospective poverty-re-duction tool. At the same time, domestic demand for vegeta-ble oils was growing rapidly, with a high level of dependence on imported products. Increased sunflower production could thus contribute to import substitution.
Over the past decade, a number of development agencies have supported interventions in Uganda’s sunflower sub-sector, sometimes in collaboration with GoU entities and
CHAPTER 680
MAKING THE GRADE
sometimes with more directed support to private-sector pro-cessors. The collective experience has generally been posi-tive, with achievements in technology adoption, production expansion, farmer welfare gains, and import substitution. Upwards of 85,000 smallholder farmers have been incorpo-rated into one or more coordinated supply chains. The sus-tained progress in this subsector contrasts sharply with the variable results and more volatile experiences of Ugandan farmers being supported for higher-value supply chains. The simple upgrades involved here—centered primarily upon the use of improved seed varieties and some modest tasks of quality screening—represent relatively easy steps that can be taken by most smallholder farmers. While the rewards for individual farmers are not exceptionally high, they have proven to be reliable, and the changes have not burdened farmers with added risks. Overall, the costs of achieving quality upgrades by these farmers have been very modest on a per beneficiary basis, especially when compared with many other recent schemes to raise standards in Ugandan agriculture and trade.
Selected Intervention Experiences
The International Fund for Agricultural Development (IFAD) has been supporting Uganda’s sunflower subsector for an extended period. Its Vegetable Oil Development Project (VODP), implemented by the Ministry of Agriculture, Animal Industries, and Fisheries (MAAIF), provided support be-tween 1998 and 2008. Major foci of the program included adaptive varietal research by NARO, planting seed multiplica-tion and distribution and the mobilization of farmer groups (through the Uganda Oilseeds Producers and Processors Association—UOSPA), extension support through District Agricultural Offices, and the promotion of small-scale sun-flower oil pressing. Considerable progress was achieved on the agronomic and group organization aspects, although the experience in promoting the ram oil press technology was more mixed, with many of the introduced machines being in disuse by the end of the program (IFAD 2010a). An alterna-tive to the Sunfola variety did not emerge from the research. That variety had good production characteristics yet relatively low oil content and therefore was less attractive to large-scale vegetable oil processors.
Since the early 1990s, the leading company in the vegetable oil sector has been the Mukwano Group, which has used a combination of imported crude palm oil and domestic raw materials to produce a range of consumer products. For many years, Mukwano sourced local raw materials on a spot market basis and largely through intermediaries as it lacked a presence in rural areas or experience working directly with
farmers. Yet, by the early 2000s the company was facing difficulties procuring adequate local raw materials in compe-tition with numerous small- and medium-scale processors. In addition, the company was dissatisfied with the quality characteristics of the Sunfola variety.
In 2003, Mukwano worked in collaboration with the Investment Development Export Agriculture project of the U.S. Agency for International Development (IDEA/USAID) and the Serere Agricultural and Animal Production Research Institute (SAARI)70 to introduce a high-yielding, high-oil con-tent sunflower hybrid from South Africa (PAN 7351). Based on the success of the initial efforts, the company established a partnership with the Agricultural Productivity Enhancement Program (APEP/USAID) and the National Agriculture Advisory Services (NAADS) in 2004, to expand the distribution of seed to outgrowers, and it set a coordinated company procurement model geared toward raising farmer productivity, imparting knowledge about better farmer practices and lowering the transaction costs in its procurement.
Mukwano relied on NARO to conduct the adaptability and verification tests of the new variety. Under the partnership with the institutions, the firm was in charge of the overall direction of the project, while the institutional support from APEP and NAADS focused on showing the benefits of both low- and high-technology input packages, training lead farm-ers and site coordinators to manage the process, and deliver messages to farmers on good agronomic practices through demonstration plots, and also via a weekly radio program (USAID 2008). APEP was implemented through a producer organization/lead farmer extension model, which was the ba-sis for the support to sunflower production as well. By 2006, there were some 2,244 demonstration sites and 31,291 reg-istered farmers in the scheme. Quite a few of the farmers had earlier been supported and organized into groups under the VDOP. The company entered into purchase contracts with the farmer groups, with predetermined prices. A team of purchasing agents was hired by the company to coordi-nate extension services, and purchase and store the crop. By 2009, the company was employing some 200 of its own extension workers.
The company procures all its local raw materials from small-holders, with farmers having an average growing area of 1.1 hectares (Elepu and Nalukenge 2007). The estimates on the number of contracted farmers vary, but the number is certainly significant. In the northern districts of Lira, Otuke,
70 Currently known as National Semi-Arid Resources Research In-stitute (NaSARRI).
CASE STUDIES: UPGRADING FOR THE DOMESTIC MARKET AND FOR TRADITIONAL EXPORT COMMODITIES 81
ECONOMIC AND SECTOR WORK
Oyam, Kole, and Alebtong, the company estimates the num-ber at 52,000 and expanding.71 Another report estimates the number of outgrowers involved in various schemes at 75,000 to 85,000 (Elepu 2009). Most recently, Mukwano has been introducing maize and soybeans among its outgrowers as rotational crops, complementing cash crops with food crops, in order to address concerns on food security.
While the scheme has generally been successful, it has not been without problems. For example, in the early years, some farmers did not do a proper grading of their sunflower crop and included extraneous materials (e.g., dirt, stones) in their deliveries. A combination of incentives, penalties, and increased quality inspections at collection stations largely re-solved this problem. Side-selling has been a persistent issue, as the demand for sunflower seed among various processors still substantially exceeds local production. Mukwano esti-mated that some 40 percent of its contracted supply in 2007 was sold to competing companies. Inadequate access to the higher-yielding seed has remained a bottleneck. The Pan 7351 hybrid variety continues to be imported, with Mukwano being the main importer. In 2007, the company entered into a partnership with the Uganda National Agro Input Dealer’s Association (UNADA). Through the partnership, Mukwano agreed to make available imported hybrid seed to UNADA’s regional distributors for sale to millers around the country. The Danish International Development Agency (DANIDA) provided guarantee for UNADA to purchase the hybrid seed from Mukwano.
Evidence of Impact
Interventions, both through institutional partnerships and through the lead firm, have provided opportunities for small-scale producers to engage in the production of sunflower. The increased supply of Sunfola seed to farmers, on which VODP played a critical role, had a clear effect on expanded cultivation. According to IFAD (2010a), the area planted with sunflower with VODP support rose from 2,102 ha in 1998/99 to 81,548 ha in 2007–08. The number of farmers reached with the program was estimated at about 206,943 in 2008, with investments in the sector (from the IFAD loan) reach-ing over US$8 million, and a project cost per beneficiary of US$37.
Mukwano has indicated that about 40,000 hectares are planted by its outgrowers, yielding some 40,000 to 50,000
tons of sunflower seed per year. Investments in the scheme, from APEP alone, through grant agreements with the com-pany are estimated at US$85,000 during the period 2004–07, to support nearly 1,600 demonstration sites.72 Support to SAARI reached about US$12,000 for the evaluation, identifi-cation, and introduction of the high-yielding hybrid. In 2007, the project supported the efforts of a new investor, Sanyu Agro Industries Ltd., through a grant agreement (US$18,300) to set a sunflower scheme for 3,000 outgrowers in 2007–08. APEP also supported A.K. Oils & Fats Limited from 2005 to 2007 through grants totaling nearly $75,000 to develop 2,900 demonstration plots for high yielding hybrids. Those plots targeted over 30,000 outgrowers.
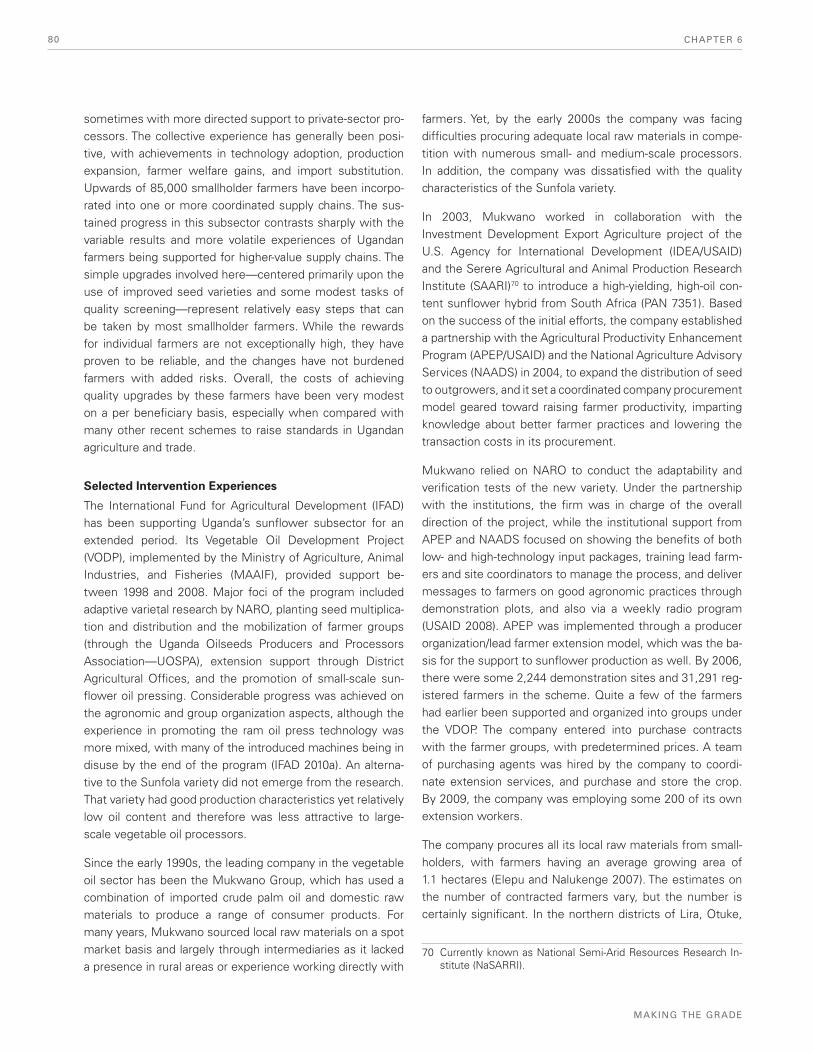
Overall, sunflower production in Uganda has increased dra-matically since the early 1990s (figure 6.1). A major leap oc-curred in the early 1990s, which coincides with the efforts to upgrade production through the adoption of the improved variety Sunfora, resulting in significant increases in yields—in the late 1990s the national average yield doubled, increasing from 400 kg/ha to over 800 kg/ha. A second leap occurred al-most a decade later as a result of the activities promoted by donors as mentioned above, including the efforts to upgrade production toward the higher-yielding variety. Domestic de-mand for vegetable oil continues to grow rapidly at some 9 percent per annum (IFAD 2010b).73 Thus, there remains considerable scope for further expansion of outgrower ar-rangements since the processing sector is still operating at well below its capacity and must still rely upon imported raw materials to supplement local supplies to meet the growing demand. There are also broad opportunities to expand yields. For example, APEP reported that in spite of demonstrated yield enhancement and cost reduction associated with high-input production technologies, their adoption by farmers was very low—of the about 34,354 farmers exposed to the pro-gram, only 172 adopted high-input production technology, and about 30,919 adopted low-input technology.74
71 Northern Uganda’s New Agricultural Chapter, July 2010. Muk-wano’s website http://www.mukwano.com/agriculture/agric_in_nothern_ug.php
72 APEP estimated the company’s matching contributions at about $285,000.
73 The sector has benefited from important recent investments. For example, in 2007 A.K. Oils & Fats (U) Ltd (affiliated with the Mukwano Group) constructed a new oil mill in Lira, with an investment of approximately US$1.4 million, doubling the com-pany’s capacity, and also another plant in Tanzania. In 2009, a new sunflower oil processing plant opened in Uganda, mainly for production of sunflower cake, with a very large processing capacity (around 100,000 tons of sunflower cake annually).
74 Low-input production technologies comprise basically the use of hybrid seeds, timing planning and weeding, correct plant density, and so forth, but relatively low or no use of fertilizer.
CHAPTER 682
MAKING THE GRADE
For farmers there have been evident benefits from par-ticipating in the sunflower outgrower schemes. A survey by Elepu and Nalukenge (2007) found participating farm-ers to have much better access to advisory services and reliable market outlets than did nonparticipants in similar locations. The incremental incomes from sunflower haven’t been exceptionally high, but yields have been relatively reli-able and prices are determined prior to plantings. Elepu and Nalukenge (2007) found reported gross profit per acre to be significantly higher among the farmers participating in the contract scheme than the noncontracted farmers growing sunflower (USh 20,456/acre vs. negative 7,775/acre).
APEP reported increased yields from adoption of hybrid seed (and low input technologies) from 250–350 kg/acre with the traditional variety to 575–600 kg/acre with the improved system during the 2006/07 season, and net incomes consid-erably higher among farmers adopting the hybrid. Similarly, the impact evaluation of VODP project carried out in 2008 reported the emergence of the contracting scheme as one of the factors affecting the performance of the project—the adoption of the new variety produced a higher yield and com-manded a higher price than the open-pollinated variety (OPV) Sunfola being distributed by VODP and was thus more profit-able for farmers.75
Development agency and private sector efforts to promote smallholder sunflower production and upgrade quality
through improved seeds and farming practices have certainly paid off. Although there are many challenges ahead, including concerns about soil fertility, ensuring the sustainable distribu-tion of hybrid seeds, and finding the right balance between cash and food crop production, there are certainly positive prospects for the sector and the engagement of more farm-ers. IFAD is planning a second phase VODP, and USAID’s new investment in Uganda—the Livelihoods and Enterprises for Agricultural Development (LEAD) project that started in 2008—has continued its support to sunflower outgrower schemes.
This experience provides an excellent illustration of the op-portunities for achieving both commercial and developmental benefits from interventions seeking to upgrade smallholder production from levels 1 to 2 in our conceptual spectrum of market requirements. The technical and organizational challenges were straightforward. The scale of financial investment by donors and the GoU—largely in research, demonstration plots, advisory services—was rather modest in relation to the number of farmer (and Ugandan consumer) beneficiaries and the scale of production gains achieved.
250,000
200,000
150,000
100,000
50,000
0
1,400
1,200
1,000
800
600
400
200
0
Production (tonnes)
Yield (Kg/Ha)
1980
1981
1982
1983
1984
1985
1986
1987
1988
1989
1990
1991
1992
1993
1994
1995
1996
1997
1998
1999
2000
2001
2002
2003
2004
2005
2006
2007
2008
2009
Source: Calculations based on FAOSTAT data.
FIGURE 6.1: Uganda Sunflower Production and Yields
75 The project also highlighted that as a result of the adoption of hybrid seed, both the market for sunflower seed and the sup-ply of extension services became more diverse and the VODP-supported products became less attractive for farmers.
CASE STUDIES: UPGRADING FOR THE DOMESTIC MARKET AND FOR TRADITIONAL EXPORT COMMODITIES 83
ECONOMIC AND SECTOR WORK
Farmers were required to make very modest adjustments. They were not asked to bear heavy financial or commercial risks. No third party was needed to certify products or pro-duction practices.
CASE 2: “MILKING OPPORTUNITIES” IN INFORMAL AND FORMAL DAIRY VALUE CHAINS76
In recent decades, there has been a growing interest in the potential of smallholder dairy development to reduce poverty in developing countries via income and nutrition improve-ments. Even among the lower-end smallholders, holding just one dairy cow is acknowledged to have significant benefits in terms of household nutrition and supplemental income gains (IFAD 2005; Swanson 2009). Following the liberalization of the sector in much of sub-Saharan Africa (SSA) during the 1990s, smallholder dairy production has shown signs of con-siderable dynamism. Region-wide, smallholders are estimat-ed to account for about 80 percent of raw milk production, the balance coming from medium- or large-scale commercial farms or integrated farming/processing operations.77
During the past decade, there has been growing concern about the ability of African smallholders to sustain a remu-nerative position in national dairy value chains. One factor has been competition from imported milk powder, being widely used by processors due to logistical considerations (in contrast with procuring highly perishable raw milk). A second factor has related to standards, those laid down and enforced by both governments and the private sector. Governments have sought to protect consumers from the potential risks associated with improper milk production, handling, and adul-teration. Elements of the private sector, including processors selling milk through modern supermarkets and companies producing higher value dairy products, have raised quality standards above the prevailing norm.
Addressing these challenges—and taking advantage of emerging market opportunities—has stimulated an array of donor-supported programs in dairy development within Africa, often implemented with close collaboration with the private sector. This mini case study highlights some recent
experiences with dairy sector interventions in Kenya, Uganda, and Zambia. It emphasizes that the traditional challenges in smallholder dairying—related to animal husbandry, farm productivity, and realizing economies of scale in milk bulking and sale—remain the prominent focus and that there is little evidence to suggest that smallholders have been excluded from formal markets due to quality-related concerns. In fact, processors have been unable to source enough smallholder raw milk—and therefore, continue to operate at below ca-pacity—not because of quality mismatches but because the processors frequently cannot compete with informal market channels on the basis of price and the transaction costs as-sociated with sales.
Challenges of Smallholder Dairy Development and the
Importance of Quality and Safety Standards
Public standards, whether mandatory or voluntary, covering milk and milk products, have been driven by concerns over public health and by a conviction that ensuring the safety of dairy products is a fundamental role of the state.78 But the pursuit of consumer protection objectives by encouraging the formalization of milk trade implies significant challenges, particularly as it relates to the implied required changes in production and handling practices to ensure quality milk. Additionally, other challenges include putting in place ef-ficient and well-coordinated logistical arrangements along the chain to avoid quality deterioration and investments in infrastructure and technologies (including cooling systems). A failure in the process can easily compromise the quality of the pasteurized milk and related dairy products.
Dairy production is generally regarded as a very expensive activity. In the case of smallholder dairy development, a major challenge is the high farm-level start-up cost. The value of dairy livestock often accounts for 50 to 70 percent of total investment costs, which can be particularly difficult for small-scale farmers to afford without external support or access to artificial insemination services to upgrade existing animals through breeding. Once a smallholder has been able to engage in dairy activities, the level of upgrade required to participate in formal markets will be associated with the
76 Detailed information on this case study is presented in Keyser, J. (forthcoming).
77 Although smallholders involved in dairy production might not be the poorest, they are certainly both poor and disadvantaged. In Kenya, for example, the average dairy farm size is 2.6 ha and supports six people; a quarter of these households are female-headed. The mean number of cattle is only three, but for about half the farms dairying is a major source of income.
78 Public approaches to provide consumer protection on the con-sumption of milk and milk products have included i) recommen-dations on the proper hygienic control of milk and milk products throughout the food chain, ii) the publication of specifications for the quality of milk, according to its intended use, including microbiological and other criteria, iii) procedures for testing and analysis, and iv) in several countries, specific provisions for the marketing of raw milk, including the banning of informal raw milk trade, particularly in urban centers.
CHAPTER 684
MAKING THE GRADE
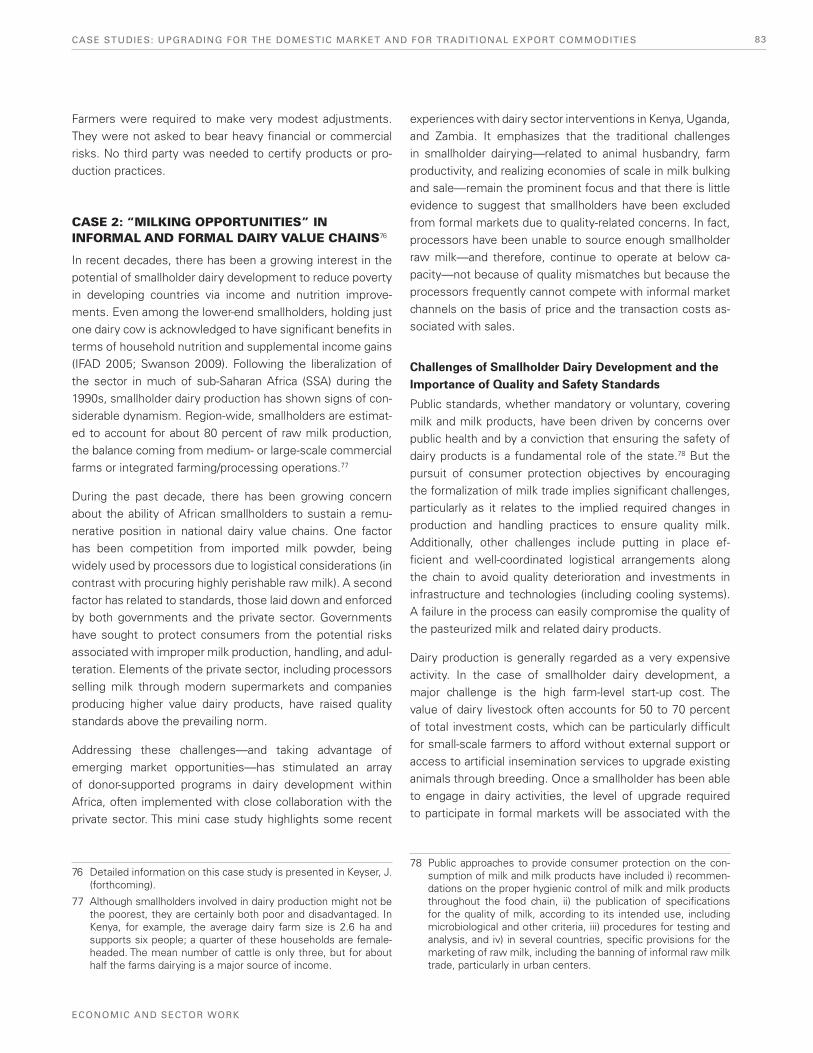
TABLE 6.1: Continuum of Market Requirements and Associated Conformity Systems in Milk and Milk Products
STRINGENCY OF OFFICIAL AND BUYER REQUIREMENTS LEVEL OF SOPHISTICATION OF THE CONFORMITY ASSESSMENT SYSTEMS
DAIRY LEVEL 1 DAIRY LEVEL 2 DAIRY LEVEL 3 DAIRY LEVEL 4 DAIRY LEVEL 4a
Market Outlets(increasing requirements for capital investment, inspection, and licensing as move from left to right on continuum)
Informal Formal
Local sales by farmers or unlicensed vendors to customers in the farm area
Sales to urban and town markets by unlicensed traders, vendors, milk shop owners
Sales to urban and town markets by licensed traders, vendors, milk shop owners + licensed bulking centers
Processor (domestic, some current exports) Milk from level 3 bulking center or own milk run
Processor (COMESA/EAC export ready) Milk from advanced bulking center or own milk run
Main Products(increasing standards for hygiene and freshness as move from left to right on continuum)
Raw Milk Processed Milk
Raw milk Raw milk Raw milk + processed yoghurt, ghee, cheese, fermented milk Some batch pasteurized milk
Pasteurized milk (including fermented milk), yoghurt, butter, ghee, cheese, ice cream, cream, UHT, dry milk powder, etc.
UHT milk, dry milk powder, plus other long life, value-added products at COMESA/ EAC export level
Quality Requirements Fresh milk, quick delivery w/o chilling
Fresh milk, quick delivery w/o chilling
Fresh milk, some chilling to prolong life if needed Certification and licens-ing by national authority
Fresh milk, chilling to prolong life as required More advanced national level certification and licensing requirements that are variably based on ISO and HACCP guide-lines for milk hygiene and timeliness of intake
Fresh milk, consistent chilling to prevent bacteria growth essential + detailed specifications for product, packaging, labeling, composition, and laboratory analysis using ISO methods
Quality Inspection Sight and smell Sight and smell + occasional platform tests
Sight and smell + wider range of routine platform tests + basic record keeping of milk intake and payments to farmers
3-4 routine platform tests at bulking center and other critical control points (ideal) + more detailed quality analysis at plant (ideal)
3-4 routine platform tests at bulking center and all other critical control points (needed) + very detailed quality analysis and record keeping at plant (required)
Source: Keyser, J. (forthcoming).
characteristics of the targeted market (as determined by the intended use of the raw milk—yogurt, cheese, UHT milk, etc.), as well as by the starting point of the farm in terms of knowledge and investments already made to improve dairy productivity and to ensure quality and safety.
Table 6.1 outlines five levels of upgrading in dairy develop-ment, applying the generic framework laid out earlier in Chapter 3. Buyer requirements for freshness, shelf life, physical quality attribute, and microbiological quality become increasingly stringent as one moves from informal to for-mal markets and as end uses relate more to value-added products. In local outlets, where raw milk is sold for direct consumption, the freshness of the milk and its quick delivery
are the essential requirements. At the other end of the spectrum, for supply chains in which the procured milk will be converted into milk powder or UHT milk, the range and stringency of quality criteria are considerable. Raw milk with a total bacteria count greater than 200,000 cfu/ml is unsuit-able for UHT production. Similarly, the sophistication of con-formity assessment systems varies across this spectrum of markets and users.
As farmers move from level 1 to level 2 value chains and then beyond, the costs associated with quality upgrading increase and can be difficult for farmers to afford in terms of up-front cash requirements as well as managing the de-preciation of their assets. Data from the three focal countries
CASE STUDIES: UPGRADING FOR THE DOMESTIC MARKET AND FOR TRADITIONAL EXPORT COMMODITIES 85
ECONOMIC AND SECTOR WORK
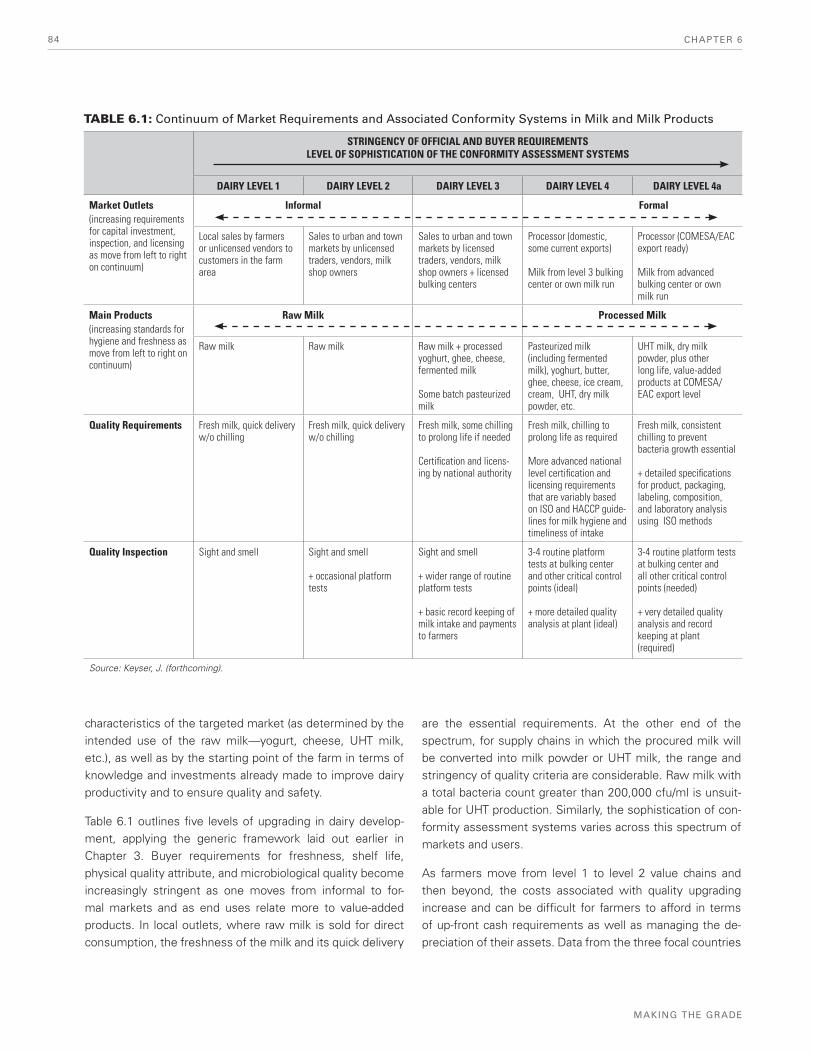
illustrate the higher production costs of moving toward “im-proved” and “advanced” dairy production, yet also clearly indicate a higher level of profitability for those farmers able to make the upgrades (table 6.2).
Off-farm upgrades become especially critical for farmers to supply levels 3, 4, and 4a value chains. Normally, there will be the need for investment in a raw milk bulker, except where farmers are in close proximity to a dairy plant or when their daily production is large enough to justify direct deliv-ery. At such milk bulking sites quality assurance can be done through routine platform tests. In level 2 value chains for raw milk, the bulking function is typically carried out by small traders or bicycle vendors who buy direct from smallholder farmers and sell to final consumers or other intermediaries on a daily basis. These informal markets depend on quick turnover and are unlikely to involve milk chilling except when long delivery times are involved that would cause the milk to spoil.
Very often, the bulking function in formal dairy systems is carried out by farmer-owned cooperatives, although this may be performed by private entrepreneurs or even processors as part of a vertically integrated milk run in areas where there is large enough production and/or strong competition for raw milk to justify the investment. Bulking systems without chill-ing are more common in Kenya than in Uganda and Zambia due to the very large volumes of milk produced in Kenya and the proximity of farmers to a processing plant, particularly in the leading production regions. Where cooling does not take place, Kenyan dairies have developed ISO-certified systems to monitor the timeliness of delivery and record platform test results at each stage of the collection and delivery operation. In Uganda, nearly all milk that reaches a processing plant has been chilled and, in Zambia, chilling is absolutely essen-tial because of the dispersed nature of production and time required to collect sufficient quantities to justify selling to a dairy processor.
TABLE 6.2: Costs and Returns of Smallholder Dairy Upgrades in Selected Countries
TOTAL MILK AVAILABLE FOR SALE
(LITERS/YR)
PRODUCTION COSTS (USD) FARMER REVENUE (USD)
TOTAL COST PER HERD
COST PER COW
COST PER LITER SOLD
TOTAL NET PROFIT (CASH & IMPUTED)
NET PROFIT FROM MILK
SALES (CASH ONLY)
TOTAL PROFIT PER COW (CASH &
IMPUTED)
Kenya (3-cow) Typical Basic Improved Advanced
5,448 6,229 9,060 14,269
1,944 2,085 2,945 4,026
648 695 982 1,342
0.36 0.33 0.33 0.28
39 152 944 1,564
(148) (56) 441 874
13 51 315 521
Kenya (6-cow) Typical Basic Improved Advanced
7,533 9,015 11,785 17,193
2,385 2,545 3,430 4,941
398 424 572 824
0.32 0.28 0.29 0.29
463 734 1,595 2,193
255 505 1,187 1,742
77 122 266 366
Uganda (3-cow) Basic Improved Advanced
4,177 7,843 11,754
1,131 1,623 2,007
377 541 669
0.27 0.21 0.17
321 638 931
(122) 100 360
107 213 310
Zambia (1-cow) Basic Recommended Advanced
617 1,932 3,037
394 649 902
394 649 902
0.64 0.34 0.30
586 926 1,099
(209) (97) 52
586 926 1,099
Zambia (2-cow) Basic Recommended Advanced
1,564 4,269 6,509
657 1,193 1,678
328 596 839
0.42 0.28 0.26
1,214 1,843 2,213
(188) 27 368
607 922 1,106
Management assumptions Kenya, zero-graze: breed improves at each level, switch from plastic to metal. Uganda, zero-graze: breed improves from typical to improved (same for improved and advanced). Zambia, semi-zero graze: high-quality breed throughout. * Indicates metal dairy equipment
Source: Keyser, 2003 (Uganda), Keyser, 2008 (Zambia), Parsons and Matiru, 2008 (Kenya).
**
**
***
***
CHAPTER 686
MAKING THE GRADE
The costs of establishing an efficient milk bulking operation can be significant. Large investments in stainless steel dairy equipment, cooling tanks, quality test kits, insulated tankers, and new or upgraded buildings may be required.79 Significant investments in business management training and quality control procedures may also be required. It is not unusual for milk bulking centers in East Africa to have an annual turnover greater than a million dollars, which imposes significant man-agement demands. Operation of a competitive milk bulking system, in fact, creates a number of important management problems in terms of having to keep track of farmer pay-ments, deciding where to market the milk to get the best price, how to organize the logistics of milk collection and delivery, quality assurance, and long-term financial planning to cover depreciation costs and future expansions.
For processing upgrades, there are several technological op-tions for the preservation or processing of raw milk, from very basic small-scale systems—level 3-type technology, with little asset-specificity involved—to very complex pro-cesses and higher investments in facilities and equipment (e.g., the production and packaging of long-life UHT milk and evaporated milk powder for domestic markets and export require more sophisticated capital-intensive techniques and specialized skills, so are associated greater economies of scale and higher degrees of asset specificity (Jaffee, 1995)). Furthermore, specific quality requirements can be particu-larly challenging in some higher-end products.
Characteristics of Country Industries and the Relevance
of Standards
Since economic liberalization and the privatization of state dairy-related functions, a vibrant small-scale sector has emerged in Kenya and Uganda. In Kenya, some 750,000 smallholders are involved; in Uganda, about 200,000. In both of these countries, most milk production has been tradition-ally sold through informal channels. In Kenya, for example, the International Livestock Research Institute (ILRI) esti-mates that informal milk markets account for approximately 86 percent of milk supplied to consumers, with supply chain actors including small-scale producers, mobile milk traders, milk bar operators and milk transporters. The high degree
of informality is the result of the proliferation of small-scale (and technically illegal) milk traders after liberalization, with these suppliers being able to provide milk more cheaply and more directly to large numbers of consumers. In Uganda, the formal sector is estimated to handle only 5 percent of the milk that is domestically marketed or consumed.
In both Kenya and Uganda the official government policy has been to restrict the activities of small-scale milk vendors, os-tensibly to protect consumers. In Kenya, for example, such vendors cannot operate unless they are licensed, yet the ex-isting regulations made no provisions for licensing or engag-ing them (Kaitibie et al. 2009). In Uganda, milk handlers have faced tight laws and licensing requirements since 2002 and the national authority is looking at legislation that would com-pletely ban the sale of raw milk in urban areas. However, due to the high demand for cheap, raw milk, the informal sector has continued to flourish in both countries, making it almost impossible for the respective authorities to enforce the laws, given the size of the sector. In Kenya in particular, this situ-ation gave rise to what was called the “milk war” between processors and the informal sector. This was a dispute that later resulted in a comprehensive policy shift toward small-scale milk vendors, as will be discussed later.
The evident dynamism of the informal milk trading sector represents a tremendous challenge for processors, who have made significant investments in plant and equipment yet are forced to compete with informal channels to gain enough supply of quality milk to expand their market pres-ence, both at home and regionally. Most processors in both Kenya and Uganda operate at well below their installed capacity and have little scope to compete with small-scale traders on the basis of price because of the extra costs of their operations, including expensive packaging costs. As a result, they are rarely able to pay a significant premium for higher-quality milk, and this detracts from the incentives for farmers to supply the former sector.80
Thus, from the standards perspective, clearly, in Uganda and Kenya, where a large informal sector exits, standards have not been a constraint for smallholder market access. The is-sue has not been exclusion due to standards, but rather a lack of incentives motivating farmers to make upgrades to supply formal markets, allowing processors to take advantage of growing demand for dairy products at home and in regional
79 In Kenya, the capital equipment required for a typical bulking center with 4,000-liter daily capacity is estimated to be around US$40,000 without chilling tanks or US$80,000 with these (Key-ser 2006). In Zambia, the cost of opening a new collection center with a small 1,500-liter cooling tank is around US$30,000 (Keyser 2006a).
80 There are 52 milk processors in Kenya, although in early 2009 only 34 were active. There were 7 large processors active in Uganda in 2009.
CASE STUDIES: UPGRADING FOR THE DOMESTIC MARKET AND FOR TRADITIONAL EXPORT COMMODITIES 87
ECONOMIC AND SECTOR WORK
purpose, the access to artificial insemination (AI) services was considered critical. Product quality came as a specific project objective in the early 2000s, with approaches target-ing farmers through cooperatives or other groups. These approaches extended to value-chain frameworks, targeting improvements along the chain, using different entry points to enhance the capacities of different actors and the overall performance of the chain.
Many of the more recent projects have been based on a Business Service Development (BSD) model in which farm-ers were provided improved understanding of and access to selected services (e.g., AI services) and quality inputs (e.g., feeds, veterinary drugs) and the capacities of service providers was strengthened. One example was the DFID-supported Business Service Market Development Program (BSMDP), which supported farmer links to both informal and formal supply chains. Several service hubs were established for milk bulking and chilling, regional AI stations were estab-lished, and support was given to agricultural input stockists.
USAID has supported the sector, most recently through its Kenya Dairy Development Program (KDDP) and the Kenya Dairy Sector Competitiveness Program (KDSCP). The latter emphasized the creation of sustainable local businesses, co-operatives, and enterprises to provide services for improve-ments in market expansion, cost competitiveness and pro-ductivity. Complementing this approach, several programs have focused on quality improvements, providing access to chilling equipment to reduce spoilage and increase milk sup-plies and incomes. For example, the KDDP developed the “Milk Quality System”—a kit containing six real-time cow-side technologies—as an alternative to centralized laborato-ries that use complex, nonportable, and expensive analytical equipment.
Lessons have been learned from these experiences and examples of good practice have been identified and repli-cated. For example, the experiences of Land O’Lakes with cooperative business services and TecnoServe with “service hubs” are now being replicated by other donors in Kenya and throughout the region. “Milking/service hubs” are places where milk can be bulked, cooled, and marketed. The centers link the farmers to processors and develop businesses that ensure a steady, cost-effective supply of goods and services to farmer groups. A key aspect is to link these chilling plants/business hubs to financial institutions to help the entities with their (substantial) financing needs. The service centers focus on creating incentives to small farmers and traders, to encourage them to invest in better production practices and improved technologies (including animals).
markets. In the context of informal markets, in Kenya for ex-ample, under the new provisions of the Dairy Act, the burden of compliance is passed on to traders who now need to be trained and certified and make small investments in testing equipment to be able to supply quality milk to the market. In Uganda, the fact that the formal sector has not been able to capture a significant share of the market due to constraints at milk collection and processing levels, has limited the op-portunities to reduce milk waste and contribute to income stabilization, as fluctuations in prices between dry and rainy seasons can reach 60 percent or more.
In contrast to Kenya and Uganda, dairy production is much less developed in Zambia and is a comparatively new activ-ity for smallholder farmers. It is estimated that about 1,700 smallholders sell into commercial supply chains. The entire smallholder output in 2008 was of a similar volume as the raw milk handled by many individual collection stations in Kenya and Uganda. In Zambia, dairy developed from large investments, both in production and processing capacity. The challenge of dairy development in this industry has been to scale-up domestic production to fulfill growing demand. Considerable amounts of powdered milk must be imported by the lead processors due to inadequate local availability of raw milk. From the perspective of smallholders, the challenge has been to achieve economies of scale—in production and bulking—and the quality required to become an attractive procurement option for the large-scale processors.
Development Agency Approaches to Smallholder Dairy
Support and Associated Compliance Challenges
The challenge of smallholder dairy development has been seen by development agencies through two distinct lenses. One is a commercial lens, with the aim being to enable small-scale farmers to supply more discerning market chan-nels (i.e., levels 3 to 4a) and, in so doing, contribute to higher levels of efficiency of the industry and increased regional trade. The second is a poverty reduction lens, with the aim being to support farmer participation in level 1 and 2 value chains, recognizing the incomes gained by producers as well as the benefits for poor consumers.
Kenya—In Kenya the dairy sector has been subject to con-siderable donor investments. Some US$40–50 million has been committed by donors to support the sector since 1997, excluding recent commitments within regional projects. Approaches to commercial dairy in Kenya have evolved from farmer-based approaches in the 1990s toward market-orient-ed approaches in the early 2000s, with farm improvements focusing on improving the quality of cattle stock. For this
CHAPTER 688
MAKING THE GRADE
Thus, in Kenya, it is apparent that within the context of sup-port to dairy development, collective action through “service hubs,” as the entry point for channeling support to smallhold-ers and a practical donor exit strategy, is the predominant ap-proach in current interventions, complemented by activities to strengthen the capacities of the business service provid-ers to serve the needs of smallholders and other actors. The IFAD-funded project under implementation by the Ministry of Livestock and Fisheries Development (MLFD) follows a similar approach for the formalization of milk supply, using
“business groups” as the entry point for intervention, but, importantly, relies on a step-wise process to strengthen farmer groups, complemented by investments in training and quality-related infrastructure (box 6.1). In Kenya, devel-opment agencies have also played a very important role in supporting dairy sector policy reforms.81
Uganda—In the late 1980s and early 1990s donor agencies made considerable investments to help rehabilitate Uganda’s dairy industry. Investments were made in insulated road tank-ers, refrigerated distribution trucks, coolers, lab equipment, and upgrading of milk collection facilities in production ar-eas—all within the domain of the parastatal Dairy Corporation (DC). With the support of DANIDA, the government initiated a process of reviewing the dairy policy. Yet, it was not until 2006 that the DC’s commercial arm was privatized.
Support to commercialization initiatives started in the mid-1990s with donor investments totaling around $12 million. The foci of activity have been on on-farm improvements and farmers’ collective action as a way to link producers to for-mal markets. However, with the larger donor investments, value-chain interventions have dominated. Support for the establishment and development of industry service-based organizations has been quite prominent in Uganda. It is likely that the service/milk hubs approach will become the domi-nant method of intervention to reach smallholders, through, for example, the investments to be made by the East Africa Dairy Development Project (EADD).
In terms of quality upgrading, one of the most significant changes has been the support to policy action/regulatory intervention leading to the ban on the use of plastic contain-ers to carry milk (2002), and the requirement of the use of chilling equipment and insulated tankers by traders except for local sales within the immediate farm area (2006). In Uganda, transport distances are larger than in Kenya, and, therefore, chilling is critical. As a consequence of this policy change, large parts of the so-called informal sector
81 The new dairy policy now clearly acknowledges the role of the informal market actors in the development of the sector. Do-nors have provided support to the implementation of the policy, which has implied support to the certification of trainers of trad-ers; licensing of traders; training to traders, transporters, milk bars, and so forth; the creation of traders associations, and so forth. The Improving Quality Assurance in Milk Markets (IQAM) implemented by Strengthening Informal Sector Training and Enterprise (SITE), with funds of DANIDA and the Department for International Development (DFID), was formulated with the objective of supporting the policy implementation. Traders now appear as a key target group in recent projects.
Project interventions are targeted to support the pro-gressive movement of groups or individuals through steps:
(a) Step 1. Here, there is increasing collective activity (for example, in the form of contact with input suppliers to purchase feed in bulk) and a clear increase in incomes. Evidence of consistent successful activity (measured at this low level in terms of volume or a slightly increased profit level) will indicate that the group can move on to the next level. The group or individual will decide when and how to take the next step.
(b) Step 2. Following a period of time and based on their broadened perspectives and understanding of market opportunities, the group may decide to build capacity to expand and assume a higher level of risk. The bulk of program resources will support technical training ac-tivities to help beneficiaries gain the knowledge to cope with risk.
(c) Step 3. Groups become organized as business en-tities and expand and consolidate their activities. They should also be able to demonstrate that they have sus-tained dairy-based activities generating a profit that pro-vides regular incomes to their members. The entity (for example, a self-help group, women’s group, cooperative, or company) can then be considered to have progressed to maturity.
Gradual adoption of dairy product standards is encour-aged through awareness-raising and capacity-building for milk producers, processors, traders and consumers. Investments in small dairy cooling/processing units are also supported.
Source: IFAD (2005).
BOX 6.1: Formalizing Milk Supply in Kenya: The Market-Oriented Dairy Enterprise Approach
CASE STUDIES: UPGRADING FOR THE DOMESTIC MARKET AND FOR TRADITIONAL EXPORT COMMODITIES 89
ECONOMIC AND SECTOR WORK
in Uganda have become relatively sophisticated in which medium-size traders have their own collection networks and cooling tanks in farm areas, and bring raw milk for sale in insulated tankers. Estimates indicate that, as a result of this policy change, over 200,000 small-scale traders were pushed to exit the business during the transition period of policy implementation, and as a result of not being able to afford the required upgrades.
Zambia—Dairy investments have often been made within the context of broader programs and, therefore, it is difficult to estimate the size of the investments made. The support has needed to be significant since smallholder dairying was started nearly from scratch and substantial investments have included the high start-up costs of livestock. Although value chain approaches have been applied, the focus of the invest-ments has been on on-farm productivity and aggregation of product to achieve economies of scale, the latter being an enormous challenge in Zambia.82
Approaches have included working with two types of farm-ers. One group was better endowed smallholders who own relatively large numbers of cattle, but who were never en-gaged in trade. It was expected that these farmers were able to more easily absorb the training messages and make the transition to commercial dairy production. The other target group has been food-insecure households for whom dairying would be an entirely new activity.
Donors have tested several approaches to support the partic-ipation of the larger smallholder farmers in formal dairy mar-kets. Commercial demand for fresh milk was on the rise, and it was perceived that this so-called “ready market” offered an ideal opportunity for smallholders to deliver their surplus milk and become part of the modern supply chain (Mukumbuta and Sherchand 2006). However, it quickly became apparent that the surplus milk model was not sufficient for long-term success. Given the low productivity of the traditional live-stock, very often milk volume was too small to justify de-livery. More integrated approaches have been implemented under value-chain frameworks, including providing intensive
types of support focused on the fundamentals of good dairy management and breed improvement, facilitating farmer ac-cess to high-yielding livestock, and facilitating investments in milk bulking.
Support to new dairy farmers has included intensive training in dairy production and milk hygiene, and the provision of a pregnant heifer with the understanding they must pass on the first female calf to another group member as a way to extend the program’s outreach and minimize costs per ben-eficiary. Some observers argue that the pass-on requirement can create significant risks to farmers and could undermine the long-term sustainability of new value chains developed with project assistance (Keyser 2006, 2008). Business ser-vice development approaches have been tested but have faced the challenge of enough demand for the services, given the relatively small number of small-scale producers and their dispersion over large geographic areas.
Evidence of Impacts and Learning
Dairy production has increased significantly in the region, in both formal and informal markets. In Kenya, for example, estimates indicate that the formal sector has nearly tripled in size since 2001, reaching about 420 million liters in 2007. The marketing of raw milk has also grown quite rapidly. From 2001 to 2007, the amounts being marketed through raw milk channels increased by 430 million liters (Grant 2008). Development support to the dairy sector has undoubtedly contributed to these gains, particularly in terms of ensuring that quality milk reaches formal channels.
From the review of different donor experiences, it is clear that the major constraints to smallholder dairying in East and Southern Africa have related to long-standing issues about on-farm productivity, animal husbandry, and the economics of milk bulking and marketing rather than the more recent focus on addressing the challenges of quality upgrading. Although standards-related requirements have played an important part in shaping donor and private investor strate-gies for channeling milk to the formal sector, there is little evidence that new quality requirements have kept small farmers from successful dairy marketing.
This is not to say that quality upgrading has not been im-portant. In Kenya and Uganda, where farmers are used to selling in level 1- and level 2-type markets, the experiences have showed that farm-level upgrading to levels 4 and 4a can be particularly difficult without adequate price incentives being provided by processors. Dairy projects in this setting, therefore, have needed to focus on farmer training in cost-
82 Financial analyses have shown that a typical bulking center in Zambia requires a minimum throughput of 200,000 liters per year to break even. Many of the centers set up through donor proj-ects have had an annual throughput of 60,000 liters or less. They will thus require several years of steady growth—or continued subsidization—in order to eventually achieve financial indepen-dence. Zambia’s thin production base is the main cause of this problem, although the situation has been compounded by donor priorities that have sometimes required project implementers to spread interventions over many locations for the sake of equity.
CHAPTER 690
MAKING THE GRADE
effective management improvements, helping producers to afford metal dairy equipment, and other types of investments that make trading with formal sector buyers more reliable and appealing. Thus in this type of market, the challenge has been the high costs of dairy development and finding the right balance in project activities to address the bottlenecks that matter most.
Some development partners have argued that although proj-ect activities have contributed to increasing the volume of milk produced and marketed by the targeted groups, quality issues through the whole value chain remain a problem, par-ticularly in Kenya, and low milk quality has affected the ability of processors to diversify into higher-value products and take advantage of underserved regional markets. Unless these markets are exploited through improved quality, increased production will ultimately lead to low farm gate prices, a major disincentive to the smallholder dairy farmer (Land O’Lakes 2008).
In newly emerging dairy countries such as Zambia, where informal markets are less prevalent, more comprehensive kinds of assistance have been required to achieve the stan-dards that commercial processors require. Despite the costs of this assistance, project directors say that the challenges of quality upgrading have actually been easier to address in Zambia than in East Africa, since new farmers can be trained and equipped to do things right from the very beginning.83 Because of the focus on dairy development as a route to im-proved food security, however, another important risk arises in spreading the production base too thinly and, therefore, never achieving sufficient economies of scale in post-farm operations.
In terms of interventions to support quality improvements in informal markets, Kenya’s experience of endorsing small-scale milk vendors and milk bar operators through a certifica-tion and licensing program demonstrates that investments can bring these markets to level 3-type standards, while helping to create a more level playing field for formal sector operators to compete and attract the kind of supplies they need for value-added processing. Studies have begun to quantify the specific impacts of this policy, which are dem-onstrating positive outcomes in terms of welfare effects, reduction of transaction costs, reduction of consumer prices, and changes in behavior among regulators—away from a policy of harassment and rent-seeking. They have also high-lighted the need for a fairer way of assessing certification fees among producers and consumers (Kaitibie et al. 2009).
Similarly, considerable success has been achieved in Uganda by working with small-scale traders to improve the depend-ability of raw milk markets by investing in new dairy equip-ment and the training of operators in hygienic dairy handling. Even in Zambia where the outlets for raw milk are much smaller, counter sales have still been an important revenue stream at most bulking centers and often provide more value per liter compared to selling to a formal buyer once the costs of milk transportation are taken into account. As a strategy to help overcome the major problem in Zambia of achieving effective economies of scale, the importance of local outlets and potential for simple kinds of processing that add value to local production should be considered.
In terms of project approaches, there has been a lot of experi-mentation on ways to better serve the needs of smallholders and of the industry. The sequencing of donor interventions and the replication of effective approaches have been clearly observed. For example, many of the most sustainable busi-ness service models piloted by a project have then been supported and expanded by other programs. The BSD ap-proaches for dairy support have benefited from the plentiful supply of trained veterinary staff and an increasing presence of suppliers of basic services (such as artificial insemination, clinical and agro-vet services, and so on), and from the exist-ing technologies, financial infrastructure, and existing models of service hubs (cooperatives). Yet, sustainability of business service providers has frequently depended upon their ability to provide a diverse range of services.
The dairy sector offers considerable promise for smallholder participation despite the importance of quality standards and buyer demands in some market segments. Quality standards have not been the most important barrier to successful smallholder dairying, but attention to quality and investments
83 Milk quality test results in smallholder collection centers have recorded higher total plate count results than commercial and emergent farmers, but have still been consistently within the B-grade range, which is entirely acceptable even for producing UHT milk. Compared with East Africa, where smallholder total plate counts often exceed 2 million cfu/ml, the results for Zam-bia are outstanding and well within the limits set out in the draft COMESA standards. From 2003 to 2007, 0.2 percent of small-holder milk was classified as A-grade, 88.8 percent was B-grade, and 11 percent was C-grade. Over the same period, 88 percent of commercial famer milk was classified as A-grade, 12 percent was B-grade, and less than 1 percent was C-grade. Commercial farmers mostly use automatic milking machines and on-farm cooling tanks. Smallholder milk is sometimes regarded as su-perior to commercial farmer milk, particularly with regard to but-terfat content from which dairy processors make most of their revenue. This is a result of many small farmers being provided with Jersey cows, which are hardier under local conditions and naturally produce milk with more fat content than the Friesian cows owned by most large commercial producers.
CASE STUDIES: UPGRADING FOR THE DOMESTIC MARKET AND FOR TRADITIONAL EXPORT COMMODITIES 91
ECONOMIC AND SECTOR WORK
in quality upgrading are important and can have significant impact on farmer revenues, trade competitiveness, and the total value added by the national industries.
CASE 3: BREWING UP PRODUCTIVITY AND INCOME GAINS LINKED TO SORGHUM
Upgrading Production and Marketing Arrangements
In SSA, sorghum is still largely a subsistence food crop. Its production is crucial to food security given its unique char-acteristics to resist drought and withstand periods of high temperature. It also grows well in subtropical Africa, char-acterized by intermittent rains and by brief periods of very high rainfall. In fact sorghum is not only drought-resistant, it can also withstand periods of water logging (Taylor 2010). In Uganda, the crop is mainly grown in drier areas in the east-ern, northern, and southwestern regions, and is, together with maize and millet, one of the most important staple cere-als in the country.
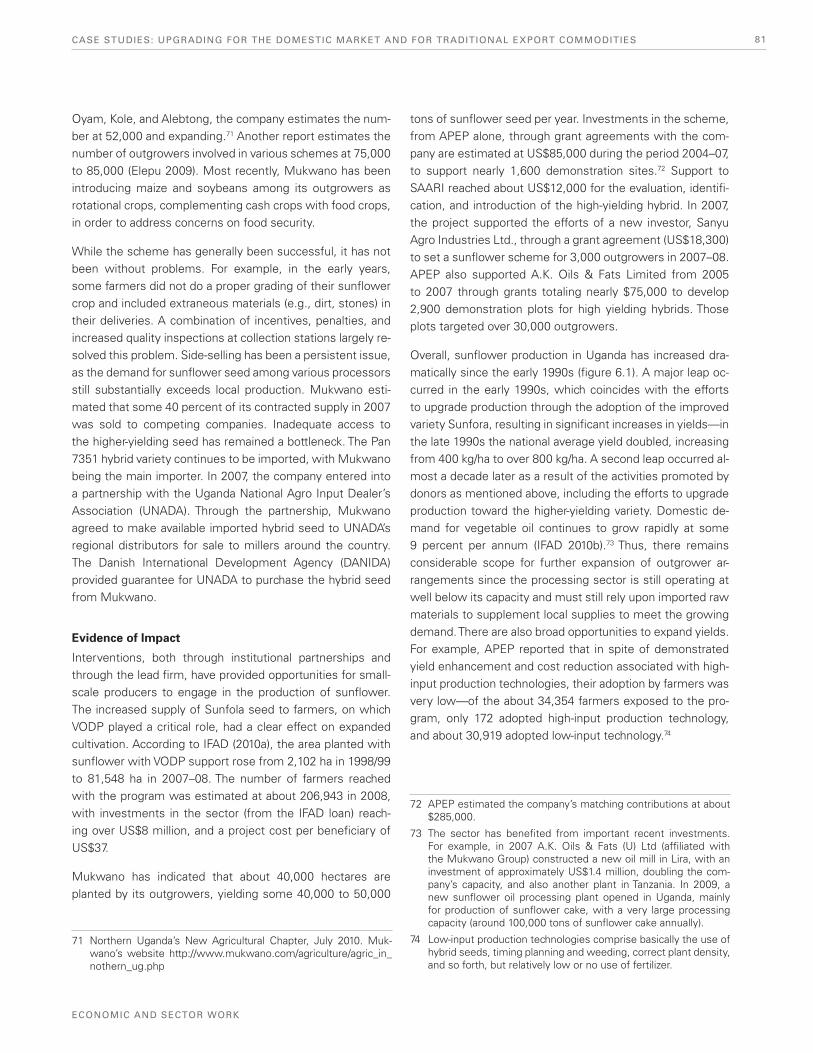
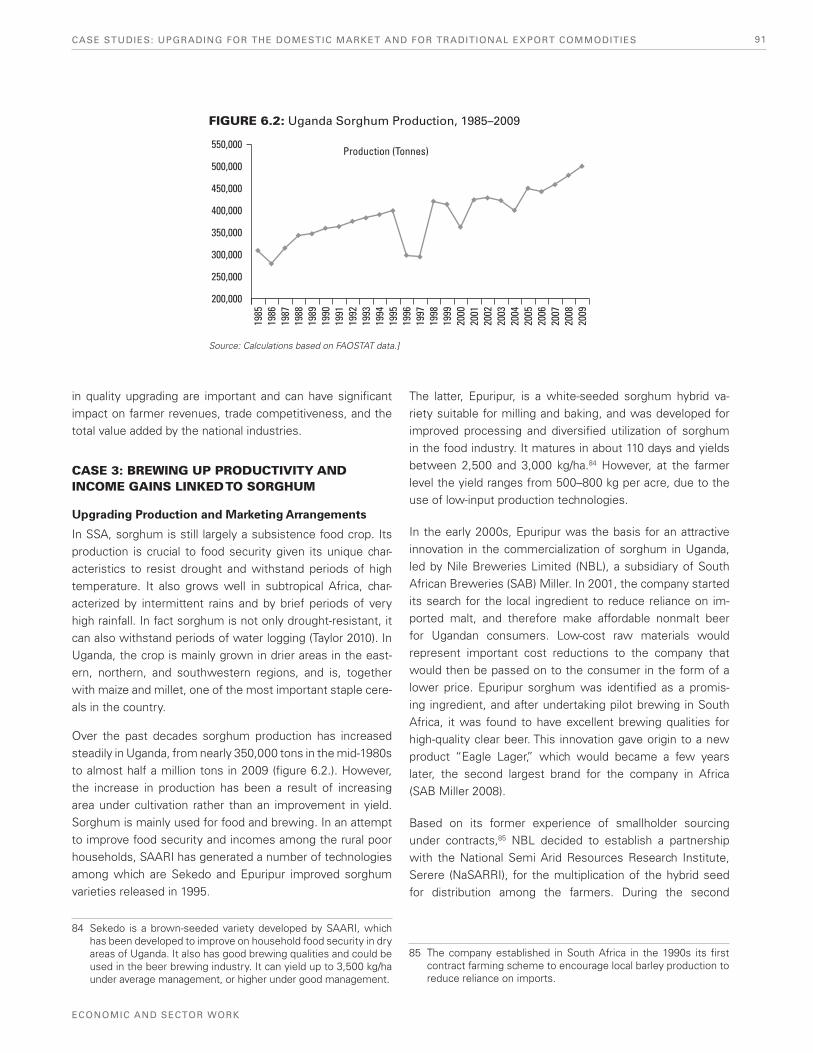
Over the past decades sorghum production has increased steadily in Uganda, from nearly 350,000 tons in the mid-1980s to almost half a million tons in 2009 (figure 6.2.). However, the increase in production has been a result of increasing area under cultivation rather than an improvement in yield. Sorghum is mainly used for food and brewing. In an attempt to improve food security and incomes among the rural poor households, SAARI has generated a number of technologies among which are Sekedo and Epuripur improved sorghum varieties released in 1995.
The latter, Epuripur, is a white-seeded sorghum hybrid va-riety suitable for milling and baking, and was developed for improved processing and diversified utilization of sorghum in the food industry. It matures in about 110 days and yields between 2,500 and 3,000 kg/ha.84 However, at the farmer level the yield ranges from 500–800 kg per acre, due to the use of low-input production technologies.
In the early 2000s, Epuripur was the basis for an attractive innovation in the commercialization of sorghum in Uganda, led by Nile Breweries Limited (NBL), a subsidiary of South African Breweries (SAB) Miller. In 2001, the company started its search for the local ingredient to reduce reliance on im-ported malt, and therefore make affordable nonmalt beer for Ugandan consumers. Low-cost raw materials would represent important cost reductions to the company that would then be passed on to the consumer in the form of a lower price. Epuripur sorghum was identified as a promis-ing ingredient, and after undertaking pilot brewing in South Africa, it was found to have excellent brewing qualities for high-quality clear beer. This innovation gave origin to a new product “Eagle Lager,” which would became a few years later, the second largest brand for the company in Africa (SAB Miller 2008).
Based on its former experience of smallholder sourcing under contracts,85 NBL decided to establish a partnership with the National Semi Arid Resources Research Institute, Serere (NaSARRI), for the multiplication of the hybrid seed for distribution among the farmers. During the second
85 The company established in South Africa in the 1990s its first contract farming scheme to encourage local barley production to reduce reliance on imports.
84 Sekedo is a brown-seeded variety developed by SAARI, which has been developed to improve on household food security in dry areas of Uganda. It also has good brewing qualities and could be used in the beer brewing industry. It can yield up to 3,500 kg/ha under average management, or higher under good management.
FIGURE 6.2: Uganda Sorghum Production, 1985–2009
Source: Calculations based on FAOSTAT data.]
550,000
500,000
450,000
400,000
350,000
300,000
250,000
200,000
1985
1986
1987
1988
1989
1990
1991
1992
1993
1994
1995
1996
1997
1998
1999
2000
2001
2002
2003
2004
2005
2006
2007
2008
2009
Production (Tonnes)
CHAPTER 692
MAKING THE GRADE
season of 2002, the company provided 10 metric tons of seeds to farmers in four districts—Soroti, Kumi, Katakwi, and Kaberamaido—initiating the first contract farming scheme for sorghum production in Uganda.
The scheme has benefited from the engagement of other or-ganizations, all playing critical roles. For example, SAB Miller/NBL, together with NARO, NaSARRI, and NAADS, have respectively provided the financial and technical assistance required for the smooth running of the contract scheme; and Afro-Kai Limited (a seed and commodity broker, who joined the scheme in 2003) is responsible for seed multiplication and distribution, as well as for the procurement of the har-vested product from the farmers, including transport and storage. Afro-Kai multiplies Epuripur seeds on its own farms and through organized growers. Seeds for planting are then distributed by Afro-Kai via farmers’ associations and govern-mental and nongovernmental organizations. NBL/Afro Kai does not enter into direct forward contracts with farmers but with district farmers’ associations. The GoU supported the initiative through removing the excise duty paid by NBL on beer produced under the contractual scheme (Eagle Lager and Eagle Extra Lager)—this was increased from zero at the beginning of the scheme to 20 percent in 2006.86
The initial pilot comprised only 350 farmers from four tradi-tional sorghum producing districts. In the season 2002/2003 the number of farmers participating in the scheme increased to 1,133 and reached 8,326 farmers in 2006, generating a supplemental or seasonal labor demand for about 58,238 rural workers. Prior to 2005, the double seasonal production of sorghum by contracted farmers resulted in undersupply—below the projected production quantities, with several fac-tors responsible for this including the reluctance of farmers to adopt the seeds and civil disturbance in 2003.
As a result, Afro-Kai initiated a more aggressive strategy to increase the volume of product reaching NBL’s plant by ex-panding the number of farmers recruited into the contract scheme, including the recruitment of relatively large-scale farmers. NBL was then a victim of its success, with the 2006 harvest causing oversupply. Increased confidence of a reliable market at a guaranteed price, a better under-standing by farmers of the need to buy seeds, access to extension services, and volatility of markets of other cash crops such as cotton, contributed to many farmers em-bracing the scheme, and, with ample seed available, to
the delivery of sorghum supplies more than double NBL’s requirements.
The company honored the contracts and ensured that farmers were informed that the company was not going to buy sorghum in the next season, and it supplied farm-ers with maize and rice seeds to ensure that their incomes wouldn’t drop off significantly. Yet it also started to put in place a strategy to prevent oversupply in the future, includ-ing selective distribution of seeds to limit harvests, inden-tifying specific communities for long-term relations and more timely communication with farmers. In 2007/2008, the number of farmers involved in the scheme dropped to 1,071. Yet, since then the company’s brewing capacity has been expanded and some 5,800 farmers were involved in the scheme in 2009.
Benefits Accruing to Farmers
Clearly the farmers that have been able to participate in the scheme have benefited from an assured or reliable market, an additional source of cash income, and increased adoption of improved sorghum technologies. Afro-Kai/NBL remains the single largest buyer of Epuripur sorghum, with the other marketing channels available offering lower prices and trad-ing lower volumes. There have been, however, a few occa-sions when alternative marketing channels have become more attractive. For instance, due to the huge demand for grain in South Sudan some Epuripur sorghum has found its way there.
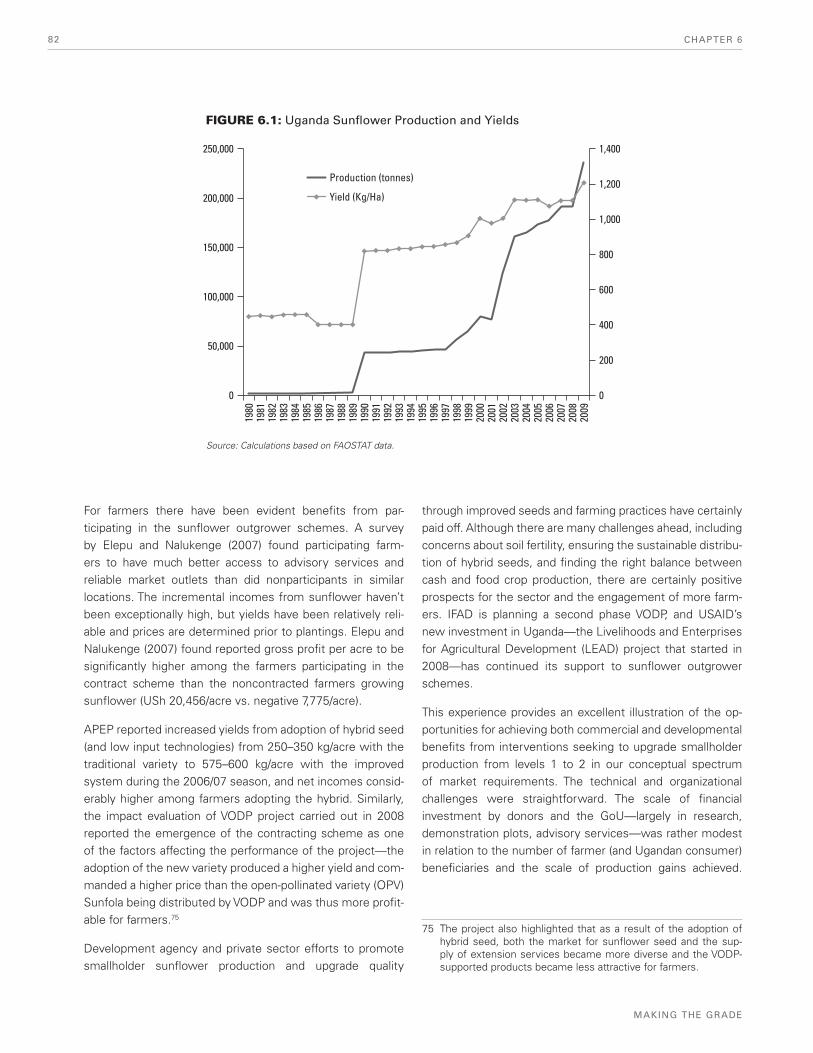
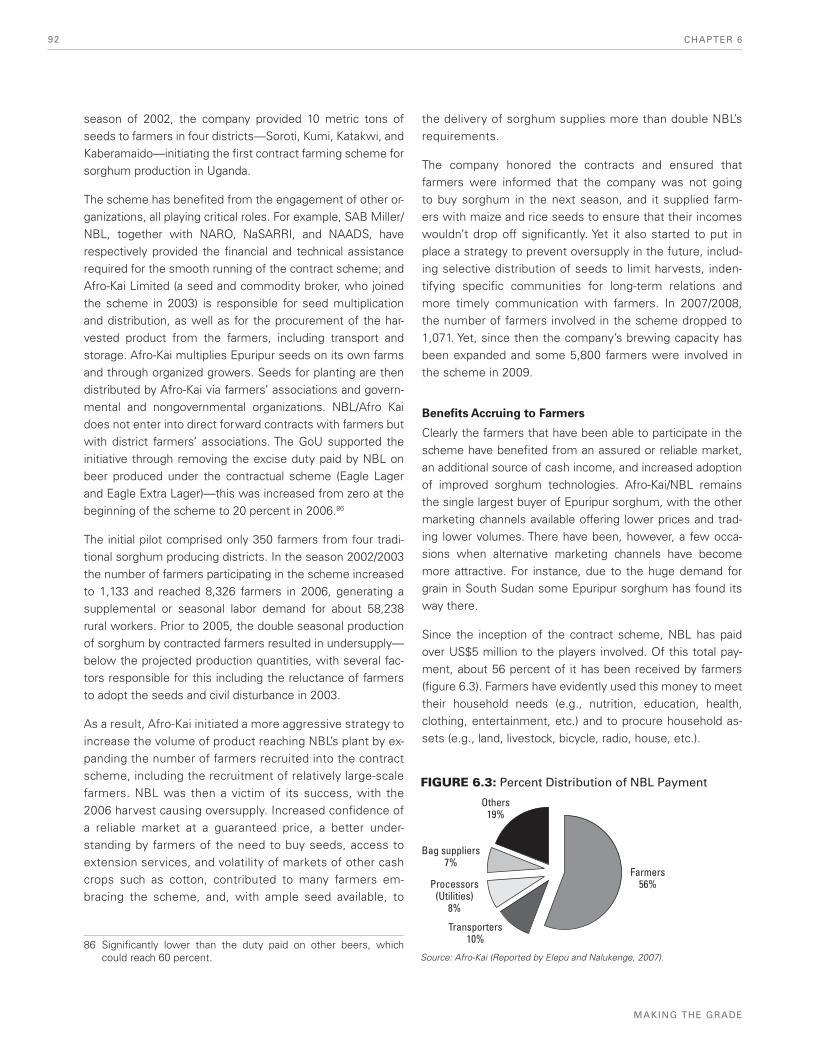
Since the inception of the contract scheme, NBL has paid over US$5 million to the players involved. Of this total pay-ment, about 56 percent of it has been received by farmers (figure 6.3). Farmers have evidently used this money to meet their household needs (e.g., nutrition, education, health, clothing, entertainment, etc.) and to procure household as-sets (e.g., land, livestock, bicycle, radio, house, etc.).
86 Significantly lower than the duty paid on other beers, which could reach 60 percent.
Others19%
Bag suppliers7%
Transporters10%
Farmers56%Processors
(Utilities)8%
FIGURE 6.3: Percent Distribution of NBL Payment
Source: Afro-Kai (Reported by Elepu and Nalukenge, 2007).
CASE STUDIES: UPGRADING FOR THE DOMESTIC MARKET AND FOR TRADITIONAL EXPORT COMMODITIES 93
ECONOMIC AND SECTOR WORK
by the company, which they believe have provided better re-sults. The partnership model avoids the company taking over responsibilities that are outside its core competencies, but also allows it to get a certain level of control, to be able to get the grip with emerging problems.
CASE 4: AFRICA’S GROUNDNUT TRADE AND EUROPEAN UNION (EU) MYCOTOXIN STANDARDS88
Compliance with EU Aflatoxin Standards: A Barrier to
SSA Trade to Europe?
Awareness of the safety risks associated with the consump-tion of products contaminated with mycotoxins—aflatoxins in particular—has increased significantly since the late 1980s, when the International Agency for Research on Cancer (IARC) placed Aflatoxin B1 on the list of human carcinogens. In response, countries have established a set of regulatory measures to reduce risks associated with consumption of products contaminated with aflatoxins. The European Union’s adoption of harmonized standards for aflatoxins in groundnuts and groundnut products in 1998, above the lev-els that were proposed/discussed at the Codex Alimentarius Commission,89 has been one of the most controversial food safety regulatory interventions in international trade. It has been argued, and discussion remains ongoing, that the strict EU standards would not significantly lower the health risk to consumers, but they would impose serious costs or technical difficulties on the suppliers. The discussions have also ques-tioned EU methods of sampling and analyzing aflatoxins.90 It is empirically difficult to determine definitively how one country or region adopting new or more stringent standards affects trade, because of the many repercussions of such
Other actors also benefit: The company estimates the beer sales revenue at US$43 million per year in Uganda (SAB Miller 2008), generating revenues to the Ugandan govern-ment estimated at nearly US$6.8 million on excise duty and VAT of US$4.8 million in 2007/08. Eagle Lager has been part of SAB Miller’s success in Uganda.
The company estimates that farmers have received over US$3.8 million through the program over the past four years, providing a supplemental income of around $250 per farmer over and above their subsistence farming, with each farmer supplying an average of 1.4 tons of sorghum each year.
The introduction of Epuripur sorghum, and its contractual pro-duction arrangements, has led to its wide adoption by farm-ers. Previously, the adoption of improved sorghum technolo-gies such as improved varieties had been low mainly due to the lack of output markets. For example, improved sorghum varieties that have been developed before but have not been widely adopted include Serena, Seredo, and Sekedo.
Although the scheme does not operate without problems, it does certainly constitute an example of the upgrading possibilities available to private actors, the government, and development partners to leverage poverty outcomes through upgrades at levels 1 and 2. In the example cited, the market served may not have the capacity to engage thousands of small-scale producers; however, it illustrates the power of markets to leverage supply-chain improvements. In Africa, a number of improved hybrid varieties of sorghum are avail-able that can help improve yields (Olembo et al. 2010). The experience in Uganda illustrates how combining improved technology with strong market links can provide a powerful boost even for a crop that is not generally considered a cash crop in Africa.
SAB Miller has recently highlighted the learning that the experience in Uganda has provided to the company’s op-erations in other locations. In 2005 the company initiated a similar operation in Zambia, operating almost entirely through an outsourcing model benefiting around 2,600 producers in 2007/08.87 The operations in Tanzania and South Africa have been implemented through an in-sourcing model, with the company providing directly the support and leading the op-eration. In Uganda, and most recently in India, the programs used a partnership model, with various levels of engagement
87 Partners in the initiative include the NGO CARE, the Cooperative League of the United States of America (CLUSA), and CHC Com-modities, a grain dealer and brokerage firm.
88 For a more detailed analysis of this case see Diaz Rios and Jaffee (2008).
89 EU maximum limits for groundnuts to be subjected to sorting, or other physical treatment, before human consumption or use as an ingredient in foodstuffs were set at 8.0 ppb for B1 for 15.0 ppb for Total aflatoxins. The maximum limit for groundnuts and nuts, and processed products thereof, intended for direct human consumption or use as an ingredient in foodstuffs were set at 2.0 ppb for B1 for 4.0 ppb for Total aflatoxins. Codex maximum limit for peanuts intended for further processing (hereafter re-ferred to as “Codex limit”) was set at 15 ppb.
90 Criticism has also extended to the maximum levels set by Codex, as the recommendations resulting from the risk assessment car-ried out by JECFA compared relatively low levels (10 ppb and 20 ppb), with critics arguing that the developing-country perspec-tive—that such levels would be very challenging to achieve and would not greatly reduce risk—was not considered during the process of setting the Codex International Standard.
CHAPTER 694
MAKING THE GRADE
Evolution of EU Market Requirements for Groundnuts
and Groundnut Products and Upgrades Required to
Achieve Sustained Market Participation
Since the colonial era, groundnut exports have tradition-ally been an important source of export revenue for several African countries and a source of livelihood for thousands of SSA small-scale producers. The market demands of the EU—the lead importing market—have played a critical role in determining SSA’s participation and competitiveness in groundnut trade, and in shaping international trade for groundnuts and groundnut products, overall. These mar-ket developments have involved a period of increasing EU demand for vegetable oil and industrial oils and fats, which marked the emergence and expansion of SSA’s groundnut production and trade during the 1960s and 1970s and the subsequent shift from the oil market to edible groundnuts in the 1980s. The shift to edible groundnuts led to tough com-petition among old (SSA and United States) and emerging (Argentina and China) suppliers to capture a larger share of the EU market, including being able to effectively respond to new, stricter and evolving market requirements. The evolu-tion of these requirements and associated systems for con-formity assessment are illustrated in figure 6.4.
The evolution of requirements in the edible groundnut trade to Europe has implied two clear phases of upgrading steps at production and processing levels. The first phase related to very basic product quality and productivity upgrades (upgrades from level 1 to 2) and implies the expansion of crop areas or increased yields (or a combination of both) and adoption of desirable varieties and grades. The second phase involved the adoption of improved production and postharvest tech-nologies and practices to maintain quality and quantities, but also to achieve safety outcomes and differentiate products (upgrades at levels 3 to 5). These second stages of upgrades are combined with end-product testing and inspections at different stages of the supply chain implemented by official authorities in importing and/or in the exporting countries, as well as by the buyers and exporters.
In the first stage, upgrades are facilitated by reliable external markets for inputs and outputs, extension services, access to credit and technologies, and a stable macroeconomic environment. The second phase of upgrades is facilitated by (i) available knowledge of production and processing practices (e.g., good agricultural practice—GAP—and good manufacturing practices—GMP), technologies (e.g., shelling/blanching), and systems (e.g., Hazard Analysis and Critical Control Point—HACCP) oriented at reducing aflatoxin con-tamination and differentiating products, (ii) availability of
standards, the varied responses, and the multitude of other factors affecting trade flows and competitiveness. Even so, there have been some attempts to measure the impacts. For aflatoxins, some of the most referenced studies on the trade impacts of the EU regulations come from Otsuki and others (2001a, 2001b). The authors predict large losses for Africa’s trade in cereals, nuts, and dried fruit to Europe.91 Although the authors employed a hypothetical and greatly simplified model, their findings have frequently been referred to as evidence that African countries in fact lost such levels of trade as a result of EU regulations, and consequently, these stricter regulations have often been referred to as the cause for SSA’s continued marginalization within international groundnut trade.
The responses adopted by countries to the challenges as-sociated with market developments are critical to ensure their sustained participation in the served markets. Suppliers of groundnuts and groundnut products to the EU responded very differently to the challenges imposed by strict standards and overall demands for quality and safety. In some coun-tries, the response has included proactive, forward-looking strategies seeking to reinforce competitive advantages, with stricter standards acting as a catalyst for continued improve-ments. In other countries, the response was to deliberately accept rejections as part of business costs, with tremendous consequences for these industries. Often, the noncompli-ance by individual companies resulted in collective punish-ment against an entire export-oriented cluster of companies. These events forced industries (and governments) to act reactively and defensively, seeking to adjust in the face of restricted trade. As analyzed below, the most effective re-sponses to compliance challenges associated with stricter standards have come from those industries that had been gradually making investments to improve their competitive position in the EU market. SSA industries, for several rea-sons, have failed to do so.
91 Their findings suggested that the trade of nine African countries would potentially decline by $400 million under the proposed, stringent new EU standards, whereas this trade might have in-creased by some $670 million had the EU based its new har-monized standards on the guidelines of the Codex Alimentarius (Otsuki et al. 2001a). A second study, focusing only on edible groundnut exports from Africa, estimated that the new EU stan-dard for aflatoxin would result in an 11 percent decline in EU im-ports from Africa, and a trade flow some 63 percent lower than it would have been had the Codex international standards been adopted (Otsuki et al. 2001b).
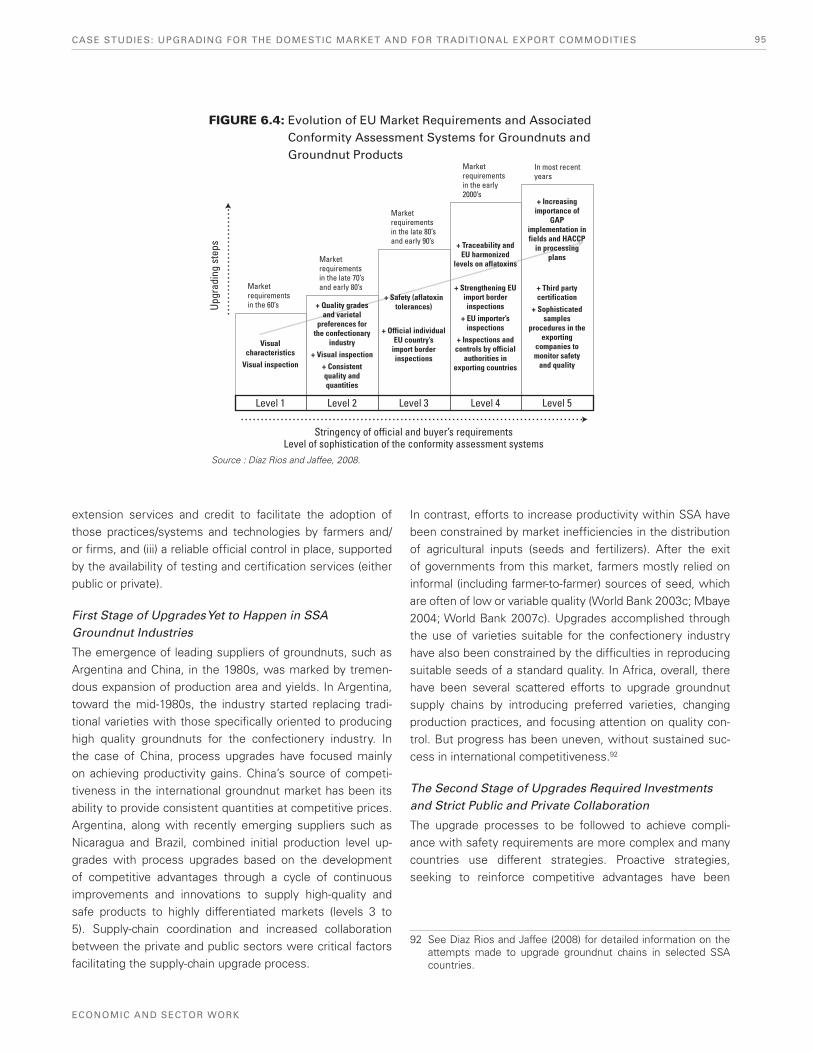
CASE STUDIES: UPGRADING FOR THE DOMESTIC MARKET AND FOR TRADITIONAL EXPORT COMMODITIES 95
ECONOMIC AND SECTOR WORK
In contrast, efforts to increase productivity within SSA have been constrained by market inefficiencies in the distribution of agricultural inputs (seeds and fertilizers). After the exit of governments from this market, farmers mostly relied on informal (including farmer-to-farmer) sources of seed, which are often of low or variable quality (World Bank 2003c; Mbaye 2004; World Bank 2007c). Upgrades accomplished through the use of varieties suitable for the confectionery industry have also been constrained by the difficulties in reproducing suitable seeds of a standard quality. In Africa, overall, there have been several scattered efforts to upgrade groundnut supply chains by introducing preferred varieties, changing production practices, and focusing attention on quality con-trol. But progress has been uneven, without sustained suc-cess in international competitiveness.92
The Second Stage of Upgrades Required Investments and Strict Public and Private Collaboration
The upgrade processes to be followed to achieve compli-ance with safety requirements are more complex and many countries use different strategies. Proactive strategies, seeking to reinforce competitive advantages have been
extension services and credit to facilitate the adoption of those practices/systems and technologies by farmers and/or firms, and (iii) a reliable official control in place, supported by the availability of testing and certification services (either public or private).
First Stage of Upgrades Yet to Happen in SSA Groundnut Industries
The emergence of leading suppliers of groundnuts, such as Argentina and China, in the 1980s, was marked by tremen-dous expansion of production area and yields. In Argentina, toward the mid-1980s, the industry started replacing tradi-tional varieties with those specifically oriented to producing high quality groundnuts for the confectionery industry. In the case of China, process upgrades have focused mainly on achieving productivity gains. China’s source of competi-tiveness in the international groundnut market has been its ability to provide consistent quantities at competitive prices. Argentina, along with recently emerging suppliers such as Nicaragua and Brazil, combined initial production level up-grades with process upgrades based on the development of competitive advantages through a cycle of continuous improvements and innovations to supply high-quality and safe products to highly differentiated markets (levels 3 to 5). Supply-chain coordination and increased collaboration between the private and public sectors were critical factors facilitating the supply-chain upgrade process.
92 See Diaz Rios and Jaffee (2008) for detailed information on the attempts made to upgrade groundnut chains in selected SSA countries.
Level 1
Upgr
adin
g st
eps
Visualcharacteristics
Visual inspection
Marketrequirementsin the 60’s
Level 2
+ Quality gradesand varietal
preferences forthe confectionary
industry+ Visual inspection
+ Consistentquality andquantities
Marketrequirementsin the late 70’sand early 80’s
Level 3
Stringency of official and buyer’s requirementsLevel of sophistication of the conformity assessment systems
+ Safety (aflatoxintolerances)
+ Official individualEU country’s
import borderinspections
Marketrequirementsin the late 80’sand early 90’s
Level 4
+ Traceability andEU harmonized
levels on aflatoxins
+ Strengthening EUimport borderinspections
+ EU importer’sinspections
+ Inspections andcontrols by official
authorities inexporting countries
Marketrequirementsin the early2000’s
Level 5
+ Increasingimportance of
GAPimplementation infields and HACCP
in processingplans
+ Third partycertification
+ Sophisticatedsamples
procedures in theexporting
companies tomonitor safety
and quality
In most recentyears
FIGURE 6.4: Evolution of EU Market Requirements and Associated Conformity Assessment Systems for Groundnuts and Groundnut Products
Source : Diaz Rios and Jaffee, 2008.
CHAPTER 696
MAKING THE GRADE
China—In contrast to the situation in Argentina, China’s production of groundnuts is highly fragmented. Limited availability of arable land and a large rural population restrict large-scale peanut cultivation. Despite this, according to EU buyers, Chinese peanuts have come a very long way in terms of quality, with remarkable improvements in the control sys-tems, implemented by both the private and public sectors, to assure compliance. However, for China, the delay in compli-ance has had considerable consequences. As a result of the mission carried out by the EU authorities to assess the sys-tems in place for aflatoxin control in 2001, specific provisions were set for peanuts consigned from or originating in China. A second mission, carried out in December 2006, indicated that China had made great progress during the ensuing five years to improve the system to certify compliance, including significant changes in the regulatory framework in terms of registering establishments, sampling and analyzing peanuts for export, setting domestic standards for aflatoxin (aflatoxin B1 at 20 ppb), and improving public and private infrastructure for conformity assessment. In 2006, more than a dozen ac-credited official laboratories and two private laboratories car-ried out official analysis for aflatoxins on product intended for export. At the time of the first EU assessment mission, the General Administration of Quality and Supervision, Inspection and Quarantine (AQSIQ), responsible for the control of pea-nut exports, had only recently been established. Since then, the capacities of AQSIQ have considerably strengthened.
Furthermore, the government was promoting a “shock tactic policy” to promote approaches to aflatoxin reduction among farm and exporter operations. These policies included enforc-ing requirements related to the application of GAPs, GMPs, and HACCP during cultivation and processing of peanuts for export; application of aflatoxin levels stricter than the ones set by the EU; and suspension of sanitary registration to those companies that are involved in a Rapid Alert System for Food and Feed (RASFF) notification, until corrective mea-sures have been taken and verification is carried out.
Experiences from SSA—As in the case of China, reactive measures to prevent aflatoxin contamination, though not yet generalized, have also been taken in some SSA countries. For example, in Ghana, the government has initiated a pro-gram to support the implementation of GMPs and HACCP principles in small- and medium-scale enterprises. A most recent milestone was the accreditation of a laboratory for microbiological analysis with support of several donors, in 2009.
In Malawi, the National Smallholder Farmers Association of Malawi (NASFAM) and International Crops Research Institute
adopted by countries such as Argentina, and most recently also Nicaragua and Brazil. In China and Egypt, in contrast, significant reactive measures came after groundnut intercep-tions (and a temporary ban in Egypt) and critical inspection missions by EU authorities. In all cases, effective responses have implied strong collaboration between the public and the private sector, as well as upgrading the capacities of both. A discussion of a few of those experiences follows.
Argentina—The country’s efforts to achieve compliance with EU regulatory developments have included regulatory measures; technical and scientific research; improvements in production, postharvest, and processing technologies; in-vestments in physical infrastructure; and strengthening of ac-creditation and certification systems. At the regulatory level, responsibility for the control of agricultural products exported from Argentina (including groundnuts) lies with the National Service for Health and Quality of Agri-Foodstuffs (SENASA). Argentine authorities have issued official measures regard-ing the certification and control of exports, including peanuts, since the mid-1990s, yet it was not until the beginning of this decade that SENASA established the procedure and re-quirements with regard to the certification of peanut exports to the European Union (Resolution 436/2002). Although of-ficial supervision of aflatoxin is oriented toward end-product control, the private sector has implemented preventive measures to reduce aflatoxin contamination along the supply chain. Groundnut cultivation in Argentina is based on modern agricultural technology, including incorporation of good agri-cultural practices (GAPs). The same applies to the processing area, in which companies have been applying good manu-facturing practices and the principles of the HACCP system. Conformity assessment of product intended for export is the responsibility of private authorized certification bodies, which carry out official sampling and analysis of groundnut consignments and issue lot-specific safety certificates. Local infrastructure for conformity assessment includes several private laboratories and one national reference laboratory. Official efforts have been focused on generating opportuni-ties for private operators to perform conformity assessment services.
Argentina’s reputation as a reliable supplier of quality product, as well as the low number of notifications during the years prior to and after implementation of the EU harmonized lev-els, may have given Argentina the time needed to make the necessary adjustments to strengthen the local official control systems. In May 2005, the European authorities carried out the first mission to Argentina to assess the control systems in place, with overall positive results from the mission.
CASE STUDIES: UPGRADING FOR THE DOMESTIC MARKET AND FOR TRADITIONAL EXPORT COMMODITIES 97
ECONOMIC AND SECTOR WORK
view of intercepted trade, one analysis of EU official figures pointed to little more than 949 tons being intercepted during 2004–06, with the total volume affected during 1999–2006 likely being no more than 1,600 tons, at an estimated value of $1.2–$1.5 million. Against the region’s $175 million in sales to Europe over the period, the affected trade appears insignificant. Taking into account that a large proportion of the product intercepted underwent physical treatment, and therefore could be traded in the European market, the value of “lost” trade becomes even smaller.
The indirect effects are more difficult to estimate, including the deterrent effect on stakeholder investments in groundnut-related activity and changes in the commercial orientations of groundnut processors and traders. Certainly for the individual companies involved in the notifications, the EU regulations have had more profound effects, as the economic implica-tions of returned consignments or discounted product can be significant. Yet, the “lost” trade that can be confidently attrib-uted to the EU standards has been extremely low, given the multitude of other technical, institutional, and other problems reducing the competitiveness of African groundnut supply chains seeking to participate in any international markets—let alone the more discerning one in the EU.
The evidence indicates that the SSA region would not signifi-cantly benefit from a less stringent standard, for example the international levels accepted by Codex. Nearly 80 percent of the consignments from Africa that were intercepted by EU authorities between 2004 to 2006, would have failed even the less strict Codex standard.93 In Ghana, particularly, afla-toxins remain a significant problem in exports of processed products.
The primary beneficiaries of less stricter standards would be Africa’s main competitors (in the EU market), especially Argentina, the United States, Brazil, China, and Egypt. These countries have made considerable investments to upgrade their production systems to achieve quality and productivity gains, and most recently, to also achieve safety objectives by preventing and reducing aflatoxin contamination.
For most African supply chains, it is more accurate to refer to an aflatoxin management problem than to a trade standards compliance problem. The focus of policy-maker attention
for the Semi-Arid Tropics (ICRISAT) collaborate in the imple-mentation of cost-effective methods for aflatoxin detection, while in Senegal, Centre de Coopération Internationale en Recherche Agronomique pour le Développement (CIRAD) in partnership with the main Senegalese producer orga-nization (Association Sénégalaise pour la Promotion du Développement à la Base –ASPRODEB), is implementing the “Edible Groundnut Program,” aiming to ensure high-quality product to satisfy demands for confectionary groundnuts in export markets.
Evidence of Direct Impacts of EU Standards on SSA
Groundnut Trade
As mentioned above, during the 1980s, African suppliers were unable to meet emerging demand for consistent vol-umes and quality of product and thus were overtaken by competitors from Latin America and Asia—SSA accounted for just under 89 percent of global exports in the 1960s, yet the region’s share of international trade fell to the single dig-its by the late 1980s, and to only 1.2 percent in 2008.
Although the changes in the global groundnut trade during the 1970s and 1980s were significant, according to Badiane and Kinteh (1994), the decline of African raw groundnut ex-ports was primarily the result of macroeconomic and sector policies that reduced producer incentives through direct or indirect taxation. In most sub-Saharan exporting countries, the sector faced heavy government involvement in input supply, marketing, and producer prices. Inefficient provision of quality seed and other agricultural inputs and too little sup-ply chain coordination still constrain quality and productivity.
Lower competitiveness and limited demand for groundnut oil—along with an inability to shift industry focus to the edible confectionery market, a market with higher quality and safety requirements—helped marginalize sub-Saharan Africa’s global market position. The region’s participation in the global trade of groundnuts and groundnut products has fallen in both the dynamic (edible groundnuts) and least dynamic (oil/cake) sectors. As they have not achieved sus-tained gains in groundnut productivity and product quality, many of Africa’s groundnut industries were ill prepared to meet stringent official and buyer requirement. By the late 1990s, compliance with aflatoxin standards was only one of many challenges faced by SSA industries supplying the international market.
How much the EU aflatoxin standards subsequently af-fected the already marginalized African groundnut export trade is difficult to determine precisely. From the point of
93 During the period 2007–09, the equivalent percent of notifica-tions related to aflatoxins from SSA, compromising peanuts, but also other products, presenting levels above Codex was 55 per-cent (of which 50 percent presented levels above 50 ppb).
CHAPTER 698
MAKING THE GRADE
levels have highlighted the magnitude of the problem on the domestic/regional scale.
However, it is recognized that the establishment of aflatoxin regulations or of strict standards by buyers will have limited effects in terms of health protection in the region, as many farmers grow grains and groundnuts for their own consump-tion. Although in SSA, regulatory intervention and strict end-product controls are necessary, they have limited roles to play due to the prevalence of subsistence farming. Thus, there is a realization that the solutions to this problem need to be holistic, looking at multiple dimensions of the problem and the specific characteristics of SSA’s supply chains.
Emerging Cost-Effective Management Solutions
While aflatoxins cannot be completely eliminated, measures can be taken to manage the risks to lessen their prevalence and minimize the trade, health, and food-security effects on humans and animals. Approaches to managing aflatoxin risks rely on prevention to reduce the probability of product contamination and mitigation to reduce its potential impact. Research efforts undertaken by several organizations in the region are progressively making available appropriate and potentially cost-effective measures for aflatoxin prevention/mitigation, emphasizing on-farm technologies.
For example, research led by ICRISAT and the International Institute of Tropical Agriculture (IITA) is targeting the problem through holistic approaches, including (i) the development of resistant/tolerant varieties, (ii) the identification and validation of appropriate agronomic practices (e.g., application of soil amendments—lime, crop remnants, manure—to reduce the effect of drought at the end of the harvest season, testing proper crop densities, planting days, etc.), (iii) the identifica-tion of proper practices and technologies for drying, storing, and processing, and (iv) the development of cost-effective diagnostic tools. These efforts have been complemented by the exploration of alternative uses for contaminated product.
Biological control has also emerged as a very promising solu-tion in the United States, with pilot trials being implemented in SSA under the leadership of IITA and the U.S. Department of Agriculture (USDA), although mainly in maize. Several efforts are underway to gain support for more trials/pilots and possible partnerships to commercialize the technology. However, as solutions emerge, a lot of work is still needed to understand the effectiveness of these technologies/prac- tices in different contexts and the incentives for their adoption among different types of farmers. For example, research led by ICRISAT in Mali determined that the immediate removal
on the alleged trade barrier aspect of the EU’s aflatoxin standards has contributed little to exports or public health improvements in SSA, and does not provide a basis for im-proved strategy development and investment.
Undoubtedly, for some countries supplying edible ground-nuts to the EU market (Egypt and China), the stringency of the EU aflatoxin regulation did act as a temporary barrier to trade, and subsequently (in a reactive way) as a catalyst for the modernization of the supply chain and for improved col-laboration between the public and the private sector. The catalytic role of EU standards enforcement is more clearly seen in the case of the Argentine industry, which has used compliance as a means to improve the industry’s competi-tive position and gain market participation.
In contrast, for most SSA countries, the stringency of the EU standards has served neither as a significant barrier to trade nor as a significant catalyst for proactive action. Sub-Saharan suppliers’ inability to build a reputation for reliable supply, consistent quality, and safe product contributes to their marginalization in international groundnut trade. Upgrades at the production and harvest levels to improve basic quality characteristics and ensure consistency are needed, along with safety improvements. Yet, attempts to move off of this continuum of improvements often results in the need to go back to re-enforcing basic compliance capaci-ties (see box 6.2).
The Multiple Dimensions of the Aflatoxin Problem in
Africa
The aflatoxin problem in SSA has often been considered within a trade barrier context, whereas the domestic market, and the associated public health and food security dimen-sions, have received much less attention.94 Recent attempts made by private actors and donors to improve quality and safety by setting and enforcing requirements for aflatoxin
94 Several authors have found widespread chronic dietary exposure to aflatoxins in Africa (Peanut Collaborative Research Support Program—PCRSP). Also several studies in China, Kenya, Mo-zambique, the Philippines, Swaziland, Thailand, and South Af-rica have shown a strong positive correlation between aflatoxin levels in the diet and the development of cancer (WHO 2005). The synergy between exposure to aflatoxins and infection with hepatitis B substantially increases the risk of carcinoma. Aflatox-ins are also associated with growth retardation and immune sup-pression. In Benin and Togo, children in high aflatoxin exposure zones were found to gain 22 percent less height than children in low-exposure zones. Childhood exposure to aflatoxin in the Gambia was also associated with immune suppression (Myco-Globe 2005).
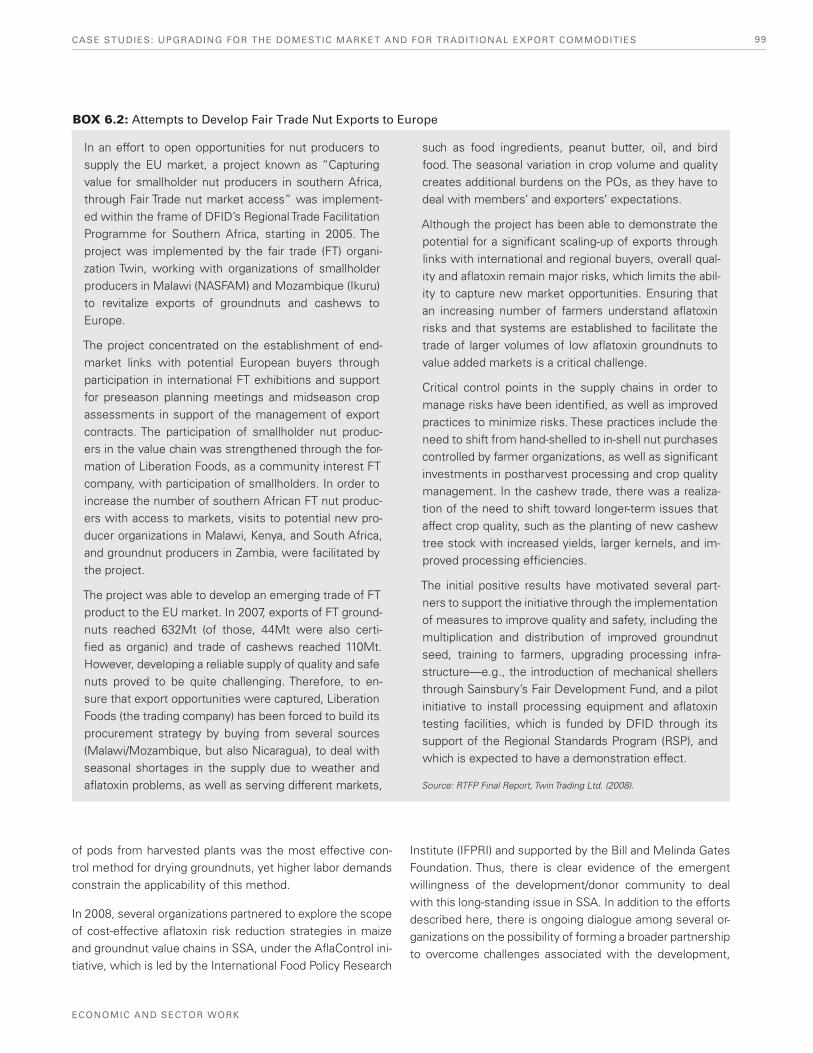
CASE STUDIES: UPGRADING FOR THE DOMESTIC MARKET AND FOR TRADITIONAL EXPORT COMMODITIES 99
ECONOMIC AND SECTOR WORK
Institute (IFPRI) and supported by the Bill and Melinda Gates Foundation. Thus, there is clear evidence of the emergent willingness of the development/donor community to deal with this long-standing issue in SSA. In addition to the efforts described here, there is ongoing dialogue among several or-ganizations on the possibility of forming a broader partnership to overcome challenges associated with the development,
of pods from harvested plants was the most effective con-trol method for drying groundnuts, yet higher labor demands constrain the applicability of this method.
In 2008, several organizations partnered to explore the scope of cost-effective aflatoxin risk reduction strategies in maize and groundnut value chains in SSA, under the AflaControl ini-tiative, which is led by the International Food Policy Research
BOX 6.2: Attempts to Develop Fair Trade Nut Exports to Europe
In an effort to open opportunities for nut producers to supply the EU market, a project known as “Capturing value for smallholder nut producers in southern Africa, through Fair Trade nut market access” was implement-ed within the frame of DFID’s Regional Trade Facilitation Programme for Southern Africa, starting in 2005. The project was implemented by the fair trade (FT) organi-zation Twin, working with organizations of smallholder producers in Malawi (NASFAM) and Mozambique (Ikuru) to revitalize exports of groundnuts and cashews to Europe.
The project concentrated on the establishment of end-market links with potential European buyers through participation in international FT exhibitions and support for preseason planning meetings and midseason crop assessments in support of the management of export contracts. The participation of smallholder nut produc-ers in the value chain was strengthened through the for-mation of Liberation Foods, as a community interest FT company, with participation of smallholders. In order to increase the number of southern African FT nut produc-ers with access to markets, visits to potential new pro-ducer organizations in Malawi, Kenya, and South Africa, and groundnut producers in Zambia, were facilitated by the project.
The project was able to develop an emerging trade of FT product to the EU market. In 2007, exports of FT ground-nuts reached 632Mt (of those, 44Mt were also certi-fied as organic) and trade of cashews reached 110Mt. However, developing a reliable supply of quality and safe nuts proved to be quite challenging. Therefore, to en-sure that export opportunities were captured, Liberation Foods (the trading company) has been forced to build its procurement strategy by buying from several sources (Malawi/Mozambique, but also Nicaragua), to deal with seasonal shortages in the supply due to weather and aflatoxin problems, as well as serving different markets,
such as food ingredients, peanut butter, oil, and bird food. The seasonal variation in crop volume and quality creates additional burdens on the POs, as they have to deal with members’ and exporters’ expectations.
Although the project has been able to demonstrate the potential for a significant scaling-up of exports through links with international and regional buyers, overall qual-ity and aflatoxin remain major risks, which limits the abil-ity to capture new market opportunities. Ensuring that an increasing number of farmers understand aflatoxin risks and that systems are established to facilitate the trade of larger volumes of low aflatoxin groundnuts to value added markets is a critical challenge.
Critical control points in the supply chains in order to manage risks have been identified, as well as improved practices to minimize risks. These practices include the need to shift from hand-shelled to in-shell nut purchases controlled by farmer organizations, as well as significant investments in postharvest processing and crop quality management. In the cashew trade, there was a realiza-tion of the need to shift toward longer-term issues that affect crop quality, such as the planting of new cashew tree stock with increased yields, larger kernels, and im-proved processing efficiencies.
The initial positive results have motivated several part-ners to support the initiative through the implementation of measures to improve quality and safety, including the multiplication and distribution of improved groundnut seed, training to farmers, upgrading processing infra-structure—e.g., the introduction of mechanical shellers through Sainsbury’s Fair Development Fund, and a pilot initiative to install processing equipment and aflatoxin testing facilities, which is funded by DFID through its support of the Regional Standards Program (RSP), and which is expected to have a demonstration effect.
Source: RTFP Final Report, Twin Trading Ltd. (2008).
CHAPTER 6100
MAKING THE GRADE
each would continue to expand output. Thus, without major investment and, perhaps, a reorientation of the industry, the prospects for Rwanda’s coffee sector looked bleak.
Taking Action—Targeting the Coffee “Specialty”96
Market (Upgrades from Level 1 to Levels 3 and 4)
From an agro-climatic perspective, Rwanda enjoys ideal conditions for the growth of Arabica coffee, given its rich vol-canic soils, high altitudes, ample rainfall, and mild year-round temperatures. The latter leads to the slow maturation of the coffee bean and creates a distinctive taste in the cup. This natural comparative advantage has formed the basis for the collective efforts of the GoR, private sector, donor agencies, and NGOs to revive Rwanda’s coffee industry with a particu-lar focus on targeting the “speciality” coffee segment.
Plans for the revitalization of the industry were laid out in the late 1990s and early 2000s. A Rwanda Coffee Working Group outlined a very ambitious strategy covering the 2002 to 2010 period. Over this period, targets were set for $70 million in investments and accumulative export revenues of $600 mil-lion. The strategy proposed multiple interventions, along dif-ferent points in the value chain, to address productivity and quality bottlenecks and to open new market opportunities. About half of the sector revitalization budget was supposed to be directed at the farm level, to support the replacement of trees, the training of farmers, and the uptake of fertilizer and other production inputs. About one-third of the budget was to go for investments of CWSs and other infrastructure (e.g., energy, water, and roads).
adoption, and scaling-up of cost-effective reduction/mitigation methods by small-scale farmers to achieve desired trade, domestic commercial, and public health objectives. These efforts are certainly welcome news to SSA smallholder producers.
CASE 5: RWANDA—GAINING A PLACE IN THE “SPECIALTY” COFFEE MARKET
Introduction
Since its introduction early in the twentieth century, coffee production in Rwanda was subject to strict official controls, both during the colonial period and following independence. In the early 1930s, growing coffee was made compulsory in Rwanda. At independence (in 1963), legislation prohibited the uprooting of coffee trees, with a Government of Rwanda (GoR) majority-owned company holding a monopoly on cof-fee exports. These restrictions remained in place until the im-plementation of economic and sector reforms in the 1990s.
The combined impacts of social strife, reduced international coffee prices, and relaxed restrictions led many farmers to neglect coffee in favor of more profitable food crops. National coffee production fell from 35,000 tons in 1986 to 14,000 tons in 1998, with a substantial reduction in quality mix of marketed sales. Farmers were exiting the sector. Some 55 percent of Rwandan farmers grew coffee in 1991; by 2002, only 30 percent were active growers. While in the 1970s, coffee exports accounted for up to 80 percent of Rwanda’s merchandise exports, this share fell to less than 60 percent in the 1990s and to only 34 percent in 2000.95
Despite declining production and participation, coffee re-mained an important element in the Rwandan rural landscape. According to a production census, some 400,000 smallholder farmers were still producing coffee in 2002. Average plant-ings were very small, at some 150 bushes, with a large per-centage of plants being thirty years old or older. The critical situation at the production level was aggravated by the lack of cost-effective technologies for processing. This translated into poor (and declining) quality coffee. Although two cof-fee washing stations (CWS) had been built, these were not operational. The bleak situation at home was compounded by international developments. Large and low-cost suppli-ers such as Vietnam and Brazil were increasingly dominat-ing the low-quality coffee segment, with expectations that
95 See Lode et al. (2004), Loveridge et al. (2002), and USAID (2006) for more details.
96 There is no unique definition of “specialty” coffee. It was initially used to describe the range of coffee products sold in dedicated coffee shops, in order to differentiate these supplies from cof-fee generally available through supermarkets and other retail outlets. Specialty today refers both to whole-bean sales and to coffee beverages sold in coffee bars and cafés (as opposed to restaurants and other catering establishments). The range in-cludes higher-quality coffees, both single-origin and blends, un-conventional coffees such as flavored coffees and coffees with an unusual background or story behind them. However, with the rapid growth in the number of specialty coffee retail outlets and particularly the expansion of the specialty coffee product range into more mainstream outlets such as supermarkets, the term has become much looser. It is fair to say that “specialty” coffee has become a generic label covering a range of different coffees, which either command a premium price over other coffees or are perceived by consumers as being different from the widely available mainstream brands of coffee. The Specialty Coffee Association of America says the following: “Sometimes called ‘gourmet’ or ‘premium’ coffee, specialty coffees are made from exceptional beans grown only in ideal coffee producing climates. They tend to feature distinctive flavors, which are shaped by the unique characteristics of the soil that produces them.”
CASE STUDIES: UPGRADING FOR THE DOMESTIC MARKET AND FOR TRADITIONAL EXPORT COMMODITIES 101
ECONOMIC AND SECTOR WORK
Specialty Coffee Company (RWASHOSCCO), created in 2004 by eleven coffee cooperatives to represent the interests of approximately 20,000 farmers. The company’s service in-cludes extension, quality control, buyer relations, marketing, and shipping on behalf of its member cooperatives. The sec-ond is the Rwanda Fine Coffee Association (RFCA), which represents the interests of the privately owned enterprises. Support to these two initiatives has continued under the USAID SPREAD project and with other donors (e.g., Agence Française de Développement—AFD).
Significant Gains Resulting from the Quality Upgrading
Process
The combined results of NGOs, government, and donor sup-port efforts have been impressive. Table 6.3 summarizes indicators of achievement over the past decade, in terms of investments, trade, beneficiaries, and so forth. Even though only a relatively small proportion of Rwanda’s coffee exports are fully washed (just over 3,000 tons in 2009 or 7 percent of export volume), Rwanda has become something of a “hot” destination for global coffee roasting companies and large wholesale buyers seeking new origins for specialty coffee.99
The efforts to support product quality upgrades were comple-mented with efforts to further differentiate products through sustainability certifications, including fair trade and, to a less-er degree, also organic certification. Information retrieved from the Fair Trade Africa database indicate, a total of seven cooperatives fair trade certified, covering about 23,000 small-scale producers—about 5 percent of total coffee farmers.100 International buyers such as Starbucks and Green Mountain Coffee have been switching product lines toward fair trade product, and are becoming active supporters of fair trade pro-grams in Rwanda.101 Furthermore, certification against Café
International development agencies were expected to con-tribute about one-third of the costs associated with this sec-tor (re-)development strategy. In fact, the development com-munity lived up to its commitments. For example, USAID has been a major supporter of the industry, through a series of projects implemented within Rwanda and at the regional level.97 The costs of these projects have been around $17 million. IFAD has been another significant player through its $6 million Smallholder Cash and Export Crop Development Project (PDCRE). Many other donors have provided contribu-tions, particularly for the expansion of processing capabili-ties (CWSs). Examples include the EU through its STABEX98 program, and the United Nationals Development Program (UNDP). A regional coffee program supported by the Gates Foundation and being implemented by TecnoServe also has been very active in Rwanda.
A central pillar of the coffee strategy and related donor invest-ments has been the promotion of coffee washing stations. With proper processing, it would be possible to increase the volume and uniformity of quality coffee. Two approaches have been taken. One approach has emphasized the role of private entrepreneurs in the establishment of CWSs and in developing relationships with individual farmers and/or farm-er cooperatives as the most sustainable way to facilitate the process of quality upgrading. A second approach has focused on collective action, with farmer cooperatives taking the lead in processing and marketing functions. Cooperatives were also used as the basis for achieving fair trade and organic cer-tifications. The majority of donor interventions took the latter route, focusing on the development and operations of coffee cooperatives as this arrangement was seen to have better prospects for technical outreach to farmers and, perhaps, a more equitable sharing of the benefits from improved quality and market access.
Although there have been a series of donor interventions over the past decade, a nod in the direction of an exit strat-egy has been made through the establishment of two indus-try umbrella organizations. One is the Rwanda Smallholder
97 These have included the Agribusiness Development Assis-tance to Rwanda (ADAR) project; the Partnership for Enhanc-ing Agriculture in Rwanda through Linkages (PEARL) project, implemented by Michigan State and Texas A&M Universities, in collaboration with the National University of Rwanda; the ACDI-VOCA PL 480 food monetization program; the Sustaining Part-nerships to Enhance Rural Enterprise and Agribusiness Develop-ment (SPREAD) project; and support through the Eastern African Coffee Association.
98 French acronym for the EU program on Stabilisation des recettes d’Exportation.
99 The industry’s achievements fell far short of the very ambitious targets set out in the 2002–10 strategy. The export of 3,000 tons of fully washed coffee in 2009 is but a fraction of the tar-get set at 20,000 tons. Aggregate export revenues over the planning period were $270 million, compared with the target of $600 million.
100 SPREAD project estimates the number of coffee farmers at half a million (higher than the 400,000 figure reported in 2002).
101 Starbucks partnered with fair trade organizations to certify Rwandan coffee coming to the UK in 2010. The company made commitments in 2009 to sell exclusive Rwanda coffee in the UK. Similarly, TransFair USA, the Cordes Foundation, Green Mountain Coffee, and the Clinton Global Initiative partnered to fight poverty among small farmers in Rwanda by enabling them to sell more fair trade certified coffee (Trans Fair USA, Septem-ber, 2009—http://www.transfairusa.org/press-room/press_re-lease/transfair-usa-cordes-foundation-and-green-mountain-cof-fee-announce-commitme)
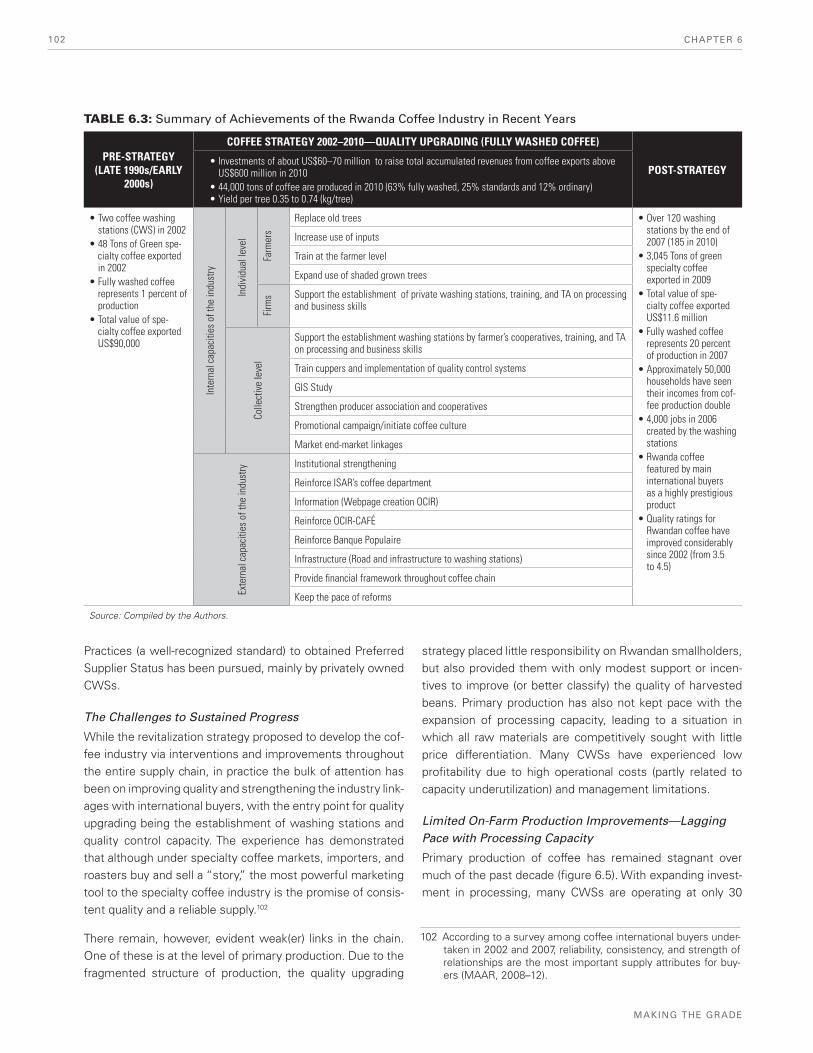
CHAPTER 6102
MAKING THE GRADE
strategy placed little responsibility on Rwandan smallholders, but also provided them with only modest support or incen-tives to improve (or better classify) the quality of harvested beans. Primary production has also not kept pace with the expansion of processing capacity, leading to a situation in which all raw materials are competitively sought with little price differentiation. Many CWSs have experienced low profitability due to high operational costs (partly related to capacity underutilization) and management limitations.
Limited On-Farm Production Improvements—Lagging Pace with Processing Capacity
Primary production of coffee has remained stagnant over much of the past decade (figure 6.5). With expanding invest-ment in processing, many CWSs are operating at only 30
Practices (a well-recognized standard) to obtained Preferred Supplier Status has been pursued, mainly by privately owned CWSs.
The Challenges to Sustained Progress
While the revitalization strategy proposed to develop the cof-fee industry via interventions and improvements throughout the entire supply chain, in practice the bulk of attention has been on improving quality and strengthening the industry link-ages with international buyers, with the entry point for quality upgrading being the establishment of washing stations and quality control capacity. The experience has demonstrated that although under specialty coffee markets, importers, and roasters buy and sell a “story,” the most powerful marketing tool to the specialty coffee industry is the promise of consis-tent quality and a reliable supply.102
There remain, however, evident weak(er) links in the chain. One of these is at the level of primary production. Due to the fragmented structure of production, the quality upgrading
TABLE 6.3: Summary of Achievements of the Rwanda Coffee Industry in Recent Years
PRE-STRATEGY (LATE 1990s/EARLY
2000s)
COFFEE STRATEGY 2002–2010—QUALITY UPGRADING (FULLY WASHED COFFEE)
POST-STRATEGY
stations (CWS) in 2002-
cialty coffee exported in 2002
represents 1 percent of production
-cialty coffee exported
Inte
rnal
cap
aciti
es o
f the
indu
stry
Indi
vidu
al le
vel
Farm
ers
Replace old treesstations by the end of 2007 (185 in 2010)
specialty coffee exported in 2009
-cialty coffee exported
represents 20 percent of production in 2007
households have seen their incomes from cof-fee production double
created by the washing stations
featured by main international buyers as a highly prestigious product
Rwandan coffee have improved considerably since 2002 (from 3.5 to 4.5)
Increase use of inputs
Train at the farmer level
Expand use of shaded grown treesFi
rms Support the establishment of private washing stations, training, and TA on processing
and business skills
Colle
ctiv
e le
vel
Support the establishment washing stations by farmer’s cooperatives, training, and TA on processing and business skills
Train cuppers and implementation of quality control systems
Strengthen producer association and cooperatives
Promotional campaign/initiate coffee culture
Market end-market linkages
Exte
rnal
cap
aciti
es o
f the
indu
stry Institutional strengthening
Reinforce ISAR’s coffee department
Information (Webpage creation OCIR)
Reinforce OCIR-CAFÉ
Reinforce Banque Populaire
Infrastructure (Road and infrastructure to washing stations)
Provide financial framework throughout coffee chain
Keep the pace of reforms
Source: Compiled by the Authors.
102 According to a survey among coffee international buyers under-taken in 2002 and 2007, reliability, consistency, and strength of relationships are the most important supply attributes for buy-ers (MAAR, 2008–12).
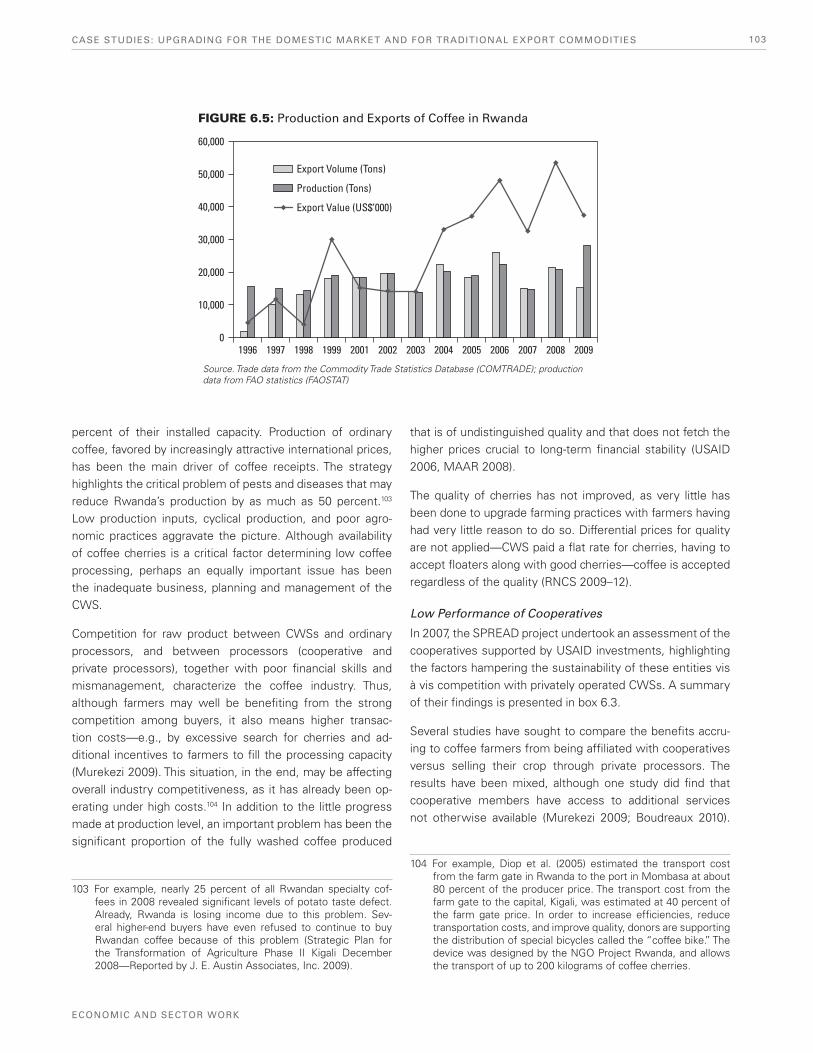
CASE STUDIES: UPGRADING FOR THE DOMESTIC MARKET AND FOR TRADITIONAL EXPORT COMMODITIES 103
ECONOMIC AND SECTOR WORK
that is of undistinguished quality and that does not fetch the higher prices crucial to long-term financial stability (USAID 2006, MAAR 2008).
The quality of cherries has not improved, as very little has been done to upgrade farming practices with farmers having had very little reason to do so. Differential prices for quality are not applied—CWS paid a flat rate for cherries, having to accept floaters along with good cherries—coffee is accepted regardless of the quality (RNCS 2009–12).
Low Performance of Cooperatives
In 2007, the SPREAD project undertook an assessment of the cooperatives supported by USAID investments, highlighting the factors hampering the sustainability of these entities vis à vis competition with privately operated CWSs. A summary of their findings is presented in box 6.3.
Several studies have sought to compare the benefits accru-ing to coffee farmers from being affiliated with cooperatives versus selling their crop through private processors. The results have been mixed, although one study did find that cooperative members have access to additional services not otherwise available (Murekezi 2009; Boudreaux 2010).
percent of their installed capacity. Production of ordinary coffee, favored by increasingly attractive international prices, has been the main driver of coffee receipts. The strategy highlights the critical problem of pests and diseases that may reduce Rwanda’s production by as much as 50 percent.103 Low production inputs, cyclical production, and poor agro-nomic practices aggravate the picture. Although availability of coffee cherries is a critical factor determining low coffee processing, perhaps an equally important issue has been the inadequate business, planning and management of the CWS.
Competition for raw product between CWSs and ordinary processors, and between processors (cooperative and private processors), together with poor financial skills and mismanagement, characterize the coffee industry. Thus, although farmers may well be benefiting from the strong competition among buyers, it also means higher transac-tion costs—e.g., by excessive search for cherries and ad-ditional incentives to farmers to fill the processing capacity (Murekezi 2009). This situation, in the end, may be affecting overall industry competitiveness, as it has already been op-erating under high costs.104 In addition to the little progress made at production level, an important problem has been the significant proportion of the fully washed coffee produced
103 For example, nearly 25 percent of all Rwandan specialty cof-fees in 2008 revealed significant levels of potato taste defect. Already, Rwanda is losing income due to this problem. Sev-eral higher-end buyers have even refused to continue to buy Rwandan coffee because of this problem (Strategic Plan for the Transformation of Agriculture Phase II Kigali December 2008—Reported by J. E. Austin Associates, Inc. 2009).
104 For example, Diop et al. (2005) estimated the transport cost from the farm gate in Rwanda to the port in Mombasa at about 80 percent of the producer price. The transport cost from the farm gate to the capital, Kigali, was estimated at 40 percent of the farm gate price. In order to increase efficiencies, reduce transportation costs, and improve quality, donors are supporting the distribution of special bicycles called the “coffee bike.” The device was designed by the NGO Project Rwanda, and allows the transport of up to 200 kilograms of coffee cherries.
FIGURE 6.5: Production and Exports of Coffee in Rwanda
Source. Trade data from the Commodity Trade Statistics Database (COMTRADE); production data from FAO statistics (FAOSTAT)
1996
60,000
50,000
40,000
30,000
20,000
10,000
01997 1998 1999 2001 2002 2003 2004 2005 2006 2007 2008 2009
Production (Tons)
Export Value (US$’000)
Export Volume (Tons)
CHAPTER 6104
MAKING THE GRADE
Thousands of Rwanda smallholders are benefiting from high-er coffee prices for fully washed specialty coffee. The price that cooperatives and noncooperative (private sector) CWSs are paying to farmers for cherries has risen from 60 to 80 Rwandan francs in 2004 to between 160 and 180 Rwandan francs in 2008 (RNCS 2009–12; SPREAD 2008).106
Diop et al. (2005), using household data from 2001, carried out a set of indicative simulations that demonstrated the potential for substantial reductions in rural poverty from initiatives that reduce trade costs in coffee supply chains, enhance the qual-ity of coffee, and facilitate movement out of subsistence into commercial coffee production. Assessment of actual farmer
The advantages of cooperative membership certainly relate to the distinctive performance and management of one’s own cooperative. For example, one study found, not sur-prisingly, that the range of benefits accruing to members of cooperatives affiliated with Fair Trade distribution channels may be undercut by poor management of such cooperatives (Whitfield 2010). Thus, the low performance of cooperatives is limiting their capacity to leverage larger gains for their members and for the industry as a whole. In order to address these constraints, SPREAD, ICIR-CAFÉ,105 and TecnoServe have been implementing a program to strengthen the most viable cooperatives known as the “turnaround cooperative program.”
Overall Perspective of Developmental Impacts—Coffee Farmers Are Better Off
Producers have certainly gained from sector reforms and from GoR, donor, and private investments in the sector.
105 OCIR (Office des Cultures Industrielles du Rwanda) CAFE is the government authority for the coffee sector.
106 Murekezi (2009) found that marketing through the coffee cherry channels increases the average annual food expenditures per adult equivalent by 15 percent compared to selling through tra-ditional nonwashed (parchment) coffee channels. Similarly, sell-ing coffee cherries improves the total annual expenditures per adult equivalent by 17 percent compared to selling parchment coffee. Coffee growers have improved the overall household expenditure by 13 percent in 2007 compared to the period be-fore the reforms.
One of the principal problems facing coffee cooperatives in Rwanda today is that the producers themselves—the supposed actual owners of these cooperatives—have not kept pace with the capacity building that has taken in other areas of the coffee value chain. Attention given to links in the upper levels of this value chain (outside the cooperative itself) has been very successful, and has launched Rwanda into the world specialty coffee mar-ket—accessible to any Rwandan group, private entre-preneur, or cooperative capable of competing. Rwandan cooperatives, their Board of Directors (BoDs), and their members, however, have not been making the organiza-tional and behavioral changes needed fast enough, and face an uncertain future.
When focus and some training is given to the coopera-tive, much of this goes no farther than the BoD, who tend to run their cooperative like a social welfare organization, without consideration of business principles. Members have almost no ownership of their cooperatives, and only see the cooperative as one option, among others, for selling their coffee cherries.
In the face of rapidly growing and aggressive private-sec-tor coffee entrepreneurs, competition for the farmer’s
BOX 6.3: Weak Cooperatives as a Bottleneck to Improved Export Performance in Quality Coffee Markets
cherries has grown. Farmers will sell their most valuable cash crop where they can get the best return, and in the past two years, cooperatives have lost ground to the private entrepreneur businesses.
None of SPREAD’s 14 cooperatives can be said to be well managed or business focused. Without major changes in management styles, priorities, and efficiencies in in-ternal operations, it is almost certain that many of these cooperatives will go bankrupt as soon as project support is removed. SPREAD will need to move additional finan-cial resources toward this membership base of the co-operative systems they are supporting. The alternative will be to see many years of USAID effort and millions of dollars expended on coffee cooperatives in Rwanda leading to ultimate failure. Private-sector entrepreneur competition within the coffee industry is a very good thing, and this reality may finally force cooperatives to make the changes they need to make. This competition should help assure that Rwanda’s smallholder coffee farmers receive the prices they should for their valuable coffee.
Source: SPREAD, 2008.
CASE STUDIES: UPGRADING FOR THE DOMESTIC MARKET AND FOR TRADITIONAL EXPORT COMMODITIES 105
ECONOMIC AND SECTOR WORK
gains has recently been undertaken, using both general and very detailed analytical methods. Boudreaux has highlighted in several reports the set of direct and indirect benefits ac-cruing to farmers from coffee sectoral reforms (Boudreaux 2007; Boudreaux and Sacks 2007; Boudreaux and Ahluwalia 2009; Boudreaux 2010).
Thus, thousands of Rwanda smallholders are benefiting from higher coffee prices for fully washed specialty coffee, but also from ordinary coffee. Exports of coffee represented 36 percent of total export revenue in 2009, with ordinary (not specialty) coffee accounting for the bulk of sales.
During the past decade a small quality-based industry has emerged in Rwanda, yet significant challenges remain ahead. The GoR is taking measures to implement the needed adjustments to push for further progress in the industry.
Donors and NGOs are committed to supporting those ef-forts and continuing the search for innovative solutions to the problems faced by the industry. The coffee strategy has been revisited and new targets have been set. This time, the expectation is to increase production to 33,000 tons by 2012, with 19,000 tons of this being fully washed, generating ex-ports of US$115 million by 2012, and estimated investments of US$51.8 million. This time the strategy also embraces ordinary coffee.
Clearly, positive international markets are contributing to ex-port growth, yet for Rwanda, a small player in international coffee markets, the efforts to improve quality along the chain would certainly provide a better buffer for the inevitable peri-ods of low prices. However, the notion driving improvements needs to be that quality starts at the farm level and can be maintained only through proper processing.