Embed Size (px)
Citation preview
Chapter 5
Weighted Average Cost of Capital: It's Implications on Financial Performance of Sample Companies -
An application of multivariate regression model
1. Introduction
The CIMA defines the weighted average cost of capital (WACC) “as the
average cost of the company’s finance (equity, debentures, long-term fund loans and
retained earnings) weighted according to the proportion each element bears to the
total pool of capital, which is usually based on market valuations, current yields and
costs after tax.”
The term weighted average cost of capital is the combined cost of the specific
costs associated with specific source of financing. The cost of different source of
financing represents the components of the combined cost. The use of weighted
average and not the simple average is warranted by the fact that the proportions of
various sources of funds in the capital structure of a firm are different.
Chapter: 5 Weighted Average Cost of Capital 235
2. Objectives
The major objective of this chapter is to assess the influence of cost of capital
on the performance as well as nature and type of capital structure of the firms and the
industry as a whole.
3. Hypotheses
Hypothesis 1
Specific costs and overall cost of capital of different companies in an industry
are similar
Hypothesis 2
There is no significant influence of financing decision on overall cost of
capital
Hypothesis 3
Average Cost of Capital is not influenced by the performance of the
company measured in terms of size of companies, growth of companies,
profitability, liquidity, and dividend payout of the firm.
To accomplish the aforesaid objective and to test the hypotheses, this chapter
is designed in three sections. In first section, we have analyzed the nature of WACC
in the Sample Companies and the industry as a whole. The second section was
devoted to assessment of effectiveness of WACC on the performance of the sample
Chapter: 5 Weighted Average Cost of Capital 236
companies. The hypothesis of Modigliani and Miller was tested in third section. In
first section, the statistical tools like simple average and ANOVA analysis was
adopted. In second and third sections, correlation coefficients (r) between the
variables have been calculated to identify the existence of linear relationship between
the variables. Again, multiple regressions have also been fitted to see the influence of
different explanatory variables on cost of capital.
The nature of average cost of capital along with their components i.e. debt and
equity in the industry has been analyzed in three parts
a) Average cost of capital i.e. WACC of individual company within the industry
b) Average equity capital of individual company within the industry
c) Average debt capital of individual company within the industry.
4. Specific Cost and WACC In the sample companies
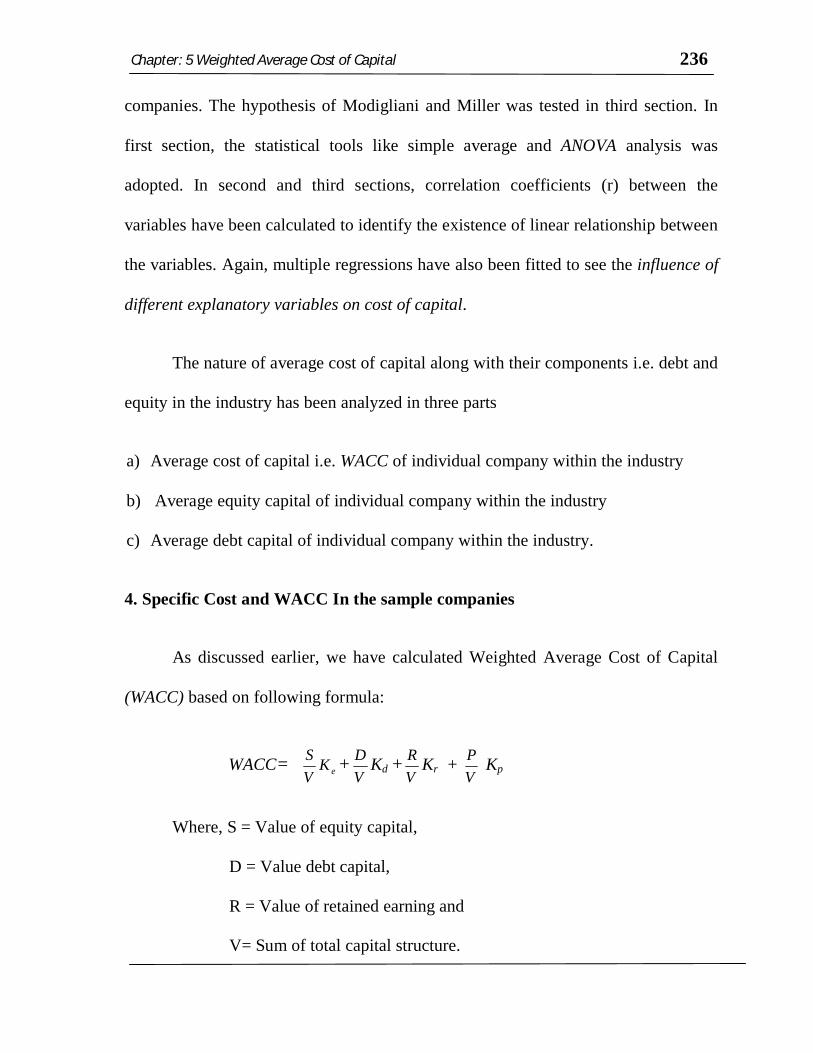
As discussed earlier, we have calculated Weighted Average Cost of Capital
(WACC) based on following formula:
WACC= eKVS +
VD Kd +V
R Kr + VP Kp
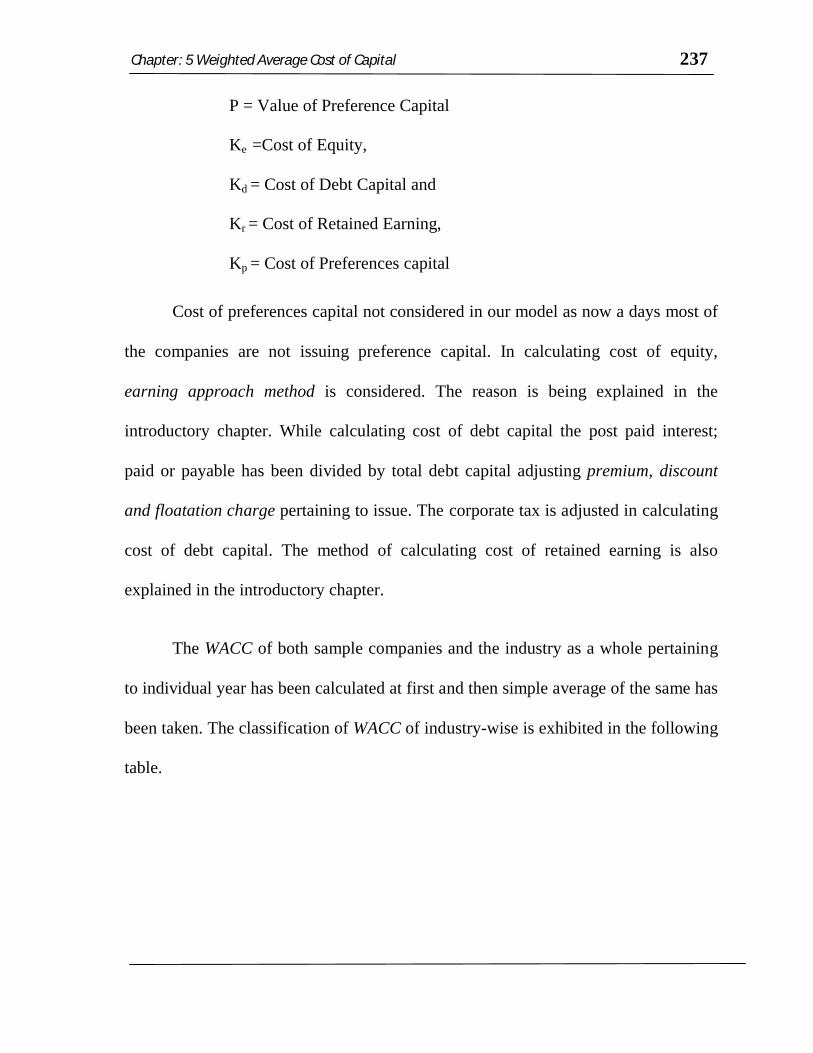
Where, S = Value of equity capital,
D = Value debt capital,
R = Value of retained earning and
V= Sum of total capital structure.
Chapter: 5 Weighted Average Cost of Capital 237
P = Value of Preference Capital
Ke =Cost of Equity,
Kd = Cost of Debt Capital and
Kr = Cost of Retained Earning,
Kp = Cost of Preferences capital
Cost of preferences capital not considered in our model as now a days most of
the companies are not issuing preference capital. In calculating cost of equity,
earning approach method is considered. The reason is being explained in the
introductory chapter. While calculating cost of debt capital the post paid interest;
paid or payable has been divided by total debt capital adjusting premium, discount
and floatation charge pertaining to issue. The corporate tax is adjusted in calculating
cost of debt capital. The method of calculating cost of retained earning is also
explained in the introductory chapter.
The WACC of both sample companies and the industry as a whole pertaining
to individual year has been calculated at first and then simple average of the same has
been taken. The classification of WACC of industry-wise is exhibited in the following
table.
Chapter: 5 Weighted Average Cost of Capital 238
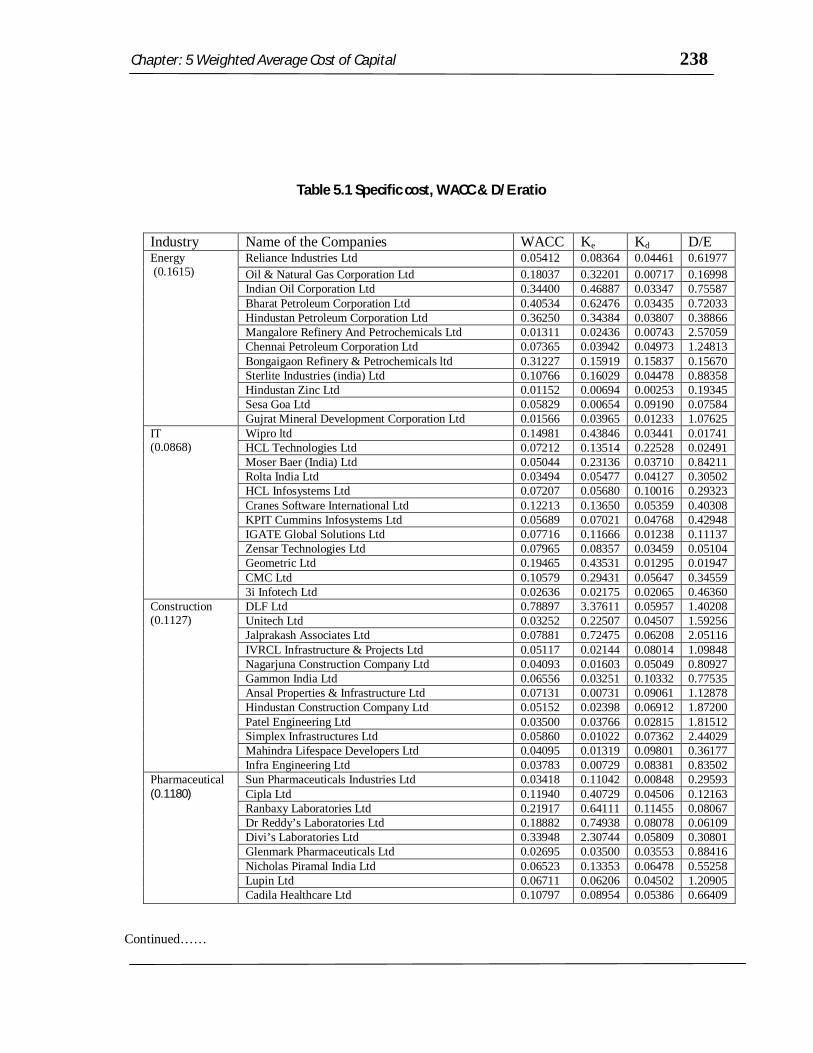
Table 5.1 Specific cost, WACC & D/E ratio
Industry Name of the Companies WACC Ke Kd D/E Energy (0.1615)
Reliance Industries Ltd 0.05412 0.08364 0.04461 0.61977 Oil & Natural Gas Corporation Ltd 0.18037 0.32201 0.00717 0.16998 Indian Oil Corporation Ltd 0.34400 0.46887 0.03347 0.75587 Bharat Petroleum Corporation Ltd 0.40534 0.62476 0.03435 0.72033 Hindustan Petroleum Corporation Ltd 0.36250 0.34384 0.03807 0.38866 Mangalore Refinery And Petrochemicals Ltd 0.01311 0.02436 0.00743 2.57059 Chennai Petroleum Corporation Ltd 0.07365 0.03942 0.04973 1.24813 Bongaigaon Refinery & Petrochemicals ltd 0.31227 0.15919 0.15837 0.15670 Sterlite Industries (india) Ltd 0.10766 0.16029 0.04478 0.88358 Hindustan Zinc Ltd 0.01152 0.00694 0.00253 0.19345 Sesa Goa Ltd 0.05829 0.00654 0.09190 0.07584 Gujrat Mineral Development Corporation Ltd 0.01566 0.03965 0.01233 1.07625
IT (0.0868)
Wipro ltd 0.14981 0.43846 0.03441 0.01741 HCL Technologies Ltd 0.07212 0.13514 0.22528 0.02491 Moser Baer (India) Ltd 0.05044 0.23136 0.03710 0.84211 Rolta India Ltd 0.03494 0.05477 0.04127 0.30502 HCL Infosystems Ltd 0.07207 0.05680 0.10016 0.29323 Cranes Software International Ltd 0.12213 0.13650 0.05359 0.40308 KPIT Cummins Infosystems Ltd 0.05689 0.07021 0.04768 0.42948 IGATE Global Solutions Ltd 0.07716 0.11666 0.01238 0.11137 Zensar Technologies Ltd 0.07965 0.08357 0.03459 0.05104 Geometric Ltd 0.19465 0.43531 0.01295 0.01947 CMC Ltd 0.10579 0.29431 0.05647 0.34559 3i Infotech Ltd 0.02636 0.02175 0.02065 0.46360
Construction (0.1127)
DLF Ltd 0.78897 3.37611 0.05957 1.40208 Unitech Ltd 0.03252 0.22507 0.04507 1.59256 Jalprakash Associates Ltd 0.07881 0.72475 0.06208 2.05116 IVRCL Infrastructure & Projects Ltd 0.05117 0.02144 0.08014 1.09848 Nagarjuna Construction Company Ltd 0.04093 0.01603 0.05049 0.80927 Gammon India Ltd 0.06556 0.03251 0.10332 0.77535 Ansal Properties & Infrastructure Ltd 0.07131 0.00731 0.09061 1.12878 Hindustan Construction Company Ltd 0.05152 0.02398 0.06912 1.87200 Patel Engineering Ltd 0.03500 0.03766 0.02815 1.81512 Simplex Infrastructures Ltd 0.05860 0.01022 0.07362 2.44029 Mahindra Lifespace Developers Ltd 0.04095 0.01319 0.09801 0.36177 Infra Engineering Ltd 0.03783 0.00729 0.08381 0.83502
Pharmaceutical (0.1180)
Sun Pharmaceuticals Industries Ltd 0.03418 0.11042 0.00848 0.29593 Cipla Ltd 0.11940 0.40729 0.04506 0.12163 Ranbaxy Laboratories Ltd 0.21917 0.64111 0.11455 0.08067 Dr Reddy’s Laboratories Ltd 0.18882 0.74938 0.08078 0.06109 Divi’s Laboratories Ltd 0.33948 2.30744 0.05809 0.30801 Glenmark Pharmaceuticals Ltd 0.02695 0.03500 0.03553 0.88416 Nicholas Piramal India Ltd 0.06523 0.13353 0.06478 0.55258 Lupin Ltd 0.06711 0.06206 0.04502 1.20905 Cadila Healthcare Ltd 0.10797 0.08954 0.05386 0.66409
Continued……
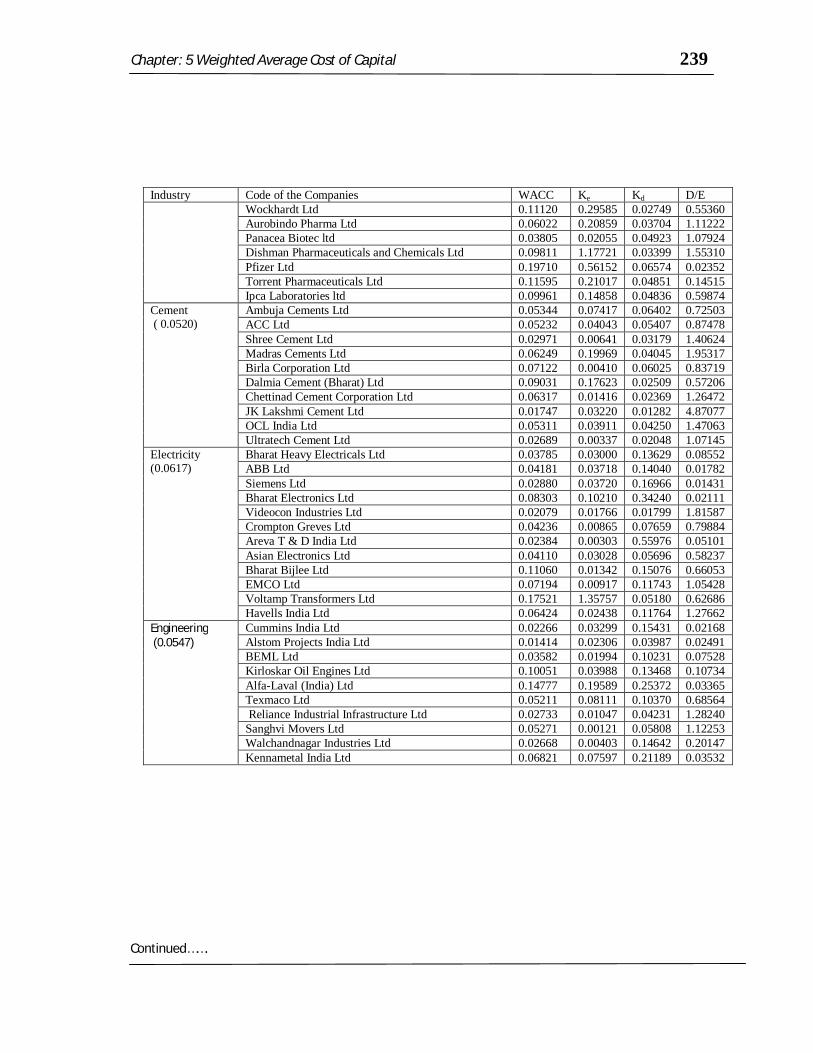
Chapter: 5 Weighted Average Cost of Capital 239
Industry Code of the Companies WACC Ke Kd D/E Wockhardt Ltd 0.11120 0.29585 0.02749 0.55360
Aurobindo Pharma Ltd 0.06022 0.20859 0.03704 1.11222 Panacea Biotec ltd 0.03805 0.02055 0.04923 1.07924 Dishman Pharmaceuticals and Chemicals Ltd 0.09811 1.17721 0.03399 1.55310 Pfizer Ltd 0.19710 0.56152 0.06574 0.02352 Torrent Pharmaceuticals Ltd 0.11595 0.21017 0.04851 0.14515 Ipca Laboratories ltd 0.09961 0.14858 0.04836 0.59874
Cement ( 0.0520)
Ambuja Cements Ltd 0.05344 0.07417 0.06402 0.72503 ACC Ltd 0.05232 0.04043 0.05407 0.87478 Shree Cement Ltd 0.02971 0.00641 0.03179 1.40624 Madras Cements Ltd 0.06249 0.19969 0.04045 1.95317 Birla Corporation Ltd 0.07122 0.00410 0.06025 0.83719 Dalmia Cement (Bharat) Ltd 0.09031 0.17623 0.02509 0.57206 Chettinad Cement Corporation Ltd 0.06317 0.01416 0.02369 1.26472 JK Lakshmi Cement Ltd 0.01747 0.03220 0.01282 4.87077 OCL India Ltd 0.05311 0.03911 0.04250 1.47063 Ultratech Cement Ltd 0.02689 0.00337 0.02048 1.07145
Electricity (0.0617)
Bharat Heavy Electricals Ltd 0.03785 0.03000 0.13629 0.08552 ABB Ltd 0.04181 0.03718 0.14040 0.01782 Siemens Ltd 0.02880 0.03720 0.16966 0.01431 Bharat Electronics Ltd 0.08303 0.10210 0.34240 0.02111 Videocon Industries Ltd 0.02079 0.01766 0.01799 1.81587 Crompton Greves Ltd 0.04236 0.00865 0.07659 0.79884 Areva T & D India Ltd 0.02384 0.00303 0.55976 0.05101 Asian Electronics Ltd 0.04110 0.03028 0.05696 0.58237 Bharat Bijlee Ltd 0.11060 0.01342 0.15076 0.66053 EMCO Ltd 0.07194 0.00917 0.11743 1.05428 Voltamp Transformers Ltd 0.17521 1.35757 0.05180 0.62686 Havells India Ltd 0.06424 0.02438 0.11764 1.27662
Engineering (0.0547)
Cummins India Ltd 0.02266 0.03299 0.15431 0.02168 Alstom Projects India Ltd 0.01414 0.02306 0.03987 0.02491 BEML Ltd 0.03582 0.01994 0.10231 0.07528 Kirloskar Oil Engines Ltd 0.10051 0.03988 0.13468 0.10734 Alfa-Laval (India) Ltd 0.14777 0.19589 0.25372 0.03365 Texmaco Ltd 0.05211 0.08111 0.10370 0.68564 Reliance Industrial Infrastructure Ltd 0.02733 0.01047 0.04231 1.28240 Sanghvi Movers Ltd 0.05271 0.00121 0.05808 1.12253 Walchandnagar Industries Ltd 0.02668 0.00403 0.14642 0.20147 Kennametal India Ltd 0.06821 0.07597 0.21189 0.03532
Continued…….
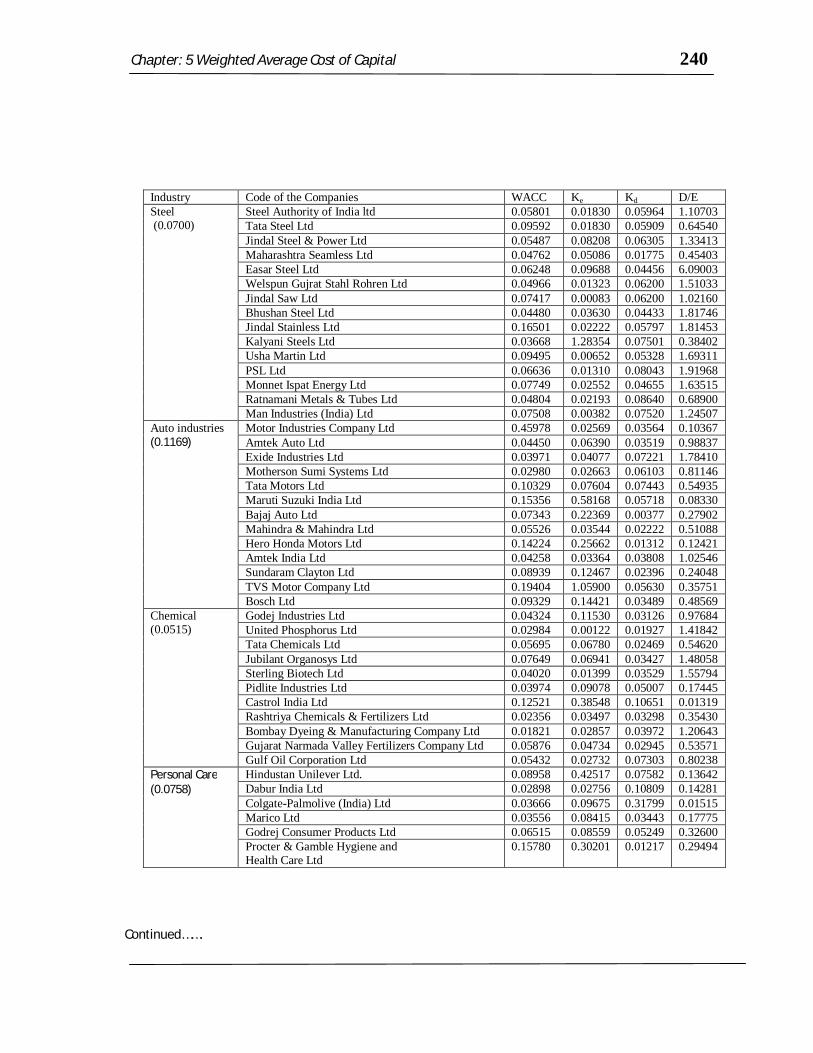
Chapter: 5 Weighted Average Cost of Capital 240
Industry Code of the Companies WACC Ke Kd D/E Steel (0.0700)
Steel Authority of India ltd 0.05801 0.01830 0.05964 1.10703 Tata Steel Ltd 0.09592 0.01830 0.05909 0.64540 Jindal Steel & Power Ltd 0.05487 0.08208 0.06305 1.33413 Maharashtra Seamless Ltd 0.04762 0.05086 0.01775 0.45403 Easar Steel Ltd 0.06248 0.09688 0.04456 6.09003 Welspun Gujrat Stahl Rohren Ltd 0.04966 0.01323 0.06200 1.51033 Jindal Saw Ltd 0.07417 0.00083 0.06200 1.02160 Bhushan Steel Ltd 0.04480 0.03630 0.04433 1.81746 Jindal Stainless Ltd 0.16501 0.02222 0.05797 1.81453 Kalyani Steels Ltd 0.03668 1.28354 0.07501 0.38402 Usha Martin Ltd 0.09495 0.00652 0.05328 1.69311 PSL Ltd 0.06636 0.01310 0.08043 1.91968 Monnet Ispat Energy Ltd 0.07749 0.02552 0.04655 1.63515 Ratnamani Metals & Tubes Ltd 0.04804 0.02193 0.08640 0.68900 Man Industries (India) Ltd 0.07508 0.00382 0.07520 1.24507
Auto industries (0.1169)
Motor Industries Company Ltd 0.45978 0.02569 0.03564 0.10367 Amtek Auto Ltd 0.04450 0.06390 0.03519 0.98837 Exide Industries Ltd 0.03971 0.04077 0.07221 1.78410 Motherson Sumi Systems Ltd 0.02980 0.02663 0.06103 0.81146 Tata Motors Ltd 0.10329 0.07604 0.07443 0.54935 Maruti Suzuki India Ltd 0.15356 0.58168 0.05718 0.08330 Bajaj Auto Ltd 0.07343 0.22369 0.00377 0.27902 Mahindra & Mahindra Ltd 0.05526 0.03544 0.02222 0.51088 Hero Honda Motors Ltd 0.14224 0.25662 0.01312 0.12421 Amtek India Ltd 0.04258 0.03364 0.03808 1.02546 Sundaram Clayton Ltd 0.08939 0.12467 0.02396 0.24048 TVS Motor Company Ltd 0.19404 1.05900 0.05630 0.35751 Bosch Ltd 0.09329 0.14421 0.03489 0.48569
Chemical (0.0515)
Godej Industries Ltd 0.04324 0.11530 0.03126 0.97684 United Phosphorus Ltd 0.02984 0.00122 0.01927 1.41842 Tata Chemicals Ltd 0.05695 0.06780 0.02469 0.54620 Jubilant Organosys Ltd 0.07649 0.06941 0.03427 1.48058 Sterling Biotech Ltd 0.04020 0.01399 0.03529 1.55794 Pidlite Industries Ltd 0.03974 0.09078 0.05007 0.17445 Castrol India Ltd 0.12521 0.38548 0.10651 0.01319 Rashtriya Chemicals & Fertilizers Ltd 0.02356 0.03497 0.03298 0.35430 Bombay Dyeing & Manufacturing Company Ltd 0.01821 0.02857 0.03972 1.20643 Gujarat Narmada Valley Fertilizers Company Ltd 0.05876 0.04734 0.02945 0.53571 Gulf Oil Corporation Ltd 0.05432 0.02732 0.07303 0.80238
Personal Care (0.0758)
Hindustan Unilever Ltd. 0.08958 0.42517 0.07582 0.13642 Dabur India Ltd 0.02898 0.02756 0.10809 0.14281 Colgate-Palmolive (India) Ltd 0.03666 0.09675 0.31799 0.01515 Marico Ltd 0.03556 0.08415 0.03443 0.17775 Godrej Consumer Products Ltd 0.06515 0.08559 0.05249 0.32600 Procter & Gamble Hygiene and Health Care Ltd
0.15780 0.30201 0.01217 0.29494
Continued…….
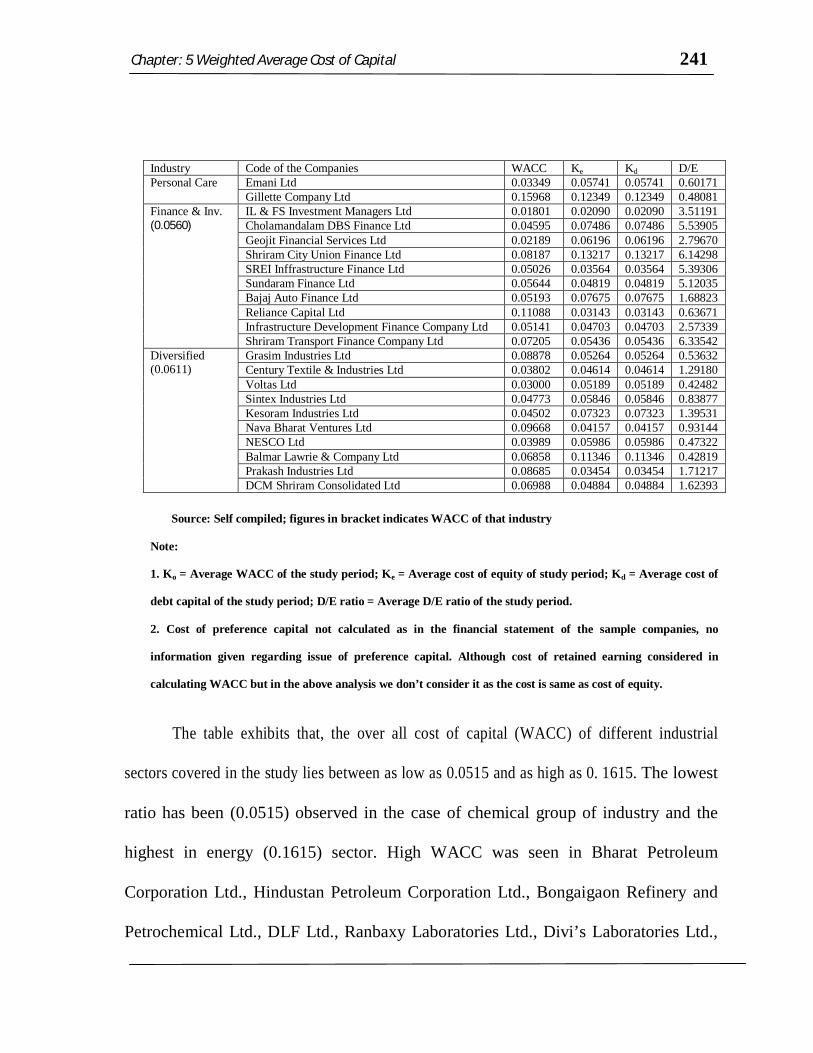
Chapter: 5 Weighted Average Cost of Capital 241
Industry Code of the Companies WACC Ke Kd D/E Personal Care Emani Ltd 0.03349 0.05741 0.05741 0.60171
Gillette Company Ltd 0.15968 0.12349 0.12349 0.48081 Finance & Inv. (0.0560)
IL & FS Investment Managers Ltd 0.01801 0.02090 0.02090 3.51191 Cholamandalam DBS Finance Ltd 0.04595 0.07486 0.07486 5.53905 Geojit Financial Services Ltd 0.02189 0.06196 0.06196 2.79670 Shriram City Union Finance Ltd 0.08187 0.13217 0.13217 6.14298 SREI Inffrastructure Finance Ltd 0.05026 0.03564 0.03564 5.39306 Sundaram Finance Ltd 0.05644 0.04819 0.04819 5.12035 Bajaj Auto Finance Ltd 0.05193 0.07675 0.07675 1.68823 Reliance Capital Ltd 0.11088 0.03143 0.03143 0.63671 Infrastructure Development Finance Company Ltd 0.05141 0.04703 0.04703 2.57339 Shriram Transport Finance Company Ltd 0.07205 0.05436 0.05436 6.33542
Diversified (0.0611)
Grasim Industries Ltd 0.08878 0.05264 0.05264 0.53632 Century Textile & Industries Ltd 0.03802 0.04614 0.04614 1.29180 Voltas Ltd 0.03000 0.05189 0.05189 0.42482 Sintex Industries Ltd 0.04773 0.05846 0.05846 0.83877 Kesoram Industries Ltd 0.04502 0.07323 0.07323 1.39531 Nava Bharat Ventures Ltd 0.09668 0.04157 0.04157 0.93144 NESCO Ltd 0.03989 0.05986 0.05986 0.47322 Balmar Lawrie & Company Ltd 0.06858 0.11346 0.11346 0.42819 Prakash Industries Ltd 0.08685 0.03454 0.03454 1.71217 DCM Shriram Consolidated Ltd 0.06988 0.04884 0.04884 1.62393
Source: Self compiled; figures in bracket indicates WACC of that industry
Note:
1. Ko = Average WACC of the study period; Ke = Average cost of equity of study period; Kd = Average cost of
debt capital of the study period; D/E ratio = Average D/E ratio of the study period.
2. Cost of preference capital not calculated as in the financial statement of the sample companies, no
information given regarding issue of preference capital. Although cost of retained earning considered in
calculating WACC but in the above analysis we don’t consider it as the cost is same as cost of equity.
The table exhibits that, the over all cost of capital (WACC) of different industrial
sectors covered in the study lies between as low as 0.0515 and as high as 0. 1615. The lowest
ratio has been (0.0515) observed in the case of chemical group of industry and the
highest in energy (0.1615) sector. High WACC was seen in Bharat Petroleum
Corporation Ltd., Hindustan Petroleum Corporation Ltd., Bongaigaon Refinery and
Petrochemical Ltd., DLF Ltd., Ranbaxy Laboratories Ltd., Divi’s Laboratories Ltd.,
Chapter: 5 Weighted Average Cost of Capital 242
Alfa- Lavel(India) Ltd., TVS Motor Company Ltd., Castrol India Ltd. and Procter &
Gamble Hygine and Health Care Ltd. One of the reasons behind the higher cost of
capital is probably the inclusion of lower amount of debt capital in the capital
structure of these firms. On the other hand, lower WACC was seen in the companies
like Reliance Industries Ltd., Mangalore Refinery and Petrochemicals Ltd., Chennai
Petroleum Corporation Ltd., Gujrat Mineral Development Corporation Ltd.,
Jaiprakash Associates Ltd., IVRCL Infrastructure & Projects Ltd., Simplex
Infrastructure Ltd., Lupin Ltd., JK Lakshmi Cement Ltd., Videocon Industries Ltd.,
Relience Industrial Infrastructure Ltd., Jindal Stainless Ltd., Bombay Dyeing &
Manufacturing Company Ltd., Cholamandalam DBS Finance Ltd., Kesoram
Industries. It is seen that the companies having lower cost of capital included more
amount of debt capital in the capital structure. Again, the companies like Easar Steel
Ltd., Shriram City Union Finance Ltd., Shriram Transport Finance Company Ltd.,
Prakash Industries Ltd. are spending more amount of money in raising capital.
Further, in those companies the maximum amount of debt capital included. So,
maintenance of optimum capital structure is very important. The peculiar thing has
been noticed in the case of DLF Ltd. (Construction Companies) that although
sufficient amount of debt capital included in the capital structure but still the
companies overall cost of capital is very high because the companies cost of equity is
very high as their market price of the share is very low while earning per share is
very high.
Chapter: 5 Weighted Average Cost of Capital 243
Now, to study the quantum of financial burden arose due to capital structure of
individual firm under study specific costs are calculated and presented in the
following paragraphs.
4.1. Nature of Cost of equity in the sample company
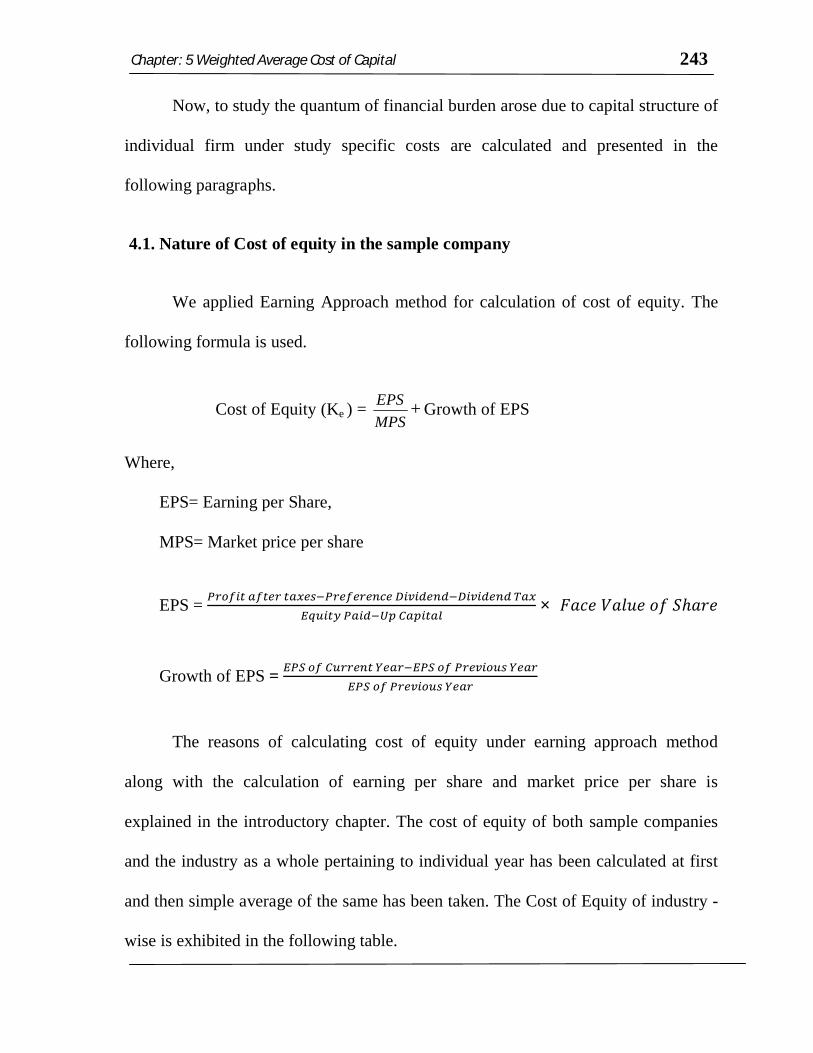
We applied Earning Approach method for calculation of cost of equity. The
following formula is used.
Cost of Equity (Ke ) = MPSEPS + Growth of EPS
Where,
EPS= Earning per Share,
MPS= Market price per share
EPS =
× 퐹푎푐푒푉푎푙푢푒표푓푆ℎ푎푟푒
Growth of EPS =
The reasons of calculating cost of equity under earning approach method
along with the calculation of earning per share and market price per share is
explained in the introductory chapter. The cost of equity of both sample companies
and the industry as a whole pertaining to individual year has been calculated at first
and then simple average of the same has been taken. The Cost of Equity of industry -
wise is exhibited in the following table.
Chapter: 5 Weighted Average Cost of Capital 244
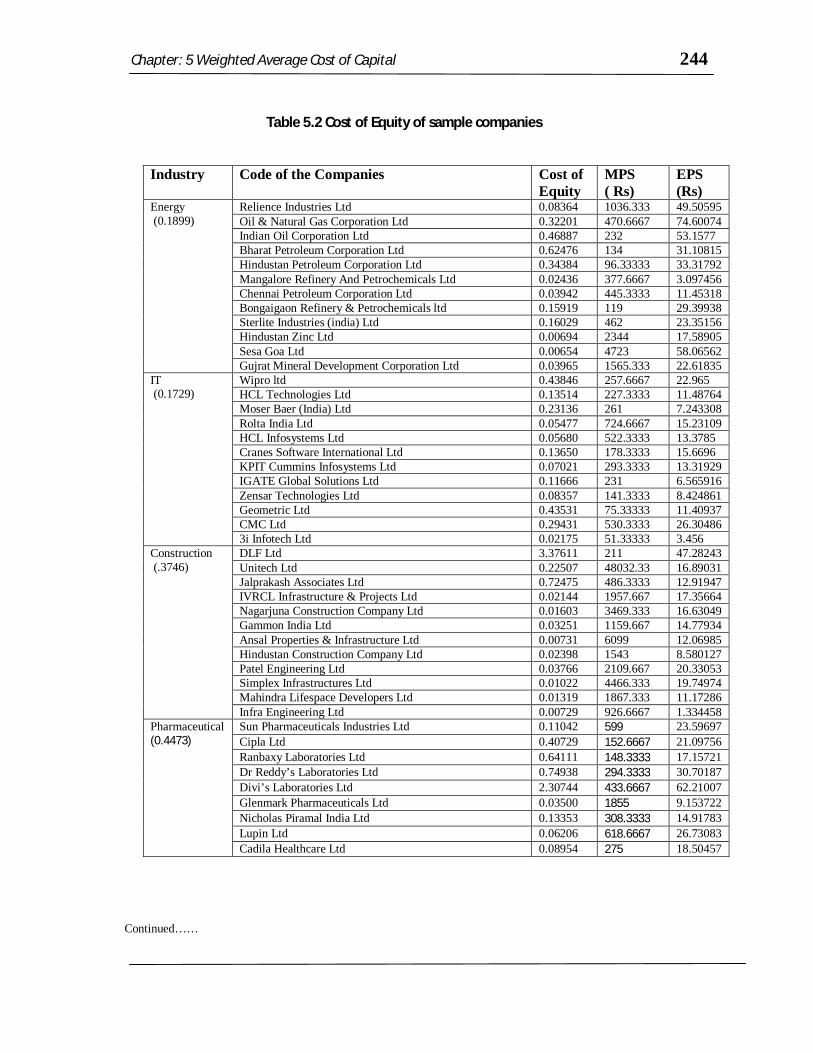
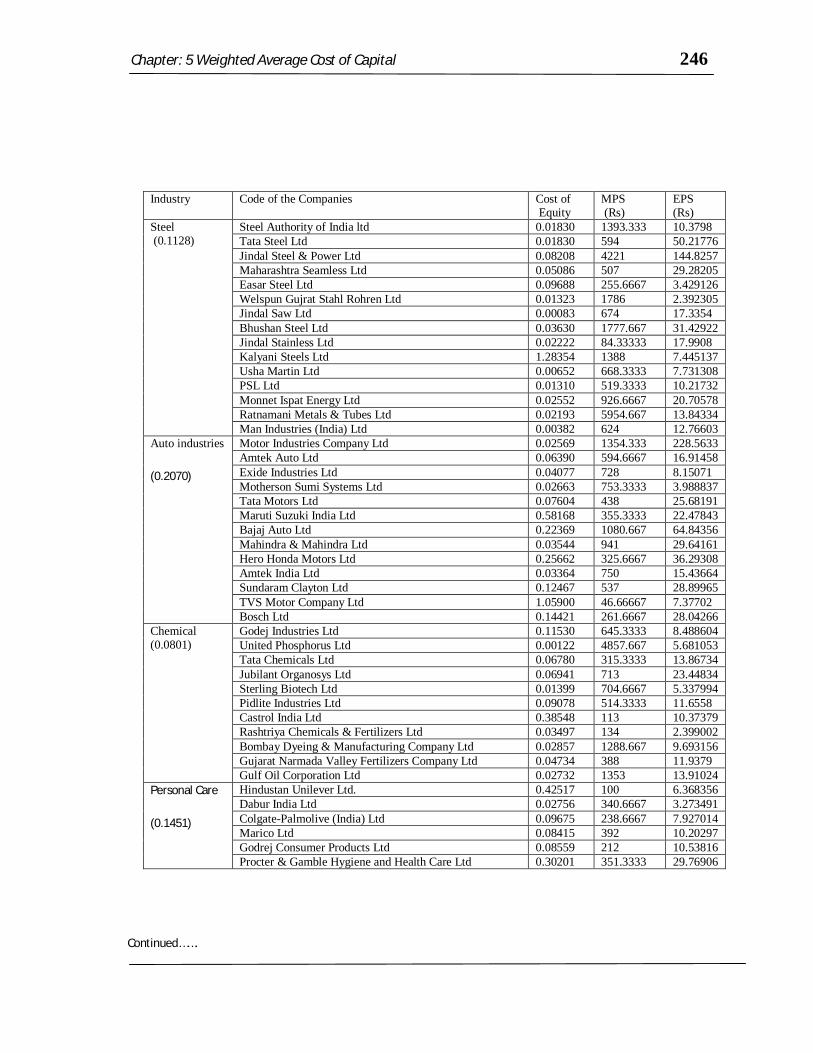
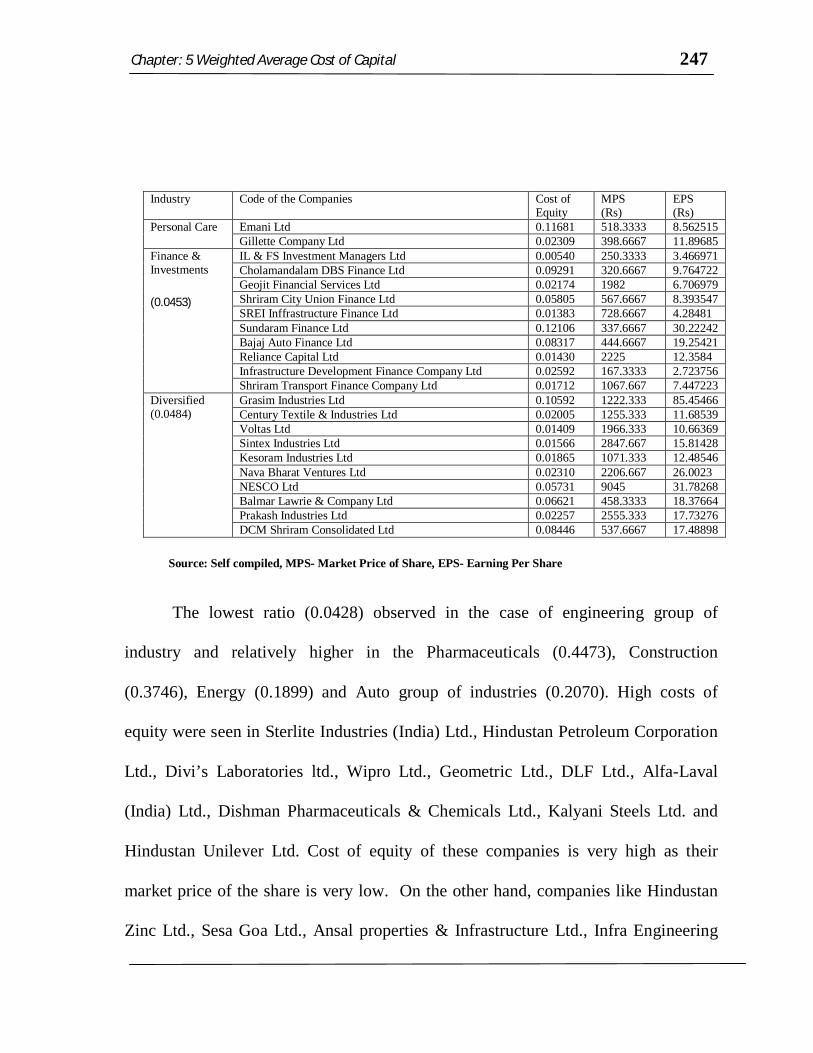
Table 5.2 Cost of Equity of sample companies
Industry Code of the Companies Cost of Equity
MPS ( Rs)
EPS (Rs)
Energy (0.1899)
Relience Industries Ltd 0.08364 1036.333 49.50595 Oil & Natural Gas Corporation Ltd 0.32201 470.6667 74.60074 Indian Oil Corporation Ltd 0.46887 232 53.1577 Bharat Petroleum Corporation Ltd 0.62476 134 31.10815 Hindustan Petroleum Corporation Ltd 0.34384 96.33333 33.31792 Mangalore Refinery And Petrochemicals Ltd 0.02436 377.6667 3.097456 Chennai Petroleum Corporation Ltd 0.03942 445.3333 11.45318 Bongaigaon Refinery & Petrochemicals ltd 0.15919 119 29.39938 Sterlite Industries (india) Ltd 0.16029 462 23.35156 Hindustan Zinc Ltd 0.00694 2344 17.58905 Sesa Goa Ltd 0.00654 4723 58.06562 Gujrat Mineral Development Corporation Ltd 0.03965 1565.333 22.61835
IT (0.1729)
Wipro ltd 0.43846 257.6667 22.965 HCL Technologies Ltd 0.13514 227.3333 11.48764 Moser Baer (India) Ltd 0.23136 261 7.243308 Rolta India Ltd 0.05477 724.6667 15.23109 HCL Infosystems Ltd 0.05680 522.3333 13.3785 Cranes Software International Ltd 0.13650 178.3333 15.6696 KPIT Cummins Infosystems Ltd 0.07021 293.3333 13.31929 IGATE Global Solutions Ltd 0.11666 231 6.565916 Zensar Technologies Ltd 0.08357 141.3333 8.424861 Geometric Ltd 0.43531 75.33333 11.40937 CMC Ltd 0.29431 530.3333 26.30486 3i Infotech Ltd 0.02175 51.33333 3.456
Construction (.3746)
DLF Ltd 3.37611 211 47.28243 Unitech Ltd 0.22507 48032.33 16.89031 Jalprakash Associates Ltd 0.72475 486.3333 12.91947 IVRCL Infrastructure & Projects Ltd 0.02144 1957.667 17.35664 Nagarjuna Construction Company Ltd 0.01603 3469.333 16.63049 Gammon India Ltd 0.03251 1159.667 14.77934 Ansal Properties & Infrastructure Ltd 0.00731 6099 12.06985 Hindustan Construction Company Ltd 0.02398 1543 8.580127 Patel Engineering Ltd 0.03766 2109.667 20.33053 Simplex Infrastructures Ltd 0.01022 4466.333 19.74974 Mahindra Lifespace Developers Ltd 0.01319 1867.333 11.17286 Infra Engineering Ltd 0.00729 926.6667 1.334458
Pharmaceutical (0.4473)
Sun Pharmaceuticals Industries Ltd 0.11042 599 23.59697 Cipla Ltd 0.40729 152.6667 21.09756 Ranbaxy Laboratories Ltd 0.64111 148.3333 17.15721 Dr Reddy’s Laboratories Ltd 0.74938 294.3333 30.70187 Divi’s Laboratories Ltd 2.30744 433.6667 62.21007 Glenmark Pharmaceuticals Ltd 0.03500 1855 9.153722 Nicholas Piramal India Ltd 0.13353 308.3333 14.91783 Lupin Ltd 0.06206 618.6667 26.73083 Cadila Healthcare Ltd 0.08954 275 18.50457
Continued……
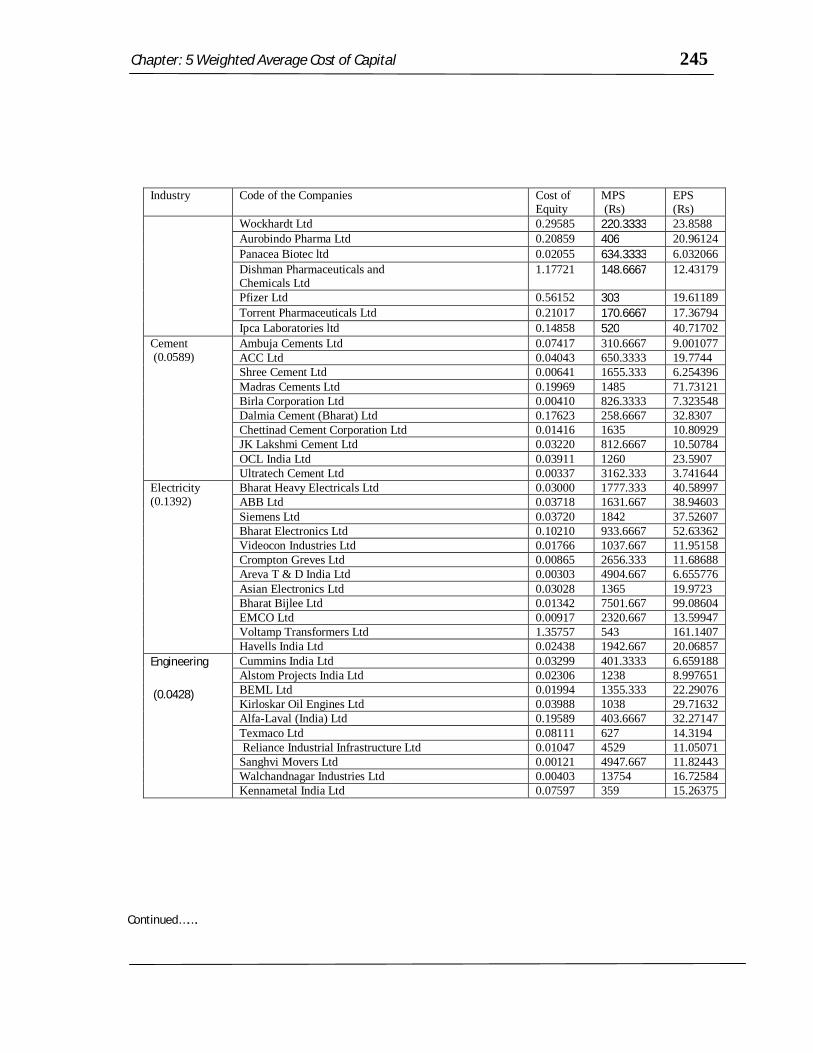
Chapter: 5 Weighted Average Cost of Capital 245
Industry Code of the Companies Cost of Equity
MPS (Rs)
EPS (Rs)
Wockhardt Ltd 0.29585 220.3333 23.8588 Aurobindo Pharma Ltd 0.20859 406 20.96124 Panacea Biotec ltd 0.02055 634.3333 6.032066 Dishman Pharmaceuticals and Chemicals Ltd
1.17721 148.6667 12.43179
Pfizer Ltd 0.56152 303 19.61189 Torrent Pharmaceuticals Ltd 0.21017 170.6667 17.36794 Ipca Laboratories ltd 0.14858 520 40.71702
Cement (0.0589)
Ambuja Cements Ltd 0.07417 310.6667 9.001077 ACC Ltd 0.04043 650.3333 19.7744 Shree Cement Ltd 0.00641 1655.333 6.254396 Madras Cements Ltd 0.19969 1485 71.73121 Birla Corporation Ltd 0.00410 826.3333 7.323548 Dalmia Cement (Bharat) Ltd 0.17623 258.6667 32.8307 Chettinad Cement Corporation Ltd 0.01416 1635 10.80929 JK Lakshmi Cement Ltd 0.03220 812.6667 10.50784 OCL India Ltd 0.03911 1260 23.5907 Ultratech Cement Ltd 0.00337 3162.333 3.741644
Electricity (0.1392)
Bharat Heavy Electricals Ltd 0.03000 1777.333 40.58997 ABB Ltd 0.03718 1631.667 38.94603 Siemens Ltd 0.03720 1842 37.52607 Bharat Electronics Ltd 0.10210 933.6667 52.63362 Videocon Industries Ltd 0.01766 1037.667 11.95158 Crompton Greves Ltd 0.00865 2656.333 11.68688 Areva T & D India Ltd 0.00303 4904.667 6.655776 Asian Electronics Ltd 0.03028 1365 19.9723 Bharat Bijlee Ltd 0.01342 7501.667 99.08604 EMCO Ltd 0.00917 2320.667 13.59947 Voltamp Transformers Ltd 1.35757 543 161.1407 Havells India Ltd 0.02438 1942.667 20.06857
Engineering
(0.0428)
Cummins India Ltd 0.03299 401.3333 6.659188 Alstom Projects India Ltd 0.02306 1238 8.997651 BEML Ltd 0.01994 1355.333 22.29076 Kirloskar Oil Engines Ltd 0.03988 1038 29.71632 Alfa-Laval (India) Ltd 0.19589 403.6667 32.27147 Texmaco Ltd 0.08111 627 14.3194 Reliance Industrial Infrastructure Ltd 0.01047 4529 11.05071 Sanghvi Movers Ltd 0.00121 4947.667 11.82443 Walchandnagar Industries Ltd 0.00403 13754 16.72584 Kennametal India Ltd 0.07597 359 15.26375
Continued…….
Chapter: 5 Weighted Average Cost of Capital 246
Industry Code of the Companies Cost of Equity
MPS (Rs)
EPS (Rs)
Steel (0.1128)
Steel Authority of India ltd 0.01830 1393.333 10.3798 Tata Steel Ltd 0.01830 594 50.21776 Jindal Steel & Power Ltd 0.08208 4221 144.8257 Maharashtra Seamless Ltd 0.05086 507 29.28205 Easar Steel Ltd 0.09688 255.6667 3.429126 Welspun Gujrat Stahl Rohren Ltd 0.01323 1786 2.392305 Jindal Saw Ltd 0.00083 674 17.3354 Bhushan Steel Ltd 0.03630 1777.667 31.42922 Jindal Stainless Ltd 0.02222 84.33333 17.9908 Kalyani Steels Ltd 1.28354 1388 7.445137 Usha Martin Ltd 0.00652 668.3333 7.731308 PSL Ltd 0.01310 519.3333 10.21732 Monnet Ispat Energy Ltd 0.02552 926.6667 20.70578 Ratnamani Metals & Tubes Ltd 0.02193 5954.667 13.84334 Man Industries (India) Ltd 0.00382 624 12.76603
Auto industries
(0.2070)
Motor Industries Company Ltd 0.02569 1354.333 228.5633 Amtek Auto Ltd 0.06390 594.6667 16.91458 Exide Industries Ltd 0.04077 728 8.15071 Motherson Sumi Systems Ltd 0.02663 753.3333 3.988837 Tata Motors Ltd 0.07604 438 25.68191 Maruti Suzuki India Ltd 0.58168 355.3333 22.47843 Bajaj Auto Ltd 0.22369 1080.667 64.84356 Mahindra & Mahindra Ltd 0.03544 941 29.64161 Hero Honda Motors Ltd 0.25662 325.6667 36.29308 Amtek India Ltd 0.03364 750 15.43664 Sundaram Clayton Ltd 0.12467 537 28.89965 TVS Motor Company Ltd 1.05900 46.66667 7.37702 Bosch Ltd 0.14421 261.6667 28.04266
Chemical (0.0801)
Godej Industries Ltd 0.11530 645.3333 8.488604 United Phosphorus Ltd 0.00122 4857.667 5.681053 Tata Chemicals Ltd 0.06780 315.3333 13.86734 Jubilant Organosys Ltd 0.06941 713 23.44834 Sterling Biotech Ltd 0.01399 704.6667 5.337994 Pidlite Industries Ltd 0.09078 514.3333 11.6558 Castrol India Ltd 0.38548 113 10.37379 Rashtriya Chemicals & Fertilizers Ltd 0.03497 134 2.399002 Bombay Dyeing & Manufacturing Company Ltd 0.02857 1288.667 9.693156 Gujarat Narmada Valley Fertilizers Company Ltd 0.04734 388 11.9379 Gulf Oil Corporation Ltd 0.02732 1353 13.91024
Personal Care
(0.1451)
Hindustan Unilever Ltd. 0.42517 100 6.368356 Dabur India Ltd 0.02756 340.6667 3.273491 Colgate-Palmolive (India) Ltd 0.09675 238.6667 7.927014 Marico Ltd 0.08415 392 10.20297 Godrej Consumer Products Ltd 0.08559 212 10.53816 Procter & Gamble Hygiene and Health Care Ltd 0.30201 351.3333 29.76906
Continued…….
Chapter: 5 Weighted Average Cost of Capital 247
Industry Code of the Companies Cost of Equity
MPS (Rs)
EPS (Rs)
Personal Care Emani Ltd 0.11681 518.3333 8.562515 Gillette Company Ltd 0.02309 398.6667 11.89685
Finance & Investments
(0.0453)
IL & FS Investment Managers Ltd 0.00540 250.3333 3.466971 Cholamandalam DBS Finance Ltd 0.09291 320.6667 9.764722 Geojit Financial Services Ltd 0.02174 1982 6.706979 Shriram City Union Finance Ltd 0.05805 567.6667 8.393547 SREI Inffrastructure Finance Ltd 0.01383 728.6667 4.28481 Sundaram Finance Ltd 0.12106 337.6667 30.22242 Bajaj Auto Finance Ltd 0.08317 444.6667 19.25421 Reliance Capital Ltd 0.01430 2225 12.3584 Infrastructure Development Finance Company Ltd 0.02592 167.3333 2.723756 Shriram Transport Finance Company Ltd 0.01712 1067.667 7.447223
Diversified (0.0484)
Grasim Industries Ltd 0.10592 1222.333 85.45466 Century Textile & Industries Ltd 0.02005 1255.333 11.68539 Voltas Ltd 0.01409 1966.333 10.66369 Sintex Industries Ltd 0.01566 2847.667 15.81428 Kesoram Industries Ltd 0.01865 1071.333 12.48546 Nava Bharat Ventures Ltd 0.02310 2206.667 26.0023 NESCO Ltd 0.05731 9045 31.78268 Balmar Lawrie & Company Ltd 0.06621 458.3333 18.37664 Prakash Industries Ltd 0.02257 2555.333 17.73276 DCM Shriram Consolidated Ltd 0.08446 537.6667 17.48898
Source: Self compiled, MPS- Market Price of Share, EPS- Earning Per Share
The lowest ratio (0.0428) observed in the case of engineering group of
industry and relatively higher in the Pharmaceuticals (0.4473), Construction
(0.3746), Energy (0.1899) and Auto group of industries (0.2070). High costs of
equity were seen in Sterlite Industries (India) Ltd., Hindustan Petroleum Corporation
Ltd., Divi’s Laboratories ltd., Wipro Ltd., Geometric Ltd., DLF Ltd., Alfa-Laval
(India) Ltd., Dishman Pharmaceuticals & Chemicals Ltd., Kalyani Steels Ltd. and
Hindustan Unilever Ltd. Cost of equity of these companies is very high as their
market price of the share is very low. On the other hand, companies like Hindustan
Zinc Ltd., Sesa Goa Ltd., Ansal properties & Infrastructure Ltd., Infra Engineering
Chapter: 5 Weighted Average Cost of Capital 248
Ltd., Birla Corporation ltd., Crompton Greves Ltd., Sanghvi Movers Ltd.,
Walchandnagar Industries Ltd., Jindal Saw Ltd. and United Phosphorus Ltd. are
comparatively spending lower amount in raising capital. Cost of equity capital of the
companies is comparatively low because of the higher market price of share. This
suggests that both action cost and prevailing market price act pivotal role in
determining the degree of cost of equity capital.
4.2. Nature of cost of debt capital in the sample company
While calculating cost of debt capital the post paid interest; paid/ payable is
divided by total debt capital adjusting premium, discount and floatation charge
pertaining to issue or such capital of the company. The corporate tax is adjusted in
calculating cost of debt capital.
Again, the Cost of debt of both sample companies and the industry as a whole
pertaining to individual year has been calculated at first and then simple average of
the five years has been taken. The Cost of debt capital of industry -wise classification
is exhibited in the following table.
Chapter: 5 Weighted Average Cost of Capital 249
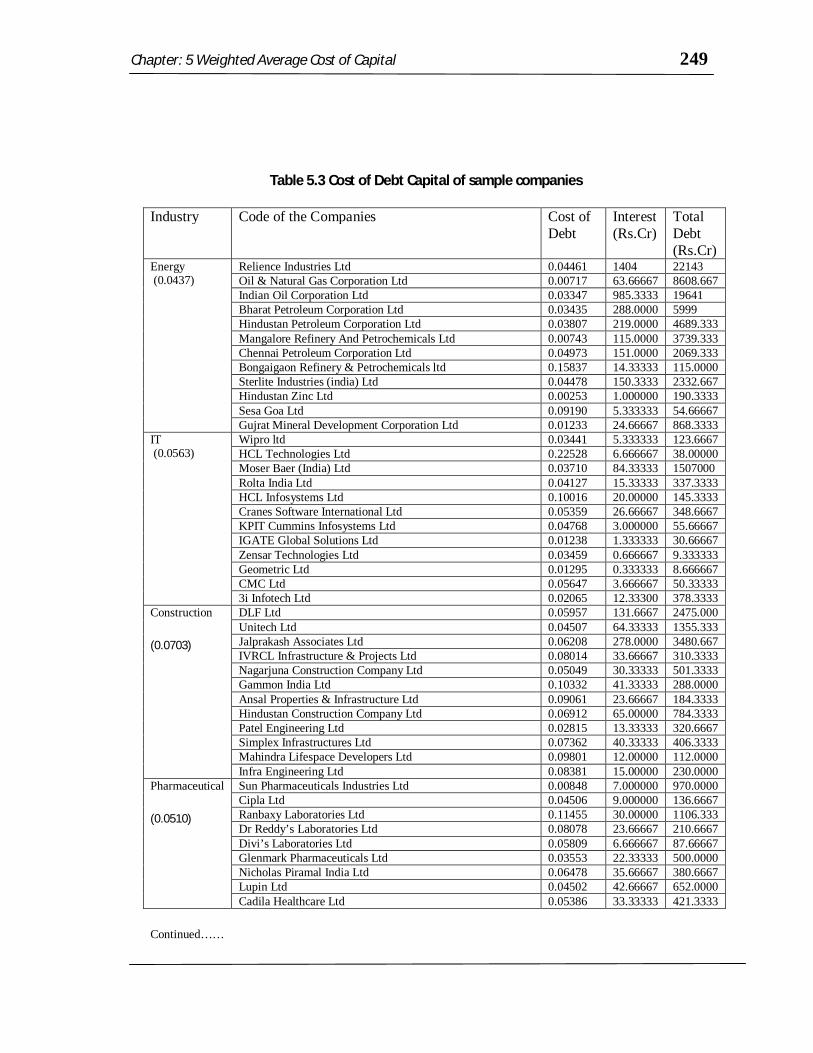
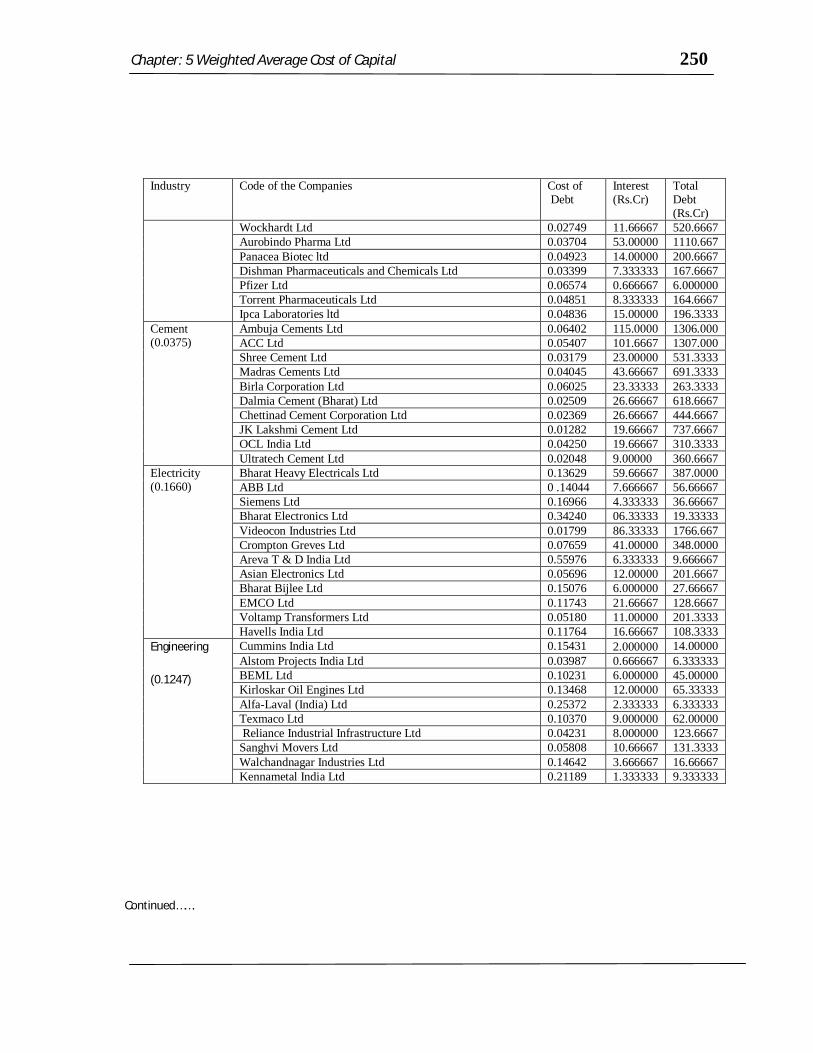
Table 5.3 Cost of Debt Capital of sample companies
Industry Code of the Companies Cost of Debt
Interest (Rs.Cr)
Total Debt (Rs.Cr)
Energy (0.0437)
Relience Industries Ltd 0.04461 1404 22143 Oil & Natural Gas Corporation Ltd 0.00717 63.66667 8608.667 Indian Oil Corporation Ltd 0.03347 985.3333 19641 Bharat Petroleum Corporation Ltd 0.03435 288.0000 5999 Hindustan Petroleum Corporation Ltd 0.03807 219.0000 4689.333 Mangalore Refinery And Petrochemicals Ltd 0.00743 115.0000 3739.333 Chennai Petroleum Corporation Ltd 0.04973 151.0000 2069.333 Bongaigaon Refinery & Petrochemicals ltd 0.15837 14.33333 115.0000 Sterlite Industries (india) Ltd 0.04478 150.3333 2332.667 Hindustan Zinc Ltd 0.00253 1.000000 190.3333 Sesa Goa Ltd 0.09190 5.333333 54.66667 Gujrat Mineral Development Corporation Ltd 0.01233 24.66667 868.3333
IT (0.0563)
Wipro ltd 0.03441 5.333333 123.6667 HCL Technologies Ltd 0.22528 6.666667 38.00000 Moser Baer (India) Ltd 0.03710 84.33333 1507000 Rolta India Ltd 0.04127 15.33333 337.3333 HCL Infosystems Ltd 0.10016 20.00000 145.3333 Cranes Software International Ltd 0.05359 26.66667 348.6667 KPIT Cummins Infosystems Ltd 0.04768 3.000000 55.66667 IGATE Global Solutions Ltd 0.01238 1.333333 30.66667 Zensar Technologies Ltd 0.03459 0.666667 9.333333 Geometric Ltd 0.01295 0.333333 8.666667 CMC Ltd 0.05647 3.666667 50.33333 3i Infotech Ltd 0.02065 12.33300 378.3333
Construction
(0.0703)
DLF Ltd 0.05957 131.6667 2475.000 Unitech Ltd 0.04507 64.33333 1355.333 Jalprakash Associates Ltd 0.06208 278.0000 3480.667 IVRCL Infrastructure & Projects Ltd 0.08014 33.66667 310.3333 Nagarjuna Construction Company Ltd 0.05049 30.33333 501.3333 Gammon India Ltd 0.10332 41.33333 288.0000 Ansal Properties & Infrastructure Ltd 0.09061 23.66667 184.3333 Hindustan Construction Company Ltd 0.06912 65.00000 784.3333 Patel Engineering Ltd 0.02815 13.33333 320.6667 Simplex Infrastructures Ltd 0.07362 40.33333 406.3333 Mahindra Lifespace Developers Ltd 0.09801 12.00000 112.0000 Infra Engineering Ltd 0.08381 15.00000 230.0000
Pharmaceutical
(0.0510)
Sun Pharmaceuticals Industries Ltd 0.00848 7.000000 970.0000 Cipla Ltd 0.04506 9.000000 136.6667 Ranbaxy Laboratories Ltd 0.11455 30.00000 1106.333 Dr Reddy’s Laboratories Ltd 0.08078 23.66667 210.6667 Divi’s Laboratories Ltd 0.05809 6.666667 87.66667 Glenmark Pharmaceuticals Ltd 0.03553 22.33333 500.0000 Nicholas Piramal India Ltd 0.06478 35.66667 380.6667 Lupin Ltd 0.04502 42.66667 652.0000 Cadila Healthcare Ltd 0.05386 33.33333 421.3333
Continued……
Chapter: 5 Weighted Average Cost of Capital 250
Industry Code of the Companies Cost of Debt
Interest (Rs.Cr)
Total Debt (Rs.Cr)
Wockhardt Ltd 0.02749 11.66667 520.6667 Aurobindo Pharma Ltd 0.03704 53.00000 1110.667 Panacea Biotec ltd 0.04923 14.00000 200.6667 Dishman Pharmaceuticals and Chemicals Ltd 0.03399 7.333333 167.6667 Pfizer Ltd 0.06574 0.666667 6.000000 Torrent Pharmaceuticals Ltd 0.04851 8.333333 164.6667 Ipca Laboratories ltd 0.04836 15.00000 196.3333
Cement (0.0375)
Ambuja Cements Ltd 0.06402 115.0000 1306.000 ACC Ltd 0.05407 101.6667 1307.000 Shree Cement Ltd 0.03179 23.00000 531.3333 Madras Cements Ltd 0.04045 43.66667 691.3333 Birla Corporation Ltd 0.06025 23.33333 263.3333 Dalmia Cement (Bharat) Ltd 0.02509 26.66667 618.6667 Chettinad Cement Corporation Ltd 0.02369 26.66667 444.6667 JK Lakshmi Cement Ltd 0.01282 19.66667 737.6667 OCL India Ltd 0.04250 19.66667 310.3333 Ultratech Cement Ltd 0.02048 9.00000 360.6667
Electricity (0.1660)
Bharat Heavy Electricals Ltd 0.13629 59.66667 387.0000 ABB Ltd 0 .14044 7.666667 56.66667 Siemens Ltd 0.16966 4.333333 36.66667 Bharat Electronics Ltd 0.34240 06.33333 19.33333 Videocon Industries Ltd 0.01799 86.33333 1766.667 Crompton Greves Ltd 0.07659 41.00000 348.0000 Areva T & D India Ltd 0.55976 6.333333 9.666667 Asian Electronics Ltd 0.05696 12.00000 201.6667 Bharat Bijlee Ltd 0.15076 6.000000 27.66667 EMCO Ltd 0.11743 21.66667 128.6667 Voltamp Transformers Ltd 0.05180 11.00000 201.3333 Havells India Ltd 0.11764 16.66667 108.3333
Engineering
(0.1247)
Cummins India Ltd 0.15431 2.000000 14.00000 Alstom Projects India Ltd 0.03987 0.666667 6.333333 BEML Ltd 0.10231 6.000000 45.00000 Kirloskar Oil Engines Ltd 0.13468 12.00000 65.33333 Alfa-Laval (India) Ltd 0.25372 2.333333 6.333333 Texmaco Ltd 0.10370 9.000000 62.00000 Reliance Industrial Infrastructure Ltd 0.04231 8.000000 123.6667 Sanghvi Movers Ltd 0.05808 10.66667 131.3333 Walchandnagar Industries Ltd 0.14642 3.666667 16.66667 Kennametal India Ltd 0.21189 1.333333 9.333333
Continued…….
Chapter: 5 Weighted Average Cost of Capital 251
Industry Code of the Companies Cost of Debt
Interest (Rs.Cr)
Total Debt (Rs.Cr)
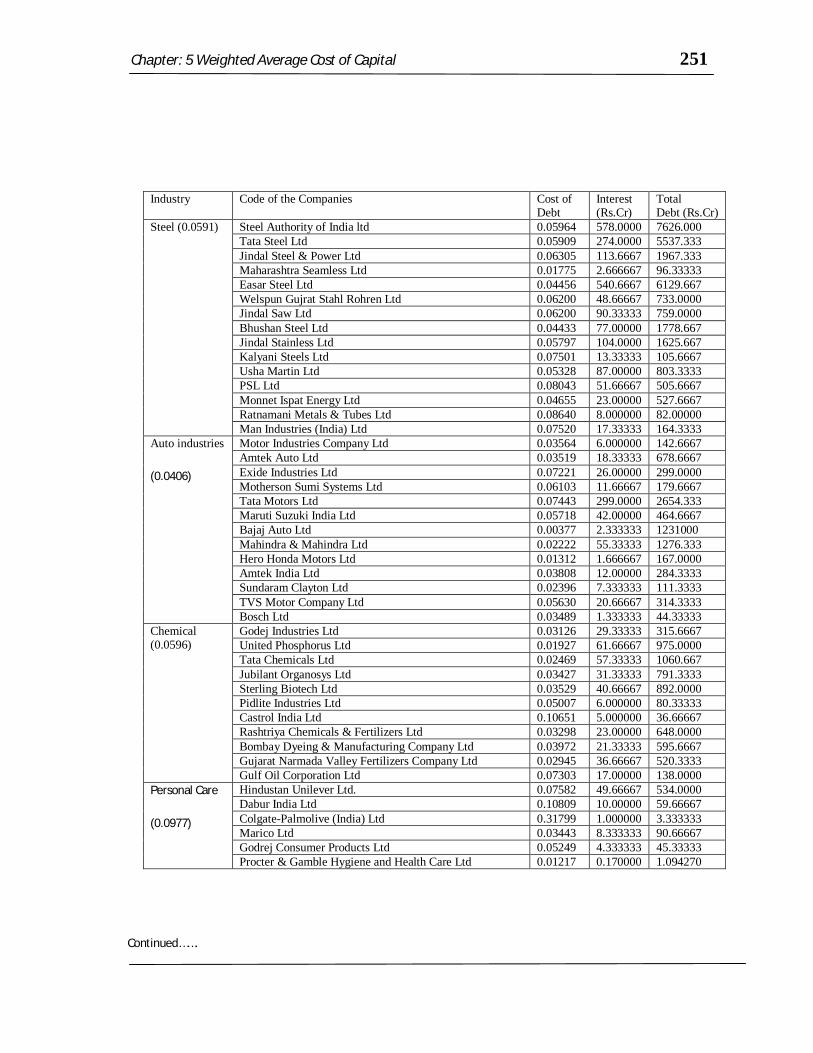
Steel (0.0591) Steel Authority of India ltd 0.05964 578.0000 7626.000 Tata Steel Ltd 0.05909 274.0000 5537.333 Jindal Steel & Power Ltd 0.06305 113.6667 1967.333 Maharashtra Seamless Ltd 0.01775 2.666667 96.33333 Easar Steel Ltd 0.04456 540.6667 6129.667 Welspun Gujrat Stahl Rohren Ltd 0.06200 48.66667 733.0000 Jindal Saw Ltd 0.06200 90.33333 759.0000 Bhushan Steel Ltd 0.04433 77.00000 1778.667 Jindal Stainless Ltd 0.05797 104.0000 1625.667 Kalyani Steels Ltd 0.07501 13.33333 105.6667 Usha Martin Ltd 0.05328 87.00000 803.3333 PSL Ltd 0.08043 51.66667 505.6667 Monnet Ispat Energy Ltd 0.04655 23.00000 527.6667 Ratnamani Metals & Tubes Ltd 0.08640 8.000000 82.00000 Man Industries (India) Ltd 0.07520 17.33333 164.3333
Auto industries
(0.0406)
Motor Industries Company Ltd 0.03564 6.000000 142.6667 Amtek Auto Ltd 0.03519 18.33333 678.6667 Exide Industries Ltd 0.07221 26.00000 299.0000 Motherson Sumi Systems Ltd 0.06103 11.66667 179.6667 Tata Motors Ltd 0.07443 299.0000 2654.333 Maruti Suzuki India Ltd 0.05718 42.00000 464.6667 Bajaj Auto Ltd 0.00377 2.333333 1231000 Mahindra & Mahindra Ltd 0.02222 55.33333 1276.333 Hero Honda Motors Ltd 0.01312 1.666667 167.0000 Amtek India Ltd 0.03808 12.00000 284.3333 Sundaram Clayton Ltd 0.02396 7.333333 111.3333 TVS Motor Company Ltd 0.05630 20.66667 314.3333 Bosch Ltd 0.03489 1.333333 44.33333
Chemical (0.0596)
Godej Industries Ltd 0.03126 29.33333 315.6667 United Phosphorus Ltd 0.01927 61.66667 975.0000 Tata Chemicals Ltd 0.02469 57.33333 1060.667 Jubilant Organosys Ltd 0.03427 31.33333 791.3333 Sterling Biotech Ltd 0.03529 40.66667 892.0000 Pidlite Industries Ltd 0.05007 6.000000 80.33333 Castrol India Ltd 0.10651 5.000000 36.66667 Rashtriya Chemicals & Fertilizers Ltd 0.03298 23.00000 648.0000 Bombay Dyeing & Manufacturing Company Ltd 0.03972 21.33333 595.6667 Gujarat Narmada Valley Fertilizers Company Ltd 0.02945 36.66667 520.3333 Gulf Oil Corporation Ltd 0.07303 17.00000 138.0000
Personal Care
(0.0977)
Hindustan Unilever Ltd. 0.07582 49.66667 534.0000 Dabur India Ltd 0.10809 10.00000 59.66667 Colgate-Palmolive (India) Ltd 0.31799 1.000000 3.333333 Marico Ltd 0.03443 8.333333 90.66667 Godrej Consumer Products Ltd 0.05249 4.333333 45.33333 Procter & Gamble Hygiene and Health Care Ltd 0.01217 0.170000 1.094270
Continued…….
Chapter: 5 Weighted Average Cost of Capital 252
Industry Code of the Companies Cost of Debt
Interest (Rs.Cr)
Total Debt (Rs.Cr)
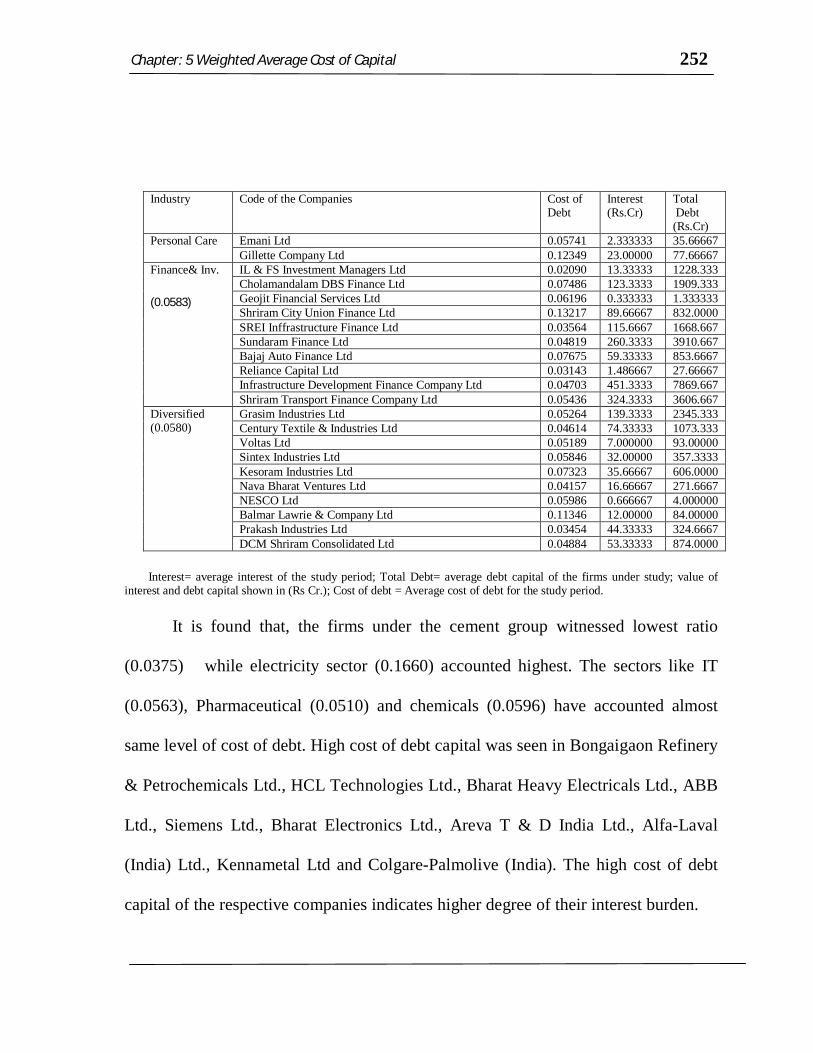
Personal Care Emani Ltd 0.05741 2.333333 35.66667 Gillette Company Ltd 0.12349 23.00000 77.66667
Finance& Inv.
(0.0583)
IL & FS Investment Managers Ltd 0.02090 13.33333 1228.333 Cholamandalam DBS Finance Ltd 0.07486 123.3333 1909.333 Geojit Financial Services Ltd 0.06196 0.333333 1.333333 Shriram City Union Finance Ltd 0.13217 89.66667 832.0000 SREI Inffrastructure Finance Ltd 0.03564 115.6667 1668.667 Sundaram Finance Ltd 0.04819 260.3333 3910.667 Bajaj Auto Finance Ltd 0.07675 59.33333 853.6667 Reliance Capital Ltd 0.03143 1.486667 27.66667 Infrastructure Development Finance Company Ltd 0.04703 451.3333 7869.667 Shriram Transport Finance Company Ltd 0.05436 324.3333 3606.667
Diversified (0.0580)
Grasim Industries Ltd 0.05264 139.3333 2345.333 Century Textile & Industries Ltd 0.04614 74.33333 1073.333 Voltas Ltd 0.05189 7.000000 93.00000 Sintex Industries Ltd 0.05846 32.00000 357.3333 Kesoram Industries Ltd 0.07323 35.66667 606.0000 Nava Bharat Ventures Ltd 0.04157 16.66667 271.6667 NESCO Ltd 0.05986 0.666667 4.000000 Balmar Lawrie & Company Ltd 0.11346 12.00000 84.00000 Prakash Industries Ltd 0.03454 44.33333 324.6667 DCM Shriram Consolidated Ltd 0.04884 53.33333 874.0000
Interest= average interest of the study period; Total Debt= average debt capital of the firms under study; value of interest and debt capital shown in (Rs Cr.); Cost of debt = Average cost of debt for the study period.
It is found that, the firms under the cement group witnessed lowest ratio
(0.0375) while electricity sector (0.1660) accounted highest. The sectors like IT
(0.0563), Pharmaceutical (0.0510) and chemicals (0.0596) have accounted almost
same level of cost of debt. High cost of debt capital was seen in Bongaigaon Refinery
& Petrochemicals Ltd., HCL Technologies Ltd., Bharat Heavy Electricals Ltd., ABB
Ltd., Siemens Ltd., Bharat Electronics Ltd., Areva T & D India Ltd., Alfa-Laval
(India) Ltd., Kennametal Ltd and Colgare-Palmolive (India). The high cost of debt
capital of the respective companies indicates higher degree of their interest burden.
Chapter: 5 Weighted Average Cost of Capital 253
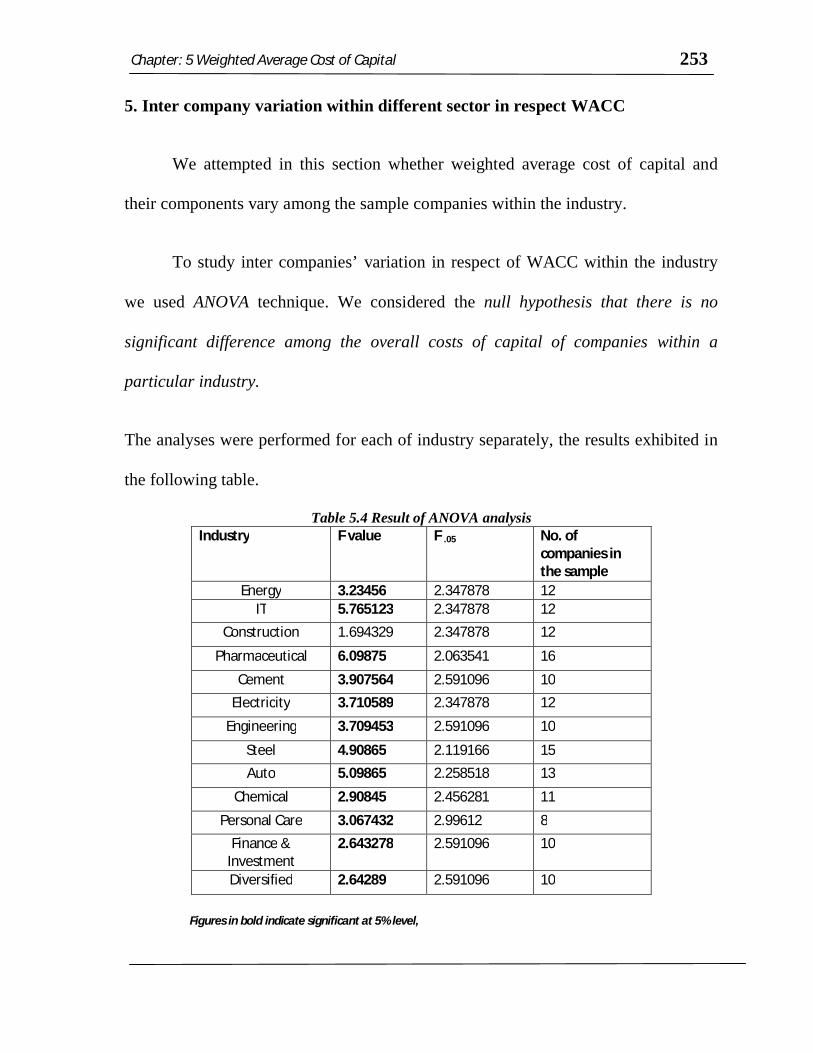
5. Inter company variation within different sector in respect WACC
We attempted in this section whether weighted average cost of capital and
their components vary among the sample companies within the industry.
To study inter companies’ variation in respect of WACC within the industry
we used ANOVA technique. We considered the null hypothesis that there is no
significant difference among the overall costs of capital of companies within a
particular industry.
The analyses were performed for each of industry separately, the results exhibited in
the following table.
Table 5.4 Result of ANOVA analysis Industry F value F .05 No. of
companies in the sample
Energy 3.23456 2.347878 12 IT 5.765123 2.347878 12
Construction 1.694329 2.347878 12
Pharmaceutical 6.09875 2.063541 16
Cement 3.907564 2.591096 10 Electricity 3.710589 2.347878 12
Engineering 3.709453 2.591096 10
Steel 4.90865 2.119166 15 Auto 5.09865 2.258518 13
Chemical 2.90845 2.456281 11
Personal Care 3.067432 2.99612 8 Finance &
Investment 2.643278 2.591096 10
Diversified 2.64289 2.591096 10
Figures in bold indicate significant at 5% level,
Chapter: 5 Weighted Average Cost of Capital 254
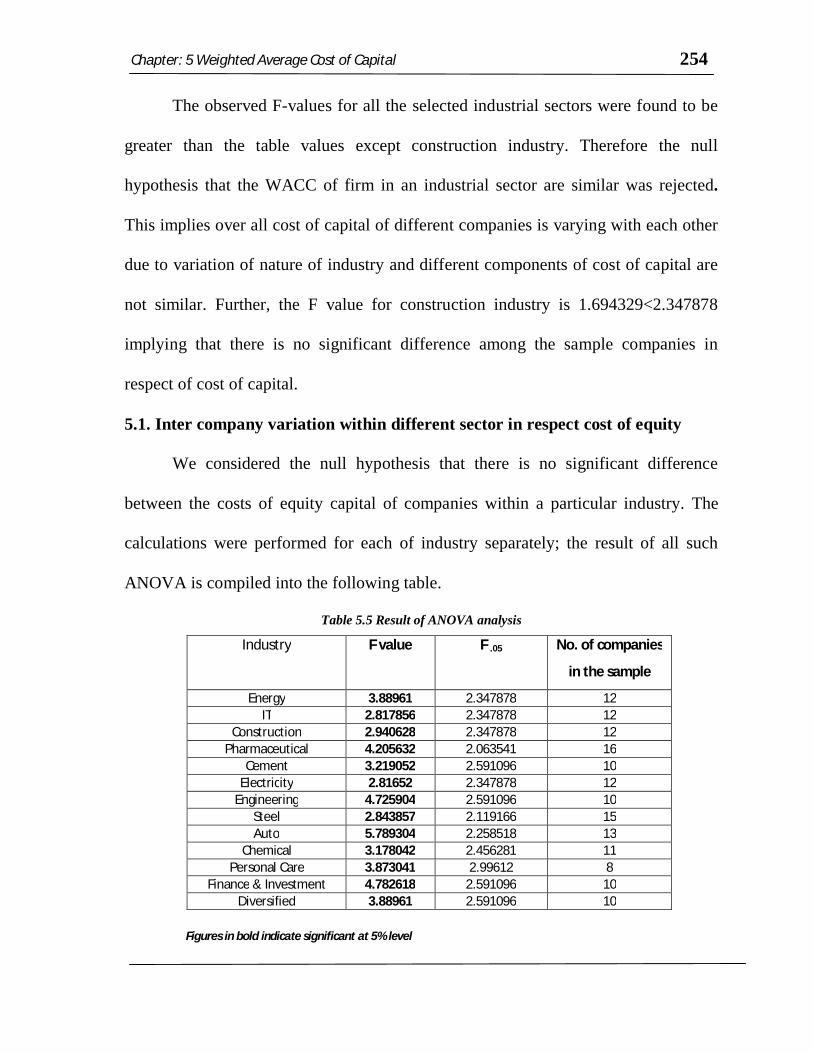
The observed F-values for all the selected industrial sectors were found to be
greater than the table values except construction industry. Therefore the null
hypothesis that the WACC of firm in an industrial sector are similar was rejected.
This implies over all cost of capital of different companies is varying with each other
due to variation of nature of industry and different components of cost of capital are
not similar. Further, the F value for construction industry is 1.694329<2.347878
implying that there is no significant difference among the sample companies in
respect of cost of capital.
5.1. Inter company variation within different sector in respect cost of equity
We considered the null hypothesis that there is no significant difference
between the costs of equity capital of companies within a particular industry. The
calculations were performed for each of industry separately; the result of all such
ANOVA is compiled into the following table.
Table 5.5 Result of ANOVA analysis Industry F value F .05 No. of companies
in the sample
Energy 3.88961 2.347878 12 IT 2.817856 2.347878 12
Construction 2.940628 2.347878 12 Pharmaceutical 4.205632 2.063541 16
Cement 3.219052 2.591096 10 Electricity 2.81652 2.347878 12
Engineering 4.725904 2.591096 10 Steel 2.843857 2.119166 15 Auto 5.789304 2.258518 13
Chemical 3.178042 2.456281 11 Personal Care 3.873041 2.99612 8
Finance & Investment 4.782618 2.591096 10 Diversified 3.88961 2.591096 10
Figures in bold indicate significant at 5% level
Chapter: 5 Weighted Average Cost of Capital 255
The observed F-values for all the selected industrial sectors were found to be
greater than the table values. Therefore, the null hypothesis that the cost of equity of
firm in an industrial sector is similar was rejected. This implies that sample
companies differ in respect of cost of equity capital. The reasons of such difference
are attributed to the distinct capital structure policies based on nature and
requirements along with risk appetite of the management of the company.
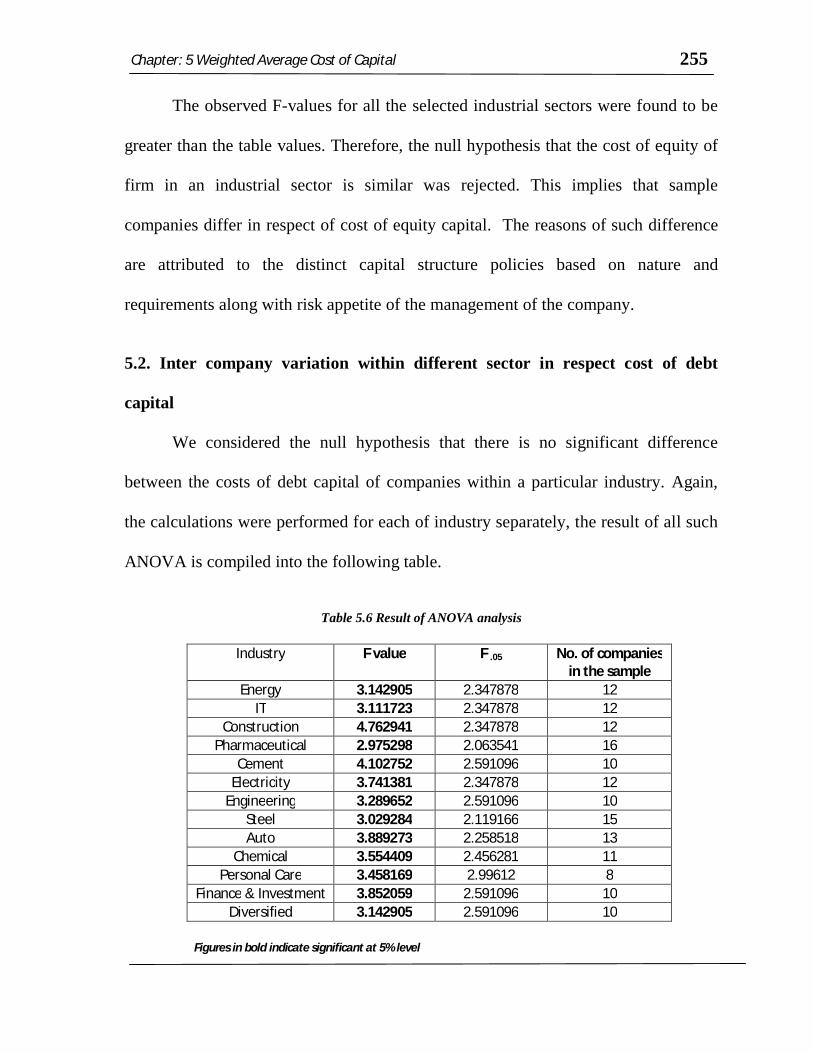
5.2. Inter company variation within different sector in respect cost of debt
capital
We considered the null hypothesis that there is no significant difference
between the costs of debt capital of companies within a particular industry. Again,
the calculations were performed for each of industry separately, the result of all such
ANOVA is compiled into the following table.
Table 5.6 Result of ANOVA analysis
Industry F value F .05 No. of companies in the sample
Energy 3.142905 2.347878 12 IT 3.111723 2.347878 12
Construction 4.762941 2.347878 12 Pharmaceutical 2.975298 2.063541 16
Cement 4.102752 2.591096 10 Electricity 3.741381 2.347878 12
Engineering 3.289652 2.591096 10 Steel 3.029284 2.119166 15 Auto 3.889273 2.258518 13
Chemical 3.554409 2.456281 11 Personal Care 3.458169 2.99612 8
Finance & Investment 3.852059 2.591096 10 Diversified 3.142905 2.591096 10
Figures in bold indicate significant at 5% level
Chapter: 5 Weighted Average Cost of Capital 256
The observed F-values for all the selected industrial sectors were found to be
greater than the table values. Therefore, the null hypothesis that the costs of debt
capital of firm in an industrial sector are similar was rejected and implying that cost
of debt capital of different companies are varied even within the same industrial
group. In other words, management plays important role in determining the level of
debts in the capital structure.
6. Interrelationship between WACC and variables determining companies’
performance
From the earlier literature reviewed, it has been emerged that the financial
performance of the company is measured by different financial parameters like size,
growth, liquidity, profitability, leverage and growth of dividend of the companies. In
this respect, the financial tools such as capital employed, growth of profit after tax,
current ratio, return on net worth, debt equity ratio and dividend payout ratio are
considered to represent companies size, growth, liquidity, profitability, leverage and
growth of dividend of the companies respectively. However, management endeavor
relates to have optimal capital structure to some extent to achieve the goal of wealth
maximization through better financial performance. It is worth mentioning in this
respect that the financial cost of capital plays vital role in the level of earnings as well
overall financial performance of the firms. This warrants studying the impact of
WACC on financial performance of the company or vice-versa. Analysis of
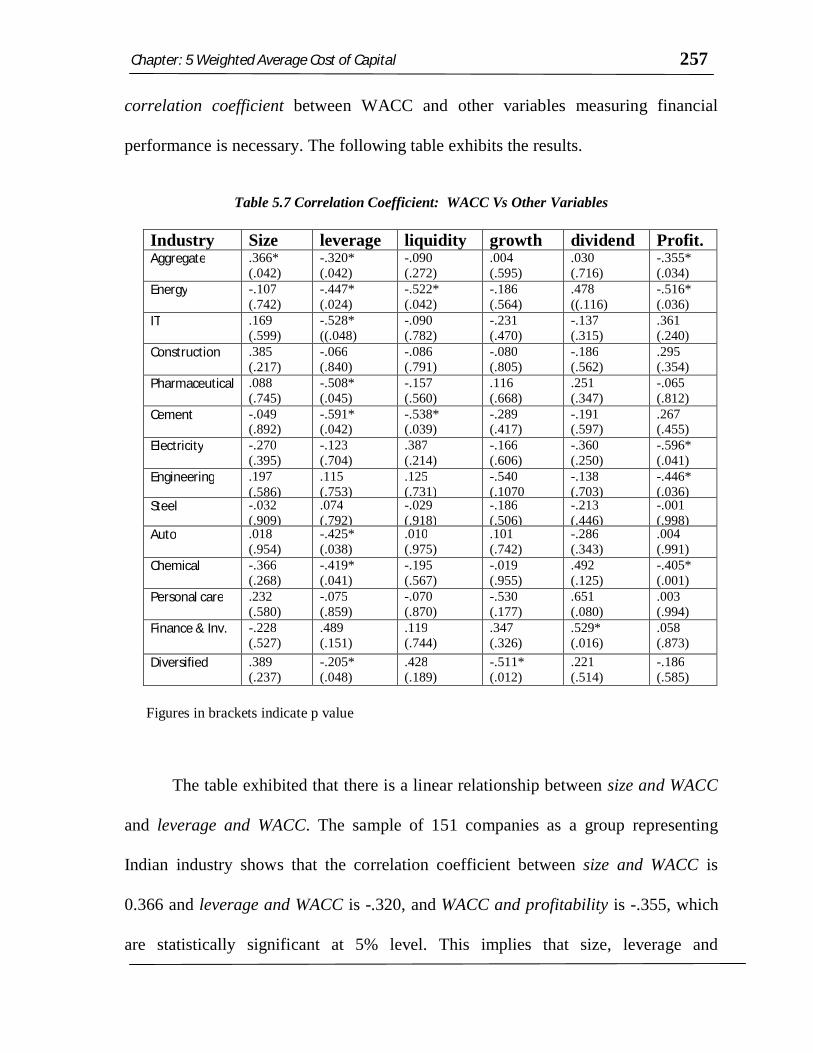
Chapter: 5 Weighted Average Cost of Capital 257
correlation coefficient between WACC and other variables measuring financial
performance is necessary. The following table exhibits the results.
Table 5.7 Correlation Coefficient: WACC Vs Other Variables
Industry Size leverage liquidity growth dividend Profit. Aggregate .366*
(.042) -.320* (.042)
-.090 (.272)
.004 (.595)
.030 (.716)
-.355* (.034)
Energy -.107 (.742)
-.447* (.024)
-.522* (.042)
-.186 (.564)
.478 ((.116)
-.516* (.036)
IT .169 (.599)
-.528* ((.048)
-.090 (.782)
-.231 (.470)
-.137 (.315)
.361 (.240)
Construction .385 (.217)
-.066 (.840)
-.086 (.791)
-.080 (.805)
-.186 (.562)
.295 (.354)
Pharmaceutical .088 (.745)
-.508* (.045)
-.157 (.560)
.116 (.668)
.251 (.347)
-.065 (.812)
Cement -.049 (.892)
-.591* (.042)
-.538* (.039)
-.289 (.417)
-.191 (.597)
.267 (.455)
Electricity -.270 (.395)
-.123 (.704)
.387 (.214)
-.166 (.606)
-.360 (.250)
-.596* (.041)
Engineering .197 (.586)
.115 (.753)
.125 (.731)
-.540 (.1070
-.138 (.703)
-.446* (.036)
Steel -.032 (.909)
.074 (.792)
-.029 (.918)
-.186 (.506)
-.213 (.446)
-.001 (.998)
Auto .018 (.954)
-.425* (.038)
.010 (.975)
.101 (.742)
-.286 (.343)
.004 (.991)
Chemical -.366 (.268)
-.419* (.041)
-.195 (.567)
-.019 (.955)
.492 (.125)
-.405* (.001)
Personal care .232 (.580)
-.075 (.859)
-.070 (.870)
-.530 (.177)
.651 (.080)
.003 (.994)
Finance & Inv. -.228 (.527)
.489 (.151)
.119 (.744)
.347 (.326)
.529* (.016)
.058 (.873)
Diversified .389 (.237)
-.205* (.048)
.428 (.189)
-.511* (.012)
.221 (.514)
-.186 (.585)
Figures in brackets indicate p value
The table exhibited that there is a linear relationship between size and WACC
and leverage and WACC. The sample of 151 companies as a group representing
Indian industry shows that the correlation coefficient between size and WACC is
0.366 and leverage and WACC is -.320, and WACC and profitability is -.355, which
are statistically significant at 5% level. This implies that size, leverage and
Chapter: 5 Weighted Average Cost of Capital 258
profitability are affected by overall Cost of capital of the companies. The value of
correlation coefficient between the variables revealed that with the increase of size of
the organization the over all cost of capital is also increasing and vice-versa. The
leverage is indirectly associated with WACC. One significant result obtained from
the aforesaid correlation analysis that positive “r” against the “a priori”, profitability
and WACC are inversely related in the sector like IT, Construction Cement, Auto,
personal Care and Finance & Investment. The reasons of such positive relationship
can be attributed to the growth of EBIT of the companies irrespective of growth of
capital structure. Moreover, these companies have efficiently used their capital and
attempted to expedite their bottom-line. Thus, growing firms and firms with
perennial demand do not bother much about WACC; rather they concentrate on
expanding the business opportunities.
Now to study whether performance of the company has any impact on the cost
of capital we have fitted regression line taking WACC as dependent variable.
Following table exhibits the result.
Chapter: 5 Weighted Average Cost of Capital 259
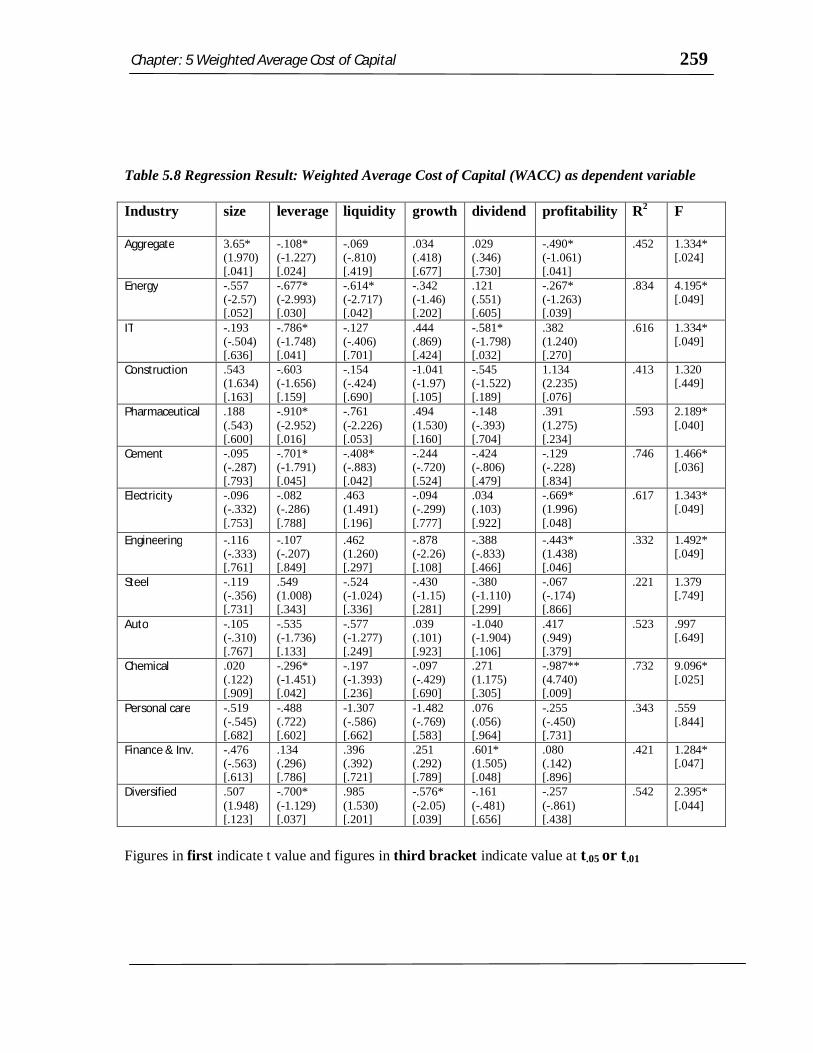
Table 5.8 Regression Result: Weighted Average Cost of Capital (WACC) as dependent variable
Industry size leverage liquidity growth dividend profitability R2 F
Aggregate 3.65* (1.970) [.041]
-.108* (-1.227) [.024]
-.069 (-.810) [.419]
.034 (.418) [.677]
.029 (.346) [.730]
-.490* (-1.061) [.041]
.452 1.334* [.024]
Energy -.557 (-2.57) [.052]
-.677* (-2.993) [.030]
-.614* (-2.717) [.042]
-.342 (-1.46) [.202]
.121 (.551) [.605]
-.267* (-1.263) [.039]
.834 4.195* [.049]
IT -.193 (-.504) [.636]
-.786* (-1.748) [.041]
-.127 (-.406) [.701]
.444 (.869) [.424]
-.581* (-1.798) [.032]
.382 (1.240) [.270]
.616 1.334* [.049]
Construction .543 (1.634) [.163]
-.603 (-1.656) [.159]
-.154 (-.424) [.690]
-1.041 (-1.97) [.105]
-.545 (-1.522) [.189]
1.134 (2.235) [.076]
.413 1.320 [.449]
Pharmaceutical .188 (.543) [.600]
-.910* (-2.952) [.016]
-.761 (-2.226) [.053]
.494 (1.530) [.160]
-.148 (-.393) [.704]
.391 (1.275) [.234]
.593 2.189* [.040]
Cement -.095 (-.287) [.793]
-.701* (-1.791) [.045]
-.408* (-.883) [.042]
-.244 (-.720) [.524]
-.424 (-.806) [.479]
-.129 (-.228) [.834]
.746 1.466* [.036]
Electricity
-.096 (-.332) [.753]
-.082 (-.286) [.788]
.463 (1.491) [.196]
-.094 (-.299) [.777]
.034 (.103) [.922]
-.669* (1.996) [.048]
.617 1.343* [.049]
Engineering -.116 (-.333) [.761]
-.107 (-.207) [.849]
.462 (1.260) [.297]
-.878 (-2.26) [.108]
-.388 (-.833) [.466]
-.443* (1.438) [.046]
.332 1.492* [.049]
Steel -.119 (-.356) [.731]
.549 (1.008) [.343]
-.524 (-1.024) [.336]
-.430 (-1.15) [.281]
-.380 (-1.110) [.299]
-.067 (-.174) [.866]
.221 1.379 [.749]
Auto -.105 (-.310) [.767]
-.535 (-1.736) [.133]
-.577 (-1.277) [.249]
.039 (.101) [.923]
-1.040 (-1.904) [.106]
.417 (.949) [.379]
.523 .997 [.649]
Chemical .020 (.122) [.909]
-.296* (-1.451) [.042]
-.197 (-1.393) [.236]
-.097 (-.429) [.690]
.271 (1.175) [.305]
-.987** (4.740) [.009]
.732 9.096* [.025]
Personal care -.519 (-.545) [.682]
-.488 (.722) [.602]
-1.307 (-.586) [.662]
-1.482 (-.769) [.583]
.076 (.056) [.964]
-.255 (-.450) [.731]
.343 .559 [.844]
Finance & Inv. -.476 (-.563) [.613]
.134 (.296) [.786]
.396 (.392) [.721]
.251 (.292) [.789]
.601* (1.505) [.048]
.080 (.142) [.896]
.421 1.284* [.047]
Diversified .507 (1.948) [.123]
-.700* (-1.129) [.037]
.985 (1.530) [.201]
-.576* (-2.05) [.039]
-.161 (-.481) [.656]
-.257 (-.861) [.438]
.542 2.395* [.044]
Figures in first indicate t value and figures in third bracket indicate value at t.05 or t.01
Chapter: 5 Weighted Average Cost of Capital 260
The econometric analysis reveals that, leverage becomes one of the major
influential factors of the cost of capital. Except Construction, Electricity,
Engineering, Steel, Auto, Personal Care and Financial Service, it has been seen that
leverage is negatively related to the cost of capital and statistically significant. It
signifies the cost of capital has declined with significant increase of debt capital in
the capital structure. The sectors like Construction, Electricity, Steel, Auto group are
found to be highly geared company even in some case debts in form of borrowed
capital are double to equity capital in the capital structure. Where as the sector like
Engineering and personal care are maintaining low level of borrowed capital in the
capital structure resulting into no affect on cost of capital. It implies capital structure
decision plays an important role for minimizing overall cost of capital of the
companies. But the companies must have to maintain optimum level of capital
structure (debt-equity mix) based on its nature and risk zone where it operates. The
statistically significant value of “F” at 5% level of significance indicates the
regression equation is significant. While, value of R2, indicates the extents or
influence of independent variables on dependent variable, WACC. In aggregate term,
it is observed that regression is significant. However, independent variables explain
variation only 45% (R2 = .452) of dependent variable. Thus, WACC is not
significantly affected by financial performance of the firms as far as sample is
concerned. Only, size (β =3.65) has positive while leverage (β = -0.108) and
profitability (β = -0.490) has negative impact on WACC. However, such
interpretation differs in case of individual sector. Thus, WACC is firms specific. The
Chapter: 5 Weighted Average Cost of Capital 261
factors mainly qualitative are; business risk, financial risk, management risks appetite
and fiscal policy as a whole. Similar views were expressed by (K.B. Hari: 2006) that
Indian large firms are not using resources effectively in comparison to their smaller
counterparts even not taking advantage of cheaper funds available over the years.
It is evident from the above table that a few, not all variables were
detected as explanatory for the WACC across industrial sectors. Much of this is
accountable to the nature of the industry. Further, following analysis has been
conducted particularly related to determining the influential factor of cost of capital:
6.1Cost of capital and Size
In aggregate terms, relationship between size of the companies and WACC (β = 3.65)
indicates with the increase of size of the companies cost of capital is also increasing
as far as our sample is concerned. The statistical result shows that size of the
companies is not significantly influenced the overall cost of capital of the companies
while analyzing the cause-effect relationship within industrial group. The regression
coefficient value of size for the companies under the sample industrial group
excluding construction, pharmaceuticals, chemical and diversified signifies that with
the increase of size the companies cost of capital is declining. Where as, in case of
the industry like construction, pharmaceuticals, chemical and diversified group a
positive relationship has been seen between WACC and size of the companies. This
Chapter: 5 Weighted Average Cost of Capital 262
implies that the companies under this sector do not bother about the increasing trend
of WACC.
6.2 Cost of capital and Growth
As far as sample is concerned no significant relationship has been observed
between WACC and growth of the companies since the regression coefficient value
of growth is not statistically significant. Where as under the diversified sector, the
table showed that the correlation coefficient between growth and WACC is -.511,
statistically significant and the beta value between them is -.576, statistically
significant implying, there is negative association between the variables of
diversified companies and one unit of cost of capital (WACC) changes due to change
of .576 unit of growth of companies. On the other hand, the overall costs of capital of
diversified companies are declining because of constant growth of profit of the
companies.
6.3 Cost of capital and Dividend
In the IT and financial service sector, dividend becomes the significant factor
of the cost of capital. In the IT sector the dividend (β = -0.581) is negatively and in
the financial service sectors the dividend (β = .601) is positively related with the cost
of capital. The positive relationship signifies that the investors have no preference for
current dividend in general; rather they prefer future growth of their investment on
Chapter: 5 Weighted Average Cost of Capital 263
shares, where as , the negative coefficient of the payout variable suggests that
investors have preference for current dividend ( Pandey: 1996).
6.4 Cost of capital and Liquidity
The regression coefficient between liquidity and WACC is found to be negative for the
sample companies under the Energy (β=-0.614) and Cement (β=-0.408). The regression
coefficient value of liquidity for both the sectors is statistically significant at 5%
level. This implies that highly liquid companies are procuring the funds by incurring
less amount of cost because of high credit worthiness in the market. On the other
hand less risky companies in terms of liquidity are spending less amount of money
for mobilizing the capital for their survival and growth. It is theoretically true that the
investors generally prefer to invest their funds in less risky companies.
6.5 Cost of Capital and Profitability
The aggregate result suggests that there exists a relationship between WACC
and profitability of the companies. The profitability of the companies (β = -0.490)
has negative impact on overall cost of capital and the relationship is statistically
significant at 5% level. Furthermore, the value of F = 1.334 statistically significant at
5% level implying that the regression equation is also significant. The relationship
shows that as far as sample is concerned with, the increase of profitability of the
companies the overall cost of capital will automatically fall. The similar statistically
significant and negative relationship between the cost of capital and profitability in
Chapter: 5 Weighted Average Cost of Capital 264
case of energy (β = -0.267), electricity (β = -0.669), engineering (β =-0 .443) and
chemical (β = -0.987) respectively has been observed . The negative relationship is
theoretically true because the profitable companies are expected to procure the funds
with cheaper cost.
From the above analysis of the sample encompassing 151 companies
irrespective of industrial groups supports that leverage is negatively related with cost
of capital (WACC) and also statistically significant. Further, most of the sector
except Construction, Electricity, Engineering, Steel, Auto, Personal Care and
Financial Service supports that cost of capital declines with leverage because the beta
coefficient of leverage is statistically significant. The result of this section clearly
indicates that the cost of capital of a firm declines with leverage. Thus, the traditional
view that debt is advantageous because of (i) its low cost compared to other sources
of finance and (ii) its tax benefit arising from the tax deductibility of interest charges
is supported. A relationship is seen in between the cost of capital and size of the
companies. Again, it is found in the entire industrial sector that the correlation
between the cost of capital and growth is not significant. Therefore, there is no
relationship between the cost of capital and the growth of companies. A negative
relation has been seen in between liquidity and cost of capital in the sector like of
energy and cement group of industries. The negative relation implies less risky
companies or companies with relatively higher degree of solvency; the cost of capital
is low. On the other hand positive relationship implies keeping more liquidity by the
Chapter: 5 Weighted Average Cost of Capital 265
firms are facing more cost of capital which is theoretically true. Again, in the sector
of energy, electricity, engineering and chemical; profitability is negatively related
with the cost of capital and statistically significant. This implies that the companies
under these sectors are able to decline the cost of capital by enhancing the
profitability of companies. In the sector of IT and financial service of industries,
dividend becomes the significant factor of the cost of capital.
7. Study of effect of change of Cost of Capital on financial performance of
sample companies (Micro Level Analysis)
To know the effect of change of cost of capital on financial performance of
Sample Company over the years, we calculated correlation coefficient of cost of
Capital with different intervening variable. The correlation matrix results are
exhibited in the following table.
Chapter: 5 Weighted Average Cost of Capital 266
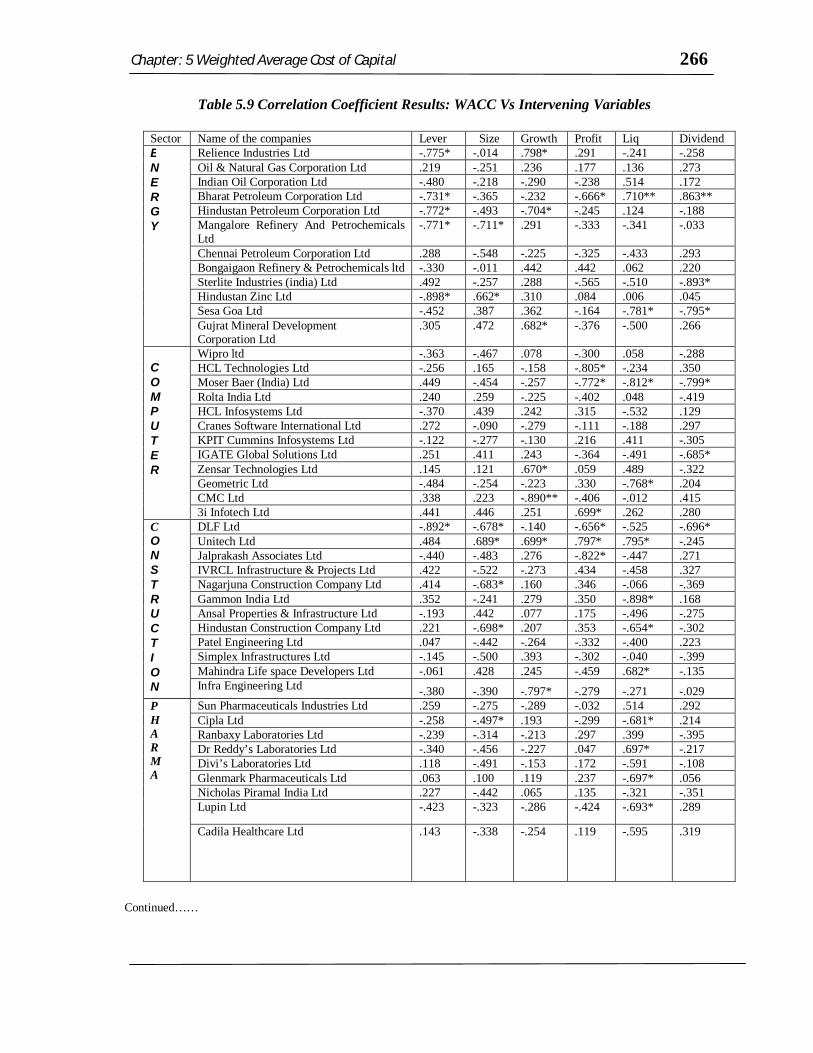
Table 5.9 Correlation Coefficient Results: WACC Vs Intervening Variables
Sector Name of the companies Lever Size Growth Profit Liq Dividend E N E R G Y
Relience Industries Ltd -.775* -.014 .798* .291 -.241 -.258 Oil & Natural Gas Corporation Ltd .219 -.251 .236 .177 .136 .273 Indian Oil Corporation Ltd -.480 -.218 -.290 -.238 .514 .172 Bharat Petroleum Corporation Ltd -.731* -.365 -.232 -.666* .710** .863** Hindustan Petroleum Corporation Ltd -.772* -.493 -.704* -.245 .124 -.188 Mangalore Refinery And Petrochemicals Ltd
-.771* -.711* .291 -.333 -.341 -.033
Chennai Petroleum Corporation Ltd .288 -.548 -.225 -.325 -.433 .293 Bongaigaon Refinery & Petrochemicals ltd -.330 -.011 .442 .442 .062 .220 Sterlite Industries (india) Ltd .492 -.257 .288 -.565 -.510 -.893* Hindustan Zinc Ltd -.898* .662* .310 .084 .006 .045 Sesa Goa Ltd -.452 .387 .362 -.164 -.781* -.795* Gujrat Mineral Development Corporation Ltd
.305 .472 .682* -.376 -.500 .266
C O M P U T E R
Wipro ltd -.363 -.467 .078 -.300 .058 -.288 HCL Technologies Ltd -.256 .165 -.158 -.805* -.234 .350 Moser Baer (India) Ltd .449 -.454 -.257 -.772* -.812* -.799* Rolta India Ltd .240 .259 -.225 -.402 .048 -.419 HCL Infosystems Ltd -.370 .439 .242 .315 -.532 .129 Cranes Software International Ltd .272 -.090 -.279 -.111 -.188 .297 KPIT Cummins Infosystems Ltd -.122 -.277 -.130 .216 .411 -.305 IGATE Global Solutions Ltd .251 .411 .243 -.364 -.491 -.685* Zensar Technologies Ltd .145 .121 .670* .059 .489 -.322 Geometric Ltd -.484 -.254 -.223 .330 -.768* .204 CMC Ltd .338 .223 -.890** -.406 -.012 .415 3i Infotech Ltd .441 .446 .251 .699* .262 .280
C O N S T R U C T I O N
DLF Ltd -.892* -.678* -.140 -.656* -.525 -.696* Unitech Ltd .484 .689* .699* .797* .795* -.245 Jalprakash Associates Ltd -.440 -.483 .276 -.822* -.447 .271 IVRCL Infrastructure & Projects Ltd .422 -.522 -.273 .434 -.458 .327 Nagarjuna Construction Company Ltd .414 -.683* .160 .346 -.066 -.369 Gammon India Ltd .352 -.241 .279 .350 -.898* .168 Ansal Properties & Infrastructure Ltd -.193 .442 .077 .175 -.496 -.275 Hindustan Construction Company Ltd .221 -.698* .207 .353 -.654* -.302 Patel Engineering Ltd .047 -.442 -.264 -.332 -.400 .223 Simplex Infrastructures Ltd -.145 -.500 .393 -.302 -.040 -.399 Mahindra Life space Developers Ltd -.061 .428 .245 -.459 .682* -.135 Infra Engineering Ltd -.380 -.390 -.797* -.279 -.271 -.029
P H A R M A
Sun Pharmaceuticals Industries Ltd .259 -.275 -.289 -.032 .514 .292 Cipla Ltd -.258 -.497* .193 -.299 -.681* .214 Ranbaxy Laboratories Ltd -.239 -.314 -.213 .297 .399 -.395 Dr Reddy’s Laboratories Ltd -.340 -.456 -.227 .047 .697* -.217 Divi’s Laboratories Ltd .118 -.491 -.153 .172 -.591 -.108 Glenmark Pharmaceuticals Ltd .063 .100 .119 .237 -.697* .056 Nicholas Piramal India Ltd .227 -.442 .065 .135 -.321 -.351 Lupin Ltd -.423 -.323 -.286 -.424 -.693* .289
Cadila Healthcare Ltd .143 -.338 -.254 .119 -.595 .319
Continued……
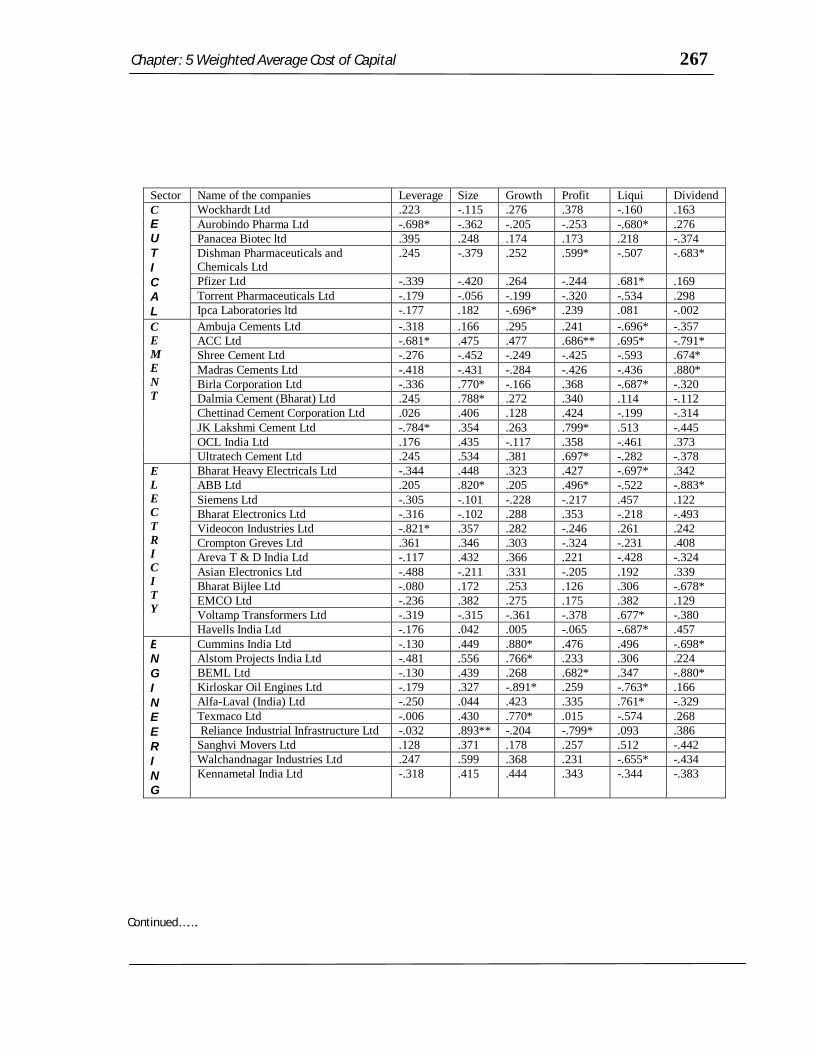
Chapter: 5 Weighted Average Cost of Capital 267
Sector Name of the companies Leverage Size Growth Profit Liqui Dividend C E U T I C A L
Wockhardt Ltd .223 -.115 .276 .378 -.160 .163 Aurobindo Pharma Ltd -.698* -.362 -.205 -.253 -.680* .276 Panacea Biotec ltd .395 .248 .174 .173 .218 -.374 Dishman Pharmaceuticals and Chemicals Ltd
.245 -.379 .252 .599* -.507 -.683*
Pfizer Ltd -.339 -.420 .264 -.244 .681* .169 Torrent Pharmaceuticals Ltd -.179 -.056 -.199 -.320 -.534 .298 Ipca Laboratories ltd -.177 .182 -.696* .239 .081 -.002
C E M E N T
Ambuja Cements Ltd -.318 .166 .295 .241 -.696* -.357 ACC Ltd -.681* .475 .477 .686** .695* -.791* Shree Cement Ltd -.276 -.452 -.249 -.425 -.593 .674* Madras Cements Ltd -.418 -.431 -.284 -.426 -.436 .880* Birla Corporation Ltd -.336 .770* -.166 .368 -.687* -.320 Dalmia Cement (Bharat) Ltd .245 .788* .272 .340 .114 -.112 Chettinad Cement Corporation Ltd .026 .406 .128 .424 -.199 -.314 JK Lakshmi Cement Ltd -.784* .354 .263 .799* .513 -.445 OCL India Ltd .176 .435 -.117 .358 -.461 .373 Ultratech Cement Ltd .245 .534 .381 .697* -.282 -.378
E L E C T R I C I T Y
Bharat Heavy Electricals Ltd -.344 .448 .323 .427 -.697* .342 ABB Ltd .205 .820* .205 .496* -.522 -.883* Siemens Ltd -.305 -.101 -.228 -.217 .457 .122 Bharat Electronics Ltd -.316 -.102 .288 .353 -.218 -.493 Videocon Industries Ltd -.821* .357 .282 -.246 .261 .242 Crompton Greves Ltd .361 .346 .303 -.324 -.231 .408 Areva T & D India Ltd -.117 .432 .366 .221 -.428 -.324 Asian Electronics Ltd -.488 -.211 .331 -.205 .192 .339 Bharat Bijlee Ltd -.080 .172 .253 .126 .306 -.678* EMCO Ltd -.236 .382 .275 .175 .382 .129 Voltamp Transformers Ltd -.319 -.315 -.361 -.378 .677* -.380 Havells India Ltd -.176 .042 .005 -.065 -.687* .457
E N G I N E E R I N G
Cummins India Ltd -.130 .449 .880* .476 .496 -.698* Alstom Projects India Ltd -.481 .556 .766* .233 .306 .224 BEML Ltd -.130 .439 .268 .682* .347 -.880* Kirloskar Oil Engines Ltd -.179 .327 -.891* .259 -.763* .166 Alfa-Laval (India) Ltd -.250 .044 .423 .335 .761* -.329 Texmaco Ltd -.006 .430 .770* .015 -.574 .268 Reliance Industrial Infrastructure Ltd -.032 .893** -.204 -.799* .093 .386 Sanghvi Movers Ltd .128 .371 .178 .257 .512 -.442 Walchandnagar Industries Ltd .247 .599 .368 .231 -.655* -.434 Kennametal India Ltd -.318 .415 .444 .343 -.344 -.383
Continued…….
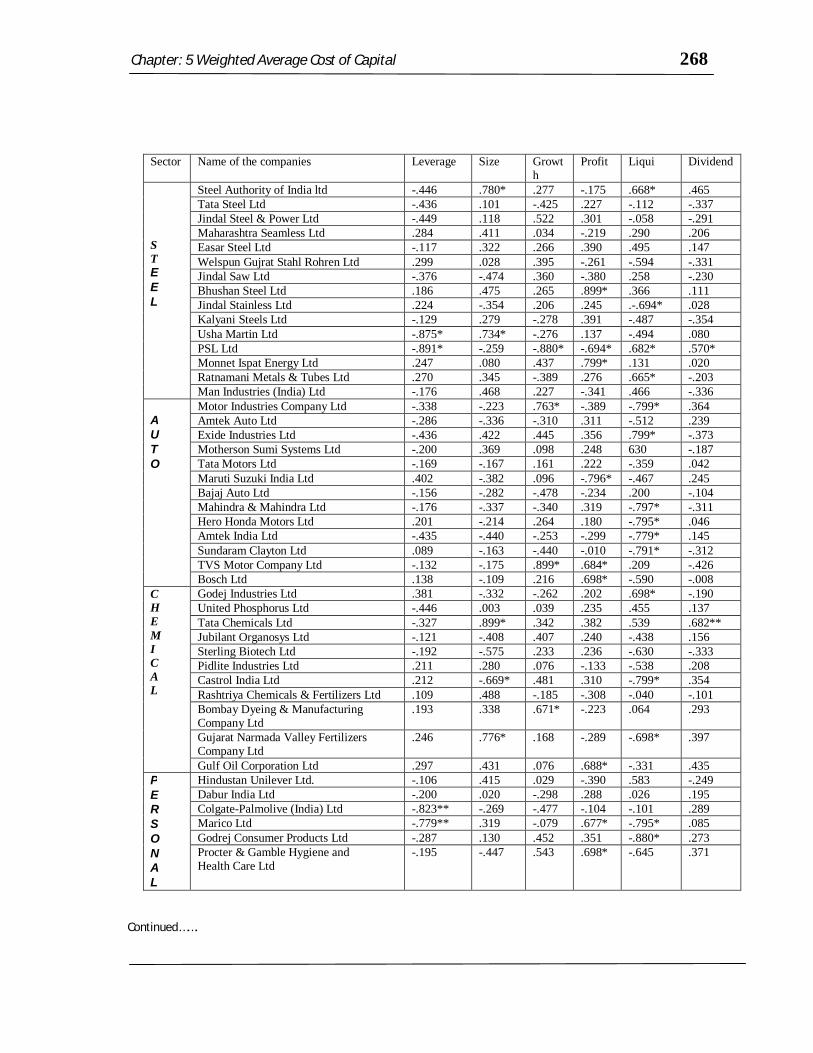
Chapter: 5 Weighted Average Cost of Capital 268
Sector Name of the companies Leverage Size Growth
Profit Liqui Dividend
S T E E L
Steel Authority of India ltd -.446 .780* .277 -.175 .668* .465 Tata Steel Ltd -.436 .101 -.425 .227 -.112 -.337 Jindal Steel & Power Ltd -.449 .118 .522 .301 -.058 -.291 Maharashtra Seamless Ltd .284 .411 .034 -.219 .290 .206 Easar Steel Ltd -.117 .322 .266 .390 .495 .147 Welspun Gujrat Stahl Rohren Ltd .299 .028 .395 -.261 -.594 -.331 Jindal Saw Ltd -.376 -.474 .360 -.380 .258 -.230 Bhushan Steel Ltd .186 .475 .265 .899* .366 .111 Jindal Stainless Ltd .224 -.354 .206 .245 .-.694* .028 Kalyani Steels Ltd -.129 .279 -.278 .391 -.487 -.354 Usha Martin Ltd -.875* .734* -.276 .137 -.494 .080 PSL Ltd -.891* -.259 -.880* -.694* .682* .570* Monnet Ispat Energy Ltd .247 .080 .437 .799* .131 .020 Ratnamani Metals & Tubes Ltd .270 .345 -.389 .276 .665* -.203 Man Industries (India) Ltd -.176 .468 .227 -.341 .466 -.336
A U T O
Motor Industries Company Ltd -.338 -.223 .763* -.389 -.799* .364 Amtek Auto Ltd -.286 -.336 -.310 .311 -.512 .239 Exide Industries Ltd -.436 .422 .445 .356 .799* -.373 Motherson Sumi Systems Ltd -.200 .369 .098 .248 630 -.187 Tata Motors Ltd -.169 -.167 .161 .222 -.359 .042 Maruti Suzuki India Ltd .402 -.382 .096 -.796* -.467 .245 Bajaj Auto Ltd -.156 -.282 -.478 -.234 .200 -.104 Mahindra & Mahindra Ltd -.176 -.337 -.340 .319 -.797* -.311 Hero Honda Motors Ltd .201 -.214 .264 .180 -.795* .046 Amtek India Ltd -.435 -.440 -.253 -.299 -.779* .145 Sundaram Clayton Ltd .089 -.163 -.440 -.010 -.791* -.312 TVS Motor Company Ltd -.132 -.175 .899* .684* .209 -.426 Bosch Ltd .138 -.109 .216 .698* -.590 -.008
C H E M I C A L
Godej Industries Ltd .381 -.332 -.262 .202 .698* -.190 United Phosphorus Ltd -.446 .003 .039 .235 .455 .137 Tata Chemicals Ltd -.327 .899* .342 .382 .539 .682** Jubilant Organosys Ltd -.121 -.408 .407 .240 -.438 .156 Sterling Biotech Ltd -.192 -.575 .233 .236 -.630 -.333 Pidlite Industries Ltd .211 .280 .076 -.133 -.538 .208 Castrol India Ltd .212 -.669* .481 .310 -.799* .354 Rashtriya Chemicals & Fertilizers Ltd .109 .488 -.185 -.308 -.040 -.101 Bombay Dyeing & Manufacturing Company Ltd
.193 .338 .671* -.223 .064 .293
Gujarat Narmada Valley Fertilizers Company Ltd
.246 .776* .168 -.289 -.698* .397
Gulf Oil Corporation Ltd .297 .431 .076 .688* -.331 .435 P E R S O N A L
Hindustan Unilever Ltd. -.106 .415 .029 -.390 .583 -.249 Dabur India Ltd -.200 .020 -.298 .288 .026 .195 Colgate-Palmolive (India) Ltd -.823** -.269 -.477 -.104 -.101 .289 Marico Ltd -.779** .319 -.079 .677* -.795* .085 Godrej Consumer Products Ltd -.287 .130 .452 .351 -.880* .273 Procter & Gamble Hygiene and Health Care Ltd
-.195 -.447 .543 .698* -.645 .371
Continued…….
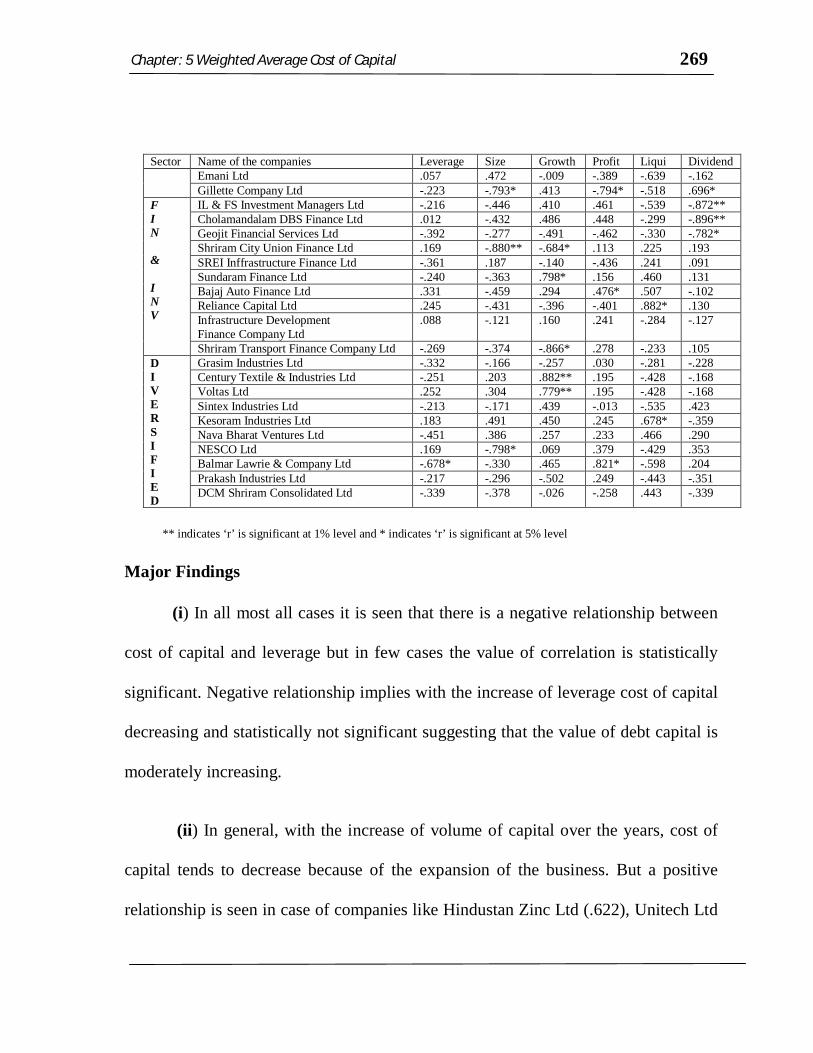
Chapter: 5 Weighted Average Cost of Capital 269
Sector Name of the companies Leverage Size Growth Profit Liqui Dividend Emani Ltd .057 .472 -.009 -.389 -.639 -.162
Gillette Company Ltd -.223 -.793* .413 -.794* -.518 .696* F I N & I N V
IL & FS Investment Managers Ltd -.216 -.446 .410 .461 -.539 -.872** Cholamandalam DBS Finance Ltd .012 -.432 .486 .448 -.299 -.896** Geojit Financial Services Ltd -.392 -.277 -.491 -.462 -.330 -.782* Shriram City Union Finance Ltd .169 -.880** -.684* .113 .225 .193 SREI Inffrastructure Finance Ltd -.361 .187 -.140 -.436 .241 .091 Sundaram Finance Ltd -.240 -.363 .798* .156 .460 .131 Bajaj Auto Finance Ltd .331 -.459 .294 .476* .507 -.102 Reliance Capital Ltd .245 -.431 -.396 -.401 .882* .130 Infrastructure Development Finance Company Ltd
.088 -.121 .160 .241 -.284 -.127
Shriram Transport Finance Company Ltd -.269 -.374 -.866* .278 -.233 .105 D I V E R S I F I E D
Grasim Industries Ltd -.332 -.166 -.257 .030 -.281 -.228 Century Textile & Industries Ltd -.251 .203 .882** .195 -.428 -.168 Voltas Ltd .252 .304 .779** .195 -.428 -.168 Sintex Industries Ltd -.213 -.171 .439 -.013 -.535 .423 Kesoram Industries Ltd .183 .491 .450 .245 .678* -.359 Nava Bharat Ventures Ltd -.451 .386 .257 .233 .466 .290 NESCO Ltd .169 -.798* .069 .379 -.429 .353 Balmar Lawrie & Company Ltd -.678* -.330 .465 .821* -.598 .204 Prakash Industries Ltd -.217 -.296 -.502 .249 -.443 -.351 DCM Shriram Consolidated Ltd -.339 -.378 -.026 -.258 .443 -.339
** indicates ‘r’ is significant at 1% level and * indicates ‘r’ is significant at 5% level
Major Findings
(i) In all most all cases it is seen that there is a negative relationship between
cost of capital and leverage but in few cases the value of correlation is statistically
significant. Negative relationship implies with the increase of leverage cost of capital
decreasing and statistically not significant suggesting that the value of debt capital is
moderately increasing.
(ii) In general, with the increase of volume of capital over the years, cost of
capital tends to decrease because of the expansion of the business. But a positive
relationship is seen in case of companies like Hindustan Zinc Ltd (.622), Unitech Ltd
Chapter: 5 Weighted Average Cost of Capital 270
(.689), Birla Corporation Ltd (.788), ABB Ltd (.820), Reliance Industrial
Infrastructure Ltd (.893), Steel Authority of India Ltd (.780), Usha Martin Ltd (.734),
Tata Chemicals Ltd (.899), Gujrat Narmada Valley Fertilizers Company Ltd (.766)
which signifies that with the increase volume of capital over the years the companies’
cost of capital also increasing. The reason of positive correlation is attributed to
companies’ inability to mobilize the funds from proper sources leading to minimizing
the cost of capital.
(iii) A significant negative relationship between growths of profit and cost of
capital is seen in the case of companies like Ipca Laboratories Ltd (-.696), Kirloskar
Oil Engines Ltd (-.891), PSL Ltd (-.880), Shriram City Union Finance Ltd (-.684),
Sriram Transport Company Ltd (-.866). The negative relationship is established that
growth of the profit is significant factor for minimizing the cost of capital of the
companies. On the other hand a significant positive relationship is observed in case
of the companies like Cummins India Ltd (.880), Alstom Projects India Ltd (.766),
Texmaco Ltd (.770), Motor Industries Company Ltd (.763), TVS Motor Company
Ltd (.899), Bombay Dying and Manufacturing Ltd (.671), Sundaram Finance Ltd
(.798), Century Textile and Industries Ltd (.882), Voltas Ltd (.779). This implies that
although over the years the growth of profit was increasing but companies are unable
to take the advantage of the factors related to the positive growth rate in mobilizing
the fund from the market. This signifies that particularly for these companies; the
growth factor is not influencing to reduce the cost of capital.
Chapter: 5 Weighted Average Cost of Capital 271
(iv) Statistically significant and positive correlation between cost of capital
and Profitability is found in case of sample companies; 3i Infotech Ltd (.699),
Unitech Ltd (.797), Dishman Pharmaceuticals and Chemicals Ltd (.599), ACC Ltd
(.686), JK Laxhmi Cement Ltd (.799), Ultra (.697), ABB Ltd (.496), BEML Ltd
(.682), Bajaj Auto Finance Ltd (.476), Balmer Lawrie & Company Ltd (.682),
Bhushan Steel Ltd (,899), Monnet Ispat Energy Ltd (.799), TVS Motor Company Ltd
(.684), Bosch Ltd (.689), Gulf Oil Corporation Ltd (.688), Marico Ltd (.677), Procter
and Gamble Hygine & Health Care Ltd ( .698). It implies either with the increase of
cost of capital, companies’ profitability is increasing or with the decrease of cost of
capital over the years profitability is decreasing. In case of increase of cost of capital
with the growth of profitability, the companies are not in a position to take due
advantages of profitability at the time of raising the capital from different source of
finance. Where as, decrease of cost of capital with the fall of profitability implies that
companies’ effort towards minimizing the cost of capital does not help to improve
the pace of profitability. In other words, there are other qualitative and quantitative
factors besides cost of capital for strengthening the profitability position of the
companies.
On the other hand, significant negative relationship between the profitability
and cost of capital observed in case of Bharat petroleum Corporation Ltd (-.666),
HCL Technologies Ltd (-.805), Moser Baer (India) Ltd (-.772), DLF Ltd (-.656),
Jaiprakash Associates Ltd (-.822), Reliance Industrial Infrastructure Ltd (-.7990, PSL
Chapter: 5 Weighted Average Cost of Capital 272
Ltd (-.694), Maruti Suzuki India Ltd (-.796), Gillette Company Ltd (-.794). Negative
relationship suggests that increase in cost of capital is associated with the decrease of
profitability or vice-versa signifying that either because of increasing cost of capital,
profitability of the companies decreasing or decrease of cost of capital improves the
profitability position of the company.
(v) A positive and statistically significant relationship between liquidity and
cost of capital is seen in case of Bharat Petroleum Corporation Ltd (.710), Unitech
Ltd (.795), Mahindra Life Space Developers Ltd (.682), Dr. Reddy’s Laboratories
Ltd (.697), Pfizer Ltd (.681), ACC Ltd (.695), Voltamp Transformers Ltd (.677),
Alfa-Labal (India) Ltd (.761), Steel Authority of India Ltd (.688), PSL Ltd (.682),
Ratanmani Metals and Tubes Ltd (.665), Exide Industries Ltd (.799), Godrej
Industries Ltd (.698), Reliance Capital Ltd (.882), Kesoram Industries Ltd (.678).
This implies either with the increase of liquidity, cost of capital is increasing or with
the decrease of liquidity cost of capital is decreasing. In other words, higher degree of
solvency affects in increasing in cost of capital. The reverse case was noticed in case
of company like Sesa Goa Ltd (-.781), Moser Baer (India) Ltd (-.812), Geometric Ltd
(-.768), Gammon India Ltd (-.898), Hindustan Construction Company Ltd (-.654),
Cipla Ltd (-.681), Glenmark Pharmaceuticals Ltd (.697), Lupin Ltd (-.693),
Aurobindo Pharma Ltd (-.680), Amulya Cements Ltd (-.696), Birla Corporation Ltd
(-.687), Bharat Heavy Electrical Ltd (-.697), Havells India Ltd (-.687), Kirloskar Oil
Engine Ltd (-.763), Walchandnagar Industries Ltd (-.655), Jindal Stainless Ltd (-
Chapter: 5 Weighted Average Cost of Capital 273
.694), Motor Industries Company Ltd (-.799), Mahindra & Mahindra Ltd (-.797),
Hero Honda Motors Ltd (-.795), Amtek India Ltd (-.779), Sundaram Clayton Ltd (-
.791), Castrol India Ltd (-.799), Gujrat Narmada Valley Fertilizers Company Ltd (-
.698), Marico Ltd (-.795), Godrej Consumers product Ltd (-.880). Higher degree of
liquidity means companies are less risky from the point of view of investors and such
solvency enables the company to raise capital from the market at cheaper cost.
(vi) Dividend payout is significantly and positively related with the cost of
capital and the relationship seen in case of Bharat Petroleum Corporation Ltd (.863),
Shree Cements Ltd (.674), Madras Cement Ltd (.880), PSL Ltd (.570), Tata
Chemicals Ltd (.682), Gillete Company Ltd (.696).On the other hand, a negative
relationship observed in the companies like Sterlite Industries (India) Ltd (-.893),
Sesa Goa Ltd (-.795), Moser Baer (India) Ltd (-.799), Igate Global Solutions Ltd (-
.685), BLF Ltd (-.696), Dishman Pharmaceuticals Chemical Ltd (-.683), ACC Ltd (-
.791), ABB Ltd (-.883), Bharat Bijlee Ltd (-.678), Cummins India Ltd (-.698), BEML
Ltd (-.880), IL (-872), Cholamandalam DBS Finance Ltd (-.896), Geojit Financial
Services Ltd (-.782). Thus, dividend pay out has no significant impact on the cost of
capital.
8. Testing of M.M Hypothesis: Change of capital structure does not affect the
overall cost of capital of the firm
Chapter: 5 Weighted Average Cost of Capital 274
We finally attempted to test the MM hypothesis specially related to
relationship between cost of capital and capital structure in the following paragraph.
8.1 Leverage and cost of capital
Traditional approach of capital structure theory contradicts Modigiallani and
Miller approach in context of the relationship between the degree of leverage and
cost of capital. Traditionalist assumes a negative relationship exists between these
variables. However, the cost of capital would increase after a reasonable level of
debt. On the other hand, Modigiallani and Miller’s proposition-1 concluded no
relationship between leverage and cost of capital. In their approach, the capital
structure decision is irrelevant. In their proposition-2, they argued that capital
structure has impact on cost of capital because of tax deductibility of interest charges
on issuing debt capital. In this respect, we used multiple regressions model where
overall cost of capital or WACC (ko) is taken as dependent variable and size, growth,
liquidity, profitability, dividend, and leverage are considered as independent variable.
The following equation has been fitted.
K o = a+ b1 size+ b2 leverage+ b3 liquidity+ b4 growth+ b5 dividend+ b6 profitability + Ui
Where,
a= Constant,
bi= regression coefficient (i=1……6)
Ui= error
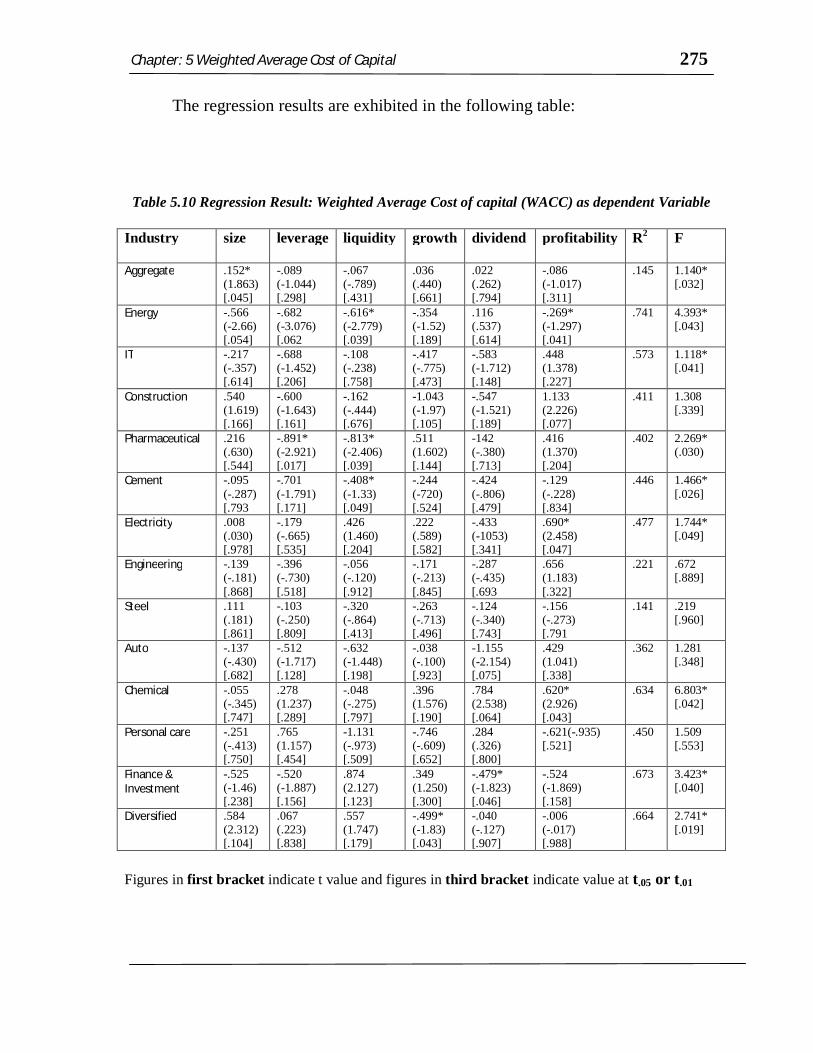
Chapter: 5 Weighted Average Cost of Capital 275
The regression results are exhibited in the following table:
Table 5.10 Regression Result: Weighted Average Cost of capital (WACC) as dependent Variable
Industry size leverage liquidity growth dividend profitability R2 F
Aggregate .152* (1.863) [.045]
-.089 (-1.044) [.298]
-.067 (-.789) [.431]
.036 (.440) [.661]
.022 (.262) [.794]
-.086 (-1.017) [.311]
.145 1.140* [.032]
Energy -.566 (-2.66) [.054]
-.682 (-3.076) [.062
-.616* (-2.779) [.039]
-.354 (-1.52) [.189]
.116 (.537) [.614]
-.269* (-1.297) [.041]
.741 4.393* [.043]
IT -.217 (-.357) [.614]
-.688 (-1.452) [.206]
-.108 (-.238) [.758]
-.417 (-.775) [.473]
-.583 (-1.712) [.148]
.448 (1.378) [.227]
.573 1.118* [.041]
Construction .540 (1.619) [.166]
-.600 (-1.643) [.161]
-.162 (-.444) [.676]
-1.043 (-1.97) [.105]
-.547 (-1.521) [.189]
1.133 (2.226) [.077]
.411 1.308 [.339]
Pharmaceutical .216 (.630) [.544]
-.891* (-2.921) [.017]
-.813* (-2.406) [.039]
.511 (1.602) [.144]
-142 (-.380) [.713]
.416 (1.370) [.204]
.402 2.269* (.030)
Cement -.095 (-.287) [.793
-.701 (-1.791) [.171]
-.408* (-1.33) [.049]
-.244 (-720) [.524]
-.424 (-.806) [.479]
-.129 (-.228) [.834]
.446 1.466* [.026]
Electricity .008 (.030) [.978]
-.179 (-.665) [.535]
.426 (1.460) [.204]
.222 (.589) [.582]
-.433 (-1053) [.341]
.690* (2.458) [.047]
.477 1.744* [.049]
Engineering -.139 (-.181) [.868]
-.396 (-.730) [.518]
-.056 (-.120) [.912]
-.171 (-.213) [.845]
-.287 (-.435) [.693
.656 (1.183) [.322]
.221 .672 [.889]
Steel .111 (.181) [.861]
-.103 (-.250) [.809]
-.320 (-.864) [.413]
-.263 (-.713) [.496]
-.124 (-.340) [.743]
-.156 (-.273) [.791
.141 .219 [.960]
Auto -.137 (-.430) [.682]
-.512 (-1.717) [.128]
-.632 (-1.448) [.198]
-.038 (-.100) [.923]
-1.155 (-2.154) [.075]
.429 (1.041) [.338]
.362 1.281 [.348]
Chemical -.055 (-.345) [.747]
.278 (1.237) [.289]
-.048 (-.275) [.797]
.396 (1.576) [.190]
.784 (2.538) [.064]
.620* (2.926) [.043]
.634 6.803* [.042]
Personal care -.251 (-.413) [.750]
.765 (1.157) [.454]
-1.131 (-.973) [.509]
-.746 (-.609) [.652]
.284 (.326) [.800]
-.621(-.935) [.521]
.450 1.509 [.553]
Finance & Investment
-.525 (-1.46) [.238]
-.520 (-1.887) [.156]
.874 (2.127) [.123]
.349 (1.250) [.300]
-.479* (-1.823) [.046]
-.524 (-1.869) [.158]
.673 3.423* [.040]
Diversified .584 (2.312) [.104]
.067 (.223) [.838]
.557 (1.747) [.179]
-.499* (-1.83) [.043]
-.040 (-.127) [.907]
-.006 (-.017) [.988]
.664 2.741* [.019]
Figures in first bracket indicate t value and figures in third bracket indicate value at t.05 or t.01
Chapter: 5 Weighted Average Cost of Capital 276
It is evident from the table that in few cases cost of capital is linearly related
with companies’ performance and also in some cases there exist a significant linear
relationship between cost of capital and leverage. Further the regression coefficient
of leverage variables is both negative and positive implies that volume of debt capital
in the capital structure affects the cost of capital of the company. However such
coefficient is not statistically significant. This indicates that the leverage may not be
regarded as an important variable that affect the cost of capital for Indian firms. The
findings contradict the traditional approach of the capital structure theories.
Further, the regression coefficients of explanatory variables representing the
performance of the company (growth of dividend pay out, liquidity, profitability etc.)
are found to be statistically significant in some cases. This implies that we can not
refuse that no relationship exists in between cost of capital and companies
performance. But there relationship varies from industry to industry as the nature of
industries is not similar.
8.2 Corporate Tax, Cost of Capital and leverage
Modigiallani and Miller argued that the use of leverage could increase the
value of the firm or lower the cost of capital, due to tax deductibility of interest
charges. The purpose of this section is to test the hypothesis that the cost of capital
declines with leverage because of tax deductibility of interest charges. Therefore the
annual tax-adjusted yield of the corporations is determined and used as dependent
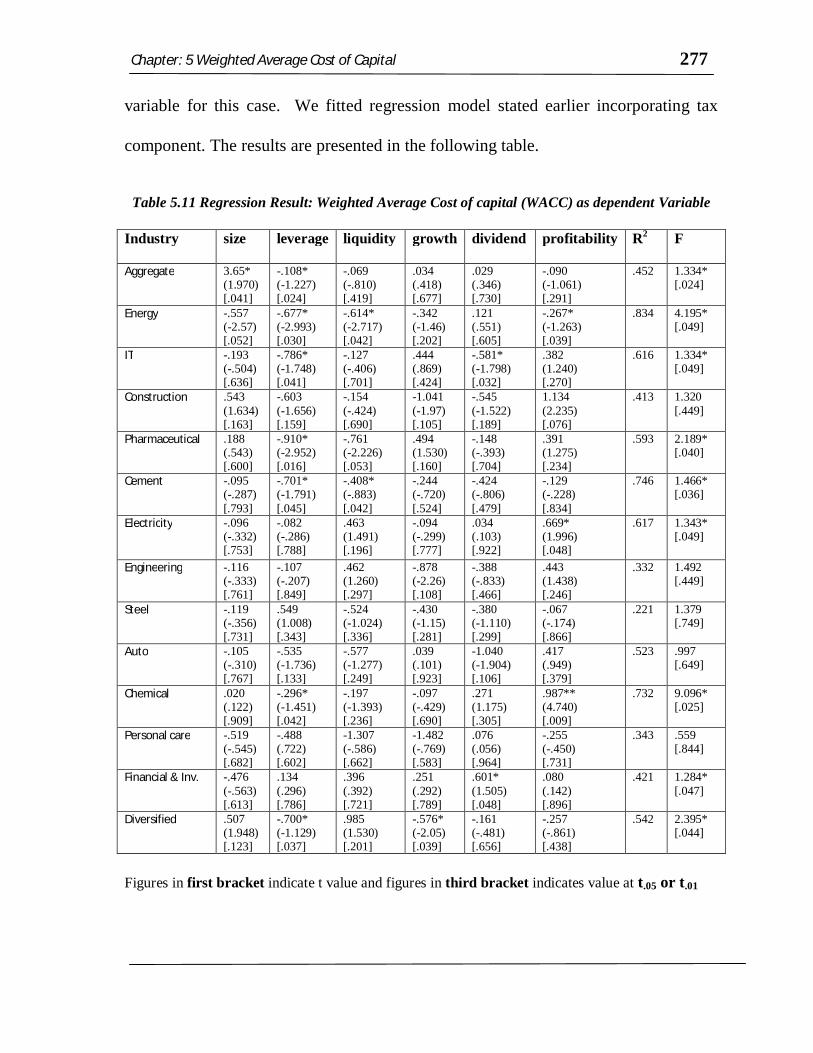
Chapter: 5 Weighted Average Cost of Capital 277
variable for this case. We fitted regression model stated earlier incorporating tax
component. The results are presented in the following table.
Table 5.11 Regression Result: Weighted Average Cost of capital (WACC) as dependent Variable
Industry size leverage liquidity growth dividend profitability R2 F
Aggregate 3.65* (1.970) [.041]
-.108* (-1.227) [.024]
-.069 (-.810) [.419]
.034 (.418) [.677]
.029 (.346) [.730]
-.090 (-1.061) [.291]
.452 1.334* [.024]
Energy -.557 (-2.57) [.052]
-.677* (-2.993) [.030]
-.614* (-2.717) [.042]
-.342 (-1.46) [.202]
.121 (.551) [.605]
-.267* (-1.263) [.039]
.834 4.195* [.049]
IT -.193 (-.504) [.636]
-.786* (-1.748) [.041]
-.127 (-.406) [.701]
.444 (.869) [.424]
-.581* (-1.798) [.032]
.382 (1.240) [.270]
.616 1.334* [.049]
Construction .543 (1.634) [.163]
-.603 (-1.656) [.159]
-.154 (-.424) [.690]
-1.041 (-1.97) [.105]
-.545 (-1.522) [.189]
1.134 (2.235) [.076]
.413 1.320 [.449]
Pharmaceutical .188 (.543) [.600]
-.910* (-2.952) [.016]
-.761 (-2.226) [.053]
.494 (1.530) [.160]
-.148 (-.393) [.704]
.391 (1.275) [.234]
.593 2.189* [.040]
Cement -.095 (-.287) [.793]
-.701* (-1.791) [.045]
-.408* (-.883) [.042]
-.244 (-.720) [.524]
-.424 (-.806) [.479]
-.129 (-.228) [.834]
.746 1.466* [.036]
Electricity
-.096 (-.332) [.753]
-.082 (-.286) [.788]
.463 (1.491) [.196]
-.094 (-.299) [.777]
.034 (.103) [.922]
.669* (1.996) [.048]
.617 1.343* [.049]
Engineering -.116 (-.333) [.761]
-.107 (-.207) [.849]
.462 (1.260) [.297]
-.878 (-2.26) [.108]
-.388 (-.833) [.466]
.443 (1.438) [.246]
.332 1.492 [.449]
Steel -.119 (-.356) [.731]
.549 (1.008) [.343]
-.524 (-1.024) [.336]
-.430 (-1.15) [.281]
-.380 (-1.110) [.299]
-.067 (-.174) [.866]
.221 1.379 [.749]
Auto -.105 (-.310) [.767]
-.535 (-1.736) [.133]
-.577 (-1.277) [.249]
.039 (.101) [.923]
-1.040 (-1.904) [.106]
.417 (.949) [.379]
.523 .997 [.649]
Chemical .020 (.122) [.909]
-.296* (-1.451) [.042]
-.197 (-1.393) [.236]
-.097 (-.429) [.690]
.271 (1.175) [.305]
.987** (4.740) [.009]
.732 9.096* [.025]
Personal care -.519 (-.545) [.682]
-.488 (.722) [.602]
-1.307 (-.586) [.662]
-1.482 (-.769) [.583]
.076 (.056) [.964]
-.255 (-.450) [.731]
.343 .559 [.844]
Financial & Inv. -.476 (-.563) [.613]
.134 (.296) [.786]
.396 (.392) [.721]
.251 (.292) [.789]
.601* (1.505) [.048]
.080 (.142) [.896]
.421 1.284* [.047]
Diversified .507 (1.948) [.123]
-.700* (-1.129) [.037]
.985 (1.530) [.201]
-.576* (-2.05) [.039]
-.161 (-.481) [.656]
-.257 (-.861) [.438]
.542 2.395* [.044]
Figures in first bracket indicate t value and figures in third bracket indicates value at t.05 or t.01
Chapter: 5 Weighted Average Cost of Capital 278
It is seen that, after adjusting tax with the cost of debt capital, leverage
becomes the major factor or influential factor of the cost of capital. In all the cases, it
has been seen that leverage is negatively related to the cost of capital and turned to be
statistically significant at 5% level. It implies that the cost of capital declines with the
increase of debt capital in the capital structure. Moreover, the value of R2=0.452,
suggests that the leverage is not only the influential factor of the cost of capital but
also largely affects the variation of the cost of capital. Construction, Electricity,
Engineering, Steel, Auto, Personal Care and Financial sector in the sample exhibits
that leverage is negatively related to cost of capital but not statistically significant.
The result of this section clearly indicates that after allowing tax effect, the cost of
capital of a firm declines with leverage. This is as par with the traditional view that
debt is advantageous because of (i) its low cost compared to other sources of finance
and (ii) its tax benefit arising from the tax deductibility of interest charges.
8.3 Cost of Common Equity and Leverage
The purpose of this section is to determine the empirical relation between
leverage and the cost of equity and also to see whether any relationship exist in
between cost of equity capital and other explanatory variables considered for
determining the companies performance. In this connection, the traditional view is
that the cost of equity either remains constant or rises slightly with moderate level of
debt and afterwards increases with leverage at an increasing rate. On the other hand,
MM proposition is that the cost of equity increases linearly with leverage. Thus, both
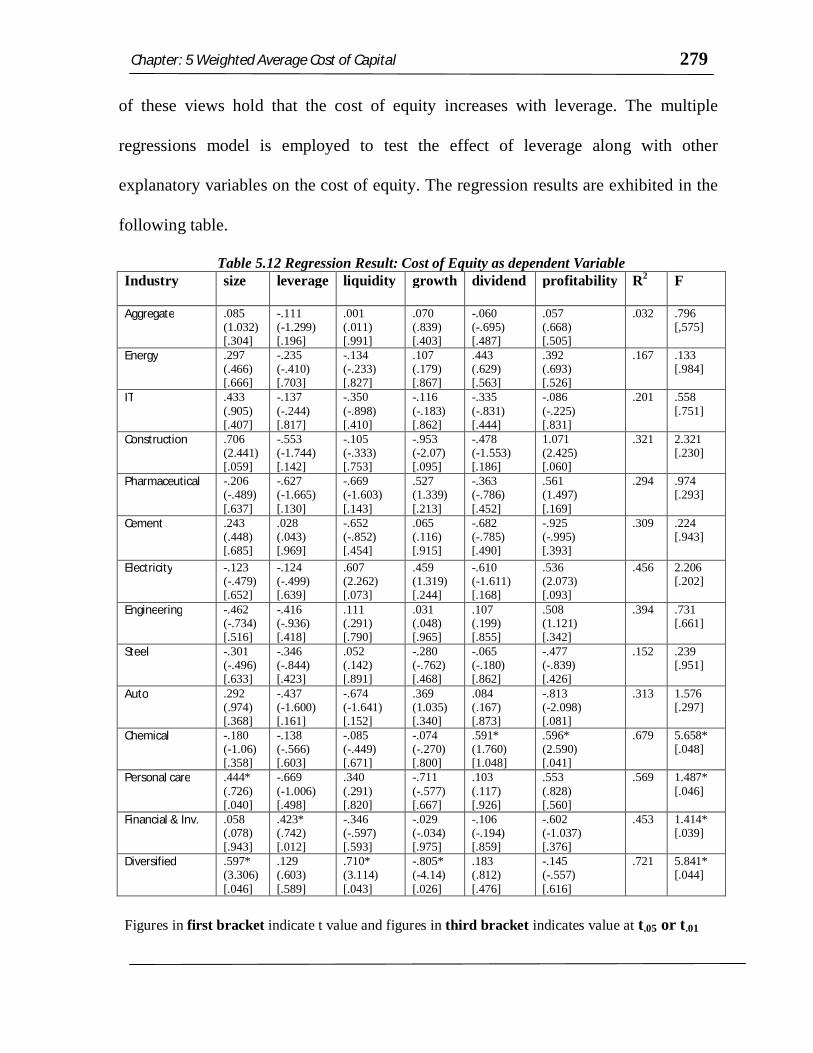
Chapter: 5 Weighted Average Cost of Capital 279
of these views hold that the cost of equity increases with leverage. The multiple
regressions model is employed to test the effect of leverage along with other
explanatory variables on the cost of equity. The regression results are exhibited in the
following table.
Table 5.12 Regression Result: Cost of Equity as dependent Variable Industry size leverage liquidity growth dividend profitability R2 F
Aggregate .085 (1.032) [.304]
-.111 (-1.299) [.196]
.001 (.011) [.991]
.070 (.839) [.403]
-.060 (-.695) [.487]
.057 (.668) [.505]
.032 .796 [,575]
Energy .297 (.466) [.666]
-.235 (-.410) [.703]
-.134 (-.233) [.827]
.107 (.179) [.867]
.443 (.629) [.563]
.392 (.693) [.526]
.167 .133 [.984]
IT .433 (.905) [.407]
-.137 (-.244) [.817]
-.350 (-.898) [.410]
-.116 (-.183) [.862]
-.335 (-.831) [.444]
-.086 (-.225) [.831]
.201 .558 [.751]
Construction .706 (2.441) [.059]
-.553 (-1.744) [.142]
-.105 (-.333) [.753]
-.953 (-2.07) [.095]
-.478 (-1.553) [.186]
1.071 (2.425) [.060]
.321 2.321 [.230]
Pharmaceutical -.206 (-.489) [.637]
-.627 (-1.665) [.130]
-.669 (-1.603) [.143]
.527 (1.339) [.213]
-.363 (-.786) [.452]
.561 (1.497) [.169]
.294 .974 [.293]
Cement
.243 (.448) [.685]
.028 (.043) [.969]
-.652 (-.852) [.454]
.065 (.116) [.915]
-.682 (-.785) [.490]
-.925 (-.995) [.393]
.309 .224 [.943]
Electricity -.123 (-.479) [.652]
-.124 (-.499) [.639]
.607 (2.262) [.073]
.459 (1.319) [.244]
-.610 (-1.611) [.168]
.536 (2.073) [.093]
.456 2.206 [.202]
Engineering -.462 (-.734) [.516]
-.416 (-.936) [.418]
.111 (.291) [.790]
.031 (.048) [.965]
.107 (.199) [.855]
.508 (1.121) [.342]
.394 .731 [.661]
Steel -.301 (-.496) [.633]
-.346 (-.844) [.423]
.052 (.142) [.891]
-.280 (-.762) [.468]
-.065 (-.180) [.862]
-.477 (-.839) [.426]
.152 .239 [.951]
Auto .292 (.974) [.368]
-.437 (-1.600) [.161]
-.674 (-1.641) [.152]
.369 (1.035) [.340]
.084 (.167) [.873]
-.813 (-2.098) [.081]
.313 1.576 [.297]
Chemical -.180 (-1.06) [.358]
-.138 (-.566) [.603]
-.085 (-.449) [.671]
-.074 (-.270) [.800]
.591* (1.760) [1.048]
.596* (2.590) [.041]
.679 5.658* [.048]
Personal care .444* (.726) [.040]
-.669 (-1.006) [.498]
.340 (.291) [.820]
-.711 (-.577) [.667]
.103 (.117) [.926]
.553 (.828) [.560]
.569 1.487* [.046]
Financial & Inv. .058 (.078) [.943]
.423* (.742) [.012]
-.346 (-.597) [.593]
-.029 (-.034) [.975]
-.106 (-.194) [.859]
-.602 (-1.037) [.376]
.453 1.414* [.039]
Diversified .597* (3.306) [.046]
.129 (.603) [.589]
.710* (3.114) [.043]
-.805* (-4.14) [.026]
.183 (.812) [.476]
-.145 (-.557) [.616]
.721 5.841* [.044]
Figures in first bracket indicate t value and figures in third bracket indicates value at t.05 or t.01
Chapter: 5 Weighted Average Cost of Capital 280
On the basis of regression result described above, no clear cut generalization
can be made regarding the role of debt in influencing the cost of equity. Only it can
be stated that, in certain cases, the cost of equity will decrease up to a point; in other
words, the use of debt may increase the cost of equity and yet in certain cases; the use
of debt may not have any impact on the cost of equity up to a certain point. This
inconsistent role of debt is not unexpected. Firstly, because the firms within the same
industry widely differ with respect to their characteristics and as a result, they are
exposed to different degrees of riskiness which may be not associated with the level
of debt. Further, investors may show markedly different preferences for the different
equities traded by them.
The regression coefficient of explanatory variable measuring companies
performance like growth, size, liquidity, dividend, profitability are found to be
insignificant for all the industries. Size of the companies is positively and
significantly related with the cost of equity in case of Personal Care and Diversified
industrial sector. The positive beta value of size implies that the larger firm is not
able to use their resources effectively as compared to small size companies and
possibly not being able to raise funds at cheaper rate by taking the advantage of their
large scale funds collection. The regression coefficient of dividend is significant and
positive only in case of Chemical sector. Thus, the result for that sector provides
some support to the hypothesis that the cost of equity sometimes not declines with
the distribution of dividend. A negative relationship has not been seen in any of the
Chapter: 5 Weighted Average Cost of Capital 281
sectors of our sample. The negative beta value of dividend indicates that the
shareholders of those sectors prefer for dividend, where as the positive value of beta
coefficients suggest that investors have no preference for current dividend in general;
rather they prefer future growth of their investment in shares.
9. Conclusion
From the aforesaid analysis, we can generalize that cost of capital (WACC) has
an impact on companies’ performance or cost of capital is influenced by companies’
financial performance. But the relationship between cost of capital and size of firm;
cost of capital and growth of firm; cost of capital and profitability of firm and so on
are not specific. Moreover, the relationship is based on the nature of companies. In
regard to relationship between cost of capital and capital structure; it is confirmed that
capital structure unswervingly affects the cost of capital only because of tax
deductibility of interest charges.
Therefore, it is suggested that the companies’ executive should consider cost of
capital (WACC) more gravely while taking business decision basing on the nature of
particular industry.
………………………………………………