Embed Size (px)
Citation preview

2015 Connecticut Wildlife Action Plan
5 - i
CHAPTER 5 - TABLE OF CONTENTS MONITORING AND ADAPTIVE MANAGEMENT
Introduction ............................................................................................................................ 1 Regional Coordination and Regional Context........................................................................... 2 The Monitoring and Performance Reporting Framework......................................................... 2 Conservation Status of Northeast Fish, Wildlife, and Natural Habitats .................................... 4 State Wildlife Grants Effectiveness Measures Project.............................................................. 4 TRACS Database ...................................................................................................................... 5 Northeast Lexicon for Common Planning and State Wildlife Action Plan Database ................. 5 Region‐wide Taxon‐specific Surveys and Monitoring............................................................... 5 Regional Monitoring Protocols and Databases ........................................................................ 6 Connecticut’s Species and Habitat Monitoring Programs......................................................... 6 Species Monitoring ..................................................................................................................... 8 Habitat Monitoring ..................................................................................................................... 9
Important Data Gaps in Connecticut........................................................................................ 9 Coordination with Partners ................................................................................................... 10 Effectiveness of Conservation Actions ................................................................................... 10 Conceptual Model for the Connecticut State Wildlife Action Plan ......................................... 10 Results Chains and Effectiveness Measures for Conservation Actions ................................... 12 Scenario: Habitat Management for New England Cottontail................................................... 13 Scenario: Long Island Sound Trawl Data Collection.................................................................. 17
Chapter 5 References ............................................................................................................ 21

2015 Connecticut Wildlife Action Plan Chapter 5
5 - ii
List of Figures Figure 5.1: Conceptual model showing linkages between WAP elements from conceptual model to results chains. .................................................. 11 Figure 5.2: Sample results chain showing the linkages between these elements ....................... 12 Figure 5.3: Historic and rangewide distribution of the NEC. ........................................................ 13 Figure 5.4: The twelve NEC Focus Areas in Connecticut, showing core focus areas within the focus areas, known NEC locations............................................................. 14 Figure 5.5: Results chain for restoration of shrublands and conservation of the New England cottontail. ............................................................. 15 Figure 5.6: Example data collected to show the impact of conservation actions on shrublands restoration and New England Cottontail (NEC) conservation. ........... 17 Figure 5.7: Results chain for Long island Sound Trawl data collection and reporting. ................ 18 Figure 5.8: Example data collected to show the impact of trawl surveys and reporting on Long Island Sound species conservation. ....................................... 20
List of Tables
Table 5.1: List of conservation targets and proposed indicators. (NEAFWA 2008)............................ 3 Table 5.2: Species, Guild (Species Groups), and Habitat Monitoring Programs in Connecticut. ... 7
2015 Connecticut Wildlife Action Plan
5 - 1
CHAPTER 5 MONITORING AND ADAPTIVE MANAGEMENT
INTRODUCTION Monitoring Connecticut’s GCN species, their habitats, and the effectiveness of the conservation actions identified in the previous chapters provides important and necessary information for DEEP and its partners (Element 5). It will allow them to determine the effectiveness of conservation actions, reduce and eliminate threats facing the state’s fish and wildlife resources, and ensure the most efficient use of limited staffing and funds. As conditions change (e.g., land‐use patterns, climate, population trends, responses to conservation actions) and as new data become available, adaptive management will allow DEEP to respond appropriately. Adaptive management has received ample attention in the conservation community as an effective method for long‐term conservation (e.g., Johnson and Case 2000, TNC 2000, Brown et al. 2001, Groves et al. 2002, Pew 2003, USFWS 2004, and Salafsky et al. 2001, 2002, and 2003).
The WAP includes a monitoring and adaptive management framework that will be used to assess the status of GCN species and habitats, as well as monitor the effectiveness of conservation actions. Appendix 1a identifies monitoring efforts, programs, plans, data, and tools used by DEEP and its partners to assess the status of GCN species and key habitats. Where monitoring for a particular species or taxon does not exist, Chapter 4 describes conservation actions for alternate species or taxa that share the same habitat. This strategy seeks to benefit the overall habitat, community, or assemblage, including many other GCN species. In cases where insufficient information exists to monitor a species or group, or where monitoring protocols have not yet been developed, this is acknowledged, and a conservation action is described to address the situation. Such is the case for some small mammals and invertebrates. In these cases, these overarching needs are described in Chapter 1 under the appropriate taxon. As the information gaps are filled, any relevant monitoring can be adapted to be more quantitative and specific (Holling 1978). Where new monitoring protocols are needed, Oakley et al. (2003) provides guidelines on how to develop them.
This chapter provides a summary of the many resources and tools that states can leverage to facilitate tracking the implementation and effectiveness of conservation actions. Examples of these resources include the Northeast Regional Monitoring and Performance Reporting Framework, collaboratively funded by the National Fish and Wildlife Foundation (NFWF, see NEAFWA 2008) and its successors; the State Wildlife Grants Effectiveness Measures Project (AFWA and BPWG 2012), funded by the Doris Duke Foundation; and the Northeast Lexicon Project (Crisfield and NEFWDTC 2013) and the national Tracking and Reporting Actions for the Conservation of Species (TRACS) database, funded by U.S. Fish and Wildlife Service (USFWS). The approach that Connecticut takes toward monitoring and adaptive management will be discussed in later sections of this chapter and will include specific scenarios that illustrate how the effectiveness of conservation actions will be measured.

2015 Connecticut Wildlife Action Plan Chapter 5
5 - 2
REGIONAL COORDINATION AND REGIONAL CONTEXT The northeastern region (Virginia north to Maine) has a long history of collaborative wildlife conservation spanning the past 50 years. Planning efforts by NEFWDTC have led to several key monitoring projects funded by the Regional Conservation Need (RCN) Grant Program.
The NEFWDTC identified the development of a regional monitoring and performance measurement project as a high priority. Although northeastern states had developed their own monitoring programs to track the status and condition of wildlife species and habitats, the NEFWDTC recognized the importance of coordinating monitoring and evaluation activities across the entire Northeast region. Several key factors cited by NEFWDTC in supporting the development of regional monitoring activities include the large number of shared priority species and habitats, the relatively limited funding available in any one state for monitoring and evaluation activities, and the presence of many regional experts who have knowledge of particular taxa or ecosystems throughout the Northeast.
The examples in this section are intended to show the breadth and diversity of regionally coordinated monitoring activities in the Northeast, especially those activities funded through the collaborative RCN Grant Program. In addition to species and habitat monitoring, many of these approaches have used results chains or similar tools such as logic models to articulate theories of change and identify status measures and effectiveness indicators. The list of examples is by no means comprehensive or exhaustive. Additional monitoring activities and programs are described in more detail in the state wildlife action plans (SWAPs) developed by the individual northeastern states.
THE MONITORING AND PERFORMANCE REPORTING FRAMEWORK The Northeast Association of Fish and Wildlife Agencies (NEAFWA) Monitoring and Performance Reporting Framework (NEAFWA 2008) is intended to help each state in the Northeast meet the expectations set by Congress and the U.S. Fish and Wildlife Service for the SWAPs and the State Wildlife Grant (SWG) programs. The goal of this framework is to assess the status and trends of GCN species and their habitats and to evaluate the effectiveness of activities intended to conserve species and habitats across the Northeast. For more information and to review project reports, please visit: http://rcngrants.org/content/regional‐monitoring‐and‐performance‐framework.
The Monitoring and Performance Reporting Framework defined conservation targets in terms of the species, landscape features, and vegetative communities that are important to fish and wildlife. Indicators were proposed for tracking status and trends of each of the targets, and data sources were identified for each of the indicators. Table 5.1 lists the eight targets and proposed indicators (NEAFWA 2008).

2015 Connecticut Wildlife Action Plan Chapter 5
5 - 3
TABLE 5.1: LIST OF CONSERVATION TARGETS AND PROPOSED INDICATORS. (NEAFWA 2008)
Targets Proposed Indicators
1. Forests 1a. Forest area ‐ by forest type 1b. Forest area ‐ by reserve status 2. Forest composition and structure ‐ by seral stage 3. Forest fragmentation index 4. Forest bird population trends 5. Acid deposition index
2. Freshwater streams and river Systems
1. Percent impervious surface 2. Distribution and population status of native Eastern brook
trout 3. Stream connectivity (length of open river) and number of
blockages 4. Index of biotic integrity 5. Distribution and population status of non‐indigenous aquatic
species 3. Freshwater wetlands 1. Size/area of freshwater wetlands
2. Percent impervious surface flow 3. Buffer area and condition (buffer index) 4a. Hydrology ‐ upstream surface water retention 4b. Hydrology ‐ high and low stream 5. Wetland bird population trends 6. Road density
4. Highly migratory species 1. Migratory raptor population index 2. Shorebird abundance 3. Bat population trends 4. Abundance of diadromous fish (indicator still under
development) 5. Presence of monarch butterfly
5. Lakes and ponds 1. Percent impervious surface/landscape integrity 2. Percent shoreline developed (shoreline integrity) 3. Overall Productivity of Common Loons
6. Managed grasslands and shrublands
To be developed
7. Regionally Significant Species of Greatest Conservation Need
1. Federally listed sp. population trends and reproductive productivity
2. State‐listing status and heritage rank of highly imperiled wildlife
3. Population trends of endemic species 8. Unique habitats in the NE 1. Proximity to human activity/roads
2. Wildlife presence/absence 3. Wildlife population trends 4. Land use/land cover changes

2015 Connecticut Wildlife Action Plan Chapter 5
5 - 4
CONSERVATION STATUS OF NORTHEAST FISH, WILDLIFE, AND NATURAL HABITATS Using the indicators developed at the regional level, NEAFWA supported The Nature Conservancy’s efforts to assess the current condition of species and habitats in the Northeast through the Conservation Status Project. Using geographic information system (GIS) analysis tools, the project examined the relationship between species and habitat condition, land ownership and conservation management status. The original assessment project was merged with another RCN‐funded project, titled Regional Indicators and Measures: Beyond Conservation Land (Anderson and Olivero Sheldon 2011), which evaluated approximately 30 indicators of habitat condition, species condition and ecosystem health in the northeastern states. Together these projects, completed in September 2011, implemented approximately 75 percent of the Northeast Regional Monitoring and Performance Measures Framework (NEAFWA 2008) previously funded by the NFWF and the RCN Grant Program. Please see: http://www.rcngrants.org/sites/default/files/final_reports/Conservation‐Status‐of‐Fish‐Wildlife‐and‐Natural‐Habitats.pdf
STATE WILDLIFE GRANTS EFFECTIVENESS MEASURES PROJECT Building on the success of the Northeastern Regional Monitoring and Performance Measures Framework (NEAFWA 2008), the Association of Fish and Wildlife Agencies (AFWA) led an effort to develop an approach for measuring the effectiveness of wildlife conservation activities funded under the U.S. Fish and Wildlife Service SWG program. In September 2009, AFWA’s Teaming with Wildlife Committee formed the Effectiveness Measures Working Group. This working group included representatives from state fish and wildlife agencies as well as private, academic, and non‐governmental conservation partners with expertise in wildlife conservation and performance management.
In April 2011, the working group released a final report that outlines a comprehensive approach to measuring the effectiveness of the activities funded under the SWG program. The report builds on the monitoring framework that was originally developed in the northeastern states and recommends a set of common indicators for measuring status, trends, and/or effectiveness of thirteen general types of conservation actions that are commonly supported by SWG. These actions include: direct management of natural resources, species restoration, creation of new habitat, acquisition/easement/lease, conservation area designation, environmental review, management planning, land use planning, training and technical assistance, data collection and analysis, education, conservation incentives, and stakeholder involvement. The report includes sample templates and forms that can be used for reporting the results of conservation activities, as well as a discussion of the specific methods by which these reporting methods could be incorporated into in the U.S. Fish and Wildlife Service grants management database. For more information and to review the project final report, please visit: http://www.fishwildlife.org/files/Effectiveness‐Measures‐Report_2011.pdf.

2015 Connecticut Wildlife Action Plan Chapter 5
5 - 5
TRACS DATABASE The State Wildlife Grants Effectiveness Measures Project has informed the development of Tracking and Reporting Actions for the Conservation of Species (TRACS), a database designed by the U.S. Fish and Wildlife Service to record information about conservation activities funded through the Wildlife and Sport Fish Restoration Program, including SWG. When fully functional, TRACS is intended to track and report project outputs, effectiveness measures, and species and habitat outcomes. TRACS has the potential to track long‐term outcomes for species and habitats, above and beyond the types of short‐term output measures commonly tracked by funding agencies (e.g., number of publications, number of workshops, number of people contacted). Because it is being designed to be responsive to the needs of the state agencies receiving SWG funding, TRACS includes its own customized classifications of conservation actions and threats. These classifications are based, at least in part, on the classifications developed jointly by the International Union for the Conservation of Nature (IUCN) and the Conservation Measures Partnership (CMP, see Salafsky et al. 2008). For more information about the development of TRACS, please visit: http://wsfrprograms.fws.gov/Subpages/TRACS/TRACS.html.
NORTHEAST LEXICON FOR COMMON PLANNING AND STATE WILDLIFE ACTION PLAN DATABASE Wildlife conservation planners in the Northeast have long recognized a potential ambiguity in many of the terms that are used to describe fish and wildlife conservation activities. For example, a “target” may refer to a number, an area, a specific site, a species, a group or guild of species, a vegetation community, or an ecosystem type. There is an acute need to develop a standard lexicon that provides conservationists with a uniform terminology that accurately and adequately describes the work of state fish and wildlife agencies. Although lexicons have been developed by the IUCN and the CMP, they are designed primarily for international conservation and sustainable development projects, activities that differ in many important ways from fish and wildlife conservation efforts in the northeastern states. Thus, the NEFWDTC developed a regional conservation lexicon that can be used by state wildlife agencies and partners to describe their conservation projects (Crisfield and NEFWDTC 2013).
The Northeast SWAP Database is a data management tool developed by the NEFWDTC , Kevin Kalasz, Karen Terwilliger, and Jonathan Mawdsley that provides a basic structure for storing and querying data collected by the individual states as part of their SWAP revisions. The database includes full support for results chains as well as indicators and the AFWA SWG Effectiveness Measures.
REGION-WIDE TAXON-SPECIFIC SURVEYS AND MONITORING Numerous taxon‐specific surveys, inventory, or monitoring programs have been developed and implemented with the support of NEAFWA and through other regional collaborations. With RCN funding, surveys and assessments have been conducted or are in the process of being conducted for wood turtle, Eastern black rail, odonates (dragonflies and damselflies), New England cottontail (Fuller and Tur 2012), shrubland birds (McDowell 2011), aquatic habitats (Gawler 2008), and frogs. Detailed avian indicators have also been developed for assessing the magnitude of threats and the effectiveness of conservation measures (Northeast Coordinated

2015 Connecticut Wildlife Action Plan Chapter 5
5 - 6
Bird Monitoring Partnership 2007). An online database of museum specimen records for GCN invertebrates in the Northeast was developed by Fetzner (2011). More in‐depth reports describing the methods and results of these surveys and associated data products are available at the RCN website: www.RCNgrants.org.
REGIONAL MONITORING PROTOCOLS AND DATABASES Northeast states have also developed monitoring protocols and databases through regional multi‐state collaborative efforts. With funding from the RCN Grant Program, monitoring protocols have been developed, reviewed, or revised for several species of regional conservation interest, including New England cottontail (Fuller and Tur 2012), shrubland‐dependent birds (McDowell 2011), freshwater aquatic habitats (Gawler 2008), and frogs. Ongoing RCN projects are also developing monitoring protocols for wood turtle, Eastern black rail, and odonates (dragonflies and damselflies). The consistent and widespread use of common monitoring methodologies and survey protocols will help support regional assessments of the status and trends of GCN species and their habitats. In addition, NEAFWA has also funded development of a database for regional invertebrate species of greatest conservation need through a partnership with the Carnegie Museum of Natural History in Pittsburgh (Fetzner 2011). A more comprehensive database has been proposed that would include data on all species, habitats, actions, and threats from the individual Northeast State Wildlife Action Plans (SWAPs; for introductory information and a lexicon of terms that would be used in such a database, please see Crisfield and NEFWDTC 2013). Links to monitoring plans and tools developed through the RCN Grant Program are available on the RCN program web site.
CONNECTICUT’S SPECIES AND HABITAT MONITORING PROGRAMS Connecticut maintains a wealth of monitoring programs that provide important information about wildlife species and their habitats (Table 5.2). Many of these programs have been designed to provide information about the status and trends of species in the state, as well as the condition and extent of wildlife habitat areas. In addition to these status measures, some of these monitoring programs also track important effectiveness measures for wildlife conservation activities.
Since the original 2005 WAP, Connecticut has been involved with several regional projects to address conservation and monitoring of GCN species and their habitats. Regionally, Connecticut has collaborated on 41 projects since 2005, including Regional Conservation Needs projects, Competitive State Wildlife Grants (SWG), and North Atlantic Landscape Conservation Cooperative projects. These projects have provided critical information on the rapid decline of bats due to white‐nose syndrome as well as the decline of the New England Cottontail and are all summarized in the Northeast Synthesis (Terwilliger Consulting, Inc. and NEFWDTC 2013) and accessible on the www.RCNgrants.org website.
Statewide projects are managed by DEEP and a multitude of other partner organizations and are summarized and accessible on the DEEP website (www.ct.gov/deep). In this WAP, species monitoring projects are discussed in Chapter 1 and habitat monitoring projects are discussed in Chapter 2. Additional information and updates on projects discussed throughout this document and the Wildlife Action Plan process can be found at the DEEP Wildlife Action Plan webpage:

2015 Connecticut Wildlife Action Plan Chapter 5
5 - 7
www.ct.gov/deep/wildlifeactionplan. Data from these programs and process‐related information from individual implementation projects (e.g., number of meetings held, number of reports produced, number of people contacted through outreach efforts, number of plans developed, etc.) will be reported to the U.S. Fish and Wildlife Service and tracked using the TRACS database.
TABLE 5.2: SPECIES, GUILD (SPECIES GROUPS), AND HABITAT MONITORING PROGRAMS IN CONNECTICUT. Level of Monitoring Monitoring Program or
Action Implementation Lead Target(s)
Species Guild Habitat New England marine mammal, sea turtle and seabird survey
NOAA Marine mammals, sea turtles, seabirds
X
NOAA Restoration Center Programs
NOAA, CT DEEP
Oil spill and contaminant release response and restoration
X X X
Freshwater mussel, snails and crayfish surveys (various locations)
Biodrawversity LLC Mussels, snails, crayfish
X X
Christmas Bird Counts Audubon Connecticut Birds X X American Shad studies CT DEEP, USFWS American shad X X White Memorial Fish and Wildlife Monitoring Programs
White Memorial Foundation Birds, amphibians, reptiles, invertebrates, fish
X X X
National Audubon Society Birdathons
Audubon Connecticut and chapters
Birds X X
BioBlitz Surveys UConn Faunal inventories X Long Island Sound Trawl Survey
CT DEEP Fin fish, squid and crustaceans
X X X
Shorebird Monitoring Survey CT DEEP Shorebirds X X Summer Canada Geese Program
CT DEEP Canada Geese X
Monitoring Avian Productivity and Survivorship (MAPS)
Institute for Bird Populations volunteers
Migratory birds X X
BirdSource (national monitoring program)
National Audubon Society and Cornell Lab of Ornithology
Birds X
School Yard Habitat Program Audubon Connecticut, USFWS Habitat, birds, bees X X X
Forest Bird Initiative
Audubon Connecticut, Ferruci & Walicki LLC, Connecticut Agricultural Experiment Station
Songbirds X X X
Osprey Nation Connecticut Audubon Society, CT DEEP
Ospreys X X
Stream and River Survey CT DEEP Fish X X Diadromous Fisheries Assessment and Restoration Program
CT DEEP, USFWS Diadromous fish X X
Eight Mile River Sampling (water quality)
Three Rivers Community College
Water quality monitoring
X X
Rapid Bioassessment Monitoring Stream Surveys
CT DEEP Macroinvertebrates X X
Oceanology Programs in Little Narragansett Bay and Pawcatuck River estuaries
Pine Point School Benthic surveys, water quality monitoring
X X
Long Island Sound Water Quality Survey
CT DEEP Water quality monitoring
X

2015 Connecticut Wildlife Action Plan Chapter 5
5 - 8
Level of Monitoring Monitoring Program or Action
Implementation Lead Target(s) Species Guild Habitat
Private Landowner Assistance Program
CT DEEP Forest management X
Air Quality Monitoring (various locations)
CT DEEP Air quality monitoring X
Water Quality Monitoring (various locations)
CT DEEP Water quality monitoring
X
Farmington River Biodiversity Project
Farmington River Watershed Association
Water quality monitoring
X
US Geological Survey Long Island Sound Environmental Studies Program
US Geological Survey Benthic mapping X
US Geological Survey Water Resources Division Monitoring
US Geological Survey Water quality and quantity monitoring
X
EPA Long Island Sound Study project
EPA, CT DEEP Water quality and benthic monitoring
X
Coastal 2000/EMAP EPA Coastal ecosystem health
X X
Southern New England and NY Seagrass Initiative
NOAA, TNC Eelgrass X
Connecticut River Watershed Floodplain Forest research
TNC Floodplain forests X
Salt Marsh Migration Analysis
UConn CLEAR, TNC Long Island Sound salt marshes
X
Long Island Sound Ecological Assessment
TNC Coastal habitats X
Climate Change, Sea Level Rise Studies
UConn, DEEP, NOAA Coastal habitats X
Forest Inventory and Analysis US Forest Service Forest Habitats X Sediment Elevation Tables Marsh Surveys (various locations)
Yale University Tidal marsh habitat X
Open Marsh Water Management Program
CT DEEP Marsh habitat X
Appendix 1a lists many of the current plans and programs that have been developed by local, state, regional, national, or international partners to monitor GCN species or their habitats in Connecticut. In Chapter 4, multiple conservation actions are listed that employ these programs and plans. These existing programs were used as the foundation from which partners/stakeholders helped identify new monitoring needs where appropriate.
Species Monitoring Connecticut has numerous programs in place that monitor individual wildlife species as well as important species guilds, such as shorebirds and waterfowl. These programs include terrestrial, fresh water, and salt water species, and are the primary means for monitoring GCN species in Connecticut. Monitoring data will be evaluated regularly and be used to refine protocols or create new ones that will be more effective. Basic species metrics from these monitoring programs will be maintained by project leaders and submitted to the U.S. Fish and Wildlife Service TRACS database when it becomes operational. TRACS performance measures have been developed and associated with each priority conservation action in the Connecticut Wildlife Action Plan.

2015 Connecticut Wildlife Action Plan Chapter 5
5 - 9
Habitat Monitoring Connecticut also has numerous programs in place for monitoring habitats. They are the primary means for monitoring the condition, extent, and status of key wildlife habitats identified in this WAP. Evaluating the success of conservation actions aimed at improving the condition of key habitats will be accomplished through these monitoring programs. Basic metrics for habitat condition and extent will be maintained by project leaders and submitted to the U.S. Fish and Wildlife Service TRACS database when it becomes operational.
Examples of habitat monitoring activities in Connecticut include the Bureau of Water Management’s water quality monitoring program, the Inland Fisheries Division’s stream survey, and the Long Island Sound Study Program. In 2008, the North Atlantic Landscape Conservation Cooperative (NALCC), the University of Massachusetts and The Nature Conservancy undertook the Northeast Terrestrial Habitat Mapping Project to provide a common framework and language for monitoring, conservation planning, and wildlife management across state lines.
The long‐term objectives of monitoring key habitats at the regional scale will be realized by using existing and new GIS programs. The Endangered Species and Wildlife Diversity Technical Committee of NEAFWA identified the need to develop updated geographic information systems at a regional scale. Expanding current programs, such as updating the existing Southern New England Gap Analysis Program (GAP), adding an aquatic GAP, and coordinating with the USFS landscape level mapping project, would enhance the understanding of key habitats in a regional context. Supporting and participating in this important regional effort will be a priority over the next ten years.
At the state and local levels, periodic updates of land use and land cover (e.g., UConn’s CLEAR program, DEEP’s Forest Plan) will allow the extent, distribution and condition of habitats to be monitored as conservation actions and SWG projects are implemented. Mapping and monitoring rare natural communities (Connecticut’s Environmental Condition Online CT ECO) and key habitats were identified in Chapter 4 as overarching statewide conservation actions. Areas where additional efforts are needed will be identified and incorporated as the WAP is updated.
IMPORTANT DATA GAPS IN CONNECTICUT With the finite resources available to support monitoring programs, it is simply not possible to monitor many aspects of the natural or human environment relevant to fish and wildlife conservation efforts. However, it is possible to identify high‐priority areas where additional data would be helpful for developing management prescriptions for fish and wildlife species and their habitats in Connecticut. Chapters 1 and 4 identify the high‐priority data gaps and actions to address them. These data gaps and actions were, in turn, identified by taxonomic experts, planners, and stakeholders that participated in the WAP review process. Developing monitoring programs to address these gaps is an ongoing and important step towards providing wildlife managers in Connecticut with the information they need. However, the ability to implement effective monitoring is clearly constrained by the limited resources.

2015 Connecticut Wildlife Action Plan Chapter 5
5 - 10
COORDINATION WITH PARTNERS A WAP performance measure will evaluate the extent to which the WAP and its implementation are coordinated with partners. An effective measure of coordination success will be the degree to which partners integrate the GCN species, habitats, and conservation actions into their plans and programs. To that end, each partner will receive the final WAP with the request that they incorporate its species and habitats into their programs and coordinate with DEEP to implement appropriate conservation actions.
An improvement in the coordination of similar monitoring projects conducted by disparate sources would be one such measure. Coordination of all the avian monitoring projects, for example, through a regional resource such as the Atlantic Coast Joint Venture Plan or other U.S. Fish and Wildlife Service Region 5 Migratory Bird Plans would enhance the efficiency of each project. This would lead to a qualitative improvement in the implementation of the WAP actions in the regional and national context for avifauna.
Another qualitative measure of monitoring success may be the increased involvement and collaboration of DEEP and its partners in other statewide or regional conservation initiatives. By utilizing both quantitative and qualitative success criteria, DEEP will be responsive to the diverse nature, scope, and scale of the WAP conservation actions.
EFFECTIVENESS OF CONSERVATION ACTIONS The purpose of tracking effectiveness measures is to obtain the information needed to adaptively manage fish and wildlife species and habitats in the state. Connecticut is committed to an adaptive management approach to fish and wildlife conservation. The next sections of this chapter describe a conceptual model for the WAP with corresponding results chains. They also illustrate how the SWG effectiveness measures function within an adaptive management context. The effectiveness of conservation actions described in this WAP will be measured using a set of standardized effectiveness measures that have been developed by AFWA and described in their 2011 report on Effectiveness Measures for State Wildlife Grants (AFWA 2011). Actual values for these measures will be entered into the U.S. Fish and Wildlife Service TRACS database, and comparisons of the values of these measures over time will be used to establish the degree of effectiveness of individual projects as well as broader conservation programs. Terms and standard definitions are derived from Margoluis and Salafsky (1998) and Salafsky et al. (2008).
CONCEPTUAL MODEL FOR THE CONNECTICUT STATE WILDLIFE ACTION PLAN Conceptual models are at the heart of adaptive management approaches for species and habitat conservation. Models illustrate what is called the “theory of change” for a project: the causal pathways by which managers believe that a project will achieve its desired results. Although there are many different kinds of conceptual models, Margoluis and Salafsky (1998) introduced a simple form of box‐and‐arrow diagram that shows causal linkages between the basic conservation elements for an individual project, including targets, threats, and conservation actions. While originally developed as a tool for individual conservation projects, conceptual models can also be created for larger conservation programs. The following

2015 Connecticut Wildlife Action Plan Chapter 5
5 - 11
conceptual model for the WAP illustrates the linkages between the core plan elements, including species and habitats, threats and actions (Figure 5.1). This conceptual model is intended to be a generalized representation of the interactions between the plan elements. Not all of the threats and actions shown in the diagram will apply to every species or habitat. What the diagram shows is the set of possible threats and actions that could affect a particular species or habitat.
FIGURE 5.1: CONCEPTUAL MODEL SHOWING LINKAGES BETWEEN WAP ELEMENTS FROM CONCEPTUAL MODEL TO RESULTS CHAINS. Conservation actions are shown in yellow hexagons; threats or information needs are shown in purple boxes, and targets are shown in blue ovals. Arrows indicate the logical causal linkages between the elements. Arrows between actions and threats show that the action is intended to remediate or ameliorate the threat. Arrows between threats and targets show that the threat affects that target.
The conceptual model above illustrates a set of results chains for each of the different conservation actions, shown in the yellow hexagons. A results chain shows the logical linkages between a conservation action and the intended beneficiary of that action. Results chains also include threats, especially in cases where the conservation action is intended to reduce a specific threat. They may also include intermediate outcomes between the action and its intended target.
Figure 5.2 depicts a sample results chain showing the linkages between these basic elements.

2015 Connecticut Wildlife Action Plan Chapter 5
5 - 12
FIGURE 5.2: SAMPLE RESULTS CHAIN SHOWING THE LINKAGES BETWEEN BASIC ELEMENTS
Fully developed results chains also incorporate indicators for each of the individual elements (e.g., action, threat, outcome, and target). A specific measure is then identified for each indicator, showing exactly how that indicator will be measured over time. Data from existing monitoring programs can be used to track the values of these measures. Reviewing data from monitoring programs can help managers adjust their management prescriptions and adaptively manage wildlife species and their habitats.
DEEP and its partners may develop, as appropriate, project‐specific results chains for the individual conservation actions that are selected for implementation (e.g., NRCS and USFWS for the New England cottontail). At the same time, the state will be using existing results chains that have been developed by NEAFWA and AFWA to identify potential indicators and effectiveness measures for the categories of conservation actions in the conceptual model presented above.
RESULTS CHAINS AND EFFECTIVENESS MEASURES FOR CONSERVATION ACTIONS Results chains were originally developed as tools for use in individual conservation projects. It is also possible to develop generalized results chains that show the relationships between the basic classes of elements (e.g., actions, threats, outcomes, targets) for particular types or classes of conservation projects. These generalized results chains can be very helpful in identifying indicators and measures that can be used to track progress towards conservation goals across a broader suite of similar projects. If projects are tracked using identical or compatible indicators and measures, the information about project accomplishments can then be “rolled up” across the suite of projects in order to report broader progress to funding agencies and the general public.
NEAFWA and AFWA have both developed sets of generalized results chains for common conservation actions described in SWAPs. The AFWA report on SWG Effectiveness Measures (AFWA 2011) also included a set of recommended indicators for each of a set of generalized results chains. Because these indicators are intended to track progress on conservation projects, they are also known as “effectiveness measures” or “performance measures.”
Effectiveness measures will be tracked by Connecticut for particular classes of conservation actions. These effectiveness measures have been developed by the AFWA SWG Effectiveness Measures Working Group (AFWA 2011) and will be reported and tracked as part of the State of Connecticut’s regular reporting to the U.S. Fish and Wildlife Service via the TRACS database. When this WAP revision is completed, DEEP will have the ability to measure project effectiveness. This will put the state in an excellent position to assess the effectiveness of WAP implementation efforts for the next ten years.

2015 Connecticut Wildlife Action Plan Chapter 5
5 - 13
Scenario: Habitat Management for New England Cottontail The following example describes a proposed approach for Connecticut’s framework for monitoring and effectiveness measures.
The New England Cottontail (NEC) was once common throughout New England and eastern New York, but largely due to habitat loss and possible competition from the introduced eastern cottontail, the range of this species has declined by 86 percent since 1960 (Figure 5.3). In 2004, the NEC was listed as a species of regional greatest conservation need (RGCN) in Wildlife Action Plans for all the states in the Northeast where the species still occurred (CT, RI, MA, NH, ME and NY). In 2006, the species was designated as a Candidate for Threatened or Endangered Status under the Federal Endangered Species Act. This designation triggered a sweeping conservation effort by state and federal biologists. This regional conservation effort was formalized in 2011 with the organization of the Regional NEC Initiative. The organizations involved included state and federal agencies, universities, and non‐profits, working to develop a conservation strategy that identified habitat and population goals, funding sources, and planned actions. The “Conservation Strategy for the New England Cottontail (Sylvilagus transitionalis)” (Fuller and Tur 2012) was formally adopted in November of 2012. A result of this effort was the 2015 determination that the NEC does not warrant listing under the Federal Endangered Species Act. Innovative conservation ranging from habitat restoration to captive rearing helped the NEC reach many recovery goals. Continued public‐private partnerships will be required to maintain this success.
Connecticut holds the most significant remaining population of NEC and plays a leadership role in NEC restoration efforts. The Wildlife Division is partnering with the Natural Resources Conservation Service (NRCS), the U.S. Fish and Wildlife Service, the Wildlife Management Institute, and the National Fish and Wildlife Foundation to conduct research, implement habitat management work, and provide education and outreach in order to cultivate and foster public participation in these efforts.
FIGURE 5.3: HISTORIC AND RANGEWIDE DISTRIBUTION OF THE NEW ENGLAND
COTTONTAIL IN THE NORTHEAST. (USFWS 2011)

2015 Connecticut Wildlife Action Plan Chapter 5
5 - 14
Providing habitat is the key to the successful restoration of this species. NEC requires large patches (ideally 10 ‐ 25 acres or more) of shrubland and/or young forest to maintain viable local populations, which prefer dense thickets of tangled shrubs, vines, and thorny vegetation. Research in New Hampshire has shown that vegetative cover with 20,000 stems per acre or more provides quality NEC habitat. In Connecticut’s mostly forested landscape, this type of habitat was created through natural processes such as fire and flooding and later, through man‐made changes including the abandonment of farmland and tree harvesting. Today these natural processes have been largely controlled and remaining patches of reverting farmland have either grown past the brushy stage into forest, or are being developed. Timber harvesting can create critical habitat for the NEC and many other species, but has declined over the years. All of these factors have combined to reduce the amount of young forest habitat available to the many species dependent on it, including the NEC. Recognizing this, the goal of conserving 24,000 acres of habitat and a population goal of 12,000 rabbits for Connecticut was established. A model was developed to identify those areas of the state that have the best potential for both habitat and population restoration. Twelve focus areas were delineated and have helped to guide restoration work both on state and private lands (Figure 5.4).
FIGURE 5.4: THE TWELVE NEC FOCUS AREAS IN CONNECTICUT, SHOWING CORE FOCUS AREAS WITHIN THE FOCUS AREAS, KNOWN NEC LOCATIONS (AS OF OCTOBER 2014).
Given that NEC are still relatively widespread in Connecticut, biologists believed that much of this habitat already existed. DEEP contracted with UConn to provide a statewide and focus area

2015 Connecticut Wildlife Action Plan Chapter 5
5 - 15
estimate of how much habitat was available (Rittenhouse, in preparation), largely using remote sensing imagery. This study estimated more than 13,000 acres of habitat existed in NEC focus areas. Further efforts to quantify existing habitat included an investigation of understory habitat patches in forested areas and a survey of Connecticut Forest Practitioners regarding timber harvests that would result in suitable cottontail habitat.
To restore NEC populations in Connecticut, land managers identified the following specific conservation action: use brush mowing or other mechanical treatment to manage quality shrublands communities, thereby increasing the number of acres with >20,000 stems. Target goals for acres managed have been set for each of Connecticut’s focal areas.
For this action, a basic results chain (Figure 5.5) was developed. The diagram shows the logical connections between the four basic conservation elements: action, objectives, threats, and targets (species and habitats). In this case, these elements are defined as follows:
• Action: Use brush mowing or other mechanical treatments to manage shrublands, restoring to 20,000 stems per acre or more;
• Objective: Restoration of all acres in CT’s NEC Focal Areas to quality shrublands to support NEC populations;
• Threat: Large shrubs and trees crowds out smaller multi‐stemmed shrubs and plants that provide forage and shelter needed by NEC; and
• Targets: Habitat‐ shrublands, Species‐ NEC.
FIGURE 5.5: RESULTS CHAIN FOR RESTORATION OF SHRUBLANDS AND CONSERVATION OF THE NEW ENGLAND COTTONTAIL.
For each element in the results chain, an indicator and a method or measure by which that indicator will be tracked is identified.
The Association of Fish and Wildlife Agencies’ 2011 report on Effectiveness Measures for State Wildlife Grants classifies brush mowing as a “Direct Management of Natural Resources.” Recommended indicators and performance measures for projects that involve Direct Management of Natural Resources include the following:
• Percent management actions implemented as planned; • Evidence that direct management action is reducing key threats; • Degree to which target GCN species respond as expected from direct management
actions; • Degree to which target habitats/processes respond as expected from direct
management actions; • Species Measures (e.g., population size, reproductive success); and • Habitat Measures (e.g., size, condition).

2015 Connecticut Wildlife Action Plan Chapter 5
5 - 16
For the specific management action of brush mowing, the indicator, “number of acres mowed per year,” will be measured by tracking the number of acres that are subjected to management each year.
For the objective (restoration of shrublands), the indicator “number of acres of shrublands with >20,000 stems/acre” will be measured by tracking the number of acres of shrublands meeting certain vegetation composition and stand characteristics typical of high‐quality NEC habitat.
For the threat (large shrubs and trees), the indicator “number of acres of shrublands with >20,000 stems/acre” will be measured by tracking the number of acres of shrublands communities with >20,000 stems/acre.
For the targets (shrublands and NEC), the indicators “number of sites with NEC populations” and “number of acres of shrublands in quality condition” can be measured. Note that the target and objectives for this particular conservation action will be tracked using the same indicator, which will be used as both a status and effectiveness measure. The indicator for the NEC populations will be measured using presence‐absence surveys conducted in shrublands areas.
To implement and track these indicators, managers will need to record the following basic information in the WAP database: description of a specific measure for the indicator, the values of that measure in 2005 and 2015, the units for the measure, and the name of any monitoring program that provides data on that measure and indicator. As individual projects are completed, this information can also be reported to the U.S. Fish and Wildlife Service using the TRACS database, as a way of recording progress towards achievement of conservation objectives.
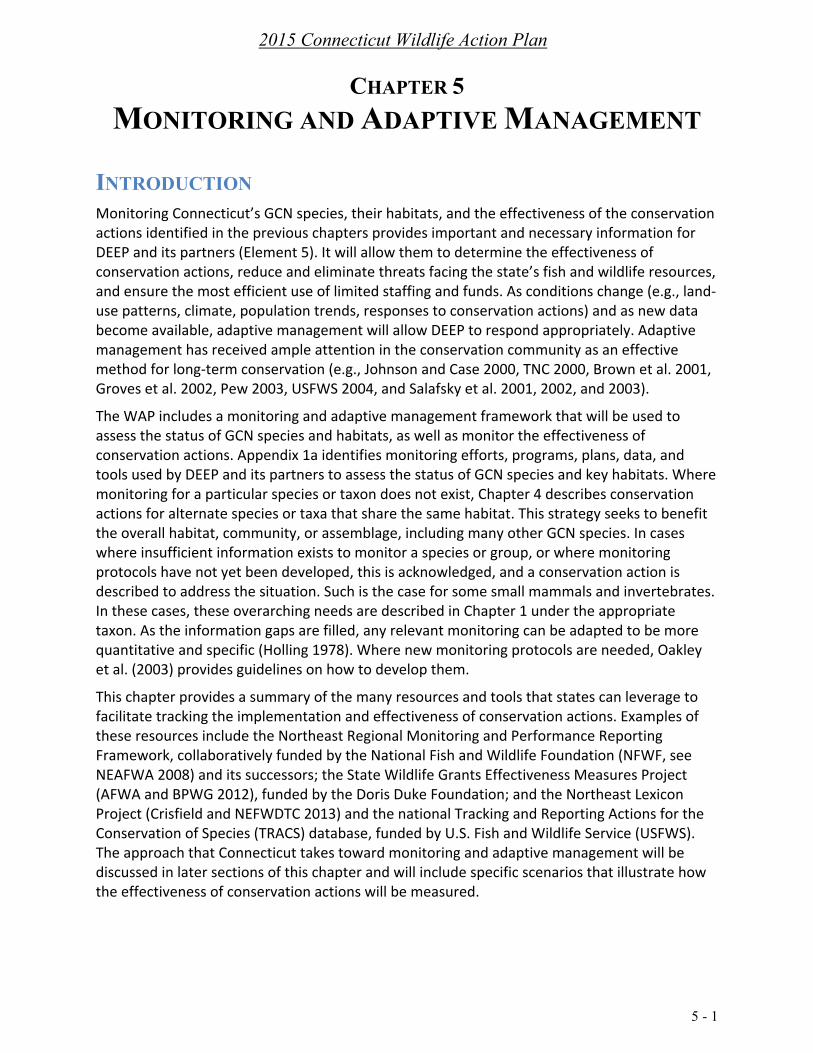
In 2025, managers will present the basic results chain shown above and a chart or diagram showing how the values of each indicator have changed since the project was implemented. Figure 5.6 shows charts provided as examples of how these data might be presented in the 2025 Wildlife Action Plan.
Taken together, these four charts graphically illustrate progress towards the conservation goals for shrublands habitat and NEC populations (Figure 5.6.). By mowing a relatively small number of acres each year, the number of acres with >20,000 stems is greatly increased over ten years, and the number of acres of quality shrublands habitat is also increased. The number of NEC likewise increases over time, demonstrating progress towards the overall goal of conserving this species in the state. The charts indicate a successful conservation management action. They also illustrate one way to track and report project effectiveness over time.
2015 Connecticut Wildlife Action Plan Chapter 5
5 - 17
FIGURE 5.6: EXAMPLE DATA COLLECTED TO SHOW THE IMPACT OF CONSERVATION ACTIONS ON SHRUBLANDS RESTORATION AND NEW ENGLAND COTTONTAIL (NEC) CONSERVATION.
Scenario: Long Island Sound Trawl Data Collection The following example describes a proposed approach to implementing monitoring and effectiveness measures for Long Island Sound (LIS) species.
Long Island Sound forms the southern border of the state, covering a watershed of 16,820 square miles in Connecticut and New York. The three major rivers in Connecticut provide this large estuary with 90 percent of its fresh water, which is well mixed with salt water through two connections to the Atlantic Ocean: the Race and Rhode Island’s Block Island Sound in the east and the East River and New York Harbor in the west. The estuary is approximately 110 miles long east‐to‐west, and 21 miles wide at its broadest part, encompassing a total of 1,320 square miles (LISS 2014).
Significant conservation efforts have focused on Long Island Sound to assess, protect, conserve, and restore its many coastal resources. One of the most comprehensive programs is the Long Island Sound Trawl Survey (LISTS). This survey has been conducted annually since 1984. The Marine Fisheries Division conducts the survey to measure the abundance and distribution of important finfish and macroinvertebrates, as well as related water quality data. This survey is independent of, and in addition to, harvest data collected by the Marine Fisheries Division. Collectively, these data are used to evaluate fish stock health and guide effective management strategies (CT DEP 2004). Survey results are used to help support local and coast‐wide fishery management efforts (CT DEEP 2014) with key partners including the National Marine Fisheries Service, Atlantic States Marine Fisheries Commission, New England and Mid‐Atlantic Councils.

2015 Connecticut Wildlife Action Plan Chapter 5
5 - 18
To collect and report data on Long Island Sound species in Connecticut, managers identify the following specific conservation action: use trawl survey data and reporting to make informed management decisions.
For this action, a sample basic results chain (Figure 5.7) was developed. The diagram shows the logical connections between the four basic conservation elements: action, objectives, threats, and targets (species and/or habitats). In this case, these elements are defined as follows:
• Action: Use trawl surveys to gather data on Long Island Sound species and report results to relevant partners;
• Objective: To make informed decisions that support Long Island Sound species populations;
• Threat: Management may not identify or address needs of or key threats to LIS species; and
• Target: Long‐term sustainable biodiversity in Long Island Sound and its watersheds including sustainable harvest rates for commercial and recreational species.
For each element in the results chain, an indicator and a method or measure by which that indicator will be tracked is identified.
FIGURE 5.7: RESULTS CHAIN FOR LONG ISLAND SOUND TRAWL DATA COLLECTION AND REPORTING.
The Association of Fish and Wildlife Agencies’ 2011 report on Effectiveness Measures for State Wildlife Grants classifies surveys as a “Data Collection and Analysis.” Recommended indicators and performance measures for projects that involve Data Collection and Analysis include the following:
• Evidence that clear management needs and outcomes have been identified with input from relevant data users;
• Evidence that the researcher clearly provides answers to relevant questions; • Evidence that data are reaching relevant audiences; • Evidence that data collection effort resulted in conservation action recommendations;
and • Evidence data are being used to inform conservation actions.
For the specific management action (trawl surveys and reporting), the indicator “percent of Information and Data Collection Actions in which researcher provided relevant answers to questions” will be measured by tracking the number of trawl survey objectives met each year. By comparing LISTS data with current fishery data (landings, catch/effort, seasonal patterns) each species' harvest can be weighed against its abundance, providing a gauge to determine

2015 Connecticut Wildlife Action Plan Chapter 5
5 - 19
whether harvest limit targets are being met. LISTS also provides a measure of recruitment strength (abundance of young fish) entering the population each year, as well as detailed characterization of the size and age composition of several species entering the Sound. This information is very relevant and providing it in a timely manner is critical to effective management of key GCN species.
LISTS data are summarized and made available on DEEP’s website. For the objective (Informed Decisions), the indicator “data collection efforts in which data are reaching relevant audiences” will be measured by monitoring the number of web page visits and tracking the use of the data by different audiences (e.g., state and federal fisheries management agencies, independent researchers, and private interest groups such as anglers, coastal non‐profit groups, and educators).
For the threat (Management addresses needs of LIS species), the indicator “percent of Information and Data Collection Actions that resulted in recommendations” will be measured by tracking the quantity of data used in DEEP management decisions and planning documents.
For the targets (Sustainable biodiversity in LIS and Sustainable harvest of recreational and commercial species), the indicators “abundance of total finfish biomass taken in LISTS annually (i.e. spring and fall) and the number of harvested species which have achieved sustainable fishing rates (as specified in their fisheries management plans)” can be measured.
To implement and track these indicators, managers will need to record the following basic information in the WAP database: description of a specific measure for the indicator, the values of that measure in 2005 and 2015, the units for the measure, and the name of any monitoring program that provides data on that measure and indicator. As individual projects are completed, this information can also be reported to the U.S. Fish and Wildlife Service using the TRACS database, as a way of recording progress towards achievement of conservation objectives.
In 2025, managers will present the basic results chain shown above and a chart or diagram showing how the values of each indicator have changed since the project was implemented. The following charts are provided as examples of how these data might be presented in the 2025 Wildlife Action Plan (Figure 5.8).

2015 Connecticut Wildlife Action Plan Chapter 5
5 - 20
FIGURE 5.8: EXAMPLE DATA COLLECTED TO SHOW THE IMPACT OF TRAWL SURVEYS AND REPORTING ON LONG ISLAND SOUND SPECIES CONSERVATION.
Taken together, these four charts graphically illustrate progress towards the conservation goals for the impact of trawl surveys and reporting on Long Island Sound species conservation (Figure 5.8). By meeting survey objectives, DEEP’s partners are able to incorporate the data into their management plans. In addition, audiences demonstrate continued interest in the information. The number of finfish fluctuates over time, but the species persists at harvestable levels, demonstrating progress towards the overall goal of conserving these species in the state. These charts demonstrate that LISTS is a successful data collection action, and they illustrate one way to track and report project effectiveness over time. Use of tracking indicators and effectiveness measures will put Connecticut in an excellent position to show the effectiveness of WAP implementation efforts in the future.

2015 Connecticut Wildlife Action Plan Chapter 5
5 - 21
CHAPTER 5 REFERENCES
Anderson, M.G. and A. Olivero Sheldon. 2011. Conservation status of fish, wildlife, and natural habitats in the Northeast landscape: implementation of the Northeast monitoring framework. The Nature Conservancy, Eastern Conservation Science.
Association of Fish and Wildlife Agencies (AFWA). 2011. Measuring the effectiveness of state wildlife grants final report.
Association of Fish and Wildlife Agencies (AFWA), Teaming With Wildlife Committee, State Wildlife Action Plan Best Practices Working Group (BPWG). 2012. Best practices for state wildlife action plans—voluntary guidance to states for revision and implementation. Washington, D.C. Association of Fish and Wildlife Agencies. Available online at: http://www.fishwildlife.org/files/SWAPBestPractices.pdf (accessed August 2015)
Brown, S., C. Hickey, B. Harrington, and R. Gill, eds. 2001.The United States shorebird conservation plan. Manomet Center for Conservation Sciences. May 2001 2nd Edition.
Connecticut Department of Energy and Environmental Protection (CT DEEP). 2014. A study of marine recreational fisheries in Connecticut for the period March 2013 – February 2014. Bureau of Natural Resources, Marine Fisheries Division. Available online at: http://www.ct.gov/deep/lib/deep/fishing/fisheries_management/trawl_survey_2013_with_cover_web.pdf (accessed August 2015)
Connecticut Department of Environmental Protection (CT DEP). 2004. A study of marine recreational fisheries in Connecticut. U.S. Fish and Wildlife Service. Project F‐54‐R:1‐160.
Crisfield, E. and the Northeast Fish and Wildlife Diversity Technical Committee (NEFWDTC). 2013. The Northeast lexicon: terminology conventions and data framework for state wildlife action plans in the Northeast region. A report submitted to the Northeast Fish and Wildlife Diversity Technical Committee. Terwilliger Consulting, Inc., Locustville, Virginia.
Fetzner Jr., J.W. 2011. SGCN invertebrates: a database and associated website of museum specimen occurrence records for invertebrate species of greatest conservation need in the northeastern region. Available online at: http://iz.carnegiemnh.org/SGCNinverts/ (accessed August 2015)
Fuller, S. and A. Tur. 2012. Conservation strategy for the New England cottontail (Sylvilagus transitionalis). New England Cottontail Technical Committee.
Gawler, S.C. 2008. Northeastern terrestrial wildlife habitat classification. Report to the Virginia Department of Game and Inland Fisheries on behalf of the Northeast Association of Fish and Wildlife Agencies and the National Fish and Wildlife Foundation. NatureServe, Boston, Massachusetts.
Groves, C.R., D.B. Jensen, L. L. Valutis, and K.H. Redford. 2002. Planning for biodiversity conservation: putting conservation science into practice. Bioscience 52(6): 499‐512
Holling, C.S., editor. 1978. Adaptive environmental assessment and management. John Wiley, New York, New York.
Johnson, F.A., and D.J. Case. 2000. Adaptive regulation of waterfowl harvests: lessons learned and prospects for the future. Transactions of the North American Wildlife and Natural Resource Conference 65:94‐108. Available online at: http://migratorybirds.fws.gov/reports/ahm02/johnson‐case‐2000.pdf (accessed August 2015)

2015 Connecticut Wildlife Action Plan Chapter 5
5 - 22
Long Island Sound Study (LISS). 2014. About the Sound. Available online at: http://longislandsoundstudy.net/about‐the‐sound/by‐the‐numbers/ (accessed August 2015)
Margolius, R.A., and N. Salafsky. 1998. Measures of success: designing, managing, and monitoring conservation and development projects. Island Press, Washington, D.C., USA.
McDowell, B. 2011. Restoration of shrubland bird habitat in the Northern Appalachian Mountain bird conservation region. Wildlife Management Institute.
Northeast Association of Fish and Wildlife Agencies (NEAFWA). 2008. Monitoring the conservation of fish and wildlife in the Northeast. Final Report.
Northeast Coordinated Bird Monitoring Partnership. 2007. A framework for coordinated bird monitoring in the Northeast. Northeast Coordinated Bird Monitoring Partnership Report. Available online at: http://www.nebirdmonitor.org/framework (accessed August 2015)
Oakley, K.L., L.P. Thomas, and S.G. Fancy. 2003. Guidelines for long term monitoring protocols. Wildlife Society Bulletin 31(4): 1000‐1003.
Pew Oceans Commission. 2003. America’s living oceans: charting a course for sea change. A report to the nation, recommendations for a new ocean policy. Pew Oceans Commission, Arlington, Virginia. Available online at: http://www.pewoceans.org (accessed August 2015)
Salafsky, N., R. Margoluis, and K. Redford. 2001. Adaptive management: a tool forconservation practitioners. The Biodiversity Support Program, World Wildlife Fund, Inc. Available online at: http://www.bsponline.org/bsp/publications/aam/112/titlepage.htm (accessed August 2015)
Salafsky, N., R. Margoluis, K.H. Redford, and J.G. Robinson. 2002. Improving the practice of conservation: a conceptual framework and research agenda for conservation science. Conservation Biology 16: 1469‐1479.
Salafsky, N., D. Salzer, J. Ervin, T. Boucher, and W. Ostlie. 2003. Conventions for defining, naming, measuring, combining, and mapping threats in conservation: an initial proposal for a standard system. Foundations of Success, The Nature Conservancy Measures and Audit Team and Global Priorities Group, Bethesda, Maryland.
Salafsky, N., D. Salzer, A. Stattersfield, C. Hilton‐Taylor, R. Neugarten, S. Butchart, B. Collen, N. Cox, L. Master, S. O’Connor, and D. Wilkie. 2008. A standard lexicon for biodiversity conservation: unified classifications of threats and actions. Conservation Biology. DOI: 10.1111/j.1523‐1739.2008.00937.x. Available online at: http://www.iucnredlist.org/documents/Salafsky_et_al._2008_Unified_Classifications_of_Threats_and_Actions.pdf (accessed August 2015)
Terwilliger Consulting, Inc. (Terwilliger) and the Northeast Fish and Wildlife Diversity Technical Committee (NEFWDTC). 2013. Taking action together: Northeast regional synthesis for state wildlife action plans. A report submitted to the Northeast Fish and Wildlife Diversity Committee. Locustville, Virginia.
The Nature Conservancy (TNC). 2000. The five‐S framework for site conservation: a practitioner’s handbook for site conservation planning and measuring conservation success. The Nature Conservancy, Arlington, Virginia.
United States Fish and Wildlife Service (USFWS). 2004. Writing refuge management goals and objectives: a handbook. U.S.Department of the Interior, Washington, D.C. Available online at: http://library.fws.gov/pubs3.html (accessed August 2015)
United States Fish and Wildlife Service (USFWS). 2011. Rabbit at risk: conserving the New England cottontail.