Embed Size (px)
Citation preview
CHAPTER 5: Operations Plan
Report Prepared by:
Contents 5 OPERATIONS PLAN ............................................................................................ 5-1
5.1 Proposed Service Changes ............................................................................ 5-2
5.1.1 Fiscal Year 2017 ....................................................................................... 5-2
5.1.2 Fiscal Year 2018 ....................................................................................... 5-6
5.1.3 Fiscal Year 2019 ..................................................................................... 5-11
5.1.4 Fiscal Year 2020 ..................................................................................... 5-11
5.1.5 Fiscal Year 2021 ..................................................................................... 5-15
5.1.6 Fiscal Year 2022 ..................................................................................... 5-19
5.1.7 Fiscal Year 2023 ..................................................................................... 5-22
5.1.8 Fiscal Year 2024 ..................................................................................... 5-25
5.1.9 Fiscal Year 2025 ..................................................................................... 5-27
5.1.10 Fiscal Year 2026 ..................................................................................... 5-30
5.2 Title VI Response .......................................................................................... 5-33
5.3 Facility Improvements ................................................................................... 5-33
Figures Figure 1 | Fiscal Year 2017 Service Changes .............................................................. 5-5
Figure 2 | Fiscal Year 2018 Service Changes ............................................................ 5-10
Figure 3 | Fiscal Year 2020 Service Changes ............................................................ 5-14
Figure 4 | Fiscal Year 2021 Service Changes ............................................................ 5-18
Figure 5 | Fiscal Year 2022 Service Changes ............................................................ 5-21
Figure 6 | Fiscal Year 2024 Service Changes ............................................................ 5-26
Figure 7 | Fiscal Year 2025 Service Changes ............................................................ 5-29
Figure 8 | Fiscal Year 2026 Service Changes ............................................................ 5-32 Tables Table 1 | Fiscal Year 2017 Levels of Service ............................................................... 5-3
Table 2 | Fiscal Year 2017 Operating Statistics ........................................................... 5-4
Table 3 | Fiscal Year 2018 Levels of Service ............................................................... 5-7
Table 4 | Fiscal Year 2018 Operating Statistics ........................................................... 5-8
Table 5 | Fiscal Year 2019 Operating Statistics ......................................................... 5-11
Table 6 | Fiscal Year 2020 Levels of Service ............................................................. 5-12
Table 7 | Fiscal Year 2020 Operating Statistics ......................................................... 5-13
Table 8 | Fiscal Year 2021 Levels of Service ............................................................. 5-16
Table 9 | Fiscal Year 2021 Operating Statistics ......................................................... 5-17
Table 10 | Fiscal Year 2022 Levels of Service ........................................................... 5-19
Table 11 | Fiscal Year 2022 Operating Statistics........................................................ 5-20
Table 12 | Fiscal Year 2023 Levels of Service ........................................................... 5-22
Table 13 | Fiscal Year 2023 Operating Statistics........................................................ 5-23
Table 14 | Fiscal Year 2023 Service Changes ........................................................... 5-24
Table 15 | Fiscal Year 2024 Levels of Service ........................................................... 5-25
Table 16 | Fiscal Year 2024 Operating Statistics........................................................ 5-25
Table 17 | Fiscal Year 2025 Levels of Service ........................................................... 5-27
Table 18 | Fiscal Year 2025 Operating Statistics........................................................ 5-28
Table 19 | Fiscal Year 2026 Levels of Service ........................................................... 5-30
Table 20 | Fiscal Year 2026 Operating Statistics........................................................ 5-31
Operations Plan
Arlington County Transit Development Plan Page | 5-1
5 OPERATIONS PLAN A variety of service expansion recommendations have been prepared through this project, including the expansion of service throughout the County; a new Premium Transit Network; and the introduction of a new flexible transit service. These recommendations will be implemented over the course of the next ten years, in accordance to the priority determined based on the overall impact of the service and the expressed need for each recommendation as realized through the project’s public outreach process. The expansion of service throughout the County has required new definitions for the types of services being offered. Currently, Arlington County relies on local routes and express services to provide needed transit connections. Through the implementation of the recommendations described in this TDP, neighborhood circulators; premium transit services; and on-demand flex routes will be placed into service. The current and future bus service types offered in Arlington and where they operate within the County are:
• Local Routes: Service focused on providing connectivity within and between activity centers in Arlington County and nearby jurisdictions. These services are operated by ART and Metrobus.
• Neighborhood Circulator Routes: Service that helps passengers travel short distances to popular local destinations and/or bus transit stations, and generally operate only during peak hours. These services are operated by ART.
• Express Routes: Service focused on long trips delivering commuters directly to major employment centers without making regular stops over the trunk of the route. These services are operated by Metrobus.
• Premium Service: High-frequency service connecting major destinations that operates solely along major thoroughfares with enhanced amenities at the majority of its bus stops. These services are operated by Metrobus.
• On-demand Flex Service: On-demand service focused on providing a cost efficient alternative to fixed-route service through lower density neighborhoods. These services will be developed by ART, focusing on midday service.
The baseline figures used to estimate the net costs of all service improvements are derived from Arlington County’s existing bus service. Currently, 599,200 annual revenue hours (122,900 for ART and 476,301 for Metrobus) and 6,437,540 annual revenue miles (1,335,979 for ART and 5,101,561 for Metrobus) of service are provided. The Operating Plan is fiscally constrained and represents the reality of what can be implemented by the County based on the currently available resources. Additional improvements may be implemented, depending on the availability of new revenue.
Revenue hours and miles will decline in the first year from the baseline to Fiscal Year 2017. This is due to service changes mandated by the approved WMATA State of Good Repair modifications to Metrobus service. Some of these changes became effective June 26, 2016 with the remainder going into effect August 21, 2016.

Operations Plan
Arlington County Transit Development Plan Page | 5-2
This Operations Plan will increase revenue hours of service on both ART and Metrobus from the Fiscal Year 2017 levels. Bus revenue hours will increase 21%, revenue miles by 24% and the peak bus requirement by 14%.
5.1 Proposed Service Changes The following sections provide a year-by-year summary of the service recommendations that can be programmed in the constrained operating plan. 5.1.1 Fiscal Year 2017 In the first Fiscal Year of the TDP, ART will focus on implementing recommendations that will address service in areas where service is being discontinued by Metrobus. These changes will be reflected in the new ART 54, which will serve Dominion Hills, replacing the service currently provided by Metrobus 1E; and ART 77, which will be realigned to Rosslyn Metrorail station, replacing the current Metrobus 4A service. Additionally, the County will realize increased efficiencies on the very unproductive ART 92, which will be reconfigured into a shorter, more concise route. Other ART recommendations include increasing the san of service on the ART 43 to include midday and weekend service. Metrobus recommendations will be consistent with the State of Good Operations (SOGO) improvements developed for Fiscal Year 2017. These recommendations focus on making Metrobus services more productive and cost effective. Overall, the following service reductions are being considered for Fiscal Year 2017:
• ART 92: Reduce the span of service in the evenings from 9:00PM to 7:00PM, discontinue the connection to the Pentagon Metrorail station.
• Metrobus 1EZ: Eliminate both routes. Replace Metrobus 1E with a new route ART 54 into Dominion Hills and Metrobus 1Z with an increase of frequency on Metrobus 1B.
• Metrobus 4A: Eliminate route and replace with Metrobus 1Y (a peak hour express along US 50) and ART 77 (which will provide continued service on North Fairfax Drive and North Fort Myer Drive).
• Metrobus 9A: Eliminate route and provide similar connections using the Metroway and Metrobus 10AE.
• Metrobus 10RS: Eliminate routes and provide continued connections to Rosslyn with Metrobus 10E.
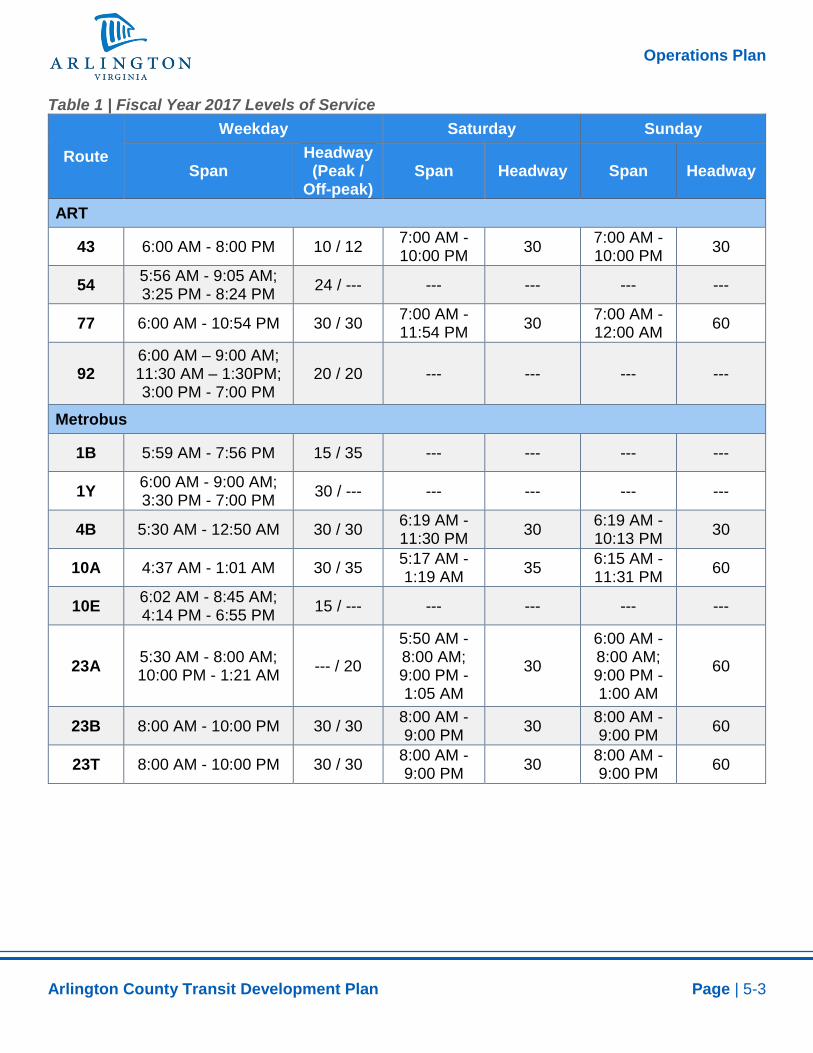
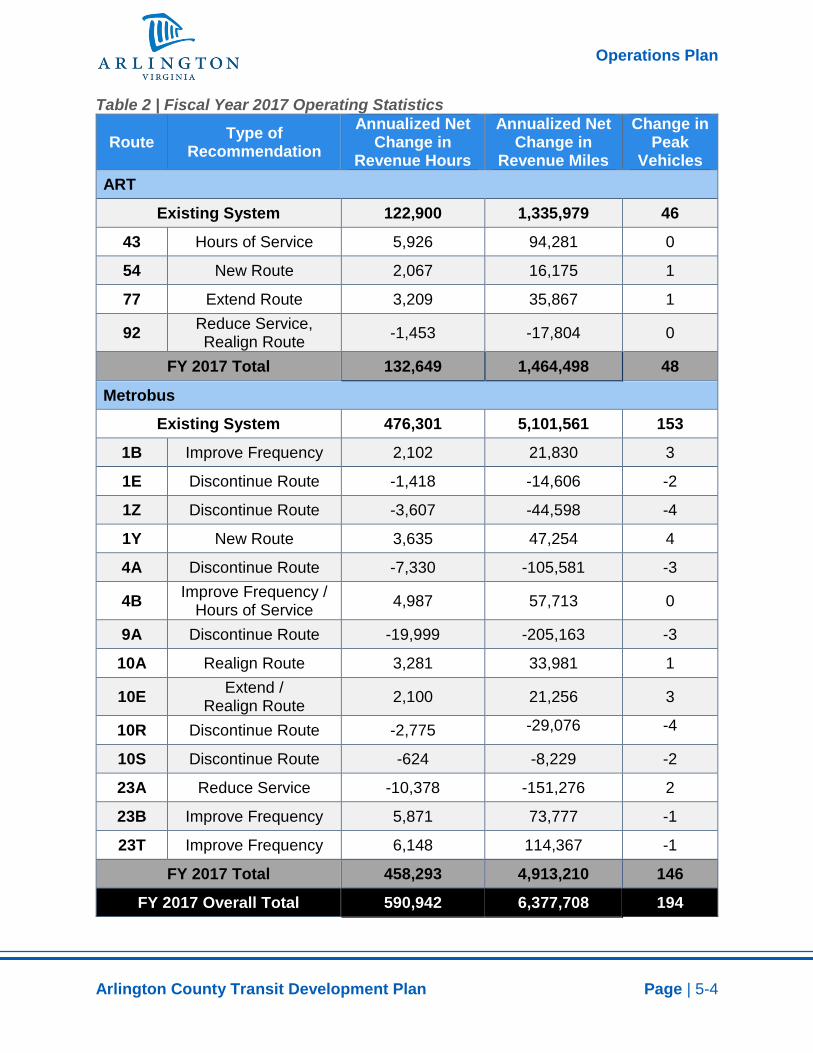
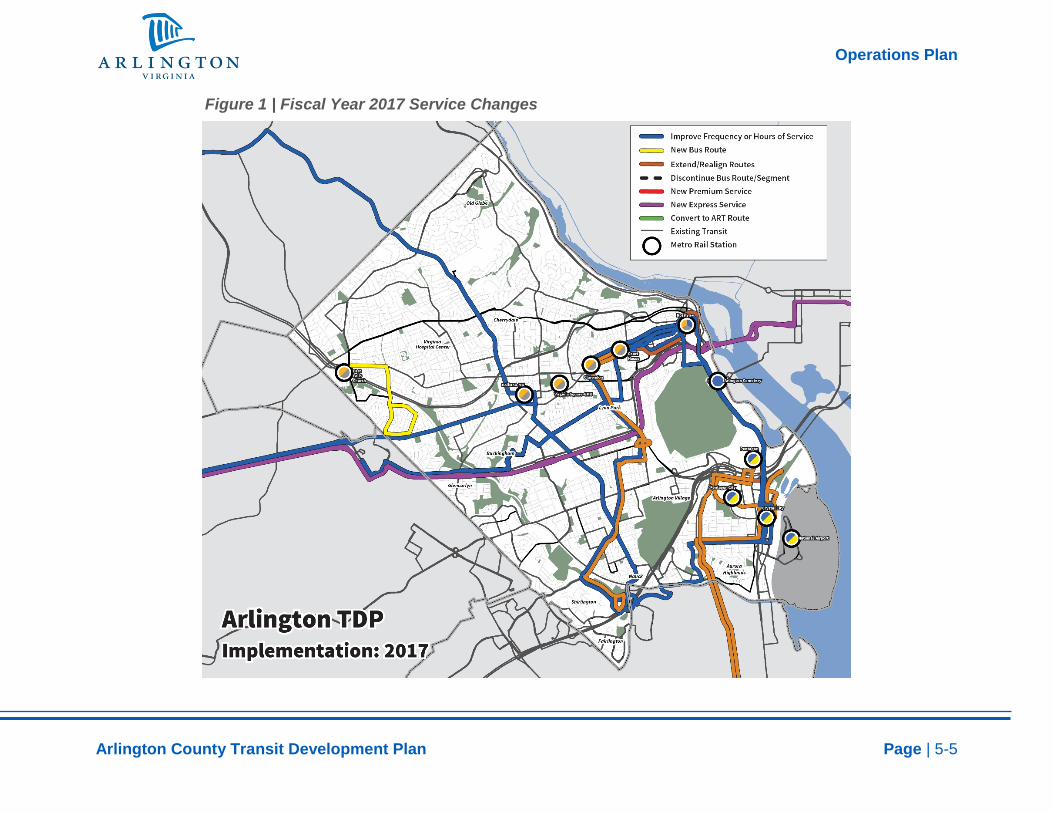
ART services will see an overall increase of approximately 8 and 10 percent in annual revenue hours and miles, respectively, while Metrobus will decrease in both revenue hours and miles in order to realize cost efficiencies. Table 1 details the levels of service for the routes that will be changing, while Table 2 provides an overview in the annual changes to hours and miles, as well as to peak vehicles. Figure 1 details the types of changes occurring along each corridor.
Operations Plan
Arlington County Transit Development Plan Page | 5-3
Table 1 | Fiscal Year 2017 Levels of Service
Route Weekday Saturday Sunday
Span Headway (Peak /
Off-peak) Span Headway Span Headway
ART
43 6:00 AM - 8:00 PM 10 / 12 7:00 AM - 10:00 PM 30 7:00 AM -
10:00 PM 30
54 5:56 AM - 9:05 AM; 3:25 PM - 8:24 PM 24 / --- --- --- --- ---
77 6:00 AM - 10:54 PM 30 / 30 7:00 AM - 11:54 PM 30 7:00 AM -
12:00 AM 60
92 6:00 AM – 9:00 AM; 11:30 AM – 1:30PM; 3:00 PM - 7:00 PM
20 / 20 --- --- --- ---
Metrobus
1B 5:59 AM - 7:56 PM 15 / 35 --- --- --- ---
1Y 6:00 AM - 9:00 AM; 3:30 PM - 7:00 PM 30 / --- --- --- --- ---
4B 5:30 AM - 12:50 AM 30 / 30 6:19 AM - 11:30 PM 30 6:19 AM -
10:13 PM 30
10A 4:37 AM - 1:01 AM 30 / 35 5:17 AM - 1:19 AM 35 6:15 AM -
11:31 PM 60
10E 6:02 AM - 8:45 AM; 4:14 PM - 6:55 PM 15 / --- --- --- --- ---
23A 5:30 AM - 8:00 AM; 10:00 PM - 1:21 AM --- / 20
5:50 AM - 8:00 AM; 9:00 PM - 1:05 AM
30
6:00 AM - 8:00 AM; 9:00 PM - 1:00 AM
60
23B 8:00 AM - 10:00 PM 30 / 30 8:00 AM - 9:00 PM 30 8:00 AM -
9:00 PM 60
23T 8:00 AM - 10:00 PM 30 / 30 8:00 AM - 9:00 PM 30 8:00 AM -
9:00 PM 60
Operations Plan
Arlington County Transit Development Plan Page | 5-4
Table 2 | Fiscal Year 2017 Operating Statistics
Route Type of Recommendation
Annualized Net Change in
Revenue Hours
Annualized Net Change in
Revenue Miles
Change in Peak
Vehicles ART
Existing System 122,900 1,335,979 46
43 Hours of Service 5,926 94,281 0
54 New Route 2,067 16,175 1
77 Extend Route 3,209 35,867 1
92 Reduce Service, Realign Route -1,453 -17,804 0
FY 2017 Total 132,649 1,464,498 48
Metrobus Existing System 476,301 5,101,561 153
1B Improve Frequency 2,102 21,830 3
1E Discontinue Route -1,418 -14,606 -2
1Z Discontinue Route -3,607 -44,598 -4
1Y New Route 3,635 47,254 4
4A Discontinue Route -7,330 -105,581 -3
4B Improve Frequency / Hours of Service 4,987 57,713 0
9A Discontinue Route -19,999 -205,163 -3
10A Realign Route 3,281 33,981 1
10E Extend / Realign Route 2,100 21,256 3
10R Discontinue Route -2,775 -29,076
-4
10S Discontinue Route -624 -8,229 -2
23A Reduce Service -10,378 -151,276 2
23B Improve Frequency 5,871 73,777 -1
23T Improve Frequency 6,148 114,367 -1
FY 2017 Total 458,293 4,913,210 146
FY 2017 Overall Total 590,942 6,377,708 194
Operations Plan
Arlington County Transit Development Plan Page | 5-5
Figure 1 | Fiscal Year 2017 Service Changes
Operations Plan
Arlington County Transit Development Plan Page | 5-6
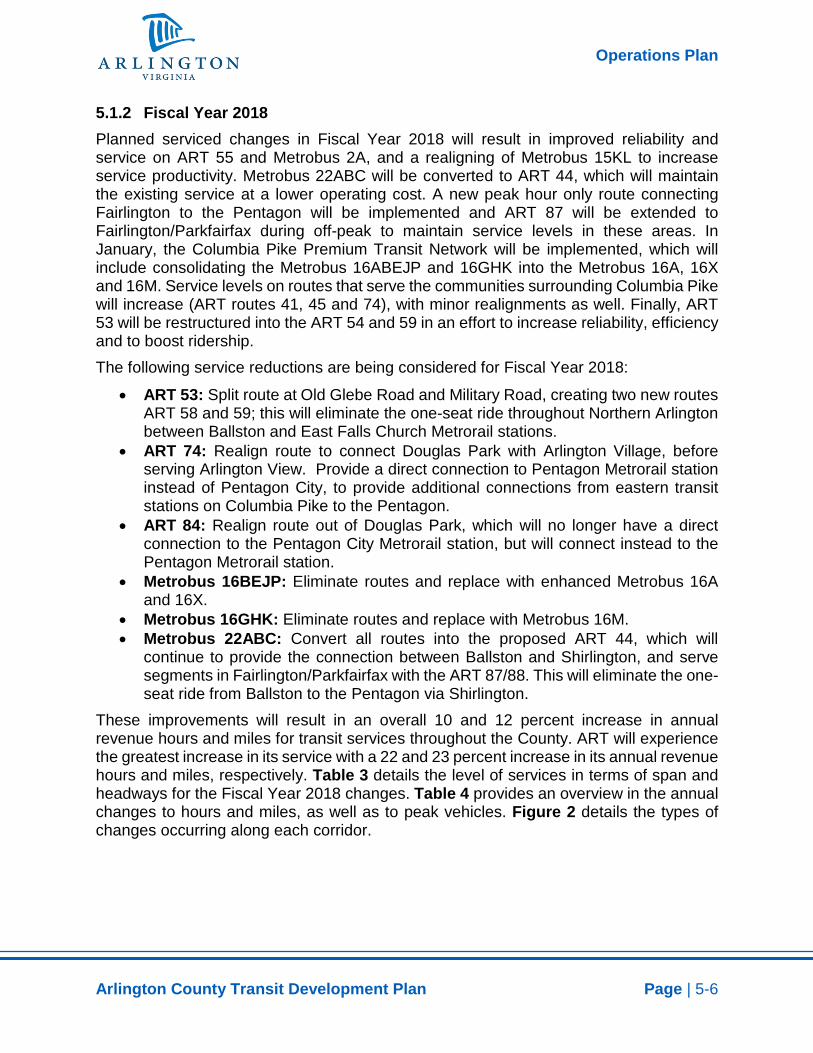
5.1.2 Fiscal Year 2018 Planned serviced changes in Fiscal Year 2018 will result in improved reliability and service on ART 55 and Metrobus 2A, and a realigning of Metrobus 15KL to increase service productivity. Metrobus 22ABC will be converted to ART 44, which will maintain the existing service at a lower operating cost. A new peak hour only route connecting Fairlington to the Pentagon will be implemented and ART 87 will be extended to Fairlington/Parkfairfax during off-peak to maintain service levels in these areas. In January, the Columbia Pike Premium Transit Network will be implemented, which will include consolidating the Metrobus 16ABEJP and 16GHK into the Metrobus 16A, 16X and 16M. Service levels on routes that serve the communities surrounding Columbia Pike will increase (ART routes 41, 45 and 74), with minor realignments as well. Finally, ART 53 will be restructured into the ART 54 and 59 in an effort to increase reliability, efficiency and to boost ridership. The following service reductions are being considered for Fiscal Year 2018:
• ART 53: Split route at Old Glebe Road and Military Road, creating two new routes ART 58 and 59; this will eliminate the one-seat ride throughout Northern Arlington between Ballston and East Falls Church Metrorail stations.
• ART 74: Realign route to connect Douglas Park with Arlington Village, before serving Arlington View. Provide a direct connection to Pentagon Metrorail station instead of Pentagon City, to provide additional connections from eastern transit stations on Columbia Pike to the Pentagon.
• ART 84: Realign route out of Douglas Park, which will no longer have a direct connection to the Pentagon City Metrorail station, but will connect instead to the Pentagon Metrorail station.
• Metrobus 16BEJP: Eliminate routes and replace with enhanced Metrobus 16A and 16X.
• Metrobus 16GHK: Eliminate routes and replace with Metrobus 16M. • Metrobus 22ABC: Convert all routes into the proposed ART 44, which will
continue to provide the connection between Ballston and Shirlington, and serve segments in Fairlington/Parkfairfax with the ART 87/88. This will eliminate the one-seat ride from Ballston to the Pentagon via Shirlington.
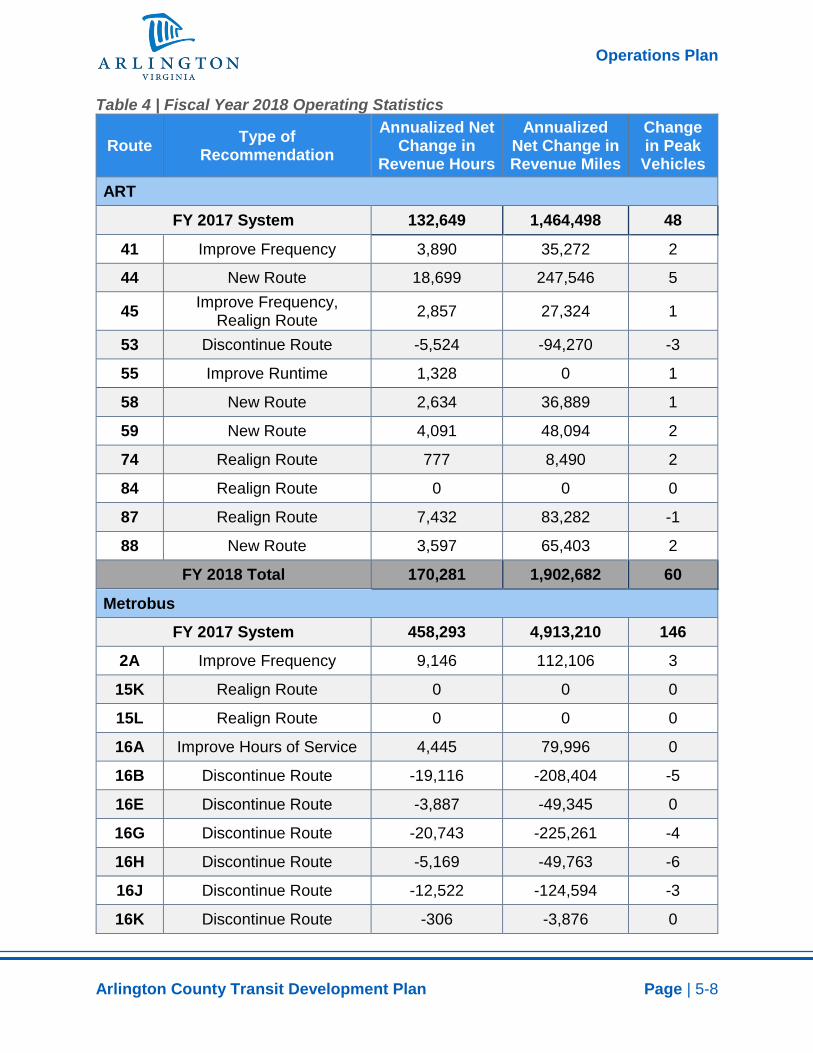
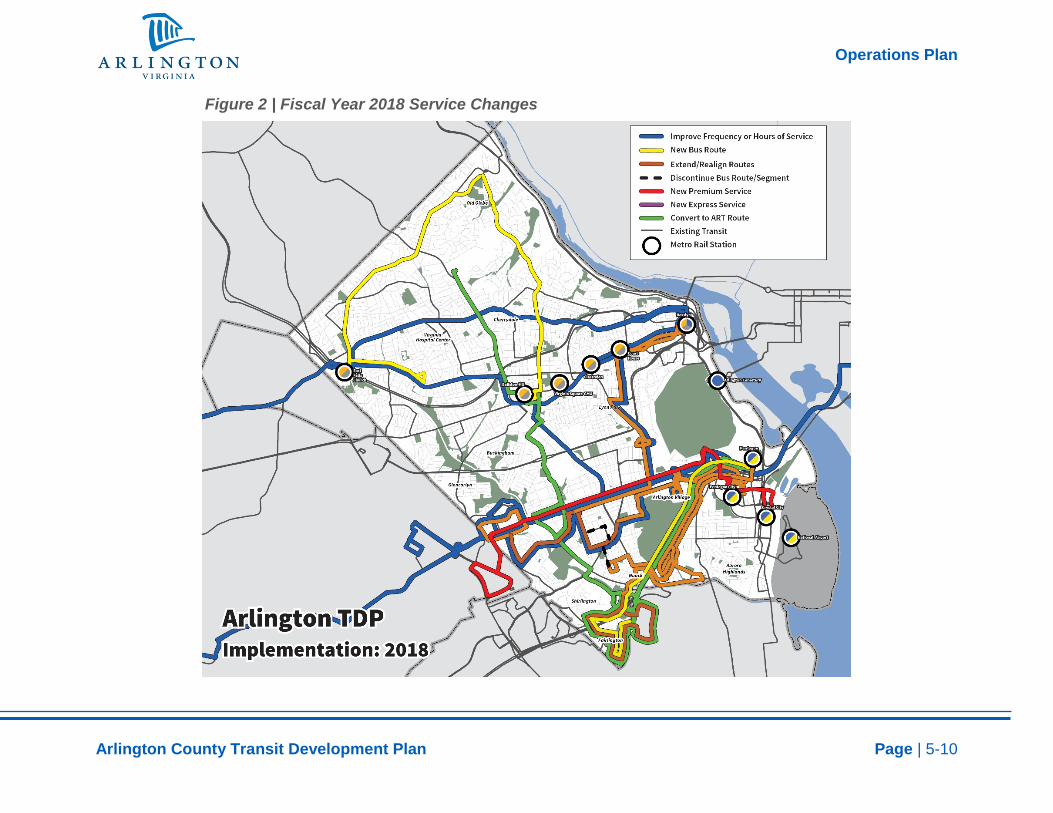
These improvements will result in an overall 10 and 12 percent increase in annual revenue hours and miles for transit services throughout the County. ART will experience the greatest increase in its service with a 22 and 23 percent increase in its annual revenue hours and miles, respectively. Table 3 details the level of services in terms of span and headways for the Fiscal Year 2018 changes. Table 4 provides an overview in the annual changes to hours and miles, as well as to peak vehicles. Figure 2 details the types of changes occurring along each corridor.

Operations Plan
Arlington County Transit Development Plan Page | 5-7
Table 3 | Fiscal Year 2018 Levels of Service
Route Weekday Saturday Sunday
Span Headway (Peak /
Off-peak) Span Headway Span Headway
ART
41 5:30 AM - 1:10 AM 10 / 20 6:10 AM - 1:57 AM 15 6:55 AM -
10:10 PM 15
44 5:00 AM - 11:00 PM 12 / 20 6:30 AM - 11:00 PM 30 6:30 AM -
11:00 PM 30
45 5:40 AM - 11:23 PM 20 / 30 7:50 AM - 12:15 AM 30 6:50 AM -
7:45 PM 30
55 5:00 AM - 12:57 AM 12 / 20 5:48 AM - 12:54 AM 20 6:18 AM -
12:08 AM 30
58 6:01 AM - 7:58 PM 30 / 45 --- --- --- ---
59 6:01 AM - 7:58 PM 30 / 45 --- --- --- ---
74 5:53 AM - 9:11 AM; 3:35 PM - 7:55 PM 25 / --- --- --- --- ---
84 5:51 AM - 9:31 AM; 3:30 PM - 7:52 PM 20 / --- --- --- --- ---
87 5:50 AM - 11:41 PM 10 / 30 7:00 AM - 11:53 PM 30 7:14 AM -
7:11 PM 30
88 5:49 AM – 9:36 AM; 3:30 PM – 7:38 PM 20 / --- --- --- --- ---
Metrobus
2A 4:45 AM - 12:55 AM 15 / 20 5:45 AM - 12:58 AM 20 5:45 AM -
1:03 AM 30
15K 5:40 AM - 9:52 AM; 3:45 PM - 8:05 PM 30 / --- --- --- --- ---
15L 6:25 AM - 9:38 AM; 3:40 PM - 7:26 PM 30 / --- --- --- --- ---
16A 4:30 AM - 12:30 AM 30 / 30 6:00 AM - 11:00 PM 30 6:00 AM -
11:00 PM 60
16M 5:30 AM - 11:00 PM 6 / 12 6:30 AM - 12:30 AM 12 7:30 AM -
10:30 PM 12
16X 4:30 AM - 1:00 AM 8 / 12 5:30 AM - 3:30 AM 15 6:00 AM -
11:00 PM 20
16Y 5:55 AM - 9:42 AM; 3:30 PM - 7:54 PM 10 / --- --- --- --- ---
Operations Plan
Arlington County Transit Development Plan Page | 5-8
Table 4 | Fiscal Year 2018 Operating Statistics
Route Type of Recommendation
Annualized Net Change in
Revenue Hours
Annualized Net Change in Revenue Miles
Change in Peak Vehicles
ART
FY 2017 System 132,649 1,464,498 48
41 Improve Frequency 3,890 35,272 2
44 New Route 18,699 247,546 5
45 Improve Frequency, Realign Route 2,857 27,324 1
53 Discontinue Route -5,524 -94,270 -3
55 Improve Runtime 1,328 0 1
58 New Route 2,634 36,889 1
59 New Route 4,091 48,094 2
74 Realign Route 777 8,490 2
84 Realign Route 0 0 0
87 Realign Route 7,432 83,282 -1
88 New Route 3,597 65,403 2
FY 2018 Total 170,281 1,902,682 60
Metrobus FY 2017 System 458,293 4,913,210 146
2A Improve Frequency 9,146 112,106 3
15K Realign Route 0 0 0
15L Realign Route 0 0 0
16A Improve Hours of Service 4,445 79,996 0
16B Discontinue Route -19,116 -208,404 -5
16E Discontinue Route -3,887 -49,345 0
16G Discontinue Route -20,743 -225,261 -4
16H Discontinue Route -5,169 -49,763 -6
16J Discontinue Route -12,522 -124,594 -3
16K Discontinue Route -306 -3,876 0
Operations Plan
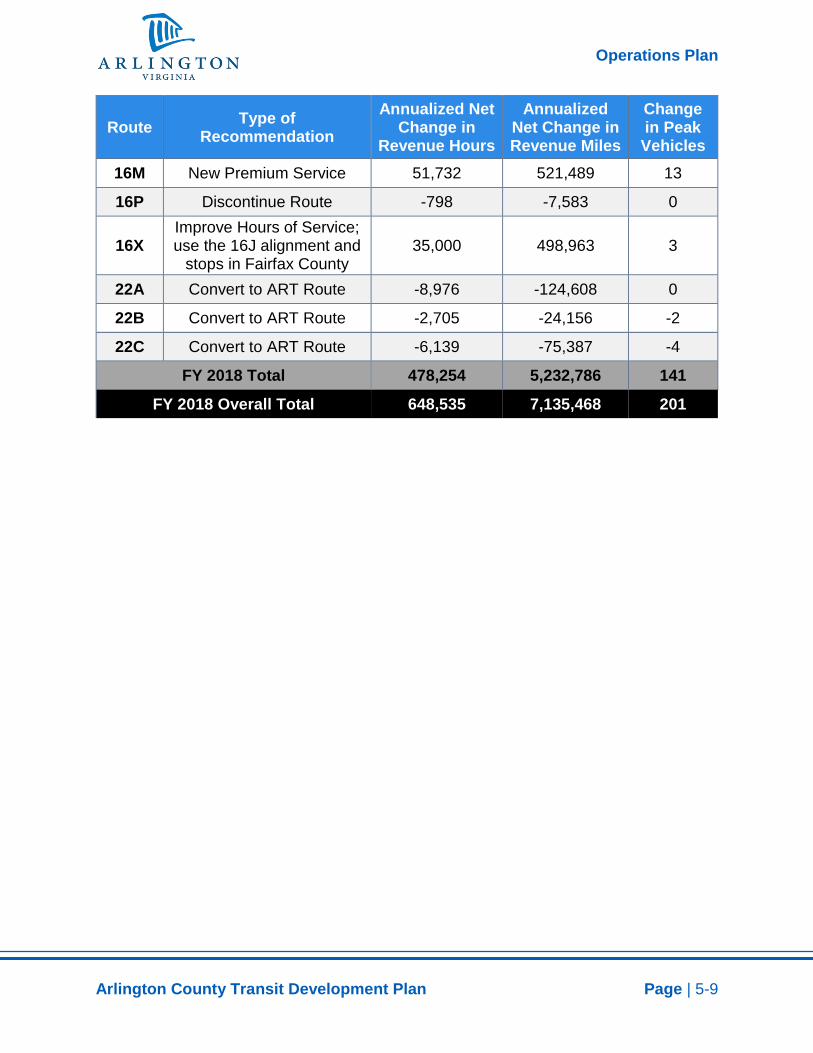
Arlington County Transit Development Plan Page | 5-9
Route Type of Recommendation
Annualized Net Change in
Revenue Hours
Annualized Net Change in Revenue Miles
Change in Peak Vehicles
16M New Premium Service 51,732 521,489 13
16P Discontinue Route -798 -7,583 0
16X Improve Hours of Service; use the 16J alignment and
stops in Fairfax County 35,000 498,963 3
22A Convert to ART Route -8,976 -124,608 0
22B Convert to ART Route -2,705 -24,156 -2
22C Convert to ART Route -6,139 -75,387 -4
FY 2018 Total 478,254 5,232,786 141
FY 2018 Overall Total 648,535 7,135,468 201
Operations Plan
Arlington County Transit Development Plan Page | 5-10
Figure 2 | Fiscal Year 2018 Service Changes
Operations Plan
Arlington County Transit Development Plan Page | 5-11
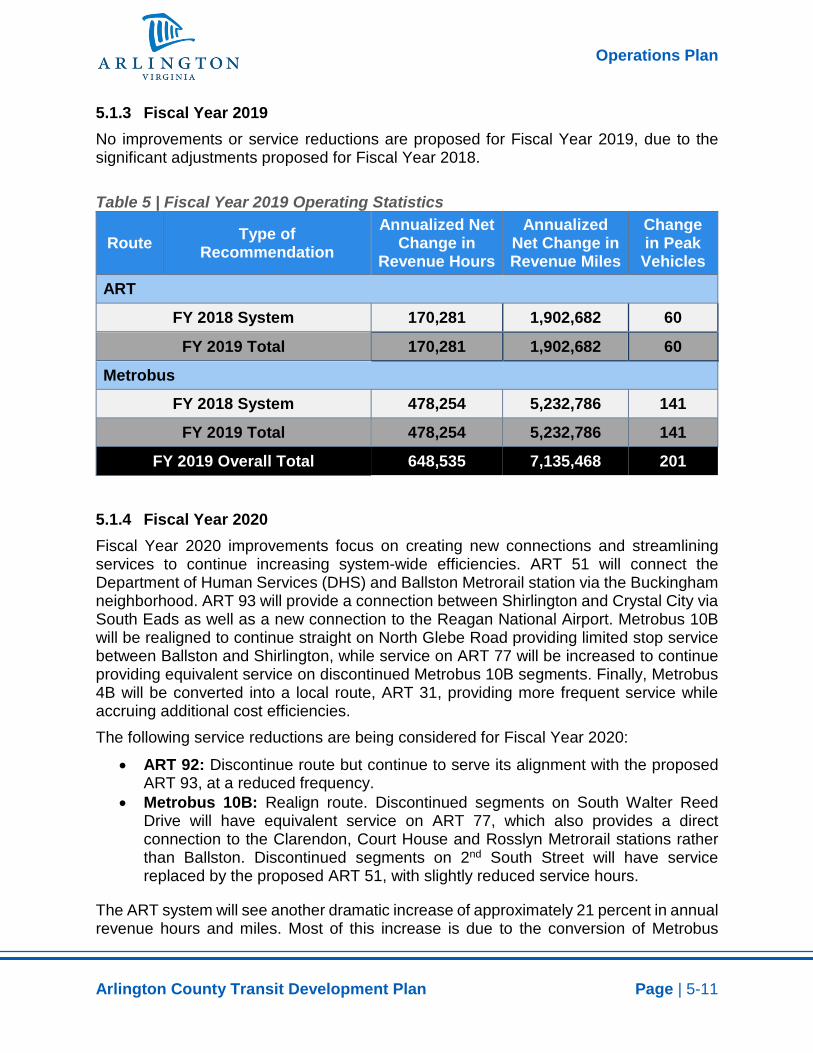
5.1.3 Fiscal Year 2019 No improvements or service reductions are proposed for Fiscal Year 2019, due to the significant adjustments proposed for Fiscal Year 2018. Table 5 | Fiscal Year 2019 Operating Statistics
Route Type of Recommendation
Annualized Net Change in
Revenue Hours
Annualized Net Change in Revenue Miles
Change in Peak Vehicles
ART
FY 2018 System 170,281 1,902,682 60
FY 2019 Total 170,281 1,902,682 60
Metrobus FY 2018 System 478,254 5,232,786 141
FY 2019 Total 478,254 5,232,786 141
FY 2019 Overall Total 648,535 7,135,468 201
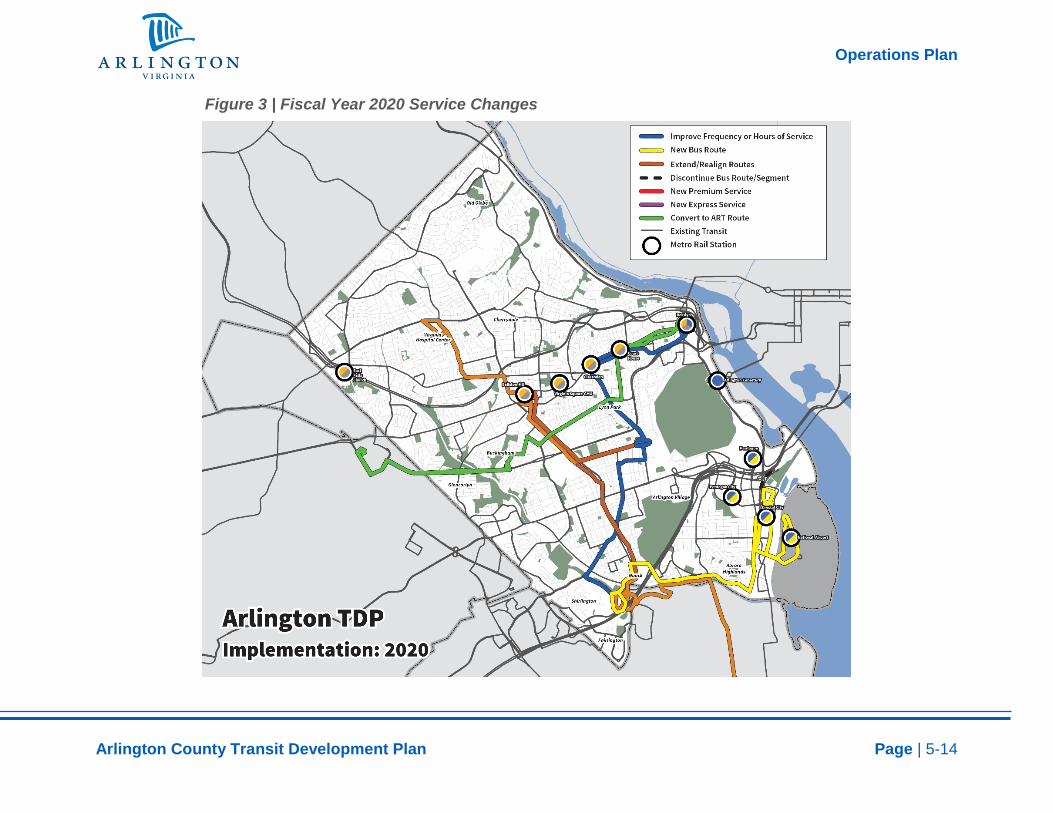
5.1.4 Fiscal Year 2020 Fiscal Year 2020 improvements focus on creating new connections and streamlining services to continue increasing system-wide efficiencies. ART 51 will connect the Department of Human Services (DHS) and Ballston Metrorail station via the Buckingham neighborhood. ART 93 will provide a connection between Shirlington and Crystal City via South Eads as well as a new connection to the Reagan National Airport. Metrobus 10B will be realigned to continue straight on North Glebe Road providing limited stop service between Ballston and Shirlington, while service on ART 77 will be increased to continue providing equivalent service on discontinued Metrobus 10B segments. Finally, Metrobus 4B will be converted into a local route, ART 31, providing more frequent service while accruing additional cost efficiencies. The following service reductions are being considered for Fiscal Year 2020:
• ART 92: Discontinue route but continue to serve its alignment with the proposed ART 93, at a reduced frequency.
• Metrobus 10B: Realign route. Discontinued segments on South Walter Reed Drive will have equivalent service on ART 77, which also provides a direct connection to the Clarendon, Court House and Rosslyn Metrorail stations rather than Ballston. Discontinued segments on 2nd South Street will have service replaced by the proposed ART 51, with slightly reduced service hours.
The ART system will see another dramatic increase of approximately 21 percent in annual revenue hours and miles. Most of this increase is due to the conversion of Metrobus
Operations Plan
Arlington County Transit Development Plan Page | 5-12
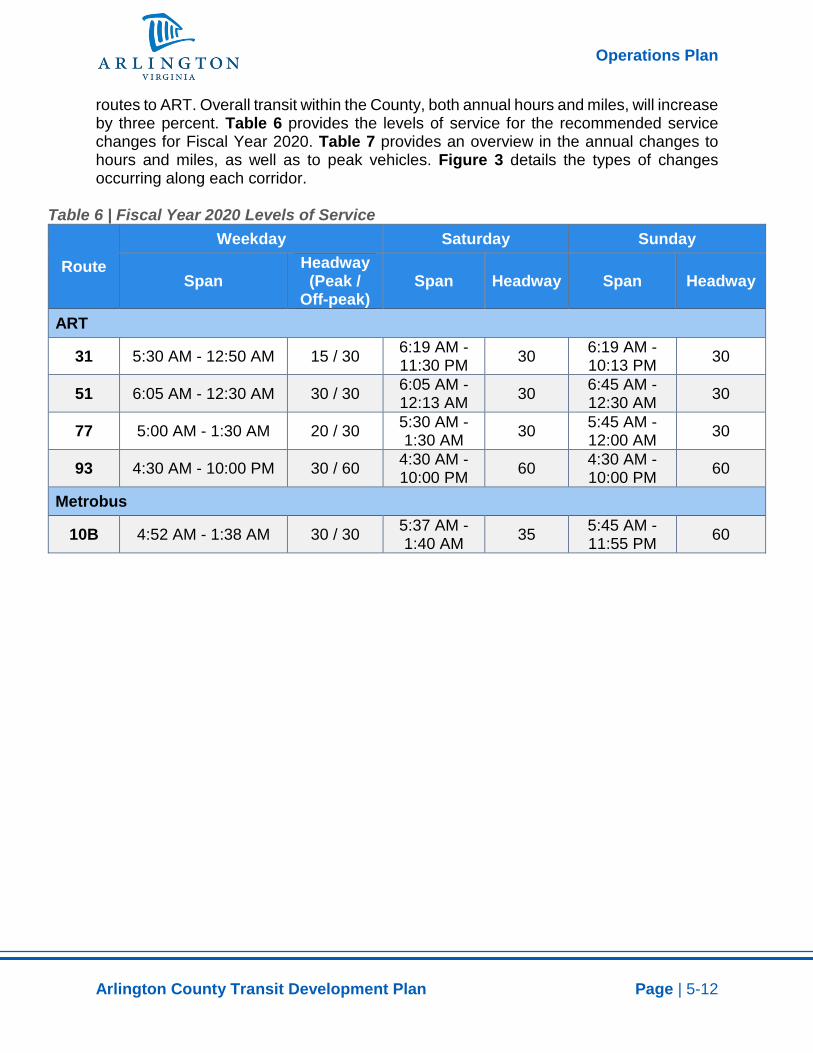
routes to ART. Overall transit within the County, both annual hours and miles, will increase by three percent. Table 6 provides the levels of service for the recommended service changes for Fiscal Year 2020. Table 7 provides an overview in the annual changes to hours and miles, as well as to peak vehicles. Figure 3 details the types of changes occurring along each corridor.
Table 6 | Fiscal Year 2020 Levels of Service
Route Weekday Saturday Sunday
Span Headway (Peak /
Off-peak) Span Headway Span Headway
ART
31 5:30 AM - 12:50 AM 15 / 30 6:19 AM - 11:30 PM 30 6:19 AM -
10:13 PM 30
51 6:05 AM - 12:30 AM 30 / 30 6:05 AM - 12:13 AM 30 6:45 AM -
12:30 AM 30
77 5:00 AM - 1:30 AM 20 / 30 5:30 AM - 1:30 AM 30 5:45 AM -
12:00 AM 30
93 4:30 AM - 10:00 PM 30 / 60 4:30 AM - 10:00 PM 60 4:30 AM -
10:00 PM 60
Metrobus
10B 4:52 AM - 1:38 AM 30 / 30 5:37 AM - 1:40 AM 35 5:45 AM -
11:55 PM 60
Operations Plan
Arlington County Transit Development Plan Page | 5-13
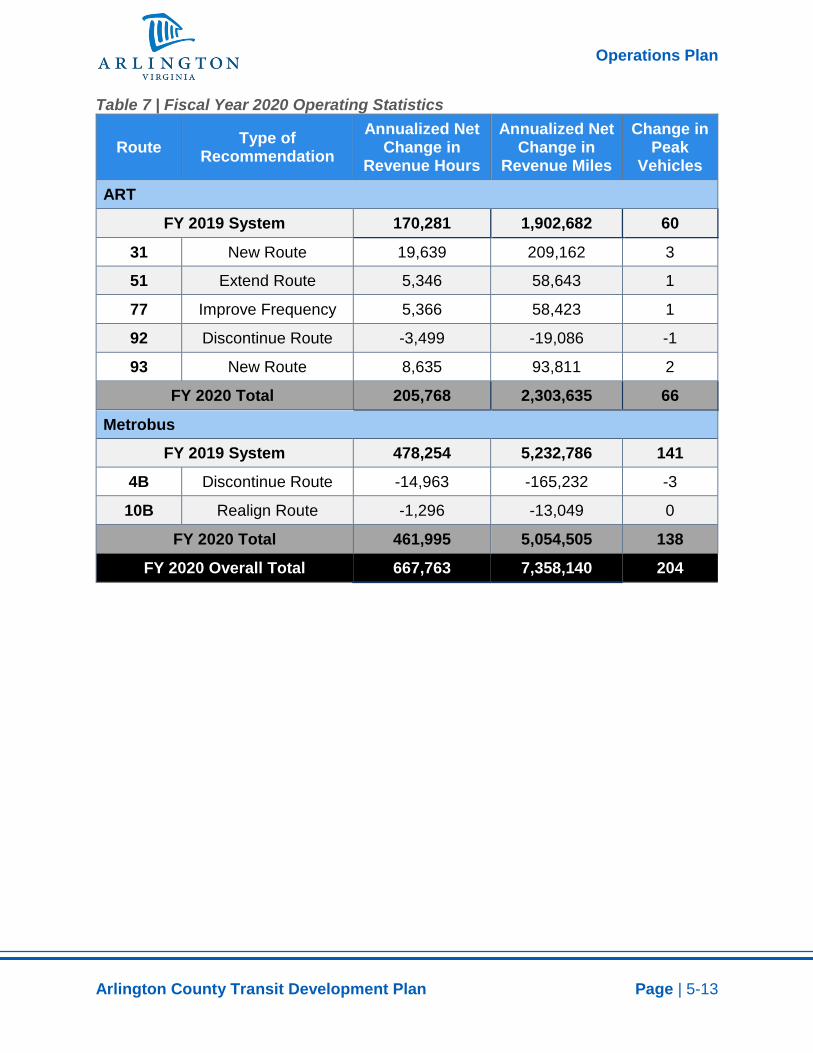
Table 7 | Fiscal Year 2020 Operating Statistics
Route Type of Recommendation
Annualized Net Change in
Revenue Hours
Annualized Net Change in
Revenue Miles
Change in Peak
Vehicles
ART
FY 2019 System 170,281 1,902,682 60
31 New Route 19,639 209,162 3
51 Extend Route 5,346 58,643 1
77 Improve Frequency 5,366 58,423 1
92 Discontinue Route -3,499 -19,086 -1
93 New Route 8,635 93,811 2
FY 2020 Total 205,768 2,303,635 66
Metrobus FY 2019 System 478,254 5,232,786 141
4B Discontinue Route -14,963 -165,232 -3
10B Realign Route -1,296 -13,049 0
FY 2020 Total 461,995 5,054,505 138
FY 2020 Overall Total 667,763 7,358,140 204
Operations Plan
Arlington County Transit Development Plan Page | 5-14
Figure 3 | Fiscal Year 2020 Service Changes
Operations Plan
Arlington County Transit Development Plan Page | 5-15
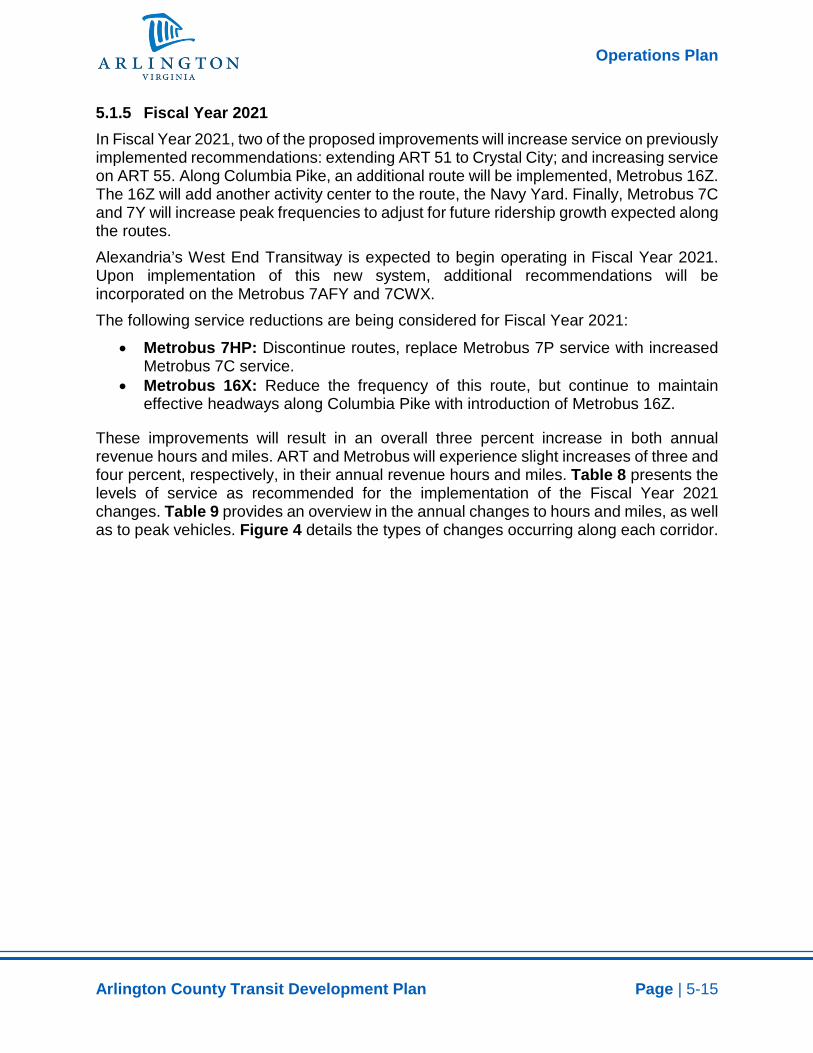
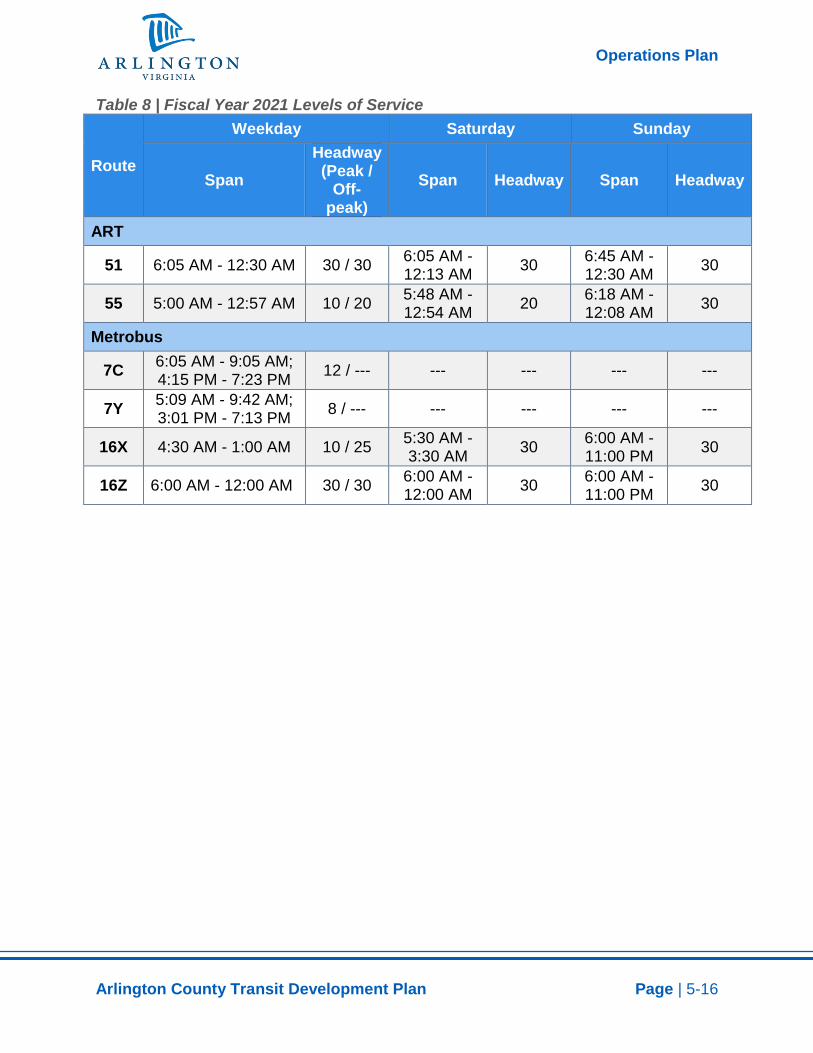
5.1.5 Fiscal Year 2021 In Fiscal Year 2021, two of the proposed improvements will increase service on previously implemented recommendations: extending ART 51 to Crystal City; and increasing service on ART 55. Along Columbia Pike, an additional route will be implemented, Metrobus 16Z. The 16Z will add another activity center to the route, the Navy Yard. Finally, Metrobus 7C and 7Y will increase peak frequencies to adjust for future ridership growth expected along the routes. Alexandria’s West End Transitway is expected to begin operating in Fiscal Year 2021. Upon implementation of this new system, additional recommendations will be incorporated on the Metrobus 7AFY and 7CWX. The following service reductions are being considered for Fiscal Year 2021:
• Metrobus 7HP: Discontinue routes, replace Metrobus 7P service with increased Metrobus 7C service.
• Metrobus 16X: Reduce the frequency of this route, but continue to maintain effective headways along Columbia Pike with introduction of Metrobus 16Z.
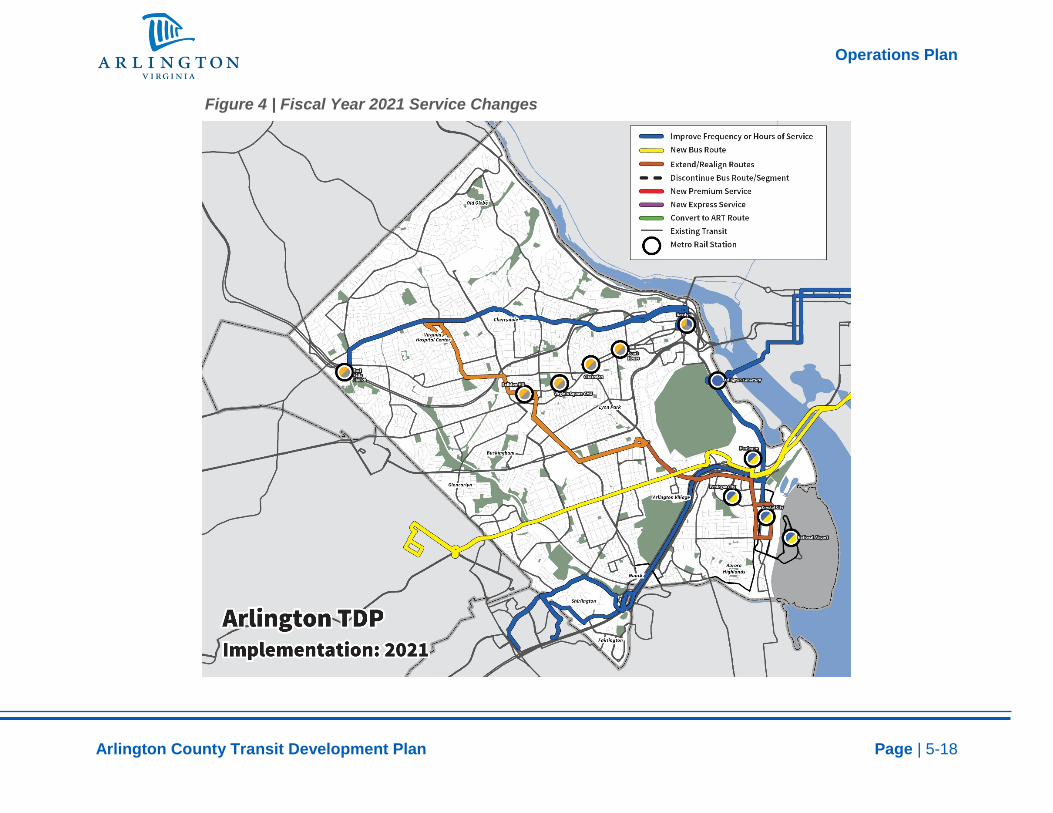
These improvements will result in an overall three percent increase in both annual revenue hours and miles. ART and Metrobus will experience slight increases of three and four percent, respectively, in their annual revenue hours and miles. Table 8 presents the levels of service as recommended for the implementation of the Fiscal Year 2021 changes. Table 9 provides an overview in the annual changes to hours and miles, as well as to peak vehicles. Figure 4 details the types of changes occurring along each corridor.
Operations Plan
Arlington County Transit Development Plan Page | 5-16
Table 8 | Fiscal Year 2021 Levels of Service
Route
Weekday Saturday Sunday
Span Headway (Peak /
Off-peak)
Span Headway Span Headway
ART
51 6:05 AM - 12:30 AM 30 / 30 6:05 AM - 12:13 AM 30 6:45 AM -
12:30 AM 30
55 5:00 AM - 12:57 AM 10 / 20 5:48 AM - 12:54 AM 20 6:18 AM -
12:08 AM 30
Metrobus
7C 6:05 AM - 9:05 AM; 4:15 PM - 7:23 PM 12 / --- --- --- --- ---
7Y 5:09 AM - 9:42 AM; 3:01 PM - 7:13 PM 8 / --- --- --- --- ---
16X 4:30 AM - 1:00 AM 10 / 25 5:30 AM - 3:30 AM 30 6:00 AM -
11:00 PM 30
16Z 6:00 AM - 12:00 AM 30 / 30 6:00 AM - 12:00 AM 30 6:00 AM -
11:00 PM 30

Operations Plan
Arlington County Transit Development Plan Page | 5-17
Table 9 | Fiscal Year 2021 Operating Statistics
Route Type of Recommendation
Annualized Net Change in
Revenue Hours
Annualized Net Change in
Revenue Miles
Change in Peak Vehicles
ART
FY 2020 System 205,768 2,303,635 66
51 Realign Route 6,429 70,533 1
55 Improve Frequency 1,889 18,887 1
FY 2021 Total 214,086 2,393,055 68
Metrobus FY 2020 System 461,995 5,054,505 138
7C Improve Frequency 1,468 19,052 2
7H Discontinue Route -184 -3,898 -2
7P Discontinue Route -812 -16,569 -1
7Y Improve Frequency 4,735 47,101 6
16X Reduce Service -11,748 -169,664 -2
16Z New Route 19,404 279,256 4
FY 2021 Total 474,859 5,209,783 145
FY 2021 Overall Total 688,945 7,602,838 213
Operations Plan
Arlington County Transit Development Plan Page | 5-18
Figure 4 | Fiscal Year 2021 Service Changes
Operations Plan
Arlington County Transit Development Plan Page | 5-19
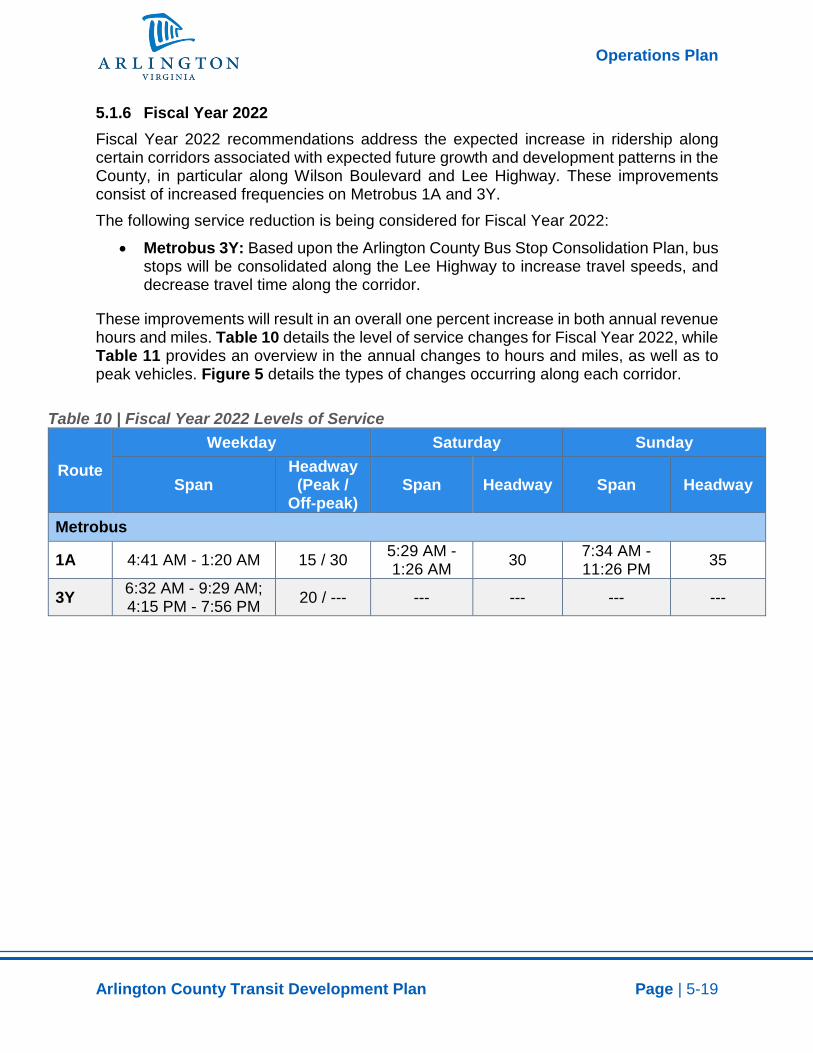
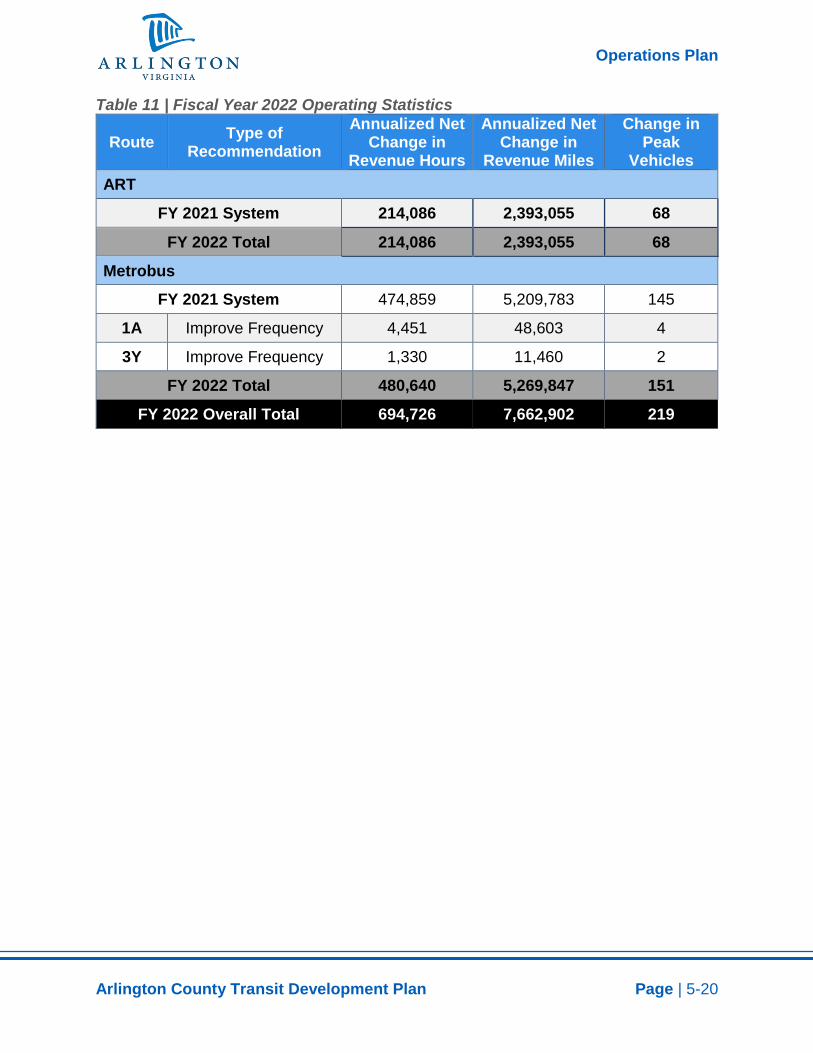
5.1.6 Fiscal Year 2022 Fiscal Year 2022 recommendations address the expected increase in ridership along certain corridors associated with expected future growth and development patterns in the County, in particular along Wilson Boulevard and Lee Highway. These improvements consist of increased frequencies on Metrobus 1A and 3Y. The following service reduction is being considered for Fiscal Year 2022:
• Metrobus 3Y: Based upon the Arlington County Bus Stop Consolidation Plan, bus stops will be consolidated along the Lee Highway to increase travel speeds, and decrease travel time along the corridor.
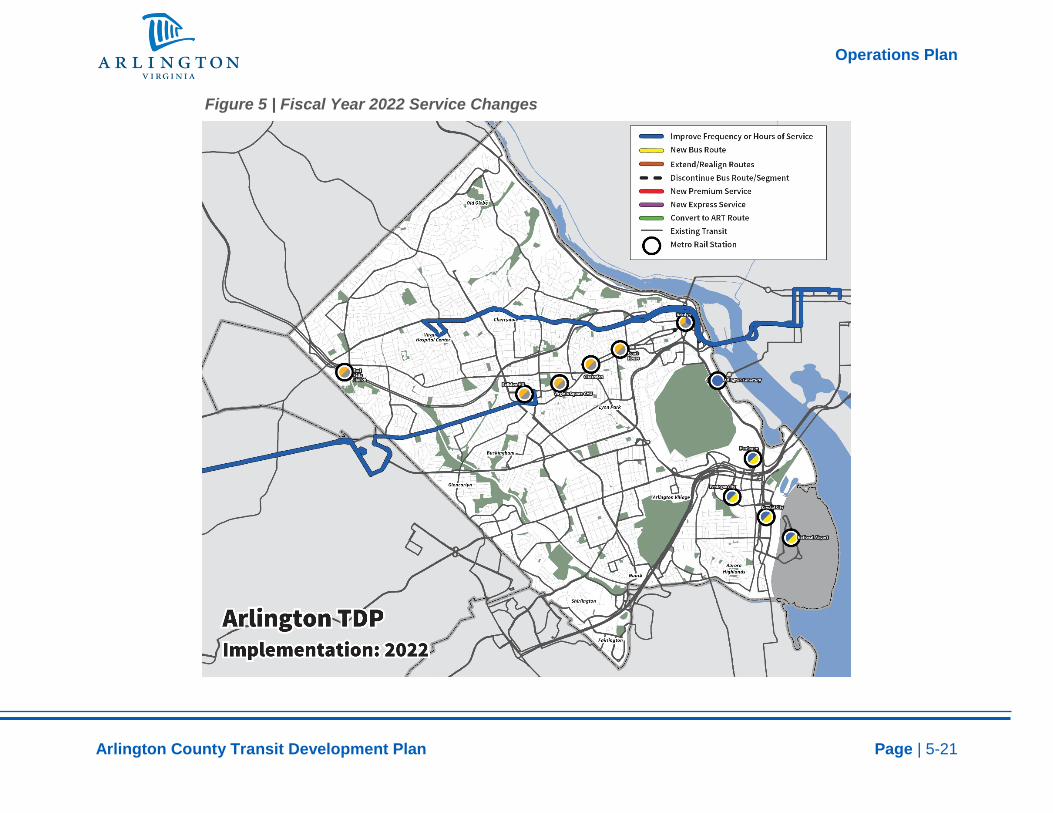
These improvements will result in an overall one percent increase in both annual revenue hours and miles. Table 10 details the level of service changes for Fiscal Year 2022, while Table 11 provides an overview in the annual changes to hours and miles, as well as to peak vehicles. Figure 5 details the types of changes occurring along each corridor.
Table 10 | Fiscal Year 2022 Levels of Service
Route Weekday Saturday Sunday
Span Headway (Peak /
Off-peak) Span Headway Span Headway
Metrobus
1A 4:41 AM - 1:20 AM 15 / 30 5:29 AM - 1:26 AM 30 7:34 AM -
11:26 PM 35
3Y 6:32 AM - 9:29 AM; 4:15 PM - 7:56 PM 20 / --- --- --- --- ---
Operations Plan
Arlington County Transit Development Plan Page | 5-20
Table 11 | Fiscal Year 2022 Operating Statistics
Route Type of Recommendation
Annualized Net Change in
Revenue Hours
Annualized Net Change in
Revenue Miles
Change in Peak
Vehicles ART
FY 2021 System 214,086 2,393,055 68
FY 2022 Total 214,086 2,393,055 68
Metrobus FY 2021 System 474,859 5,209,783 145
1A Improve Frequency 4,451 48,603 4
3Y Improve Frequency 1,330 11,460 2
FY 2022 Total 480,640 5,269,847 151
FY 2022 Overall Total 694,726 7,662,902 219
Operations Plan
Arlington County Transit Development Plan Page | 5-21
Figure 5 | Fiscal Year 2022 Service Changes

Operations Plan
Arlington County Transit Development Plan Page | 5-22
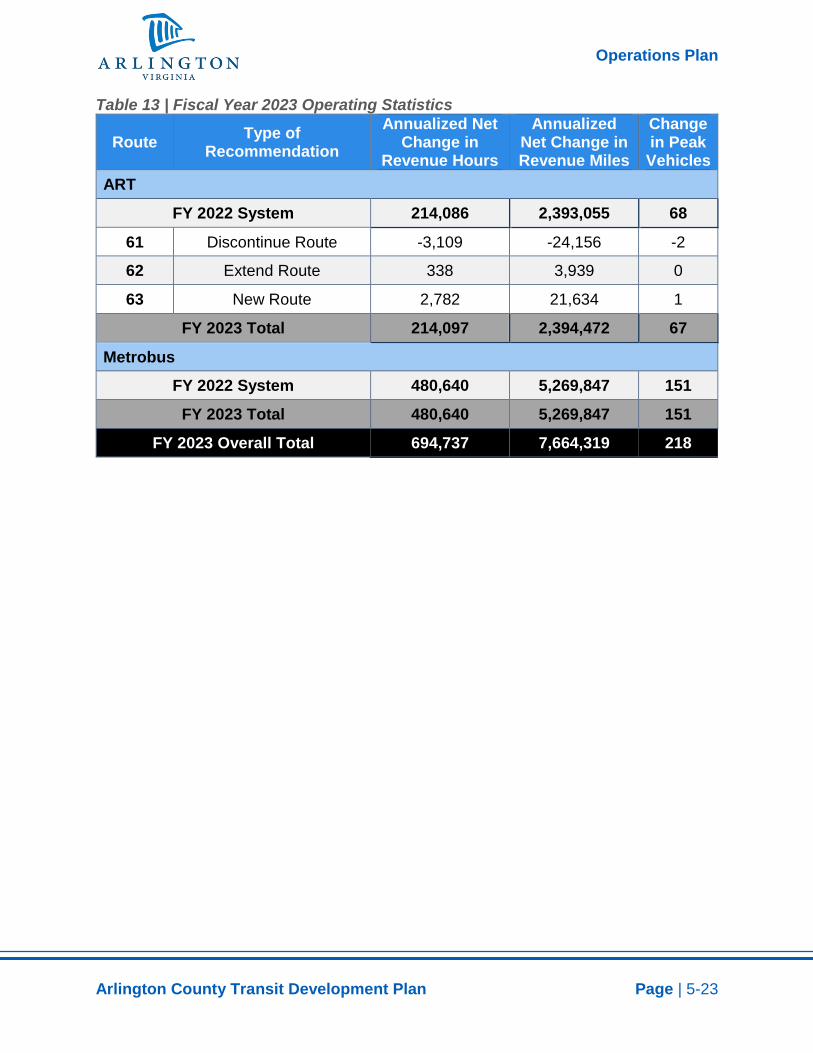
5.1.7 Fiscal Year 2023 The Fiscal Year 2023 recommendations will realign and combine routes in order to increase route productivity. This includes extending ART 62 to Rosslyn, absorbing the northern portion of the ART 61 and creating a new route, ART 63, which will connect Rosslyn with Clarendon, along 10th Street North and absorbing the southern portion of the ART 61. The following service reduction is being considered for Fiscal Year 2023:
• ART 61: Discontinue route and replace service on certain segments with ART 62 and the proposed ART 63; North Veitch Street between Wilson Boulevard and Lee Highway, and North Rhodes Street between 14th Street North and Clarendon Boulevard will no longer have any local service.
• ART 62: This route will be realigned to serve Rosslyn Metrorail Station. As as a result, local service on North Kirkwood Road between Lee Highway and Fairfax Drive will be discontinued.
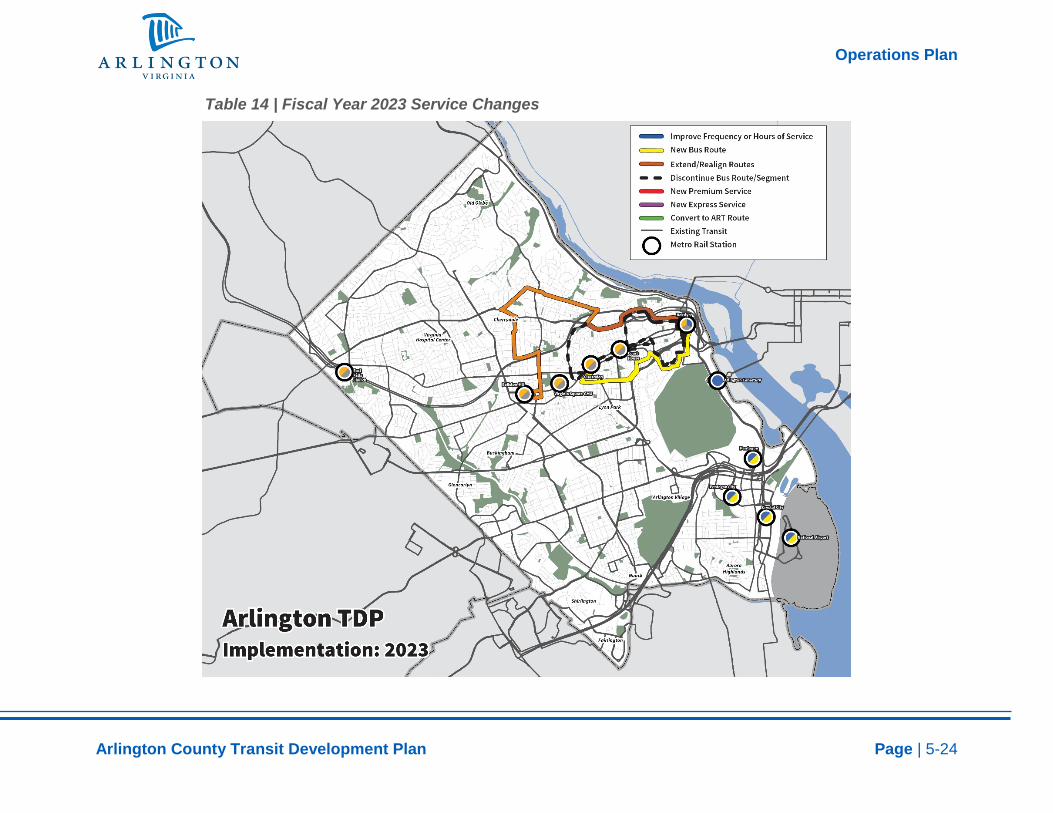
There will be no significant change in the ART or Metrobus annual revenue hours or miles. Table 12 describes the level of service changes for Fiscal Year 2023. Table 13 provides an overview in the annual changes to hours and miles, as well as to peak vehicles. Figure 6 details the types of changes occurring along each corridor. Table 12 | Fiscal Year 2023 Levels of Service
Route Weekday Saturday Sunday
Span Headway (Peak /
Off-peak) Span Headway Span Headway
ART
62 6:22 AM - 9:36 AM; 3:10 PM - 7:35 PM 30 / --- --- --- --- ---
63 6:00 AM - 9:30 AM; 3:00 PM - 7:30 PM 30 / --- --- --- --- ---
Operations Plan
Arlington County Transit Development Plan Page | 5-23
Table 13 | Fiscal Year 2023 Operating Statistics
Route Type of Recommendation
Annualized Net Change in
Revenue Hours
Annualized Net Change in Revenue Miles
Change in Peak Vehicles
ART
FY 2022 System 214,086 2,393,055 68
61 Discontinue Route -3,109 -24,156 -2
62 Extend Route 338 3,939 0
63 New Route 2,782 21,634 1
FY 2023 Total 214,097 2,394,472 67
Metrobus FY 2022 System 480,640 5,269,847 151
FY 2023 Total 480,640 5,269,847 151
FY 2023 Overall Total 694,737 7,664,319 218
Operations Plan
Arlington County Transit Development Plan Page | 5-24
Table 14 | Fiscal Year 2023 Service Changes
Operations Plan
Arlington County Transit Development Plan Page | 5-25
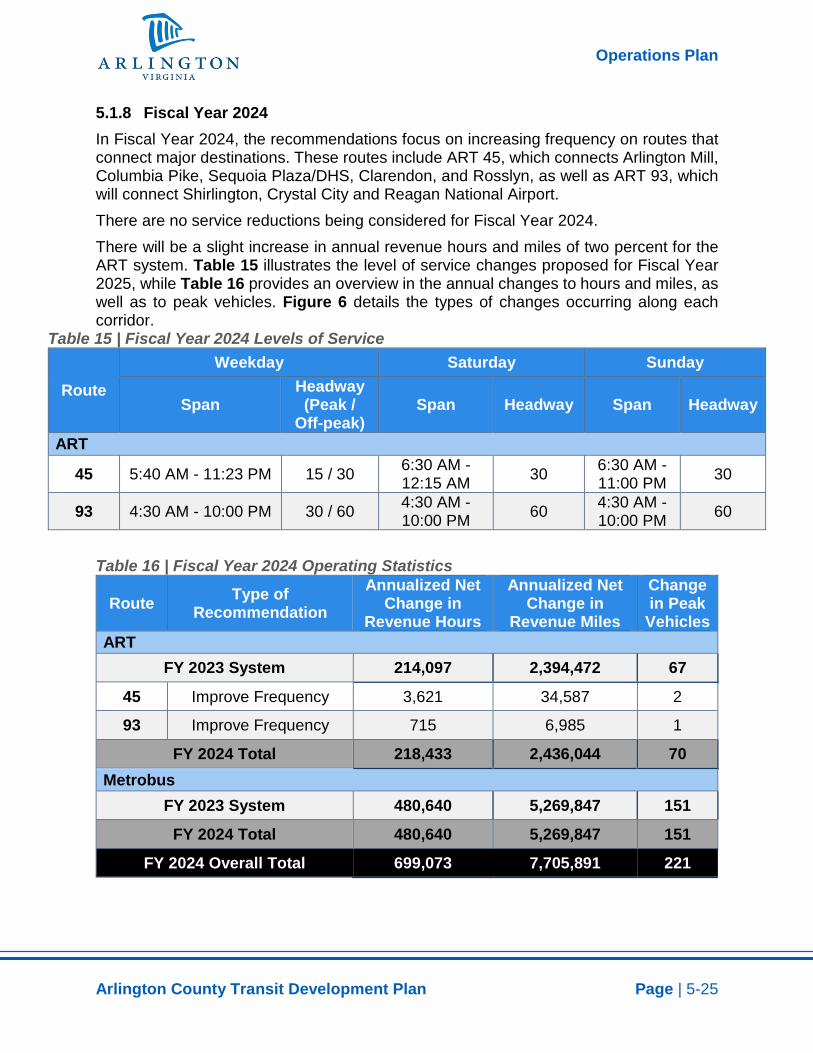
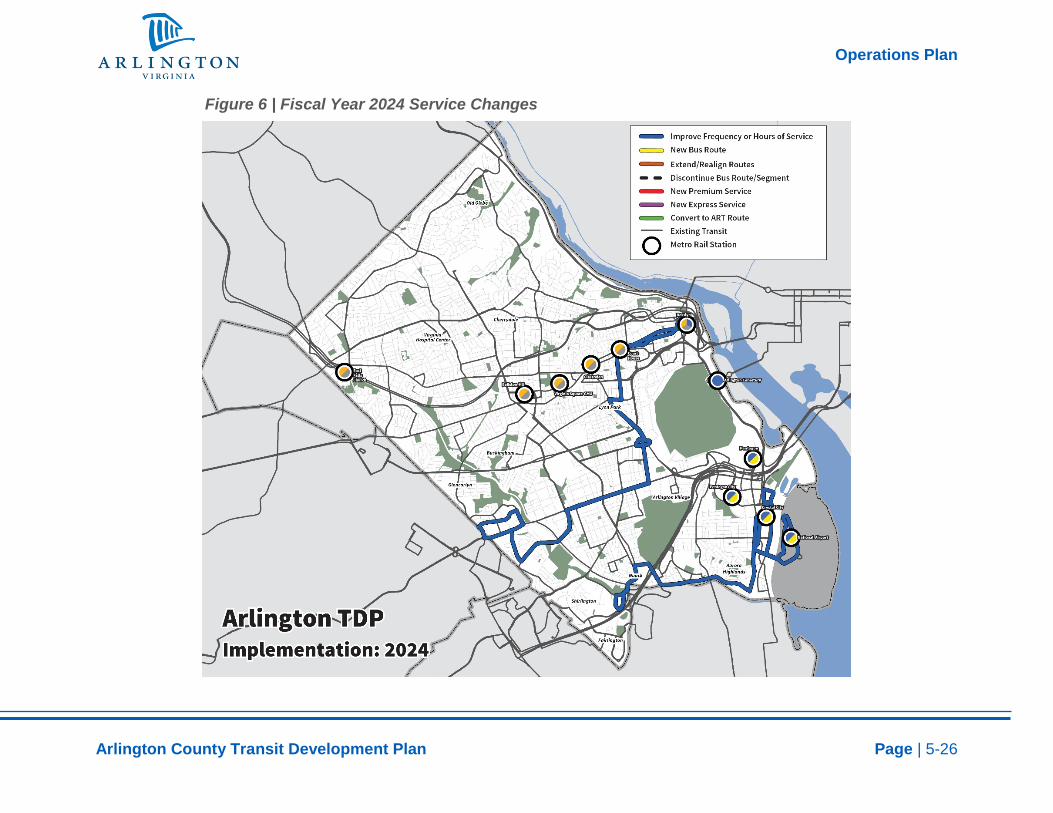
5.1.8 Fiscal Year 2024 In Fiscal Year 2024, the recommendations focus on increasing frequency on routes that connect major destinations. These routes include ART 45, which connects Arlington Mill, Columbia Pike, Sequoia Plaza/DHS, Clarendon, and Rosslyn, as well as ART 93, which will connect Shirlington, Crystal City and Reagan National Airport. There are no service reductions being considered for Fiscal Year 2024. There will be a slight increase in annual revenue hours and miles of two percent for the ART system. Table 15 illustrates the level of service changes proposed for Fiscal Year 2025, while Table 16 provides an overview in the annual changes to hours and miles, as well as to peak vehicles. Figure 6 details the types of changes occurring along each corridor.
Table 15 | Fiscal Year 2024 Levels of Service
Route Weekday Saturday Sunday
Span Headway (Peak /
Off-peak) Span Headway Span Headway
ART
45 5:40 AM - 11:23 PM 15 / 30 6:30 AM - 12:15 AM 30 6:30 AM -
11:00 PM 30
93 4:30 AM - 10:00 PM 30 / 60 4:30 AM - 10:00 PM 60 4:30 AM -
10:00 PM 60
Table 16 | Fiscal Year 2024 Operating Statistics
Route Type of Recommendation
Annualized Net Change in
Revenue Hours
Annualized Net Change in
Revenue Miles
Change in Peak
Vehicles ART
FY 2023 System 214,097 2,394,472 67
45 Improve Frequency 3,621 34,587 2
93 Improve Frequency 715 6,985 1
FY 2024 Total 218,433 2,436,044 70 Metrobus
FY 2023 System 480,640 5,269,847 151
FY 2024 Total 480,640 5,269,847 151
FY 2024 Overall Total 699,073 7,705,891 221
Operations Plan
Arlington County Transit Development Plan Page | 5-26
Figure 6 | Fiscal Year 2024 Service Changes
Operations Plan
Arlington County Transit Development Plan Page | 5-27
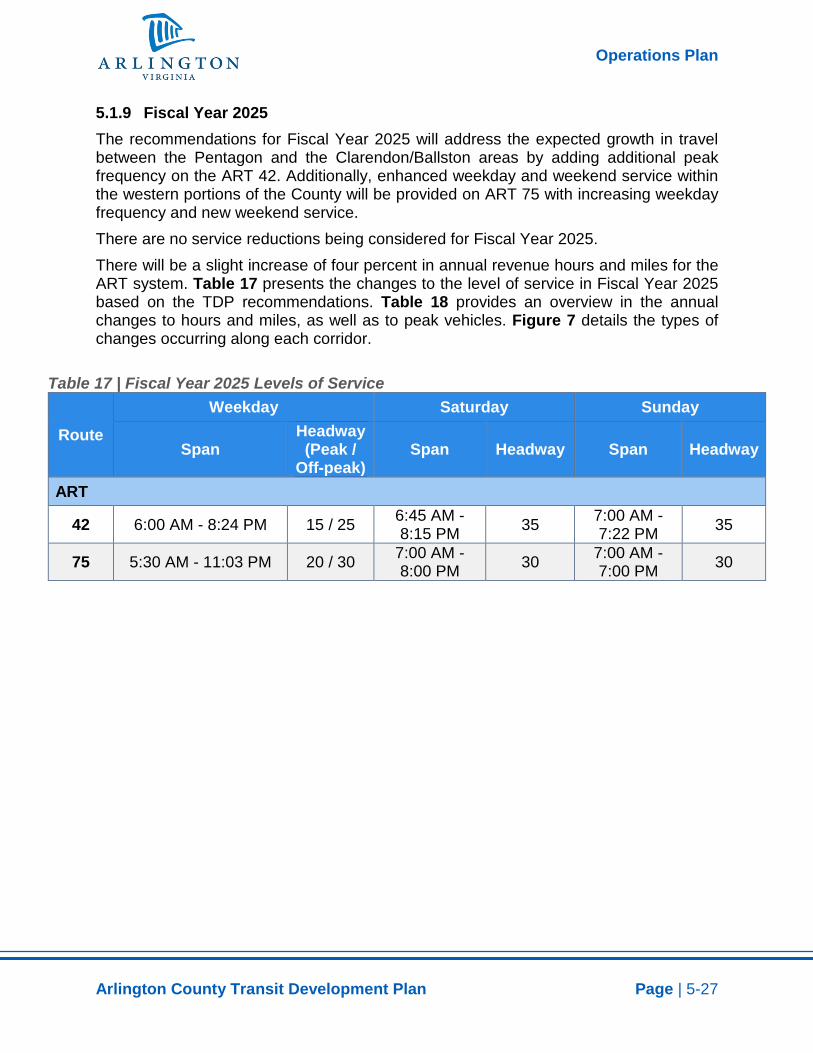
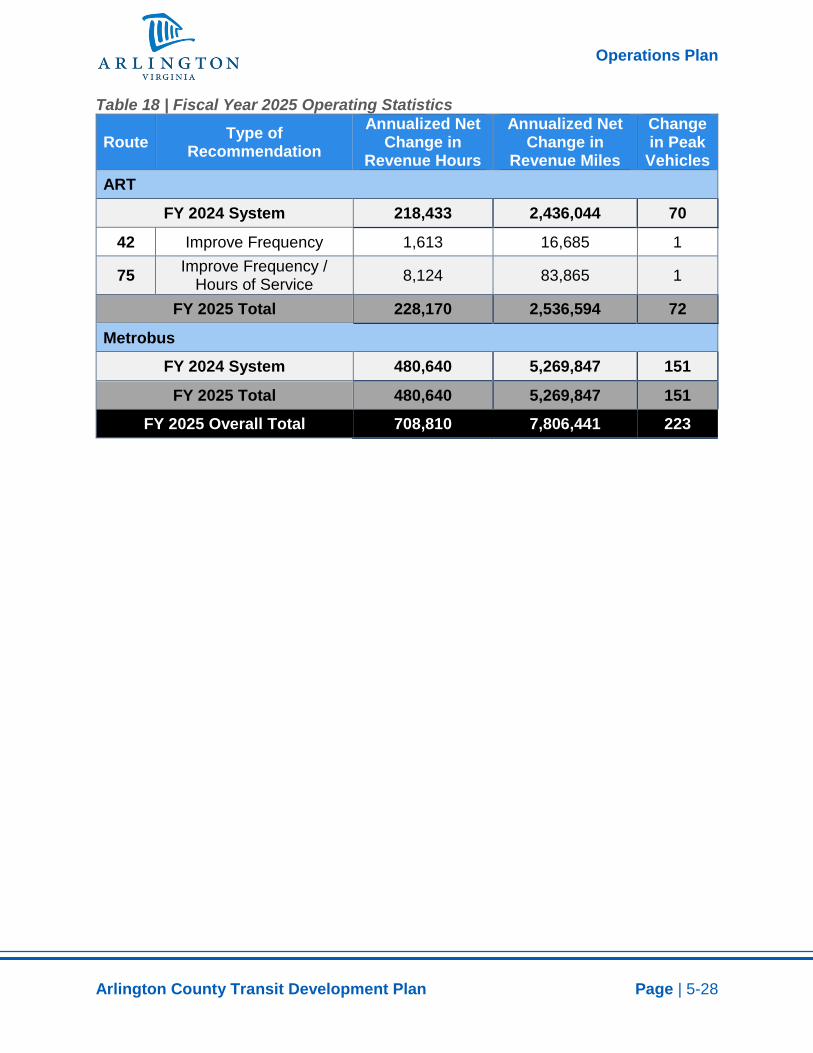
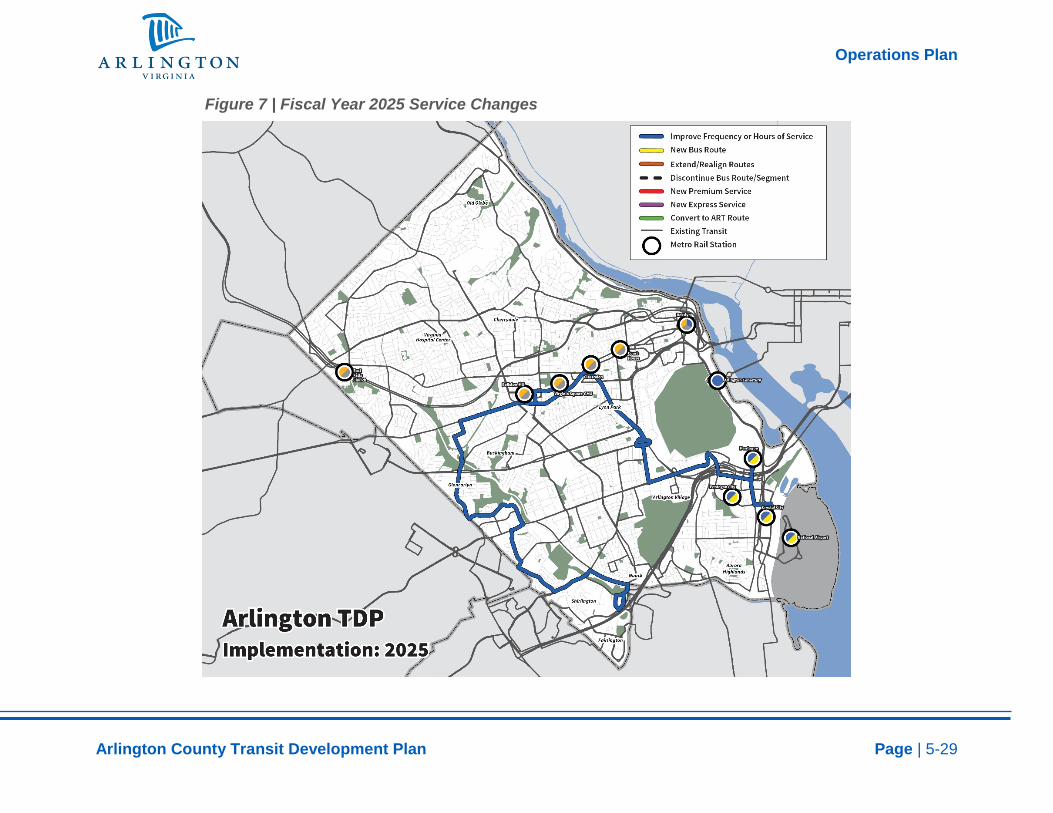
5.1.9 Fiscal Year 2025 The recommendations for Fiscal Year 2025 will address the expected growth in travel between the Pentagon and the Clarendon/Ballston areas by adding additional peak frequency on the ART 42. Additionally, enhanced weekday and weekend service within the western portions of the County will be provided on ART 75 with increasing weekday frequency and new weekend service. There are no service reductions being considered for Fiscal Year 2025. There will be a slight increase of four percent in annual revenue hours and miles for the ART system. Table 17 presents the changes to the level of service in Fiscal Year 2025 based on the TDP recommendations. Table 18 provides an overview in the annual changes to hours and miles, as well as to peak vehicles. Figure 7 details the types of changes occurring along each corridor.
Table 17 | Fiscal Year 2025 Levels of Service
Route Weekday Saturday Sunday
Span Headway (Peak /
Off-peak) Span Headway Span Headway
ART
42 6:00 AM - 8:24 PM 15 / 25 6:45 AM - 8:15 PM 35 7:00 AM -
7:22 PM 35
75 5:30 AM - 11:03 PM 20 / 30 7:00 AM - 8:00 PM 30 7:00 AM -
7:00 PM 30
Operations Plan
Arlington County Transit Development Plan Page | 5-28
Table 18 | Fiscal Year 2025 Operating Statistics
Route Type of Recommendation
Annualized Net Change in
Revenue Hours
Annualized Net Change in
Revenue Miles
Change in Peak
Vehicles ART
FY 2024 System 218,433 2,436,044 70
42 Improve Frequency 1,613 16,685 1
75 Improve Frequency / Hours of Service 8,124 83,865 1
FY 2025 Total 228,170 2,536,594 72
Metrobus FY 2024 System 480,640 5,269,847 151
FY 2025 Total 480,640 5,269,847 151 FY 2025 Overall Total 708,810 7,806,441 223
Operations Plan
Arlington County Transit Development Plan Page | 5-29
Figure 7 | Fiscal Year 2025 Service Changes

Operations Plan
Arlington County Transit Development Plan Page | 5-30
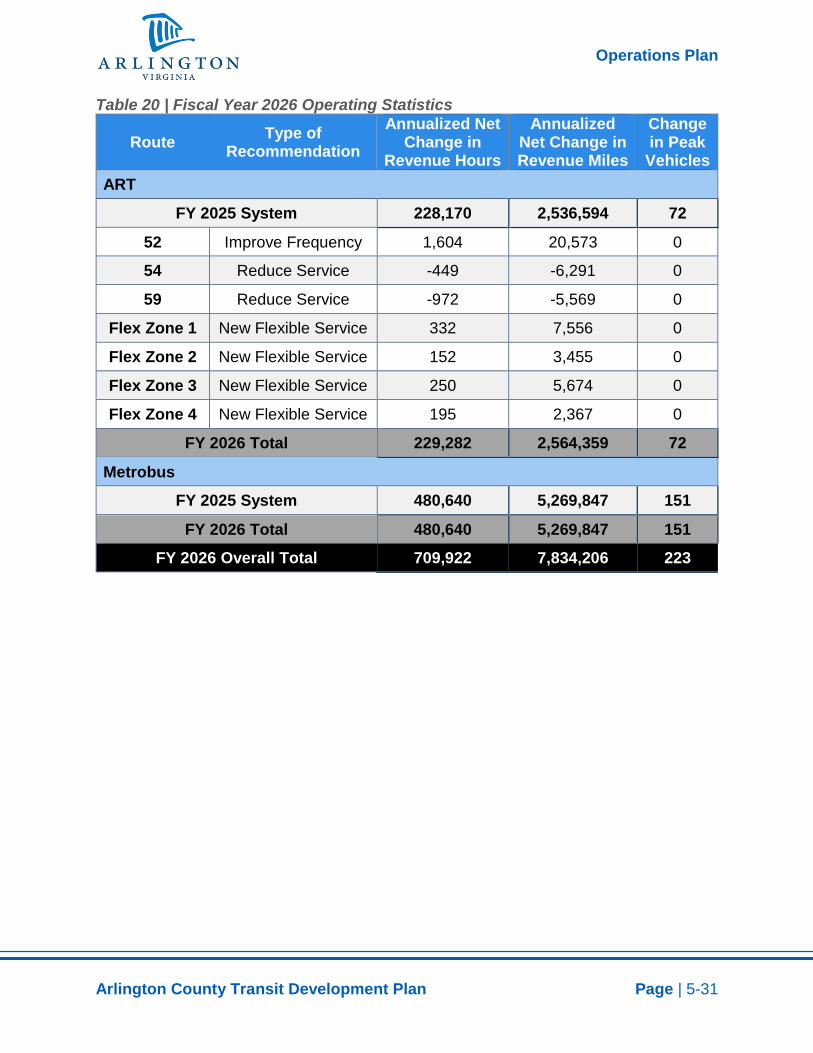
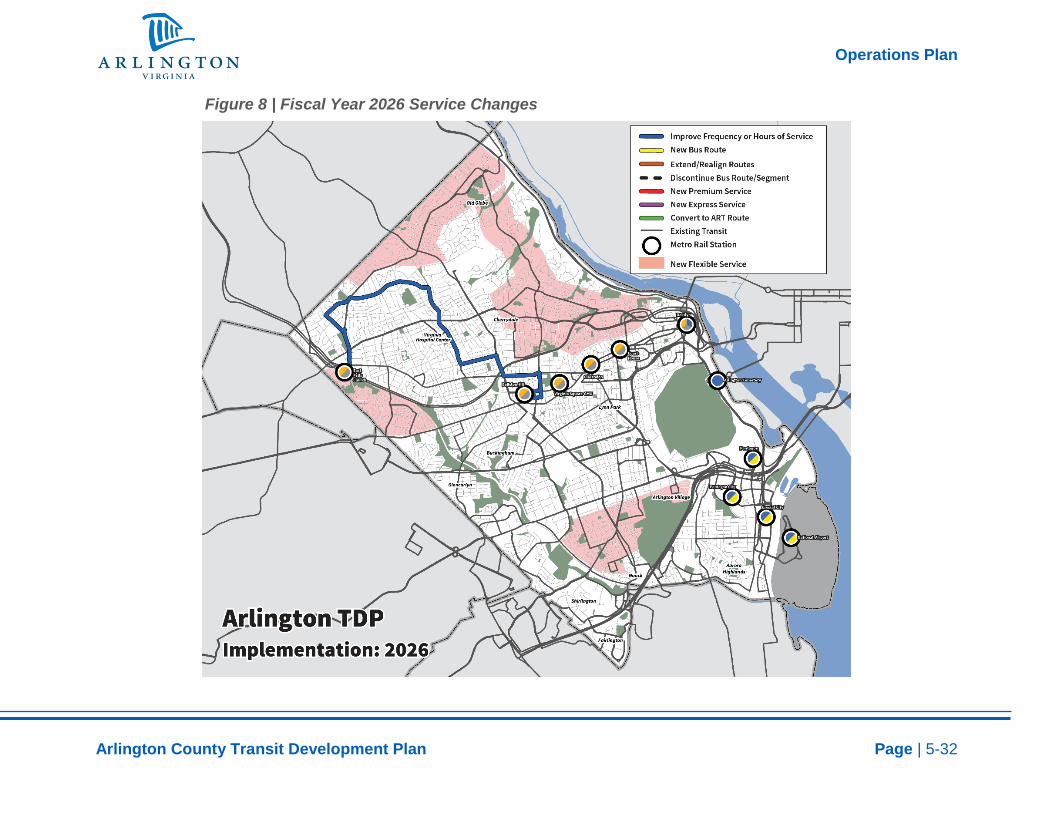
5.1.10 Fiscal Year 2026 By Fiscal Year 2026, a new service type will be introduced: the on-demand flex service. In the earlier years of the plan, the exact service mechanisms for operating this new flex service will have been determined through a focused study. The on-demand flex service will consist of four different zones which will provide midday service to lower density areas in a more cost efficient manner. The on-demand flex zones will be associated with peak hour only routes and will only provide trips to and from defined activity/transfer centers. In addition to this new type of service, additional frequency during the midday will be added to ART 52. The following service reduction is being considered for Fiscal Year 2026:
• ART 58: Service during midday will be reduced on this route and replaced by an on-demand flex zone service.
• ART 59: Service during midday will be reduced on this route and replaced by an on-demand flex zone service.
There will be a slight increase in annual revenue hours and miles of approximately one percent for the ART system. Table 19 describes the level of service changes for Fiscal Year 2026. Table 20 provides an overview in the annual changes to hours and miles, as well as to peak vehicles. Figure 8 details the types of changes occurring along each corridor.
Table 19 | Fiscal Year 2026 Levels of Service
Route
Weekday Saturday Sunday
Span Headway Span Headway Span Headway
ART
52 5:51 AM - 10:00 PM 30 / 30 --- --- --- ---
54 6:00 AM - 9:40 AM; 2:30 PM - 8:00 PM 30 / --- --- --- --- ---
59 6:00 AM - 9:30 AM; 2:30 PM - 8:00 PM 30 / --- --- --- --- ---
Flex Zone 1 9:30 AM - 2:30 PM On-demand --- --- --- ---
Flex Zone 2 9:30 AM - 2:30 PM On-demand --- --- --- ---
Flex Zone 3 9:30 AM - 2:30 PM On-demand --- --- --- ---
Flex Zone 4 9:00 AM - 3:30 PM On-demand --- --- --- ---
Operations Plan
Arlington County Transit Development Plan Page | 5-31
Table 20 | Fiscal Year 2026 Operating Statistics
Route Type of Recommendation
Annualized Net Change in
Revenue Hours
Annualized Net Change in Revenue Miles
Change in Peak
Vehicles ART
FY 2025 System 228,170 2,536,594 72
52 Improve Frequency 1,604 20,573 0
54 Reduce Service -449 -6,291 0
59 Reduce Service -972 -5,569 0
Flex Zone 1 New Flexible Service 332 7,556 0
Flex Zone 2 New Flexible Service 152 3,455 0
Flex Zone 3 New Flexible Service 250 5,674 0
Flex Zone 4 New Flexible Service 195 2,367 0
FY 2026 Total 229,282 2,564,359 72
Metrobus FY 2025 System 480,640 5,269,847 151
FY 2026 Total 480,640 5,269,847 151 FY 2026 Overall Total 709,922 7,834,206 223
Operations Plan
Arlington County Transit Development Plan Page | 5-32
Figure 8 | Fiscal Year 2026 Service Changes

Operations Plan
Arlington County Transit Development Plan Page | 5-33
5.2 Title VI Response No current or planned service improvements were developed as a direct response to the most recent Title VI Service Equity Assessment. ART has not yet had a Triennial review.
5.3 Facility Improvements The proposed projected fleet size for ART is eighty-five (85) buses in 2026. The maintenance requirements of a fleet of this size are typically accommodated in a single facility located with the fleet parking. As a general rule, most agencies support maintenance operations at a single facility until the total fleet count is above 200 buses. This is different at Arlington County where it is nearly impossible to find a single property large enough to accommodate the entire fleet plus a maintenance facility. The Arlington County maintenance program will be split to address the multiple bus parking locations. A single bay facility will be located at the South Eads Service Center and will be used to perform minor maintenance on the forty plus buses stored there. The remainder of the maintenance activities will occur at a new facility on a yet to be determined site. The programmatic requirements for the new facility are based on the fleet size, fleet mix, and maintenance practices of the County. A maintenance facility sized to support the projected fleet is approximately 22,510 square feet. The total area is divided into the following functions:
• Administration: offices and workstations for maintenance administrative staff at just over 1,020 square feet;
• Repair Bays: 9 repair bays, one chassis wash bay and one body bay at a total of 13,200 square feet;
• Shops: common work areas, tire shop and electronics shop at 480 square feet; • Support Areas: areas such as battery rooms, tool box storage, etc. at 2,600
square feet; • Personnel Areas: Mechanic’s lunchroom and locker areas at 1,380 square feet;
and • Parts Storeroom: parts storage at 3,830 square feet.