Embed Size (px)
Citation preview
Chapter 5
Experimental Details
The measurements that have been performed are the fusion excitation function
spanning the energy range around the barrier and back angle (Blab = 180°) quasi
elastic scattering excitation function also in the same energy range. As we saw in
chapter 2 fusion is defined as the formation of the compound nucleus which decays
subsequently. Since the compound nucleus is short lived, only the decay products can
be detected to estimate the cross section of the formation of the compound nucleus.
The detection of all the decay products like 1'-rays, X-rays, charged particles and
the final evaporation residue have been used successfully to estimate fusion cross
sections. Each technique has its own merits and demerits. In our work we have
measured the evaporation residues using a recoil mass separator to estimate the
fusion cross section. Measurements of quasi-elastic and elastic cross sections are
generally made by detecting the scattered projectile like particles. However, extreme
backward angle measurement (near to 180°) are very difficult because of the presence
of the beam. These measurements can be performed by detecting the corresponding
target like particles going in the forward direction with some device to filter out the
beam. We have performed quasi-elastic scattering measurements at a laboratory
angle of 180° by detecting the recoiling target like particles after rejecting the beam
using the recoil mass separator, HIRA.
The experiments reported in this thesis were performed using the beams provided
82
Experimental Details 83
by the 15UD, 16 MV Pellet ron accelerator at the Nuclear Science Centre (NSC), New
Delhi, India. The Pelletron is a tandem Vande Graf accelerator the details of which
are discussed in [I, 2]. Pulsed beams were used for all the measurements. This was
required for the time of flight measurements which were employed to measure very
low cross sections. The recoil mass separator HIRA (Heavy Ion Reaction Analyser)
[3] was used in all the measurements the details of which are discussed in the next
section.
5.1 The Heavy Ion Reaction Analyser
The Heavy Ion Reaction Analyser (HIRA) is a large solid angle online mass separator
for the reaction products preserving their kinematic correlations. It is designed to
effectively separate the nuclear reaction products of interest from the elastically
scattered beam, dispersing them with good mass resolution at its focal plane with
energy and space focusing. This is ideal for studying reactions which are forward
peaked and has good application in the study of fusion and transfer reactions around
the Coulomb barrier, spectroscopy by residue tagging etc. The HIRA has an energy
acceptance of ±20 % and mass acceptance of ± 5%. The distance from the target
position to the focal plane is ~ 8.5 m and the transport time of ions through HIRA
is of the order of a fraction of J1S to a few J1S depending on the energy of recoils.
The Configuration - The electromagnetic configuration of HIRA is QQ-ED-M
MD-ED-QQ. Here QQ stands for the quadrupole doublet, ED for the electrostatic
dipoles, MD for the magnetic dipole and M for the multipoles. The first order
performance of the system is given by six parameters: the bending radii and angles
of the ED's (PE,OE) and the MD (PM, OM), the separation (d) between the effective
field boundaries of the ED and MD and the angles (a) of the entrance and exit pole
faces of the MD. A list of the relevant parameters of HIRA is given in Table f).L
Further details about the various components can be found in Ref. [3].
One of the specialties of HIRA is the provision for rotation about a fixed axis.
Experimental Details
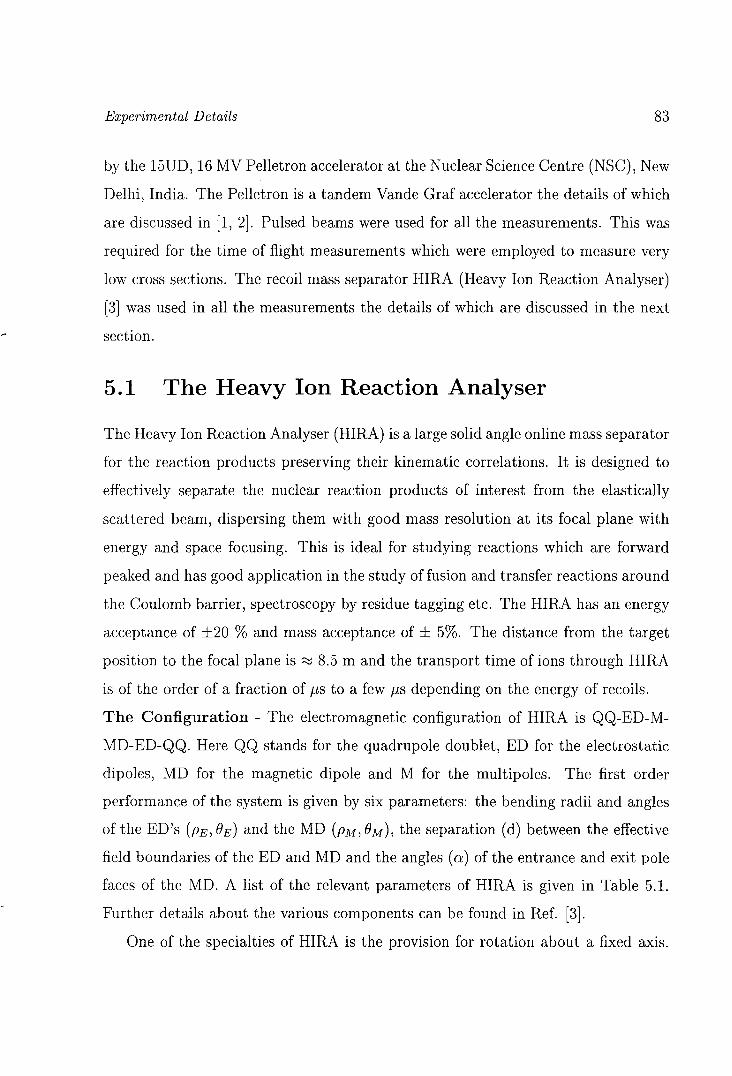
Parameter
Quad Q1 Leff Aperture rad. of Q1 and Q2 Max. gradient of Q1 and Q2 Quad Q2 Leff ED1 and ED2: Bending radius Bending angle Electric rigidity Plate separation Magnetic Dipole (MD): Bending radius Bending angle Magnetic rigidity Entrance and exit shim angles Radii of curvature of entrance and exit EFBs Pole gap Pole width Q3-Leff Aperture radius (Q3,Q4) Max. gradient (Q3,Q4) Q4-Leff Multipole (max. fields at x = 100 mm): Quadrupole Sextupole Octupole Leff Max. solid angle: With bE = bM = 0% With bE = ±10% and bM = ±5%
Design Value
300 mm 60 mm 10 T/m 230 mm
5m 16° 15 MV /q 150 mm
0.86 m 36° (36.3)° 48.5 MeV-amu/q2 7°,(7.2°),7°,(7.4°)
2.33 m 80 mm 600 mm 325 mm 75 mm 6.5 T/m 430 mm
185 G 90 G 60 G 300 mm
11.3 (10) msr 9.3 msr
84
Table 5.1: List of relevant parameters of the Heavy Ion Reaction Analyser (HIRA)
Experimental Details 85
The HIRA can be rotated from angles -150 to +400 maintaining very high vacuum.
This is achieved with the help of the sliding seal scattering chamber. Typical vacuum
which can be obtained in the chamber is of the order of 10-7 Torr. The chamber
has an inner diameter of 300 mm and a height of 200 mm and having a movable top
lid. The target ladder is mounted through the ports provided in the top lid.
5.2 The Detector Setup
The detector setup consists of detectors used at the focal plane of HIRA and the
monitor and other detectors mounted in the scattering chamber.
5.2.1 The Focal Plane Detector System
The recoil mass separator focuses the reaction products at the focal plane after
dispersing them according to their m/q values. Thus different m/q groups will
be focused at different positions of the focal plane. These reaction products can
be identified with the help of detectors which can give both position and energy
information. They can either be gas detectors or solid state detectors. For heavy
ion detection, gas filled detectors are better suited because of the flexibility in the
geometry and also due to less susceptibility to radiation damage. But they have poor
energy resolution compared to solid state detectors and the ion detection becomes
difficult especially at lower energies. The solid state detectors have the advantage
of better energy resolution and can also be used for detection of ions of very low
energy. In our experiments we have used a large area position sensitive silicon strip
detector.
The Silicon Strip Detector:- The large area silicon strip detector used in the
experiments is a 50 mm x 50 mm active area detector supplied by the Micron
Semiconductors, England. This detector having the X-lOOO design has 16 strips of
3mm width each in the V-plane and a resistive layer in the X-plane. The detector
has a thickness of 1000 microns. Each strip has two outputs, one at each end of the
Experimental Details
E
, ........ • '.I~' . ~~.r. '" , ,
..
_ .. 'II.
A:. '" .'
. ,
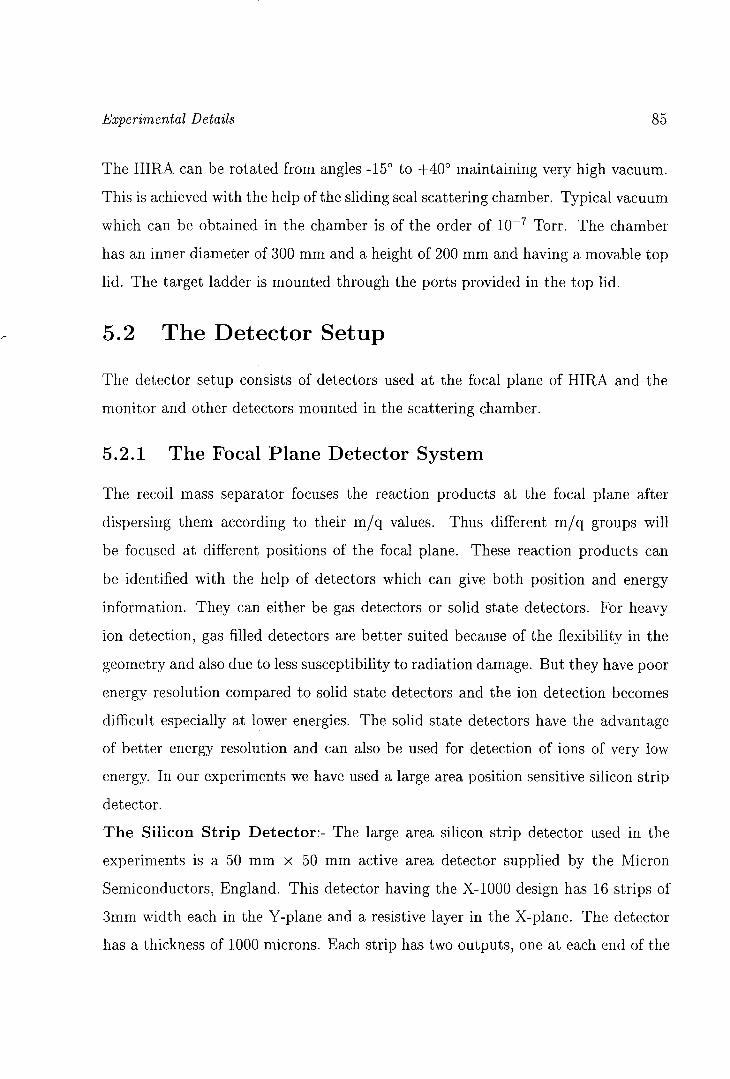
32S + 120Sn (fusion)
" , I '. I ••
"\ , • .- II ••
,:'): ' ,
. ":!:/;" '.,' : I •
"~.:':-I.'· I . ':. ,
" .. " .... ,.' ... "''\ .1., . ,_ . I' '. I. ,: ... ' ~I.. ' ..
..
0, ;I"~"" •. :. ~.":". :~ '0: .' • .. "': I'" ,#1--:'.:
• II .,., ... I.~/.!:...... . . ,'" ".~':'. " ....
I' - .... ," II:" .. ... .".-:,'. "o,.!.···., ;:..~ .. ;.,.; ... ~
I, II ,- ... ,} ,",' II II • I 1,4 I
• ... ". - : J'; ....... I ..
. .. '.'
• • I " - I .. : .,. • "" 0, I
~ I " • :a. '':. i.::' .' ' ... 0 •• _. " ." • ." • •
• "., '/ , ",,:;fr'·, -;', ,,', , RF-TAt
86
"
Figure 5.l: A typical two dimensional plot ofTOF vs Energy at a very sub-barrier energy. A clear separation of the ER's from the background can be seen.
strip, that makes a total of 32 connectors. Apart from this there is a connector to the
back plane which is the cathode and another connector to the PCB ground. The bias
is applied to the cathode. A 34 pin ribbon cable connector is used as the interface.
The energy signal is obtained from the back plane connector and the position signal
is obtained from one end of each of the strips after grounding the other end with a
zero ohm terminator. Since in experiments with HIRA we are interested in getting
a continuous position, the detector was used in a different configuration. In this
case, all the 16 strips were shorted at both the ends thereby making the detector
a square wafer of active area 50 mm x 50 mm. In this configuration the total
energy is taken from the back plane and the position information from one of the
shorted ends after grounding the other end. The detector was used with positive
bias voltage in the range 30 - 60 Volts with leakage currents varying from 0.35 to 0.56
Experimental Details 87
p,A. The preamplifier used in the biasing circuit was 142B (ORTEC) with 10 MO
input impedance.
5.2.2 The Four Monitor Detector Arrangement
Monitor detectors are generally used for beam flux normalisation and beam monitor
ing. In normal measurements a single or two detectors are used for beam monitoring.
But in high precision cross section measurements, there is a need for more accurate
beam monitoring in order to lock the beam spot on the target in both x and y di
rection. To achieve this a set of four monitor detectors was used. All four detectors
were kept out of plane of the beam at an angle of 20° thereby giving a reaction
angle of 28°. At this angle the scattering is totally Rutherford which is essential
for normalisation purposes. The monitor detectors used were silicon surface barrier
detectors with 100 micron thickness and 100 mm2 active area. A collimator of 3
mm diameter was used for the detectors.
5.3 Other Experimental Details
5.3.1 Target
The target used for the experiment were thin foils of enriched Sn isotopes - 112Sn
(96.3 % enriched), 116Sn (99 %), 120Sn (98 %). Thin targets were used so as to
minimise the energy and angular straggling effects for the recoils and also for the
incident beam. The thickness of the targets used was 77 p,g / cm2 , 85 p,g / cm2 and
50 p,g / cm2 for the 112Sn, 116Sn, 120Sn targets respectively. All targets were evapo
rated on carbon backing of ~ 10 p,g/cm2 . The thickness of the targets and carbon
backing was measured using the energy loss of 5.486 Me Va-particle through the
foil.
Experimental Details
E
,; .... .. . :.
':' I ,,'.' -' I-, ..
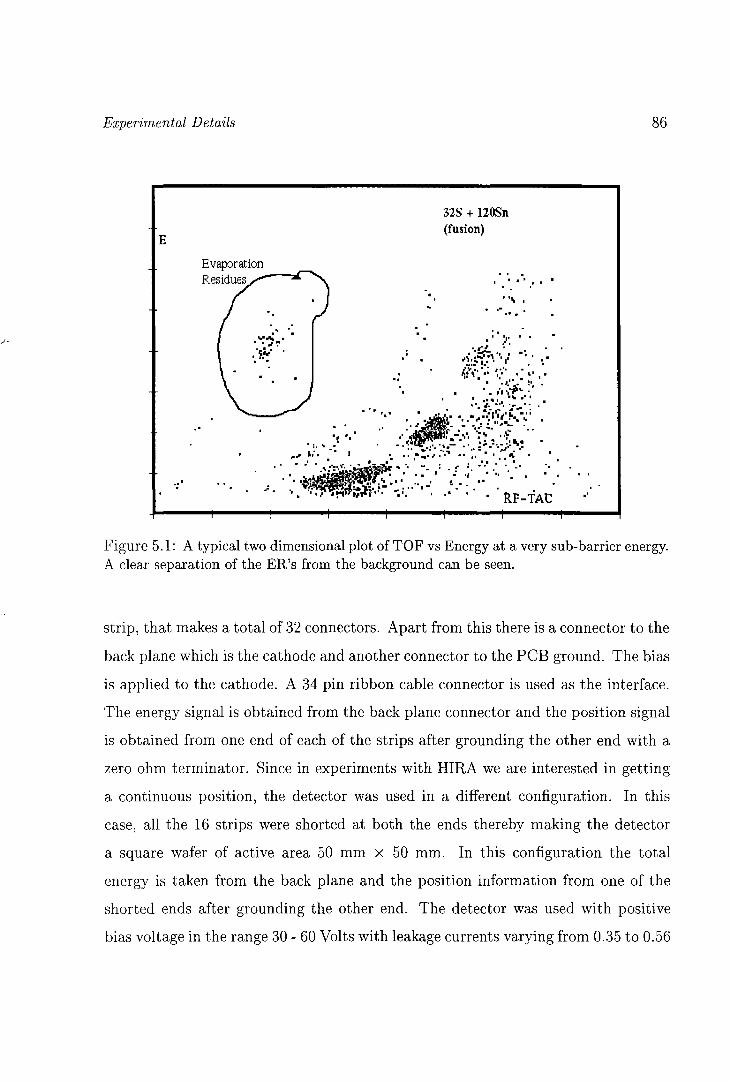
160 + 120Sn (quasi-elastic scattering)
~ .... , ' .. ... . . . .. ,." , .. ' ..
Recoils
.;1 Ji. :;f6 . '.
"': . .. .
'00,' • . : .
II .'
. ~ .. ~.~ ••. . . • " ~-w. '.
. ~ .. ...I .: .... ..iI .. . '. ."', -' " .... :' .
n' . .
88
Figure 5.2: A two dimensional plot of TOF vs Energy for the quasi-elastic scattering for 16 0 + 120Sn. The recoiling target like particles are clearly separated from the the background.
5.3.2 Time of Flight Measurement with Pulsed Beam
In our measurements we have used pulsed beam instead of DC beam. The pulsed
beam given by the Pellet ron normally has a repetition rate of 250 ns. For our
measurements we employed the TWD (Traveling Wave Deflector) to chop off the
intermediate pulses to get repetition rates of even multiples of 250 ns. This pulsed
beam was used to record the time of flight for the reaction products through HIRA.
The length of HIRA is nearly 8.5 m so the flight time of the recoils through HIRA
roughly ranges from 1 f1s to 4 f1S. The repetition rate of the beam was chosen to
be more than the flight time of the recoils. In a two dimensional plot of energy
vs time of flight a clear separation was seen between the evaporation residues and
elastically scattered beam. This was effective even in the case when the ER energy
Experimental Details
Sc. Chamber
Beam - - --
Target
Monitor
CRF SADA EDt ED2
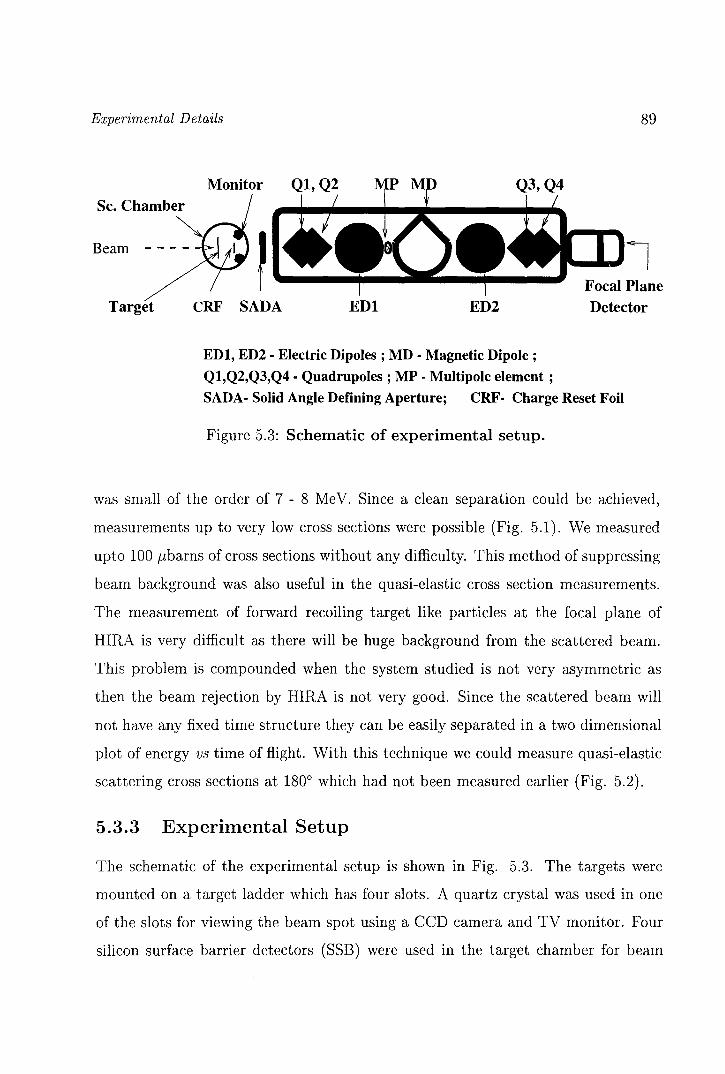
EDt, ED2 - Electric Dipoles; MD - Magnetic Dipole; Qt,Q2,Q3,Q4 - Quadrupoles ; MP - Multipole element;
89
Focal Plane Detector
SADA- Solid Angle Defining Aperture; CRF- Charge Reset Foil
Figure 5.3: Schematic of experimental setup.
was small of the order of 7 - 8 MeV. Since a clean separation could be achieved,
measurements up to very low cross sections were possible (Fig. 5.1). We measured
upto 100 f-Lbarns of cross sections without any difficulty. This method of suppressing
beam background was also useful in the quasi-elastic cross section measurements.
The measurement of forward recoiling target like particles at the focal plane of
HIRA is very difficult as there will be huge background from the scattered beam.
This problem is compounded when the system studied is not very asymmetric as
then the beam rejection by HIRA is not very good. Since the scattered beam will
not have any fixed time structure they can be easily separated in a two dimensional
plot of energy vs time of flight. With this technique we could measure quasi-elastic
scattering cross sections at 1800 which had not been measured earlier (Fig. 5.2).
5.3.3 Experimental Setup
The schematic of the experimental setup is shown in Fig. 5.3. The targets were
mounted on a target ladder which has four slots. A quartz crystal was used in one
of the slots for viewing the beam spot using a CCD camera and TV monitor. Four
silicon surface barrier detectors (SSB) were used in the target chamber for beam
Experimental Details
'----{liW'ii1- - - - - - -_____ I
'-----!fiLt'!1- - - - - I I I - - -, I I I
I I I I I I I I I I I I I I I
I I
~~W
90
To Computer AMAC -:::» -:::»
AD8ll CC - :::»
AA~A I I I I I I I
I I ~--~1------+----~¥~I----J I I
- - - _I I I ----- I
-:::» -:::»
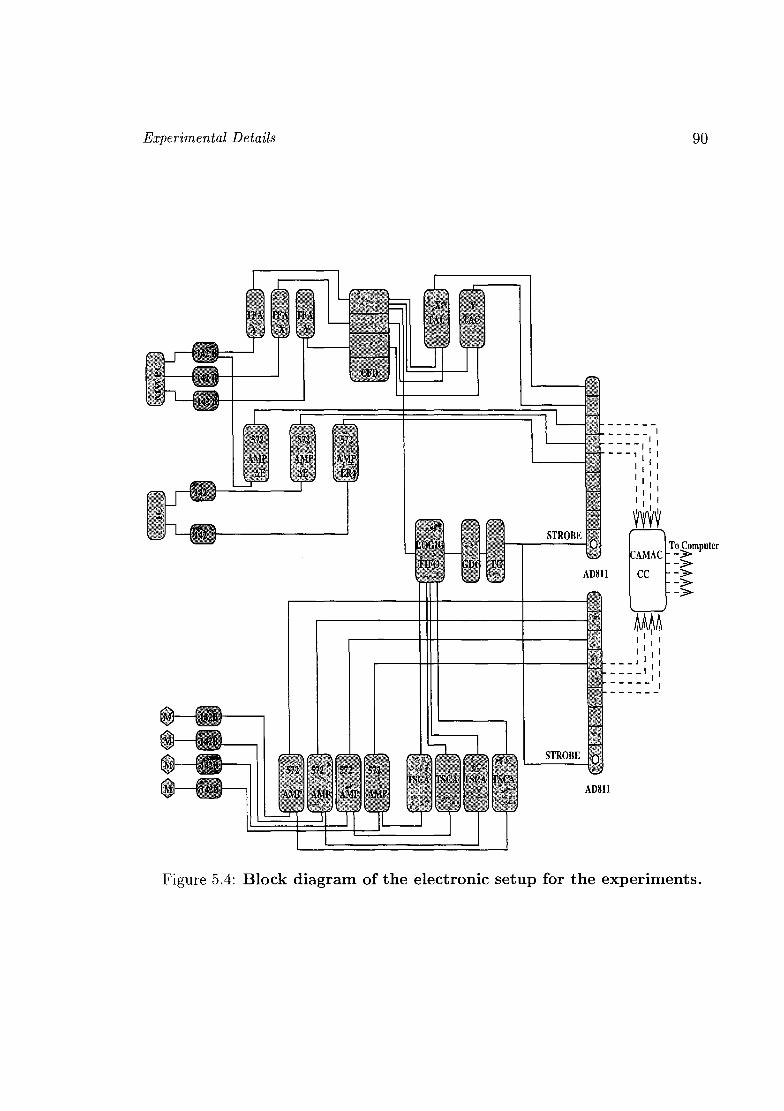
Figure 5.4: Block diagram of the electronic setup for the experiments.
Experimental Details 91
monitoring and beam flux normalisation. They were kept at a distance of 11 cm
from the target and the solid angle subtended by each monitor detector was 0.785
msr. The focal plane plane detector used was a large area silicon strip detector.
Charge Reset Foil
At a given beam energy the distribution of charge states of evaporation residues
is determined by atomic processes which occur within the target and internally
converted ,-transitions occurring after the product has recoiled from the target. A
thin carbon foil of ~ 5 p,g/cm2 was inserted at a distance of rvlO cm away from the
target in the direction of the residues so that the charge state of the residue shifted
due to internal conversion is re-equilibrated.
Optimisation of the RMS
The reaction products were selected by setting the HIRA fields (ED's, MD, Q1, Q2,
Q3 and Q4, and the multipole) with the help of the HIRA control system. The fields
were optimised to maximise the transportation of the reaction products to the focal
plane.
Signal Processing and Data Collection
A schematic of the electronics setup used in the measurements is shown Fig. 5.4.
The processed data has been collected online using the data acquisition program
FREEDOM [4]. Collected data were stored in compact discs for offline sorting.
5.4 Detection Efficiency
The calculation of absolute cross sections requires that we know the efficiency of
the measuring instrument accurately. When making measurements with HIRA the
total efficiency of detection consists of the efficiency of the detector used at the focal
plane and the transport efficiency of HIRA. The total detection efficiency can be
considered as a product of the following four quantities, namely
Experimental Details 92
1. the position dependent efficiency,
2. energy dependent efficiency,
3. charge state fraction,
4. angular distribution dependent efficiency factor
which together defines the transport efficiency of HIRA intrinsically including the
efficiency of the detector.
The measurement of the absolute efficiency of HIRA for a particular ion can be
made using coincidence of ER's detected at the focal plane with their characteristic
gamma rays emitted at the target position. Ratio of the area of the identified
coincidence gamma line to that of the singles for a particular residue will give the
transport efficiency for the same. This method is simple and gives the efficiency for
individual channels, however it cannot be employed effectively for getting estimates
of the efficiencies of weak evaporation channels. In the case of weak channels, the
intensity of the ,),-lines will become very low and their identification becomes quite
difficult. Also when using thin targets, as it is in our case a lot of time is required to
get sufficient statistics. Alternatively, the absolute detection efficiencies for various
evaporation channels at different beam energies can be obtained by a combination of
theoretical estimate of energy and angular distributions of residues and experimental
determination of these distributions and charge state distribution for certain selected
cases [5]. For the theoretical estimate of energy and angular distributions, the Monte
Carlo code PACE2 [6] can be used.
1. Position dependent transport efficiency - The recoil mass separator is
designed to transport the ions to all positions in the focal plane with equal
efficiency. However the small deviations in the trajectories of the ions inside
the RMS results in the variation of the transport efficiency across the focal
plane. The measurement of this relative efficiency as a function of HIRA focal
Experimental Details 93
1.5 r-~.....,.-~"--~-r-~.....,.-~.,--~-r-~-,
Charge state scanning Mass scanning
Exp. Exp. -- theoretical prediction
1.0 1.0
·r 0.5 0.5
! I
I I
0.0 0.0 4 6 8 10 12 14 16 18 124 125 126 127 128 129 130 131 132
Charge slate (q+) Mass (amu)
10' 1.5
Angular distribution Energy scanning
-- pace calculatiuns Exp. expo
1.0
i~II 10.1
f
f '. .'
f f
0.5 .I I 10'
I I
0.0 ·2 0 2 4 6 8 10 12 14 16 2 3 4 5 6 7 8 9 10 11 12 13 14
HIRA angle (in degrcc) Energy (MeV)
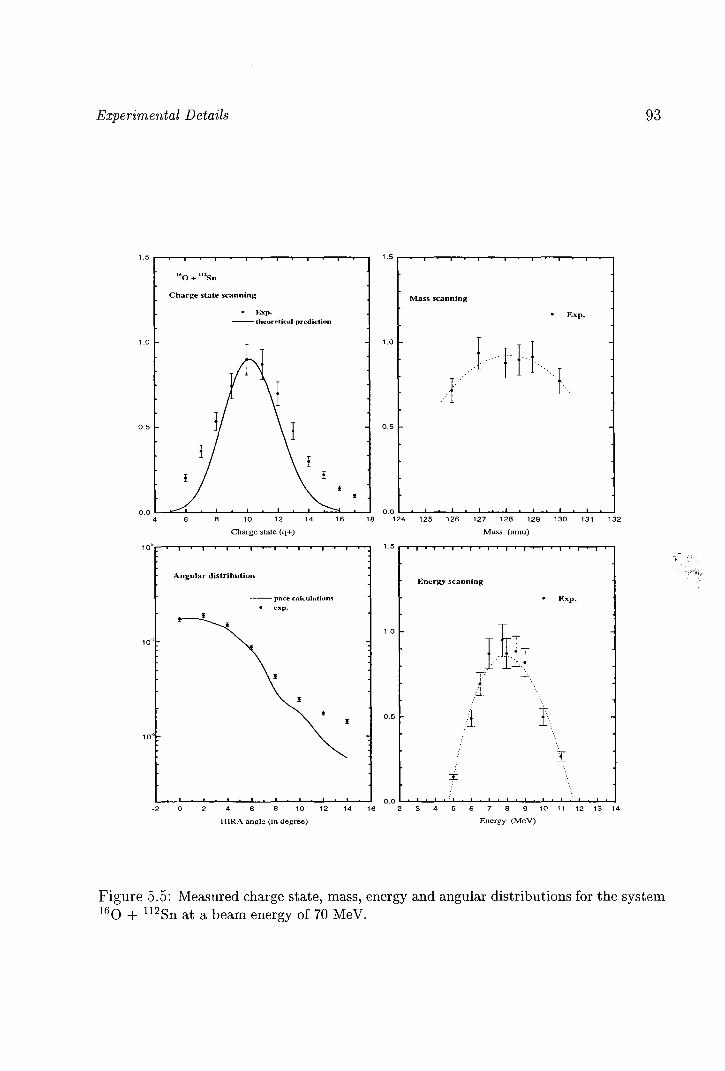
Figure 5.5: Measured charge state, mass, energy and angular distributions for the system 16 0 + 112Sn at a beam energy of 70 MeV.
'i:
,I ~I\i"
Experimental Details 94
40
35
30
~ -·2 25 ;:J
..c ..
...:: :c 20 Ql ;;::: "" 15 .::
"'e;j Ql c:.: 10
5
0 ·30 ·20 ·10 o 10 20 30
Percentage of Energy
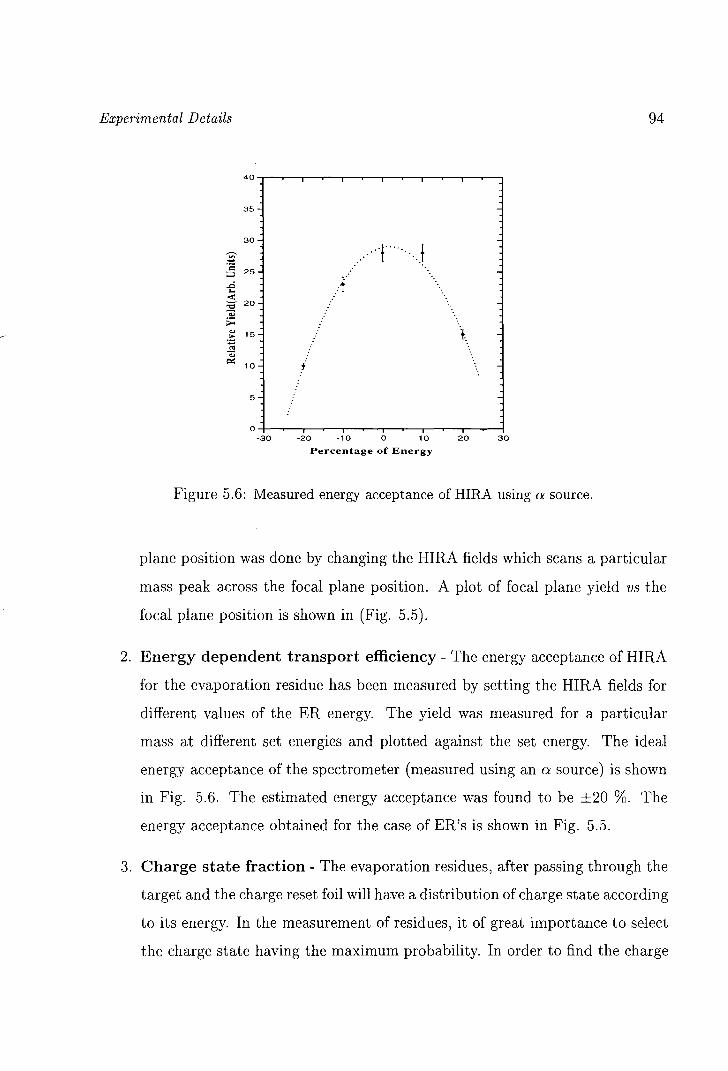
Figure 5.6: Measured energy acceptance of HIRA using a source.
plane position was done by changing the HIRA fields which scans a particular
mass peak across the focal plane position. A plot of focal plane yield vs the
focal plane position is shown in (Fig. 5.5).
2. Energy dependent transport efficiency - The energy acceptance of HIRA
for the evaporation residue has been measured by setting the HIRA fields for
different values of the ER energy. The yield was measured for a particular
mass at different set energies and plotted against the set energy. The ideal
energy acceptance of the spectrometer (measured using an a source) is shown
in Fig. 5.6. The estimated energy acceptance was found to be ±20 %. The
energy acceptance obtained for the case of ER's is shown in Fig. 5.5.
3. Charge state fraction - The evaporation residues, after passing through the
target and the charge reset foil will have a distribution of charge state according
to its energy. In the measurement of residues, it of great importance to select
the charge state having the maximum probability. In order to find the charge
Experimental Details 95
state having maximum yield, the HIRA field was set for different charge states
and the normalised yield in a particular mass was plotted against the charge
state. The optimum charge state selected was used in the measurements. The
charge state fraction estimated has been used in the estimation of the absolute
efficiency. The charge state distribution depends on the mass (M), charge (Z)
and energy (E) of the particle. The distribution obtained from the experiment
is the sum of the distributions for different Z-values forming a particular mass.
The total charge state distribution is compared with the predictions of Sayers
semi-empirical formula [7] in Fig. 5.5. The distribution was found to be in
good agreement with the predictions.
4. Angular distribution - The angular distribution of the evaporation residue
is measured by rotating the recoil mass separator HIRA to various angle with
respect to the beam direction. The fusion products are generally confined in
a narrow cone around the beam direction. The measured angular distribution
using HIRA is shown in Fig. 5.5. The figure shows the distribution for the
system 160 + 112Sn compared with the PACE2 angular distribution. In this
measurement, the solid angle of acceptance of HIRA was kept at the minimum
value of 1 msr. ER yield was measured at angular steps of 0.5 to 1 degree.
Angular distribution has been measured at both positive and negative angles
to locate the exact zero degree direction of HIRA. It was found that the shape
of the angular distribution does not change very drastically with changing
beam energy.
5.5 Systems Studied
The details of the measurements performed for the various systems are outlined
here. Our effort was to make precise measurements of fusion and quasi-elastic cross
sections so that the barrier distribution could be extracted. The barrier distribution
is obtained from the second derivative of the product of the fusion cross section
Experimental Details 96
and the centre of mass energy with respect to energy. Since the error in the second
derivative is directly proportional to the absolute error in the cross section, lot of
care needs to be taken to minimise the errors in the cross section. To achieve this,
the data was collected with statistical precision of 1 % or more. Care was taken to
minimise the other sources of errors also. The main effort was to lock the beam
direction through out the run. This was achieved by maintaining the same beam
profile and also monitoring the ratios of the counts in the four monitor detectors.
The four monitor detector setup described before was extremely useful in this. In
all the measurements we started from the highest energy and always changed energy
in one direction so as to minimise the possible errors in the definition of the exact
energy due to magnet hysteresis. During energy changes, care was taken in setting
the field of the switching magnet and analyser magnet. The field was not allowed
to over shoot the desired value so that field is changed only in one direction.
5.5.1 160 + 112,116Sn Systems
Fusion cross section measurements were made for the two systems in the energy
range 52 MeV to 70 MeV. The Coulomb barrier for the systems 16 0 + 112Sn and
160 + 116Sn are 51.74 MeV (E1ab=59.14 MeV) and 50.81 MeV (E1ab=57.82 MeV)
respectively. The detector set up consisted of four monitor detector in the target
chamber placed at an angle of 28° and a large area (50 mm x 50 mm) position
sensitive silicon surface barrier detector at the focal plane of HIRA. Pulsed 16 0
beam of repetition rate 4 J1sec was used as the flight time of the recoils through
HIRA ranged from 2 to 3 J1sec for the two systems in the full energy range. The
solid angle of HIRA was kept at 5 msr. At 70 Me V measurements were performed
to obtain the energy, mass and charge state distributions for the two systems. The
angular distribution was also measured for the 160 + 112Sn system at this energy.
These were used for getting the efficiency for these system. All care was taken to
minimise the random errors in the measurement of the excitation function.
Experimental Details 97
5.5.2 160 + 120Sn System
For this system we measured quasi-elastic scattering cross sections at a laboratory
angle of 1800 in the energy range 48 MeV to 62 MeV. Measurements were made
in steps of 1 MeV starting at 48 MeV. Pulsed 160 beam of repetition rate 2 f1sec
was used. The target was 50 f1g/cm2 enriched 120Sn with carbon backing of roughly
10 f1g/cm2. The experimental setup was same as the other measurements. HIRA
was kept at zero degree with respect to the beam direction with the solid angle at 5
msr. The total energy and the time of flight was measured. There was a very good
separation between the elastic recoils and the scattered beam in the two dimensional
plot of energy and time of flight (Fig. 5.2).
5.5.3 37Cl + 116Sn System
For this system fusion cross section were measured at energies around the barrier.
The Coulomb barrier for this system is 102.35 MeV (135 MeV in the equivalent
beam energy). The measurement was performed in the energy range 130 MeV to
152 MeV which spans from roughly 5 % below barrier to 12 % above barrier. The
experimental setup used was as described before. Pulsed 37 CI beam of repetition rate
250 ns was used . For this measurement a 8 x 47 mm2 position sensitive detector
was used at the focal plane of HIRA.
Fusion cross sections were measured in 1 MeV steps from 152 MeV to 129 MeV.
HIRA solid angle was kept at 1 msr for this measurement as the detector at the
focal plane was small. The charge state, energy, mass and the angular distribution
of the evaporation residues was measured at two energies (136 and 148 MeV). This
was done by setting the HIRA electric and magnetic fields for a particular mass,
energy and charge state and then changing them to get the different yields at the
focal plane. These distribution were later used to estimate the efficiency of HIRA
for this system.
Experimental Details 98
5.5.4 32S + 112,116,120Sn Systems
Measurements were carried out for fusion cross sections in the energy range 110
MeV to 140 MeV for the systems 328 + 112,116,12°8n. The Coulomb barriers for the
three systems are 98.64 MeV (E1ab=126.82 MeV), 97.93 MeV (E1ab=124.95 MeV)
and 97.25 MeV (E1ab=123.18 MeV). Pulsed 328 beam of repetition rate 2 fJ,sec was
used. The targets were the same as used before and the experiment was carried with
the same experimental setup. For the 32 8 + 112,1208n systems measurements were
made in steps of 0.75 MeV while for the 328 + 1168n system measurements were
made in slightly bigger steps of 1.5 to 3 MeV. As before, the measurements was
started at the highest energy where the charge state, mass and energy distributions
for the three systems were also measured. The angular distribution was measured
for the systems 328 + 112,1208n at laboratory energy of 140 MeV.
Quasi-elastic scattering cross sections were measured for the 328 + 1208n system
in the same energy range as for fusion in steps of 1 MeV. The experimental setup
was same as before.
Bibliography
[1] G. K. Mehta and A. P. Patro, Nucl. Instrum. & Methods, A268, 334 (1988~.
[2] D. Kanjilal, S. Chopra, M. M. Narayanan, 1. S. Iyer, V. Jha, R. Joshi, S. K\
Datta, Nucl. Instrum. & Methods, A328, 97 (1993).
[3] A. K. Sinha, N. Madhavan, J. J. Das, P. Sugathan, D. O. Kataria, A. P. Patro,
G. K. Mehta, Nucl. Instr. & Meth. A339, 543 (1994).
[4] B. P. Ajithkumar, E. T. Subramanium, R. K. Bhowmick, Proceedings of
SANAI98, Bombay, February, 1998
[5] A. M. Vinodkumar, Ph.D. Thesis submitted to Calicut University, India, April
1996.
[6] A. Gavron, Phys. Rev. C21, 230 (1980).
[7] R. O. Sayer, Revue de physique appliquee 12, 1543 (1972).
99


![user.spring8.or.jpuser.spring8.or.jp/.../uploads/cross_industrial_draft_e.docx · Web view- Summary of unsolved problems [PAGE 5: Experimental Details] 10. Experimental details (sketch](https://img.pdfslide.us/doc/110x75/5ad1fbe97f8b9a665f8bf0c4/user-view-summary-of-unsolved-problems-page-5-experimental-details-10-experimental.jpg)