Embed Size (px)
Citation preview
CHAPTER 5
CORSIM
I. OVERVIEW . . . . . . . . . . . . . . . . . . . . . . . . . . . . . . . . . . . . . . . . . . . . . . . . . . . . . . 5-1II. BACKGROUND . . . . . . . . . . . . . . . . . . . . . . . . . . . . . . . . . . . . . . . . . . . . . . . . . . 5-1III. DESCRIPTION . . . . . . . . . . . . . . . . . . . . . . . . . . . . . . . . . . . . . . . . . . . . . . . . . . . 5-2
Components . . . . . . . . . . . . . . . . . . . . . . . . . . . . . . . . . . . . . . . . . . . . . . . . . . . . 5-2Controls and Alignment . . . . . . . . . . . . . . . . . . . . . . . . . . . . . . . . . . . . . . . . . . 5-17Databases . . . . . . . . . . . . . . . . . . . . . . . . . . . . . . . . . . . . . . . . . . . . . . . . . . . . . 5-18Documentation . . . . . . . . . . . . . . . . . . . . . . . . . . . . . . . . . . . . . . . . . . . . . . . . . 5-19Computer Hardware, Software and Portability . . . . . . . . . . . . . . . . . . . . . . . . 5-19
IV. APPLICATION TO IMPORTANT RETIREMENT POLICY ISSUES . . . . . . . 5-20Benchmarks . . . . . . . . . . . . . . . . . . . . . . . . . . . . . . . . . . . . . . . . . . . . . . . . . . . 5-20
V. ACCESSIBILITY AND EASE OF USE . . . . . . . . . . . . . . . . . . . . . . . . . . . . . . . 5-22VI. CRITIQUE . . . . . . . . . . . . . . . . . . . . . . . . . . . . . . . . . . . . . . . . . . . . . . . . . . . . . . 5-23
ANNEX 5-1 -- CORSIM 3.0 SUMMARY DESCRIPTION TABLE
ANNEX 5-2 -- CORSIM POLICY MATRICES
ANNEX 5-3 -- PROPOSED CORSIM PRIVATE PENSION MODULE FLOWCHARTS
October 16, 1997
1 This description draws on Caldwell (1993), Caldwell (1995), Caldwell et al. (1997), Caldwell and Keister(1995), Caldwell and Favreault (1995), Williams (1997) and discussions with Steven B. Caldwell, MelissaFavreault, and Thomas Johnson of Cornell University.
2 DYNASIM is described in Chapter 3 of this report.
CHAPTER 5
CORSIM1
I. OVERVIEW
CORSIM (Cornell Microsimulation Model) is a large dynamic microsimulation modeldeveloped and maintained at Cornell University. It currently ages the 1960 Census Public UseMicrodata Sample (PUMS), operating on a sample of up to 180,000 person records. It ages thedatabase in annual periods from 1960 through 2030. The model depicts most of the importantdemographic events and characteristics, but has minimal economic behavioral content. It has adetailed social security module, with comprehensive representation of social security rules, but littlebehavioral analysis. CORSIM staff have designed a private pension module, but it has not beendeveloped. CORSIM does not include industry affiliation of workers. It does not depict behavioror characteristics of employers or retirement plan sponsors.
II. BACKGROUND
Development of CORSIM began at Cornell University in 1986 under the direction of Prof.Steven Caldwell. Caldwell was part of the team that developed DYNASIM at the Urban Institutein the early 1970s (Orcutt et al., 1976).2 The first version of CORSIM was similar to DYNASIM.A second version was developed during 1990-1993 with funding from the National Institute of DentalResearch, which included a detailed dental condition and cost module. In 1994 and 1995 the modelwas broadened, with support from the U.S. Department of Health and Human Services, the Bureauof the Census, the Internal Revenue Service, the Canadian government Office of the Superintendentof Financial Institutions, and the American Association of Retired Persons. The version current since1995 is termed CORSIM 3.0.
In 1995 CORSIM was adopted by the Office of the Superintendent of Financial Institutions(OSFI) of the Government of Canada to serve as the basis for the development of a microsimulationmodel to be used for analysis of Canada Pension Plan policy. The OSFI has revised and replaced
October 16, 19975-2
3 DYNACAN is described in Chapter 6 of this report.
4 The basic features of CORSIM, including sources of data, are summarized in the Summary Description Tablein Annex 5-1 at the end of this chapter.
5 Dynamic and static microsimulation are described in Chapter 2. As described in Chapter 2, a microsimulationmodel simulates social and economic behavior by depicting events, conditions, and changes in the informationrecorded on each individual (person or family) record in a large database. A microsimulation model depicts theaggregate conditions of the population by aggregating or tabulating over all the modified individual records. Dynamic means the model simulates events for each individual one year at a time, and the outcome for each event each year depends on current and past year’s outcomes for that and other events.
CORSIM modules to develop a model of the Canadian population and retirement income system,called DYNACAN.3
The primary objective of CORSIM is to provide a framework for research concerning thesocioeconomic behavior and states of the population, particularly life-course patterns and outcomes.A second objective is to provide a platform and framework for research in microsimulation modelingtechniques, for example investigation of computer time requirements for model simulations,alternative variance reduction techniques (discussed below), and use of alignment factors forsimulation.
A key objective for the CORSIM model has been portability among computational platforms.An important aspect of this was to develop a model that could be run with small to moderate sizesamples on a desktop micro computer and ported to a large mainframe for large samples.
III. DESCRIPTION4
CORSIM is a large-scale dynamic microsimulation model.5 It simulates the basicdemographic and socioeconomic events that characterize the socioeconomic conditions of thepopulation. The basic elements of CORSIM are persons and families. It does not depict firms,industries, or governmental entities. It simulates the basic demographic and socioeconomic events,states, and changes occurring for each person and family in its base microdata file on an annual basis.It depicts approximately 26 events, processes, or characteristics of persons and families and canoperate on a database of up to 180,000 records. The model is usually run over the period 1960-2030,but for social security simulations it has been run for 1960-2090.
Components
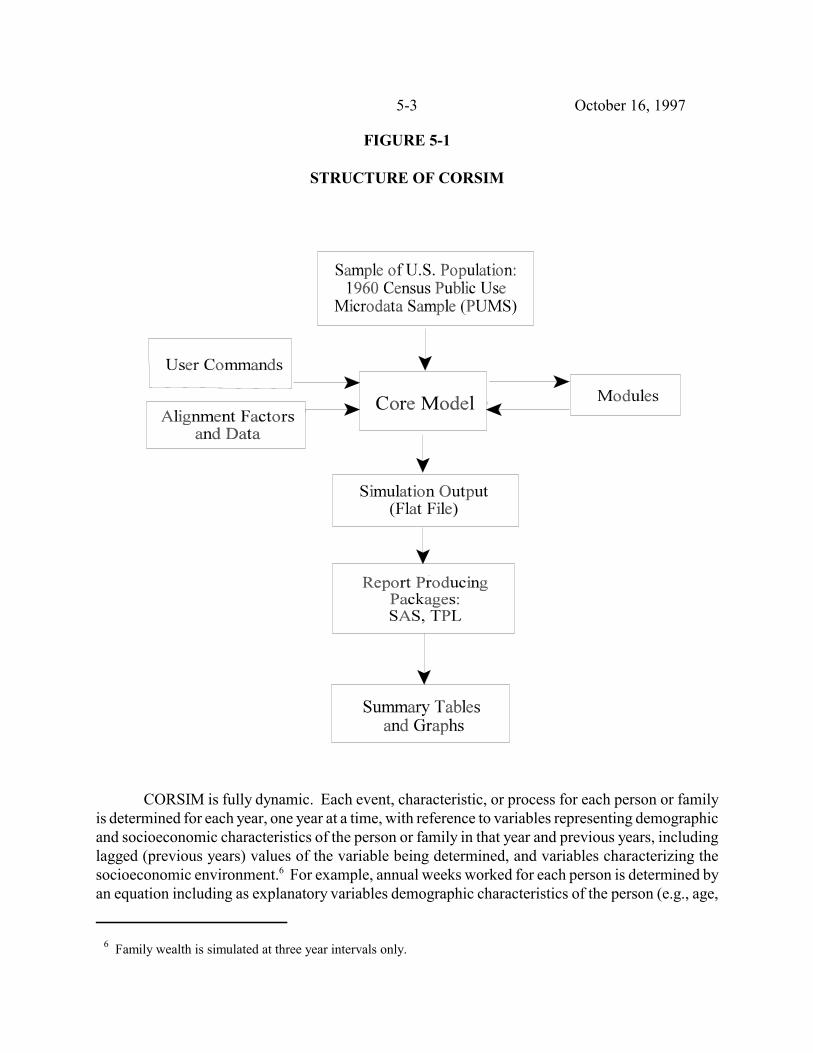
CORSIM is composed of a single integrated simulation model that operates on a microdatafile, and a set of tabulation and report producing programs that can be used to tabulate, analyze,report, and display the simulated output data. The structure of CORSIM is shown in Figure 5-1.
October 16, 19975-3
6 Family wealth is simulated at three year intervals only.
FIGURE 5-1
STRUCTURE OF CORSIM
CORSIM is fully dynamic. Each event, characteristic, or process for each person or familyis determined for each year, one year at a time, with reference to variables representing demographicand socioeconomic characteristics of the person or family in that year and previous years, includinglagged (previous years) values of the variable being determined, and variables characterizing thesocioeconomic environment.6 For example, annual weeks worked for each person is determined byan equation including as explanatory variables demographic characteristics of the person (e.g., age,
October 16, 19975-4
7 The use of the lagged value of an attribute (dependent variable) as an explanatory variable for that attribute issometimes referred to in the microsimulation literature as state-dependence. State-dependence is a key issue indynamic aging. In fact, relatively few events or characteristics in CORSIM are determined by lagged values of thedependent variable (see Table 5-1).
8 Family wealth is simulated every three years.
9 The solution sequence in use through 1997 is sometimes referred to as “events within persons”. The post-1997sequence is referred to as “persons within events”. This change is essentially a programming change and will notchange the outputs or most capabilities of the model. It will facilitate the use of particular alignment techniques(discussed below).
sex, race) and the number of weeks worked in the previous year.7 Each of the behaviors, events, orprocesses depicted in CORSIM is included in an individual module. A module may determineoutcomes using rule-based processes or behavioral equations or both. Table 5-1 shows the eventsand processes depicted in CORSIM and the variables used to determine each event. Not everymodule or process is necessarily simulated in every run of the model. The order in which the modulesare solved is shown in Table 5-2.
CORSIM simulates all of the appropriate events for each individual in the file each year.8 Inthe versions of CORSIM existing through 1997, all of the events/processes are simulated sequentiallyfor the first individual, then all are simulated for the second individual, etc., until all individuals andfamilies have been processed for one simulation year. Then the model repeats the process for the nextyear, with the simulated event values for the previous year and those already determined for thecurrent year as inputs. The process is repeated for each year until the final year of the simulationperiod. The output of the model is a file of longitudinal demographic and socioeconomic historiesfor each person in the sample of the U.S. population, including weeks worked and earnings.
In 1997 the events/persons solution sequence in CORSIM is being changed. In the revisedversion, for each year the first event/process is determined for all individuals, then the next event isdetermined for all individuals, until all events and outcomes have been determined for all individualsand families in that year. Then the model repeats this process for the next year. This change will notchange the order in which event/process modules are solved, nor the form of the output database.9
CORSIM includes approximately 26 behavioral modules and several rule-based orbookkeeping modules. Not all the modules are included in every simulation of the model. Inparticular, the modules addressing behavioral risks (smoking, alcohol, sugar, diabetes), Aid toFamilies with Dependent Children (AFDC), Supplementary Security Income (SSI), Earned IncomeTax Credit (EITC), the Social Security module and the wealth module may not be included in everysimulation. In addition, three modules are separate from the main model: the voting module, theconsumption expenditures module, and the dental module. These accept outputs from other modulesin the model but do not feed back into other modules.
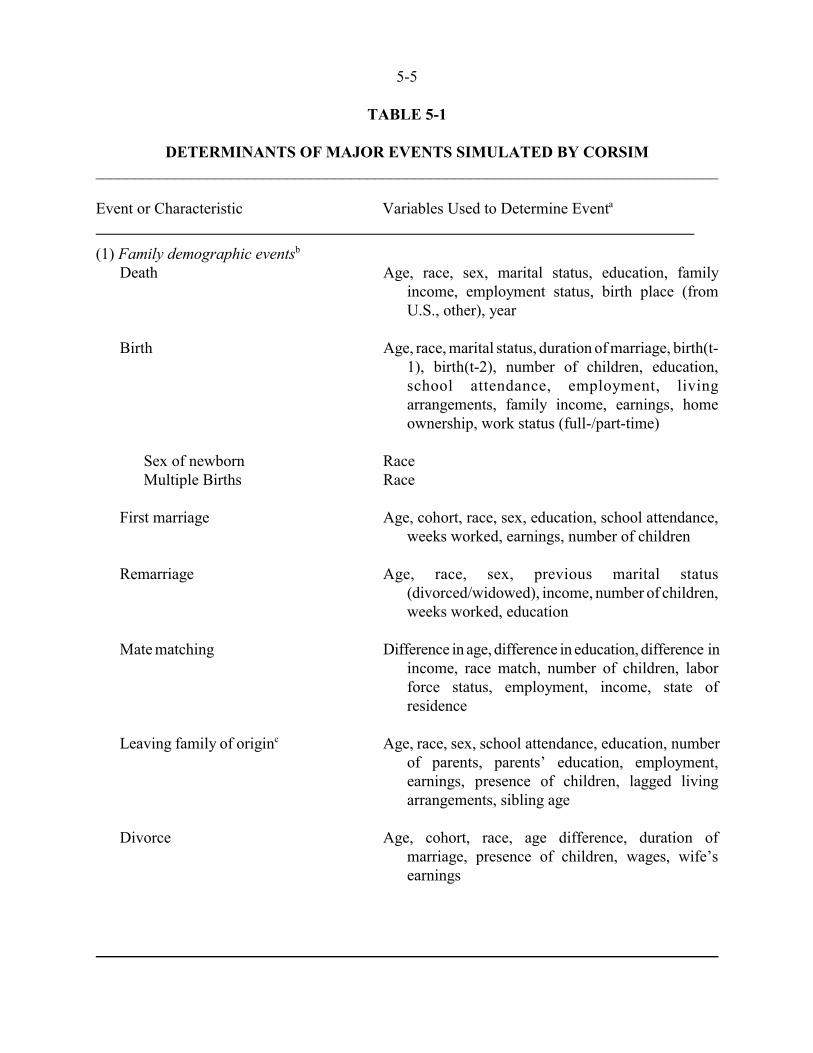
TABLE 5-1
DETERMINANTS OF MAJOR EVENTS SIMULATED BY CORSIM______________________________________________________________________________
Event or Characteristic Variables Used to Determine Eventa
5-5
(1) Family demographic eventsb
Death Age, race, sex, marital status, education, familyincome, employment status, birth place (fromU.S., other), year
Birth Age, race, marital status, duration of marriage, birth(t-1), birth(t-2), number of children, education,school attendance, employment, livingarrangements, family income, earnings, homeownership, work status (full-/part-time)
Sex of newborn RaceMultiple Births Race
First marriage Age, cohort, race, sex, education, school attendance,weeks worked, earnings, number of children
Remarriage Age, race, sex, previous marital status(divorced/widowed), income, number of children,weeks worked, education
Mate matching Difference in age, difference in education, difference inincome, race match, number of children, laborforce status, employment, income, state ofresidence
Leaving family of originc Age, race, sex, school attendance, education, numberof parents, parents’ education, employment,earnings, presence of children, lagged livingarrangements, sibling age
Divorce Age, cohort, race, age difference, duration ofmarriage, presence of children, wages, wife’searnings
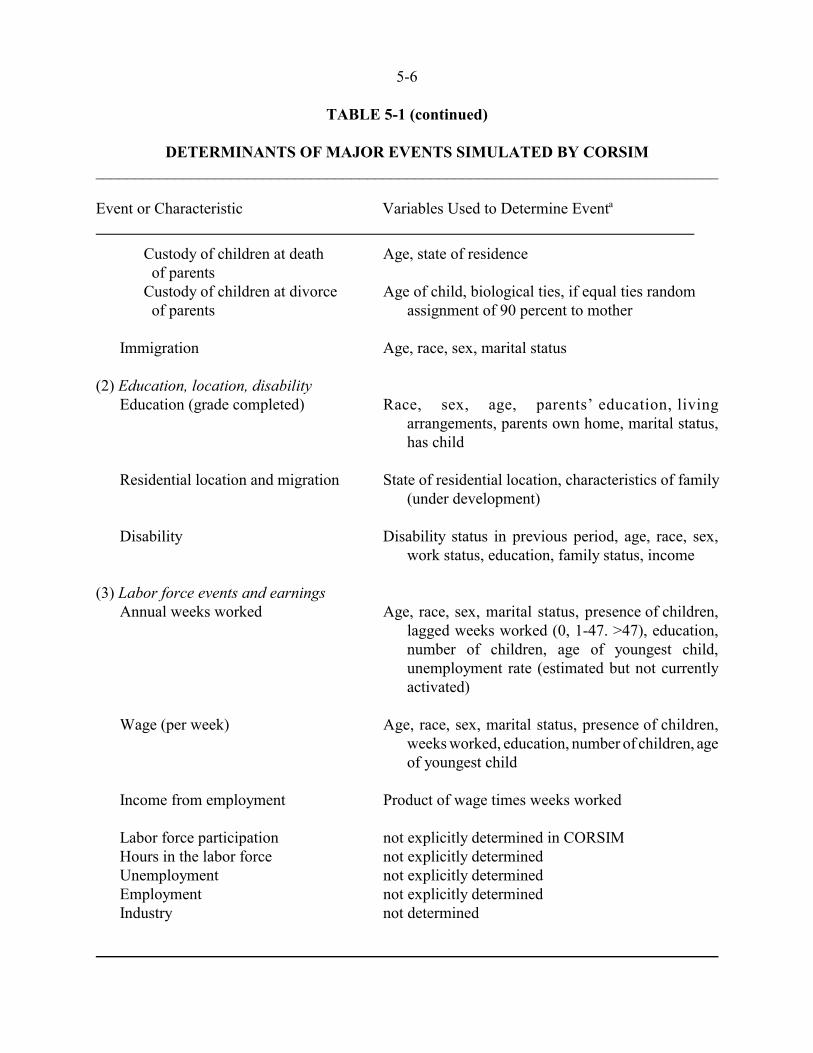
TABLE 5-1 (continued)
DETERMINANTS OF MAJOR EVENTS SIMULATED BY CORSIM______________________________________________________________________________
Event or Characteristic Variables Used to Determine Eventa
5-6
Custody of children at death Age, state of residence of parents
Custody of children at divorce Age of child, biological ties, if equal ties random of parents assignment of 90 percent to mother
Immigration Age, race, sex, marital status
(2) Education, location, disabilityEducation (grade completed) Race, sex, age, parents’ education, living
arrangements, parents own home, marital status,has child
Residential location and migration State of residential location, characteristics of family(under development)
Disability Disability status in previous period, age, race, sex,work status, education, family status, income
(3) Labor force events and earningsAnnual weeks worked Age, race, sex, marital status, presence of children,
lagged weeks worked (0, 1-47. >47), education,number of children, age of youngest child,unemployment rate (estimated but not currentlyactivated)
Wage (per week) Age, race, sex, marital status, presence of children,weeks worked, education, number of children, ageof youngest child
Income from employment Product of wage times weeks worked
Labor force participation not explicitly determined in CORSIMHours in the labor force not explicitly determinedUnemployment not explicitly determinedEmployment not explicitly determinedIndustry not determined
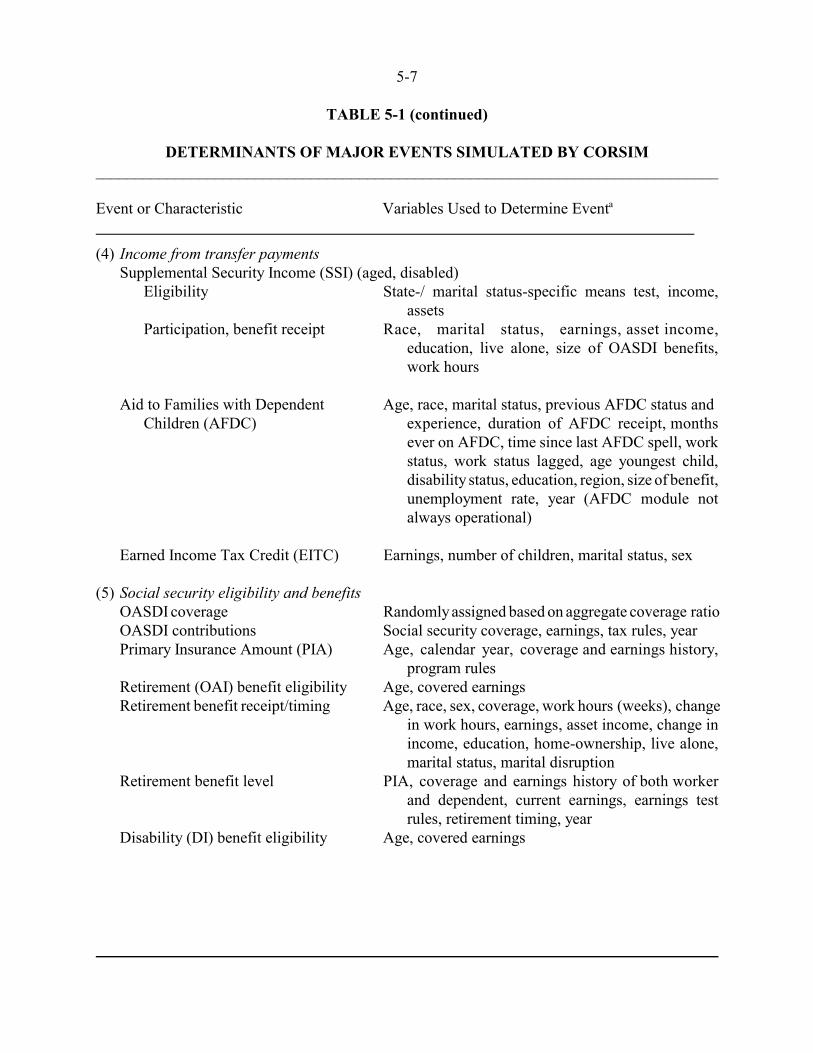
TABLE 5-1 (continued)
DETERMINANTS OF MAJOR EVENTS SIMULATED BY CORSIM______________________________________________________________________________
Event or Characteristic Variables Used to Determine Eventa
5-7
(4) Income from transfer paymentsSupplemental Security Income (SSI) (aged, disabled)
Eligibility State-/ marital status-specific means test, income,assets
Participation, benefit receipt Race, marital status, earnings, asset income,education, live alone, size of OASDI benefits,work hours
Aid to Families with Dependent Age, race, marital status, previous AFDC status and
Children (AFDC) experience, duration of AFDC receipt, monthsever on AFDC, time since last AFDC spell, workstatus, work status lagged, age youngest child,disability status, education, region, size of benefit,unemployment rate, year (AFDC module notalways operational)
Earned Income Tax Credit (EITC) Earnings, number of children, marital status, sex
(5) Social security eligibility and benefitsOASDI coverage Randomly assigned based on aggregate coverage ratioOASDI contributions Social security coverage, earnings, tax rules, yearPrimary Insurance Amount (PIA) Age, calendar year, coverage and earnings history,
program rulesRetirement (OAI) benefit eligibility Age, covered earningsRetirement benefit receipt/timing Age, race, sex, coverage, work hours (weeks), change
in work hours, earnings, asset income, change inincome, education, home-ownership, live alone,marital status, marital disruption
Retirement benefit level PIA, coverage and earnings history of both workerand dependent, current earnings, earnings testrules, retirement timing, year
Disability (DI) benefit eligibility Age, covered earnings
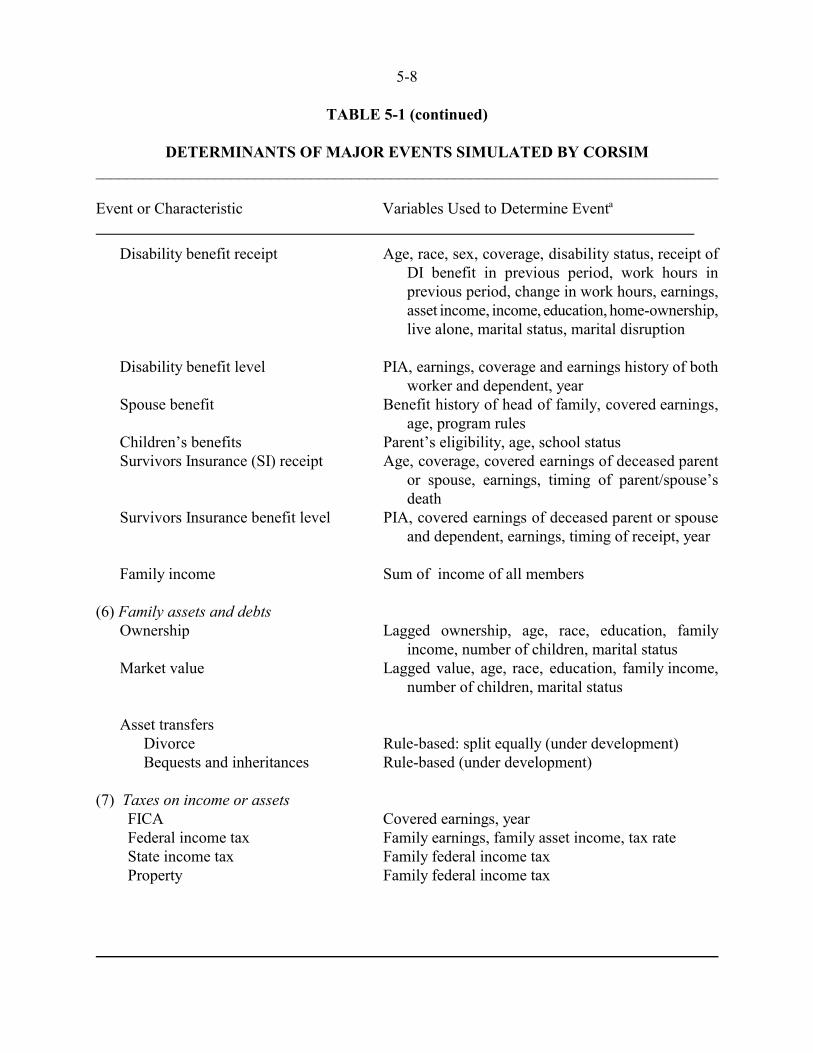
TABLE 5-1 (continued)
DETERMINANTS OF MAJOR EVENTS SIMULATED BY CORSIM______________________________________________________________________________
Event or Characteristic Variables Used to Determine Eventa
5-8
Disability benefit receipt Age, race, sex, coverage, disability status, receipt ofDI benefit in previous period, work hours inprevious period, change in work hours, earnings,asset income, income, education, home-ownership,live alone, marital status, marital disruption
Disability benefit level PIA, earnings, coverage and earnings history of bothworker and dependent, year
Spouse benefit Benefit history of head of family, covered earnings,age, program rules
Children’s benefits Parent’s eligibility, age, school statusSurvivors Insurance (SI) receipt Age, coverage, covered earnings of deceased parent
or spouse, earnings, timing of parent/spouse’sdeath
Survivors Insurance benefit level PIA, covered earnings of deceased parent or spouseand dependent, earnings, timing of receipt, year
Family income Sum of income of all members
(6) Family assets and debtsOwnership Lagged ownership, age, race, education, family
income, number of children, marital statusMarket value Lagged value, age, race, education, family income,
number of children, marital status
Asset transfersDivorce Rule-based: split equally (under development)Bequests and inheritances Rule-based (under development)
(7) Taxes on income or assets FICA Covered earnings, year Federal income tax Family earnings, family asset income, tax rate State income tax Family federal income tax Property Family federal income tax
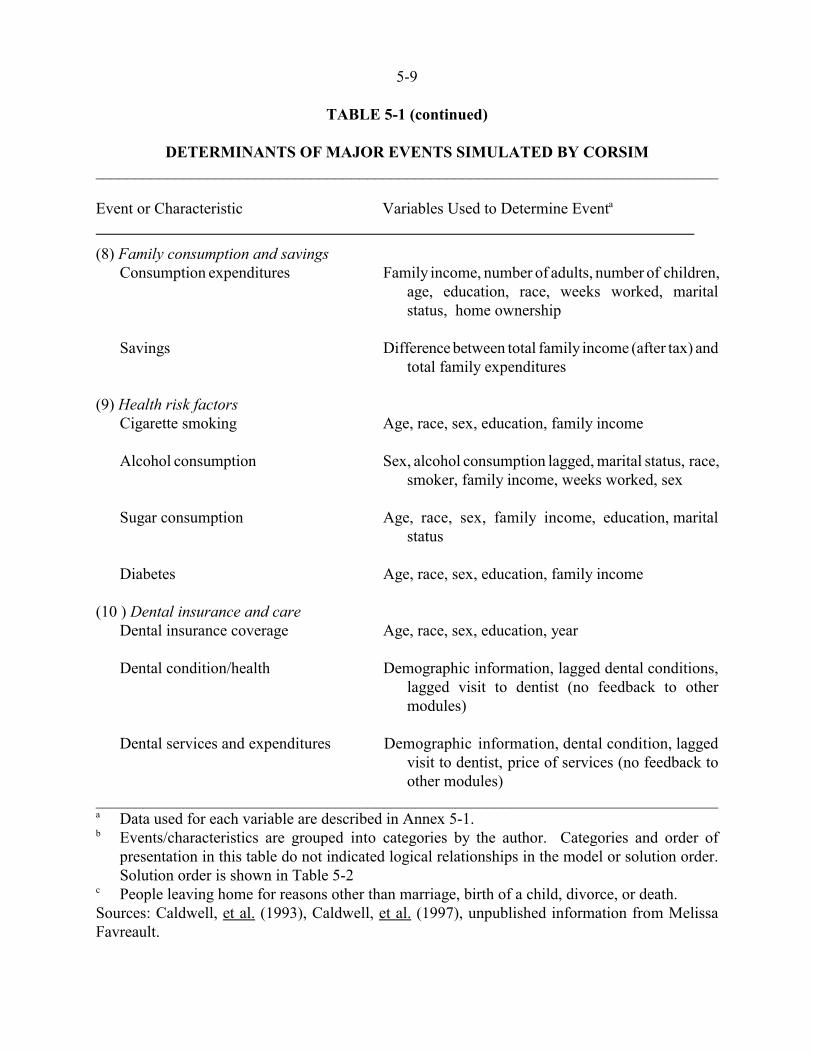
TABLE 5-1 (continued)
DETERMINANTS OF MAJOR EVENTS SIMULATED BY CORSIM______________________________________________________________________________
Event or Characteristic Variables Used to Determine Eventa
5-9
(8) Family consumption and savingsConsumption expenditures Family income, number of adults, number of children,
age, education, race, weeks worked, maritalstatus, home ownership
Savings Difference between total family income (after tax) andtotal family expenditures
(9) Health risk factorsCigarette smoking Age, race, sex, education, family income
Alcohol consumption Sex, alcohol consumption lagged, marital status, race,smoker, family income, weeks worked, sex
Sugar consumption Age, race, sex, family income, education, maritalstatus
Diabetes Age, race, sex, education, family income
(10 ) Dental insurance and careDental insurance coverage Age, race, sex, education, year
Dental condition/health Demographic information, lagged dental conditions,lagged visit to dentist (no feedback to othermodules)
Dental services and expenditures Demographic information, dental condition, laggedvisit to dentist, price of services (no feedback toother modules)
______________________________________________________________________________a Data used for each variable are described in Annex 5-1.b Events/characteristics are grouped into categories by the author. Categories and order of
presentation in this table do not indicated logical relationships in the model or solution order.Solution order is shown in Table 5-2
c People leaving home for reasons other than marriage, birth of a child, divorce, or death.Sources: Caldwell, et al. (1993), Caldwell, et al. (1997), unpublished information from MelissaFavreault.
5-10
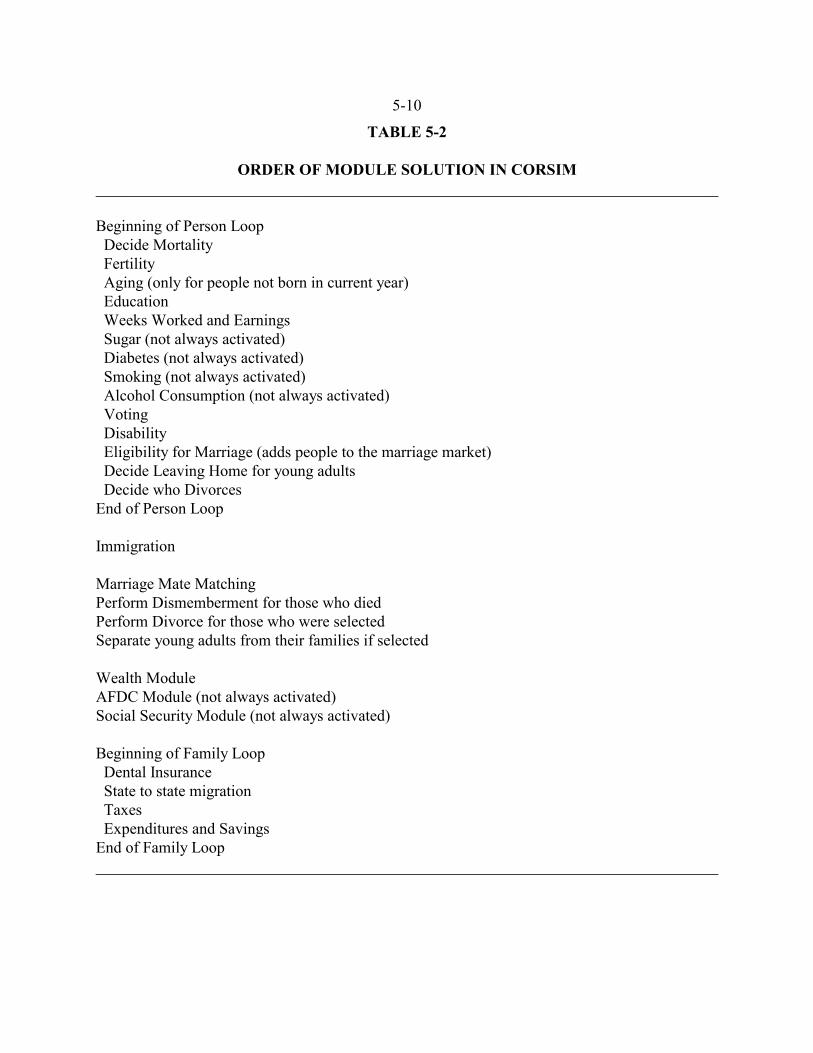
TABLE 5-2
ORDER OF MODULE SOLUTION IN CORSIM______________________________________________________________________________
Beginning of Person Loop Decide Mortality Fertility Aging (only for people not born in current year) Education Weeks Worked and Earnings Sugar (not always activated) Diabetes (not always activated) Smoking (not always activated) Alcohol Consumption (not always activated) Voting Disability Eligibility for Marriage (adds people to the marriage market) Decide Leaving Home for young adults Decide who DivorcesEnd of Person Loop
Immigration
Marriage Mate MatchingPerform Dismemberment for those who diedPerform Divorce for those who were selectedSeparate young adults from their families if selected
Wealth ModuleAFDC Module (not always activated)Social Security Module (not always activated)
Beginning of Family Loop Dental Insurance State to state migration Taxes Expenditures and SavingsEnd of Family Loop______________________________________________________________________________
October 16, 19975-11
10 Monte Carlo simulation is discussed in Chapter 2, p. 2-5.
11 Selective sampling is discussed in Pidd (1988).
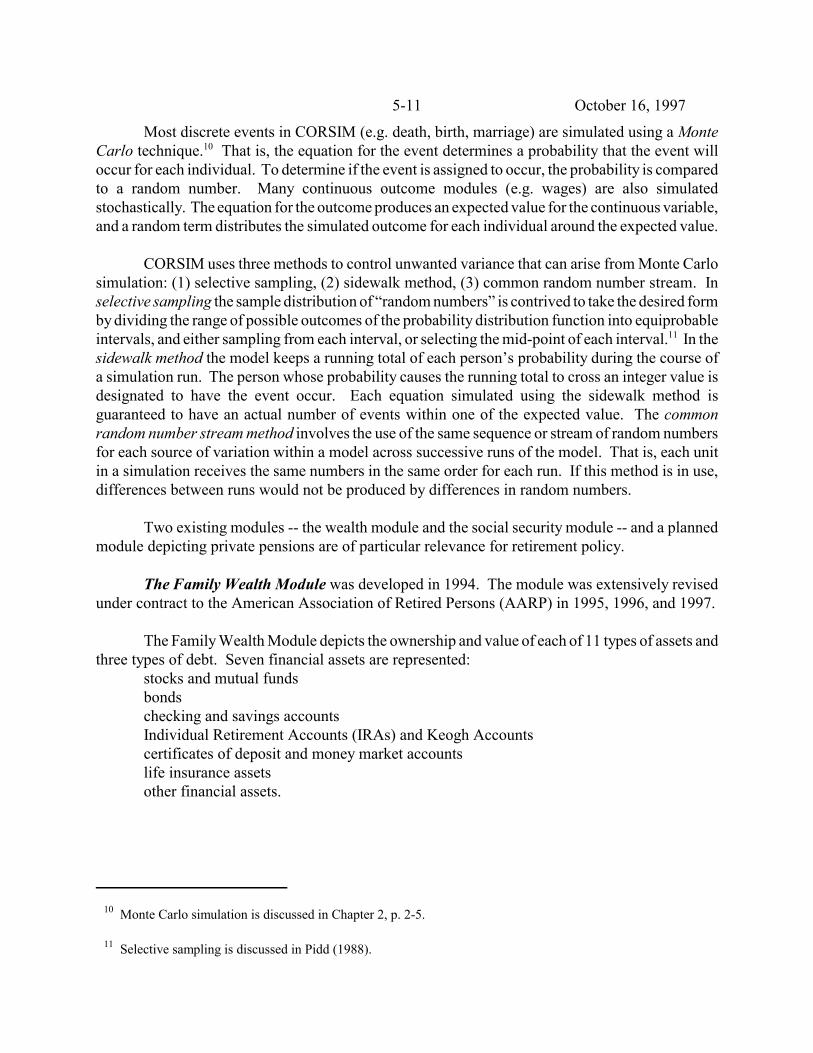
Most discrete events in CORSIM (e.g. death, birth, marriage) are simulated using a MonteCarlo technique.10 That is, the equation for the event determines a probability that the event willoccur for each individual. To determine if the event is assigned to occur, the probability is comparedto a random number. Many continuous outcome modules (e.g. wages) are also simulatedstochastically. The equation for the outcome produces an expected value for the continuous variable,and a random term distributes the simulated outcome for each individual around the expected value.
CORSIM uses three methods to control unwanted variance that can arise from Monte Carlosimulation: (1) selective sampling, (2) sidewalk method, (3) common random number stream. Inselective sampling the sample distribution of “random numbers” is contrived to take the desired formby dividing the range of possible outcomes of the probability distribution function into equiprobableintervals, and either sampling from each interval, or selecting the mid-point of each interval.11 In thesidewalk method the model keeps a running total of each person’s probability during the course ofa simulation run. The person whose probability causes the running total to cross an integer value isdesignated to have the event occur. Each equation simulated using the sidewalk method isguaranteed to have an actual number of events within one of the expected value. The commonrandom number stream method involves the use of the same sequence or stream of random numbersfor each source of variation within a model across successive runs of the model. That is, each unitin a simulation receives the same numbers in the same order for each run. If this method is in use,differences between runs would not be produced by differences in random numbers.
Two existing modules -- the wealth module and the social security module -- and a plannedmodule depicting private pensions are of particular relevance for retirement policy.
The Family Wealth Module was developed in 1994. The module was extensively revisedunder contract to the American Association of Retired Persons (AARP) in 1995, 1996, and 1997.
The Family Wealth Module depicts the ownership and value of each of 11 types of assets andthree types of debt. Seven financial assets are represented:
stocks and mutual fundsbondschecking and savings accountsIndividual Retirement Accounts (IRAs) and Keogh Accountscertificates of deposit and money market accountslife insurance assetsother financial assets.
October 16, 19975-12
12 Estate tax data were tabulated for the years 1962, 1969, 1972, 1976, 1982, 1986, 1989, 1992 for each of 80demographic groups to estimate the proportion of persons in each group holding each of eight types of assets andthe mean value of asset holdings for each group. Estimates for the missing years were interpolated. Thepopulation of top wealth holders was estimated using mortality multipliers derived from a proportional hazardsmodel of mortality using the National Longitudinal Mortality Study. Family wealth was inferred from the estatetax based estimates of individual wealth holdings.
13 SCF data for 1962, 1970, 1983, 1986, 1989, and 1992 were tabulated for 40 demographic groups to estimatethe probability of holding each asset type and the mean value of each type. Data were interpolated for the updateyears and demographic groups for which there were no survey data available.
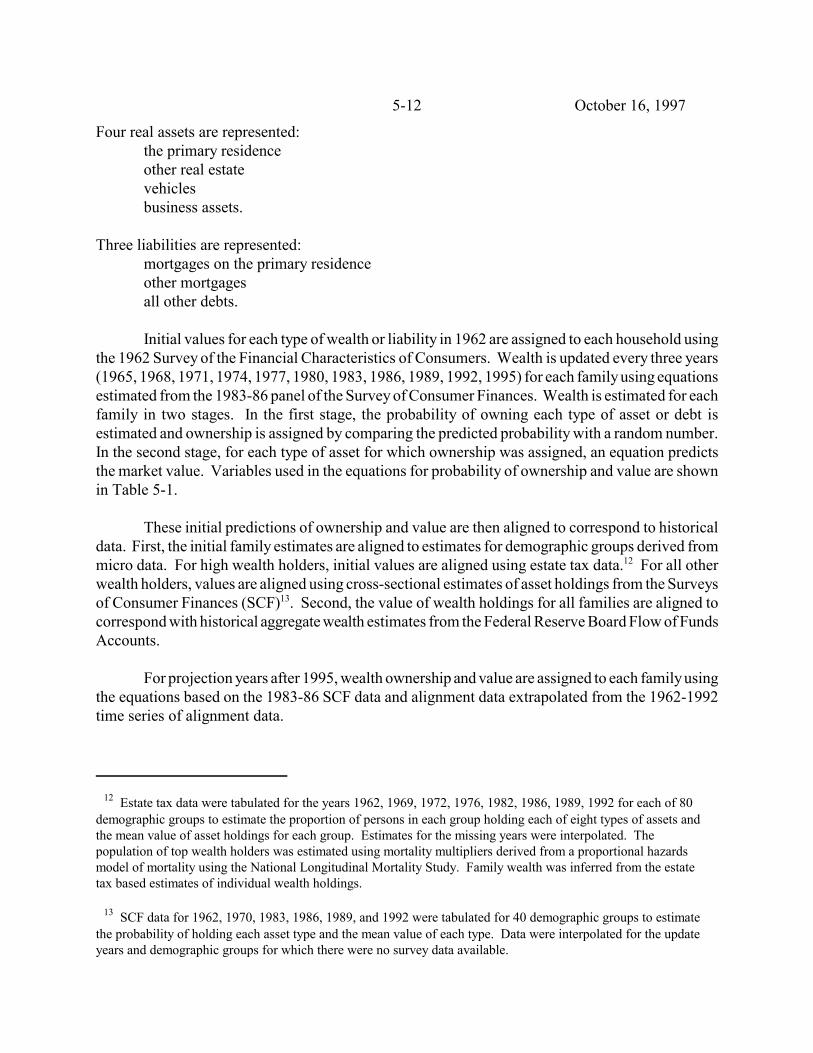
Four real assets are represented:the primary residenceother real estatevehiclesbusiness assets.
Three liabilities are represented:mortgages on the primary residenceother mortgagesall other debts.
Initial values for each type of wealth or liability in 1962 are assigned to each household usingthe 1962 Survey of the Financial Characteristics of Consumers. Wealth is updated every three years(1965, 1968, 1971, 1974, 1977, 1980, 1983, 1986, 1989, 1992, 1995) for each family using equationsestimated from the 1983-86 panel of the Survey of Consumer Finances. Wealth is estimated for eachfamily in two stages. In the first stage, the probability of owning each type of asset or debt isestimated and ownership is assigned by comparing the predicted probability with a random number.In the second stage, for each type of asset for which ownership was assigned, an equation predictsthe market value. Variables used in the equations for probability of ownership and value are shownin Table 5-1.
These initial predictions of ownership and value are then aligned to correspond to historicaldata. First, the initial family estimates are aligned to estimates for demographic groups derived frommicro data. For high wealth holders, initial values are aligned using estate tax data.12 For all otherwealth holders, values are aligned using cross-sectional estimates of asset holdings from the Surveysof Consumer Finances (SCF)13. Second, the value of wealth holdings for all families are aligned tocorrespond with historical aggregate wealth estimates from the Federal Reserve Board Flow of FundsAccounts.
For projection years after 1995, wealth ownership and value are assigned to each family usingthe equations based on the 1983-86 SCF data and alignment data extrapolated from the 1962-1992time series of alignment data.
October 16, 19975-13
The Social Security Module was developed under contract to the American Association ofRetired Persons (AARP). A preliminary version of the social security module was completed inDecember 1995. Development continued in 1996 and 1997.
The Social Security Module depicts for each individual OASDI coverage, earnings histories,contributions, disability benefit receipt for covered workers and dependents, Average IndexedMonthly Earnings (AIME) and Primary Insurance Amount (PIA), disability benefit amounts,retirement benefit receipt for workers and dependents and amounts, survivors benefit receipt andamounts, and taxation of benefits. Based on the simulated histories of contributions and benefits, themodel can produce tabulations of cumulative (lifetime) contributions, benefits, net benefits, ratio ofbenefits to contributions, replacement rates for various demographic/socioeconomic groups, andother indicators.
The social security module begins by statically imputing pre-1960 earnings histories, includingyears of coverage and earnings, for all workers in the 1960 data file. It assigns numbers of years ofcoverage randomly using historic age-sex group probabilities of full coverage. It assigns benefits forworkers who began receipt before 1960 based on age-sex proportions in 1960. All beneficiaries areassigned the mean benefit of their age-sex group. CORSIM uses the 1960 census sample as its basedata file. CORSIM does not use any of the available social security earnings records data.Consequently, all of the pre-1960 historic information (as well as all information for the period 1960-1996) must be imputed or simulated, even though historic data exist for the 1937-1977 period.
Annual dynamic simulations of OASDI outcomes begin in 1960. Coverage is assignedrandomly to wage-earners using historical proportions, without reference to wage level, number ofweeks worked, or industry (industry is not simulated). Quarters of coverage are accumulated basedon annual coverage assignment and earnings levels. Annual OASDI contributions are calculatedbased on earnings and the tax rate in each year. Disability (DI) benefit receipt is predicted based oneligibility (number of covered quarters), using an equation estimated with PSID data, which includes(self-reported) disability status and lagged receipt of disability benefit as explanatory variables (seeTable 5-1). DI benefit receipt for dependents is determined based on the relationship to the workerbeneficiary. AIME/PIA is calculated for workers with sufficient covered quarters who are slated toreceive a benefit. AIME is calculated using the social security indexing formula and the worker’ssimulated earnings history. PIA is calculated from AIME based on the actual or projected formula.Disability benefit amount is assigned based on the PIA and the family cap rule. Retirement benefitreceipt is predicted for workers ages 62-69 using an equation estimated with PSID data for 1986-1991 (see Table 5-1). Explanatory variables in the retirement equation include demographiccharacteristics, current work hours and wages, and asset income, but do not include variables forprospective social security benefit or pension benefit levels. Retirement benefit amount is thencalculated based on the PIA and adjusted for early or late retirement and the family cap. Survivorsbenefit receipt is based on the time of death of the worker, and amount is determined by the worker’sPIA. OASDI trust fund balance is calculated based on total contributions paid in, taxes on benefits,and total benefits paid out. Interest earned on the fund, reimbursements, and administrative expensesare exogenous.
October 16, 19975-14
14 This module is to be developed in 1997 and 1998 under contract to the American Association of RetiredPersons (AARP).
The social security module produces voluminous output, which can be tabulated in manyways, including annual counts of contributors, amount of contributions, counts of beneficiaries ofvarious types in various socioeconomic groups, total benefit payments, average benefits.Longitudinal (life course) results can be tabulated for cohorts, age groups, or other socioeconomicgroups (e.g. income before retirement, wealth, marital status over various periods, race, sex).
Because social security (as well as employer pensions) is very sensitive to life courseemployment and earnings histories, both individually and in the aggregate, the issue of the validityof CORSIM imputations of coverage and earnings data for 1937-1959, and simulations of historicemployment and earnings data for 1960-1996, rather than the use of actual data, is important. Socialsecurity and retirement income patterns depend on the joint distributions of employment and earningsand many other socioeconomic attributes, such as age, sex, marital status and marital histories,childbearing, and disability, as well as the expected or mean levels of these attributes for variousdemographic groups.
As of October 1997, simulations and projections of social security aggregate revenue, benefitexpenditures, and trust fund balances had not been made available to be compared with historic dataand projections made by others. CORSIM simulations of historic per capita benefit levels andnumbers of recipients in various socioeconomic categories for the 1960-1995 period differedsubstantially from reported data.
Proposed Private Pension Module. CORSIM staff have designed a Private Pension module,but it had not been developed as of September 1997.14 The design of the CORSIM Private Pensionmodule includes functions to estimate pension coverage and benefit entitlement and to estimate thedisposition of pension rights in the event of death, divorce, job change, disability, and retirement. ThePrivate Pension module creates a pension record for each CORSIM person. The pension recordincludes a description of the individual’s pension plan(s) characteristics and participation history(contributions and years of service). Each year, the person’s pension record is updated based onhis/her employment and whether or not he or she dies, divorces, or reaches the terminal age forreceiving benefits.
Private pension coverage and benefit entitlement are a direct result of a person’s employment.If a person has any weeks of work during the year (determined by the CORSIM weeks module), thePrivate Pension module first imputes the characteristics of the person’s employment, including full-time/part-time status, union membership, and whether the individual is self-employed. The modulealso determines if the weeks worked in the current year were at the same or a different job from theprevious year. If the person has changed jobs, the module determines the disposition of previouslyaccumulated pension benefits, if any. For all persons who had any weeks of work in a given year themodule determines pension coverage and participation. For persons who were covered by a pension
October 16, 19975-15
15 CORSIM’s pension module design uses the DYNASIM approach of assigning parameters of a prototypicalpension plan to each participant, rather than the PRISM approach of assigning participants to actual plan sponsorsand using the provisions of those sponsors’ actual pension plans.
last year but have no weeks of work in the current year the module determines the disposition of anyaccumulated pension assets.
The Private Pension Module includes seven sub-modules:• Pension Coverage - updates a person’s pension record based on employment status for the
current year;• Retirement - determines pension retirement benefit amount and payment type;• Disability - determines disability benefits amount;• Death - determines death benefits and survivorship benefits;• Pension Benefits - determines benefit payments eligibility for disabled and dependent benefit
recipients;• Divorce - determines division of pension rights;• Termination - determines disposition of pension accruals after termination of employment (other
than retirement).
The structure of the proposed Private Pension Module is shown in Annex 5-3.
The Pension Coverage Sub-Module performs three functions: (1) determine if a person haspension coverage in a given year; (2) assign/determine pension plan characteristics for new plans; (3) update pension record for individuals continuing pension participation.
If a person is determined to be covered by a pension plan, the module will assign a type ofplan (defined benefit, defined contribution, or both) and then assign plan characteristics as follows:15
Defined benefitContributory/non-contributory
If contributory, assign salary percentageSalary base for determination of pension benefit
Average of last x years of employmentAverage of highest x years of employmentCareer average
Integration with Social Security (Y/N)Replacement rate (percentage of salary base pension will ‘replace’)
Defined contributionMaximum and minimum contribution percentagesEmployer match/no employer match
If employer match, assign maximum match percentageRate of return
October 16, 19975-16
All plansVesting provisions
Cliff (vested after x years of service)Full and immediateGraded (x% at year y, x% at year y+t, etc.)
Spousal rights on death of pensionerspouse pension of x% of employee’s pensioncontinuation of employee’s pension for x monthsjoint survivorship pension
Dependent benefits on death of pensionerDeath benefits (lump sum payment on death)Disability benefits
qualificationsbenefits
Normal retirement ageEarly Retirement provisions.
Each person that has a pension will have a pension record that includes (for each pension) thecharacteristics of the pension and the individual’s qualified years of service under the plan.Additionally, for contributory plans, the record will include the employee’s yearly contribution andemployer match contribution, if applicable. Persons with defined contribution plans will also havean entry for the annual rate of return. These entries will be updated yearly.
The Retirement sub-module determines the pension benefits received by persons upon theirretirement. It is assumed that the defined benefit plans will pay a monthly benefit, calculatedaccording to the characteristics recorded in the pension record, and that defined contribution planswill pay out a lump-sum which is rolled over (tax free) to an annuity.
For defined benefit plans, the module determines if the person meets the pension planrequirements for “normal” retirement; either by reaching retirement age (usually 65) or reaching aminimum number of years of service (usually 20). If not, the plan calculates the early retirementmonthly benefit. Then, the module checks for a defined contribution component and calculates thelump-sum benefit if applicable. For defined contribution (only) plans, the module calculates theperson’s lump-sum distribution.
The Disability sub-module calculates monthly benefits from private pensions for individualsthat become permanently disabled. The Death sub-module assigns the disposition of pension benefitsor rights upon the death of the covered person.
The Pension Benefits Sub-Module performs the following functions: (1) adds retirement (fordefined benefit pensioners), disability, spouse, and dependent benefit payments to income; (2) movesdisabled persons to retirement benefits when they reach the normal retirement age for their plans; and(3) ends dependent pensions when the beneficiary reaches 18 years of age.
October 16, 19975-17
16 Most probabilities in CORSIM are estimated using a logistic specification: p = (1/(1+e-Bx). Parameters areestimated by transforming to the logit: Bx = ln(p/(1-p)). The micro equations are then aligned by comparing thelogit calculated using the historic group data with the logit calculated using the mean of the initial simulatedprobabilities. Adding the difference between these two “group-level” logits to the logit equation for eachindividual will not, in general, produce an exact alignment on the first pass, but ordinarily converges after severaliterations. CORSIM documentation refers to the group mean of the initial simulated probabilities as the microrate or mrate and the historical group average rate as hist. The adjustment constant to be added to the Bx is gp =ln(hist/(1-hist))-ln(mrate/(1-mrate)).
The Divorce Sub-Module assigns the disposition of pension rights upon divorce. TheTermination Sub-Module determines the disposition of pensions when an individual changes jobs orstops working for a reason other than retirement.
As of October 1997, CORSIM staff had identified several potential data bases to develop theparameters of the pension model, but had not determined which ones to use. Under considerationwere the Survey of Consumer Finances, the Current Population Survey Employee BenefitsSupplements, the survey of Asset and Health Dynamics Among the Oldest Old (AHEAD), the Healthand Retirement Survey (HRS), the Retirement History Survey, and the PSID.
Controls and Alignment
CORSIM has an extensive set of alignment procedures for most modules. Because CORSIMbegins with a 1960 data file and simulates the period 1961-1996, extensive historical data areavailable to compare and align the simulated data. Because CORSIM’s projections for future yearsare based largely on simulated historical data, it is important that the simulated historical data bealigned to actual data. Most module outcomes are aligned in two stages.
First, individual micro outcomes (usually probabilities) are aggregated or tabulated fordemographic groups for which independent historical data are available. Group alignment factors arecalculated by comparing the group mean of the initial simulated outcomes with the historical groupdata. Individual outcomes or probabilities are then adjusted so that the group mean after alignmentcorresponds to the historical data. The adjustments are usually multiplicative. This alignmentprocedure requires a second pass through the data in the file. In the first pass the initial outcomesor probabilities are estimated, which are used to calculated the alignment factors. In the second passthe initial micro outcomes are adjusted to align to the historic data. Because probabilities must beconstrained to be between zero and one, the adjustment may take the form of an additive adjustmentto the logit of the probabilities, rather than a multiplicative adjustment to the probabilities themselves,which could make some probabilities greater than one.16 This non-linear alignment procedure mayrequire more than one iteration.
In the second stage, the outcomes aligned to group data are aggregated and compared tohistoric aggregate data. The individual outcomes may then be aligned so that in the aggregate theymatch the historic aggregate data.
October 16, 19975-18
17 The population of the United States in 1960 was 179,323,175.
18 CORSIM staff are considering several databases for development of the private pension module, including theSurvey of Consumer Finances, Current Population Survey Employment Benefits Supplements, AHEAD, Healthand Retirement Survey, Retirement History Survey, and PSID.
This alignment procedure is designed so that the historic simulations track historic data, byaligning to historic group data, while the “distribution” of individual outcomes over individuals in thegroup reflects individual-level variables.
CORSIM uses the time series of historic alignment factors to develop alignment factors forthe projections of future years. In addition, projections of future years can be aligned to otherprojections of aggregate outcomes, such as aggregate fertility rates, mortality rates, rates of averagewage growth, etc. Simulations are often aligned to projections done by the Office of the Actuary ofthe Social Security Administration.
Databases
CORSIM operates on the 1960 U.S. Census Public Use Microdata Sample (PUMS). The fullPUMS is a one-in-1000 sample of the U.S. Census and includes about 180,000 person records.17
Because it is a random sample of the census, each of the person records in the PUMS has the sameweight, 1,000, meaning that each person record in the PUMS represents 1,000 persons in the U.S.population. Often, CORSIM is run on smaller samples of the PUMS, such as 20,000 or 50,000.
Data from nine large national microdata files were used to estimate the equations of themodel, and data from other files, including survey data and program administrative data, were usedto develop rule-based algorithms and to validate the model. The data used to develop and operatethe various modules of the model are listed in the Summary Description Table in Annex 5-1.Databases used to develop demographic modules include the National Longitudinal Survey (NLS)(1973-87), National Longitudinal Survey - Youth (1969-87), National Longitudinal Mortality Survey(1980-89), Panel Study of Income Dynamics (PSID) (1968-88), High School and Beyond Survey(HSB) (1980-86). Work and earnings modules were estimated using the PSID (1972-88). Assetaccumulation was estimated and aligned using the Surveys of Consumer Finance of 1962, 1966, 1971,1975, 1983, 1986, 1989, 1992, as well as IRS estate tax data and the Federal Reserve Board Flowof Funds Accounts. Health risk factors were estimated using National Health Interview Surveys of1970 and 1984 and the NLS 1986-87. In addition, census data of 1960, 1970, 1980, 1990 wereused.18
CORSIM’s use of the 1960 Census PUMS as its base data file is an issue. A large data filethat is several decades old was chosen to serve as the base file to permit CORSIM to simulate theevolution of the population over several decades for which historic data are available, so that theoperation of the model could be assessed by comparing its simulations to actual data and to use themodel to investigate and understand actual historic outcomes. This reflects CORSIM’s origins andprimary role as a tool for academic research. The CORSIM developers argue that simulating the
October 16, 19975-19
19 Caldwell, Steven B., CORSIM 2.0 Model Documentation Version 5, Cornell University, Ithaca, NY, October1, 1993.
20 Caldwell, Steven B. et al., CORSIM 3.0 User and Technical Documentation, Cornell University, Ithaca, NY,March 1997. This document is available on the CORSIM web page athttp://misic.soc.cornell.edu/docs/techdoc/index.html (index) and http://misic.soc.cornell.edu/docs/techdoc/new_tech.html.
model for a lengthy historic period permits them to understand and validate the socioeconomicprocesses depicted in the model and develop alignment factors that will improve projections of futureyears. However, CORSIM simulations of many processes do not track historical data veryaccurately, even after the first stage alignments (described above). Without realigning or rebasingthe data for a recent historic year, projections of future years may begin from a base that already issubject to errors accumulated over a 35 year simulation period. Even if many group and aggregateoutcomes can be aligned to recent data exactly, there is no way to assure that the joint distributionsbased on the 1960 data remain accurate after 35 years.
Documentation
Although extensive and informative, CORSIM’s documentation is incomplete and inadequate.Available documentation includes a lengthy 1993 research documentation for CORSIM 2.019 and acomprehensive 1997 technical and programmer’s guide for CORSIM 3.0.20 The researchdocumentation contains interesting and informative background discussion of microsimulationmodeling and the issues and problems involved, and background discussion of some of the modules.The discussion of many modules is incomplete and out of date. It provides almost no empiricalestimation results, so it is impossible for the reader to evaluate the validity of the model equations.
Computer Hardware, Software and Portability
A key objective of CORSIM was portability across computational platforms. That dictatedthe choice of ANSI C language and the requirement that programmers write portable code. CORSIMruns under OS/2, UNIX, or Linux 1.3. A sophisticated user-friendly interface has not beendeveloped. CORSIM is highly modular and designed so that existing modules can be modified andnew modules can be added relatively easily.
CORSIM 3.0 currently is run at Cornell University on a dual processor Pentium Pro, 200MHZ each, with 4 GB hard drive and 256 MB RAM, as well as a main frame (IBM 3090/600). Onthe dual Pentium Pro a CORSIM run of 130 years (1960-2090), including the social security module,excluding the health risk, dental, voting and consumer expenditures modules, on a 50,000 personsample takes about fourteen hours. A run of the wealth module on a sample of 180,000 for 30 yearstakes about four hours.
October 16, 19975-20
21 The two labor input related variables --weeks worked and wages -- are modeled as functions of socioeconomiccharacteristics of the person, e.g. age, race, sex, education, marital status, etc. No labor demand-related factors areincluded, and no aggregate economic indicators are currently activated.
IV. APPLICATION TO IMPORTANT RETIREMENT POLICY ISSUES
The policy matrix tables in Annex 5-2 indicate the types of issues which CORSIM is suitableto address. There is a table for each of six major areas where changes in retirement income policycould have important implications. The rows, which are the same for each table, list severalimportant areas where policy changes could occur. The columns, which differ in each table, showaspects which are relevant or of concern in each of the major areas. Entries in each table show areaswhere CORSIM is suitable for analysis of the impacts of the types of policy changes indicated in therows on the aspects of the pension system indicated in the columns.
CORSIM models individual person and family behavior. It can be used to simulate individualwork histories, social security contributions, social security benefits receipt and amounts, and familywealth holdings. CORSIM records extensive kinship links, including links among divorced familymembers . It can analyze some policy issues for which information on personal histories is required.The current version of CORSIM does not model employer pensions, so it cannot address policyissues pertaining to private or government employee pensions.
Examples of issues suitable for analysis with CORSIM include social security policy issuessuch as earnings sharing, changes in benefit formula and indexing, and adoption of individualaccounts; effects of marriage and fertility changes on AFDC; effects of changing schooling on weeksworked and wages. CORSIM does not simulate employer or plan sponsor behavior, so it does nothave the capability to analyze the effects of policy measures on employers or on their offering ofpensions or other benefit plans. It does not depict the behavior of producers or industries, so itcannot be used to analyze industry outcomes. Other than very simple labor input variables, individualweeks worked and wages, CORSIM does not depict any aggregate economic behavior, so it cannotanalyze effects on the aggregate economy, such as saving, investment, GDP growth, or interestrates.21
Benchmarks
Appendix C describes seven illustrative policy issues that can be used as benchmarks to assessand compare the suitability of various models for analysis of retirement income policy in variousareas. This section reviews the suitability of CORSIM for analysis of each of these illustrativebenchmark policy issues.
1. Effects of increase in Social Security Normal Retirement Age on:OASI revenues, benefit payments, trust fund balances -- CORSIM has the formal mechanics toanalyze the statutory effects of change in social security normal retirement age (NRA). Change in
October 16, 19975-21
eligibility for OAI full retirement benefit and change in early retirement reduction can be programmedand will change the retirement benefit amount. However, CORSIM does not have a behavioralretirement model. None of the variables affected by the change in normal retirement age arerepresented in the CORSIM retirement benefit receipt timing equation. Ad hoc assumptions aboutpotential changes in retirement behavior could be made. In concept, CORSIM can be used tocalculate effects on OASI revenues, benefit payments, and trust fund balances, but the trust fundmodel is rudimentary. It can calculate payroll tax liabilities and social security retirement benefitpayments for each person, which can be aggregated. DI benefit payments and trust fund balances -- The CORSIM DI module simulates increased eligibilityfor DI benefits as the NRA is increased under the 1983 law. (The methodology is not documented.)Accurate analysis may require additional research. Currently, all DI beneficiaries convert to OAI atage 65. The DI module was not estimated for persons age 65 and 66, since there are no historic datafor DI receipt at ages 65 and 66.Employer pension accruals and benefit costs -- CORSIM does not model employer pension plans oremployer behavior. Pension accruals and benefit costs are not depicted.Social security retirement replacement rates and total retirement income replacement rates --CORSIM’s longitudinal earnings records and social security model provide the capability to calculatesocial security replacement rates, for various assumptions about retirement behavior. CORSIM doesnot currently depict employer pensions. The family asset module does not depict effects of changesin retirement behavior or expectations on assets. Consequently, CORSIM could not analyze effectson total retirement income.
2. Means testing of Social Security benefits.In concept, with some reprogramming, CORSIM could be used to estimate the effects of meanstesting of social security benefits on total benefit payments. It depicts earnings and asset income, butcurrently it does not depict pension income. It currently depicts the effects of the social securityearnings test on individual benefits and means testing of SSI. CORSIM does not have behavioralmodels of DI or OAI benefit receipt. Ad hoc assumptions about benefit receipt would be required.Effects on income replacement rates could be simulated. CORSIM does not depict employer costs,so the effects on employer costs could not be simulated.
3. Mandatory minimum employer pension.The 1997 version of CORSIM could not be used to estimate effects on workers or employers of amandatory employer pension. The proposed private pension module may have the capability tosimulate effects of a mandatory minimum pension on workers. CORSIM could not simulate theeffects on employers or the potential changes in other pensions, wages, or employment. CORSIMdoes not depict employer pension accruals.
4. Expansion of individual retirement account eligibility.CORSIM could not be used to estimate effects of expansion in IRA eligibility. CORSIM does nothave an individual retirement account model. Individual retirement account assets in the familywealth module are not modeled with reference to IRA rules. Because CORSIM does not depictsaving behavior or macroeconomic effects, it could not estimate any policy effects on total retirement
October 16, 19975-22
savings, personal savings, national savings, capital formation, or GDP. It does not depict federalexpenditures, deficits, or debt.
5. Effects of value added tax on pension contributions and accruals.CORSIM cannot address issues concerning the effects of taxes on pension offerings, contributions,or accruals. The model does not depict the effects of taxes on individual or firm behavior. It doesnot depict the behavior of corporations or other employers, so it does not depict pension plansponsors.
6. Effects of construction industry benefit accrual rates on funding.CORSIM is not suitable to analyze issues concerning the condition or behavior of employer pensionfunds. CORSIM does not model employers, industries, sponsors, or pension funds.
7. Effects of alternative macroeconomic scenarios on social security and employer pensions.CORSIM in general is not appropriate for analysis of effects of alternative macroeconomic scenarioson other aggregates, such as social security fund balances. Aggregate economic variables do notenter any individual equations. Individual labor market outcomes in each period, such as weeksworked and wages, can be controlled to align to external group and aggregative data. Projectionscould, in concept, be controlled to align to alternative macroeconomic scenarios. CORSIM couldin this way be used to simulate longitudinal earnings and employment histories under alternativemacroeconomic scenarios. These longitudinal earnings and employment histories are inputs into thedetermination of social security receipt and benefit levels. In this way CORSIM can be used todepict some of the effects of alternative macroeconomic scenarios on various socioeconomic ordemographic groups. CORSIM does not depict employer pension fund balances or accruals. The1997 version of CORSIM does not depict individual participation in or receipt of employer pensions.
V. ACCESSIBILITY AND EASE OF USE
CORSIM is a proprietary model owned by Cornell University. CORSIM was developed tofacilitate research in microsimulation modeling, and the CORSIM project wants to encourage use ofthe model. Model code is available to users at reasonable cost and to collaborators at no cost. Thecode is designed to be portable. The technical user’s guide provides instructions in theimplementation, use, and modification of the model. The code is written in ANSI C programminglanguage, and a technical user planning to adapt the model should be familiar with C. The model doesnot have a user-friendly interface, but the code and technical documentation are reasonably clear andaccessible to the technical user familiar with C. It is likely that any outside individual or organizationacquiring the model would require assistance initially from CORSIM programming staff, which couldbe provided at reasonable cost.
The available documentation of the model for the research or policy analysis user is out ofdate and unsatisfactory (see Section III). Considerable effort would be required for an analystunfamiliar with the model to understand its current features and properties and to assess the validityof its modules.
October 16, 19975-23
22 This model is described in Chapter 6.
CORSIM may provide a platform with potential to add modules of interest to the Society ofActuaries. It was designed to permit researchers to add or modify modules. It is highly modular andportable. The CORSIM team at Cornell are currently developing a private pension module. Theprivate pension module is still in the design stage, and its developers may be open to input andassistance from outside groups.
CORSIM does not provide any representation of firms, employers, government entities,industries, or other organizations. Consequently, development of modules depicting plan sponsor oremployer behavior would require a major development effort. It has no regional attributes.
The CORSIM structure and computer code have been successfully adopted and adapted bythe Office of the Superintendent of Financial Institutions (OSFI) of the Government of Canada toserve as the basis for the development of a model of the Canadian population and Canada PensionPlan (which corresponds to the U.S. social security system).22 CORSIM staff and OSFI staff continueto work together on development and updating of both models.
Contracting with the CORSIM project to conduct specific studies, add modules, or providethe model and assistance in its use would be feasible. CORSIM staff appear to be interested incollaboration with outside groups.
The fact that CORSIM has been developed and is maintained at an academic institution maybe associated with certain features that should be considered. It has been primarily a research tool.This orientation accounts for the use of a 1960 data file to serve as the base population sample to beaged. Valuable research results and insights can be developed from investigation of simulations ofpast periods, even if those simulations do not replicate closely historical data. However, greaterverisimilitude may be a more important property in a policy analysis environment to lend the analysiscredibility. CORSIM staff have been composed of a full-time faculty member and graduate students(primarily in sociology) at Cornell. CORSIM has benefitted from the ability to draw on resources andpersonnel at a major research university, and research conducted by faculty and graduate students hascontributed to its development. However, CORSIM does not have a permanent staff of experiencedprofessionals. It should be recognized that academic personnel may have multiple commitments andmay not always be available full time to an outside organization.
VI. CRITIQUE
CORSIM is a large scale microsimulation model which simulates many demographic andsocial events, giving it flexibility and breadth. The computer code is portable and modular. Thetechnical user/programmer documentation appears to be fairly clear and complete, although in 1997it did not include the current wealth nor social security modules. The documentation for theresearcher/analyst is incomplete and out-of date.
October 16, 19975-24
23 Of the major microsimulation models, DYNASIM probably incorporates the most economic research,although much of this research may now be out of date. In fact, all three microsimulation models reviewed in thisreport have many components that are ad hoc, in the sense that they have equations or transition probabilities thatdescribe or replicate data in a particular data base or observed trends over a particular period, without providing amore general, underlying explanatory model. If the underlying determinants change in the future, the descriptiveequations or probabilities may no longer be accurate.
24 The aggregate unemployment rate was included in the estimation equation for annual weeks worked, but it isnot activated in the current version of the model.
25 A mechanical or rule-based, rather than behavioral, approach to modeling social security is reflected in thedescription of the CORSIM social security module. The authors write:
We have attempted to construct the OASDI module in such a way that any step upon which other steps dependprecedes the dependent step or steps. For example, assignment of retirement benefit timing must alwaysprecede assignment of retirement benefit level, given that there are adjustments to benefit amounts mandatedfor cases of early or delayed retirement. As essentially all of the steps in CORSIM’s OASDI module dependupon marital, child rearing, and labor force trajectories, the module is invoked only after outcomes for all ofCORSIM’s regular processes (deaths, births, marital status changes, changes in work effort, and so on) havebeen determined for the current year. (Caldwell and Favreault, 1995) (Italics added by the author.)
CORSIM includes a comprehensive social security module which depicts in detail theprovisions of the system and has extensive report and tabulation capabilities.
CORSIM has relatively little economic behavioral content. With the exception of the weeksworked and wages modules developed in 1988, neither economists nor actuaries have worked onCORSIM. Most of the equations for attributes and behaviors in CORSIM are descriptive. Ingeneral, the equations do not appear to be based on well articulated theories or models of economicbehavior.23
From the perspective of retirement policy, CORSIM has several weaknesses. The labormarket module is weak. The only two aspects of labor market behavior that are depicted are weeksworked and wages, and these are modeled with reference to demographic attributes only (see Table5-1).24 There is no depiction of labor force participation, unemployment, or hours. There is noidentification of industry affiliation or size of firm of workers, two attributes that are important forpension analysis. Employment class (self-employed), occupation, labor union affiliation are notdepicted.
The social security model assigns coverage randomly (aligning to historical percentages). Themodel uses no historical earnings records, but rather imputes earnings before 1960 to each worker,and simulates earnings after 1960. This is an area where data are available, and where accurateimputation would seem to be both important and difficult.
CORSIM has no behavioral retirement function. In the current version, there is no feedbackfrom changes in social security or other aspects of retirement income or retirement saving to affectlabor market behavior or retirement.25
October 16, 19975-25
Similarly, CORSIM has an elaborate family wealth imputation module, but it has minimaleconomic behavioral content and does not provide links to social security or other aspects ofretirement income or retirement savings policy or institutions.
A crucial aspect of CORSIM is its reliance on the 1960 census sample for its basic data file.From the perspective of its developer, this is a strength and provides a framework for valuableresearch into both socioeconomic patterns and microsimulation modeling methodology. It providesopportunities to investigate the accuracy of various modules, theories, and behavioral representations,and to improve the model’s alignment to historical data. This view holds that the opportunity toexamine the behavior of the model over a long historical period will improve its validity for projectingfuture periods. However, the ability of the model, even with extensive alignment, to providesimulated historical data that are accurate and capture the many changes in family structure,socioeconomic patterns, and joint distributions that have occurred over the past 35 years is a concern.In particular, the use of randomly assigned social security coverage and simulated earnings historiesfor the 1960-1996 period may be a particular concern for retirement income policy. (It must berecognized, however, that the most recent available social security earnings histories data are fromthe 1978 CPS-SSA match, and are 19 years old in 1997, so earnings histories must be simulated forthe 1979-1996 period in any case.)
Despite alignment to historic group data, the reported simulations of social security outcomesand family wealth appear to vary significantly from historic aggregate data. This attests to theperhaps inherent difficulties of microsimulation modeling. It also reinforces the concern about usingsimulated historic data as the base for projections of the future.
Of the three major U.S. microsimulation models reviewed in this report, CORSIM has themost recently developed code and simulation system. It does not yet have a private pension module,although one is in the design stage. The CORSIM private pension model design is similar to that ofDYNASIM, in that it assigns workers to simplified, prototypical pension plans, rather than to actualplan offerings of actual plan sponsors, as does PRISM. Of the three microsimulation models,CORSIM has the least economic behavioral content. It also provides the least information relevantto retirement policy, such as industry, hours worked, firm size, and labor union affiliation. CORSIMhas been designed to be portable and to be adaptable and expandable and to investigate the feasibilityof conducting microsimulation research and developing microsimulation models at reasonable cost.
5-26
ANNEX 5-1
CORSIM 3.0
SUMMARY DESCRIPTION TABLE
October 16, 1997
ANNEX 5-1
CORSIM 3.0
Summary Description
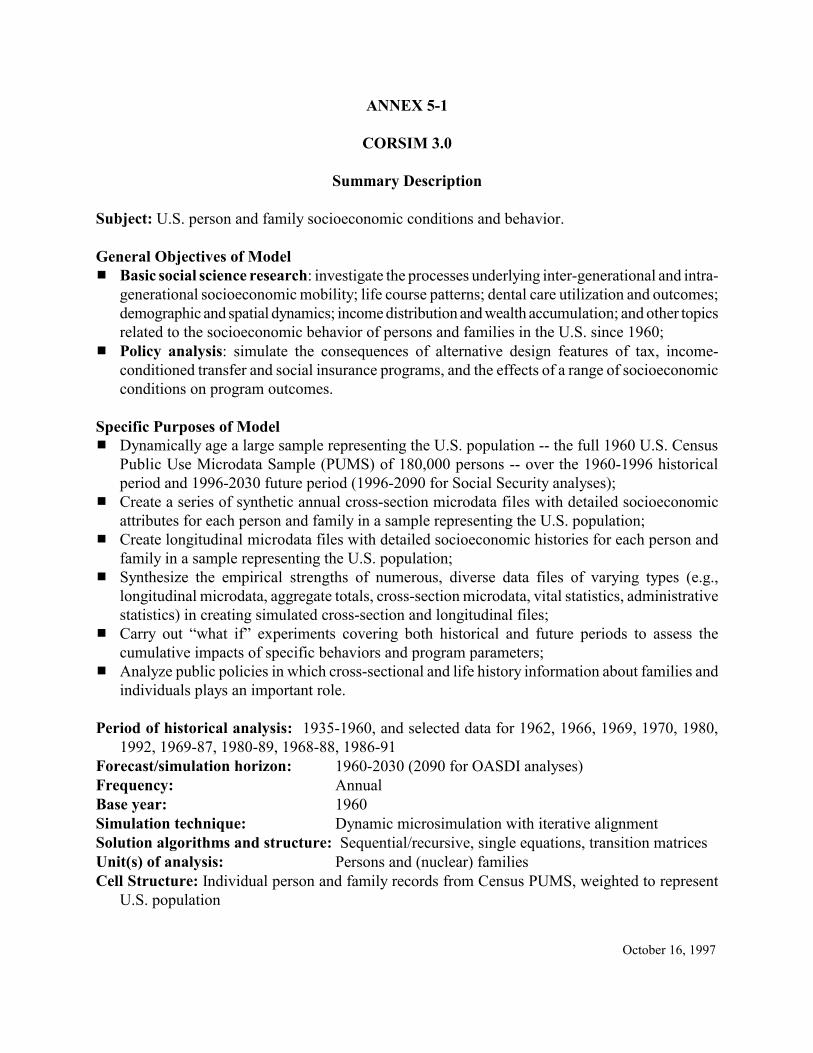
Subject: U.S. person and family socioeconomic conditions and behavior.
General Objectives of Model# Basic social science research: investigate the processes underlying inter-generational and intra-
generational socioeconomic mobility; life course patterns; dental care utilization and outcomes;demographic and spatial dynamics; income distribution and wealth accumulation; and other topicsrelated to the socioeconomic behavior of persons and families in the U.S. since 1960;
# Policy analysis: simulate the consequences of alternative design features of tax, income-conditioned transfer and social insurance programs, and the effects of a range of socioeconomicconditions on program outcomes.
Specific Purposes of Model# Dynamically age a large sample representing the U.S. population -- the full 1960 U.S. Census
Public Use Microdata Sample (PUMS) of 180,000 persons -- over the 1960-1996 historicalperiod and 1996-2030 future period (1996-2090 for Social Security analyses);
# Create a series of synthetic annual cross-section microdata files with detailed socioeconomicattributes for each person and family in a sample representing the U.S. population;
# Create longitudinal microdata files with detailed socioeconomic histories for each person andfamily in a sample representing the U.S. population;
# Synthesize the empirical strengths of numerous, diverse data files of varying types (e.g.,longitudinal microdata, aggregate totals, cross-section microdata, vital statistics, administrativestatistics) in creating simulated cross-section and longitudinal files;
# Carry out “what if” experiments covering both historical and future periods to assess thecumulative impacts of specific behaviors and program parameters;
# Analyze public policies in which cross-sectional and life history information about families andindividuals plays an important role.
Period of historical analysis: 1935-1960, and selected data for 1962, 1966, 1969, 1970, 1980,1992, 1969-87, 1980-89, 1968-88, 1986-91
Forecast/simulation horizon: 1960-2030 (2090 for OASDI analyses)Frequency: AnnualBase year: 1960Simulation technique: Dynamic microsimulation with iterative alignment Solution algorithms and structure: Sequential/recursive, single equations, transition matricesUnit(s) of analysis: Persons and (nuclear) familiesCell Structure: Individual person and family records from Census PUMS, weighted to represent
U.S. population
5-1-2
October 16, 1997
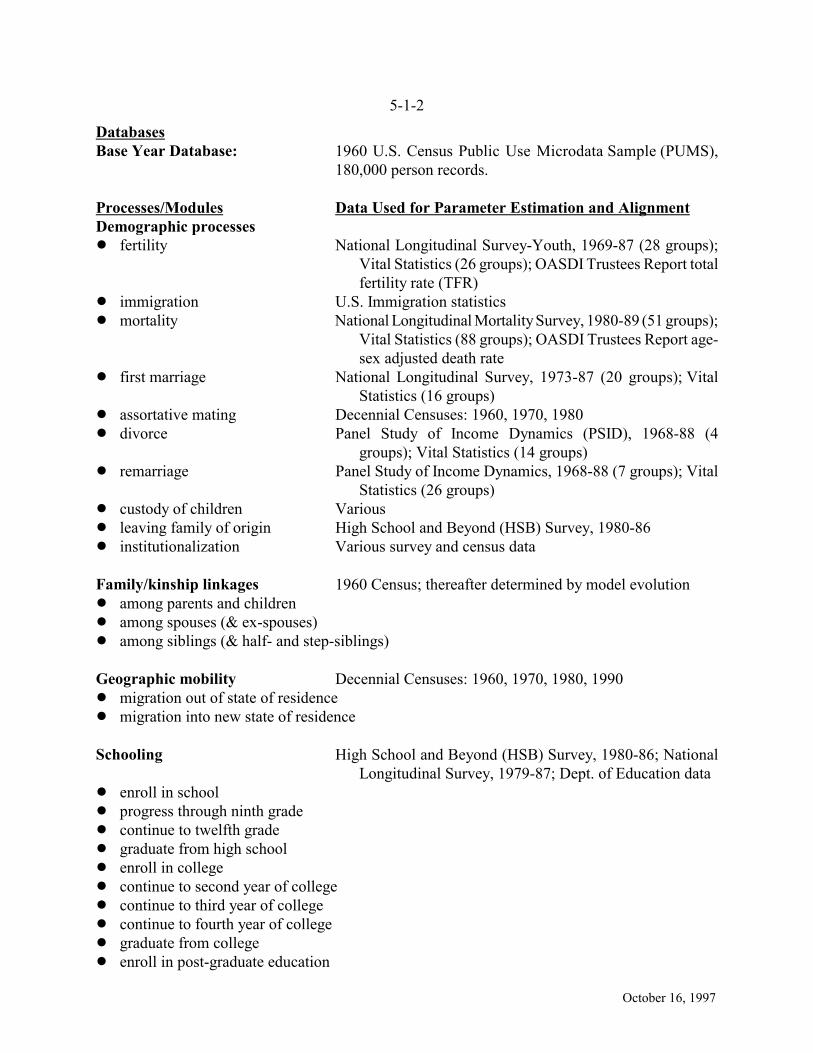
DatabasesBase Year Database: 1960 U.S. Census Public Use Microdata Sample (PUMS),
180,000 person records.
Processes/Modules Data Used for Parameter Estimation and AlignmentDemographic processes! fertility National Longitudinal Survey-Youth, 1969-87 (28 groups);
Vital Statistics (26 groups); OASDI Trustees Report totalfertility rate (TFR)
! immigration U.S. Immigration statistics ! mortality National Longitudinal Mortality Survey, 1980-89 (51 groups);
Vital Statistics (88 groups); OASDI Trustees Report age-sex adjusted death rate
! first marriage National Longitudinal Survey, 1973-87 (20 groups); VitalStatistics (16 groups)
! assortative mating Decennial Censuses: 1960, 1970, 1980! divorce Panel Study of Income Dynamics (PSID), 1968-88 (4
groups); Vital Statistics (14 groups)! remarriage Panel Study of Income Dynamics, 1968-88 (7 groups); Vital
Statistics (26 groups)! custody of children Various ! leaving family of origin High School and Beyond (HSB) Survey, 1980-86 ! institutionalization Various survey and census data
Family/kinship linkages 1960 Census; thereafter determined by model evolution! among parents and children ! among spouses (& ex-spouses)! among siblings (& half- and step-siblings)
Geographic mobility Decennial Censuses: 1960, 1970, 1980, 1990! migration out of state of residence! migration into new state of residence
Schooling High School and Beyond (HSB) Survey, 1980-86; NationalLongitudinal Survey, 1979-87; Dept. of Education data
! enroll in school! progress through ninth grade! continue to twelfth grade! graduate from high school! enroll in college! continue to second year of college! continue to third year of college! continue to fourth year of college! graduate from college! enroll in post-graduate education
5-1-3
October 16, 1997
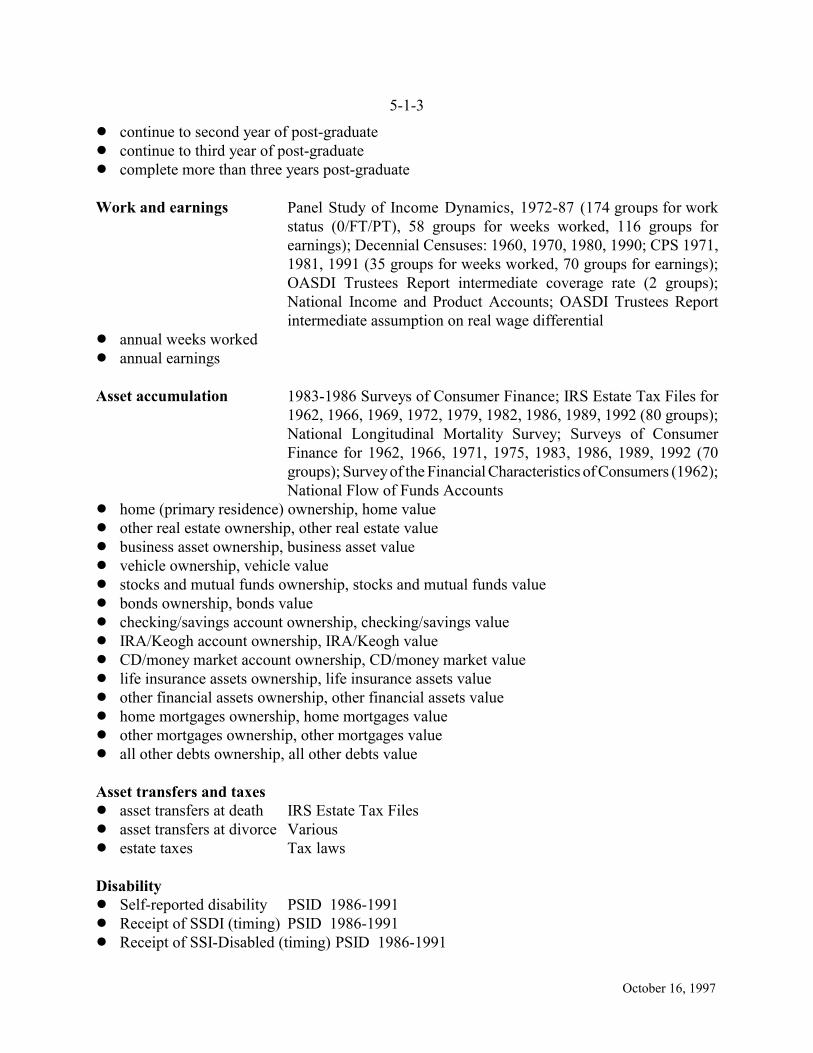
! continue to second year of post-graduate! continue to third year of post-graduate! complete more than three years post-graduate
Work and earnings Panel Study of Income Dynamics, 1972-87 (174 groups for workstatus (0/FT/PT), 58 groups for weeks worked, 116 groups forearnings); Decennial Censuses: 1960, 1970, 1980, 1990; CPS 1971,1981, 1991 (35 groups for weeks worked, 70 groups for earnings);OASDI Trustees Report intermediate coverage rate (2 groups);National Income and Product Accounts; OASDI Trustees Reportintermediate assumption on real wage differential
! annual weeks worked! annual earnings
Asset accumulation 1983-1986 Surveys of Consumer Finance; IRS Estate Tax Files for1962, 1966, 1969, 1972, 1979, 1982, 1986, 1989, 1992 (80 groups);National Longitudinal Mortality Survey; Surveys of ConsumerFinance for 1962, 1966, 1971, 1975, 1983, 1986, 1989, 1992 (70groups); Survey of the Financial Characteristics of Consumers (1962);National Flow of Funds Accounts
! home (primary residence) ownership, home value! other real estate ownership, other real estate value! business asset ownership, business asset value! vehicle ownership, vehicle value! stocks and mutual funds ownership, stocks and mutual funds value! bonds ownership, bonds value! checking/savings account ownership, checking/savings value! IRA/Keogh account ownership, IRA/Keogh value! CD/money market account ownership, CD/money market value! life insurance assets ownership, life insurance assets value! other financial assets ownership, other financial assets value! home mortgages ownership, home mortgages value! other mortgages ownership, other mortgages value! all other debts ownership, all other debts value
Asset transfers and taxes! asset transfers at death IRS Estate Tax Files! asset transfers at divorce Various! estate taxes Tax laws
Disability! Self-reported disability PSID 1986-1991! Receipt of SSDI (timing) PSID 1986-1991! Receipt of SSI-Disabled (timing) PSID 1986-1991
5-1-4
October 16, 1997
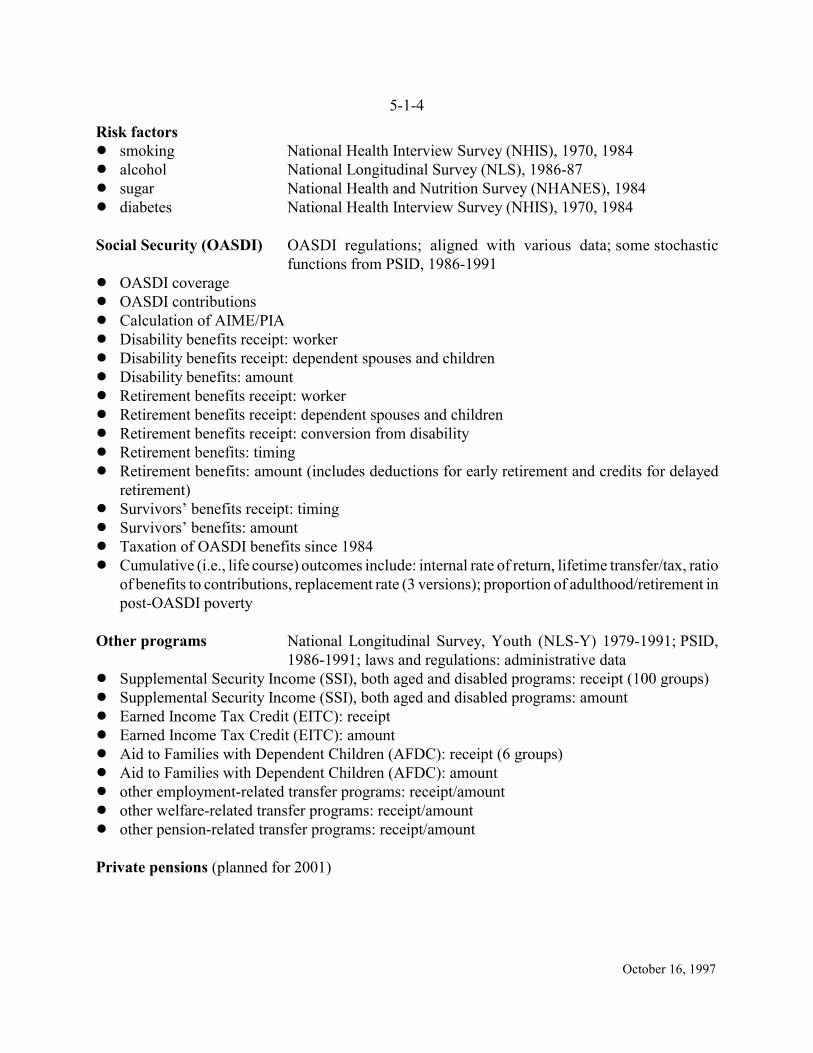
Risk factors! smoking National Health Interview Survey (NHIS), 1970, 1984! alcohol National Longitudinal Survey (NLS), 1986-87! sugar National Health and Nutrition Survey (NHANES), 1984! diabetes National Health Interview Survey (NHIS), 1970, 1984
Social Security (OASDI) OASDI regulations; aligned with various data; some stochasticfunctions from PSID, 1986-1991
! OASDI coverage! OASDI contributions! Calculation of AIME/PIA! Disability benefits receipt: worker! Disability benefits receipt: dependent spouses and children! Disability benefits: amount! Retirement benefits receipt: worker! Retirement benefits receipt: dependent spouses and children! Retirement benefits receipt: conversion from disability! Retirement benefits: timing! Retirement benefits: amount (includes deductions for early retirement and credits for delayed
retirement)! Survivors’ benefits receipt: timing! Survivors’ benefits: amount! Taxation of OASDI benefits since 1984! Cumulative (i.e., life course) outcomes include: internal rate of return, lifetime transfer/tax, ratio
of benefits to contributions, replacement rate (3 versions); proportion of adulthood/retirement inpost-OASDI poverty
Other programs National Longitudinal Survey, Youth (NLS-Y) 1979-1991; PSID,1986-1991; laws and regulations: administrative data
! Supplemental Security Income (SSI), both aged and disabled programs: receipt (100 groups)! Supplemental Security Income (SSI), both aged and disabled programs: amount! Earned Income Tax Credit (EITC): receipt! Earned Income Tax Credit (EITC): amount! Aid to Families with Dependent Children (AFDC): receipt (6 groups)! Aid to Families with Dependent Children (AFDC): amount! other employment-related transfer programs: receipt/amount! other welfare-related transfer programs: receipt/amount! other pension-related transfer programs: receipt/amount
Private pensions (planned for 2001)
5-1-5
October 16, 1997
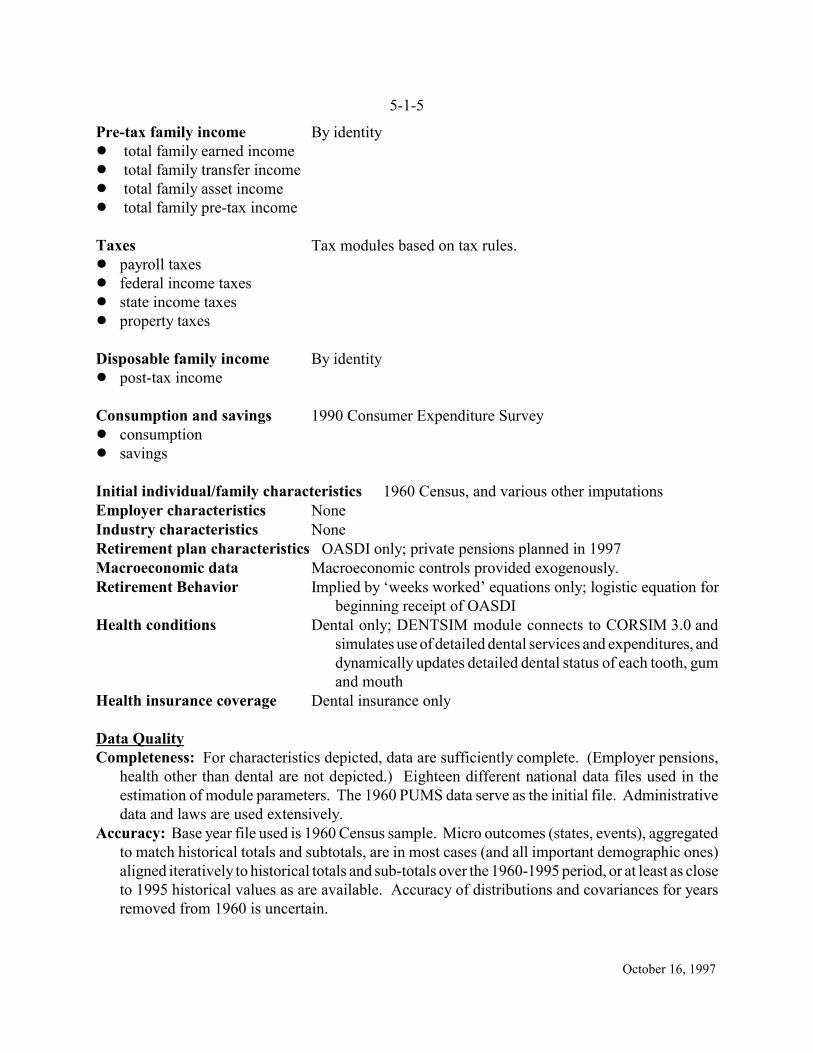
Pre-tax family income By identity! total family earned income! total family transfer income! total family asset income! total family pre-tax income
Taxes Tax modules based on tax rules.! payroll taxes! federal income taxes! state income taxes! property taxes
Disposable family income By identity! post-tax income
Consumption and savings 1990 Consumer Expenditure Survey! consumption! savings
Initial individual/family characteristics 1960 Census, and various other imputationsEmployer characteristics NoneIndustry characteristics None Retirement plan characteristics OASDI only; private pensions planned in 1997Macroeconomic data Macroeconomic controls provided exogenously.Retirement Behavior Implied by ‘weeks worked’ equations only; logistic equation for
beginning receipt of OASDI Health conditions Dental only; DENTSIM module connects to CORSIM 3.0 and
simulates use of detailed dental services and expenditures, anddynamically updates detailed dental status of each tooth, gumand mouth
Health insurance coverage Dental insurance only
Data QualityCompleteness: For characteristics depicted, data are sufficiently complete. (Employer pensions,
health other than dental are not depicted.) Eighteen different national data files used in theestimation of module parameters. The 1960 PUMS data serve as the initial file. Administrativedata and laws are used extensively.
Accuracy: Base year file used is 1960 Census sample. Micro outcomes (states, events), aggregatedto match historical totals and subtotals, are in most cases (and all important demographic ones)aligned iteratively to historical totals and sub-totals over the 1960-1995 period, or at least as closeto 1995 historical values as are available. Accuracy of distributions and covariances for yearsremoved from 1960 is uncertain.
5-1-6
October 16, 1997
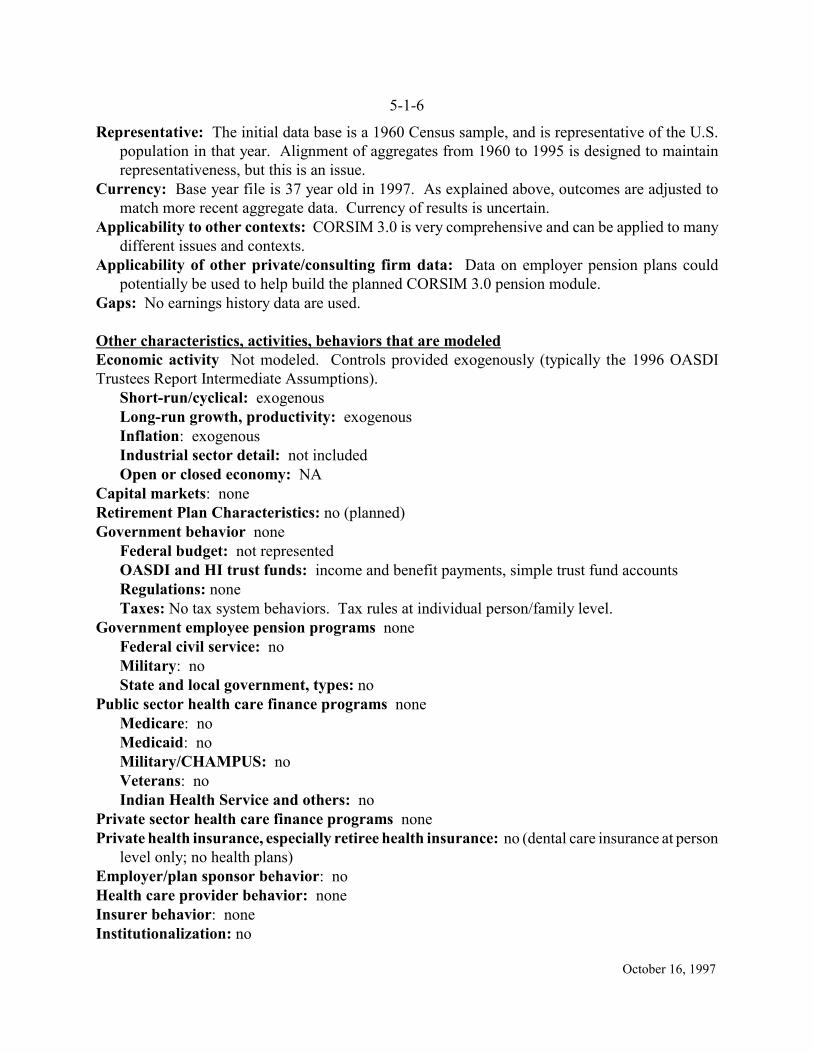
Representative: The initial data base is a 1960 Census sample, and is representative of the U.S.population in that year. Alignment of aggregates from 1960 to 1995 is designed to maintainrepresentativeness, but this is an issue.
Currency: Base year file is 37 year old in 1997. As explained above, outcomes are adjusted tomatch more recent aggregate data. Currency of results is uncertain.
Applicability to other contexts: CORSIM 3.0 is very comprehensive and can be applied to manydifferent issues and contexts.
Applicability of other private/consulting firm data: Data on employer pension plans couldpotentially be used to help build the planned CORSIM 3.0 pension module.
Gaps: No earnings history data are used.
Other characteristics, activities, behaviors that are modeledEconomic activity Not modeled. Controls provided exogenously (typically the 1996 OASDITrustees Report Intermediate Assumptions).
Short-run/cyclical: exogenousLong-run growth, productivity: exogenous Inflation: exogenousIndustrial sector detail: not included Open or closed economy: NA
Capital markets: noneRetirement Plan Characteristics: no (planned)Government behavior none
Federal budget: not representedOASDI and HI trust funds: income and benefit payments, simple trust fund accountsRegulations: noneTaxes: No tax system behaviors. Tax rules at individual person/family level.
Government employee pension programs noneFederal civil service: noMilitary: noState and local government, types: no
Public sector health care finance programs noneMedicare: noMedicaid: noMilitary/CHAMPUS: noVeterans: noIndian Health Service and others: no
Private sector health care finance programs nonePrivate health insurance, especially retiree health insurance: no (dental care insurance at person
level only; no health plans)Employer/plan sponsor behavior: noHealth care provider behavior: noneInsurer behavior: noneInstitutionalization: no
5-1-7
October 16, 1997
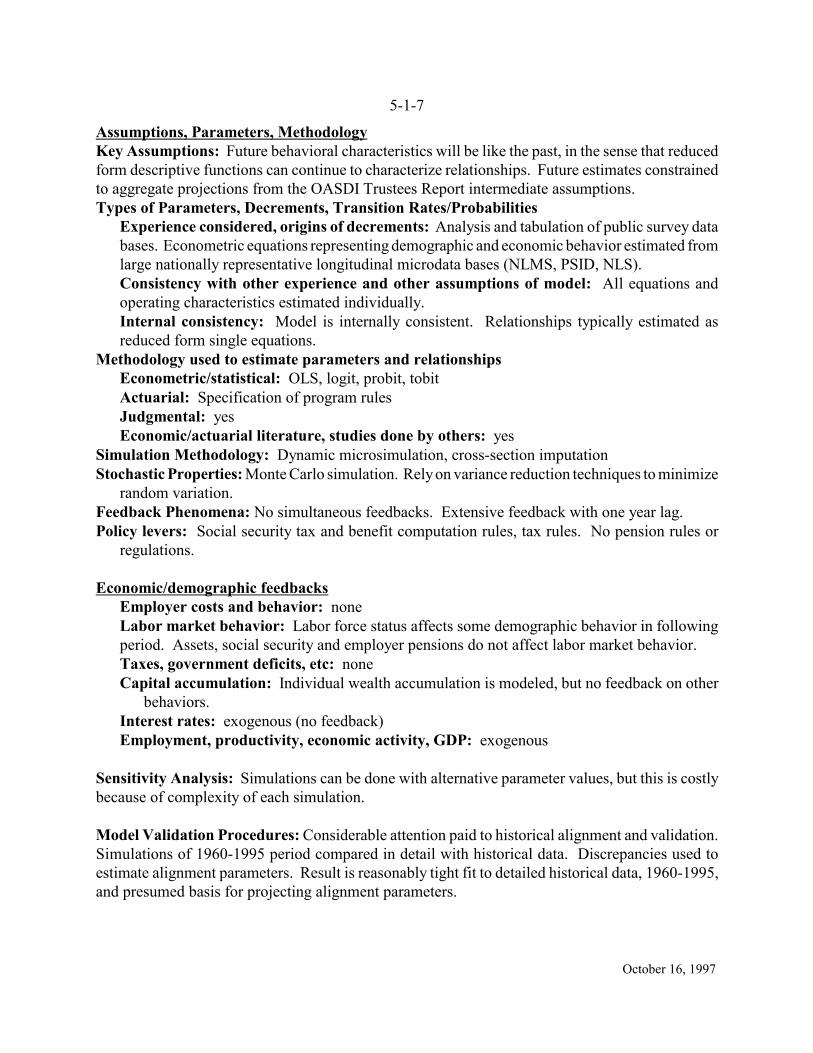
Assumptions, Parameters, MethodologyKey Assumptions: Future behavioral characteristics will be like the past, in the sense that reducedform descriptive functions can continue to characterize relationships. Future estimates constrainedto aggregate projections from the OASDI Trustees Report intermediate assumptions.Types of Parameters, Decrements, Transition Rates/Probabilities
Experience considered, origins of decrements: Analysis and tabulation of public survey databases. Econometric equations representing demographic and economic behavior estimated fromlarge nationally representative longitudinal microdata bases (NLMS, PSID, NLS).Consistency with other experience and other assumptions of model: All equations andoperating characteristics estimated individually.Internal consistency: Model is internally consistent. Relationships typically estimated asreduced form single equations.
Methodology used to estimate parameters and relationshipsEconometric/statistical: OLS, logit, probit, tobitActuarial: Specification of program rulesJudgmental: yesEconomic/actuarial literature, studies done by others: yes
Simulation Methodology: Dynamic microsimulation, cross-section imputationStochastic Properties: Monte Carlo simulation. Rely on variance reduction techniques to minimize
random variation. Feedback Phenomena: No simultaneous feedbacks. Extensive feedback with one year lag.Policy levers: Social security tax and benefit computation rules, tax rules. No pension rules or
regulations.
Economic/demographic feedbacksEmployer costs and behavior: noneLabor market behavior: Labor force status affects some demographic behavior in followingperiod. Assets, social security and employer pensions do not affect labor market behavior.Taxes, government deficits, etc: noneCapital accumulation: Individual wealth accumulation is modeled, but no feedback on other
behaviors.Interest rates: exogenous (no feedback) Employment, productivity, economic activity, GDP: exogenous
Sensitivity Analysis: Simulations can be done with alternative parameter values, but this is costlybecause of complexity of each simulation.
Model Validation Procedures: Considerable attention paid to historical alignment and validation.Simulations of 1960-1995 period compared in detail with historical data. Discrepancies used toestimate alignment parameters. Result is reasonably tight fit to detailed historical data, 1960-1995,and presumed basis for projecting alignment parameters.
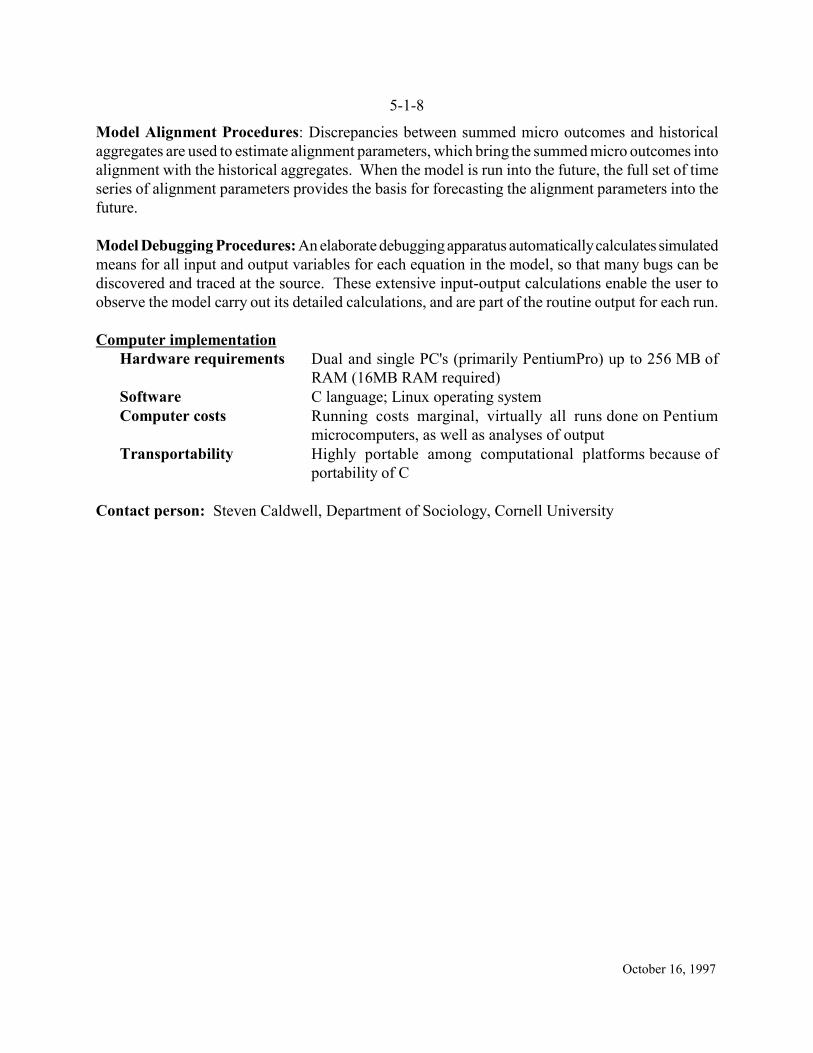
5-1-8
October 16, 1997
Model Alignment Procedures: Discrepancies between summed micro outcomes and historicalaggregates are used to estimate alignment parameters, which bring the summed micro outcomes intoalignment with the historical aggregates. When the model is run into the future, the full set of timeseries of alignment parameters provides the basis for forecasting the alignment parameters into thefuture.
Model Debugging Procedures: An elaborate debugging apparatus automatically calculates simulatedmeans for all input and output variables for each equation in the model, so that many bugs can bediscovered and traced at the source. These extensive input-output calculations enable the user toobserve the model carry out its detailed calculations, and are part of the routine output for each run.
Computer implementationHardware requirements Dual and single PC's (primarily PentiumPro) up to 256 MB of
RAM (16MB RAM required)Software C language; Linux operating systemComputer costs Running costs marginal, virtually all runs done on Pentium
microcomputers, as well as analyses of outputTransportability Highly portable among computational platforms because of
portability of C
Contact person: Steven Caldwell, Department of Sociology, Cornell University

October 16, 1997
ANNEX 5-2
CORSIM POLICY MATRICES

CORSIM -- POLICY MATRIX
1. Effects of Policy Measures on Employer Pensions
Outcome Variable
Policy Input
Offerings Types of plansand provisions
Costs of plans Funding Contributions and benefits
Tax Policy
Pension
General
Social Security
Retirement age
Benefit structure
Indexation
Payroll tax
Trust fund investment
Individual accounts
Funding and Guarantees
PBGC premium
Funding rules
Pension Regulation and Policy
ERISA/IRS
Employer plans
Pension and saving incentives/mandates
Blank cell indicates that the effects of the policy issue or input on that outcome cannot be simulated in this model. CORSIM does not depict employer pensions.
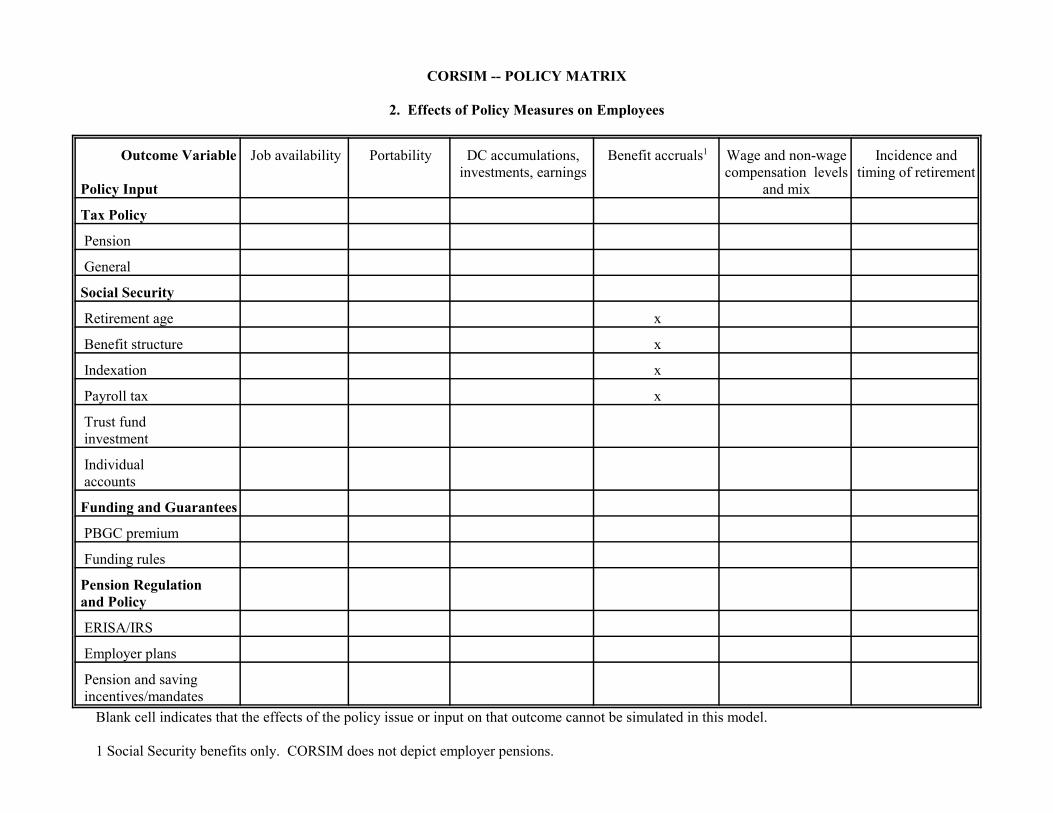
CORSIM -- POLICY MATRIX
2. Effects of Policy Measures on Employees
Outcome Variable
Policy Input
Job availability Portability DC accumulations,investments, earnings
Benefit accruals1 Wage and non-wagecompensation levels
and mix
Incidence andtiming of retirement
Tax Policy
Pension
General
Social Security
Retirement age x
Benefit structure x
Indexation x
Payroll tax x
Trust fund investment
Individual accounts
Funding and Guarantees
PBGC premium
Funding rules
Pension Regulation and Policy
ERISA/IRS
Employer plans
Pension and saving incentives/mandates
Blank cell indicates that the effects of the policy issue or input on that outcome cannot be simulated in this model.
1 Social Security benefits only. CORSIM does not depict employer pensions.
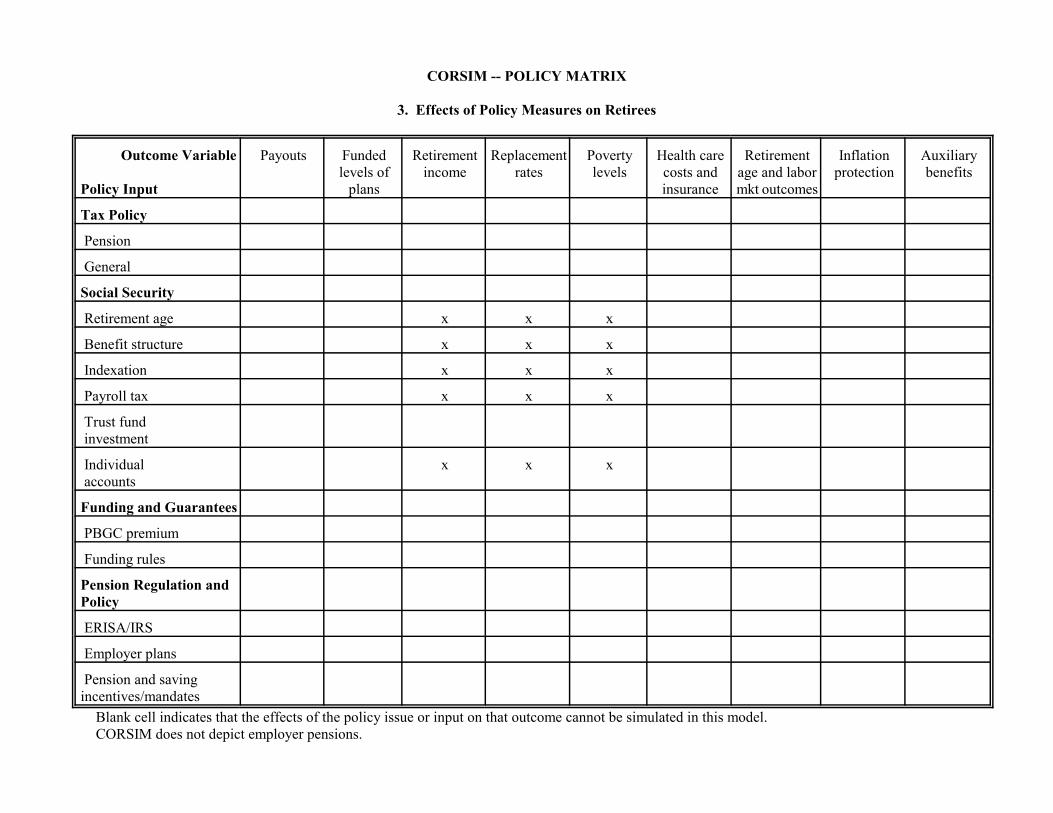
CORSIM -- POLICY MATRIX
3. Effects of Policy Measures on Retirees
Outcome Variable
Policy Input
Payouts Fundedlevels of
plans
Retirementincome
Replacementrates
Povertylevels
Health carecosts andinsurance
Retirementage and labormkt outcomes
Inflationprotection
Auxiliarybenefits
Tax Policy
Pension
General
Social Security
Retirement age x x x
Benefit structure x x x
Indexation x x x
Payroll tax x x x
Trust fund investment
Individual accounts
x x x
Funding and Guarantees
PBGC premium
Funding rules
Pension Regulation andPolicy
ERISA/IRS
Employer plans
Pension and savingincentives/mandates
Blank cell indicates that the effects of the policy issue or input on that outcome cannot be simulated in this model.CORSIM does not depict employer pensions.

CORSIM -- POLICY MATRIX
4. Effects of Policy Measures on Industry Outcomes
Outcome Variable
Policy Input
Financial strength of plans,sponsors, insurers
Labor costs Profits Competitiveness
Tax Policy
Pension
General
Social Security
Retirement age
Benefit structure
Indexation
Payroll tax
Trust fund investment
Individual accounts
Funding and Guarantees
PBGC premium
Funding rules
Pension Regulation and Policy
ERISA/IRS
Employer plans
Pension and saving incentives/mandates
Blank cell indicates that the effects of the policy issue or input on that outcome cannot be simulated in this model.
Industries are not modeled in CORSIM. CORSIM shows effects only on individuals.

CORSIM -- POLICY MATRIX
5. Effects of Policy Measures on Aggregate Economy
Outcome Variable
Policy Input
GDP growth Saving andcapital
accumulation
Equityinvestment
Investmentefficiency
Interest rates Productivity Inflation Labor mobility and labor market
flexibility
Tax Policy
Pension
General
Social Security
Retirement age
Benefit structure
Indexation
Payroll tax
Trust fund investment
Individual accounts
Funding and Guarantees
PBGC premium
Funding rules
Pension Regulation and Policy
ERISA/IRS
Employer plans
Pension and saving incentives/mandates
Blank cell indicates that the effects of the policy issue or input on that outcome cannot be simulated in this model.
Aggregate economy is not modeled in CORSIM.
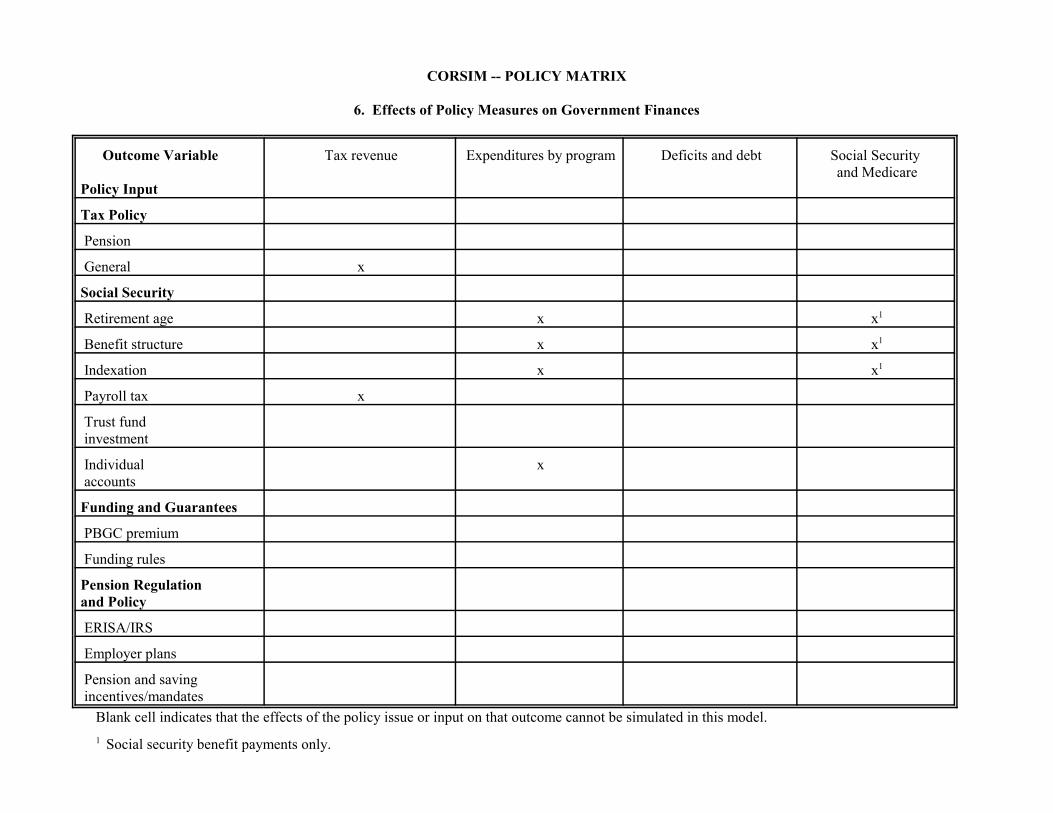
CORSIM -- POLICY MATRIX
6. Effects of Policy Measures on Government Finances
Outcome Variable
Policy Input
Tax revenue Expenditures by program Deficits and debt Social Security and Medicare
Tax Policy
Pension
General x
Social Security
Retirement age x x1
Benefit structure x x1
Indexation x x1
Payroll tax x
Trust fund investment
Individual accounts
x
Funding and Guarantees
PBGC premium
Funding rules
Pension Regulation and Policy
ERISA/IRS
Employer plans
Pension and saving incentives/mandates
Blank cell indicates that the effects of the policy issue or input on that outcome cannot be simulated in this model. 1 Social security benefit payments only.
ANNEX 5-3
PROPOSED CORSIM PRIVATE PENSION MODULEFLOWCHARTS
The following flowcharts show the proposed structure of the private pension module to be added to CORSIMin 1998. The flowcharts were developed by Sonya Williams of Cornell University.
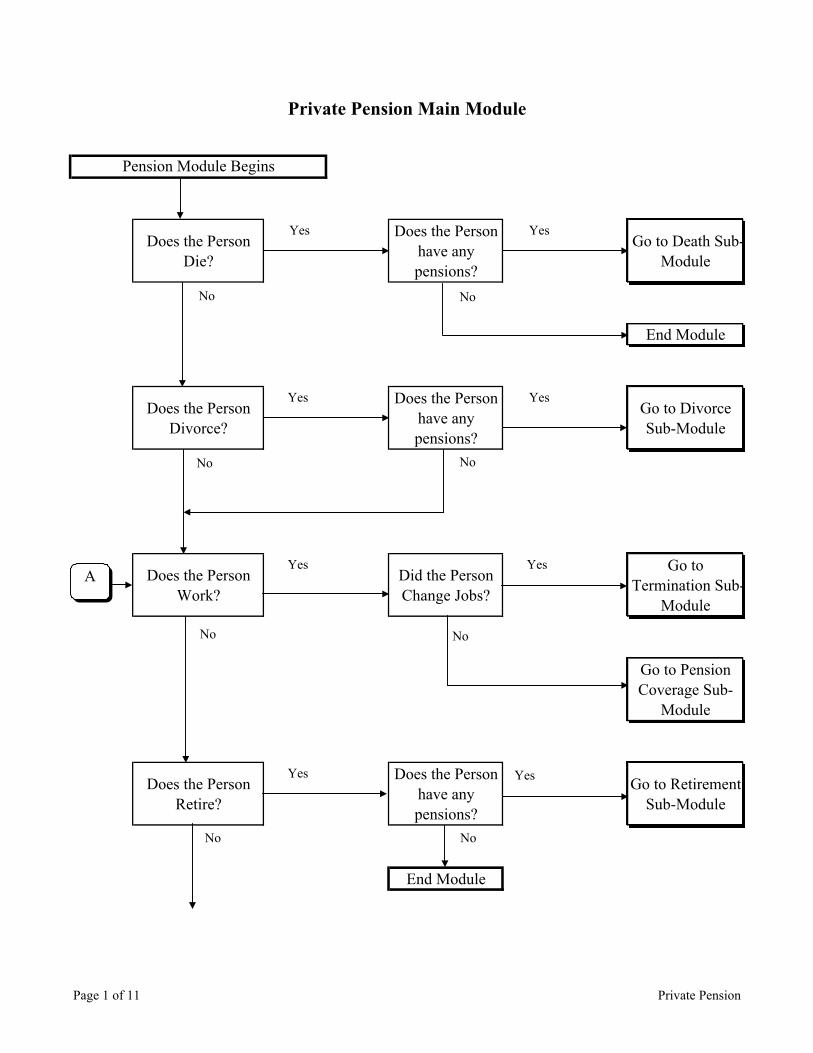
Private Pension Main Module
Pension Module Begins
Does the Person Die?
Does the Person have any pensions?
Go to Death Sub-Module
End Module
Does the Person Divorce?
Does the Person have any pensions?
Go to Divorce Sub-Module
Does the Person Work?
Did the Person Change Jobs?
Go to Termination Sub-
Module
Go to Pension Coverage Sub-
Module
Does the Person Retire?
Does the Person have any pensions?
Go to Retirement Sub-Module
End Module
No
No
No
No
Yes Yes
No
Yes
No
Yes
Yes
No
Yes
Yes Yes
No
A
Page 1 of 11 Private Pension
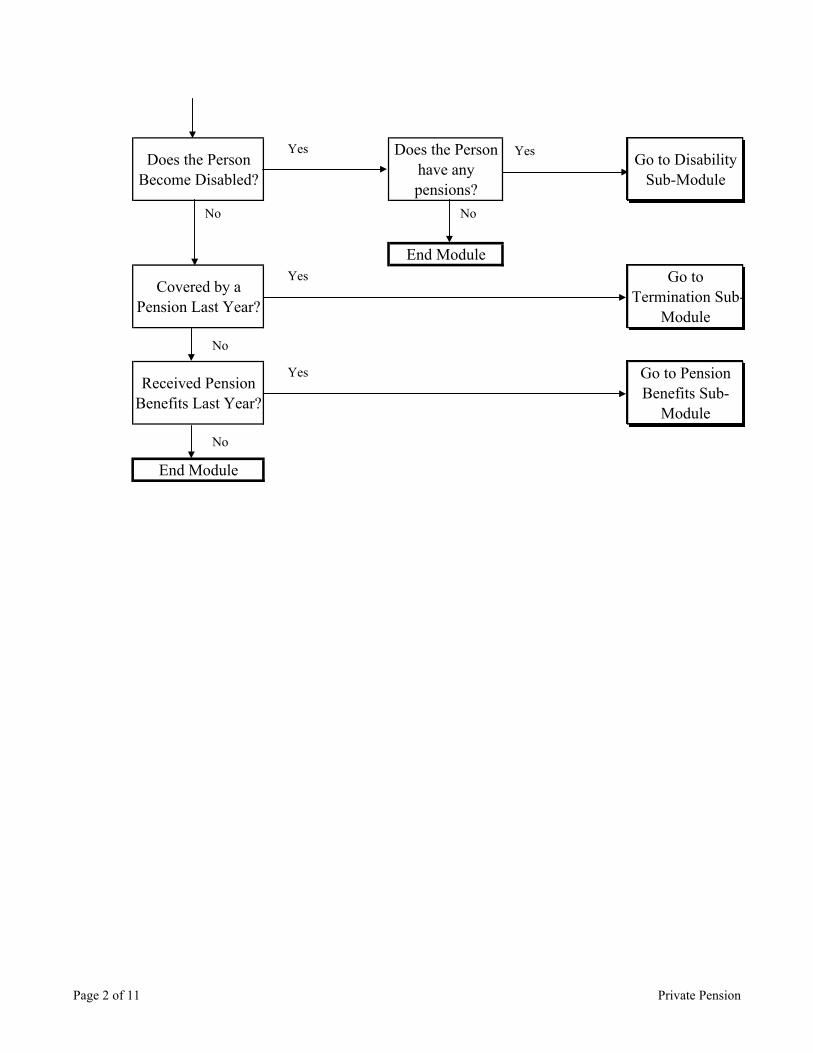
Does the Person Become Disabled?
Does the Person have any pensions?
Go to Disability Sub-Module
End Module
Covered by a Pension Last Year?
Go to Termination Sub-
Module
Received Pension Benefits Last Year?
Go to Pension Benefits Sub-
Module
End Module
Yes
No
Yes Yes
No No
Yes
No
Page 2 of 11 Private Pension
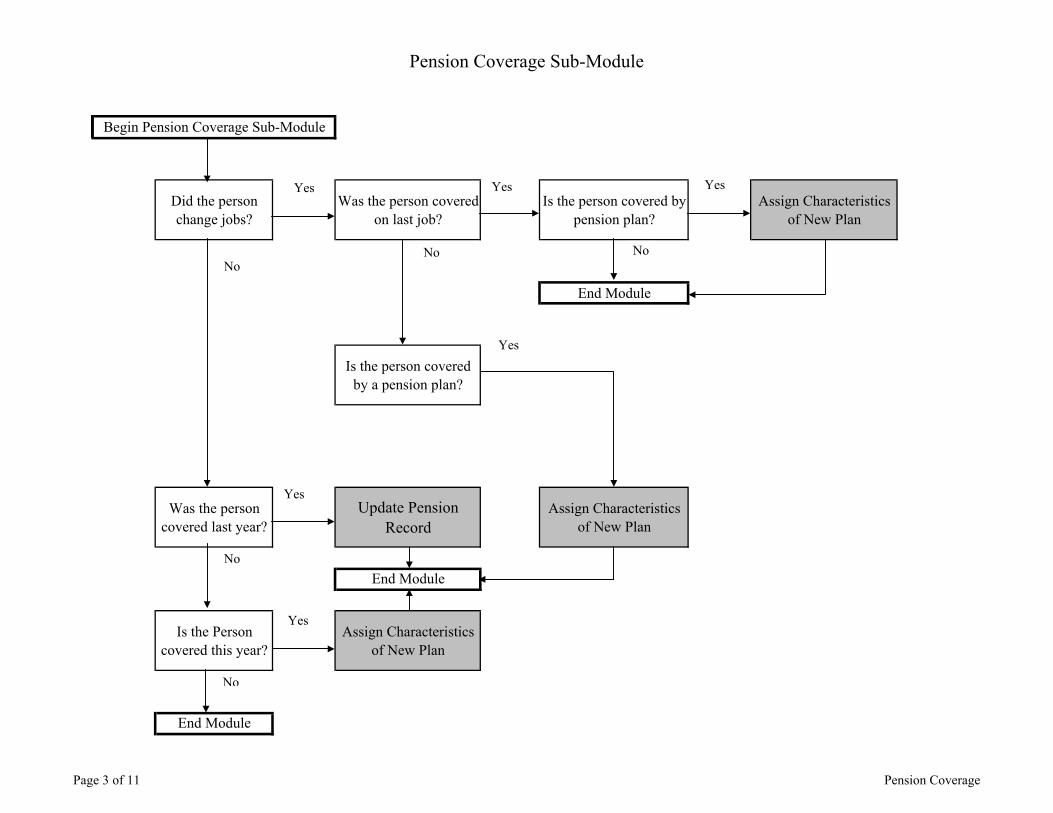
Pension Coverage Sub-Module
Begin Pension Coverage Sub-Module
Did the person change jobs?
Was the person covered on last job?
Is the person covered by pension plan?
Assign Characteristics of New Plan
End Module
Is the person covered by a pension plan?
Was the person covered last year?
Update Pension Record
Assign Characteristics of New Plan
End Module
Is the Person covered this year?
Assign Characteristics of New Plan
End Module
Yes
No
Yes Yes
Yes
Yes
No
Yes
No
NoNo
Page 3 of 11 Pension Coverage
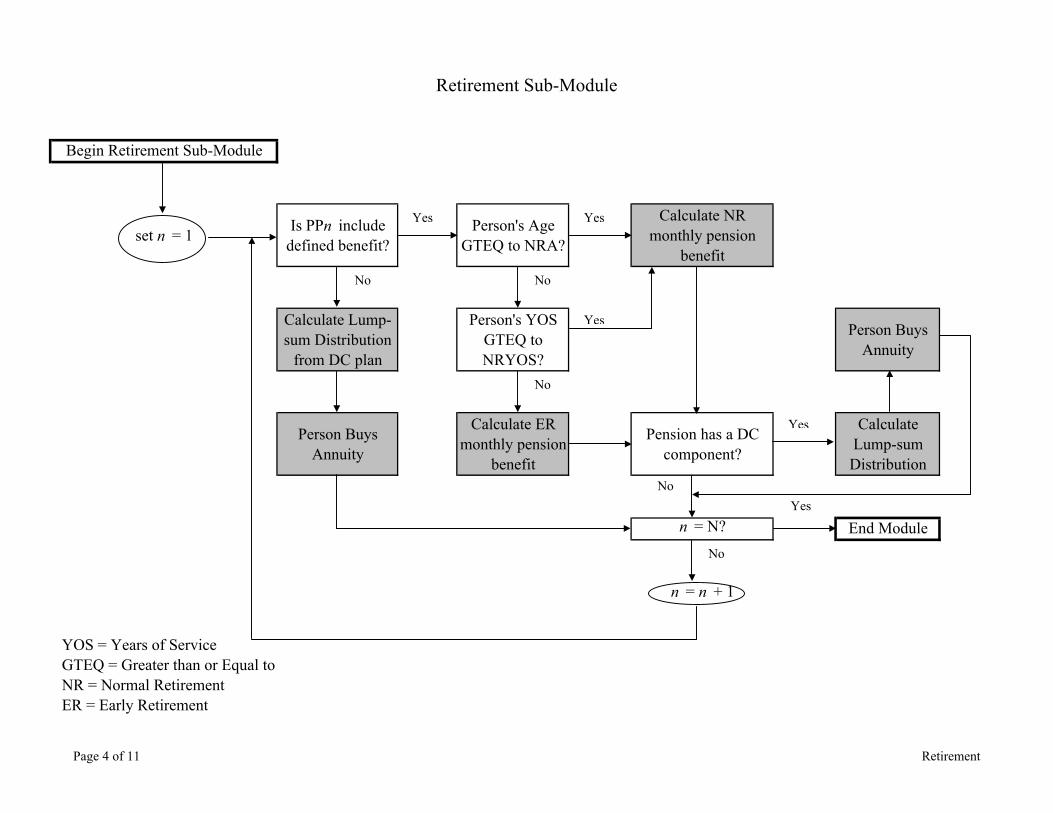
Retirement Sub-Module
Begin Retirement Sub-Module
set n = 1 Is PPn include defined benefit?
Person's Age GTEQ to NRA?
Calculate NR monthly pension
benefit
Calculate Lump-sum Distribution
from DC plan
Person's YOS GTEQ to NRYOS?
Person Buys Annuity
Person Buys Annuity
Calculate ER monthly pension
benefit
Pension has a DC component?
Calculate Lump-sum Distribution
n = N? End Module
n = n + 1
YOS = Years of ServiceGTEQ = Greater than or Equal toNR = Normal RetirementER = Early Retirement
Yes Yes
Yes
No
No
Yes
NoYes
No
No
Page 4 of 11 Retirement
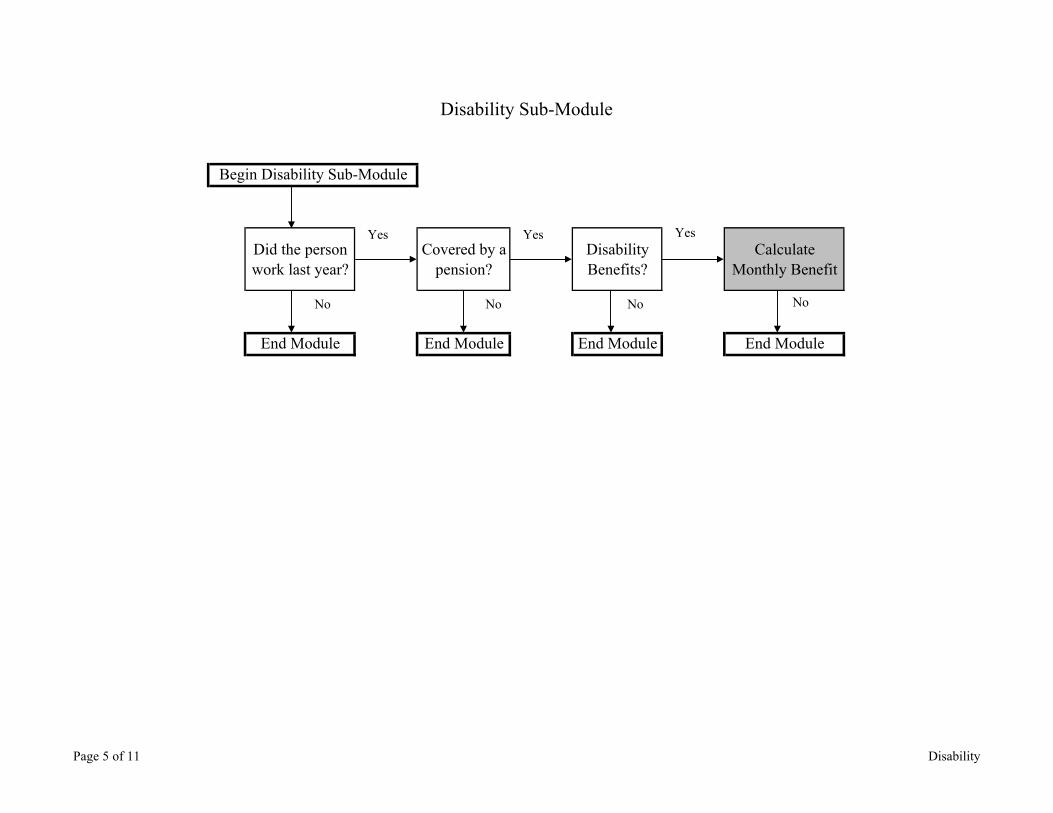
Disability Sub-Module
Begin Disability Sub-Module
Did the person work last year?
Covered by a pension?
Disability Benefits?
Calculate Monthly Benefit
End Module End Module End Module End Module
Yes Yes Yes
No No No No
Page 5 of 11 Disability
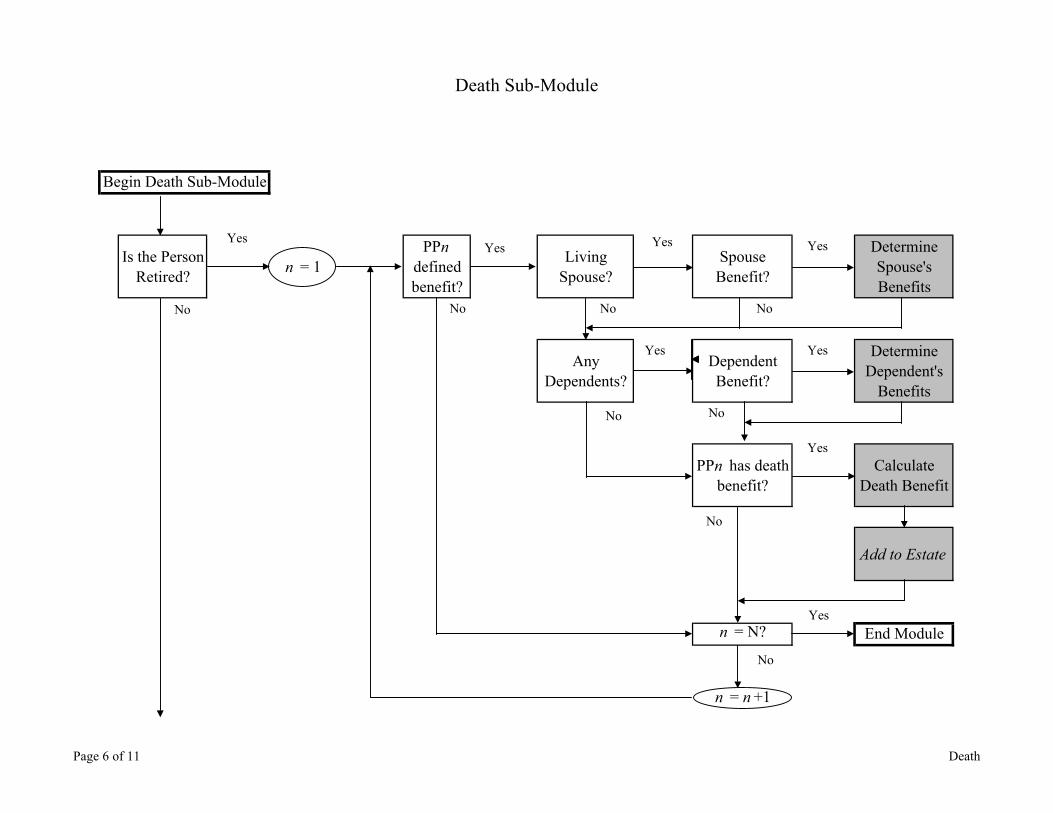
Death Sub-Module
Begin Death Sub-Module
Is the Person Retired? n = 1
PPn defined benefit?
Living Spouse?
Spouse Benefit?
Determine Spouse's Benefits
Any Dependents?
Dependent Benefit?
Determine Dependent's
Benefits
PPn has death benefit?
Calculate Death Benefit
Add to Estate
n = N? End Module
n = n +1
Yes Yes
No
Yes
Yes
No
No
No
Yes Yes
No
Yes
No
No
Yes
No
Page 6 of 11 Death
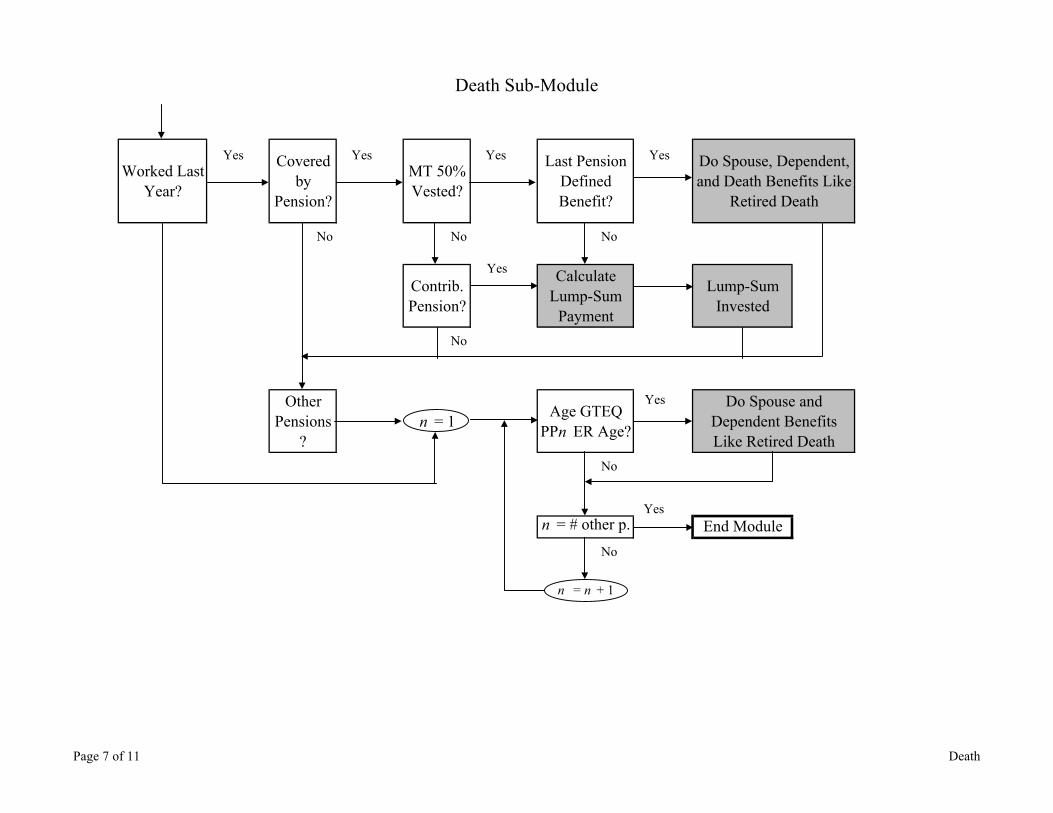
Death Sub-Module
Worked Last Year?
Covered by
Pension?
MT 50% Vested?
Last Pension Defined Benefit?
Do Spouse, Dependent, and Death Benefits Like
Retired Death
Contrib. Pension?
Calculate Lump-Sum
Payment
Lump-Sum Invested
Other Pensions
?n = 1 Age GTEQ
PPn ER Age?
Do Spouse and Dependent Benefits Like Retired Death
n = # other p. End Module
n = n + 1
YesYes
No No
Yes
Yes
No
Yes
No
Yes
No
No
Yes
Page 7 of 11 Death
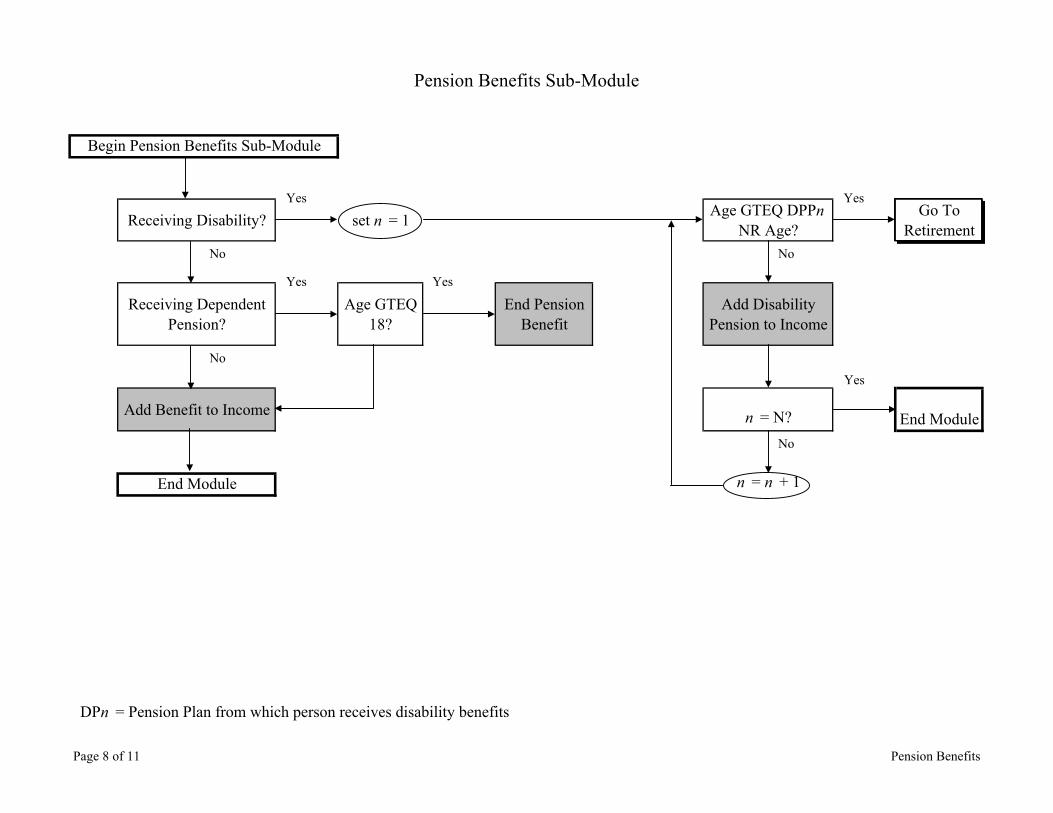
Pension Benefits Sub-Module
Begin Pension Benefits Sub-Module
Receiving Disability? set n = 1 Age GTEQ DPPn NR Age?
Go To Retirement
Receiving Dependent Pension?
Age GTEQ 18?
End Pension Benefit
Add Disability Pension to Income
Add Benefit to Income n = N? End Module
End Module n = n + 1
Yes
No
Yes
No
Yes
No
DPn = Pension Plan from which person receives disability benefits
Yes Yes
No
Page 8 of 11 Pension Benefits
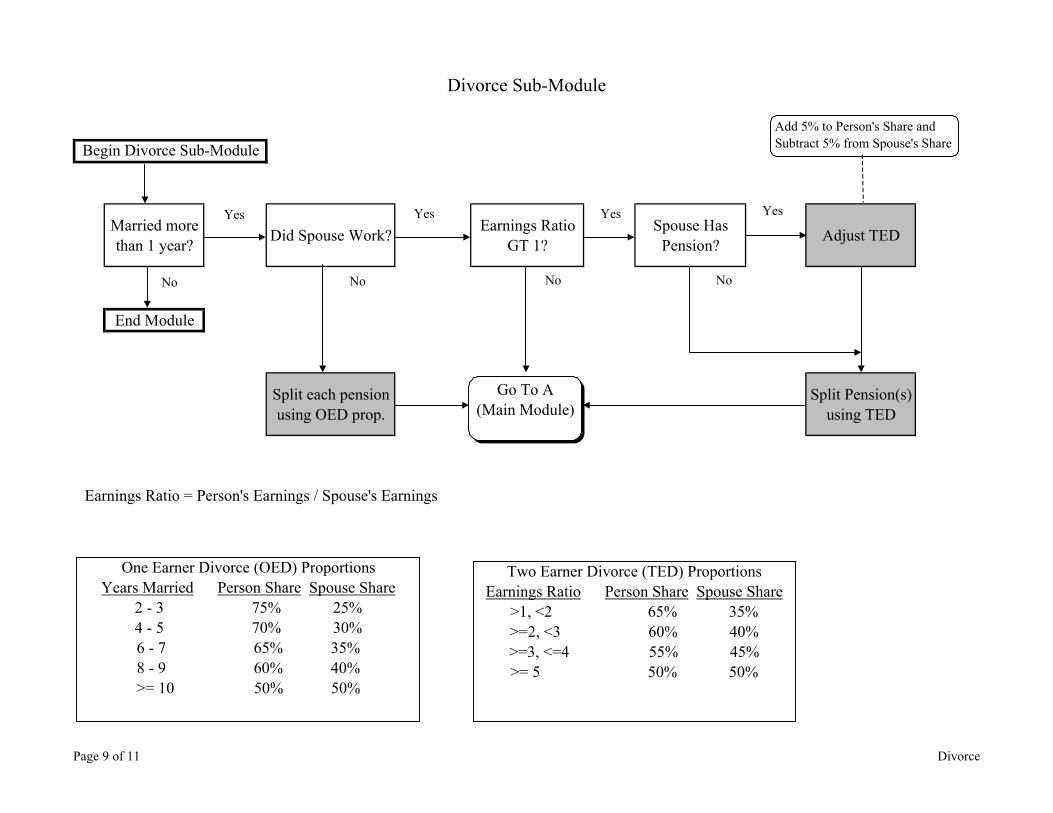
Divorce Sub-Module
Begin Divorce Sub-Module
Married more than 1 year? Did Spouse Work? Earnings Ratio
GT 1?Spouse Has
Pension? Adjust TED
End Module
Split each pension using OED prop.
Split Pension(s) using TED
Yes
No No
Yes
No
Yes
Earnings Ratio = Person's Earnings / Spouse's Earnings
Yes
No
One Earner Divorce (OED) ProportionsYears Married Person Share Spouse Share
2 - 3 75% 25%4 - 5 70% 30%6 - 7 65% 35%8 - 9 60% 40%>= 10 50% 50%
Two Earner Divorce (TED) ProportionsEarnings Ratio Person Share Spouse Share
>1, <2 65% 35%>=2, <3 60% 40%>=3, <=4 55% 45%>= 5 50% 50%
Add 5% to Person's Share and Subtract 5% from Spouse's Share
Go To A (Main Module)
Page 9 of 11 Divorce
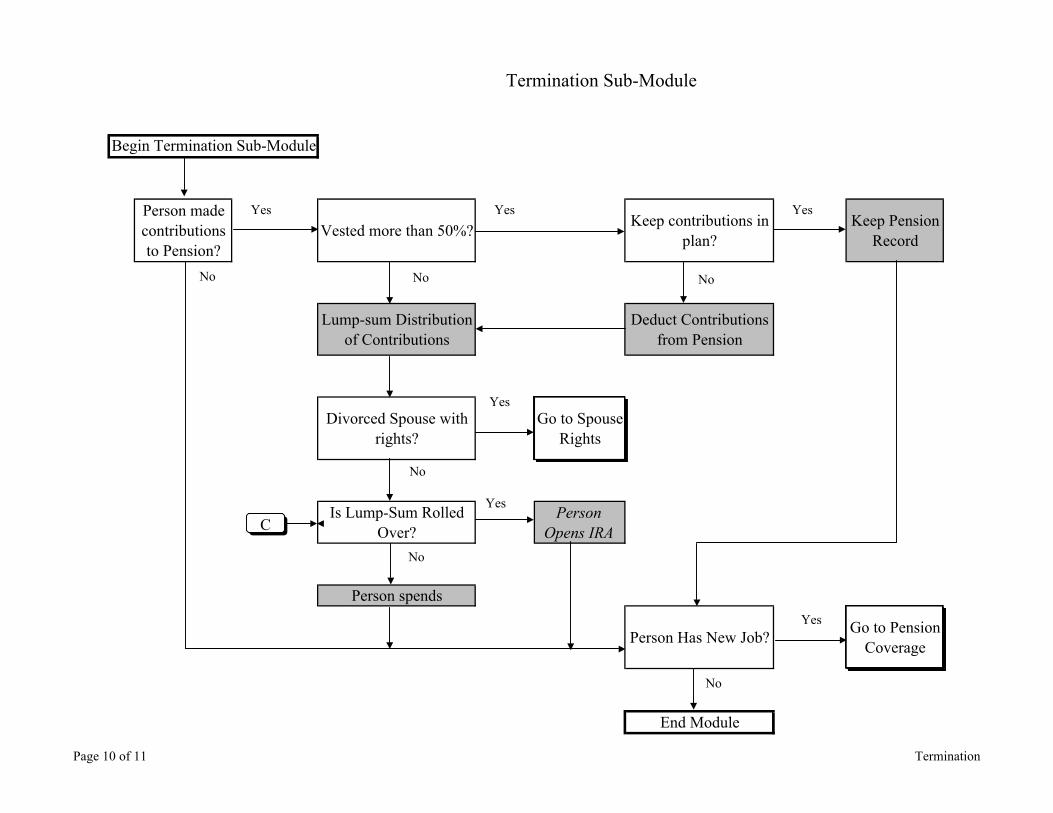
Termination Sub-Module
Begin Termination Sub-Module
Person made contributions to Pension?
Vested more than 50%? Keep contributions in plan?
Keep Pension Record
Lump-sum Distribution of Contributions
Deduct Contributions from Pension
Divorced Spouse with rights?
Go to Spouse Rights
Is Lump-Sum Rolled Over?
Person Opens IRA
Person spends
Person Has New Job? Go to Pension Coverage
End Module
Yes
No
Yes
Yes
No
No
No
YesYes
No
No
Yes
C
Page 10 of 11 Termination
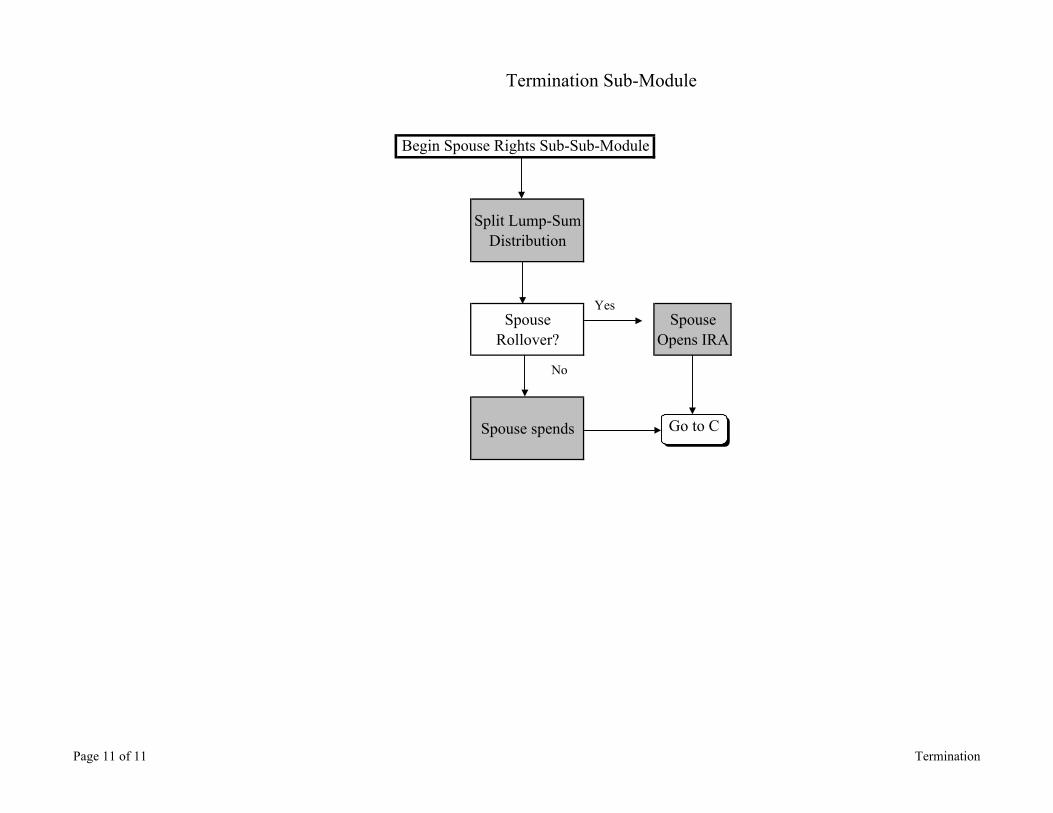
Termination Sub-Module
Begin Spouse Rights Sub-Sub-Module
Split Lump-Sum Distribution
Spouse Rollover?
Spouse Opens IRA
Spouse spends
Yes
No
Go to C
Page 11 of 11 Termination