Embed Size (px)
Citation preview

DPWH Project on Road Heightening and Tide Embankment for Section 3 and 4, Tacloban-Palo Draft Supporting Report for Basic Planning
5-1
Chapter 5 Construction and Procurement Planning
5.1 Procurement Planning
The procurement of the Project shall be implemented in the manner prescribed by R.A. 9184,
otherwise known as the “Government Procurement Reform Act, and its IRR-A”. According to the
Act, the Project Procurement Management Plan (PPMP) to be prepared by DPWH shall include the
decisions as to the type of contract, the extent/size of contract scopes, the procurement method,
along with the expected time schedule for each procurement action.
5.1.1 Type of contract
As a general rule, the procurement of infrastructure projects by the Government shall be on a fixed-
price contract and no price adjustment/escalation shall be allowed. However, in case where
uncertainties involved in the performance of the contract are of such magnitude that the cost is too
difficult to estimate with reasonable certainty and use of a fixed price contract may seriously affect
a contractor’s financial stability or result in payments by the DPWH of contingencies that never
occurred, types of contract other than those based on a fixed-price basis may be used. Alternatively,
the DPWH may provide for a price adjustment/escalation provision in the contract. The adoption of
contract types other than the fixed-price contract or the inclusion of a price adjustment/escalation
clause in the contract provisions shall be subject to the prior approval of the Head of DPWH or his
duly authorized representative.
5.1.2 Size of contract
The size and scope of individual contracts depend on the magnitude, nature and location of the
project. For a project requiring similar but separate items of good/supplies/materials, bids may be
invited under alternative contract options that would attract the interest of both small and large firms.
The adoption of this option including the basis of bid comparison for the same shall be clearly and
explicitly spelled out in the bidding documents.
5.1.3 Procurement method
The procurement of the Project shall be implemented in the manner prescribed by R.A. 9184,
otherwise known as the “Government Procurement Reform Act, and its IRR-A”. The bidding
documents will be prepared in accordance with the standard forms of “Philippines Bidding
Documents (PBDs) for the procurement of Infrastracture Projects (October 2009)”.
1) Bidding procedures
The use of either procedure shall have the prior approval of the Head of DPWH or his duly
authorized representative and shall be so indicated in the Instruction to Bidders.
a. Single Stage Bidding with post-qualification for limited-source bidding
b. Single Stage Bidding Variation with post-qualification
c. Two Stage Bidding with post-qualification
205A1-1-204
The Urgent Development Study on the Project on Rehabilitation and Recovery from Typhoon Yolanda in the Philippines Final Report (II) Appendix Technical Supporting Report 1 (Volume 1, Chapter 2)

DPWH Project on Road Heightening and Tide Embankment for Section 3 and 4, Tacloban-Palo Draft Supporting Report for Basic Planning
5-2
2) Alternative of method of procurement
The applicability of the negotiated procurement method to the Project, pursuant to the provision
of Section 53 (b) of the IRR-A, shall be confirmed by DPWH for the effective and economical
implementation of the bidding and contracting procedures. The use of the same shall be
approved by Head of DPWH or his duly authorized representative.
5.1.4 Phasing of the Project
The Project will be implemented in phases as shown in the Table 5.1-1.
Table 5.1-1 Project Implementing Phase
Phase Contents(Outline of scope of works)
Procurement method Expected time schedule
1 Prioritized Section (assumed about 2.5 km) among Section 4
Competitive bidding, Single stage bidding with post-qualification for limited-source bidding
Tentative construction period: 12 months from 2015/12
2 Remained parts of Section 3 & 4 No information No information 3 Section 1 & 2 No information No information 4 Section 5 & 6 No information No information
Source: JICA Study Team
5.2 Construction Methods / Procedures
Generally the Contractor will undertake works of the Contract in accordance with the DPWH's
standards and specifications, by using the construction methods and procedures of his own
choice. However, the following construction methods and procedures, which are clearly and
explicitly spelled out in the technical specification, shall be adopted by the Contractor in
accordance with the DPWH's requirement.
1) Steel sheet pile shoring:
The steel sheet pile shoring shall be installed for the permanent protection of tide protection
dikes. The equipment to drive sheet piles shall conform to the ACEL Equipment Guidebook.
2) Measures for consolidation settlement
(Pending matter, if required as a result of geotechnical investigation)
5.3 Construction Material / Equipment
5.3.1 Local Construction Market
To cope with the growing needs for restoring the damaged public facilities, particularly on the
rehabilitation projects, many of newly established contractors have responded to the urgent
rehabilitation works such as housing and infrastructure projects funded by NGO. Also major
local contractors who have been classified as the Category “AAA” established resident offices
concentrating in Tacloban city which is the center of construction material market. They have
206A1-1-205
The Urgent Development Study on the Project on Rehabilitation and Recovery from Typhoon Yolanda in the Philippines Final Report (II) Appendix Technical Supporting Report 1 (Volume 1, Chapter 2)

DPWH Project on Road Heightening and Tide Embankment for Section 3 and 4, Tacloban-Palo Draft Supporting Report for Basic Planning
5-3
increased their equipment capability and manpower as well. They also hire consultants to be
more updated on the construction methods.
Most construction equipment used for major projects in this locality is new, if not, newly
repaired right after the Typhon Yolanda. Equipment better innovated with the latest technology
are now being used. They are readily available for major projects, especially for those on the
Category “AAA” contractors.
Tacloban city has enough supply of materials to be used in most major projects. Shipment of
other goods can easily be shipped to the city port. Other nearby cities also have supplies of
common materials. Sources for aggregates can be found in nearby municipalities in different
quantities.
5.3.2 Sources of local construction material
It is estimated that the following major construction materials will be required for the tide
protection dike and road work in Section 3 & 4 approximately.
Table 5.3-1 Major Construction Material required for Section 3 & 4
Material Unit Quantity
Embankment (filling) m3 190,000
Crushed stone m3 28,000
Lean concrete m3 15,000
Structural concrete m3 47,000 Source: JICA Study Team
1) Imported filling material
As for imported filling material, four candidate sites of supply source were investigated by
DPWH and JICA Study Team. The location map of four candidate sites is shown in Figure 5.3-
1. The geological formation, the assumed excavation method and the consideration on
workability, quality control, etc. are outlined in Table 5.3-2. As a result of the investigation
above, it is considered that Site-1 has the highest possibility as the imported filling material
source so far.
2) Subbase & base course, sand & gravel, and boulders
The updated map of construction material sources (subbase & base course, sand & gravel,
boulders, etc.) locating comparatively close to the construction site, is shown in Figure 5.3-2.
5.3.3 Material to be procured from foreign countries
As for hydraulic gates (fixed wheel type / flap type), DPWH is intending to proceed as follows.
1. Basic requirements will be prepared by DPWH (JICA Study Team) in the basic design stage.
2. Quotation requests including the above basic requirements will be sent in the basic design
207A1-1-206
The Urgent Development Study on the Project on Rehabilitation and Recovery from Typhoon Yolanda in the Philippines Final Report (II) Appendix Technical Supporting Report 1 (Volume 1, Chapter 2)
DPWH Project on Road Heightening and Tide Embankment for Section 3 and 4, Tacloban-Palo Draft Supporting Report for Basic Planning
5-4
stage to several manufacturers who are deemed to have enough experiences of detail
design/calculation, fabrication and installation for the relevant construction material.
3. The procurement method of the relevant construction material will be selected by DPWH
from the following options during the detailed design stage.
a. To procure from a manufacturer who is deemed to be reliable and have enough
experiences on detail design/calculation, fabrication and installation.
b. To procure from a local manufacturer who can import a suitable material from foreign
countries, fabricate and install it based on the shop drawings to be prepared by him in
accordance with the technical specification and drawings provided by DPWH.
It is recommended that the above manufacturer shall be a subcontractor and have no direct
contract with DPWH so that all relevant responsibilities are limited to a Contractor.
208A1-1-207
The Urgent Development Study on the Project on Rehabilitation and Recovery from Typhoon Yolanda in the Philippines Final Report (II) Appendix Technical Supporting Report 1 (Volume 1, Chapter 2)

DPWH Project on Road Heightening and Tide Embankment for Section 3 and 4, Tacloban-Palo Draft Supporting Report for Basic Planning
5-5
Site-1
Site-2
Site-3
Site-4
Source: JICA Study Team
Figure 5.3-1 Location map of candidate sites for imported filling material source
209A1-1-208
The Urgent Development Study on the Project on Rehabilitation and Recovery from Typhoon Yolanda in the Philippines Final Report (II) Appendix Technical Supporting Report 1 (Volume 1, Chapter 2)

DPWH Project on Road Heightening and Tide Embankment for Section 3 and 4, Tacloban-Palo Draft Supporting Report for Basic Planning
5-6
Table 5.3-2 Outline of candidate sites for imported filling material source
Site Geological Formation Assumed
Excavation Method
Consideration on Workability, Quality Control, etc.
1
Tertiary sedimentary rocks: The formation is composed of low inclined conglomerate, sandstone and marlish tuffaceous shale.
It is unconsolidated sedimentary rocks and easily dug by backhoe or ripper.
Most material can be used for the filling work. Excavation is easy and it has the highest supply capability in four sites. To get the maximum dry density, the compaction work shall be performed in a state of optimum moisture content ratio. The quality control is clear and easy. This site has the longest haul to the construction site and the vehicles shall pass through the city center.
2
Gabbro / Diabase: Except a part of surface soil, the formation consists of a solid rock having strength.
Except a part of surface soil, digging by breaker or blasting is needed.
Rock materials can be supplied mainly. A massive rock may be produced by the blasting, and the fragmentation method and/or another use shall be examined for rocks larger than a certain size. The site locates adjacent to the residential area, and troubles may be caused by the excavation work. The transportation vehicles shall pass through the city center. The quality control method for rock materials shall be established during the construction stage.
3
Gabbro / Diabase: Only surface soil can be used as the filling material since the deeper part is weathered low and mainly consists of a solid rock.
The surface soil can be dug by backhoe or ripper. The deeper part weathered low needs to be dug by breaker or blasting.
Rock materials can be supplied mainly. The transportation vehicles shall pass through the city center. The quality control method for rock materials shall be established during the construction stage.
4
Basalt and Andesite with Sediment: Weathering is found to a certain depth, and the further deep part is composed of a solid rock. Accordingly, only surface soil and highly weathered layer can be used as the filling material.
The surface soil and highly weathered layer can be dug by backhoe or ripper. The low weathered part needs to be dug by breaker or blasting.
Troubles on excavation may be very few since the site locates far from the residential area and the excavation wots are proceeded in the site currently. Though this site has the shortest haul to the construction site, its supply capacity cannot satisfy all required volume of filling material. The soil and rock materials can be supplied, and the quality control method for the respective material and the mixed material shall be established.
Source: JICA Study Team
210A1-1-209
The Urgent Development Study on the Project on Rehabilitation and Recovery from Typhoon Yolanda in the Philippines Final Report (II) Appendix Technical Supporting Report 1 (Volume 1, Chapter 2)

5-7
Source: DPWH
Figure 5.3-2 Location map of subbase & base course, sand & gravel, and boulders material source
A1-1-210
The Urgent Development Study on the Project on Rehabilitation and Recovery from Typhoon Yolanda in the Philippines Final Report (II) Appendix Technical Supporting Report 1 (Volume 1, Chapter 2)

DPWH Project on Road Heightening and Tide Embankment for Section 3 and 4, Tacloban-Palo Draft Supporting Report for Basic Planning
5-8
5.4 Implementation Schedule
The Project Implementation Schedule (Preliminary) shown in Figure 5.4-1 is prepared in
consideration of the followings.
a. Current progress of the Project (based on monthly status report)
b. Necessary time for the remaining engineering works including necessary approvals
c. Prospective issuance date of ECC and other necessary licenses/permits
d. Necessary time for activities on the bidding and contracting procedures.
e. Construction method and material/equipment supposed for major construction works
The schedule of activities succeeding to “Basic Design” shown in Figure 5.4-1, mean the same for
only the prioritized section in Section 4.
As for the item “d” above, the period of activities for the Stage No. 6, 10 and 13 are adjusted as
shown in the Table 5.4-1 in consideration of the priority, magnitude and implementability of the
Project.
Table 5.4-1 Period of action on procurement activities
Stage ActivitiesPeriod
Earliest1) Maximum2) Adjusted
1 Advertisement 7 cd
50 cd
7 cd
2 Submission of expression of Interest 7 cd 7 cd
3 Evaluation and notification of eligibility 1 cd 1 cd
4 Issuance & availability of bidding documents 7 cd 7 cd
5 Site inspection / pre-bid conference 1 cd 1 cd
6 Preparation and submission of Bid proposals 11 cd 28 cd
6’ Opening of bids 1 cd 1 cd 1 cd
7, 10 Bid evaluation / post-qualification 2 cd 14 cd 5 cd
11 Approval of resolution / issuance of NOA 2 cd 7 cd 2 cd
12 Contract preparation and signing 2 cd 10 cd 2 cd
13 Approval of Contract by higher Authority 1 cd 15 cd 2 cd
14 Issuance of Notice to Proceed 1 cd 3 cd 1 cd
Total Period 43 cd 100 cd 64 cd
Source: Annex “C” in IRR-A, arranged by JICA Study Team
Note: 1) “Earliest” means the Earliest Possible Time of Civil Works as mentioned in the table of
Annex “C” in IRR-A.
2) “Maximum” means the Maximum Periods of Civil Works for ABC costing above 50M
as mentioned in the table of Annex “C” in IRR-A.
A1-1- 212A1-1-211
The Urgent Development Study on the Project on Rehabilitation and Recovery from Typhoon Yolanda in the Philippines Final Report (II) Appendix Technical Supporting Report 1 (Volume 1, Chapter 2)

DPWH Project on Road Heightening and Tide Embankment for Section 3 and 4, Tacloban-Palo Draft Supporting Report for Basic Planning
5-9
Source: Annex “C” in IRR-A, arranged by JICA Study Team
Figure 5.4-1 Project Implementing Schedule
213A1-1-212
The Urgent Development Study on the Project on Rehabilitation and Recovery from Typhoon Yolanda in the Philippines Final Report (II) Appendix Technical Supporting Report 1 (Volume 1, Chapter 2)

DPWH Project on Road Heightening and Tide Embankment for Section 3 and 4, Tacloban-Palo Draft Supporting Report for Basic Planning
6-1
Chapter 6 Environmental and Social Considerations
6.1 Legal Framework
In the Philippines, any project or activity that may potentially have a negative impact on the
environment is subject to an Environmental Impact Assessment (EIA) under the Philippine
Environmental Impact Statement System (PEISS). The PEISS was initially set up by Presidential
Decree (PD) No. 1151 in 1977, known as the Philippine Environmental Policy. It stipulates the
necessity of the preparation of EIS for the proposed project and/or undertakings which might cause
significant environmental impacts. In the following year, PD No. 1586 was promulgated to
formalize the EIS System under the PD No. 1151.
The EIS process applies to proposed projects that are identified as Environmentally Critical Projects
(ECPs) and proposed projects to be located in Environmentally Critical Areas (ECAs), two of which
are presumed to have significant impacts on the environment. The ECPs and ECAs have been
defined and identified in the Presidential Proclamation (PP) No. 2146 (1981) and PP No. 803 (1996).
The implementing rules of the EIS System was stipulated in the DENR Administrative Order No.
37 in 1996 (DAO No. 96-37), which was revised to partly simplify the procedures by DAO No. 42
(2002) and DAO No.03-30 (2003). In November 2011, Memorandum Circular 005 was issued by
DENR-EMB to streamline EIA requirements and include climate change adaptation and disaster
risk reduction into the EIA. In 2014, another Memorandum Circular (2014-005) was issued by
DENR-EMB, in which coverage screening and standardized requirements were updated. Table
6.1-1 summarizes the legal framework of the PEISS.
Table 6.1-1 List of Laws and Regulations/Guidelines for PEISS
Subject/Coverage No./Title of laws,
regulations or administrative order
Contents / Points related to the Project (PMRCIP)
1 PEISS (Philippine Environmental Impact Statement System)
Environmental Impact Statement System (EISS), Presidential Decree No. 1586 (1978)
An act establishing and centralizing the Environmental Impact Statement (EIS) System
2 Screening Process of PEISS
Presidential Proclamation No. 2146 (1981) and No. 803 (1996)
Environmentally Critical Projects (ECPs) to cause significant impact on the quality of environment and Environmentally Critical Areas (ECAs)
3 Further strengthening of PEISS
DENR Administrative Order No. 37 Series of 1996 (DAO 96-37)
Emphasis on promoting maximum public participation in EIA process for social acceptability of the project.
4 Timeframe of PEISS Administrative Order (AO) No. 42 (2002)
Streamlining the ECC application processing procedures and strengthening the implementation of the PEISS
5 Implementation Rules and Procedures of PEISS
DENR Administrative Order No. 30 Series of 2003 (DAO 03-30), Revised Procedural Manual (2007)
Implementation rules and regulations of Presidential Decree No. 1586 (above).
Also, provided detailed definitions of technical terms and detailed information
214A1-1-213
The Urgent Development Study on the Project on Rehabilitation and Recovery from Typhoon Yolanda in the Philippines Final Report (II) Appendix Technical Supporting Report 1 (Volume 1, Chapter 2)
DPWH Project on Road Heightening and Tide Embankment for Section 3 and 4, Tacloban-Palo Draft Supporting Report for Basic Planning
6-2
Subject/Coverage No./Title of laws,
regulations or administrative order
Contents / Points related to the Project (PMRCIP)
regarding procedures, related laws and regulations
6 Climate change adaption and disaster risk reduction
DENR-EMB Memorandum Circular 005 (2011)
Promotion of Climate Change Adaptation (CCA) and Disaster Risk Reduction (DRR), and streamlining EIA Requirements.
7 Coverage Screening and Standardized Requirements
DENR-EMB Memorandum Circular 005 (2014)
Providing project types within the ECP category as well as clearer and updated technical definition of ECAs description of activities / undertakings.
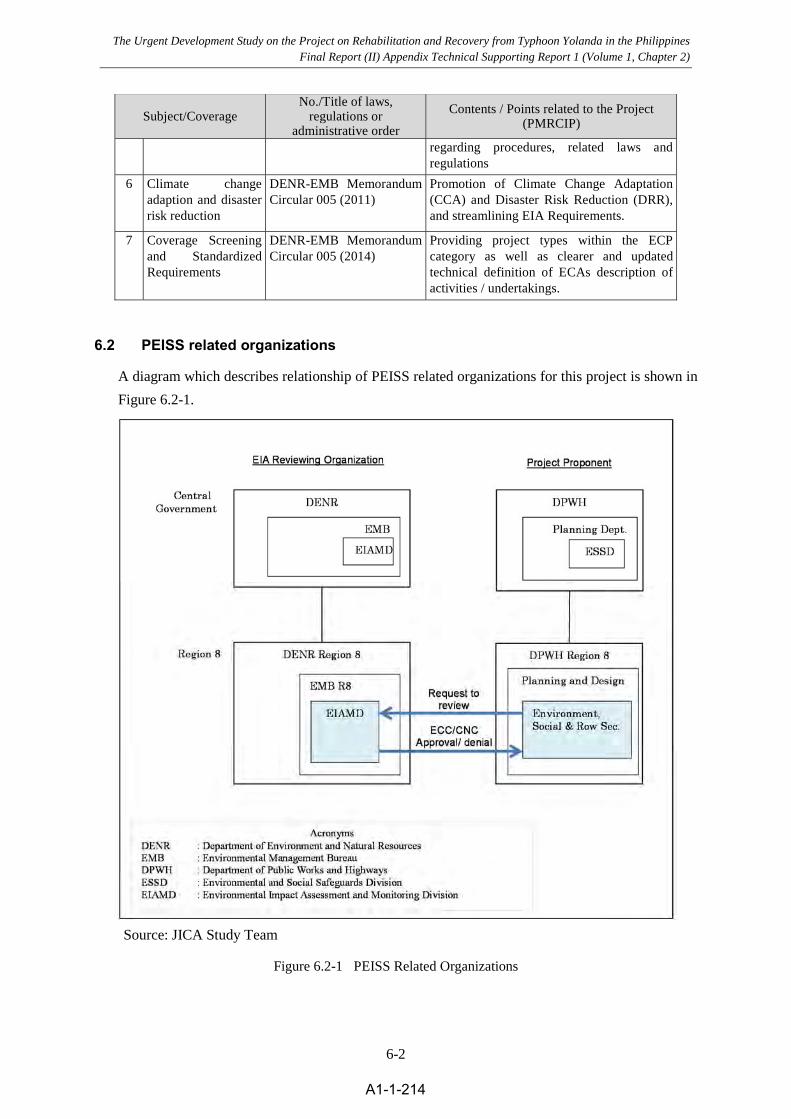
6.2 PEISS related organizations
A diagram which describes relationship of PEISS related organizations for this project is shown in
Figure 6.2-1.
Source: JICA Study Team
Figure 6.2-1 PEISS Related Organizations
A1-1- 215A1-1-214
The Urgent Development Study on the Project on Rehabilitation and Recovery from Typhoon Yolanda in the Philippines Final Report (II) Appendix Technical Supporting Report 1 (Volume 1, Chapter 2)

DPWH Project on Road Heightening and Tide Embankment for Section 3 and 4, Tacloban-Palo Draft Supporting Report for Basic Planning
6-3
6.3 Procedures of PEISS
As shown in Figure 6.3-1, the procedures of EIA can be grouped into three major stages, including
(1) pre-study stage (screening and scoping), (2) EIA study stage and (3) post-study stage (review,
decision-making and monitoring).
Source: Revised Procedural Manual for DENR Administrative Order No. 30 Series of 2003 (DAO 03-30)(2007)
Figure 6.3-1 Summary Flowchart of EIA Process
Pre-Study Stage
EIA Study Stage
Post-Study Stage
Project
EIA Study Scoping
EIA Study/ Report Preparationby the Project Proponent as
a requirement for ECC application
Expansion/Project modifications Implementation
Environmental Impact Monitoring and Evaluation/Audit
Change of Project
plan/Relocation
Public Involvement
No EIAEIA Required
Review and Evaluation of EIAfacilitated by DENR-EMB
Denial of ECC Issuance of ECC w/ recommendations to other entitles w/ mandate on the project
Secure necessary permits / clearances from other EMBDivisions, DENR Bureaus, other GAs and LGUs
Legend:
Proponent drivenDENR-EMB driven
Proponent driven but the EIA process as requirements are under the mandate of other entities
216A1-1-215
The Urgent Development Study on the Project on Rehabilitation and Recovery from Typhoon Yolanda in the Philippines Final Report (II) Appendix Technical Supporting Report 1 (Volume 1, Chapter 2)

DPWH Project on Road Heightening and Tide Embankment for Section 3 and 4, Tacloban-Palo Draft Supporting Report for Basic Planning
6-4
Necessary EIS report will be submitted to EMB Region VIII in September, and ECC for this project
will be obtained within ten days after the submission (See Figure 6.3-2).
Figure 6.3-2 EIA process
Plan for Section
1, 2, 5 and 6
Phase II (S.1, 2) Phase III (S5, 6)
EIS Report
ECC
Submission To DENR-EMB R8 In September
Issuance Within 10 days
Before the end of October
Basic Design for Section
3& 4
Phase I
217A1-1-216
The Urgent Development Study on the Project on Rehabilitation and Recovery from Typhoon Yolanda in the Philippines Final Report (II) Appendix Technical Supporting Report 1 (Volume 1, Chapter 2)

DPWH Project on Road Heightening and Tide Embankment for Section 3 and 4, Tacloban-Palo Draft Supporting Report for Basic Planning
7-1
Chapter 7 Selection of Prioritized Sections
7.1 Selection of Prioritized Sections
The section 3 and section 4 have been divided into some sections. In terms of implementation
sequence, the selection of leading section that should be started at first within 2015 is required.
In order to select such leading section, Table 7.1-1 was prepared to indicate basic feature of
subsections in Section 3 and 4.
Table 7.1-1 Basic Feature of Subsections in Section 3 and 4
Section Sub-section Social Aspect Technical Aspect Prioritized
Sections
3
3-1 Many houses within the
NBZ, and relocation by
Tacloban city is needed.
Land acquisition takes time.
No major problem.
3-2
3-3 Deviation of airport road
needed during construction
4
4-1
4-2 No houses, land acquisition
by DPWH is easy
No major problem. Selected
4-3 Selected
4-4
Few houses, land
acquisition by DPWH is
easy
Selected
4-5 Few houses, land
acquisition by DPWH is
easy. Alignment exceeds
NBZ in some part.
Topographical survey /
geological survey is needed
to judge the
implementability
4-6
4-7 Land acquisition time
depends on the alignment.
(Alignment not comfirmed)
Technical coordination on
the connection of Section 5
is necessary.
Source: JICA Study Team
Based on the above Table, it is recommended the prioritized section is about 2,500m in Section 4.
The outline of the prioritized section is explained in the next section.
From the End of existing road
to the limit of MacArthur Park
Prioritized Sections
218A1-1-217
The Urgent Development Study on the Project on Rehabilitation and Recovery from Typhoon Yolanda in the Philippines Final Report (II) Appendix Technical Supporting Report 1 (Volume 1, Chapter 2)

DPWH Project on Road Heightening and Tide Embankment for Section 3 and 4, Tacloban-Palo Draft Supporting Report for Basic Planning
7-2
7.2 Prioritized sections
Prioritized sections selected by DPWH is as follows.
7.2.1 Outline of the prioritized sections
The outline of the prioritized sections is shown in Figure 7.2-1. Prioritized sections are the
sections whose implementation leads among the whole sections. It should be noted that
implementation of all sections should be done for the benefit of the project.
Figure 7.2-1 Outline of Prioritized Sections (leading sections)
219A1-1-218
The Urgent Development Study on the Project on Rehabilitation and Recovery from Typhoon Yolanda in the Philippines Final Report (II) Appendix Technical Supporting Report 1 (Volume 1, Chapter 2)

DPWH Project on Road Heightening and Tide Embankment for Section 3 and 4, Tacloban-Palo Draft Supporting Report for Basic Planning
7-3
7.2.2 Beginning point of prioritized section
Beginning point is the end of existing road as shown in Figure 7.2-2.
Source: JICA Study Team
Figure 7.2-2 Start Point of Prioritized Sections
220A1-1-219
The Urgent Development Study on the Project on Rehabilitation and Recovery from Typhoon Yolanda in the Philippines Final Report (II) Appendix Technical Supporting Report 1 (Volume 1, Chapter 2)
DPWH Project on Road Heightening and Tide Embankment for Section 3 and 4, Tacloban-Palo Draft Supporting Report for Basic Planning
7-4
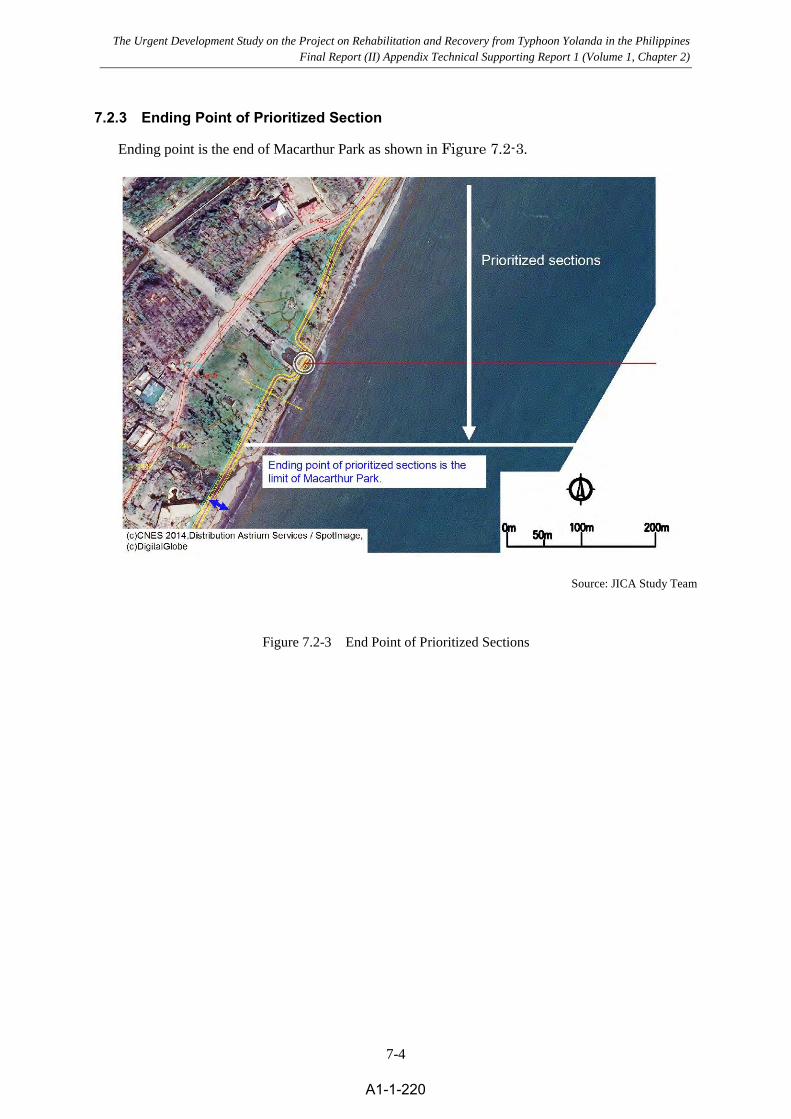
7.2.3 Ending Point of Prioritized Section
Ending point is the end of Macarthur Park as shown in Figure 7.2-3.
Source: JICA Study Team
Figure 7.2-3 End Point of Prioritized Sections
221A1-1-220
The Urgent Development Study on the Project on Rehabilitation and Recovery from Typhoon Yolanda in the Philippines Final Report (II) Appendix Technical Supporting Report 1 (Volume 1, Chapter 2)

DPWH Project on Road Heightening and Tide Embankment for Section 3 and 4, Tacloban-Palo Draft Supporting Report for Basic Planning
8-1
Chapter 8 Design Parameters for Basic Design for Prioritized Sections
8.1 General Outline of Prioritized Sections
The general outline of the prioritized section is summarized in Table 7.1-1. The prioritized section
can be divided into 3 subsection according to their main features. The main features are tide
embankment with new road, tide embankment with existing road widening and tide embankment
only. They are corresponding to Section 4-2, 4-3 and 4-4, respectively. Regarding the related
structures, there are road intersection, flood gate and drainage box culverts, and they are all
included in Section 4-3.
Access over the dike will be included in each section according to the basic design.
Table 8.1-1 Structure Included in the Prioritized Sections
Section Length Main Feature Road Intersection Flood Gate Drainage:
Box culverts Access
4-2 1.4 kmTide embankment with new road
N/A N/A 5 sites To be designed
4-3 0.9 km
Tide embankment with road widening
1@North of Payapay Bridge
1@Kilot creek
1@Binok creek
N/A To be designed
4-4 0.3 km Tide embankment N/A N/A N/A To be
designed
Total 2.6 km 1 2 4
Source: JICA Study Team
8.2 Outline of structures included in the prioritized sections
Structures included in the prioritized sections is listed in Table 8.2-1 and shown in Figure 8.2-1
to Figure 8.2-6. River dikes and bridges are not included in the prioritized sections.
Table 8.2-1 Structure Included in the Prioritized Sections
Type of structure Number / Length Note
Tide embankment about 2.6 km Whole sections
Access road To be designated Whole sections
Road: New road about 1.4 km North of Payapay Bridge
Road: Road widening about 0.9 km South of Payapay Bridge
Road: Intersection 1 site North of Payapay Bridge
Flood gate 2 sites Kilot creek, Binok creek
Drainage: Box culverts 5 sites Outlets for swamps
Source: JICA Study Team
222A1-1-221
The Urgent Development Study on the Project on Rehabilitation and Recovery from Typhoon Yolanda in the Philippines Final Report (II) Appendix Technical Supporting Report 1 (Volume 1, Chapter 2)

DPWH Project on Road Heightening and Tide Embankment for Section 3 and 4, Tacloban-Palo Draft Supporting Report for Basic Planning
8-2
Source: JICA Study Team
Figure 8.2-1 Structures in Prioritized Sections (1)
Source: JICA Study Team
Figure 8.2-2 Structures in Prioritized Sections (2)
223A1-1-222
The Urgent Development Study on the Project on Rehabilitation and Recovery from Typhoon Yolanda in the Philippines Final Report (II) Appendix Technical Supporting Report 1 (Volume 1, Chapter 2)

DPWH Project on Road Heightening and Tide Embankment for Section 3 and 4, Tacloban-Palo Draft Supporting Report for Basic Planning
8-3
Source: JICA Study Team
Figure 8.2-3 Structures in Prioritized Sections (3)
Source: JICA Study Team
Figure 8.2-4 Structures in Prioritized Sections (4)
224A1-1-223
The Urgent Development Study on the Project on Rehabilitation and Recovery from Typhoon Yolanda in the Philippines Final Report (II) Appendix Technical Supporting Report 1 (Volume 1, Chapter 2)

DPWH Project on Road Heightening and Tide Embankment for Section 3 and 4, Tacloban-Palo Draft Supporting Report for Basic Planning
8-4
Source: JICA Study Team
Figure 8.2-5 Structures in Prioritized Sections (5)
Source: JICA Study Team
Figure 8.2-6 Structures in Prioritized Sections (6)
225A1-1-224
The Urgent Development Study on the Project on Rehabilitation and Recovery from Typhoon Yolanda in the Philippines Final Report (II) Appendix Technical Supporting Report 1 (Volume 1, Chapter 2)

DPWH Project on Road Heightening and Tide Embankment for Section 3 and 4, Tacloban-Palo Draft Supporting Report for Basic Planning
8-5
8.3 Tide embankment
About 2.5 km of tide embankment is included in the prioritized sections. Access roads will also
needed whose location needs to be designated. Design parameters are sorted out in this chapter.
Table 8.3-1 Tide Embankment in the Prioritized Sections
Type of structure Number / Length Note
Tide embankment about 2.5 km Whole sections
Access road To be designated Whole sections
Road: New road about 1.4 km North of Payapay Bridge
Road: Road widening about 0.9 km South of Payapay Bridge
Road: Intersection 1 site North of Payapay Bridge
Flood gate 2 sites Kilot creek, Binok creek
Drainage: Box culverts 5 sites Outlets for swamps
Source: JICA Study Team
8.3.1 Alignment
(1) Basic policy
Basic policy for setting up an alignment is showed in the figure below. The centerline of the tide
embankment shall be set up at 30 meters from the sea shore, so that the embankment falls inside
the no-building zone, which is 40 meters from the sea shore.
Source: JICA Study Team
Figure 8.3-1 Basic Policy for Setting up an Alignment
However, some areas are exempt from the basic rule, as described below.
Existing large facilities shall be avoided.
Where there is an existing road within 40 meters from the shore line, the embankment shall
be shifted seaward so that the existing road will not be affected.
226A1-1-225
The Urgent Development Study on the Project on Rehabilitation and Recovery from Typhoon Yolanda in the Philippines Final Report (II) Appendix Technical Supporting Report 1 (Volume 1, Chapter 2)

DPWH Project on Road Heightening and Tide Embankment for Section 3 and 4, Tacloban-Palo Draft Supporting Report for Basic Planning
8-6
Even if there are large facilities and existing roads to avoid and tide enbankment needs to be
shifted towards the sea, the tide embankment should be constructed on existing land.
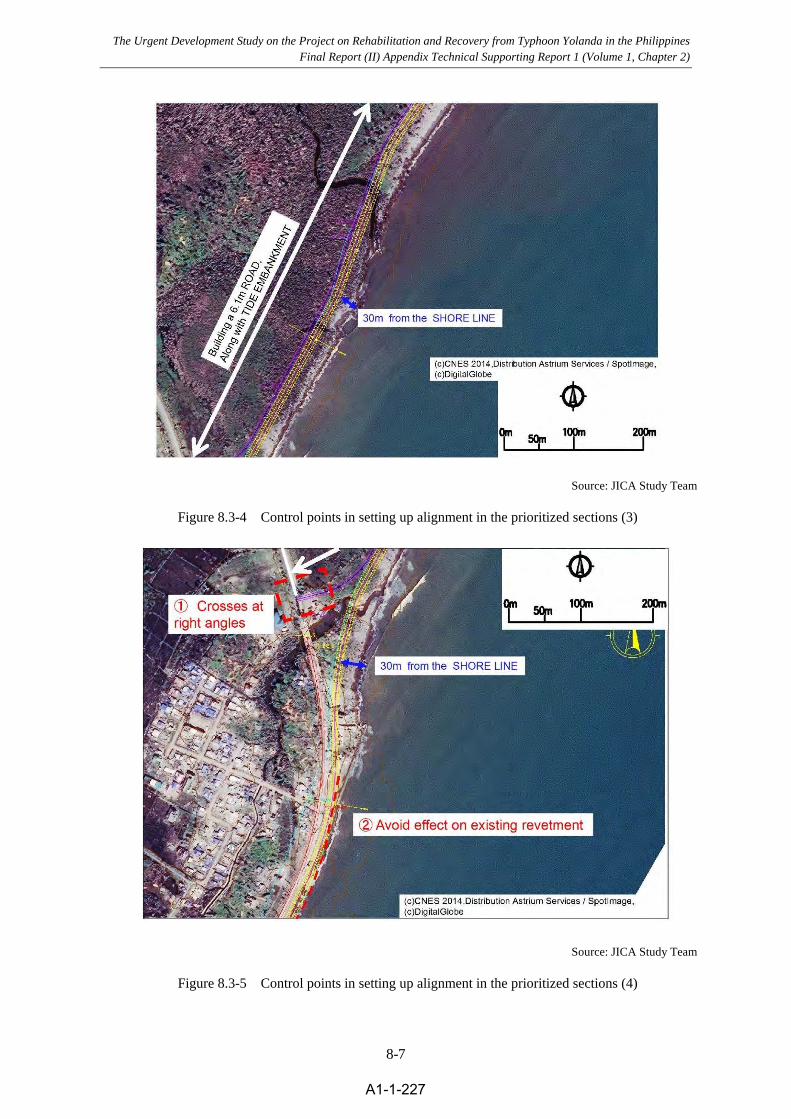
(2) Alignment settings in prioritized sections
Control points in setting up the alignment in the prioritized sections is shown in following figures.
Source: JICA Study Team
Figure 8.3-2 Control points in setting up alignment in the prioritized sections (1)
Source: JICA Study Team
Figure 8.3-3 Control points in setting up alignment in the prioritized sections (2)
227A1-1-226
The Urgent Development Study on the Project on Rehabilitation and Recovery from Typhoon Yolanda in the Philippines Final Report (II) Appendix Technical Supporting Report 1 (Volume 1, Chapter 2)
DPWH Project on Road Heightening and Tide Embankment for Section 3 and 4, Tacloban-Palo Draft Supporting Report for Basic Planning
8-7
Source: JICA Study Team
Figure 8.3-4 Control points in setting up alignment in the prioritized sections (3)
Source: JICA Study Team
Figure 8.3-5 Control points in setting up alignment in the prioritized sections (4)
228A1-1-227
The Urgent Development Study on the Project on Rehabilitation and Recovery from Typhoon Yolanda in the Philippines Final Report (II) Appendix Technical Supporting Report 1 (Volume 1, Chapter 2)

DPWH Project on Road Heightening and Tide Embankment for Section 3 and 4, Tacloban-Palo Draft Supporting Report for Basic Planning
8-8
Source: JICA Study Team
Figure 8.3-6 Control points in setting up alignment in the prioritized sections (5)
Source: JICA Study Team
Figure 8.3-7 Control points in setting up alignment in the prioritized sections (6)
229A1-1-228
The Urgent Development Study on the Project on Rehabilitation and Recovery from Typhoon Yolanda in the Philippines Final Report (II) Appendix Technical Supporting Report 1 (Volume 1, Chapter 2)

DPWH Project on Road Heightening and Tide Embankment for Section 3 and 4, Tacloban-Palo Draft Supporting Report for Basic Planning
8-9
(3) Alignment settings in the north of Macarthur Park
Existing revetment along the road in the north of Macarthur Park was damaged by Yolanda. The
restoration of the revetment in ongoing by DPWH.
The newly constructed tide embankment will be place behind the existing revetment so that the
embankment will not affect the existing one. The road needs to be shifted landward as shown in
the figure below.
Source: JICA Study Team
Figure 8.3-8 Alignment Settings in the north of Macarthur Park
8.3.2 Structural design parameters
(1) Design conditions of tide embankment
1) Top elevation
Top elevation of the embankment is set at MSL+4.0m in section 3 and MSL+3.5m in section4.
The height is based on the results of simulated 50-year-return-period storm surge deviation in each
section. The maximum storm surge height in section 3 is MSL+3.8m, which is rounded up to set
the design top elevation of MSL+4.0m. The maximum storm surge height in section 4 is
MSL+3.2m, which is rounded up to set the design top elevation of MSL+3.5m.
In the storm surge simulation, it is the centric atmospheric pressure which is 50-year-return-period
and track and speed of typhoon was assumed as the same with Yolanda. The conditions for
simulation is on the safe side, since initial sensibility analysis demonstrated that the track and
speed of Yolanda were the most severe case, as discussed in the appendix.
230A1-1-229
The Urgent Development Study on the Project on Rehabilitation and Recovery from Typhoon Yolanda in the Philippines Final Report (II) Appendix Technical Supporting Report 1 (Volume 1, Chapter 2)

DPWH Project on Road Heightening and Tide Embankment for Section 3 and 4, Tacloban-Palo Draft Supporting Report for Basic Planning
8-10
Table 8.3-2 Top elevation settings
Simulated storm surge deviation
(MSL+m)
Design Top elevation
(MSL+m)
Section 3 MSL +3.8m MSL +4.0m
Section 4 MSL +3.2m MSL +3.5m
Source: JICA Study Team
Source: JICA Study Team
Figure 8.3-9 Simulated Storm Surge Deviation (50 years returns period)
2) Crest width
The crest width for tide embankment shall be more than 3 meters and it is generally 3 to 4 meters
on a case-based study for similar structures.
Here, the width is set 4 meters considering utilization of the crest as well as described below.
Source: JICA Study Team
Figure 8.3-10 Crest Width Requirement as a Cycling and Maintenance Road.
231A1-1-230
The Urgent Development Study on the Project on Rehabilitation and Recovery from Typhoon Yolanda in the Philippines Final Report (II) Appendix Technical Supporting Report 1 (Volume 1, Chapter 2)

DPWH Project on Road Heightening and Tide Embankment for Section 3 and 4, Tacloban-Palo Draft Supporting Report for Basic Planning
8-11
The crest of the embankment will be utilized as a promenade and cycling road, and it will not be
utilized as a residential roadway. In this regard, utilization of normal vehicles shall be regulated.
In the meantime, the crest will also be utilized for an access lane for official vehicle, in case tide
embankments, gates and other related structure need to be surveyed, maintained or repaired. Such
utilization is occasionally.
The crest width is set at 4 meters so that it can be used as a cycling road considering an official
vehicle parked on it. 2.0 meters for an official vehicle, 1.5 meters for bicycles and 0.25 x 2 meters
for shoulders where fall prevention net will be installed.
(2) Structural Specifications
Structural specifications for tide embankment is organized in the table below.
Source: JICA Study Team
Figure 8.3-11 Standard Structure of the Embankment
232A1-1-231
The Urgent Development Study on the Project on Rehabilitation and Recovery from Typhoon Yolanda in the Philippines Final Report (II) Appendix Technical Supporting Report 1 (Volume 1, Chapter 2)

DPWH Project on Road Heightening and Tide Embankment for Section 3 and 4, Tacloban-Palo Draft Supporting Report for Basic Planning
8-12
Table 8.3-3 Structural Specifications of Tide Embankment
Items specifications explanation
Seaward slope gradient 1 : 1.0 Steepest case-based gradient for
concrete-protected embankment. Lowering the
gradient facilitate overtopping thus unsafe.
Landward slope gradient 1 : 1.5 Typical case-based gradient for
concrete-protected embankment.
Seaward slope protection Concrete (50cm)
Lean concrete (10cm)
Crushed stone (20cm)
Typical case-based protection for tide
embankment.
Landward slope protection Concrete (20cm)
Lean concrete (10cm)
Crushed stone (20cm)
Typical case-based protection for tide
embankment.
Crest protection Concrete (20cm)
Lean concrete (10cm)
Crushed stone (20cm)
Typical case-based protection for tide
embankment.
Sheet pile (seaward) L=3.0m Standard length needed for erosion protection,
water shutoff and soil draw-out prevention.
Base concrete (seaward) 1m (H)x 1m(V) Typical case-based protection for tide
embankment.
Embedded depth (seaward) D=1.0m Standard length needed for erosion protection
Embedded depth (landward) D=1.0m Standard length needed for erosion protection
Foot protection 2 lines of base concrete
(1m x 1m)
Typical case-based protection for tide
embankment.
Source: JICA Study Team
The top elevation of the base concrete shall be set at a same elevation for a certain length,
depending on the tendency of the ground level profile. The base concrete shall always be
embedded for more than one (1) meter from the ground level and the top elevation of the base
concrete shall be set at 0.50 meter interval. The concept applies for seaward base concrete as well
as landward base concrete.
233A1-1-232
The Urgent Development Study on the Project on Rehabilitation and Recovery from Typhoon Yolanda in the Philippines Final Report (II) Appendix Technical Supporting Report 1 (Volume 1, Chapter 2)

DPWH Project on Road Heightening and Tide Embankment for Section 3 and 4, Tacloban-Palo Draft Supporting Report for Basic Planning
8-13
Source: JICA Study Team
Figure 8.3-12 Example of Setting the Height of Base Concrete
(3) Stability analysis
Stability of the foundation ground shall be analyzed utilizing the result of geotechnical survey.
Consolidation of the foundation ground and liquefaction shall be also analyzed.
234A1-1-233
The Urgent Development Study on the Project on Rehabilitation and Recovery from Typhoon Yolanda in the Philippines Final Report (II) Appendix Technical Supporting Report 1 (Volume 1, Chapter 2)

DPWH Project on Road Heightening and Tide Embankment for Section 3 and 4, Tacloban-Palo Draft Supporting Report for Basic Planning
8-14
8.3.3 Access Road
Access road to the top of embankment as well as to the other side of the embankment shall be
secured by installing an access road wherever necessary. Depending on its usage, whether it’s for
vehicle (for official use for maintenance), bicycles or pedestrians, the size of the slope must be
chosen.
The location and type of access road needs to be designated.
Source: JICA Study Team
Figure 8.3-13 General image of access road for vehicles
235A1-1-234
The Urgent Development Study on the Project on Rehabilitation and Recovery from Typhoon Yolanda in the Philippines Final Report (II) Appendix Technical Supporting Report 1 (Volume 1, Chapter 2)

DPWH Project on Road Heightening and Tide Embankment for Section 3 and 4, Tacloban-Palo Draft Supporting Report for Basic Planning
8-15
Source: JICA Study Team
Figure 8.3-14 General image of access road for bicycles
236A1-1-235
The Urgent Development Study on the Project on Rehabilitation and Recovery from Typhoon Yolanda in the Philippines Final Report (II) Appendix Technical Supporting Report 1 (Volume 1, Chapter 2)

DPWH Project on Road Heightening and Tide Embankment for Section 3 and 4, Tacloban-Palo Draft Supporting Report for Basic Planning
8-16
Source: JICA Study Team
Figure 8.3-15 General image of access road for pedestrians
237A1-1-236
The Urgent Development Study on the Project on Rehabilitation and Recovery from Typhoon Yolanda in the Philippines Final Report (II) Appendix Technical Supporting Report 1 (Volume 1, Chapter 2)

DPWH Project on Road Heightening and Tide Embankment for Section 3 and 4, Tacloban-Palo Draft Supporting Report for Basic Planning
8-17
8.4 Road
About 1.3 km of construction of new road, about 0.9km of road widening and 1 site of intersection
are included in the prioritized sections. Design parameters are sorted out in this chapter.
Table 8.4-1 Construction and Improvement of Road in the Prioritized Sections
Type of structure Number / Length Note
Tide embankment about 2.5 km Whole sections
Access road To be designated Whole sections
Road: New road about 1.4 km North of Payapay Bridge
Road: Road widening about 0.9 km South of Payapay Bridge
Road: Intersection 1 site North of Payapay Bridge
Flood gate 2 sites Kilot creek, Binok creek
Drainage: Box culverts 5 sites Outlets for swamps
Source: JICA Study Team
8.4.1 Road alignment
(1) Geometric Design Standard
The Geometric Design Standard is to be based on Design Guidelines, Criteria and Standards for
Public Works and Highways Volume I and II Department of Public Works and Highways
(DPWH) and AASHTO policies.
The proposed modified Geometric Design Standard is shown in Table 8.4-1 and Table 8.4-2 is
shown DPWH Geometric Design Standards.
The engineering design was made in order to come up with a reasonable estimate of the project
cost with an accuracy of + or –10%.
1) Anticipated Traffic Volume
The design of a highway or any part thereof should be based on factual data among those related
to traffic. The service for the improvement is indicated by present and future demands of traffic.
It directly affects the geometric features of design such as number of lane, width, grade, alignment
and type of pavement. Similarly, all roads should be designed to accommodate almost all types of
vehicles with provision for safety and convenience
2) Design Speed
The value of a highway is evaluated by the convenience and economy that it affords in
transporting goods and people in a safe and expeditious manner. The design speed should be the
maximum safe speed that can be maintained over a specified section of a highway where
conditions are so favorable that the design features of the highway govern. Table 8.4-2 shows the
238A1-1-237
The Urgent Development Study on the Project on Rehabilitation and Recovery from Typhoon Yolanda in the Philippines Final Report (II) Appendix Technical Supporting Report 1 (Volume 1, Chapter 2)
DPWH Project on Road Heightening and Tide Embankment for Section 3 and 4, Tacloban-Palo Draft Supporting Report for Basic Planning
8-18
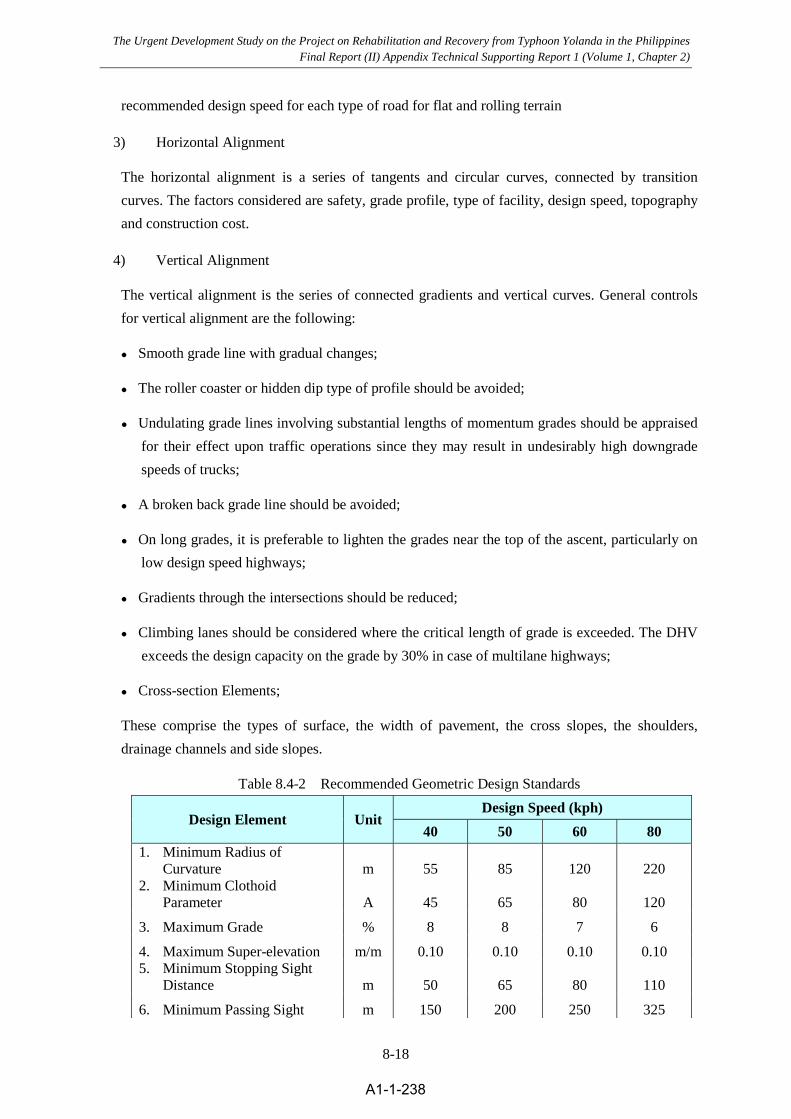
recommended design speed for each type of road for flat and rolling terrain
3) Horizontal Alignment
The horizontal alignment is a series of tangents and circular curves, connected by transition
curves. The factors considered are safety, grade profile, type of facility, design speed, topography
and construction cost.
4) Vertical Alignment
The vertical alignment is the series of connected gradients and vertical curves. General controls
for vertical alignment are the following:
Smooth grade line with gradual changes;
The roller coaster or hidden dip type of profile should be avoided;
Undulating grade lines involving substantial lengths of momentum grades should be appraised
for their effect upon traffic operations since they may result in undesirably high downgrade
speeds of trucks;
A broken back grade line should be avoided;
On long grades, it is preferable to lighten the grades near the top of the ascent, particularly on
low design speed highways;
Gradients through the intersections should be reduced;
Climbing lanes should be considered where the critical length of grade is exceeded. The DHV
exceeds the design capacity on the grade by 30% in case of multilane highways;
Cross-section Elements;
These comprise the types of surface, the width of pavement, the cross slopes, the shoulders,
drainage channels and side slopes.
Table 8.4-2 Recommended Geometric Design Standards
Design Element Unit Design Speed (kph)
40 50 60 80
1. Minimum Radius of Curvature m 55 85 120 220
2. Minimum Clothoid Parameter A 45 65 80 120
3. Maximum Grade % 8 8 7 6
4. Maximum Super-elevation m/m 0.10 0.10 0.10 0.10 5. Minimum Stopping Sight
Distance m 50 65 80 110
6. Minimum Passing Sight m 150 200 250 325
239A1-1-238
The Urgent Development Study on the Project on Rehabilitation and Recovery from Typhoon Yolanda in the Philippines Final Report (II) Appendix Technical Supporting Report 1 (Volume 1, Chapter 2)

DPWH Project on Road Heightening and Tide Embankment for Section 3 and 4, Tacloban-Palo Draft Supporting Report for Basic Planning
8-19
Distance
7. Lane Width (4 lane traffic) m 3.25 3.25 3.35 3.50 8. Length of Vertical Curves:
- Crest (Desirable Value) - Sag (Desirable Value)
m m
5A 6A
8A 10A
14A 15A
32A 25A
9. Embankment Side Slope m 1:1.5 1:1.5 1:1.5 1:1.5 10. Normal Cross Slope
- Concrete Pavement - Asphalt Pavement
% %
2.0 2.0
2.0 2.0
2.0 2.0
2.0 2.0
11. Sidewalk- Slope - Width
% m
4 1.5
4 1.5
4 1.5
4 1.5
12. Right-of-Way Width m 30 30 30 30
Source: JICA Study Team
Table 8.4-3 Minimum Design Standard Philippine Highways ADT AVERAGE DAILY TRAFFIC ON UNDER 200 200 – 400 400 – 1000 1000 - 2000 MORE THAN 2000
OPENING MINIMUM DESIRABLE MINIMUM DESIRABLE MINIMUM DESIRABLE
DESIGNED SPEED (km/h) FLAT TOPOGRAPHY 60 70 70 90 80 95 90 100ROLLING TOPOGRAPHY 40 50 60 80 60 80 70 90MOUNTAINOUS TOPOGRAPHY 30 40 40 50 50 60 60 70
RADUIS ( metre ) FLAT TOPOGRAPHY 120 160 160 280 220 320 260 350ROLLING TOPOGRAPHY 55 65 120 220 120 220 160 280MOUNTAINOUS TOPOGRAPHY 30 50 50 80 80 120 180 160
GRADE (PERCENT) FLAT TOPOGRAPHY 6.0 6.0 5.0 3.0 4.0 3.0 4.0 3.0ROLLING TOPOGRAPHY 8.0 7.0 6.0 5.0 5.0 5.0 5.0 4.0MOUNTAINOUS TOPOGRAPHY 10.0 9.0 8.0 6.0 7.0 6.0 7.0 5.0PAVEMENT WIDTH ( m ) 4.0 5.5 ; 6.0 6.10 6.70 6.70 7.30 SHOULDER WIDTH ( m ) 0.50 1.0 1.50 2.00 2.50 3.00 3.00RIGHT OF WAY ( m ) 20 30 30 30 30 30SUPERELEVATION ( m / m ) 0.10 (MAX.) 0.10 (MAX.) 0.10 (MAX.) 0.10 (MAX.)
NON PASSING SIGHHT DISTANCE ( metre ) FLAT TOPOGRAPHY 70 90 90 135 115 150 135 160ROLLING TOPOGRAPHY 40 60 70 11.5 70 115 90 135MOUNTAINOUS TOPOGRAPHY 40 40 40 60 60 70 70 90
PASSING DISTANCE ( metre ) FLAT TOPOGRAPHY 420 490 490 615 645 645 615 675ROLLING TOPOGRAPHY 270 350 350 560 560 560 490 615MOUNTAINOUS TOPOGRAPHY 190 270 270 350 420 420 420 490
TYPE OF SURFACING
GRAVEL, CRUSHED GRAVEL OR CRUSHED STONE BIT,
PRESERVATIVE TREATMENT, SINGLE OR DOUBLE BIT, SURFACE TREATMENT,
BITUMINOUS MACADAM PAVEMENT
BITUMINOUS MACADAM PAVEMENT, DENSE OR OPEN GRADED PLANT
MIX SURFACE COURSE, BITUMINOUS CONCRETE
SURFACE COURSE
BITUMINOUS CONCRETE SURFACE COURSE
BITUMINOUS CONCRETE SURFACE COURSE
PORTLAND CEMENT CONCRETE PAVEMENT
Source: DPWH Design Standard and Criteria
(2) Road Alignment for Extension of Service Road (Baybay Road) and Road Widening for Manlurip Road in Section 4
1) Extension of Service Road (Baybay Road) in Section 4
Existing road of Baybay road at around Sta. 2+400 in Section 4 was washed out during Typhoon
Yolanda. Rehabilitation of damage by Typhoon Yolanda, Tidal Protection Dike will be
constructed 40m of no built zone from shore line and beside for landside of this dike will be
constructed 6.1m width concrete pavement extension road to connect Manlurip Road as a Service
240A1-1-239
The Urgent Development Study on the Project on Rehabilitation and Recovery from Typhoon Yolanda in the Philippines Final Report (II) Appendix Technical Supporting Report 1 (Volume 1, Chapter 2)

DPWH Project on Road Heightening and Tide Embankment for Section 3 and 4, Tacloban-Palo Draft Supporting Report for Basic Planning
8-20
Road (Barangay Road). Basically road alignment will be same as Tidal Protection Dike.
2) Road Widening in Section 4
Existing road (Manlurip Rd.) of 760m in length at Sta. 3+500~Sta. 4+260 based on stationing of
tide protection dike in Section 4 will be affected new dike construction. Therefore existing road
shall be sifted about 8m to landside and road alignment is basically same as existing road.
8.4.2 Intersections
(1) General
One of the important highway elements, limiting capacity and often interrupting the flow of
vehicular traffic, especially in an urban area, is the intersection-at-grade. Proper channelization
designs at intersection will improve traffic movements and safety, increase capacity, and instill
drivers confidence. Channelized intersection will also directly influence the capacity of the road
to provide services to the vehicles and pedestrian traffic.
(2) Objective
The main objective is to design the intersection that would provide a maximum service volume for
individual isolated intersection approaches and thereby maximize the capacity for each
intersection.
As a function of the preliminary design process the Consultant ensures that the location of
intersection shall be chosen to avoid steep profile grades for driver safety (less than 2.5%).
An intersection is the general area where two or more highways join or cross for traffic movements.
It is an important part of a highway since much of the efficiency, safety, speed, cost of operation,
and capacity of the carriageway are dependent upon its design.
General Consideration for design
Following are the guidelines adopted in designing at-grade intersections:
Provide sight distance at least equal to the stopping distance for the design speed of the road.
Avoid if possible intersection in cuts or near the crest of vertical curves.
If possible avoid placing the intersection where the superior road is on a sharp horizontal curve.
Avoid intersections where road is on a steep grade.
Try to make the intersection as nearly right angled as possible. It is operationally safer and cheaper
to construct.
The major intersections are proposed to be signalized and all minor crossings which require only a
simple road connection by improving the corner radius.
241A1-1-240
The Urgent Development Study on the Project on Rehabilitation and Recovery from Typhoon Yolanda in the Philippines Final Report (II) Appendix Technical Supporting Report 1 (Volume 1, Chapter 2)
DPWH Project on Road Heightening and Tide Embankment for Section 3 and 4, Tacloban-Palo Draft Supporting Report for Basic Planning
8-21
The pertinent data for the traffic flow forecast for the intersections shall be the basis for the design
of the channelized at-grade intersections and has be undertaken during the detailed design phase.
The geometric design criteria were based on AASHTO, A Policy on Geometric Design of
Highways and Streets, Series of 2001 and Highway Capacity Manual Series 2000.
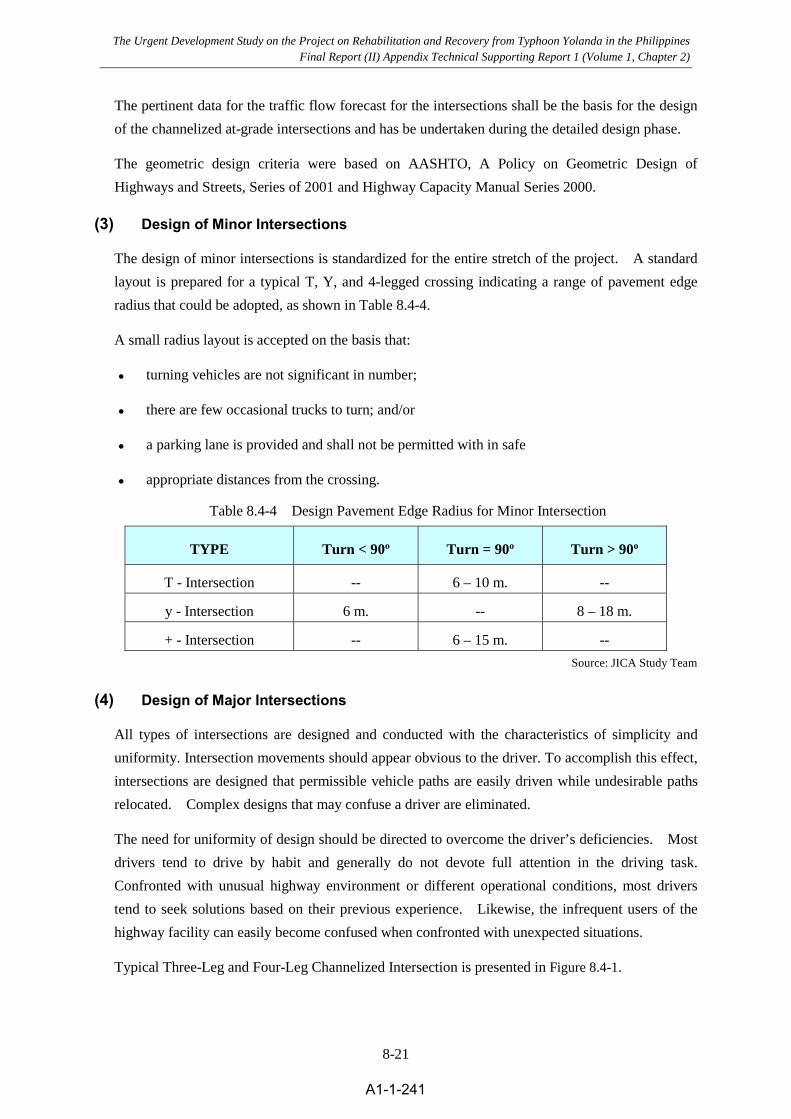
(3) Design of Minor Intersections
The design of minor intersections is standardized for the entire stretch of the project. A standard
layout is prepared for a typical T, Y, and 4-legged crossing indicating a range of pavement edge
radius that could be adopted, as shown in Table 8.4-4.
A small radius layout is accepted on the basis that:
turning vehicles are not significant in number;
there are few occasional trucks to turn; and/or
a parking lane is provided and shall not be permitted with in safe
appropriate distances from the crossing.
Table 8.4-4 Design Pavement Edge Radius for Minor Intersection
Source: JICA Study Team
(4) Design of Major Intersections
All types of intersections are designed and conducted with the characteristics of simplicity and
uniformity. Intersection movements should appear obvious to the driver. To accomplish this effect,
intersections are designed that permissible vehicle paths are easily driven while undesirable paths
relocated. Complex designs that may confuse a driver are eliminated.
The need for uniformity of design should be directed to overcome the driver’s deficiencies. Most
drivers tend to drive by habit and generally do not devote full attention in the driving task.
Confronted with unusual highway environment or different operational conditions, most drivers
tend to seek solutions based on their previous experience. Likewise, the infrequent users of the
highway facility can easily become confused when confronted with unexpected situations.
Typical Three-Leg and Four-Leg Channelized Intersection is presented in Figure 8.4-1.
TYPE Turn < 90o Turn = 90o Turn > 90o
T - Intersection -- 6 – 10 m. --
y - Intersection 6 m. -- 8 – 18 m.
+ - Intersection -- 6 – 15 m. --
242A1-1-241
The Urgent Development Study on the Project on Rehabilitation and Recovery from Typhoon Yolanda in the Philippines Final Report (II) Appendix Technical Supporting Report 1 (Volume 1, Chapter 2)

DPWH Project on Road Heightening and Tide Embankment for Section 3 and 4, Tacloban-Palo Draft Supporting Report for Basic Planning
8-22
Source: JICA Study Team
Figure 8.4-1 Typical Three-Leg and Four-Leg Channelized Intersection
(5) Geometric Design Standard
Geometric design elements have a strong influence on the safety and efficiency of operation of
intersection-at-grade. The elements for which uniformity is important are, the design speed, corner
radii, intersection angles, vehicle turning paths, auxiliary lanes, median end treatment and
channelized island
(6) Design Speed
Generally, the design speed is determined during the design of the road horizontal alignment.
Design speed is adopted 60 kph for common section, and 40 kph for at-grade intersections. This
is a reduction by 20 kph from the adopted design speed for common section
(7) Corner Radii
The turning roadway was designed using a simple curve and asymmetrical compound curves.
The radius for the simple curve was limited to a minimum of 10 meters to suit operational
requirements and to minimize ROW acquisition cost. Where smooth passing is required for a right
turn vehicle, either a tapered section precedes the curve or asymmetrical compound curve (radius
of a flatter curve is twice the radius of a sharper curve). The width was based on two-lane operation
with stalled vehicle passing for SU design vehicle.
(8) Intersection Angle
The angle of intersection is the difference of Azimuths of two intersecting road. Azimuths of the
road are established in the design of the horizontal alignment. The azimuths of the crossing road
are determined from the coordinates of its centerline profile
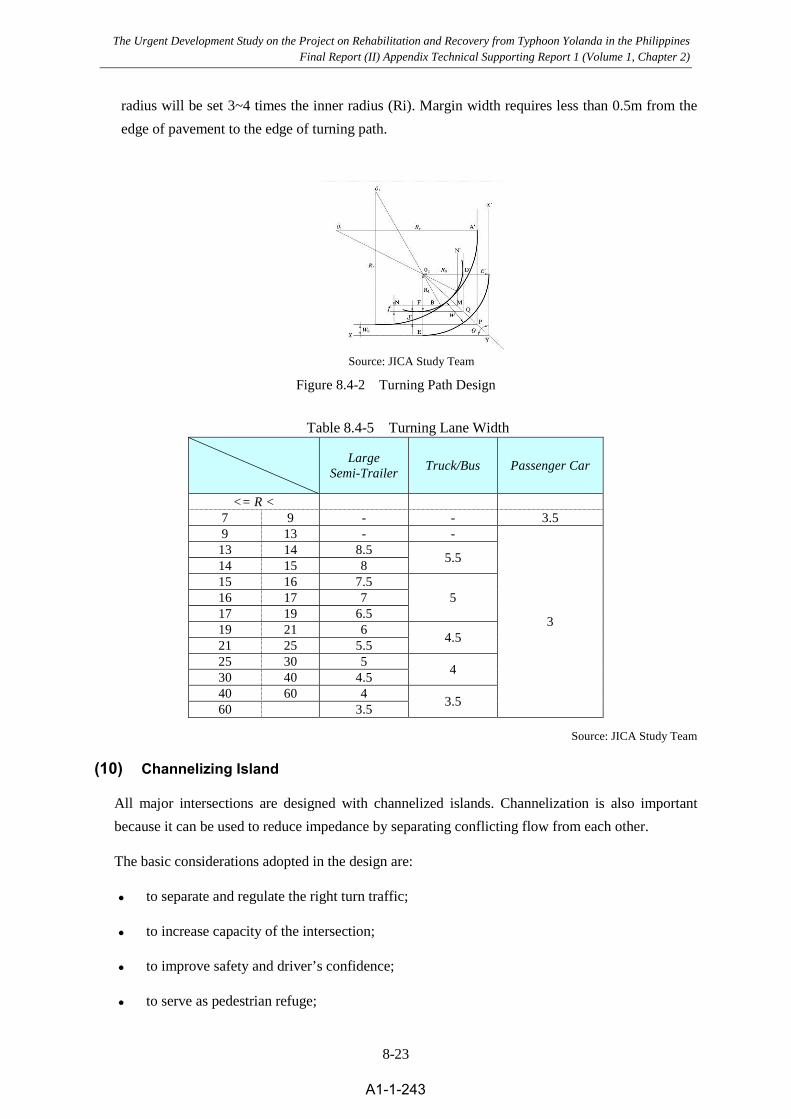
(9) Turning Path
The turning path is recommended to use 3-centered compound curve. Outside radius (Ro) and
turning path width (w) will be selected from Table 8.4-5 Turning Lane Width Transition curve
243A1-1-242
The Urgent Development Study on the Project on Rehabilitation and Recovery from Typhoon Yolanda in the Philippines Final Report (II) Appendix Technical Supporting Report 1 (Volume 1, Chapter 2)
DPWH Project on Road Heightening and Tide Embankment for Section 3 and 4, Tacloban-Palo Draft Supporting Report for Basic Planning
8-23
radius will be set 3~4 times the inner radius (Ri). Margin width requires less than 0.5m from the
edge of pavement to the edge of turning path.
Source: JICA Study Team
Figure 8.4-2 Turning Path Design
Table 8.4-5 Turning Lane Width
Source: JICA Study Team
(10) Channelizing Island
All major intersections are designed with channelized islands. Channelization is also important
because it can be used to reduce impedance by separating conflicting flow from each other.
The basic considerations adopted in the design are:
to separate and regulate the right turn traffic;
to increase capacity of the intersection;
to improve safety and driver’s confidence;
to serve as pedestrian refuge;
Large
Semi-TrailerTruck/Bus Passenger Car
<= R < 7 9 - - 3.5 9 13 - -
3
13 14 8.5 5.5
14 15 8 15 16 7.5
5 16 17 7 17 19 6.5 19 21 6
4.5 21 25 5.5 25 30 5
4 30 40 4.5 40 60 4
3.5 60 3.5
244A1-1-243
The Urgent Development Study on the Project on Rehabilitation and Recovery from Typhoon Yolanda in the Philippines Final Report (II) Appendix Technical Supporting Report 1 (Volume 1, Chapter 2)

DPWH Project on Road Heightening and Tide Embankment for Section 3 and 4, Tacloban-Palo Draft Supporting Report for Basic Planning
8-24
to reduce paved area thereby narrowing conflicting areas for the vehicle; and
to provide space for any traffic control devices as necessary.
The dimensions of the island were the product of the right turns radii and the left turn radii,
approach pavement width and the geometry of the islands provided.
(11) New Intersection for Extension of Baybay connected to Manlurip Road
Existing Baybay road from Sta. 2+400 in Section 4 will be extended to Manlurip Road at Sta.
3+700 and this connection point has been new T type intersection. Below Figure 8.4-3 shows
schematic plan for intersection of Baybay road and Manlurip Road.
Source: JICA Study Team
Figure 8.4-3 Intersection of Baybay road and Manlurip Road at Section 4
8.4.3 Pavement Structure
The Design Standards and Criteria will adopt DPWH and AASHTO Guidelines 2004 edition in
the design of the pavement for the road project. Parameters/data for input shall be taken from soils
survey (CBR), traffic surveys (computation of ESAL and ESWL); Modulus of Resiliency (from
Laboratory Test results) and demand forecast.
The Pavement Design will use of the result of the Life-cycle Cost Analysis for the Road Project.
(1) Design Life Period
The pavement design life is as follows;
Rigid Pavement:
- Highway……………… 30 years
245A1-1-244
The Urgent Development Study on the Project on Rehabilitation and Recovery from Typhoon Yolanda in the Philippines Final Report (II) Appendix Technical Supporting Report 1 (Volume 1, Chapter 2)

DPWH Project on Road Heightening and Tide Embankment for Section 3 and 4, Tacloban-Palo Draft Supporting Report for Basic Planning
8-25
- Service Road…………. 20 years
Flexible Pavement:
- Highway……………… 20 years
- Service Road…………. 20 years (Total Extend Life)
{10 years (Initial period) + 10 years (Overlay)}
(2) Selection of Pavement Type
Basically Pavement type is divided broadly into two categories which are Rigid Pavement and
Flexible Pavement. One of the differences between these two types of pavement lies in the ability
to adopt stage construction to optimize the investment in the project implementation. Adoption of
multi-stage is initial project construction for 10-year design life with periodic overlays to extend
the performance period, is common in the case of Flexible pavement, while single-stage
construction is normally adopted in the case of Rigid pavement.
1) Rigid Pavement
The rigid pavement structure consisting of a prepared roadbed underlying layer of granular
sub-base and plain concrete slab is assumed in calculation the required thickness.
The traffic load is estimated based on the result of traffic study. Such design input as
environmental impact and effective modulus of sub-grade reaction are estimated from the results
of soil survey and by referring to available data and information.
2) Flexible Pavement
The flexible pavement structure consisting of a prepared underlying layer of sub-base and base
course and 5 cm asphalt binder course, 5 cm asphalt surface course is assumed in calculation the
required thickness. The traffic load estimation is same as rigid pavement. The pavement structural
number (SN) requirements are determined from design charts for flexible pavement shown in the
AASHTO design guide.
(3) Pavement Type for Service Road (Baybay Rd.) in Section 4
Extend of Baybay road which is say Service Road from Sta. 2+400 to connect Manlurip Road in
Section 4. Existing road is 5m width concrete pavement and traffic volume is very small
(AADT=843). Therefore 21 cm minimum thickness of concrete pavement and 20 cm of aggregate
sub-base course is proposed
246A1-1-245
The Urgent Development Study on the Project on Rehabilitation and Recovery from Typhoon Yolanda in the Philippines Final Report (II) Appendix Technical Supporting Report 1 (Volume 1, Chapter 2)
DPWH Project on Road Heightening and Tide Embankment for Section 3 and 4, Tacloban-Palo Draft Supporting Report for Basic Planning
8-26
(4) Pavement Type for Road Widening of Manlurip Road in Section 4
Existing concrete pavement road (Manlurip Rd.) of 760m in length at Sta. 3+500~Sta. 4+260 in
section 4 will be affected new dike construction. Therefore existing road shall be sifted 4m toward
to land side and pavement type and thickness for widening is proposed 25 cm minimum thickness
of concrete pavement and 20 cm of aggregate sub-base course
247A1-1-246
The Urgent Development Study on the Project on Rehabilitation and Recovery from Typhoon Yolanda in the Philippines Final Report (II) Appendix Technical Supporting Report 1 (Volume 1, Chapter 2)

DPWH Project on Road Heightening and Tide Embankment for Section 3 and 4, Tacloban-Palo Draft Supporting Report for Basic Planning
8-27
8.5 Flood gate
2 flood gates are included in the prioritized sections. Design parameters are sorted out in this
chapter.
Table 8.5-1 Flood Gates in the Prioritized Sections
Type of structure Number / Length Note
Tide embankment about 2.5 km Whole sections
Access road To be designated Whole sections
Road: New road about 1.4 km North of Payapay Bridge
Road: Road widening about 0.9 km South of Payapay Bridge
Road: Intersection 1 site North of Payapay Bridge
Flood gate 2 sites Kilot creek, Binok creek
Drainage: Box culverts 5 sites Outlets for swamps
Source: JICA Study Team
8.5.1 Proposed Locations of river gate River gate facilities are proposed to build at the spots where the rivers/creeks would cross the
proposed tide embankment for the purpose of protecting the landside against the sea water. The
proposed locations of the river gate facilities are shown in Figure 8.5-1.Two gates are located in
the prioritized sections.
Figure 8.5-1 Proposed Locations of River Gate
248A1-1-247
The Urgent Development Study on the Project on Rehabilitation and Recovery from Typhoon Yolanda in the Philippines Final Report (II) Appendix Technical Supporting Report 1 (Volume 1, Chapter 2)

DPWH Project on Road Heightening and Tide Embankment for Section 3 and 4, Tacloban-Palo Draft Supporting Report for Basic Planning
8-28
8.5.2 Design and operational water levels and depths River gate facilities will be built against the sea water with the levels not exceeding “Required
heights at MSL of the tide embankment” tabulated at the Table 8.5-2 below. The river gate
facilities shall be designed not to hinder the river/creek flows at the time of those high water
levels or lower, and also not to hydraulically damage the conjunctive tide protection work and
river/creek structures.
Table 8.5-2 Required Heights of the Tide Embankment
Sections Section 4
Required heights at MSL of the tide embankment
+3.5m
Source: JICA study team
“Required heights at MSL of tide embankment” are being determined by this Study inclusive of a
certain allowance, and so the proposed river gate facilities shall be designed to be structurally
safe against the sea water with the levels of “Required heights at MSL of the tide embankment”.
In Prioritized sections, the reevaluated flow discharges conducted by this Study at the existing
bridges and culverts closest to the outfalls are summarized as following Table 8.5-3.
Table 8.5-3 Reevaluated Flow Discharges at the Existing Bridges and Culverts
No.
Sec
tion
s
Rivers/ Creeks
Located LGUs
Current opening size of the existing bridges and culverts closest to the outfalls
1/10 year estimated discharge at outfalls
Recommended hydraulic dimensions at the locations of the existing bridges and culverts
Width Height Total area
(m3/s) (m) (m) (m2)
5 S-4 Kilot creek (Payapay)
Palo municipality
Payapay bridge 3 span I girder type B(7.8m+10.0m+7.8m) ×H3.5m
1 2.0 2.0 4.0
6 S-4 Binog creek Palo municipality
Box culvert No.1B2.5m×H1.8m×2 13 5.0 2.0 10.0
Source: JICA study team
Heights, clear spans and the numbers of the gate leaves will be determined so that the reevaluated
flow discharges and heights, done by this Study, of the rivers/creeks can pass smoothly when
those gate leaves are fully opened.
Freeboard will be added 0.60m, for design discharge of less than 200m3/s, on the top of the water
level reevaluated by this Project in conformity with “Design Guidelines Criteria and Standards
for Public Works and Highways, Volume II, page 468, DPWH” as following description.
249A1-1-248
The Urgent Development Study on the Project on Rehabilitation and Recovery from Typhoon Yolanda in the Philippines Final Report (II) Appendix Technical Supporting Report 1 (Volume 1, Chapter 2)

DPWH Project on Road Heightening and Tide Embankment for Section 3 and 4, Tacloban-Palo Draft Supporting Report for Basic Planning
8-29
The proposed gate heights will not be lower than the freeboard 0.60m + the reevaluated flow
heights.
In discussion with Palo municipal mayor and her officers which took place in June 11th 2015, the
boats having locally common size shall be accommodated landward through the proposed gate
opening at Kilot creek.This is because Kilot creek (otherwise called Payapay) is being currently
used as waterway.
Regardless of the reevaluated flow discharge for the proposed gate sites, size of single gate leaf
will be determined taking into consideration the manufacturing capacity and experience even of
Philippine manufactures. So far, information on Philippine manufactures of hydraulic gates has
not been obtained enough, however as the result of some hearings from the officers of DPWH
Regional office No.8 and NIA Regional office No.8, the manufacturing capacity of Philippine
manufactures does not sound higher. Therefore, the maximum size of single gate leaf will be to
be 10m2 as small gate leaf as stipulated in Japan. From terms of the quality assurance, overseas
procurement of the hydraulic gate facilities will not be excluded.
Sill elevations of the gate leaves will be determined in the Basic Design stage complying with the
current river/creek bed elevations.
250A1-1-249
The Urgent Development Study on the Project on Rehabilitation and Recovery from Typhoon Yolanda in the Philippines Final Report (II) Appendix Technical Supporting Report 1 (Volume 1, Chapter 2)

DPWH Project on Road Heightening and Tide Embankment for Section 3 and 4, Tacloban-Palo Draft Supporting Report for Basic Planning
8-30
Thus in sections 3 and 4, the design & operational water depths and the dimensions of gate leaves
are proposed as Table 8.5-4 in order to proceed to the Basic Design stage for conducting
mechanical, electrical, structural and foundation design.
Table 8.5-4 Design & Operational Water Depths and Dimensions of Gate Leaves
No.
Sec
tion
s
Provisional
names of gates
Proposed dimensions of gate leaves
Design
sea water
level
Tentative
(To be determined in B/D Width
(Clear
span)
Height Nos.Total
area Type Gate sill
elevation
Design
water
depth
Opera-
tional
water
depth
(m MSL) (m MSL) (m) (m) (m) (m) - (m2)
5 S-4 Kilot
creek Gate +3.5 -0.5 4.0 4.0 3.5 2.6 1 9.1
Fixed
wheel
6 S-4 Binog creek
Gate No.1 +3.5 +0.3 3.2 3.2 3.0 2.0 2 12.0
Fixed
wheel
Source: JICA study team
251A1-1-250
The Urgent Development Study on the Project on Rehabilitation and Recovery from Typhoon Yolanda in the Philippines Final Report (II) Appendix Technical Supporting Report 1 (Volume 1, Chapter 2)

DPWH Project on Road Heightening and Tide Embankment for Section 3 and 4, Tacloban-Palo Draft Supporting Report for Basic Planning
8-31
8.5.3 Layouts of river gates The proposed river gate facilities will be composed of hydraulic gate system (gate leaves,
hoisting devices and gate guides), box culvert, piers, columns, hoisting deck, wing walls, breast
walls and stairs. Each structure excluding the hydraulic gate system and the staircase shall be of
reinforced concrete.
Transition dike will be provided in order to connect the existing channel with the upstream
(landside) wing wall of the structure.
Training dike will be provided after downstream (seaside) wing wall seaward to drain landside
water to the sea.
At the Basic Planning stage, rough layouts of the proposed river gates are shown as follows.
(1) Kilot creek Gate in Palo Municipality
Source: JICA Study Team
Figure 8.5-2 Plan of Kilot creek Gate
252A1-1-251
The Urgent Development Study on the Project on Rehabilitation and Recovery from Typhoon Yolanda in the Philippines Final Report (II) Appendix Technical Supporting Report 1 (Volume 1, Chapter 2)

DPWH Project on Road Heightening and Tide Embankment for Section 3 and 4, Tacloban-Palo Draft Supporting Report for Basic Planning
8-32
Source: JICA Study Team
Figure 8.5-3 Profile of Kilot creek Gate
Source: JICA Study Team
Figure 8.5-4 Front View of Kilot creek Gate from Seaside
253A1-1-252
The Urgent Development Study on the Project on Rehabilitation and Recovery from Typhoon Yolanda in the Philippines Final Report (II) Appendix Technical Supporting Report 1 (Volume 1, Chapter 2)

DPWH Project on Road Heightening and Tide Embankment for Section 3 and 4, Tacloban-Palo Draft Supporting Report for Basic Planning
8-33
8.5.4 Design conditions
1) Codes, standards, guidelines and manuals for designing
The following codes, standards, guidelines and manuals will be used for conducting the Basic and
Detailed Designs for the river gate facilities.
a) Philippine codes, standards, guidelines and manuals
National Building Code of the Philippines
National Structural Code of the Philippines, Volume 1 and 2
DPWH Design Guidelines Criteria and Standards for Public Works and Highways, Volumes I,
II, III and IV
DPWH Standard Specifications for Highways, Bridges and Airports
DPWH Ready Check
Other Codes, Standards, Guidelines and Manuals Spread in the Philippines
b) International codes and standards
International Organization for Standardization (ISO)
International Electrotechnical Commission (IEC)
Other Codes, Standards, Guidelines and Manuals Spread Worldwide
c) American codes, standards, guidelines and manuals
American National Standards Institute (ANSI)
ASTM International (former American Society for Testing and Materials)
American Association of State Highway and Transportation Officials (AASHTO)
American Concrete Institute (ACI)
American Institute of Steel Construction (AISC)
U.S. Army Corps of Engineers, Engineering and Design
Other Codes, Standards, Guidelines and Manuals Spread in the USA
d) Japanese codes, standards, guidelines and manuals
Japanese Industrial Standards (JIS)
Japan Electrical Manufacturers’ Association (JEM)
Japanese Electrotechnical Committee (JEC)
Japan Association of Dam & Weir Equipment Engineering Standards
Technical Standards for River and Sabo Works, River Association of Japan
Specification for Highway Bridges, Part I ~ V, Road Association of Japan
Other Codes, Standards, Guidelines and Manuals Spread in Japan
254A1-1-253
The Urgent Development Study on the Project on Rehabilitation and Recovery from Typhoon Yolanda in the Philippines Final Report (II) Appendix Technical Supporting Report 1 (Volume 1, Chapter 2)

DPWH Project on Road Heightening and Tide Embankment for Section 3 and 4, Tacloban-Palo Draft Supporting Report for Basic Planning
8-34
2) Parameters for structural and foundation design
Parameters for the structural and foundation design of the river gate facilities are described as
follows.
a) Unit weights of materials
Unit weights of materials are tabulated as follows.
Table 8.5-5 Unit Weights of Materials
Materials Unit weight(kN/m3)
Structural Steel 77.0
Stainless steel 77.8
Reinforced concrete 24.0
Prestressed concrete 24.0
Plain concrete 23.5
Cement mortar 21.0
Grouted riprap/Wet stone masonry 22.0
Sand/Gravel/Crushed stone 19.0
Water 9.8
Timber 8.0
Source: Ministry of Land, Infrastructure, Transport and Tourism of Japan
Unit weights of soil shall be determined by the results of laboratory tests, however if there is
no data available at hand, the following standards of unit weights will be used.
Table 8.5-6 Unit Weights of Soil
Type of soil Wet (kN/m3)
Loose Compacted
Natural Foundation
Sand /Gravel 18 20
Sandy soil 17 19
Clayey soil 14 18
Embankment
Sand /Gravel 20
Sandy soil 19
Clayey soil 18
Source: Ministry of Land, Infrastructure, Transport and Tourism of Japan
255A1-1-254
The Urgent Development Study on the Project on Rehabilitation and Recovery from Typhoon Yolanda in the Philippines Final Report (II) Appendix Technical Supporting Report 1 (Volume 1, Chapter 2)

DPWH Project on Road Heightening and Tide Embankment for Section 3 and 4, Tacloban-Palo Draft Supporting Report for Basic Planning
8-35
3) Parameters of concrete
a) Class
Concrete is classified according to28th day compressive strength, maximum size of
aggregates and application as shown in the following table.
Table 8.5-7- Class of Concrete
Class of concrete
28th day compressive strength f’c
(N/mm2)
Maximum size of aggregates
(mm) Application
A 20.7 50 General use, reinforced concrete members with thickness more than 20cm
B 16.5 50 Plain concrete for structure
C 20.7 19 General use, reinforced concrete members with thickness less than 20cm, secondary concrete
P 37.7 - Prestressed concrete structures and members
E 29.4 25 Precast reinforced concrete pile
F 11.8 40 Plain concrete for leveling
Seal 20.7 37.5 Concrete deposited in water
b) Allowable stress
Allowable stresses for plain and reinforced concretes are obtained from the values of the 28th
day compressive strength f’c of concrete. The following table shows formulas for obtaining
those allowable stresses.
Table 8.5-8 Allowable Stresses of Concrete
Type of stress Plain concrete
(N/mm2) Reinforced concrete
(N/mm2)
Flexure
Compression 0.40f’c 0.40f’c
Tension 0.21f’c ―
Rapture 0.70f’c1/2 0.70f’c1/2
Bearing 0.30f’c 0.30f’c
Shear stress
Beam, one-way slab and foundation
0.08f’c1/2 0.08f’c1/2
Axial force
Compression 0.08f’c1/2 0.08f’c1/2
Tension 0.075[1+0.6(N/Ag)] f’c1/2 0.075[1+0.6(N/Ag)] f’c1/2
Note: N = Axial Force、Ag = Area of reinforcement
256A1-1-255
The Urgent Development Study on the Project on Rehabilitation and Recovery from Typhoon Yolanda in the Philippines Final Report (II) Appendix Technical Supporting Report 1 (Volume 1, Chapter 2)

DPWH Project on Road Heightening and Tide Embankment for Section 3 and 4, Tacloban-Palo Draft Supporting Report for Basic Planning
8-36
4) Parameters of reinforcing steel bars
a) Grade and allowable stresses
Reinforcing steel bars shall be of Grade 275 or Grade 415. The following table shows the
yield strength and allowable stress of the reinforcing steel bars.
Table 8.5-9- Allowable Stress of Reinforcing Steel Bars
Grade Minimum yield strength
(N/mm2) Allowable tensile stress
(N/mm2)
Grade 275 reinforcement 275 140
Grade 415 reinforcement 415 168
Dimensions of reinforcing steel bars used in the Philippines are shown in the following table.
Table 8.5-10- Dimensions of Reinforcing Steel Bars
Nominal diameter
(mm)
Nominal perimeter
(mm)
Nominal cross-sectional
area (cm2)
Unit mass (kg/m)
8 25.1 0.503 0.387
10 31.4 0.785 0.617
12 37.7 1.131 0.888
16 50.3 2.011 1.578
20 62.8 3.142 2.466
25 78.6 4.909 3.853
28 88.6 6.158 4.834
32 100.5 8.043 6.313
36 113.1 10.179 7.990
b) Modulus of elasticity
The modulus of elasticity for concrete (Ec) is obtained as 4,700 f’c1/2 (N/mm2) for normal
weight concrete.
The modulus of elasticity for reinforcing steel bar (Es) is obtained as 200,000 (N/mm2).
Therefore, in case of f’c = 20.7 (N/mm2), modular ratio is obtained as n = Es / Ec = 9.
5) Parameters of soil
a) Cohesion of clayey soil
Cohesion of clayey soil shall be determined by tri-axial test or unconfined compression test.
When using an unconfined compression test, the following formula can be used to estimate
the cohesion of soft clay.
2uq
c
Where,
257A1-1-256
The Urgent Development Study on the Project on Rehabilitation and Recovery from Typhoon Yolanda in the Philippines Final Report (II) Appendix Technical Supporting Report 1 (Volume 1, Chapter 2)

DPWH Project on Road Heightening and Tide Embankment for Section 3 and 4, Tacloban-Palo Draft Supporting Report for Basic Planning
8-37
c : cohesion (kN/m2)
qu : unconfined compression strength (kN/m2)
If there is no data available, cohesion can be estimated by using N-value as follows.
c = 6N ~ 10N
b) Coefficient of lateral reaction of foundation ground
For the design of foundation piles, coefficient of lateral reaction of soil can be estimated by
using the following method.
4/30 3.0
HHH
BKK
Where,
KH : coefficient of lateral reaction of soil (kN/m3)
KHo : coefficient of lateral reaction of soil (kN/m3) equals to a value of plate bearing test
with rigid circular plate of a diameter of 30cm, and it can be estimated by the following
equation with a modulus of deformation: E0 obtained by various soil tests and investigations:
EoK H 3.0
10
Where,
α: coefficient given by the table below
Eo : modulus of deformation of soil for design obtained by soil test or equation as shown in
table below.
BH : converted loading width of foundation in load action direction (m)
Table 8.5-11- Relation between Eo and α
Modulus of Deformation Eo (kN/m2)
α value
Normal, Storm
Seismic
A half of modulus of deformation obtained by repeating curves in plate bearing test with rigid circular plate of a diameter of 30cm
1 2
Modulus of deformation measured in borehole horizontal loading test
4 8
Modulus of deformation obtained by test pieces in unconfined compression test or tri-axial test
4 8
Modulus of deformation estimated by Eo=2800N with N-value in Standard Penetration Test
1 2
258A1-1-257
The Urgent Development Study on the Project on Rehabilitation and Recovery from Typhoon Yolanda in the Philippines Final Report (II) Appendix Technical Supporting Report 1 (Volume 1, Chapter 2)

DPWH Project on Road Heightening and Tide Embankment for Section 3 and 4, Tacloban-Palo Draft Supporting Report for Basic Planning
8-38
c) Compression index
Compression index of soil or foundation ground shall be determined by compression test, but
if there is no data available, it can be estimated by the following formula.
Cc=0.009 (LL -10)
or
Cc=0.0054 (2.6 w - 35)
Where,
Cc : compression index
LL : liquid limit (%)
w : natural water content (%)
6) Seismic load
Seismic load is basically computed using Seismic Coefficient Method. Seismic coefficient
shall be one-half (1/2) of the acceleration coefficient (Kh = A/2 = 0.4/2 = 0.2).
7) Seismic load
Seismic load is basically computed using Seismic Coefficient Method. Seismic coefficient
shall be one-half (1/2) of the acceleration coefficient (Kh = A/2 = 0.4/2 = 0.2).
8) Wind forces
Minimum wind pressure to be used in this project shall be computed by the following
formula.
P = Ce Cq qs I
Where,
P = Design wind pressure
Ce = Combined height, exposure and gust factor coefficient
Cq = Pressure coefficient for the structure or portion of structure
qs = Wind stagnation pressures at height of 10 meters
I = Importance factor
9) Load combination and increase in allowable stresses
All structures shall be designed for the largest stresses resulting from the worst combination
of loads that may act on the structure at any given condition. For safety reasons, each
component of the structure shall be in proportion to bear all combinations of these forces.
Group I : Normal condition : D + L + I + E + H + U + F
Group II : Wind condition I : D + E + H + U + F + W
Group III : Wind condition II : Group I + 0.3W + WL + LF
Group IV : Seismic condition : D + Ee + H + U + V + De
Where,
259A1-1-258
The Urgent Development Study on the Project on Rehabilitation and Recovery from Typhoon Yolanda in the Philippines Final Report (II) Appendix Technical Supporting Report 1 (Volume 1, Chapter 2)

DPWH Project on Road Heightening and Tide Embankment for Section 3 and 4, Tacloban-Palo Draft Supporting Report for Basic Planning
8-39
D=dead load
L=live load
I=impact/dynamic effect of live load
E=earth pressure
H=hydrostatic pressure
U=uplift
W=wind load on structure
WL=wind load on live load
LF=longitudinal force from live load
V=seismic load
F=flowing water pressure
Ee=earth pressure due to earthquake
De=Dynamic water pressure due to earthquake
The following extra factors in allowable stresses shall be applied to the load combinations
listed above.
Table 8.5-12- Extra Factors in Allowable Stresses
Philippines code and standard Group I / Condition None
Group II 25%
Group III 25%
Group IV 33%
Japanese code and standard Normal None
Seismic 50%
260A1-1-259
The Urgent Development Study on the Project on Rehabilitation and Recovery from Typhoon Yolanda in the Philippines Final Report (II) Appendix Technical Supporting Report 1 (Volume 1, Chapter 2)

DPWH Project on Road Heightening and Tide Embankment for Section 3 and 4, Tacloban-Palo Draft Supporting Report for Basic Planning
8-40
8.5.5 Types of Hydraulic Gates Small gate leaves themselves, whose size is 10m2 or less, is classified as slide gate type and
fixed wheel (otherwise called as roller) gate type.
Slide gate type is to do water pressure supporting and water sealing by attaching a bearing
plates on the contact surface with the gate guide. That structure is very simple. However the
lifting load gets greater because of greater friction generated between the bearing plates and
gate guide when water pressure is higher. So, this type is used for low water protection.
Fixed wheel/roller gate type is to do water pressure supporting and lifting by attaching
wheels/rollers in the both side the gate leaf itself. That water sealing is made by attaching
the rubber seals on the four sides of the gate leaf. The lifting load gets smaller because of
smaller friction generated between the wheels/rollers and gate guide even when water
pressure is higher. So, this type is used commonly even for higher water protection.
Hoisting device is generally classified as rack gear type, screw spindle type and wire rope
winch type. In Japan, the up and down hoisting speed requires 0.3m/min except for
emergent use gates. Manual hoisting device is normally manufactured up to 40kN of lifting
loads. Lifting loads more than 40kN require motorized hoisting device. Screw spindle
type and rack gear type is commonly used for small gates. The screw spindle type is used
for higher hoisting speed for emergency use gates. However the device requires higher
power motor. The rack gear type is used for normal hoisting speed for general use gates and
so the device requires smaller power motor.
In conclusion, the combination of fixed wheel/ roller gate with motorized rack gear is highly
recommended for this project implementation. Table 8.5-13 and Table 8.5-14 show the
comparison gate types and hoisting devices.
Table 8.5-13 Proposed Gate Types and Hoisting Devices
No.
Sec
tion
s
Provisional
names of gates
Proposed gate types and hoisting devices
Design
sea water
level
Tentative
(To be determined in B/D)
Availability of gate leaves
judged by rack gear hoist
Rack gear
Hoist
Gate sill
elevation Des
ign
wat
erde
pth
Ope
rati
onal
wat
er d
epth
Arr
ange
men
t
Sli
de ty
pe
Fix
ed w
heel
type
Man
ual
40kN
or
less
Mot
oriz
ed
(m MSL) (m MSL) (m) (m)
1 S-3
Tanghas-
Lirang
creek Gate
+4.0 -0.5 4.5 4.5B3.0m×H
2.6m×3 N/A A N/A 100kN
2 S-3 Sagakhan
creek Gate +4.0 -0.5 4.5 4.5
B3.0m×H
2.6m×1 N/A A N/A 100kN
3 S-3 Mahayahay
creek Gate +4.0 -0.5 4.5 4.5
B3.0m×H
2.6m×1 N/A A N/A 100kN
4 S-3 Burayan
river Gate +4.0 -1.0 5.0 5.0
B3.5m×H
2.6m×3 N/A A N/A 100kN
261A1-1-260
The Urgent Development Study on the Project on Rehabilitation and Recovery from Typhoon Yolanda in the Philippines Final Report (II) Appendix Technical Supporting Report 1 (Volume 1, Chapter 2)

DPWH Project on Road Heightening and Tide Embankment for Section 3 and 4, Tacloban-Palo Draft Supporting Report for Basic Planning
8-41
5 S-4 Kilot
creek Gate +3.5 -0.5 4.0 4.0
B3.5m×H
2.6m×1 N/A A N/A 75kN
6 S-4 Binog creek
Gate No.1 +3.5 +0.3 3.2 3.2
B3.0m×H
2.0m×2 N/A A N/A 50kN
7 S-4 Binog creek
Gate No.2 +3.5 -0.5 4.0 4.0
B3.0m×H
2.6m×1 N/A A N/A 75kN
8 S-4 Bangon river
appendix Gate+3.5 -1.0 4.5 4.5
B3.0m×H
2.6m×2 N/A A N/A 75kN
Source: JICA study team
Table 8.5-14 Comparison of Hoisting Devices
Item Type of hoisting device
Rack gear Screw spindle Wire rope winch
Self-weight closing Possible Impossible Possible
Pressing-down force Available Available Not available
Self-locked Possible Possible Depends on speed reducer type
Mechanical efficiency High Low Depends on speed reducer type
Motor capacity Small Large Depends on speed reducer type
Opening degree control Possible Possible Possible
Opening & closing speed
0.3m/min Approx.3m/min 0.3m/min
Mechanical complexity Fair Fair Complex
Applicable gate leaf size
Small Small and medium Medium and large
Operationability Easy Easy Easy
Maintenance Easy Fair Much required
Recommendability Recommendable Unrecommendable Unrecommendable
Seawater contains great deal of chloride as much as 19,000ppm and has higher electric
conductivity as much as 270 ohm-cm that are respectively 100 times or higher than fresh
water. Higher concentration of chloride breaks electrochemically a passive film created on
the material surface. As the result, surface metal comes to dissolves continuously and bring
about corrosion of material surface. SUS304 is representative of austenite stainless steel.
SUS 316, which is also austenite stainless steel, is added molybdenum comparing SUS304
for higher corrosion resistance. Stainless steel is made adding nickel and chrome into steel
materials in the manufacturing process. Chrome added in the materials with oxygen in the
surrounding air forms a dense and strong oxide film giving performance of corrosion
resistance. Table 8.5-15 and Table 8.5-16 show the comparison of stainless steel and
common steel.In the project implementation, the stain less steel gate leaves and gate guides
are highly recommended.
262A1-1-261
The Urgent Development Study on the Project on Rehabilitation and Recovery from Typhoon Yolanda in the Philippines Final Report (II) Appendix Technical Supporting Report 1 (Volume 1, Chapter 2)

DPWH Project on Road Heightening and Tide Embankment for Section 3 and 4, Tacloban-Palo Draft Supporting Report for Basic Planning
8-42
Table 8.5-15 Comparison of Materials for Gate Leaves and Guides
Evaluation Item
Materials for gate leaves and guides
Stainless steel
(SUS304, SUS316)
Steel
(SS400, SM400)
Strength Very good Very good
Corrosion resistance against seawater
Very good Very poor
Maintenance Easy Fair
Aesthetics Good Fair
(Very poor when oxidized)
Marketability Good Very good
Erection Good Good
Workability Fair Very good
Initial cost High Cheap
Repainting UnrequiredRequired
(every 4 to 7 years)
Running cost Low High
Recommendability Highly recommendable Unrecommendable
Table 8.5-16 Stress of Gate Materials
Materials Item
SUS 304 SS400 and SM400 Thickness 40 mm
Axial tensile stress (for net sectional area)
100 N/mm2 120 N/mm2
Axial compressive stress (for gross sectional area)
On condition of (l/r) 19, 100 N/mm2
On condition of (l/r) 20, 120 N/mm2
Compressive members On condition of 19 < (l/r) 96, 100– 0.53 ((l/r)-19)
On condition of 20 < (l/r) 93, 120 – 0.75 ((l/r)-20)
On condition of 96 < (l/r), 980,000/(7,200 + (l/r)2)
On condition of 93 < (l/r), 10,000,000/(6,700 + (l/r)2)
where; l: buckling length of member (mm)
r: radius of gyration of gross sectional area of member (mm)
Compressive splice member 100 N/mm2 120 N/mm2
Bending stress at tensile side(for net sectional area)
100 N/mm2 120 N/mm2
Bending stress at compressive side (for gross sectional area)
On condition of (l/b) (10/K), 100 N/mm2
On condition of (l/b) (9/K), 120 N/mm2
On condition of (l/b)> (10/K), 100– 0.9 ((Kl/b) – 10)
On condition of (9/K) < (l/b) 30, 120 – 1.1((Kl/b) – 9)
where; l: distance between fixed points of compressive flange (mm)
263A1-1-262
The Urgent Development Study on the Project on Rehabilitation and Recovery from Typhoon Yolanda in the Philippines Final Report (II) Appendix Technical Supporting Report 1 (Volume 1, Chapter 2)

DPWH Project on Road Heightening and Tide Embankment for Section 3 and 4, Tacloban-Palo Draft Supporting Report for Basic Planning
8-43
b: width of compressive flange (mm)
Ac
AwK
23
Aw: gross sectional area of web plate (mm2)
Ac: gross sectional area of compressive flange (mm2)
In case of (Aw/Ac) < 2, K is taken as 2.
On condition that compressive flange is directly welded to skin plate, etc.
100 N/mm2 120 N/mm2
Shear stress (for net sectional area)
60 N/mm2 70 N/mm2
Bearing stress 150 N/mm2 180 N/mm2
Notes:
In case the thickness exceeds 40 mm, the allowable stresses for normal loading condition of the
structural steel members shall be adjusted that the stress is 0.92 time that of the allowable stress as
mentioned above in the case of steel materials SS 400 and SM 400.
264A1-1-263
The Urgent Development Study on the Project on Rehabilitation and Recovery from Typhoon Yolanda in the Philippines Final Report (II) Appendix Technical Supporting Report 1 (Volume 1, Chapter 2)

DPWH Project on Road Heightening and Tide Embankment for Section 3 and 4, Tacloban-Palo Draft Supporting Report for Basic Planning
8-44
8.6 Drainage outlets
4 box culverts are included in the prioritized sections. Design parameters are sorted out in this
chapter.
Table 8.6-1 Drainage Outlest in the Prioritized Sections
Type of structure Number / Length Note
Tide embankment about 2.5 km Whole sections
Access road To be designated Whole sections
Road: New road about 1.4 km North of Payapay Bridge
Road: Road widening about 0.9 km South of Payapay Bridge
Road: Intersection 1 site North of Payapay Bridge
Flood gate 2 sites Kilot creek, Binok creek
Drainage: Box culverts 5 sites Outlets for swamps
Source: JICA Study Team
8.6.1 Location of drainage outlets
Location of drainage outlets are shown in Figure 8.6-1 and Figure 8.6-2.
265A1-1-264
The Urgent Development Study on the Project on Rehabilitation and Recovery from Typhoon Yolanda in the Philippines Final Report (II) Appendix Technical Supporting Report 1 (Volume 1, Chapter 2)

DPWH Project on Road Heightening and Tide Embankment for Section 3 and 4, Tacloban-Palo Draft Supporting Report for Basic Planning
8-45
Source: JICA Study Team
Figure 8.6-1 Location of Existing Drainage Outlets (1)
Prioritized sections Box culvert
Box culvert
266A1-1-265
The Urgent Development Study on the Project on Rehabilitation and Recovery from Typhoon Yolanda in the Philippines Final Report (II) Appendix Technical Supporting Report 1 (Volume 1, Chapter 2)
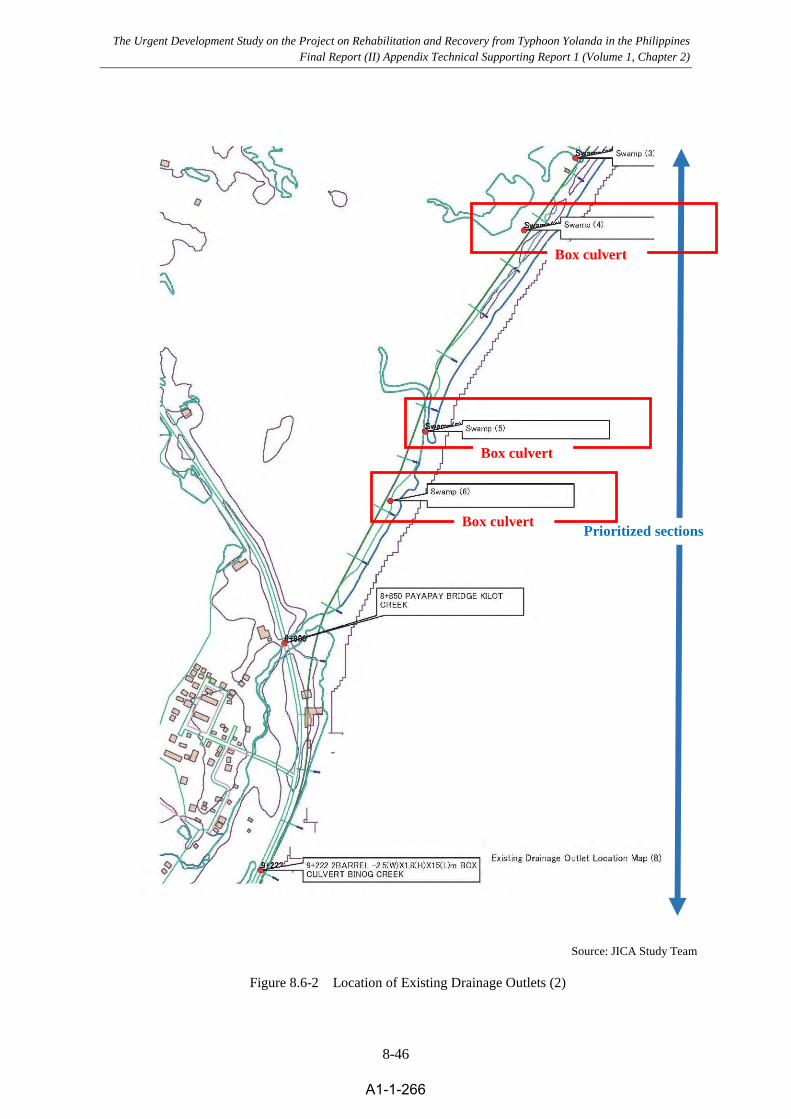
DPWH Project on Road Heightening and Tide Embankment for Section 3 and 4, Tacloban-Palo Draft Supporting Report for Basic Planning
8-46
Source: JICA Study Team
Figure 8.6-2 Location of Existing Drainage Outlets (2)
Prioritized sections
Box culvert
Box culvert
Box culvert
267A1-1-266
The Urgent Development Study on the Project on Rehabilitation and Recovery from Typhoon Yolanda in the Philippines Final Report (II) Appendix Technical Supporting Report 1 (Volume 1, Chapter 2)
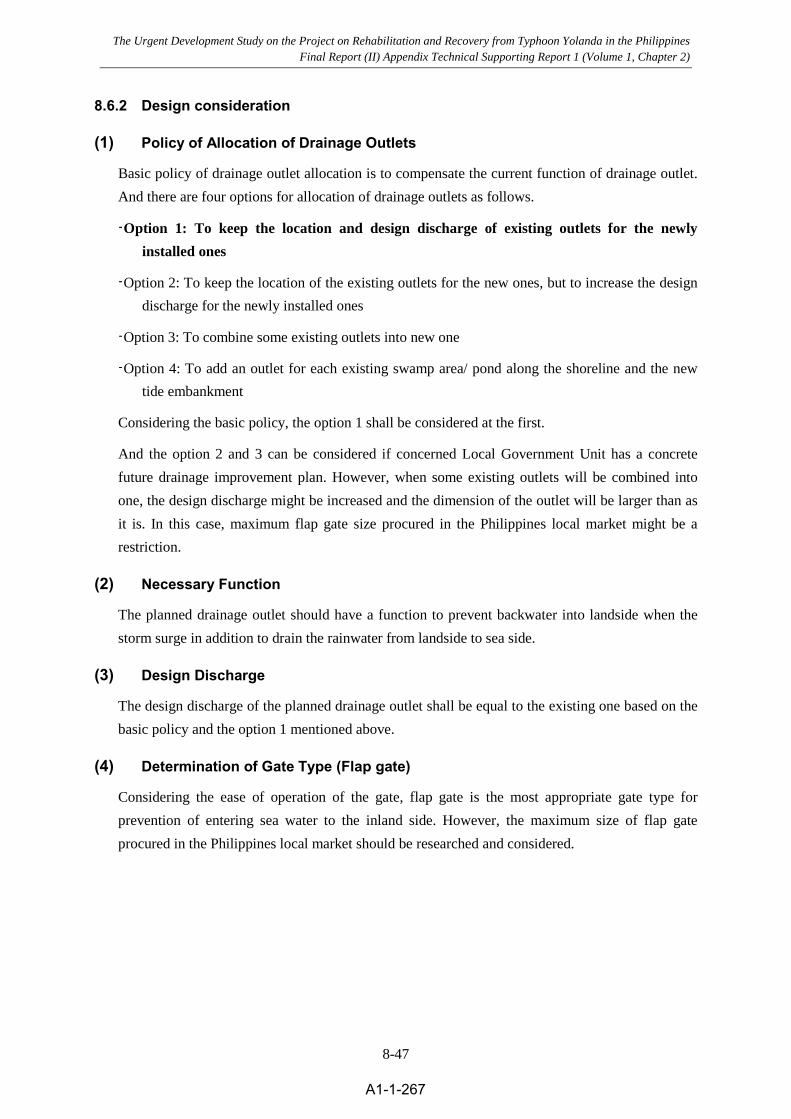
DPWH Project on Road Heightening and Tide Embankment for Section 3 and 4, Tacloban-Palo Draft Supporting Report for Basic Planning
8-47
8.6.2 Design consideration
(1) Policy of Allocation of Drainage Outlets
Basic policy of drainage outlet allocation is to compensate the current function of drainage outlet.
And there are four options for allocation of drainage outlets as follows.
- Option 1: To keep the location and design discharge of existing outlets for the newly
installed ones
- Option 2: To keep the location of the existing outlets for the new ones, but to increase the design
discharge for the newly installed ones
- Option 3: To combine some existing outlets into new one
- Option 4: To add an outlet for each existing swamp area/ pond along the shoreline and the new
tide embankment
Considering the basic policy, the option 1 shall be considered at the first.
And the option 2 and 3 can be considered if concerned Local Government Unit has a concrete
future drainage improvement plan. However, when some existing outlets will be combined into
one, the design discharge might be increased and the dimension of the outlet will be larger than as
it is. In this case, maximum flap gate size procured in the Philippines local market might be a
restriction.
(2) Necessary Function
The planned drainage outlet should have a function to prevent backwater into landside when the
storm surge in addition to drain the rainwater from landside to sea side.
(3) Design Discharge
The design discharge of the planned drainage outlet shall be equal to the existing one based on the
basic policy and the option 1 mentioned above.
(4) Determination of Gate Type (Flap gate)
Considering the ease of operation of the gate, flap gate is the most appropriate gate type for
prevention of entering sea water to the inland side. However, the maximum size of flap gate
procured in the Philippines local market should be researched and considered.
268A1-1-267
The Urgent Development Study on the Project on Rehabilitation and Recovery from Typhoon Yolanda in the Philippines Final Report (II) Appendix Technical Supporting Report 1 (Volume 1, Chapter 2)

DPWH Project on Road Heightening and Tide Embankment for Section 3 and 4, Tacloban-Palo Draft Supporting Report for Basic Planning
8-48
8.6.3 Basic Plan of Drainage Outlet (Number, Location, Dimension and Gate Type)
Proposed dimension, structure and gate type for 4 drainage outlets is highlighted in Table 8.6-2.
The size of RCBC is designed as 1.0m width and 1.0m height with a flap gate.
Table 8.6-2 List of the Planned Drainage Outlets in Prioritized Section
NO.
SEC.
LGU
STATION
PRESENT STRUCTURE PLANNED STRUCTUURE REMARKS
24 4-2 TC Swamp (2) 1.0m(W)X1.0m(H) RCBC + Flap Gate
25 4-2 TC Swamp (3) 1.0m(W)X1.0m(H) RCBC + Flap Gate
26 4-2 PL Swamp (4) 1.0m(W)X1.0m(H) RCBC + Flap Gate
27 4-2 PL Swamp (5) 1.0m(W)X1.0m(H) RCBC + Flap Gate
28 4-2 PL Swamp (6) 1.0m(W)X1.0m(H) RCBC + Flap Gate
* TC: Tacloban, PL: Palo
Source: JICA Study Team
269A1-1-268
The Urgent Development Study on the Project on Rehabilitation and Recovery from Typhoon Yolanda in the Philippines Final Report (II) Appendix Technical Supporting Report 1 (Volume 1, Chapter 2)

DPWH Project on Road Heightening and Tide Embankment for Section 3 and 4, Tacloban-Palo Draft Supporting Report for Basic Planning
8-49
8.7 Construction Procedure, Materials
8.7.1 Construction materials The approximate volume of major construction materials, which are required for each sub-section
of Prioritized Section, is shown in Table 8.7-1.
Table 8.7-1 Major Construction Material Required for Prioritized Section
Source: JICA Study Team
Note: 1) the embedded area of sheet pile shoring is not included.
As for the procurement of steel sheet pile shoring materials and related construction equipment,
which will be delivered from Manila, an immediate action shall be taken so that the first step for the
tide protection dike construction can be commenced as soon as possible once the Contract has become
effective.
8.7.2 Contraction schedule In consideration of its work volume, workability and priority, it is estimated that 12 months
including mobilization and demobilization will be required for the construction of Prioritized Section
as shown in Table 8.7-2. And the construction works of Section 4-2 and Section 4-3 shall be carried
out simultaneously to keep this construction period.
Table 8.7-2 Construction Schedule for Prioritized Section
(Unit: month)
1 2 3 4 5 6 7 8 9 10 11 12
Commencement
Mobilization
Section 4-2
Section 4-3
Section 4-4
Demobilization
Completion Source: JICA Study Team
Unit Section 4-2
(length 1.5km)
Section 4-3
(length 0.9km)
Section 4-4
(length 0.2km)
Total
Embankment m3 14,900 16,200 700 31,800
Crushed stone m3 2,400 2,600 200 5,200
Lean concrete m3 1,300 1,400 100 2,800
Structural Concrete m3 3,900 4,400 400 8,700 Steel sheet pile shoring (permanent)
m2 6,000 1) 3,700 1) 800 1) 10,500 1)
270A1-1-269
The Urgent Development Study on the Project on Rehabilitation and Recovery from Typhoon Yolanda in the Philippines Final Report (II) Appendix Technical Supporting Report 1 (Volume 1, Chapter 2)

DPWH Project on Road Heightening and Tide Embankment for Section 3 and 4, Tacloban-Palo Draft Supporting Report for Basic Planning
9-1
Chapter 9 Recommendations
9.1 General
In previous chapters, the basic plan for Section 3 and Section 4 was proposed and the preliminary
design for the prioritized sections was conducted. The basic design for the prioritized sections as
well as the design for the remaining sections in Section 3 and 4 will be conducted by DPWH. The
basic design for the prioritized sections will be prepared in the course of mutual collaboration
among DPWH and JICA Study Team, while the design for the remaining sub-sections in Section 3
&4 and also other Sections such as Section 1, 2, 5 and 6 should be conducted by DPWH later.
In this chapter, the important aspects in the course of the design of the remaining sections in
Section 3 & 4 are mentioned as draft recommendations for DPWH.
271A1-1-270
The Urgent Development Study on the Project on Rehabilitation and Recovery from Typhoon Yolanda in the Philippines Final Report (II) Appendix Technical Supporting Report 1 (Volume 1, Chapter 2)

DPWH Project on Road Heightening and Tide Embankment for Section 3 and 4, Tacloban-Palo Draft Supporting Report for Basic Planning
9-2
9.2 Tide Embankment
(1) Tide embankment and gate along the fish pond
1) River gate at annex channel
Alignment in section 4-6 encompasses the area that includes the fish pond. The fish pond is
connected to the downstream of the Bangon river, via an annex channel. As discussed in the next
page, the location of the channel is regarded as fixed and it is not affected by the flooding of the
Bangon river. In this regard, a gate should be installed at the place where the alignment and the
annex channel crosses.
The width of the annex channel is about 6 meters but detailed survey will be needed to set the
dimension as well as its exact location. The alignment of the tide embankment shall be modified at
the place where gate will be installed, so that they will be at right angles to each other.
Geotechnical survey should also be carried out to judge the foundation of the gate.
Source: JICA Study Team
Figure 9.2-1 Alignment along the fish pond
Annex channel
Gate will be needed here
272A1-1-271
The Urgent Development Study on the Project on Rehabilitation and Recovery from Typhoon Yolanda in the Philippines Final Report (II) Appendix Technical Supporting Report 1 (Volume 1, Chapter 2)

DPWH Project on Road Heightening and Tide Embankment for Section 3 and 4, Tacloban-Palo Draft Supporting Report for Basic Planning
9-3
In case construction of the gate and the tide embankment are considered difficult, the alignment
should be shifted to the landside of the fish pond. The change of alignment shall be discussed with
Palo municipality.
2) Bangon river channel in the most downstream section (for reference)
The following figures are the Bangon river channel situations in 1950’s and 2015. The former
figure is from NAMRIA 1956 topographical map whose map source is 1950’s. The latter figure is
the latest condition as topographical relief taken by lidar survey conducted by JICA Study team in
2015.
The significant position of the river channel has not changed since 1950’s, while the 1950’s map
was illustrated by visual observation. Also the propagation of river mouth as a result of sediment
runoff from the upstream is not observed according to these figures. Since the Bangon river basin
has meandering section in the middle reach where flood water and sediment can be retarded, the
downstream section has not been affected much during the several decades by the supply from
upstream, to result into the comparatively stable configuration in the most downstream section.
Source: NAMRIA Map 1:50,000
Figure 9.2-2 Bangon River Channel in 1950’s
273A1-1-272
The Urgent Development Study on the Project on Rehabilitation and Recovery from Typhoon Yolanda in the Philippines Final Report (II) Appendix Technical Supporting Report 1 (Volume 1, Chapter 2)

DPWH Project on Road Heightening and Tide Embankment for Section 3 and 4, Tacloban-Palo Draft Supporting Report for Basic Planning
9-4
Source: JICA Study Team
Figure 9.2-3 Bangon River Channel in 2015
In 1950’s map, a structure like the crossing structure ( ) over the fishpond can be seen in the left
bank of the most downstream of the channel near the mouth. Comparing with the image in 2015,
the connecting channel from the main channel to the fishpond seems to be positioned in the same
way.
The significant difference between 1950 and 2015 is the development of bending section at 500 m
from the river mouth. It seems that the road along the right bank in 1950 was eroded due to the
propagation of the sharp bend.
274A1-1-273
The Urgent Development Study on the Project on Rehabilitation and Recovery from Typhoon Yolanda in the Philippines Final Report (II) Appendix Technical Supporting Report 1 (Volume 1, Chapter 2)
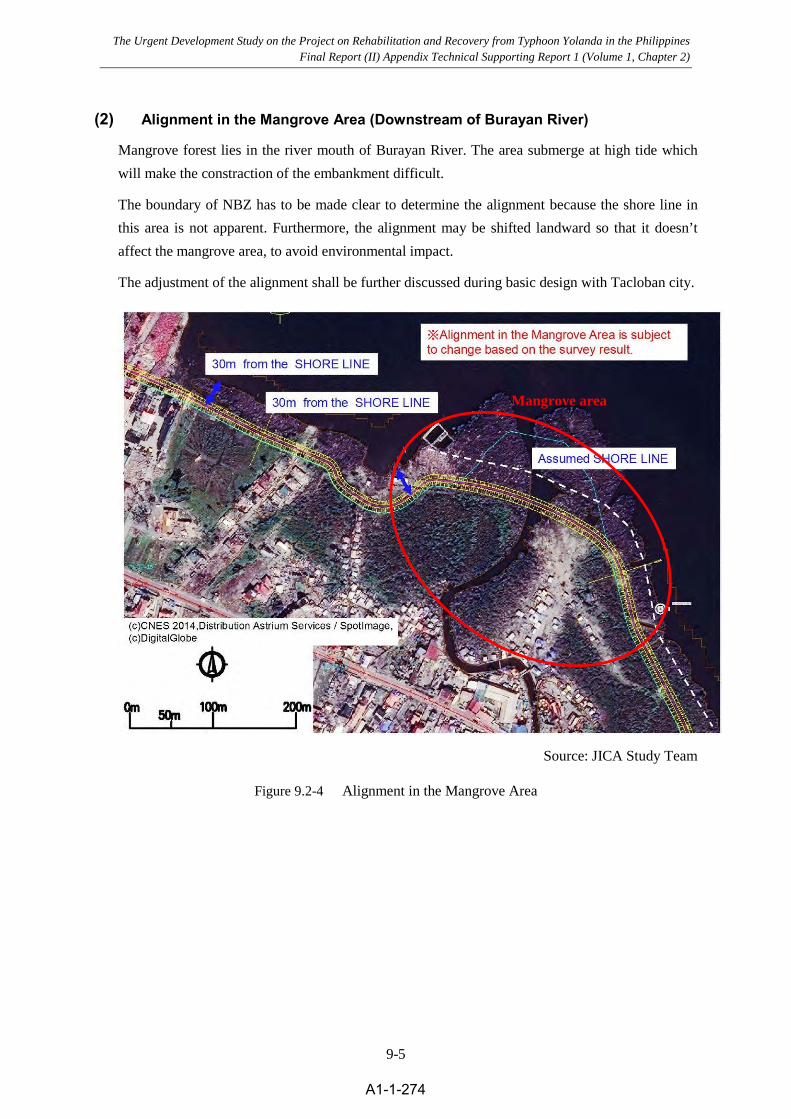
DPWH Project on Road Heightening and Tide Embankment for Section 3 and 4, Tacloban-Palo Draft Supporting Report for Basic Planning
9-5
(2) Alignment in the Mangrove Area (Downstream of Burayan River)
Mangrove forest lies in the river mouth of Burayan River. The area submerge at high tide which
will make the constraction of the embankment difficult.
The boundary of NBZ has to be made clear to determine the alignment because the shore line in
this area is not apparent. Furthermore, the alignment may be shifted landward so that it doesn’t
affect the mangrove area, to avoid environmental impact.
The adjustment of the alignment shall be further discussed during basic design with Tacloban city.
Source: JICA Study Team
Figure 9.2-4 Alignment in the Mangrove Area
Mangrove area
275A1-1-274
The Urgent Development Study on the Project on Rehabilitation and Recovery from Typhoon Yolanda in the Philippines Final Report (II) Appendix Technical Supporting Report 1 (Volume 1, Chapter 2)

DPWH Project on Road Heightening and Tide Embankment for Section 3 and 4, Tacloban-Palo Draft Supporting Report for Basic Planning
9-6
(3) Alignment along the Ice Factory and Access to the Pier
Proposed alignment along the Ice Factory in Tacloban city runs on the seaside of the factory so
that it doesn’t affect the existing facilities. Howerer, access to the pier will be disconnected by the
embankment.
The access road shall be provided and alignment shall be adjusted if necessary in the basic design.
Figure 9.2-5 Alignment along the Ice Factory
Pier
276A1-1-275
The Urgent Development Study on the Project on Rehabilitation and Recovery from Typhoon Yolanda in the Philippines Final Report (II) Appendix Technical Supporting Report 1 (Volume 1, Chapter 2)

DPWH Project on Road Heightening and Tide Embankment for Section 3 and 4, Tacloban-Palo Draft Supporting Report for Basic Planning
9-7
(4) Alignment at the end of Section 4
Alignment at the end of Section 4 shall be in concord with the alignment in Section 5, with regard
to the extent of houses to protect on seaside of the road. Although the existing houses along the
road is few in the end of Section 4, Section 5 has a lot of existing houses in separate locations.
The rule has to be set in determining the alignment at the end of Section 4 and subsequent
alignment in Section 5.
Figure 9.2-6 Alignment at the End of Section 4 and Section 5
277A1-1-276
The Urgent Development Study on the Project on Rehabilitation and Recovery from Typhoon Yolanda in the Philippines Final Report (II) Appendix Technical Supporting Report 1 (Volume 1, Chapter 2)

DPWH Project on Road Heightening and Tide Embankment for Section 3 and 4, Tacloban-Palo Draft Supporting Report for Basic Planning
9-8
9.3 Drainage Plan and Flood Control
(1) Consideration of future land use
In the section 4.3.2, probable discharges at outlets on the tidal embankment and road heightening
proposed by DPWH were estimated considering existing river basin condition. In the future,
however there will be growing concerns that urbanization such as developing housing lots and
settlement in both of City/Municipality accelerates the increase in the risk on flood, especially for
peak discharge. Once the coastal structure is constructed, it will significantly cost to reconstruct
these outlets for improving their discharge capacities.
In this paragraph, probable discharges at these outlets under the river/creek basin condition
considering land use change in the future are estimated and appropriate storage volume for
retarding pond is recommended. Basically assumed future land use condition refers to the CLUP
of Tacloban City proposed by JST in 2015 JICA Study and existing CLUP of Palo (as shown in
Figure 8.3-1 and Figure 8.3-2).
Source: JICA Study Team
Figure 9.3-1 CLUP of Tacloban City Proposed by JST
278A1-1-277
The Urgent Development Study on the Project on Rehabilitation and Recovery from Typhoon Yolanda in the Philippines Final Report (II) Appendix Technical Supporting Report 1 (Volume 1, Chapter 2)

DPWH Project on Road Heightening and Tide Embankment for Section 3 and 4, Tacloban-Palo Draft Supporting Report for Basic Planning
9-9
Source: Provided by Palo
Figure 9.3-2 CLUP of Palo
For taking into account future land use condition in river/creek basin, especially for urbanization,
that will possibly drive the increase in peak river discharge. following land use classification are
considered as urbanized/settled area.
Table 9.3-1 Considered Land Use as Urbanized/Settled Area Tacloban City
Low Density Residential Zone (R-1), Medium Density Residential Zone (R-2), High Density Residential Zone (R-3), Low Density Commercial Zone (C-1), Medium Density Commercial Zone (C-2), High Density Commercial Zone (C-3),Light Industrial Zone (L-12), General Institutional Zones (GInsZ), Proposed Infrastructure/ Utilities, Existing Roads, Proposed Roads, Cementeries
Palo
Residential Area, Socialized Area, Commercial Area, Institutional Area, Special Institutional Area
Source: JICA Study Team
Table 9.3-2 Existing/Assumed Settled Area and Impervious Ratio in the Future
1 Name Existing Future
Area (km2) Impervious Ratio (%)
Area (km2) Impervious Ratio (%)
- Mangonbangon River 5.43 21 3.96 73 1 Tanghas Lirang Creek 4.26 28 2.70 63 2 Sagkahan Creek 0.55 - 0.52 95 3 Mahayahay Creek 2.62 - 2.45 93 4 Bureyan River 5.28 49 4.72 89 5 Banok Creek 4.34 - 2.64 61 6 Kilot Creek 0.92 - 0.42 46
*”-” means “not calculated” Source: JICA Study Team
279A1-1-278
The Urgent Development Study on the Project on Rehabilitation and Recovery from Typhoon Yolanda in the Philippines Final Report (II) Appendix Technical Supporting Report 1 (Volume 1, Chapter 2)
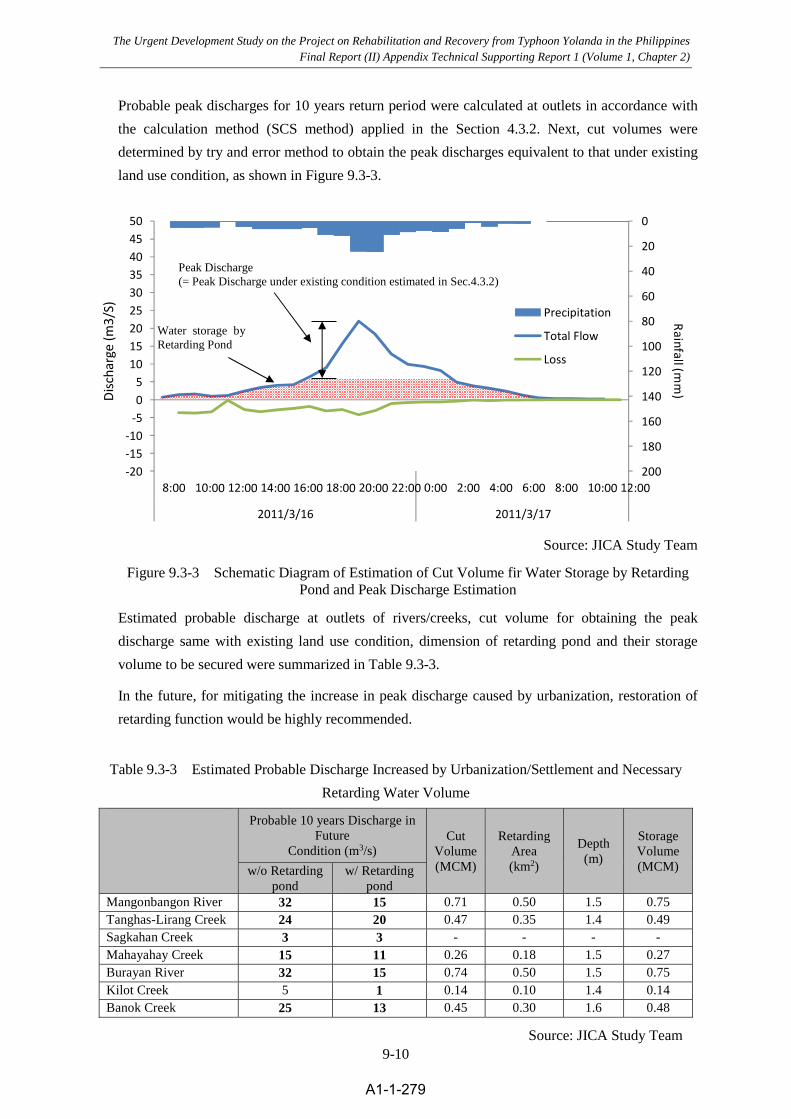
DPWH Project on Road Heightening and Tide Embankment for Section 3 and 4, Tacloban-Palo Draft Supporting Report for Basic Planning
9-10
Probable peak discharges for 10 years return period were calculated at outlets in accordance with
the calculation method (SCS method) applied in the Section 4.3.2. Next, cut volumes were
determined by try and error method to obtain the peak discharges equivalent to that under existing
land use condition, as shown in Figure 9.3-3.
0
20
40
60
80
100
120
140
160
180
200‐20‐15‐10‐505
101520253035404550
2011/3/16 2011/3/17
Precipitation
Total Flow
Loss
Disc
harg
e(m
3/S)
Discharge(m
3/S)Rainfall (m
m)
Source: JICA Study Team
Figure 9.3-3 Schematic Diagram of Estimation of Cut Volume fir Water Storage by Retarding Pond and Peak Discharge Estimation
Estimated probable discharge at outlets of rivers/creeks, cut volume for obtaining the peak
discharge same with existing land use condition, dimension of retarding pond and their storage
volume to be secured were summarized in Table 9.3-3.
In the future, for mitigating the increase in peak discharge caused by urbanization, restoration of
retarding function would be highly recommended.
Table 9.3-3 Estimated Probable Discharge Increased by Urbanization/Settlement and Necessary
Retarding Water Volume
Probable 10 years Discharge in Future
Condition (m3/s) Cut
Volume (MCM)
Retarding Area (km2)
Depth (m)
Storage Volume (MCM) w/o Retarding
pond w/ Retarding
pond Mangonbangon River 32 15 0.71 0.50 1.5 0.75 Tanghas-Lirang Creek 24 20 0.47 0.35 1.4 0.49 Sagkahan Creek 3 3 - - - -Mahayahay Creek 15 11 0.26 0.18 1.5 0.27 Burayan River 32 15 0.74 0.50 1.5 0.75 Kilot Creek 5 1 0.14 0.10 1.4 0.14 Banok Creek 25 13 0.45 0.30 1.6 0.48
Water storage by Retarding Pond
Peak Discharge (= Peak Discharge under existing condition estimated in Sec.4.3.2)
Source: JICA Study Team
280A1-1-279
The Urgent Development Study on the Project on Rehabilitation and Recovery from Typhoon Yolanda in the Philippines Final Report (II) Appendix Technical Supporting Report 1 (Volume 1, Chapter 2)

DPWH Project on Road Heightening and Tide Embankment for Section 3 and 4, Tacloban-Palo Draft Supporting Report for Basic Planning
9-11
(2) Current flood control plan made by DPWH
As for Bangon River, in respond to current discharge capacity evaluated in 4.3.4, dike elevation is
recommended as illustrated in Figure 9.3-4, which secures discharge capacity for 50 years return
period flood. Structure type and horizontal plan basically follow the current plan designed by
DPWH (refer to Section 4.3.4).
Recommended longitudinal profile of the top of the dike in the downstream of Bernard Reed
Bridge is level, which mean that design longitudinal slope is 0 percent. This design slope is
indicated by DPWH.
The relationship of the recommended height and the height designed in the current plan should be
made clear in conducting the elevation survey of the benchmark used for the current plan.
281A1-1-280
The Urgent Development Study on the Project on Rehabilitation and Recovery from Typhoon Yolanda in the Philippines Final Report (II) Appendix Technical Supporting Report 1 (Volume 1, Chapter 2)

DP
WH
Project on R
oad Heightening and T
ide Em
bankment for Section 3 and 4, Tacloban-P
alo D
raft Supporting Report for B
asic Planning
9-12
Figure 9.3-4 Recommended Dike Elevation
-10
-5
0
5
10
15
20
0 0.5 1 1.5 2 2.5 3 3.5 4
Riverbed Level (Surveyed in 2014) Right Bank Level (Surveyed in 2014) Left Bank Level (Surveyed in 2015)
Right Bank Level (Surveyed in 2015) Bridge (Bottom of Girder) Proposed River Dike Elevation
Cal. WL (10yr, 350m3/s) Cal. WL (50yr, 380m3/s)
Distance from River mouth (km)
Ele
vatio
n(M
SL
+ m
)
Bernard Reed Brd 2
Bernard Reed Brd
Purisuma Brd
Top Elevation of Tidal Structure (MSL + 3.5m)
Elevation : MSL + 4.08mDesign Slope: Flat
Elevation : MSL + 4.08 - 4.2 m Design Slope: 0.0003
* Height of parapet (60cm) is not included in the proposed elevation Source: JICA Study Team
282A1-1-281
The Urgent D
evelopment Study on the Project on Rehabilitation and Recovery from
Typhoon Yolanda in the Philippines Final Report (II) Appendix Technical Supporting Report 1 (Volum
e 1, Chapter 2)

A - 1
Appendix 1 Definitive Planning Conditions
1.3 External Force Conditions
1.3.1 Return Period of External Force The scale of external force used for setting the top elevation of structures is established according
to the following concepts.
The external force is considered to be the storm surge caused by the incoming typhoon. The
depression of central atmospheric pressure of the typhoon (which reflects the scale of the typhoon) has
a large impact on the scale of storm surges because they are generated by a suction effect consequent on
the pressure drop and a wind stress effect. Naturally, differences in the path and translation speed of the
typhoon affect the distribution for storm surges, but the scale of storm surges is difficult to quantitatively
analyze using the indices of typhoon path and translation speed. Hence, we evaluate the scale of the
external force using the central atmospheric pressure drop of the typhoon as it passes the Leyte Gulf.
To prevent occurrence of a similar disaster, it is preferable to consider the storm surge generated
by Typhoon Yolanda. However, as shown by Figure 1.3-1, an evaluation by central pressure gives a
return period of approximately 110 years for Typhoon Yolanda. Designs based on the scale of Typhoon
Yolanda can be expected to result in extremely large structures and very high construction costs.
Figure 1.3-1 Estimated return period of depression of central atmospheric pressure
Note1) This result of statistical analysis of extreme values is based on long-term analysis of
historical typhoons that passed over Leyte Gulf and nearby regions since 1951.
Note2) The value shown for the pressure drop is 1013 hPa (1 atm) minus the central atmospheric
pressure. For example, the minimum central atmospheric pressure of Typhoon Yolanda
was 895 hPa, giving a pressure drop of 118 hPa.
1
10
100
1000
0 10 20 30 40 50 60 70 80 90 100 110 120 130 140 150
Ret
urn
Perio
d (Y
ear)
Depression of Central Atmospheric Pressure (hPa)
Weibull Distribution (k=1.0)
110year (Typhoon Yolanda)
50year
118hPa98hPa
283A1-1-282
The Urgent Development Study on the Project on Rehabilitation and Recovery from Typhoon Yolanda in the Philippines Final Report (II) Appendix Technical Supporting Report 1 (Volume 1, Chapter 2)

A - 2
Accordingly, we assume nonstructural disaster prevention measures (e.g., educating residents
about evacuation by the preparation of hazard maps) are taken with respect to an external force of a
scale of Typhoon Yolanda and that structural measures are implemented with the objective of disaster
mitigation.
Taking into account the service life of structures in a coastal environment and the many cases in
Japan where a 50-year return period is employed, a return period of 50 years is used for the external
force.
According to Figure 1.1, the central pressure drop of a 50-year return period typhoon is 98 hPa,
which makes the central pressure of such a typhoon 915 hPa. This central pressure is used to establish
the external force.
1.3.2 Numerical Analysis of Maximum Sea Level
(1) Numerical Conditions The height setting for the protection provided by the structure is established by a storm surge
simulation. The calculation conditions for the storm surge were as follows. With regards to the path
(refer to Figure 1.3-2) and translation velocity of the typhoon used in the calculation, conditions which
gave the largest storm surge in the project districts were adopted and the same path and tlanslation
velocity as Typhoon Yolanda were used.
Central Atmospheric Pressure of Typhoon ; 915 hPa (ref. Typhoon Yolanda : Lowest 895 hPa)
Typhoon Track ; Track of Typhoon Yolanda
Translation Speed ; 41 km/h (same as Typhoon Yolanda)
Figure 1.3-2 Path of Typhoon used in the storm surge simulation
284A1-1-283
The Urgent Development Study on the Project on Rehabilitation and Recovery from Typhoon Yolanda in the Philippines Final Report (II) Appendix Technical Supporting Report 1 (Volume 1, Chapter 2)

A - 3
(2) Numerical Results Figure 1.3-3 shows the numerical results for the storm surge. Looking the project districts, the
maximum sea level is +3.5 m to +3.8 (datum level: mean sea level [MSL]) in Section 3 and +3.0 m to
+3.2m in Section 4 (Table 1.3-1).
Figure 1.3-3 Numerical results of maximum sea level from MSL
Table 1.3-1 Numerical results of maximum sea level in the each section
Section Name Maximum Sea Level
Section 3 +3.5M ~ +3.8M
Section 4 +3.0M ~ +3.2M
Note) datum level = MSL
285A1-1-284
The Urgent Development Study on the Project on Rehabilitation and Recovery from Typhoon Yolanda in the Philippines Final Report (II) Appendix Technical Supporting Report 1 (Volume 1, Chapter 2)

A - 4
1.3.3 Top Elevation of Heightened Road/Tide Embankment
(1) Basic Conception The basic concepts for setting the planned top elevation of the structure are as follows.
The planned top elevation is the same height within each section.
The planned top elevation is set according to the largest value of maximum sea level in each
section.
To have a margin above the maximum sea level, the planned top elevation is rounded upward
to the nearest 50 cm
The effects of waves are not included in the calculation of the planned top elevation, because
the impact of inundation into the landward side by waves is limited and waves do not directly
act on structures built away from the shoreline.
(2) Planned Top Elevation Against Storm Surge In accordance with the basic concepts for setting the planned top elevation of structures, the planned
top elevation for each section is set as follows.
In the Section 3, Planned Top Elevation is +4.0M (from MSL)
Maximum Sea Level : MSL +3.8M
Planned Top Elevation = (MSL +3.8M) + 0.2M = MSL +4.0M
In the Section 4, Planned Top Elevation is +3.5M (from MSL)
Maximum Sea Level : MSL +3.2M
Planned Top Elevation = (MSL +3.2M) + 0.3M = MSL +3.5M
Here, as detailed in Chapter 2.3.1, in addition to the typhoon’s central pressure drop, its path and
migration velocity affect the scale of the storm surge. The 50-year return period was established using
the central pressure drop of the typhoon as the scale of the external force, but if the path and the velocity
of the typhoon differ from those of Typhoon Yolanda, the maximum sea level due to the storm surge
would decrease. According to sensitivity analysis results for the storm surge of a typhoon of the same
scale as Typhoon Yolanda, the path, translation speed, and direction of movement of Typhoon Yolanda
were the most severe conditions for the districts of Talcoban and Palo.
In other words, the return period for the planned top elevation will be longer if the path or
286A1-1-285
The Urgent Development Study on the Project on Rehabilitation and Recovery from Typhoon Yolanda in the Philippines Final Report (II) Appendix Technical Supporting Report 1 (Volume 1, Chapter 2)

A - 5
translation speed of the typhoon is different. Therefore, sufficient safety of the top elevation of the
structure is secured.
For reference, Figure 1.3-4 shows the calculation results for storm surge under the following
conditions: typhoon central pressure of 915 hPa; the same path as Typhoon Yolanda; and migration
velocity of 25 km/h (the most common value). Looking at the project districts, the distribution of
maximum sea level is +3.2 m to +2.8 m in Section 3 and +2.1 m to +2.3 m in Section 4 (datum level:
MSL).
Figure 1.3-4. Numerical results of maximum sea level from MSL
(Numerical Condition : Typhoon translation speed = 25km/h)
A1-1- 287A1-1-286
The Urgent Development Study on the Project on Rehabilitation and Recovery from Typhoon Yolanda in the Philippines Final Report (II) Appendix Technical Supporting Report 1 (Volume 1, Chapter 2)

A - 6
(Reference Figure)
Figure 1.3-5 Distribution of maximum sea level departure for the case that the course of Typhoon
Yolanda is shifted to the north side
Figure 1.3-6 Distribution of maximum sea level departure for the case that the course of Typhoon
Yolanda is shifted to the south side
288A1-1-287
The Urgent Development Study on the Project on Rehabilitation and Recovery from Typhoon Yolanda in the Philippines Final Report (II) Appendix Technical Supporting Report 1 (Volume 1, Chapter 2)

A - 7
Figure 1.3-7 Distribution of maximum sea level departure for the case that the translation speed of
Typhoon Yolanda is changed
Figure 1.3-8 Distribution of maximum sea level departure for the cases that the track of Typhoon
Yolanda is rotated around Tacloban
289A1-1-288
The Urgent Development Study on the Project on Rehabilitation and Recovery from Typhoon Yolanda in the Philippines Final Report (II) Appendix Technical Supporting Report 1 (Volume 1, Chapter 2)

A - 8
Appendix 2 Traffic Volume Analysis
2.1 Calculation Sheets of Traffic Classification Count Survey
Calculation sheets of traffic classification count survey are shown in following figures.
Figure 2.1-1 Manual Traffic Classification Count Annual Average Daily Traffic 2015 (1)
Road Section : S00001LT Date: 4/10-4/16
Sta No & Location: Lions Den - Real St. - Jct. Burgos St Day: 1 week
Veh ic le Type Date24-hourCount
Dai lyFac tor
SeasonalFactor
AADT
4/10/15 4,063 1.000 4,0634/11/15 2,863 1.000 2,8634/12/15 5,382 1.000 5,3824/13/15 5,126 1.000 5,1264/14/15 4,727 1.000 4,7274/15/15 5,090 1.000 5,0904/16/15 4,799 1.000 4,7994/10/15 4,593 1.000 4,5934/11/15 4,523 1.000 4,5234/12/15 6,520 1.000 6,5204/13/15 6,714 1.000 6,7144/14/15 6,257 1.000 6,2574/15/15 6,582 1.000 6,5824/16/15 5,837 1.000 5,8374/10/15 88 1.000 884/11/15 67 1.000 674/12/15 145 1.000 1454/13/15 166 1.000 1664/14/15 139 1.000 1394/15/15 119 1.000 1194/16/15 120 1.000 1204/10/15 6 1.000 64/11/15 1 1.000 14/12/15 1 1.000 14/13/15 2 1.000 24/14/15 3 1.000 34/15/15 5 1.000 54/16/15 3 1.000 34/10/15 2 1.000 24/11/15 2 1.000 24/12/15 8 1.000 84/13/15 18 1.000 184/14/15 6 1.000 64/15/15 3 1.000 34/16/15 2 1.000 24/10/15 189 1.000 1894/11/15 117 1.000 1174/12/15 271 1.000 2714/13/15 288 1.000 2884/14/15 276 1.000 2764/15/15 227 1.000 2274/16/15 204 1.000 2044/10/15 105 1.000 1054/11/15 34 1.000 344/12/15 57 1.000 574/13/15 85 1.000 854/14/15 88 1.000 884/15/15 44 1.000 444/16/15 41 1.000 414/10/15 51 1.000 514/11/15 32 1.000 324/12/15 78 1.000 784/13/15 56 1.000 564/14/15 75 1.000 754/15/15 88 1.000 884/16/15 73 1.000 73
4/10/15 3,448 1.000 3,4484/11/15 3,705 1.000 3,7054/12/15 5,831 1.000 5,8314/13/15 5,685 1.000 5,6854/14/15 5,375 1.000 5,3754/15/15 5,743 1.000 5,7434/16/15 5,425 1.000 5,425
1119276,461
15669Total (AADT3) 111,673
0.890 4477
4477Sub-Total (AADT2) 35,212
Sub-Total (AADT1)
Truck Combination 65
Mortercycle/Tricycle 5030
Truck 2-axle 225 1.110 249
1.750 113
Truck 3-axle 65 1.110 72
Mini-Bus 3 1.200 4
Large Bus 6 0.950 6
Jeepney 5861 1.000 5861
Pick-up/Van 121 1.040 125
Average Dai ly Traffic(ADT)
Car/Taxi/Jeep 4579 1.040 4762
290A1-1-289
The Urgent Development Study on the Project on Rehabilitation and Recovery from Typhoon Yolanda in the Philippines Final Report (II) Appendix Technical Supporting Report 1 (Volume 1, Chapter 2)

A - 9
Figure 2.1-2 Manual Traffic Classification Count Annual Average Daily Traffic 2015 (2)
Road Section : S00002LT Date: 4/10-4/16
Sta No & Location: Pampango St.- -Jct. Imelda St.-Magallanes St. Day: 1 week
Veh ic le Type Date24-hourCount
Dai lyFactor
SeasonalFactor
AADT
4/10/15 751 1.000 7514/11/15 568 1.000 5684/12/15 793 1.000 7934/13/15 882 1.000 8824/14/15 744 1.000 7444/15/15 847 1.000 8474/16/15 868 1.000 8684/10/15 2,865 1.000 2,8654/11/15 1,450 1.000 1,4504/12/15 2,424 1.000 2,4244/13/15 3,091 1.000 3,0914/14/15 3,091 1.000 3,0914/15/15 3,259 1.000 3,2594/16/15 2,907 1.000 2,9074/10/15 35 1.000 354/11/15 29 1.000 294/12/15 43 1.000 434/13/15 48 1.000 484/14/15 44 1.000 444/15/15 42 1.000 424/16/15 42 1.000 424/10/15 1 1.000 14/11/15 9 1.000 94/12/15 1 1.000 14/13/15 0 1.000 04/14/15 0 1.000 04/15/15 0 1.000 04/16/15 0 1.000 04/10/15 0 1.000 04/11/15 3 1.000 34/12/15 0 1.000 04/13/15 0 1.000 04/14/15 0 1.000 04/15/15 0 1.000 04/16/15 3 1.000 34/10/15 74 1.000 744/11/15 33 1.000 334/12/15 64 1.000 644/13/15 80 1.000 804/14/15 75 1.000 754/15/15 76 1.000 764/16/15 78 1.000 784/10/15 2 1.000 24/11/15 8 1.000 84/12/15 2 1.000 24/13/15 1 1.000 14/14/15 2 1.000 24/15/15 1 1.000 14/16/15 0 1.000 04/10/15 0 1.000 04/11/15 0 1.000 04/12/15 0 1.000 04/13/15 0 1.000 04/14/15 0 1.000 04/15/15 0 1.000 04/16/15 0 1.000 0
4/10/15 3,205 1.000 3,2054/11/15 2,821 1.000 2,8214/12/15 3,051 1.000 3,0514/13/15 3,465 1.000 3,4654/14/15 3,589 1.000 3,5894/15/15 3,434 1.000 3,4344/16/15 3,418 1.000 3,418
Jeepney 2727 1.000 2727
Average Dai ly Traffic(ADT)
Car/Taxi/Jeep 779 1.040 810
Mini-Bus 2 1.200 2
Pick-up/Van 40 1.040 42
Truck 2-axle 69 1.110 76
Large Bus 1 0.950 1
Truck Combination 0 1.750 0
Truck 3-axle 2 1.110 3
Mortercycle/Tricycle 3283 0.890 2922
Sub-Total (AADT1)
2922Sub-Total (AADT2) 22,983
6582Total (AADT3) 48,319
25,336 3660
291A1-1-290
The Urgent Development Study on the Project on Rehabilitation and Recovery from Typhoon Yolanda in the Philippines Final Report (II) Appendix Technical Supporting Report 1 (Volume 1, Chapter 2)

A - 10
Figure 2.1-3 Manual Traffic Classification Count Annual Average Daily Traffic 2015 (3)
Road Section : S00003LT Date: 4/17-4/23
Sta No & Location: Magallanes St.- Pericohon St. Day: 1 week
Veh ic le Type Date24-hour
Count
Dai ly
Factor
Seasonal
FactorAADT
4/17/15 756 1.000 7564/18/15 519 1.000 5194/19/15 883 1.000 8834/20/15 972 1.000 9724/21/15 1,169 1.000 1,1694/22/15 1,047 1.000 1,0474/23/15 879 1.000 8794/17/15 2,256 1.000 2,2564/18/15 934 1.000 9344/19/15 2,798 1.000 2,7984/20/15 3,023 1.000 3,0234/21/15 2,912 1.000 2,9124/22/15 2,846 1.000 2,8464/23/15 2,626 1.000 2,6264/17/15 34 1.000 344/18/15 17 1.000 174/19/15 41 1.000 414/20/15 55 1.000 554/21/15 44 1.000 444/22/15 31 1.000 314/23/15 22 1.000 224/17/15 0 1.000 04/18/15 0 1.000 04/19/15 0 1.000 04/20/15 0 1.000 04/21/15 1 1.000 14/22/15 0 1.000 04/23/15 0 1.000 04/17/15 0 1.000 04/18/15 0 1.000 04/19/15 0 1.000 04/20/15 0 1.000 04/21/15 0 1.000 04/22/15 1 1.000 14/23/15 0 1.000 04/17/15 27 1.000 274/18/15 17 1.000 174/19/15 44 1.000 444/20/15 53 1.000 534/21/15 54 1.000 544/22/15 52 1.000 524/23/15 42 1.000 424/17/15 0 1.000 04/18/15 0 1.000 04/19/15 0 1.000 04/20/15 0 1.000 04/21/15 0 1.000 04/22/15 0 1.000 04/23/15 1 1.000 14/17/15 0 1.000 04/18/15 0 1.000 04/19/15 0 1.000 04/20/15 0 1.000 04/21/15 0 1.000 04/22/15 0 1.000 04/23/15 0 1.000 0
4/17/15 2,599 1.000 2,5994/18/15 1,999 1.000 1,9994/19/15 6,402 1.000 6,4024/20/15 3,720 1.000 3,7204/21/15 3,094 1.000 3,0944/22/15 3,237 1.000 3,2374/23/15 2,750 1.000 2,750
349224,156
6519Total (AADT3) 47,957
0.890 3026
3026Sub-Total (AADT2) 23,801
Sub-Total (AADT1)
Truck Combination 0
Mortercycle/Tricycle 3400
Truck 2-axle 41 1.110 46
1.750 0
Truck 3-axle 0 1.110 0
Mini-Bus 0 1.200 0
Large Bus 0 0.950 0
Jeepney 2485 1.000 2485
Pick-up/Van 35 1.040 36
Average Dai ly Traffic
(ADT)
Car/Taxi/Jeep 889 1.040 925
292A1-1-291
The Urgent Development Study on the Project on Rehabilitation and Recovery from Typhoon Yolanda in the Philippines Final Report (II) Appendix Technical Supporting Report 1 (Volume 1, Chapter 2)

A - 11
Figure 2.1-4 Manual Traffic Classification Count Annual Average Daily Traffic 2015 (4)
Road Section : S00004LT Date: 4/17-4/23
Sta No & Location: Old Road Sagkahan- Astrodome Day: 1 week
Veh ic le Type Date24-hour
Count
Dai ly
Factor
Seasonal
FactorAADT
4/17/15 584 1.000 5844/18/15 482 1.000 4824/19/15 840 1.000 8404/20/15 704 1.000 7044/21/15 680 1.000 6804/22/15 684 1.000 6844/23/15 730 1.000 7304/17/15 2,259 1.000 2,2594/18/15 1,002 1.000 1,0024/19/15 3,319 1.000 3,3194/20/15 3,152 1.000 3,1524/21/15 3,112 1.000 3,1124/22/15 3,034 1.000 3,0344/23/15 3,239 1.000 3,2394/17/15 40 1.000 404/18/15 29 1.000 294/19/15 55 1.000 554/20/15 56 1.000 564/21/15 62 1.000 624/22/15 67 1.000 674/23/15 45 1.000 454/17/15 0 1.000 04/18/15 0 1.000 04/19/15 0 1.000 04/20/15 0 1.000 04/21/15 1 1.000 14/22/15 0 1.000 04/23/15 0 1.000 04/17/15 0 1.000 04/18/15 0 1.000 04/19/15 0 1.000 04/20/15 0 1.000 04/21/15 0 1.000 04/22/15 0 1.000 04/23/15 0 1.000 04/17/15 127 1.000 1274/18/15 108 1.000 1084/19/15 154 1.000 1544/20/15 169 1.000 1694/21/15 201 1.000 2014/22/15 154 1.000 1544/23/15 149 1.000 1494/17/15 20 1.000 204/18/15 6 1.000 64/19/15 15 1.000 154/20/15 6 1.000 64/21/15 23 1.000 234/22/15 4 1.000 44/23/15 8 1.000 84/17/15 1 1.000 14/18/15 1 1.000 14/19/15 0 1.000 04/20/15 0 1.000 04/21/15 0 1.000 04/22/15 0 1.000 04/23/15 1 1.000 1
4/17/15 2,561 1.000 2,5614/18/15 2,371 1.000 2,3714/19/15 3,020 1.000 3,0204/20/15 2,876 1.000 2,8764/21/15 2,896 1.000 2,8964/22/15 3,002 1.000 3,0024/23/15 2,727 1.000 2,727
Jeepney 2731 1.000 2731
Average Dai ly Traffic
(ADT)
Car/Taxi/Jeep 672 1.040 699
Mini-Bus 0 1.200 0
Pick-up/Van 51 1.040 53
Truck 2-axle 152 1.110 168
Large Bus 0 0.950 0
Truck Combination 0 1.750 1
Truck 3-axle 12 1.110 13
Mortercycle/Tricycle 2779 0.890 2473
Sub-Total (AADT1)
2473Sub-Total (AADT2) 19,453
6138Total (AADT3) 44,776
25,323 3665
293A1-1-292
The Urgent Development Study on the Project on Rehabilitation and Recovery from Typhoon Yolanda in the Philippines Final Report (II) Appendix Technical Supporting Report 1 (Volume 1, Chapter 2)

A - 12
Figure 2.1-5 Manual Traffic Classification Count Annual Average Daily Traffic 2015 (5)
Road Section : S00005LT Date: 4/24-4/30
Sta No & Location: Astrodome-CocaCola Jct (Natasha) Day: 1 week
Veh ic le Type Date24-hourCount
Dai lyFactor
SeasonalFactor
AADT
4/24/15 7,993 1.000 7,9934/25/15 6,887 1.000 6,8874/26/15 7,677 1.000 7,6774/27/15 8,133 1.000 8,1334/28/15 8,725 1.000 8,7254/29/15 8,388 1.000 8,3884/30/15 7,993 1.000 7,9934/24/15 6,421 1.000 6,4214/25/15 5,824 1.000 5,8244/26/15 6,524 1.000 6,5244/27/15 6,835 1.000 6,8354/28/15 7,099 1.000 7,0994/29/15 6,311 1.000 6,3114/30/15 6,421 1.000 6,4214/24/15 312 1.000 3124/25/15 223 1.000 2234/26/15 186 1.000 1864/27/15 359 1.000 3594/28/15 266 1.000 2664/29/15 261 1.000 2614/30/15 312 1.000 3124/24/15 8 1.000 84/25/15 9 1.000 94/26/15 4 1.000 44/27/15 1 1.000 14/28/15 0 1.000 04/29/15 5 1.000 54/30/15 8 1.000 84/24/15 2 1.000 24/25/15 0 1.000 04/26/15 0 1.000 04/27/15 0 1.000 04/28/15 0 1.000 04/29/15 3 1.000 34/30/15 2 1.000 24/24/15 300 1.000 3004/25/15 274 1.000 2744/26/15 324 1.000 3244/27/15 352 1.000 3524/28/15 350 1.000 3504/29/15 270 1.000 2704/30/15 300 1.000 3004/24/15 91 1.000 914/25/15 43 1.000 434/26/15 52 1.000 524/27/15 77 1.000 774/28/15 124 1.000 1244/29/15 133 1.000 1334/30/15 91 1.000 914/24/15 53 1.000 534/25/15 18 1.000 184/26/15 18 1.000 184/27/15 37 1.000 374/28/15 54 1.000 544/29/15 49 1.000 494/30/15 53 1.000 53
4/24/15 8,123 1.000 8,1234/25/15 8,587 1.000 8,5874/26/15 8,601 1.000 8,6014/27/15 8,600 1.000 8,6004/28/15 9,201 1.000 9,2014/29/15 8,754 1.000 8,7544/30/15 8,123 1.000 8,123
15584106,255
23211Total (AADT3) 166,244
0.890 7627
7627Sub-Total (AADT2) 59,989
Sub-Total (AADT1)
Truck Combination 40
Mortercycle/Tricycle 8570
Truck 2-axle 310 1.110 344
1.750 71
Truck 3-axle 87 1.110 97
Mini-Bus 5 1.200 6
Large Bus 1 0.950 1
Jeepney 6491 1.000 6491
Pick-up/Van 274 1.040 285
Average Dai ly Traffic(ADT)
Car/Taxi/Jeep 7971 1.040 8290
294A1-1-293
The Urgent Development Study on the Project on Rehabilitation and Recovery from Typhoon Yolanda in the Philippines Final Report (II) Appendix Technical Supporting Report 1 (Volume 1, Chapter 2)

A - 13
Figure 2.1-6 Manual Traffic Classification Count Annual Average Daily Traffic 2015 (6)
Road Section : S00006LT Date: 4/24-4/30
Sta No & Location: Coca-Cola Jct - San Jose Rotonda (INC) Day: 1 week
Veh ic le Type Date24-hourCount
Dai lyFactor
SeasonalFactor
AADT
4/24/15 5,554 1.000 5,5544/25/15 4,724 1.000 4,7244/26/15 5,041 1.000 5,0414/27/15 5,923 1.000 5,9234/28/15 6,075 1.000 6,0754/29/15 5,717 1.000 5,7174/30/15 4,948 1.000 4,9484/24/15 3,335 1.000 3,3354/25/15 2,646 1.000 2,6464/26/15 2,963 1.000 2,9634/27/15 3,197 1.000 3,1974/28/15 3,436 1.000 3,4364/29/15 3,046 1.000 3,0464/30/15 2,901 1.000 2,9014/24/15 211 1.000 2114/25/15 134 1.000 1344/26/15 205 1.000 2054/27/15 247 1.000 2474/28/15 198 1.000 1984/29/15 120 1.000 1204/30/15 123 1.000 1234/24/15 3 1.000 34/25/15 2 1.000 24/26/15 3 1.000 34/27/15 1 1.000 14/28/15 2 1.000 24/29/15 2 1.000 24/30/15 3 1.000 34/24/15 9 1.000 94/25/15 7 1.000 74/26/15 2 1.000 24/27/15 0 1.000 04/28/15 0 1.000 04/29/15 2 1.000 24/30/15 5 1.000 54/24/15 692 1.000 6924/25/15 446 1.000 4464/26/15 572 1.000 5724/27/15 730 1.000 7304/28/15 697 1.000 6974/29/15 534 1.000 5344/30/15 493 1.000 4934/24/15 77 1.000 774/25/15 64 1.000 644/26/15 99 1.000 994/27/15 109 1.000 1094/28/15 133 1.000 1334/29/15 85 1.000 854/30/15 95 1.000 954/24/15 38 1.000 384/25/15 37 1.000 374/26/15 28 1.000 284/27/15 31 1.000 314/28/15 1,394 1.000 1,3944/29/15 44 1.000 444/30/15 39 1.000 39
4/24/15 7,371 1.000 7,3714/25/15 7,152 1.000 7,1524/26/15 7,911 1.000 7,9114/27/15 7,973 1.000 7,9734/28/15 8,239 1.000 8,2394/29/15 7,565 1.000 7,5654/30/15 7,673 1.000 7,673
Jeepney 3075 1.000 3075
Average Dai ly Traffic(ADT)
Car/Taxi/Jeep 5426 1.040 5643
Mini-Bus 2 1.200 3
Pick-up/Van 177 1.040 184
Truck 2-axle 595 1.110 660
Large Bus 4 0.950 3
Truck Combination 230 1.750 403
Truck 3-axle 95 1.110 105
Mortercycle/Tricycle 7698 0.890 6851
Sub-Total (AADT1)
6851Sub-Total (AADT2) 53,884
16927Total (AADT3) 121,106
67,222 10076
295A1-1-294
The Urgent Development Study on the Project on Rehabilitation and Recovery from Typhoon Yolanda in the Philippines Final Report (II) Appendix Technical Supporting Report 1 (Volume 1, Chapter 2)

A - 14
Figure 2.1-7 Manual Traffic Classification Count Annual Average Daily Traffic 2015 (7)
Road Section : S00007LT Date: 4/24-4/30
Sta No & Location: San Jose Rotonda INC - Baybay Jct. Day: 1 week
Veh ic le Type Date24-hourCount
Dai lyFactor
SeasonalFactor
AADT
4/24/15 2,247 1.000 2,2474/25/15 2,582 1.000 2,5824/26/15 2,258 1.000 2,2584/27/15 3,811 1.000 3,8114/28/15 2,910 1.000 2,9104/29/15 3,274 1.000 3,2744/30/15 2,693 1.000 2,6934/24/15 2,614 1.000 2,6144/25/15 2,433 1.000 2,4334/26/15 2,436 1.000 2,4364/27/15 2,801 1.000 2,8014/28/15 2,725 1.000 2,7254/29/15 3,289 1.000 3,2894/30/15 2,650 1.000 2,6504/24/15 180 1.000 1804/25/15 143 1.000 1434/26/15 106 1.000 1064/27/15 239 1.000 2394/28/15 129 1.000 1294/29/15 195 1.000 1954/30/15 113 1.000 1134/24/15 16 1.000 164/25/15 0 1.000 04/26/15 0 1.000 04/27/15 0 1.000 04/28/15 0 1.000 04/29/15 1 1.000 14/30/15 0 1.000 04/24/15 0 1.000 04/25/15 0 1.000 04/26/15 0 1.000 04/27/15 0 1.000 04/28/15 0 1.000 04/29/15 3 1.000 34/30/15 0 1.000 04/24/15 380 1.000 3804/25/15 397 1.000 3974/26/15 362 1.000 3624/27/15 581 1.000 5814/28/15 447 1.000 4474/29/15 450 1.000 4504/30/15 364 1.000 3644/24/15 95 1.000 954/25/15 68 1.000 684/26/15 52 1.000 524/27/15 102 1.000 1024/28/15 72 1.000 724/29/15 107 1.000 1074/30/15 49 1.000 494/24/15 15 1.000 154/25/15 23 1.000 234/26/15 11 1.000 114/27/15 39 1.000 394/28/15 40 1.000 404/29/15 28 1.000 284/30/15 13 1.000 13
4/24/15 3,869 1.000 3,8694/25/15 4,886 1.000 4,8864/26/15 3,850 1.000 3,8504/27/15 5,532 1.000 5,5324/28/15 4,419 1.000 4,4194/29/15 4,967 1.000 4,9674/30/15 4,305 1.000 4,305
641443,543
10460Total (AADT3) 75,371
0.890 4047
4047Sub-Total (AADT2) 31,828
Sub-Total (AADT1)
Truck Combination 24
Mortercycle/Tricycle 4547
Truck 2-axle 426 1.110 473
1.750 42
Truck 3-axle 78 1.110 86
Mini-Bus 2 1.200 3
Large Bus 0 0.950 0
Jeepney 2707 1.000 2707
Pick-up/Van 158 1.040 164
Average Dai ly Traffic(ADT)
Car/Taxi/Jeep 2825 1.040 2938
296A1-1-295
The Urgent Development Study on the Project on Rehabilitation and Recovery from Typhoon Yolanda in the Philippines Final Report (II) Appendix Technical Supporting Report 1 (Volume 1, Chapter 2)

A - 15
Figure 2.1-8 Manual Traffic Classification Count Annual Average Daily Traffic 2015 (8)
Road Section : S00008LT Date: 4/24-4/30
Sta No & Location: Baybay Jct (Yolanda) - Brgy Payapay Day: 1 week
Veh ic le Type Date24-hourCount
Dai lyFactor
SeasonalFactor
AADT
4/24/15 109 1.000 1094/25/15 120 1.000 1204/26/15 97 1.000 974/27/15 129 1.000 1294/28/15 130 1.000 1304/29/15 108 1.000 1084/30/15 115 1.000 1154/24/15 40 1.000 404/25/15 35 1.000 354/26/15 19 1.000 194/27/15 16 1.000 164/28/15 34 1.000 344/29/15 45 1.000 454/30/15 13 1.000 134/24/15 13 1.000 134/25/15 13 1.000 134/26/15 11 1.000 114/27/15 6 1.000 64/28/15 11 1.000 114/29/15 10 1.000 104/30/15 16 1.000 164/24/15 1 1.000 14/25/15 0 1.000 04/26/15 0 1.000 04/27/15 0 1.000 04/28/15 0 1.000 04/29/15 0 1.000 04/30/15 0 1.000 04/24/15 0 1.000 04/25/15 0 1.000 04/26/15 0 1.000 04/27/15 0 1.000 04/28/15 0 1.000 04/29/15 0 1.000 04/30/15 0 1.000 04/24/15 28 1.000 284/25/15 17 1.000 174/26/15 35 1.000 354/27/15 45 1.000 454/28/15 29 1.000 294/29/15 19 1.000 194/30/15 32 1.000 324/24/15 3 1.000 34/25/15 1 1.000 14/26/15 0 1.000 04/27/15 6 1.000 64/28/15 4 1.000 44/29/15 0 1.000 04/30/15 0 1.000 04/24/15 0 1.000 04/25/15 2 1.000 24/26/15 0 1.000 04/27/15 0 1.000 04/28/15 0 1.000 04/29/15 0 1.000 04/30/15 0 1.000 0
4/24/15 683 1.000 6834/25/15 876 1.000 8764/26/15 845 1.000 8454/27/15 613 1.000 6134/28/15 739 1.000 7394/29/15 702 1.000 7024/30/15 627 1.000 627
Jeepney 29 1.000 29
Average Dai ly Traffic(ADT)
Car/Taxi/Jeep 115 1.040 120
Mini-Bus 0 1.200 0
Pick-up/Van 11 1.040 12
Truck 2-axle 29 1.110 33
Large Bus 0 0.950 0
Truck Combination 0 1.750 1
Truck 3-axle 2 1.110 2
Mortercycle/Tricycle 726 0.890 647
Sub-Total (AADT1)
647Sub-Total (AADT2) 5,085
843Total (AADT3) 6,397
1,312 196
297A1-1-296
The Urgent Development Study on the Project on Rehabilitation and Recovery from Typhoon Yolanda in the Philippines Final Report (II) Appendix Technical Supporting Report 1 (Volume 1, Chapter 2)
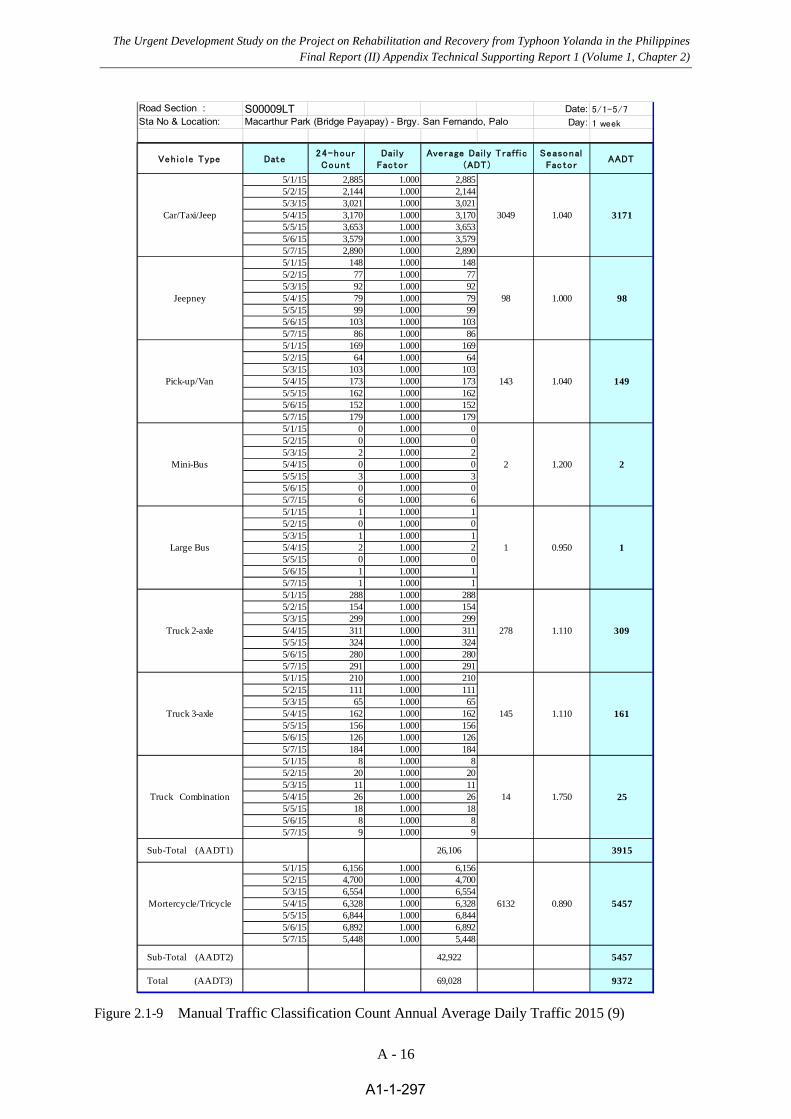
A - 16
Figure 2.1-9 Manual Traffic Classification Count Annual Average Daily Traffic 2015 (9)
Road Section : S00009LT Date: 5/1-5/7
Sta No & Location: Macarthur Park (Bridge Payapay) - Brgy. San Fernando, Palo Day: 1 week
Veh ic le Type Date24-hourCount
Dai lyFactor
SeasonalFac to r
AADT
5/1/15 2,885 1.000 2,8855/2/15 2,144 1.000 2,1445/3/15 3,021 1.000 3,0215/4/15 3,170 1.000 3,1705/5/15 3,653 1.000 3,6535/6/15 3,579 1.000 3,5795/7/15 2,890 1.000 2,8905/1/15 148 1.000 1485/2/15 77 1.000 775/3/15 92 1.000 925/4/15 79 1.000 795/5/15 99 1.000 995/6/15 103 1.000 1035/7/15 86 1.000 865/1/15 169 1.000 1695/2/15 64 1.000 645/3/15 103 1.000 1035/4/15 173 1.000 1735/5/15 162 1.000 1625/6/15 152 1.000 1525/7/15 179 1.000 1795/1/15 0 1.000 05/2/15 0 1.000 05/3/15 2 1.000 25/4/15 0 1.000 05/5/15 3 1.000 35/6/15 0 1.000 05/7/15 6 1.000 65/1/15 1 1.000 15/2/15 0 1.000 05/3/15 1 1.000 15/4/15 2 1.000 25/5/15 0 1.000 05/6/15 1 1.000 15/7/15 1 1.000 15/1/15 288 1.000 2885/2/15 154 1.000 1545/3/15 299 1.000 2995/4/15 311 1.000 3115/5/15 324 1.000 3245/6/15 280 1.000 2805/7/15 291 1.000 2915/1/15 210 1.000 2105/2/15 111 1.000 1115/3/15 65 1.000 655/4/15 162 1.000 1625/5/15 156 1.000 1565/6/15 126 1.000 1265/7/15 184 1.000 1845/1/15 8 1.000 85/2/15 20 1.000 205/3/15 11 1.000 115/4/15 26 1.000 265/5/15 18 1.000 185/6/15 8 1.000 85/7/15 9 1.000 9
5/1/15 6,156 1.000 6,1565/2/15 4,700 1.000 4,7005/3/15 6,554 1.000 6,5545/4/15 6,328 1.000 6,3285/5/15 6,844 1.000 6,8445/6/15 6,892 1.000 6,8925/7/15 5,448 1.000 5,448
391526,106
9372Total (AADT3) 69,028
0.890 5457
5457Sub-Total (AADT2) 42,922
Sub-Total (AADT1)
Truck Combination 14
Mortercycle/Tricycle 6132
Truck 2-axle 278 1.110 309
1.750 25
Truck 3-axle 145 1.110 161
Mini-Bus 2 1.200 2
Large Bus 1 0.950 1
Jeepney 98 1.000 98
Pick-up/Van 143 1.040 149
Average Dai ly Traffic(ADT)
Car/Taxi/Jeep 3049 1.040 3171
298A1-1-297
The Urgent Development Study on the Project on Rehabilitation and Recovery from Typhoon Yolanda in the Philippines Final Report (II) Appendix Technical Supporting Report 1 (Volume 1, Chapter 2)

A - 17
Figure 2.1-10 Manual Traffic Classification Count Annual Average Daily Traffic 2015 (10)
Road Section : S00010LT Date: 5/1-5/7
Sta No & Location: Brgy. San Fernando, Baras - Jct. Guindapunan-Salvacion Road Day: 1 week
Veh ic le Type Date24-hourCoun t
Dai lyFac tor
SeasonalFactor
AADT
5/1/15 1,614 1.000 1,6145/2/15 1,300 1.000 1,3005/3/15 1,762 1.000 1,7625/4/15 1,953 1.000 1,9535/5/15 2,353 1.000 2,3535/6/15 2,056 1.000 2,0565/1/15 1,819 1.000 1,8195/1/15 91 1.000 915/2/15 63 1.000 635/3/15 113 1.000 1135/4/15 100 1.000 1005/5/15 152 1.000 1525/6/15 88 1.000 885/7/15 77 1.000 775/1/15 134 1.000 1345/2/15 69 1.000 695/3/15 114 1.000 1145/4/15 156 1.000 1565/5/15 165 1.000 1655/6/15 190 1.000 1905/7/15 183 1.000 1835/1/15 0 1.000 05/2/15 0 1.000 05/3/15 1 1.000 15/4/15 1 1.000 15/5/15 4 1.000 45/6/15 3 1.000 35/7/15 3 1.000 35/1/15 0 1.000 05/2/15 0 1.000 05/3/15 0 1.000 05/4/15 1 1.000 15/5/15 0 1.000 05/6/15 1 1.000 15/7/15 0 1.000 05/1/15 338 1.000 3385/2/15 197 1.000 1975/3/15 304 1.000 3045/4/15 374 1.000 3745/5/15 452 1.000 4525/6/15 338 1.000 3385/7/15 324 1.000 3245/1/15 128 1.000 1285/2/15 39 1.000 395/3/15 72 1.000 725/4/15 82 1.000 825/5/15 92 1.000 925/6/15 90 1.000 905/7/15 88 1.000 885/1/15 14 1.000 145/2/15 8 1.000 85/3/15 8 1.000 85/4/15 14 1.000 145/5/15 16 1.000 165/6/15 10 1.000 105/7/15 22 1.000 22
5/1/15 4,242 1.000 4,2425/2/15 4,360 1.000 4,3605/3/15 4,799 1.000 4,7995/4/15 4,841 1.000 4,8415/5/15 6,199 1.000 6,1995/6/15 5,053 1.000 5,0535/7/15 4,208 1.000 4,208
Jeepney 98 1.000 98
Average Dai ly Traff ic(ADT)
Car/Taxi/Jeep 1837 1.040 1910
Mini-Bus 2 1.200 2
Pick-up/Van 144 1.040 150
Truck 2-axle 332 1.110 369
Large Bus 0 0.950 0
Truck Combination 13 1.750 23
Truck 3-axle 84 1.110 94
Mortercycle/Tricycle 4815 0.890 4285
Sub-Total (AADT1)
4285Sub-Total (AADT2) 33,702
6931Total (AADT3) 51,278
17,576 2646
299A1-1-298
The Urgent Development Study on the Project on Rehabilitation and Recovery from Typhoon Yolanda in the Philippines Final Report (II) Appendix Technical Supporting Report 1 (Volume 1, Chapter 2)

A - 18
Figure 2.1-11 Manual Traffic Classification Count Annual Average Daily Traffic 2015 (11)
Road Section : S00011LT Date: 5/1-5/7
Sta No & Location: National Highway - Brgy. Guindapunan Day: 1 week
Veh ic le Type Date24-hourCount
Dai lyFactor
SeasonalFactor
AADT
5/1/15 2,244 1.000 2,2445/2/15 1,762 1.000 1,7625/3/15 1,621 1.000 1,6215/4/15 1,974 1.000 1,9745/5/15 2,094 1.000 2,0945/6/15 1,954 1.000 1,9545/7/15 1,780 1.000 1,7805/1/15 212 1.000 2125/2/15 77 1.000 775/3/15 157 1.000 1575/4/15 150 1.000 1505/5/15 187 1.000 1875/6/15 296 1.000 2965/7/15 162 1.000 1625/1/15 169 1.000 1695/2/15 111 1.000 1115/3/15 62 1.000 625/4/15 94 1.000 945/5/15 91 1.000 915/6/15 103 1.000 1035/7/15 115 1.000 1155/1/15 0 1.000 05/2/15 0 1.000 05/3/15 0 1.000 05/4/15 2 1.000 25/5/15 1 1.000 15/6/15 6 1.000 65/7/15 4 1.000 45/1/15 0 1.000 05/2/15 2 1.000 25/3/15 0 1.000 05/4/15 1 1.000 15/5/15 2 1.000 25/6/15 6 1.000 65/7/15 2 1.000 25/1/15 503 1.000 5035/2/15 319 1.000 3195/3/15 379 1.000 3795/4/15 557 1.000 5575/5/15 601 1.000 6015/6/15 390 1.000 3905/7/15 465 1.000 4655/1/15 170 1.000 1705/2/15 94 1.000 945/3/15 44 1.000 445/4/15 80 1.000 805/5/15 85 1.000 855/6/15 139 1.000 1395/7/15 84 1.000 845/1/15 1 1.000 15/2/15 11 1.000 115/3/15 1 1.000 15/4/15 2 1.000 25/5/15 0 1.000 05/6/15 24 1.000 245/7/15 4 1.000 4
5/1/15 4,715 1.000 4,7155/2/15 4,453 1.000 4,4535/3/15 4,191 1.000 4,1915/4/15 4,785 1.000 4,7855/5/15 5,493 1.000 5,4935/6/15 4,376 1.000 4,3765/7/15 5,145 1.000 5,145
291819,394
7134Total (AADT3) 52,552
0.890 4216
4216Sub-Total (AADT2) 33,158
Sub-Total (AADT1)
Truck Combination 6
Mortercycle/Tricycle 4737
Truck 2-axle 459 1.110 510
1.750 11
Truck 3-axle 99 1.110 110
Mini-Bus 2 1.200 2
Large Bus 2 0.950 2
Jeepney 177 1.000 177
Pick-up/Van 106 1.040 111
Average Dai ly Traffic(ADT)
Car/Taxi/Jeep 1918 1.040 1995
300A1-1-299
The Urgent Development Study on the Project on Rehabilitation and Recovery from Typhoon Yolanda in the Philippines Final Report (II) Appendix Technical Supporting Report 1 (Volume 1, Chapter 2)

A - 19
Figure 2.1-12 Manual Traffic Classification Count Annual Average Daily Traffic 2015 (12)
Road Section : S00012LT Date: 5/1-5/7
Sta No & Location: Palo East By-Pass Road, Day: 1 week
Veh ic le Type Date24-hour
Count
Dai ly
Factor
Seasonal
FactorAADT
5/1/15 1,957 1.000 1,9575/2/15 2,003 1.000 2,0035/3/15 2,137 1.000 2,1375/4/15 2,507 1.000 2,5075/5/15 2,699 1.000 2,6995/6/15 2,892 1.000 2,8925/7/15 3,054 1.000 3,0545/1/15 182 1.000 1825/2/15 129 1.000 1295/3/15 220 1.000 2205/4/15 172 1.000 1725/5/15 158 1.000 1585/6/15 181 1.000 1815/7/15 149 1.000 1495/1/15 104 1.000 1045/2/15 90 1.000 905/3/15 136 1.000 1365/4/15 137 1.000 1375/5/15 118 1.000 1185/6/15 183 1.000 1835/7/15 190 1.000 1905/1/15 1 1.000 15/2/15 0 1.000 05/3/15 1 1.000 15/4/15 1 1.000 15/5/15 4 1.000 45/6/15 1 1.000 15/7/15 1 1.000 15/1/15 0 1.000 05/2/15 2 1.000 25/3/15 5 1.000 55/4/15 2 1.000 25/5/15 0 1.000 05/6/15 6 1.000 65/7/15 1 1.000 15/1/15 653 1.000 6535/2/15 350 1.000 3505/3/15 686 1.000 6865/4/15 725 1.000 7255/5/15 687 1.000 6875/6/15 718 1.000 7185/7/15 745 1.000 7455/1/15 181 1.000 1815/2/15 134 1.000 1345/3/15 124 1.000 1245/4/15 169 1.000 1695/5/15 171 1.000 1715/6/15 155 1.000 1555/7/15 170 1.000 1705/1/15 42 1.000 425/2/15 101 1.000 1015/3/15 15 1.000 155/4/15 94 1.000 945/5/15 127 1.000 1275/6/15 98 1.000 985/7/15 117 1.000 117
5/1/15 3,234 1.000 3,2345/2/15 4,068 1.000 4,0685/3/15 4,382 1.000 4,3825/4/15 4,448 1.000 4,4485/5/15 4,683 1.000 4,6835/6/15 4,550 1.000 4,5505/7/15 4,803 1.000 4,803
Jeepney 170 1.000 170
Average Dai ly Traffic
(ADT)
Car/Taxi/Jeep 2464 1.040 2563
Mini-Bus 1 1.200 2
Pick-up/Van 137 1.040 142
Truck 2-axle 652 1.110 724
Large Bus 2 0.950 2
Truck Combination 85 1.750 149
Truck 3-axle 158 1.110 175
Mortercycle/Tricycle 4310 0.890 3836
Sub-Total (AADT1)
3836Sub-Total (AADT2) 30,168
7762Total (AADT3) 55,853
25,685 3926
301A1-1-300
The Urgent Development Study on the Project on Rehabilitation and Recovery from Typhoon Yolanda in the Philippines Final Report (II) Appendix Technical Supporting Report 1 (Volume 1, Chapter 2)

A - 20
2.2 Calculation Sheets of Traffic Projections
Calculation sheets of traffic projections are shown in following figures.
Figure 2.2-1 Traffic Projections (Traffic Assignment Results),AADT and PCU/day (1)
Location Lions Den - Real St. - Jct. Burgos StRoad Section: S00001LT Mabsaysay Blvd.
Traffic Growth Rate Factor (%)Year C/J/V Pick-up Jeepneys S. Bus L. Bus Trucks 2-axle Trucks 3-axle Trucks 4-axle Mortercycle/Tricycle
2015 - 2019 9.00 9.00 7.50 7.50 7.50 5.00 5.00 5.00 5.502020 - 2024 9.75 9.75 8.12 8.12 8.12 5.42 5.42 5.42 5.962025 - 2029 10.40 10.40 8.66 8.66 8.66 5.78 5.78 5.78 6.352030 - 2034 10.82 10.82 9.02 9.02 9.02 6.01 6.01 6.01 6.612035 - 2039 11.44 11.44 9.53 9.53 9.53 6.36 6.36 6.36 6.99
Base Year AADT 4,762 125 5,861 4 6 249 72 113 4,477
Average Annual Daily TrafficYear 1 2 3 4 5 6 7 8 9 Total Total
C/J/V Pick-up Jeepneys S. Bus L. Bus Trucks 2-axle Trucks 3-axle Trucks 4-axle Mortercycle/Tricycle (1-8) (1-9)2015 4,762 125 5,861 4 6 249 72 113 4,477 11,192 15,6692016 5,190 137 6,300 4 6 262 76 119 4,723 12,093 16,8172017 5,657 149 6,773 4 6 275 79 125 4,983 13,069 18,0522018 6,167 162 7,281 4 7 289 83 131 5,257 14,124 19,3812019 6,722 177 7,827 5 7 303 88 138 5,546 15,266 20,8122020 7,326 193 8,414 5 8 318 92 145 5,851 16,501 22,3522021 8,041 212 9,097 6 9 335 97 152 6,200 17,949 24,1492022 8,825 232 9,836 6 9 354 102 161 6,569 19,525 26,0942023 9,685 255 10,635 7 10 373 108 169 6,961 21,241 28,2022024 10,630 280 11,498 7 11 393 113 179 7,376 23,110 30,4862025 11,666 307 12,432 8 12 414 120 188 7,815 25,146 32,9622026 12,879 339 13,508 8 13 438 127 199 8,312 27,512 35,8232027 14,219 374 14,678 9 14 463 134 211 8,840 30,102 38,9422028 15,697 413 15,949 10 15 490 142 223 9,401 32,940 42,3402029 17,330 456 17,331 11 16 519 150 236 9,998 36,048 46,0462030 19,132 504 18,831 12 18 549 158 249 10,633 39,453 50,0862031 21,202 558 20,530 13 19 582 168 264 11,335 43,336 54,6722032 23,496 619 22,382 14 21 617 178 280 12,085 47,607 59,6912033 26,039 686 24,401 15 23 654 189 297 12,884 52,302 65,1862034 28,856 760 26,602 16 25 693 200 315 13,735 57,467 71,2022035 31,978 842 29,001 18 28 734 212 334 14,643 63,147 77,7902036 35,637 938 31,765 20 30 781 226 355 15,667 69,751 85,4182037 39,713 1,046 34,792 21 33 831 240 377 16,762 77,054 93,8162038 44,257 1,165 38,108 23 36 884 255 402 17,933 85,130 103,0632039 49,320 1,299 41,739 26 40 940 271 427 19,187 94,061 113,2482040 54,962 1,447 45,717 28 43 1,000 289 454 20,528 103,940 124,468
Passenger Car U Passenger Car UnitPCEF 1 1 1.4 2.2 2.2 2.2 2.2 2.2 0.5 Total TotalYear C/J/V Pick-up Jeepneys S. Bus L. Bus Trucks 2-axle Trucks 3-axle Trucks 4-axle Motorcycle (1-6) (1-8)2015 4,762 125 8,205 8 12 548 158 249 2,238 14,068 16,3072016 5,190 137 8,821 9 13 576 166 262 2,362 15,173 17,5352017 5,657 149 9,482 9 14 605 175 275 2,491 16,366 18,8572018 6,167 162 10,193 10 15 635 183 288 2,629 17,654 20,2822019 6,722 177 10,958 11 16 667 193 303 2,773 19,045 21,8182020 7,326 193 11,780 11 18 700 202 318 2,926 20,548 23,4742021 8,041 212 12,736 12 19 738 213 335 3,100 22,306 25,4062022 8,825 232 13,770 13 21 778 225 353 3,285 24,217 27,5022023 9,685 255 14,888 14 22 820 237 373 3,480 26,295 29,7752024 10,630 280 16,097 16 24 864 250 393 3,688 28,553 32,2412025 11,666 307 17,405 17 26 911 263 414 3,908 31,009 34,9172026 12,879 339 18,912 18 28 964 278 438 4,156 33,857 38,0132027 14,219 374 20,549 20 31 1,020 294 463 4,420 36,970 41,3902028 15,697 413 22,329 22 33 1,079 312 490 4,700 40,375 45,0752029 17,330 456 24,263 23 36 1,141 330 518 4,999 44,097 49,0962030 19,132 504 26,364 25 39 1,207 349 548 5,316 48,169 53,4852031 21,202 558 28,742 28 43 1,279 370 581 5,668 52,803 58,4712032 23,496 619 31,334 30 47 1,356 392 616 6,042 57,891 63,9332033 26,039 686 34,161 33 51 1,438 415 653 6,442 63,476 69,9172034 28,856 760 37,242 36 56 1,524 440 693 6,868 69,607 76,4742035 31,978 842 40,601 39 61 1,616 467 734 7,322 76,338 83,6602036 35,637 938 44,471 43 66 1,719 496 781 7,833 84,151 91,9842037 39,713 1,046 48,709 47 73 1,828 528 830 8,381 92,774 101,1552038 44,257 1,165 53,351 51 80 1,944 562 883 8,967 102,293 111,2602039 49,320 1,299 58,435 56 87 2,068 597 939 9,593 112,802 122,3952040 54,962 1,447 64,004 62 95 2,199 635 999 10,264 124,404 134,668
302A1-1-301
The Urgent Development Study on the Project on Rehabilitation and Recovery from Typhoon Yolanda in the Philippines Final Report (II) Appendix Technical Supporting Report 1 (Volume 1, Chapter 2)

A - 21
Figure 2.2-2 Traffic Projections (Traffic Assignment Results),AADT and PCU/day (2)
Location Pampango St.- -Jct. Imelda St.-Magallanes St.Road Section:1 S00002LT Real St.
Traffic Growth Rate Factor (%)Year C/J/V Pick-up Jeepneys S. Bus L. Bus Trucks 2-axle Trucks 3-axle Trucks 4-axle Mortercycle/Tricycle
2015 - 2019 9.00 9.00 7.50 7.50 7.50 5.00 5.00 5.00 5.502020 - 2024 9.75 9.75 8.12 8.12 8.12 5.42 5.42 5.42 5.962025 - 2029 10.40 10.40 8.66 8.66 8.66 5.78 5.78 5.78 6.352030 - 2034 10.82 10.82 9.02 9.02 9.02 6.01 6.01 6.01 6.612035 - 2039 11.44 11.44 9.53 9.53 9.53 6.36 6.36 6.36 6.99
Base Year AADT 810 42 2,727 2 1 76 3 0 2,922
Average Annual Daily TrafficYear 1 2 3 4 5 6 7 8 9 Total Total
C/J/V Pick-up Jeepneys S. Bus L. Bus Trucks 2-axle Trucks 3-axle Trucks 4-axle Mortercycle/Tricycle (1-8) (1-9)2015 810 42 2,727 2 1 76 3 0 2,922 3,660 6,5822016 883 46 2,931 2 1 80 3 0 3,083 3,946 7,0282017 963 50 3,151 2 1 84 3 0 3,252 4,253 7,5062018 1,049 54 3,387 2 1 88 3 0 3,431 4,585 8,0172019 1,144 59 3,641 3 1 93 3 0 3,620 4,944 8,5642020 1,247 65 3,915 3 1 97 3 0 3,819 5,330 9,1492021 1,368 71 4,232 3 1 102 3 0 4,047 5,781 9,8282022 1,501 78 4,576 3 1 108 4 0 4,288 6,272 10,5592023 1,648 86 4,948 3 1 114 4 0 4,543 6,804 11,3472024 1,809 94 5,349 4 2 120 4 0 4,814 7,381 12,1952025 1,985 103 5,784 4 2 126 4 0 5,101 8,008 13,1092026 2,191 114 6,285 4 2 134 4 0 5,425 8,734 14,1592027 2,419 126 6,829 5 2 142 5 0 5,770 9,527 15,2962028 2,671 139 7,420 5 2 150 5 0 6,136 10,392 16,5282029 2,949 153 8,063 6 2 158 5 0 6,526 11,336 17,8622030 3,255 169 8,761 6 3 168 6 0 6,940 12,367 19,3072031 3,607 187 9,551 7 3 178 6 0 7,399 13,539 20,9382032 3,998 207 10,413 7 3 188 6 0 7,888 14,823 22,7112033 4,430 230 11,352 8 3 200 7 0 8,409 16,230 24,6392034 4,910 255 12,376 9 4 212 7 0 8,965 17,771 26,7362035 5,441 282 13,492 9 4 224 7 0 9,558 19,461 29,0182036 6,063 315 14,778 10 4 239 8 0 10,226 21,417 31,6432037 6,757 351 16,187 11 5 254 8 0 10,940 23,572 34,5132038 7,530 391 17,729 12 5 270 9 0 11,705 25,946 37,6512039 8,391 435 19,419 13 6 287 10 0 12,523 28,561 41,0852040 9,351 485 21,269 15 6 305 10 0 13,399 31,442 44,841
Passenger Car U Passenger Car UnitPCEF 1 1 1.4 2.2 2.2 2.2 2.2 2.2 0.5 Total TotalYear C/J/V Pick-up Jeepneys S. Bus L. Bus Trucks 2-axle Trucks 3-axle Trucks 4-axle Motorcycle (1-6) (1-8)2015 810 42 3,817 4 2 167 6 0 1,461 4,849 6,3102016 883 46 4,104 4 2 176 6 0 1,541 5,221 6,7622017 963 50 4,411 5 2 185 6 0 1,626 5,622 7,2482018 1,049 54 4,742 5 2 194 6 0 1,716 6,054 7,7692019 1,144 59 5,098 6 2 204 7 0 1,810 6,519 8,3292020 1,247 65 5,480 6 3 214 7 0 1,910 7,021 8,9312021 1,368 71 5,925 6 3 225 8 0 2,023 7,606 9,6302022 1,501 78 6,407 7 3 238 8 0 2,144 8,241 10,3852023 1,648 86 6,927 8 3 250 8 0 2,272 8,930 11,2012024 1,809 94 7,489 8 4 264 9 0 2,407 9,676 12,0832025 1,985 103 8,097 9 4 278 9 0 2,551 10,485 13,0362026 2,191 114 8,799 10 4 294 10 0 2,713 11,421 14,1342027 2,419 126 9,560 10 4 311 10 0 2,885 12,442 15,3272028 2,671 139 10,388 11 5 329 11 0 3,068 13,554 16,6222029 2,949 153 11,288 12 5 348 12 0 3,263 14,767 18,0302030 3,255 169 12,266 13 6 369 12 0 3,470 16,090 19,5602031 3,607 187 13,372 15 6 391 13 0 3,699 17,591 21,2902032 3,998 207 14,578 16 7 414 14 0 3,944 19,234 23,1782033 4,430 230 15,893 17 7 439 15 0 4,205 21,032 25,2362034 4,910 255 17,327 19 8 465 16 0 4,482 22,999 27,4812035 5,441 282 18,889 21 9 493 16 0 4,779 25,152 29,9312036 6,063 315 20,690 22 10 525 17 0 5,113 27,642 32,7552037 6,757 351 22,661 25 11 558 19 0 5,470 30,381 35,8512038 7,530 391 24,821 27 12 594 20 0 5,853 33,394 39,2462039 8,391 435 27,186 30 13 631 21 0 6,262 36,708 42,9702040 9,351 485 29,777 32 14 672 22 0 6,699 40,354 47,053
303A1-1-302
The Urgent Development Study on the Project on Rehabilitation and Recovery from Typhoon Yolanda in the Philippines Final Report (II) Appendix Technical Supporting Report 1 (Volume 1, Chapter 2)

A - 22
Figure 2.2-3 Traffic Projections (Traffic Assignment Results),AADT and PCU/day (3)
Location Magallanes St.- Pericohon St.Road Section: S00003LT Esparas Ave.
Traffic Growth Rate Factor (%)Year C/J/V Pick-up Jeepneys S. Bus L. Bus Trucks 2-axle Trucks 3-axle Trucks 4-axle Mortercycle/Tricycle
2015 - 2019 9.00 9.00 7.50 7.50 7.50 5.00 5.00 5.00 5.502020 - 2024 9.75 9.75 8.12 8.12 8.12 5.42 5.42 5.42 5.962025 - 2029 10.40 10.40 8.66 8.66 8.66 5.78 5.78 5.78 6.352030 - 2034 10.82 10.82 9.02 9.02 9.02 6.01 6.01 6.01 6.612035 - 2039 11.44 11.44 9.53 9.53 9.53 6.36 6.36 6.36 6.99
Base Year AADT 925 36 2,485 0 0 46 0 0 3,026
Average Annual Daily TrafficYear 1 2 3 4 5 6 7 8 9 Total Total
C/J/V Pick-up Jeepneys S. Bus L. Bus Trucks 2-axle Trucks 3-axle Trucks 4-axle Mortercycle/Tricycle (1-8) (1-9)2015 925 36 2,485 0 0 46 0 0 3,026 3,492 6,5192016 1,008 40 2,671 0 0 48 0 0 3,193 3,768 6,9602017 1,099 43 2,872 0 0 51 0 0 3,368 4,065 7,4332018 1,198 47 3,087 0 0 53 0 0 3,553 4,385 7,9392019 1,306 51 3,319 0 0 56 0 0 3,749 4,732 8,4802020 1,423 56 3,568 0 0 58 0 0 3,955 5,105 9,0602021 1,562 61 3,857 0 0 62 0 0 4,191 5,543 9,7332022 1,714 67 4,170 0 0 65 0 0 4,441 6,017 10,4582023 1,881 74 4,509 0 0 69 0 0 4,705 6,533 11,2382024 2,065 81 4,875 0 0 72 0 0 4,986 7,094 12,0792025 2,266 89 5,271 0 0 76 0 0 5,283 7,703 12,9862026 2,501 98 5,728 0 0 81 0 0 5,618 8,409 14,0272027 2,762 108 6,224 0 0 85 0 0 5,975 9,180 15,1552028 3,049 120 6,763 0 0 90 0 0 6,354 10,022 16,3772029 3,366 132 7,348 1 0 95 0 0 6,758 10,943 17,7002030 3,716 146 7,984 1 0 101 0 0 7,187 11,948 19,1352031 4,118 161 8,705 1 0 107 0 0 7,662 13,093 20,7552032 4,564 179 9,490 1 1 113 0 0 8,169 14,347 22,5162033 5,057 198 10,346 1 1 120 0 0 8,708 15,723 24,4322034 5,605 220 11,279 1 1 127 0 0 9,284 17,233 26,5172035 6,211 243 12,296 1 1 135 0 0 9,898 18,888 28,7862036 6,922 271 13,468 1 1 144 0 0 10,590 20,807 31,3972037 7,713 302 14,752 1 1 153 1 0 11,330 22,923 34,2522038 8,596 337 16,158 1 1 162 1 0 12,122 25,255 37,3772039 9,579 375 17,697 1 1 173 1 0 12,969 27,828 40,7972040 10,675 418 19,384 1 1 184 1 0 13,876 30,664 44,540
Passenger Car U Passenger Car UnitPCEF 1 1 1.4 2.2 2.2 2.2 2.2 2.2 0.5 Total TotalYear C/J/V Pick-up Jeepneys S. Bus L. Bus Trucks 2-axle Trucks 3-axle Trucks 4-axle Motorcycle (1-6) (1-8)2015 925 36 3,479 0 0 101 0 0 1,513 4,542 6,0552016 1,008 40 3,740 0 0 106 0 0 1,596 4,894 6,4912017 1,099 43 4,020 0 0 111 0 0 1,684 5,275 6,9592018 1,198 47 4,322 0 0 117 0 0 1,777 5,685 7,4612019 1,306 51 4,646 1 0 123 0 0 1,874 6,127 8,0012020 1,423 56 4,995 1 0 129 0 0 1,978 6,603 8,5812021 1,562 61 5,400 1 0 136 0 0 2,095 7,160 9,2562022 1,714 67 5,839 1 1 143 0 0 2,220 7,764 9,9852023 1,881 74 6,313 1 1 151 1 0 2,353 8,420 10,7732024 2,065 81 6,825 1 1 159 1 0 2,493 9,132 11,6242025 2,266 89 7,379 1 1 168 1 0 2,641 9,904 12,5452026 2,501 98 8,019 1 1 177 1 0 2,809 10,797 13,6072027 2,762 108 8,713 1 1 187 1 0 2,987 11,773 14,7602028 3,049 120 9,468 1 1 198 1 0 3,177 12,837 16,0142029 3,366 132 10,287 1 1 210 1 0 3,379 13,998 17,3772030 3,716 146 11,178 1 1 222 1 0 3,593 15,265 18,8582031 4,118 161 12,187 1 1 235 1 0 3,831 16,704 20,5352032 4,564 179 13,286 1 1 249 1 0 4,084 18,281 22,3652033 5,057 198 14,484 2 1 264 1 0 4,354 20,008 24,3622034 5,605 220 15,791 2 1 280 1 0 4,642 21,899 26,5412035 6,211 243 17,215 2 1 297 1 0 4,949 23,971 28,9202036 6,922 271 18,856 2 2 316 1 0 5,295 26,369 31,6642037 7,713 302 20,652 2 2 336 1 0 5,665 29,010 34,6742038 8,596 337 22,621 2 2 357 1 0 6,061 31,917 37,9772039 9,579 375 24,776 3 2 380 1 0 6,485 35,117 41,6022040 10,675 418 27,138 3 2 404 1 0 6,938 38,642 45,580
304A1-1-303
The Urgent Development Study on the Project on Rehabilitation and Recovery from Typhoon Yolanda in the Philippines Final Report (II) Appendix Technical Supporting Report 1 (Volume 1, Chapter 2)

A - 23
Figure 2.2-4 Traffic Projections (Traffic Assignment Results),AADT and PCU/day (4)
Location Old Road Sagkahan- AstrodomeRoad Section: S00004LT Esparas Ave.
Traffic Growth Rate Factor (%)Year C/J/V Pick-up Jeepneys S. Bus L. Bus Trucks 2-axle Trucks 3-axle Trucks 4-axle Mortercycle/Tricycle
2015 - 2019 9.00 9.00 7.50 7.50 7.50 5.00 5.00 5.00 5.502020 - 2024 9.75 9.75 8.12 8.12 8.12 5.42 5.42 5.42 5.962025 - 2029 10.40 10.40 8.66 8.66 8.66 5.78 5.78 5.78 6.352030 - 2034 10.82 10.82 9.02 9.02 9.02 6.01 6.01 6.01 6.612035 - 2039 11.44 11.44 9.53 9.53 9.53 6.36 6.36 6.36 6.99
Base Year AADT 699 53 2,731 0 0 168 13 1 2,473
Average Annual Daily TrafficYear 1 2 3 4 5 6 7 8 9 Total Total
C/J/V Pick-up Jeepneys S. Bus L. Bus Trucks 2-axle Trucks 3-axle Trucks 4-axle Mortercycle/Tricycle (1-8) (1-9)2015 699 53 2,731 0 0 168 13 1 2,473 3,665 6,1382016 762 57 2,936 0 0 177 14 1 2,609 3,946 6,5562017 830 62 3,156 0 0 186 14 1 2,753 4,250 7,0032018 905 68 3,393 0 0 195 15 1 2,904 4,577 7,4812019 987 74 3,647 0 0 205 16 1 3,064 4,930 7,9942020 1,075 81 3,921 0 0 215 17 1 3,233 5,310 8,5422021 1,180 89 4,239 0 0 227 17 1 3,425 5,753 9,1792022 1,295 97 4,583 0 0 239 18 1 3,629 6,235 9,8642023 1,422 107 4,955 0 0 252 19 1 3,846 6,757 10,6022024 1,560 117 5,358 0 0 265 20 1 4,075 7,323 11,3982025 1,712 129 5,793 0 0 280 22 1 4,318 7,937 12,2552026 1,890 142 6,295 0 0 296 23 1 4,592 8,648 13,2402027 2,087 157 6,840 0 0 313 24 1 4,883 9,423 14,3062028 2,304 173 7,432 0 0 331 26 1 5,194 10,268 15,4622029 2,544 191 8,076 1 0 350 27 2 5,523 11,190 16,7132030 2,808 211 8,775 1 0 371 29 2 5,874 12,196 18,0702031 3,112 234 9,566 1 0 393 30 2 6,262 13,338 19,6002032 3,449 260 10,429 1 0 417 32 2 6,676 14,589 21,2652033 3,822 288 11,370 1 0 442 34 2 7,118 15,958 23,0752034 4,235 319 12,396 1 0 468 36 2 7,588 17,457 25,0452035 4,693 353 13,514 1 0 496 38 2 8,090 19,098 27,1882036 5,230 394 14,802 1 0 528 41 2 8,655 20,997 29,6522037 5,829 439 16,212 1 0 561 43 2 9,260 23,088 32,3482038 6,496 489 17,757 1 0 597 46 3 9,907 25,388 35,2962039 7,239 545 19,449 1 0 635 49 3 10,600 27,921 38,5212040 8,067 607 21,303 1 0 675 52 3 11,341 30,709 42,049
Passenger Car U Passenger Car UnitPCEF 1 1 1.4 2.2 2.2 2.2 2.2 2.2 0.5 Total TotalYear C/J/V Pick-up Jeepneys S. Bus L. Bus Trucks 2-axle Trucks 3-axle Trucks 4-axle Motorcycle (1-6) (1-8)2015 699 53 3,823 0 0 370 29 2 1,237 4,976 6,2132016 762 57 4,110 0 0 389 30 2 1,305 5,350 6,6552017 830 62 4,418 0 0 408 32 2 1,376 5,753 7,1302018 905 68 4,750 0 0 429 33 2 1,452 6,187 7,6392019 987 74 5,106 1 0 450 35 2 1,532 6,654 8,1862020 1,075 81 5,489 1 0 473 37 2 1,616 7,157 8,7732021 1,180 89 5,935 1 0 498 38 2 1,713 7,743 9,4562022 1,295 97 6,417 1 0 525 41 2 1,815 8,378 10,1932023 1,422 107 6,938 1 0 554 43 2 1,923 9,066 10,9892024 1,560 117 7,501 1 0 584 45 3 2,037 9,811 11,8482025 1,712 129 8,110 1 0 616 48 3 2,159 10,618 12,7772026 1,890 142 8,812 1 0 651 50 3 2,296 11,550 13,8462027 2,087 157 9,576 1 0 689 53 3 2,442 12,566 15,0072028 2,304 173 10,405 1 0 729 56 3 2,597 13,671 16,2682029 2,544 191 11,306 1 0 771 60 3 2,762 14,876 17,6372030 2,808 211 12,285 1 0 815 63 4 2,937 16,187 19,1242031 3,112 234 13,393 1 0 864 67 4 3,131 17,675 20,8062032 3,449 260 14,601 1 0 916 71 4 3,338 19,302 22,6402033 3,822 288 15,918 2 0 971 75 4 3,559 21,080 24,6382034 4,235 319 17,354 2 0 1,030 80 5 3,794 23,023 26,8172035 4,693 353 18,919 2 0 1,092 84 5 4,045 25,148 29,1932036 5,230 394 20,722 2 0 1,161 90 5 4,328 27,604 31,9322037 5,829 439 22,697 2 0 1,235 95 5 4,630 30,302 34,9322038 6,496 489 24,860 2 0 1,313 101 6 4,954 33,268 38,2212039 7,239 545 27,229 3 0 1,397 108 6 5,300 36,526 41,8262040 8,067 607 29,824 3 0 1,486 115 7 5,670 40,108 45,778
305A1-1-304
The Urgent Development Study on the Project on Rehabilitation and Recovery from Typhoon Yolanda in the Philippines Final Report (II) Appendix Technical Supporting Report 1 (Volume 1, Chapter 2)

A - 24
Figure 2.2-5 Traffic Projections (Traffic Assignment Results),AADT and PCU/day (5)
Location Astrodome-CocaCola Jct (Natasha)Road Section: S00005LT Esparas Ave.
Traffic Growth Rate Factor (%)Year C/J/V Pick-up Jeepneys S. Bus L. Bus Trucks 2-axle Trucks 3-axle Trucks 4-axle Mortercycle/Tricycle
2015 - 2019 9.00 9.00 7.50 7.50 7.50 5.00 5.00 5.00 5.502020 - 2024 9.75 9.75 8.12 8.12 8.12 5.42 5.42 5.42 5.962025 - 2029 10.40 10.40 8.66 8.66 8.66 5.78 5.78 5.78 6.352030 - 2034 10.82 10.82 9.02 9.02 9.02 6.01 6.01 6.01 6.612035 - 2039 11.44 11.44 9.53 9.53 9.53 6.36 6.36 6.36 6.99
Base Year AADT 8,290 285 6,491 6 1 344 97 71 7,627
Average Annual Daily TrafficYear 1 2 3 4 5 6 7 8 9 Total Total
C/J/V Pick-up Jeepneys S. Bus L. Bus Trucks 2-axle Trucks 3-axle Trucks 4-axle Mortercycle/Tricycle (1-8) (1-9)2015 8,290 285 6,491 6 1 344 97 71 7,627 15,584 23,2112016 9,036 311 6,978 6 1 361 102 74 8,047 16,869 24,9152017 9,849 339 7,501 7 1 379 107 78 8,489 18,260 26,7502018 10,735 369 8,063 7 1 398 112 82 8,956 19,769 28,7252019 11,702 402 8,668 8 1 418 118 86 9,449 21,403 30,8522020 12,755 439 9,318 9 1 439 124 90 9,968 23,174 33,1432021 13,998 481 10,075 9 1 463 130 95 10,563 25,254 35,8162022 15,363 528 10,893 10 2 488 137 100 11,192 27,522 38,7142023 16,861 580 11,777 11 2 515 145 105 11,859 29,996 41,8552024 18,505 636 12,734 12 2 542 153 111 12,566 32,695 45,2612025 20,309 698 13,768 13 2 572 161 117 13,315 35,640 48,9552026 22,421 771 14,960 14 2 605 170 124 14,160 39,068 53,2282027 24,753 851 16,256 15 2 640 180 131 15,060 42,829 57,8882028 27,328 940 17,663 16 3 677 191 139 16,016 46,956 62,9722029 30,170 1,038 19,193 18 3 716 202 147 17,033 51,485 68,5182030 33,307 1,146 20,855 19 3 757 213 155 18,114 56,456 74,5702031 36,911 1,269 22,736 21 3 803 226 164 19,312 62,135 81,4462032 40,905 1,407 24,787 23 4 851 240 174 20,588 68,390 88,9792033 45,331 1,559 27,023 25 4 902 254 185 21,949 75,283 97,2322034 50,236 1,728 29,460 27 4 956 269 196 23,400 82,877 106,2772035 55,671 1,915 32,118 30 5 1,014 285 208 24,947 91,245 116,1922036 62,040 2,134 35,179 33 5 1,078 304 221 26,690 100,993 127,6832037 69,137 2,378 38,531 36 6 1,147 323 235 28,556 111,792 140,3482038 77,046 2,650 42,203 39 6 1,220 343 250 30,552 123,758 154,3102039 85,861 2,953 46,225 43 7 1,298 365 266 32,688 137,017 169,7052040 95,683 3,291 50,630 47 7 1,380 389 283 34,973 151,710 186,682
Passenger Car U Passenger Car UnitPCEF 1 1 1.4 2.2 2.2 2.2 2.2 2.2 0.5 Total TotalYear C/J/V Pick-up Jeepneys S. Bus L. Bus Trucks 2-axle Trucks 3-axle Trucks 4-axle Motorcycle (1-6) (1-8)2015 8,290 285 9,087 13 2 757 213 155 3,814 18,802 22,6162016 9,036 311 9,769 14 2 795 224 163 4,023 20,313 24,3362017 9,849 339 10,501 15 2 835 235 171 4,245 21,947 26,1922018 10,735 369 11,289 16 3 876 247 180 4,478 23,715 28,1932019 11,702 402 12,135 18 3 920 259 189 4,724 25,628 30,3522020 12,755 439 13,046 19 3 966 272 198 4,984 27,697 32,6812021 13,998 481 14,105 20 3 1,019 287 209 5,281 30,122 35,4042022 15,363 528 15,250 22 4 1,074 302 220 5,596 32,763 38,3592023 16,861 580 16,488 24 4 1,132 319 232 5,930 35,640 41,5692024 18,505 636 17,827 26 4 1,193 336 244 6,283 38,773 45,0562025 20,309 698 19,275 28 4 1,258 354 258 6,657 42,185 48,8422026 22,421 771 20,944 30 5 1,331 375 273 7,080 46,150 53,2302027 24,753 851 22,758 33 5 1,408 396 288 7,530 50,493 58,0232028 27,328 940 24,729 36 6 1,489 419 305 8,008 55,251 63,2592029 30,170 1,038 26,870 39 6 1,575 443 323 8,516 60,464 68,9802030 33,307 1,146 29,197 42 7 1,666 469 341 9,057 66,176 75,2332031 36,911 1,269 31,831 46 7 1,766 497 362 9,656 72,690 82,3462032 40,905 1,407 34,702 50 8 1,872 527 384 10,294 79,855 90,1492033 45,331 1,559 37,832 55 9 1,985 559 407 10,975 87,736 98,7112034 50,236 1,728 41,245 60 9 2,104 592 431 11,700 96,405 108,1052035 55,671 1,915 44,965 65 10 2,231 628 457 12,473 105,942 118,4152036 62,040 2,134 49,250 72 11 2,372 668 486 13,345 117,033 130,3782037 69,137 2,378 53,943 78 12 2,523 710 517 14,278 129,300 143,5782038 77,046 2,650 59,084 86 14 2,684 756 550 15,276 142,869 158,1462039 85,861 2,953 64,715 94 15 2,855 804 585 16,344 157,881 174,2252040 95,683 3,291 70,882 103 16 3,036 855 622 17,486 174,488 191,975
306A1-1-305
The Urgent Development Study on the Project on Rehabilitation and Recovery from Typhoon Yolanda in the Philippines Final Report (II) Appendix Technical Supporting Report 1 (Volume 1, Chapter 2)

A - 25
Figure 2.2-6 Traffic Projections (Traffic Assignment Results),AADT and PCU/day (6)
Location Coca-Cola Jct - San Jose Rotonda (INC)Road Section: S00006LT Real St.
Traffic Growth Rate Factor (%)Year C/J/V Pick-up Jeepneys S. Bus L. Bus Trucks 2-axle Trucks 3-axle Trucks 4-axle Mortercycle/Tricycle
2015 - 2019 9.00 9.00 7.50 7.50 7.50 5.00 5.00 5.00 5.502020 - 2024 9.75 9.75 8.12 8.12 8.12 5.42 5.42 5.42 5.962025 - 2029 10.40 10.40 8.66 8.66 8.66 5.78 5.78 5.78 6.352030 - 2034 10.82 10.82 9.02 9.02 9.02 6.01 6.01 6.01 6.612035 - 2039 11.44 11.44 9.53 9.53 9.53 6.36 6.36 6.36 6.99
Base Year AADT 5,643 184 3,075 3 3 660 105 403 6,851
Average Annual Daily TrafficYear 1 2 3 4 5 6 7 8 9 Total Total
C/J/V Pick-up Jeepneys S. Bus L. Bus Trucks 2-axle Trucks 3-axle Trucks 4-axle Mortercycle/Tricycle (1-8) (1-9)2015 5,643 184 3,075 3 3 660 105 403 6,851 10,076 16,9272016 6,151 200 3,305 3 4 693 110 423 7,228 10,890 18,1182017 6,704 219 3,553 3 4 728 116 444 7,625 11,771 19,3972018 7,308 238 3,820 3 4 764 122 466 8,045 12,726 20,7702019 7,966 260 4,106 4 5 803 128 490 8,487 13,760 22,2472020 8,683 283 4,414 4 5 843 134 514 8,954 14,879 23,8332021 9,529 311 4,773 4 5 888 141 542 9,488 16,193 25,6812022 10,458 341 5,160 5 6 937 149 571 10,053 17,626 27,6792023 11,478 374 5,579 5 6 987 157 602 10,652 19,189 29,8412024 12,597 411 6,032 5 7 1,041 165 635 11,287 20,893 32,1802025 13,825 451 6,522 6 7 1,097 174 669 11,960 22,752 34,7122026 15,263 497 7,087 6 8 1,161 185 708 12,719 24,915 37,6342027 16,850 549 7,701 7 8 1,228 195 749 13,527 27,287 40,8142028 18,603 606 8,368 7 9 1,299 206 792 14,386 29,891 44,2772029 20,537 669 9,092 8 10 1,374 218 838 15,299 32,747 48,0472030 22,673 739 9,880 9 11 1,453 231 886 16,271 35,882 52,1532031 25,126 819 10,771 10 12 1,541 245 940 17,346 39,463 56,8092032 27,845 908 11,742 10 13 1,633 260 996 18,493 43,407 61,9002033 30,858 1,006 12,802 11 14 1,731 275 1,056 19,715 47,753 67,4692034 34,197 1,115 13,956 12 15 1,835 292 1,119 21,019 52,542 73,5612035 37,897 1,235 15,215 14 17 1,946 309 1,187 22,408 57,819 80,2272036 42,232 1,377 16,665 15 18 2,069 329 1,262 23,974 63,968 87,9422037 47,064 1,534 18,253 16 20 2,201 350 1,342 25,650 70,781 96,4312038 52,448 1,710 19,993 18 22 2,341 372 1,428 27,443 78,331 105,7742039 58,448 1,905 21,898 20 24 2,490 396 1,519 29,361 86,699 116,0602040 65,134 2,123 23,985 21 26 2,648 421 1,615 31,414 95,975 127,388
Passenger Car U Passenger Car UnitPCEF 1 1 1.4 2.2 2.2 2.2 2.2 2.2 0.5 Total TotalYear C/J/V Pick-up Jeepneys S. Bus L. Bus Trucks 2-axle Trucks 3-axle Trucks 4-axle Motorcycle (1-6) (1-8)2015 5,643 184 4,305 6 7 1,453 231 886 3,425 12,715 16,1402016 6,151 200 4,628 6 8 1,525 242 930 3,614 13,692 17,3062017 6,704 219 4,975 7 9 1,602 255 977 3,813 14,746 18,5592018 7,308 238 5,348 7 9 1,682 267 1,026 4,022 15,885 19,9082019 7,966 260 5,749 8 10 1,766 281 1,077 4,244 17,116 21,3592020 8,683 283 6,180 9 11 1,854 295 1,131 4,477 18,445 22,9222021 9,529 311 6,682 9 12 1,954 311 1,192 4,744 20,000 24,7442022 10,458 341 7,224 10 13 2,060 328 1,257 5,027 21,691 26,7172023 11,478 374 7,811 11 14 2,172 345 1,325 5,326 23,530 28,8562024 12,597 411 8,445 12 15 2,290 364 1,397 5,644 25,530 31,1732025 13,825 451 9,131 13 16 2,414 384 1,472 5,980 27,706 33,6852026 15,263 497 9,922 14 17 2,553 406 1,557 6,360 30,230 36,5902027 16,850 549 10,781 15 19 2,701 429 1,648 6,763 32,992 39,7562028 18,603 606 11,715 16 20 2,857 454 1,743 7,193 36,015 43,2082029 20,537 669 12,729 18 22 3,022 480 1,843 7,650 39,322 46,9722030 22,673 739 13,832 19 24 3,197 508 1,950 8,135 42,943 51,0782031 25,126 819 15,079 21 26 3,389 539 2,067 8,673 47,067 55,7402032 27,845 908 16,439 23 29 3,593 571 2,191 9,246 51,599 60,8462033 30,858 1,006 17,922 25 31 3,809 606 2,323 9,858 56,580 66,4372034 34,197 1,115 19,539 27 34 4,038 642 2,463 10,509 62,054 72,5632035 37,897 1,235 21,301 30 37 4,280 680 2,611 11,204 68,072 79,2762036 42,232 1,377 23,331 33 40 4,553 724 2,777 11,987 75,066 87,0542037 47,064 1,534 25,555 36 44 4,842 770 2,953 12,825 82,798 95,6232038 52,448 1,710 27,990 39 49 5,150 819 3,141 13,721 91,345 105,0672039 58,448 1,905 30,658 43 53 5,478 871 3,341 14,681 100,796 115,4772040 65,134 2,123 33,579 47 58 5,826 926 3,554 15,707 111,248 126,954
307A1-1-306
The Urgent Development Study on the Project on Rehabilitation and Recovery from Typhoon Yolanda in the Philippines Final Report (II) Appendix Technical Supporting Report 1 (Volume 1, Chapter 2)
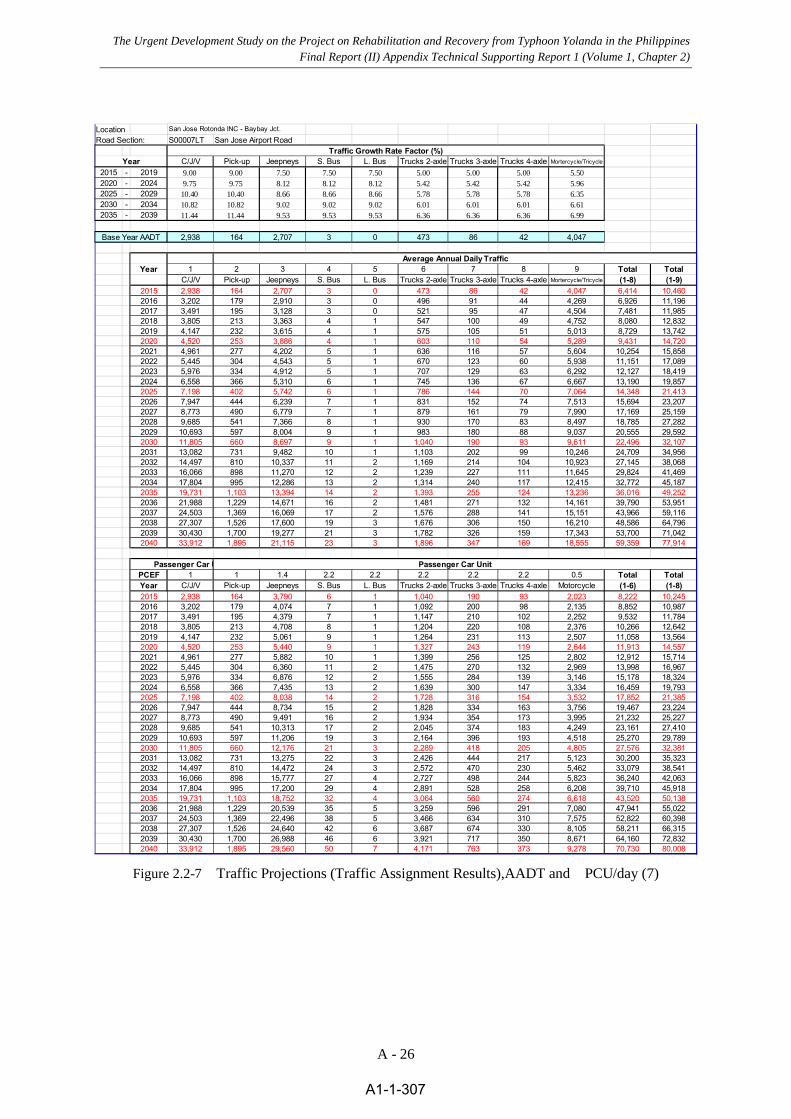
A - 26
Figure 2.2-7 Traffic Projections (Traffic Assignment Results),AADT and PCU/day (7)
Location San Jose Rotonda INC - Baybay Jct.Road Section: S00007LT San Jose Airport Road
Traffic Growth Rate Factor (%)Year C/J/V Pick-up Jeepneys S. Bus L. Bus Trucks 2-axle Trucks 3-axle Trucks 4-axle Mortercycle/Tricycle
2015 - 2019 9.00 9.00 7.50 7.50 7.50 5.00 5.00 5.00 5.502020 - 2024 9.75 9.75 8.12 8.12 8.12 5.42 5.42 5.42 5.962025 - 2029 10.40 10.40 8.66 8.66 8.66 5.78 5.78 5.78 6.352030 - 2034 10.82 10.82 9.02 9.02 9.02 6.01 6.01 6.01 6.612035 - 2039 11.44 11.44 9.53 9.53 9.53 6.36 6.36 6.36 6.99
Base Year AADT 2,938 164 2,707 3 0 473 86 42 4,047
Average Annual Daily TrafficYear 1 2 3 4 5 6 7 8 9 Total Total
C/J/V Pick-up Jeepneys S. Bus L. Bus Trucks 2-axle Trucks 3-axle Trucks 4-axle Mortercycle/Tricycle (1-8) (1-9)2015 2,938 164 2,707 3 0 473 86 42 4,047 6,414 10,4602016 3,202 179 2,910 3 0 496 91 44 4,269 6,926 11,1962017 3,491 195 3,128 3 0 521 95 47 4,504 7,481 11,9852018 3,805 213 3,363 4 1 547 100 49 4,752 8,080 12,8322019 4,147 232 3,615 4 1 575 105 51 5,013 8,729 13,7422020 4,520 253 3,886 4 1 603 110 54 5,289 9,431 14,7202021 4,961 277 4,202 5 1 636 116 57 5,604 10,254 15,8582022 5,445 304 4,543 5 1 670 123 60 5,938 11,151 17,0892023 5,976 334 4,912 5 1 707 129 63 6,292 12,127 18,4192024 6,558 366 5,310 6 1 745 136 67 6,667 13,190 19,8572025 7,198 402 5,742 6 1 786 144 70 7,064 14,348 21,4132026 7,947 444 6,239 7 1 831 152 74 7,513 15,694 23,2072027 8,773 490 6,779 7 1 879 161 79 7,990 17,169 25,1592028 9,685 541 7,366 8 1 930 170 83 8,497 18,785 27,2822029 10,693 597 8,004 9 1 983 180 88 9,037 20,555 29,5922030 11,805 660 8,697 9 1 1,040 190 93 9,611 22,496 32,1072031 13,082 731 9,482 10 1 1,103 202 99 10,246 24,709 34,9562032 14,497 810 10,337 11 2 1,169 214 104 10,923 27,145 38,0682033 16,066 898 11,270 12 2 1,239 227 111 11,645 29,824 41,4692034 17,804 995 12,286 13 2 1,314 240 117 12,415 32,772 45,1872035 19,731 1,103 13,394 14 2 1,393 255 124 13,236 36,016 49,2522036 21,988 1,229 14,671 16 2 1,481 271 132 14,161 39,790 53,9512037 24,503 1,369 16,069 17 2 1,576 288 141 15,151 43,966 59,1162038 27,307 1,526 17,600 19 3 1,676 306 150 16,210 48,586 64,7962039 30,430 1,700 19,277 21 3 1,782 326 159 17,343 53,700 71,0422040 33,912 1,895 21,115 23 3 1,896 347 169 18,555 59,359 77,914
Passenger Car U Passenger Car UnitPCEF 1 1 1.4 2.2 2.2 2.2 2.2 2.2 0.5 Total TotalYear C/J/V Pick-up Jeepneys S. Bus L. Bus Trucks 2-axle Trucks 3-axle Trucks 4-axle Motorcycle (1-6) (1-8)2015 2,938 164 3,790 6 1 1,040 190 93 2,023 8,222 10,2452016 3,202 179 4,074 7 1 1,092 200 98 2,135 8,852 10,9872017 3,491 195 4,379 7 1 1,147 210 102 2,252 9,532 11,7842018 3,805 213 4,708 8 1 1,204 220 108 2,376 10,266 12,6422019 4,147 232 5,061 9 1 1,264 231 113 2,507 11,058 13,5642020 4,520 253 5,440 9 1 1,327 243 119 2,644 11,913 14,5572021 4,961 277 5,882 10 1 1,399 256 125 2,802 12,912 15,7142022 5,445 304 6,360 11 2 1,475 270 132 2,969 13,998 16,9672023 5,976 334 6,876 12 2 1,555 284 139 3,146 15,178 18,3242024 6,558 366 7,435 13 2 1,639 300 147 3,334 16,459 19,7932025 7,198 402 8,038 14 2 1,728 316 154 3,532 17,852 21,3852026 7,947 444 8,734 15 2 1,828 334 163 3,756 19,467 23,2242027 8,773 490 9,491 16 2 1,934 354 173 3,995 21,232 25,2272028 9,685 541 10,313 17 2 2,045 374 183 4,249 23,161 27,4102029 10,693 597 11,206 19 3 2,164 396 193 4,518 25,270 29,7892030 11,805 660 12,176 21 3 2,289 418 205 4,805 27,576 32,3812031 13,082 731 13,275 22 3 2,426 444 217 5,123 30,200 35,3232032 14,497 810 14,472 24 3 2,572 470 230 5,462 33,079 38,5412033 16,066 898 15,777 27 4 2,727 498 244 5,823 36,240 42,0632034 17,804 995 17,200 29 4 2,891 528 258 6,208 39,710 45,9182035 19,731 1,103 18,752 32 4 3,064 560 274 6,618 43,520 50,1382036 21,988 1,229 20,539 35 5 3,259 596 291 7,080 47,941 55,0222037 24,503 1,369 22,496 38 5 3,466 634 310 7,575 52,822 60,3982038 27,307 1,526 24,640 42 6 3,687 674 330 8,105 58,211 66,3152039 30,430 1,700 26,988 46 6 3,921 717 350 8,671 64,160 72,8322040 33,912 1,895 29,560 50 7 4,171 763 373 9,278 70,730 80,008
308A1-1-307
The Urgent Development Study on the Project on Rehabilitation and Recovery from Typhoon Yolanda in the Philippines Final Report (II) Appendix Technical Supporting Report 1 (Volume 1, Chapter 2)
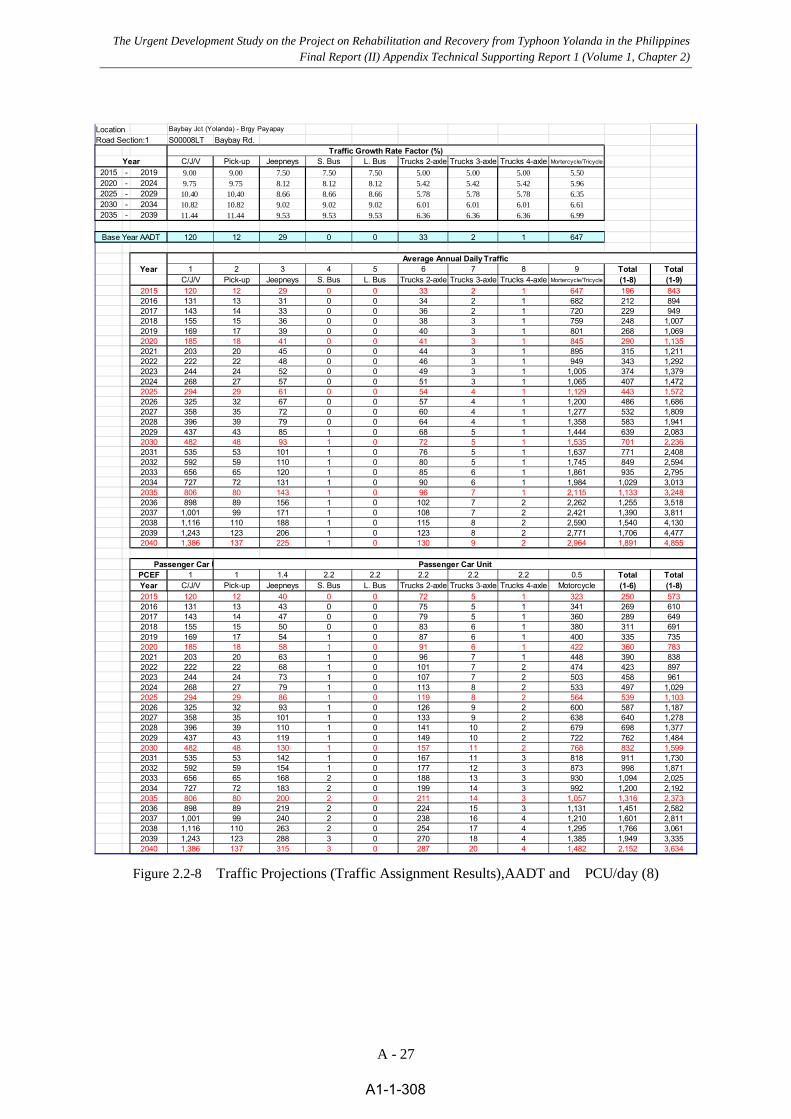
A - 27
Figure 2.2-8 Traffic Projections (Traffic Assignment Results),AADT and PCU/day (8)
Location Baybay Jct (Yolanda) - Brgy PayapayRoad Section:1 S00008LT Baybay Rd.
Traffic Growth Rate Factor (%)Year C/J/V Pick-up Jeepneys S. Bus L. Bus Trucks 2-axle Trucks 3-axle Trucks 4-axle Mortercycle/Tricycle
2015 - 2019 9.00 9.00 7.50 7.50 7.50 5.00 5.00 5.00 5.502020 - 2024 9.75 9.75 8.12 8.12 8.12 5.42 5.42 5.42 5.962025 - 2029 10.40 10.40 8.66 8.66 8.66 5.78 5.78 5.78 6.352030 - 2034 10.82 10.82 9.02 9.02 9.02 6.01 6.01 6.01 6.612035 - 2039 11.44 11.44 9.53 9.53 9.53 6.36 6.36 6.36 6.99
Base Year AADT 120 12 29 0 0 33 2 1 647
Average Annual Daily TrafficYear 1 2 3 4 5 6 7 8 9 Total Total
C/J/V Pick-up Jeepneys S. Bus L. Bus Trucks 2-axle Trucks 3-axle Trucks 4-axle Mortercycle/Tricycle (1-8) (1-9)2015 120 12 29 0 0 33 2 1 647 196 8432016 131 13 31 0 0 34 2 1 682 212 8942017 143 14 33 0 0 36 2 1 720 229 9492018 155 15 36 0 0 38 3 1 759 248 1,0072019 169 17 39 0 0 40 3 1 801 268 1,0692020 185 18 41 0 0 41 3 1 845 290 1,1352021 203 20 45 0 0 44 3 1 895 315 1,2112022 222 22 48 0 0 46 3 1 949 343 1,2922023 244 24 52 0 0 49 3 1 1,005 374 1,3792024 268 27 57 0 0 51 3 1 1,065 407 1,4722025 294 29 61 0 0 54 4 1 1,129 443 1,5722026 325 32 67 0 0 57 4 1 1,200 486 1,6862027 358 35 72 0 0 60 4 1 1,277 532 1,8092028 396 39 79 0 0 64 4 1 1,358 583 1,9412029 437 43 85 1 0 68 5 1 1,444 639 2,0832030 482 48 93 1 0 72 5 1 1,535 701 2,2362031 535 53 101 1 0 76 5 1 1,637 771 2,4082032 592 59 110 1 0 80 5 1 1,745 849 2,5942033 656 65 120 1 0 85 6 1 1,861 935 2,7952034 727 72 131 1 0 90 6 1 1,984 1,029 3,0132035 806 80 143 1 0 96 7 1 2,115 1,133 3,2482036 898 89 156 1 0 102 7 2 2,262 1,255 3,5182037 1,001 99 171 1 0 108 7 2 2,421 1,390 3,8112038 1,116 110 188 1 0 115 8 2 2,590 1,540 4,1302039 1,243 123 206 1 0 123 8 2 2,771 1,706 4,4772040 1,386 137 225 1 0 130 9 2 2,964 1,891 4,855
Passenger Car U Passenger Car UnitPCEF 1 1 1.4 2.2 2.2 2.2 2.2 2.2 0.5 Total TotalYear C/J/V Pick-up Jeepneys S. Bus L. Bus Trucks 2-axle Trucks 3-axle Trucks 4-axle Motorcycle (1-6) (1-8)2015 120 12 40 0 0 72 5 1 323 250 5732016 131 13 43 0 0 75 5 1 341 269 6102017 143 14 47 0 0 79 5 1 360 289 6492018 155 15 50 0 0 83 6 1 380 311 6912019 169 17 54 1 0 87 6 1 400 335 7352020 185 18 58 1 0 91 6 1 422 360 7832021 203 20 63 1 0 96 7 1 448 390 8382022 222 22 68 1 0 101 7 2 474 423 8972023 244 24 73 1 0 107 7 2 503 458 9612024 268 27 79 1 0 113 8 2 533 497 1,0292025 294 29 86 1 0 119 8 2 564 539 1,1032026 325 32 93 1 0 126 9 2 600 587 1,1872027 358 35 101 1 0 133 9 2 638 640 1,2782028 396 39 110 1 0 141 10 2 679 698 1,3772029 437 43 119 1 0 149 10 2 722 762 1,4842030 482 48 130 1 0 157 11 2 768 832 1,5992031 535 53 142 1 0 167 11 3 818 911 1,7302032 592 59 154 1 0 177 12 3 873 998 1,8712033 656 65 168 2 0 188 13 3 930 1,094 2,0252034 727 72 183 2 0 199 14 3 992 1,200 2,1922035 806 80 200 2 0 211 14 3 1,057 1,316 2,3732036 898 89 219 2 0 224 15 3 1,131 1,451 2,5822037 1,001 99 240 2 0 238 16 4 1,210 1,601 2,8112038 1,116 110 263 2 0 254 17 4 1,295 1,766 3,0612039 1,243 123 288 3 0 270 18 4 1,385 1,949 3,3352040 1,386 137 315 3 0 287 20 4 1,482 2,152 3,634
309A1-1-308
The Urgent Development Study on the Project on Rehabilitation and Recovery from Typhoon Yolanda in the Philippines Final Report (II) Appendix Technical Supporting Report 1 (Volume 1, Chapter 2)

A - 28
Figure 2.2-9 Traffic Projections (Traffic Assignment Results),AADT and PCU/day (9)
Location Macarthur Park (Bridge Payapay) - Brgy. San Fernando, PaloRoad Section: S00009LT Manlurip Rd.-1
Traffic Growth Rate Factor (%)Year C/J/V Pick-up Jeepneys S. Bus L. Bus Trucks 2-axle Trucks 3-axle Trucks 4-axle Mortercycle/Tricycle
2015 - 2019 9.00 9.00 7.50 7.50 7.50 5.00 5.00 5.00 5.502020 - 2024 9.75 9.75 8.12 8.12 8.12 5.42 5.42 5.42 5.962025 - 2029 10.40 10.40 8.66 8.66 8.66 5.78 5.78 5.78 6.352030 - 2034 10.82 10.82 9.02 9.02 9.02 6.01 6.01 6.01 6.612035 - 2039 11.44 11.44 9.53 9.53 9.53 6.36 6.36 6.36 6.99
Base Year AADT 3,171 149 98 2 1 309 161 25 5,457
Average Annual Daily TrafficYear 1 2 3 4 5 6 7 8 9 Total Total
C/J/V Pick-up Jeepneys S. Bus L. Bus Trucks 2-axle Trucks 3-axle Trucks 4-axle Mortercycle/Tricycle (1-8) (1-9)2015 3,171 149 98 2 1 309 161 25 5,457 3,915 9,3722016 3,456 162 105 2 1 324 169 26 5,757 4,246 10,0032017 3,767 177 113 2 1 340 177 28 6,074 4,605 10,6792018 4,106 193 121 2 1 357 186 29 6,408 4,996 11,4042019 4,476 210 130 3 1 375 195 30 6,761 5,421 12,1822020 4,879 229 140 3 1 394 205 32 7,132 5,883 13,0152021 5,354 251 152 3 1 415 216 34 7,557 6,427 13,9842022 5,876 276 164 3 1 438 228 35 8,008 7,022 15,0302023 6,449 303 177 3 1 462 240 37 8,485 7,674 16,1592024 7,078 332 192 4 2 487 253 39 8,991 8,387 17,3782025 7,768 365 207 4 2 513 267 42 9,527 9,168 18,6952026 8,576 403 225 4 2 543 283 44 10,132 10,080 20,2112027 9,468 445 245 5 2 574 299 46 10,775 11,084 21,8592028 10,453 491 266 5 2 607 316 49 11,459 12,189 23,6492029 11,540 542 289 6 2 642 335 52 12,187 13,408 25,5942030 12,740 598 314 6 3 679 354 55 12,961 14,749 27,7102031 14,119 663 342 7 3 720 375 58 13,817 16,287 30,1042032 15,646 735 373 7 3 764 398 62 14,731 17,987 32,7182033 17,339 814 407 8 3 809 422 66 15,705 19,868 35,5722034 19,215 902 444 9 4 858 447 69 16,743 21,948 38,6902035 21,294 1,000 484 9 4 910 474 74 17,849 24,248 42,0972036 23,730 1,114 530 10 4 968 504 78 19,097 26,938 46,0352037 26,445 1,242 580 11 5 1,029 536 83 20,432 29,931 50,3632038 29,470 1,384 635 12 5 1,095 570 89 21,860 33,260 55,1202039 32,842 1,542 696 13 6 1,164 606 94 23,388 36,964 60,3522040 36,599 1,718 762 15 6 1,238 645 100 25,023 41,084 66,107
Passenger Car U Passenger Car UnitPCEF 1 1 1.4 2.2 2.2 2.2 2.2 2.2 0.5 Total TotalYear C/J/V Pick-up Jeepneys S. Bus L. Bus Trucks 2-axle Trucks 3-axle Trucks 4-axle Motorcycle (1-6) (1-8)2015 3,171 149 137 4 2 679 354 55 2,729 4,550 7,2792016 3,456 162 147 4 2 713 371 58 2,879 4,914 7,7932017 3,767 177 158 5 2 749 390 61 3,037 5,309 8,3462018 4,106 193 170 5 2 786 409 64 3,204 5,736 8,9402019 4,476 210 183 6 2 826 430 67 3,380 6,199 9,5792020 4,879 229 196 6 3 867 451 70 3,566 6,701 10,2672021 5,354 251 212 6 3 914 476 74 3,779 7,291 11,0702022 5,876 276 230 7 3 963 502 78 4,004 7,935 11,9392023 6,449 303 248 8 3 1,016 529 82 4,243 8,638 12,8812024 7,078 332 268 8 4 1,071 558 87 4,495 9,405 13,9012025 7,768 365 290 9 4 1,129 588 91 4,763 10,244 15,0072026 8,576 403 315 10 4 1,194 622 97 5,066 11,220 16,2862027 9,468 445 343 10 4 1,263 658 102 5,388 12,293 17,6812028 10,453 491 372 11 5 1,336 696 108 5,730 13,472 19,2022029 11,540 542 405 12 5 1,413 736 114 6,093 14,767 20,8612030 12,740 598 440 13 6 1,495 779 121 6,480 16,191 22,6722031 14,119 663 479 15 6 1,585 825 128 6,909 17,820 24,7282032 15,646 735 522 16 7 1,680 875 136 7,365 19,617 26,9822033 17,339 814 570 17 7 1,781 927 144 7,852 21,600 29,4522034 19,215 902 621 19 8 1,888 983 153 8,371 23,789 32,1602035 21,294 1,000 677 21 9 2,001 1,042 162 8,925 26,206 35,1312036 23,730 1,114 741 22 10 2,129 1,109 172 9,548 29,028 38,5762037 26,445 1,242 812 25 11 2,264 1,179 183 10,216 32,160 42,3762038 29,470 1,384 889 27 12 2,408 1,254 195 10,930 35,639 46,5692039 32,842 1,542 974 30 13 2,561 1,334 207 11,694 39,503 51,1972040 36,599 1,718 1,067 32 14 2,724 1,419 221 12,511 43,794 56,305
310A1-1-309
The Urgent Development Study on the Project on Rehabilitation and Recovery from Typhoon Yolanda in the Philippines Final Report (II) Appendix Technical Supporting Report 1 (Volume 1, Chapter 2)

A - 29
Figure 2.2-10 Traffic Projections (Traffic Assignment Results),AADT and PCU/day (10)
Location Brgy. San Fernando, Baras - Jct. Guindapunan-Salvacion RoadRoad Section: S00010LT Manlurip Rd.-2
Traffic Growth Rate Factor (%)Year C/J/V Pick-up Jeepneys S. Bus L. Bus Trucks 2-axle Trucks 3-axle Trucks 4-axle Mortercycle/Tricycle
2015 - 2019 9.00 9.00 7.50 7.50 7.50 5.00 5.00 5.00 5.502020 - 2024 9.75 9.75 8.12 8.12 8.12 5.42 5.42 5.42 5.962025 - 2029 10.40 10.40 8.66 8.66 8.66 5.78 5.78 5.78 6.352030 - 2034 10.82 10.82 9.02 9.02 9.02 6.01 6.01 6.01 6.612035 - 2039 11.44 11.44 9.53 9.53 9.53 6.36 6.36 6.36 6.99
Base Year AADT 1,910 150 98 2 0 369 94 23 4,285
Average Annual Daily TrafficYear 1 2 3 4 5 6 7 8 9 Total Total
C/J/V Pick-up Jeepneys S. Bus L. Bus Trucks 2-axle Trucks 3-axle Trucks 4-axle Mortercycle/Tricycle (1-8) (1-9)2015 1,910 150 98 2 0 369 94 23 4,285 2,646 6,9312016 2,082 164 105 2 0 387 98 24 4,521 2,863 7,3842017 2,269 178 113 2 0 407 103 25 4,769 3,099 7,8682018 2,474 195 121 3 0 427 108 27 5,032 3,355 8,3862019 2,696 212 130 3 0 449 114 28 5,308 3,632 8,9412020 2,939 231 140 3 0 471 120 29 5,600 3,934 9,5342021 3,226 254 152 3 0 496 126 31 5,934 4,288 10,2222022 3,540 278 164 3 0 523 133 33 6,288 4,675 10,9632023 3,885 306 177 4 0 552 140 34 6,662 5,099 11,7612024 4,264 335 192 4 1 582 148 36 7,060 5,561 12,6212025 4,680 368 207 4 1 613 156 38 7,480 6,067 13,5472026 5,167 406 225 5 1 649 165 40 7,955 6,657 14,6122027 5,704 449 245 5 1 686 174 43 8,460 7,306 15,7672028 6,297 495 266 6 1 726 184 45 8,998 8,020 17,0182029 6,952 547 289 6 1 768 195 48 9,569 8,805 18,3742030 7,675 604 314 7 1 812 206 51 10,177 9,669 19,8462031 8,505 669 342 7 1 861 219 54 10,849 10,658 21,5072032 9,426 741 373 8 1 913 232 57 11,567 11,750 23,3172033 10,446 821 407 9 1 967 246 60 12,331 12,957 25,2882034 11,576 910 444 9 1 1,026 260 64 13,146 14,290 27,4362035 12,828 1,009 484 10 1 1,087 276 68 14,015 15,763 29,7782036 14,296 1,124 530 11 1 1,156 294 72 14,995 17,484 32,4792037 15,931 1,253 580 12 2 1,230 312 77 16,043 19,397 35,4402038 17,754 1,396 635 13 2 1,308 332 82 17,164 21,522 38,6872039 19,785 1,556 696 15 2 1,391 353 87 18,364 23,884 42,2492040 22,048 1,734 762 16 2 1,480 376 92 19,648 26,510 46,158
Passenger Car U Passenger Car UnitPCEF 1 1 1.4 2.2 2.2 2.2 2.2 2.2 0.5 Total TotalYear C/J/V Pick-up Jeepneys S. Bus L. Bus Trucks 2-axle Trucks 3-axle Trucks 4-axle Motorcycle (1-6) (1-8)2015 1,910 150 137 5 1 812 206 51 2,142 3,271 5,4132016 2,082 164 147 5 1 852 216 53 2,260 3,520 5,7812017 2,269 178 158 5 1 895 227 56 2,385 3,790 6,1752018 2,474 195 170 6 1 940 239 59 2,516 4,082 6,5972019 2,696 212 183 6 1 987 251 62 2,654 4,397 7,0512020 2,939 231 196 6 1 1,036 263 65 2,800 4,738 7,5382021 3,226 254 212 7 1 1,092 277 68 2,967 5,137 8,1042022 3,540 278 230 8 1 1,151 292 72 3,144 5,572 8,7162023 3,885 306 248 8 1 1,214 308 76 3,331 6,046 9,3772024 4,264 335 268 9 1 1,280 325 80 3,530 6,562 10,0922025 4,680 368 290 10 1 1,349 343 84 3,740 7,125 10,8652026 5,167 406 315 10 1 1,427 362 89 3,978 7,778 11,7562027 5,704 449 343 11 1 1,509 383 94 4,230 8,495 12,7252028 6,297 495 372 12 2 1,597 406 100 4,499 9,280 13,7792029 6,952 547 405 13 2 1,689 429 105 4,785 10,141 14,9262030 7,675 604 440 15 2 1,787 454 111 5,088 11,086 16,1752031 8,505 669 479 16 2 1,894 481 118 5,425 12,164 17,5892032 9,426 741 522 17 2 2,008 510 125 5,783 13,352 19,1352033 10,446 821 570 19 2 2,128 541 133 6,166 14,659 20,8252034 11,576 910 621 21 3 2,256 573 141 6,573 16,100 22,6732035 12,828 1,009 677 22 3 2,392 608 149 7,008 17,688 24,6952036 14,296 1,124 741 25 3 2,544 646 159 7,497 19,538 27,0352037 15,931 1,253 812 27 4 2,706 687 169 8,021 21,588 29,6102038 17,754 1,396 889 29 4 2,878 731 179 8,582 23,861 32,4432039 19,785 1,556 974 32 4 3,061 777 191 9,182 26,381 35,5632040 22,048 1,734 1,067 35 5 3,256 827 203 9,824 29,174 38,998
311A1-1-310
The Urgent Development Study on the Project on Rehabilitation and Recovery from Typhoon Yolanda in the Philippines Final Report (II) Appendix Technical Supporting Report 1 (Volume 1, Chapter 2)

A - 30
Figure 2.2-11 Traffic Projections (Traffic Assignment Results),AADT and PCU/day (11)
Location National Highway - Brgy. GuindapunanRoad Section: S00011LT Manlurip Rd.-3
Traffic Growth Rate Factor (%)Year C/J/V Pick-up Jeepneys S. Bus L. Bus Trucks 2-axle Trucks 3-axle Trucks 4-axle Mortercycle/Tricycle
2015 - 2019 9.00 9.00 7.50 7.50 7.50 5.00 5.00 5.00 5.502020 - 2024 9.75 9.75 8.12 8.12 8.12 5.42 5.42 5.42 5.962025 - 2029 10.40 10.40 8.66 8.66 8.66 5.78 5.78 5.78 6.352030 - 2034 10.82 10.82 9.02 9.02 9.02 6.01 6.01 6.01 6.612035 - 2039 11.44 11.44 9.53 9.53 9.53 6.36 6.36 6.36 6.99
Base Year AADT 1,995 111 177 2 2 510 110 11 4,216
Average Annual Daily TrafficYear 1 2 3 4 5 6 7 8 9 Total Total
C/J/V Pick-up Jeepneys S. Bus L. Bus Trucks 2-axle Trucks 3-axle Trucks 4-axle Mortercycle/Tricycle (1-8) (1-9)2015 1,995 111 177 2 2 510 110 11 4,216 2,918 7,1342016 2,175 121 191 2 2 535 116 11 4,448 3,153 7,6002017 2,370 132 205 3 2 562 122 12 4,692 3,407 8,0992018 2,584 143 220 3 2 590 128 12 4,950 3,683 8,6332019 2,816 156 237 3 2 619 134 13 5,223 3,981 9,2042020 3,070 170 255 3 3 650 141 14 5,510 4,305 9,8152021 3,369 187 275 3 3 686 148 14 5,838 4,686 10,5242022 3,698 205 298 4 3 723 157 15 6,186 5,102 11,2882023 4,058 225 322 4 3 762 165 16 6,555 5,555 12,1102024 4,454 247 348 4 3 803 174 17 6,946 6,051 12,9962025 4,888 271 376 5 4 847 183 18 7,360 6,592 13,9512026 5,396 299 409 5 4 896 194 19 7,827 7,222 15,0492027 5,958 331 444 6 4 948 205 20 8,324 7,915 16,2392028 6,577 365 482 6 5 1,002 217 21 8,852 8,676 17,5292029 7,261 403 524 7 5 1,060 230 22 9,415 9,512 18,9272030 8,016 445 570 7 6 1,122 243 24 10,012 10,432 20,4442031 8,884 493 621 8 6 1,189 257 25 10,674 11,483 22,1572032 9,845 546 677 9 7 1,261 273 27 11,380 12,644 24,0232033 10,910 605 738 9 7 1,336 289 28 12,132 13,924 26,0562034 12,091 671 805 10 8 1,417 307 30 12,934 15,337 28,2712035 13,399 743 877 11 9 1,502 325 32 13,789 16,898 30,6872036 14,932 828 961 12 10 1,597 346 34 14,753 18,719 33,4722037 16,640 923 1,052 13 10 1,699 368 36 15,784 20,742 36,5262038 18,544 1,029 1,153 14 11 1,807 391 38 16,887 22,987 39,8742039 20,665 1,146 1,263 16 13 1,922 416 41 18,068 25,481 43,5492040 23,029 1,278 1,383 17 14 2,044 443 43 19,331 28,250 47,581
Passenger Car U Passenger Car UnitPCEF 1 1 1.4 2.2 2.2 2.2 2.2 2.2 0.5 Total TotalYear C/J/V Pick-up Jeepneys S. Bus L. Bus Trucks 2-axle Trucks 3-axle Trucks 4-axle Motorcycle (1-6) (1-8)2015 1,995 111 248 5 4 1,121 243 24 2,108 3,751 5,8582016 2,175 121 267 5 4 1,177 255 25 2,224 4,029 6,2532017 2,370 132 287 6 4 1,236 268 26 2,346 4,329 6,6752018 2,584 143 308 6 5 1,298 281 27 2,475 4,653 7,1282019 2,816 156 331 7 5 1,363 295 29 2,611 5,003 7,6142020 3,070 170 356 7 6 1,431 310 30 2,755 5,380 8,1352021 3,369 187 385 8 6 1,509 327 32 2,919 5,822 8,7412022 3,698 205 417 8 7 1,590 344 34 3,093 6,302 9,3952023 4,058 225 450 9 7 1,677 363 35 3,277 6,824 10,1022024 4,454 247 487 10 8 1,767 383 37 3,473 7,392 10,8652025 4,888 271 526 10 8 1,863 403 39 3,680 8,010 11,6902026 5,396 299 572 11 9 1,971 427 42 3,913 8,727 12,6412027 5,958 331 622 12 10 2,085 451 44 4,162 9,512 13,6742028 6,577 365 675 13 11 2,205 478 47 4,426 10,371 14,7972029 7,261 403 734 14 11 2,333 505 49 4,707 11,311 16,0182030 8,016 445 797 16 12 2,468 534 52 5,006 12,341 17,3472031 8,884 493 869 17 14 2,616 566 55 5,337 13,514 18,8512032 9,845 546 948 19 15 2,773 601 58 5,690 14,805 20,4952033 10,910 605 1,033 20 16 2,940 637 62 6,066 16,224 22,2902034 12,091 671 1,127 22 18 3,116 675 66 6,467 17,785 24,2522035 13,399 743 1,228 24 19 3,304 715 70 6,894 19,503 26,3972036 14,932 828 1,345 27 21 3,514 761 74 7,376 21,502 28,8782037 16,640 923 1,473 29 23 3,737 809 79 7,892 23,714 31,6062038 18,544 1,029 1,614 32 25 3,975 861 84 8,444 26,163 34,6072039 20,665 1,146 1,768 35 28 4,228 916 89 9,034 28,874 37,9082040 23,029 1,278 1,936 38 30 4,497 974 95 9,665 31,877 41,542
312A1-1-311
The Urgent Development Study on the Project on Rehabilitation and Recovery from Typhoon Yolanda in the Philippines Final Report (II) Appendix Technical Supporting Report 1 (Volume 1, Chapter 2)

A - 31
Figure 2.2-12 Traffic Projections (Traffic Assignment Results),AADT and PCU/day (12)
Palo East By-Pass Road,
S00012LT Palo East By-Pass Road, Traffic Growth Rate Factor (%)
Year C/J/V Pick-up Jeepneys S. Bus L. Bus Trucks 2-axle Trucks 3-axle Trucks 4-axle Mortercycle/Tricycle
- 2019 9.00 9.00 7.50 7.50 7.50 5.00 5.00 5.00 5.50- 2024 9.75 9.75 8.12 8.12 8.12 5.42 5.42 5.42 5.96- 2029 10.40 10.40 8.66 8.66 8.66 5.78 5.78 5.78 6.35- 2034 10.82 10.82 9.02 9.02 9.02 6.01 6.01 6.01 6.61- 2039 11.44 11.44 9.53 9.53 9.53 6.36 6.36 6.36 6.99
Year AADT 2,563 142 170 2 2 724 175 149 3,836
Average Annual Daily TrafficYear 1 2 3 4 5 6 7 8 9 Total Total
C/J/V Pick-up Jeepneys S. Bus L. Bus Trucks 2-axle Trucks 3-axle Trucks 4-axle Mortercycle/Tricycle (1-8) (1-9)2015 2,563 142 170 2 2 724 175 149 3,836 3,926 7,7622016 2,793 155 183 2 2 760 184 156 4,047 4,235 8,2822017 3,045 169 197 2 3 798 193 164 4,269 4,569 8,8392018 3,319 184 211 2 3 838 203 172 4,504 4,931 9,4352019 3,617 201 227 2 3 880 213 181 4,752 5,324 10,0752020 3,943 219 244 2 3 924 223 190 5,013 5,748 10,7612021 4,327 240 264 2 3 974 236 200 5,312 6,247 11,5592022 4,749 264 286 3 4 1,027 248 211 5,628 6,790 12,4192023 5,212 289 309 3 4 1,082 262 222 5,964 7,383 13,3472024 5,721 318 334 3 4 1,141 276 234 6,319 8,030 14,3502025 6,278 349 361 3 5 1,203 291 247 6,696 8,736 15,4322026 6,931 385 392 4 5 1,272 308 261 7,121 9,558 16,6792027 7,652 425 426 4 5 1,346 326 276 7,573 10,460 18,0332028 8,448 469 463 4 6 1,423 344 292 8,054 11,450 19,5052029 9,327 518 503 5 6 1,506 364 309 8,566 12,538 21,1032030 10,297 572 547 5 7 1,593 385 327 9,110 13,732 22,8422031 11,411 634 596 5 8 1,688 408 346 9,712 15,097 24,8092032 12,646 702 650 6 8 1,790 433 367 10,354 16,602 26,9562033 14,014 778 708 6 9 1,898 459 389 11,038 18,262 29,3002034 15,530 863 772 7 10 2,012 487 413 11,768 20,093 31,8602035 17,210 956 842 8 11 2,132 516 438 12,545 22,112 34,6582036 19,179 1,065 922 8 12 2,268 549 465 13,422 24,469 37,8912037 21,373 1,187 1,010 9 13 2,412 584 495 14,361 27,083 41,4442038 23,818 1,323 1,106 10 14 2,566 621 526 15,364 29,985 45,3492039 26,543 1,474 1,212 11 15 2,729 660 560 16,438 33,205 49,6432040 29,580 1,643 1,327 12 17 2,903 702 596 17,587 36,779 54,367
Passenger Car U Passenger Car UnitPCEF 1 1 1.4 2.2 2.2 2.2 2.2 2.2 0.5 Total TotalYear C/J/V Pick-up Jeepneys S. Bus L. Bus Trucks 2-axle Trucks 3-axle Trucks 4-axle Motorcycle (1-6) (1-8)2015 2,563 142 238 3 5 1,592 385 327 1,918 5,255 7,1732016 2,793 155 256 4 5 1,672 404 343 2,023 5,633 7,6562017 3,045 169 275 4 6 1,755 425 360 2,135 6,039 8,1732018 3,319 184 296 4 6 1,843 446 378 2,252 6,476 8,7282019 3,617 201 318 5 6 1,935 468 397 2,376 6,948 9,3242020 3,943 219 342 5 7 2,032 492 417 2,507 7,456 9,9632021 4,327 240 370 5 7 2,142 518 440 2,656 8,050 10,7062022 4,749 264 400 6 8 2,258 546 463 2,814 8,695 11,5092023 5,212 289 432 6 9 2,381 576 489 2,982 9,394 12,3762024 5,721 318 467 7 9 2,510 607 515 3,160 10,154 13,3132025 6,278 349 505 7 10 2,646 640 543 3,348 10,978 14,3262026 6,931 385 549 8 11 2,799 677 574 3,561 11,934 15,4952027 7,652 425 597 9 12 2,960 716 607 3,787 12,978 16,7652028 8,448 469 648 9 13 3,132 758 643 4,027 14,119 18,1472029 9,327 518 704 10 14 3,313 801 680 4,283 15,367 19,6502030 10,297 572 765 11 15 3,504 848 719 4,555 16,731 21,2862031 11,411 634 834 12 17 3,715 899 762 4,856 18,283 23,1392032 12,646 702 910 13 18 3,938 953 808 5,177 19,987 25,1642033 14,014 778 992 14 20 4,175 1,010 857 5,519 21,859 27,3782034 15,530 863 1,081 15 22 4,425 1,070 908 5,884 23,915 29,7992035 17,210 956 1,179 17 24 4,691 1,135 963 6,273 26,174 32,4472036 19,179 1,065 1,291 18 26 4,990 1,207 1,024 6,711 28,800 35,5122037 21,373 1,187 1,414 20 28 5,307 1,284 1,089 7,180 31,703 38,8832038 23,818 1,323 1,549 22 31 5,645 1,365 1,158 7,682 34,912 42,5942039 26,543 1,474 1,696 24 34 6,004 1,452 1,232 8,219 38,460 46,6792040 29,580 1,643 1,858 26 37 6,386 1,545 1,310 8,794 42,385 51,179
313A1-1-312
The Urgent Development Study on the Project on Rehabilitation and Recovery from Typhoon Yolanda in the Philippines Final Report (II) Appendix Technical Supporting Report 1 (Volume 1, Chapter 2)