Embed Size (px)
Citation preview

116
CHAPTER 5 An Assessment of Program Impacts
KEY MESSAGES
A review of evaluations of 80 programs in 37 countries shows that a broad range of economic inclusion programs have shown promising and potentially sustained impact on a wide range of outcomes. A bundled set of interventions shows greater impact on income, assets, and savings relative to stand-alone interventions .
The discussion on program impact needs to be rebalanced to reflect the shifting landscape from stand-alone nonprofit-led programs to government-led programs. The evidence from nonprofit-led programs is indicative of persistent impact, support-ing the hypothesis that economic inclusion programming can potentially launch the extreme poor into an upward trajectory . Evidence on impact at scale is also cautiously positive . As government-led economic inclusion programs continue to be embedded in broader social policy, community spillover effects will become increasingly important, and beneficiaries will likely benefit from complementary programs or refresher interven-tions to sustain income growth .
Although there is a strong evidence base, it does not yet go far enough in address-ing several ongoing debates in economic inclusion programming. A number of critical knowledge gaps constrain evidence-based program design and delivery .
FUTURE DIRECTIONS
The next wave of evaluations looks set to focus on government programs at scale and will help isolate the mechanisms of impact of economic inclusion programming across entry points and for different groups. This will have important operational implications for identifying cost-effective bundles of interventions and lessons on the effectiveness of different delivery models .
A critical learning agenda is emerging to help address evidence gaps. These include complementing impact evaluations with real-time operational research, program- monitoring assessments, and qualitative fieldwork to identify opportunities to enhance program performance .
There is a need for a more systematic evidence base, using comparable outcomes and indicators to conclusively establish the overall impact of the government-led economic inclusion programs at scale. In the coming years, a meta-analysis of the impact evidence will be an important contribution to the policy debate on the feasibility and sustainability of scaling up economic inclusion programming .

T H E S T A T E O F E C O N O M I C I N C L U S I O N R E P O R T 2 0 2 1 : T H E P O T E N T I A L T O S C A L E
117
Introduction
Optimism about economic inclusion programming to improve income and resil-ience of the extreme poor is warranted. There is a large and growing body of research on the impact of these programs, especially those whose entry point
is based on advancing livelihoods and jobs (L&J). The initial evidence base was driven primarily by programs led by nongovernmental organizations (NGOs). In particular, the evaluation of pilot projects modeled after BRAC’s Targeting the Ultra Poor (TUP) program, conducted by the Ford Foundation and the Consultative Group to Assist the Poor (CGAP) in six countries, made a significant contribution to the evidence base in diverse contexts (Banerjee et al. 2015). Subsequently, the evidence base has broad-ened to include a number of government-led programs, whose evidence typically had not been considered in discussions of economic inclusion because it is often trapped in sectoral silos. In this review, evidence is synthesized from a range of sectors, covering evaluations of both NGO-led and government-led programs in the past decade. While the diversity in program design and in evaluations makes comparative analysis of impact challenging, this synthesis provides a resource on the state of knowledge on the impact of economic inclusion programming.1
However, the evidence presented here does not go far enough in addressing several ongoing debates in economic inclusion programming. This is an inevitable gap as the evidence catches up with country implementation. This chapter highlights critical gaps in understanding the mechanisms and drivers of impact, especially for large-scale programs with social safety nets (SSNs) and financial inclusion (FI) as entry points for different groups. The evaluations of NGO-led programs remain the first wave of knowl-edge, as they unpack the evidence and test alternative design and delivery modalities. Ideally, this should lead to another wave of learning and evaluation of government-led programs to conclusively establish whether these patterns are replicated at scale.
This chapter focuses on four efforts. First, it assesses the overall short-, medium-, and long-term impacts of economic inclusion programs across a variety of income and resilience indicators and highlights whether these impacts can be sustained at scale. This analysis is based on a review of impact evaluations. Second, the chapter assesses this evidence to examine two key features of economic inclusion programming: the state of our knowledge regarding the bundling of multiple interventions relative to stand-alone interventions and the observed heterogeneity of impacts across population groups. Third, the chapter draws on both impact evaluations and nonevaluative qualitative and operational research to identify key drivers of impact. Fourth, the chapter identifies key directions to filling critical knowledge gaps through the pipeline of upcoming research.
Review of the Impact Literature: Method, Sample, and Caveats
In this synthesis, we review impact evaluations of 80 economic inclusion programs in 37 countries (see figure 5.1). These programs were identified from a number of different sources, including the Partnership for Economic Inclusion (PEI) Landscape Surveys of 2018 and 2020, evaluations listed in online research databases, and in systematic reviews of economic inclusion programs (see appendix B for details). Three programs had only a qualitative evaluation; all others had at least one quantitative eval-uation, either experimental (randomized controlled trial) or quasi-experimental.
The evaluated programs in this synthesis cut across diverse institutional arrange-ments, contexts, and program typologies. The evidence base is largely balanced with respect to the distribution across government-led and nongovernment-led programs, at

118
T H E S T A T E O F E C O N O M I C I N C L U S I O N R E P O R T 2 0 2 1 : T H E P O T E N T I A L T O S C A L E
FIGURE 5.1 Distribution of Reviewed Programs
13
49
4
14
43
37 38
20
3
19
0
10
20
30
40
50
60
Finan
cial
inclusio
n
Comple
menta
ry
South A
sia
East A
sia a
nd Pac
ific
Latin
Am
erica
and
the C
arib
bean
Entry points Institutionalarrangements
Region
Nu
mb
er
of
pro
gra
ms
Live
lihoods
and jo
bs
Gove
rnm
ent
Nongove
rnm
ent
Sub-Sah
aran
Afri
ca
Social
saf
ety n
et
Source: Partnership for Economic Inclusion, World Bank.Note: Complementary programs in the review typically link social safety nets with livelihood interventions to promote economic inclusion. Data labels refer to number of reviewed programs in each category.
least with respect to overall impact on primary outcomes. The evidence is also fairly representative of the distribution of economic inclusion programming across regions (see chapter 3), with the majority of evaluated programs in Sub-Saharan Africa (48 percent), followed by South Asia (25 percent) and Latin America and the Caribbean (24 percent). However, there is a considerable gap in the scope of available evidence with respect to evaluations of SSN-plus interventions (16 percent) relative to evaluations of L&J interven-tions (61 percent).2 This seems surprising given that SSNs are among the most frequently evaluated social policy interventions in the world.3 This gap exists because this review captures a much narrower set of evaluations of SSN-plus interventions, i.e., those featur-ing livelihood interventions that are bundled with regular cash transfers or public works programs. However, the complementary programs in the review typically link SSNs with livelihood interventions to promote economic inclusion.4
While this diversity is a valuable contribution of the report, it raises several chal-lenges with respect to the comparability of evidence. Impact evaluations reflect the diversity in program design and context, such that outcomes, indicators, and estimates of impact size reported vary widely across studies (see box 5.1). As a result of this diversity, the following allowances have been made:
• Given the limited number of evaluations of SSN-plus programs, the evidence base and findings are presented across all three entry points (figure 5.2 and figure 5.3), rather than disaggregating by entry point. While a total of 107 studies for 80 programs were reviewed for the synthesis, the summary of overall impact findings reflects 97 quantitative impact evaluations for the 71 programs for which complete information on impact estimates from the studies could be obtained.
• There is considerable variation in the precise indicators reported, limiting the possi-bility of reporting precise ranges of impact sizes. There is also a strong publication bias, with studies reporting positive results on what works, thus presenting an overly positive picture of the evidence. In this synthesis, the focus is on summarizing the direction of impact (when significant to at least the 10 percent level).

T H E S T A T E O F E C O N O M I C I N C L U S I O N R E P O R T 2 0 2 1 : T H E P O T E N T I A L T O S C A L E
119
BOX 5.1 Gaps in the Evidence and Challenges in Making Comparative Statements
Uneven coverage of different program entry points. The single programs reviewed are predominantly those addressing livelihoods and jobs (L&J), as evidence for social safety net (SSN) programs and financial inclusion (FI) programs is low . The evidence base on complementary programs is mostly available for Latin America and the Caribbean . Although complementary programs are also more common than single programs in East Asia and the Pacific, no evaluations are yet available .
Lack of comparability across evaluations. Studies differ widely with respect to the outcomes and indicators examined and estimates of treatment effects (the size of the impact) . The choices are rational, based on the differing program objectives, research prior-ities, and data availability, but the variation limits our ability to provide an estimated range of effect size . There are also information gaps in some evaluations . While a total of 107 studies (including 4 qualitative evaluations) for 80 programs were reviewed for this synthesis, the summary of findings reflects 97 quantitative impact evaluations for 71 programs for which complete information on impact estimates from the studies could be obtained .
Positive bias. There is a strong publication bias, that is, publicly available studies tend to emphasize results on what works, presenting an overly positive picture of the evidence . We try to mitigate against this risk by including a large number of third-party evaluations and experimental randomized controlled trials (RCTs) (which may be expected to be less susceptible to positive bias relative to retrospective evaluations as the control group is predefined) . We would expect publication bias to be stronger for pilot projects and nongovernment-led programs (where financing may depend on results), but most of these evaluations are RCTs . A promising development is that the research pipeline is strong, and many planned evaluations are registered, with researchers posting details of the design, methodology, and hypothesis before starting data collection .
Limited evidence on long-term impact. Program duration varies across programs as does the timing of impact evaluations . The overwhelming majority of programs provide time-bound interventions (of one to three years on average) . There are some exceptions: for example, in SSN-plus programs, the SSN is typically open-ended while the “plus” components are time bound . For comparability, we define short-term impact as measured immediately after a program concludes, typically one to two years after program start (i .e ., when beneficiaries enroll in the program) . Medium term is defined as impact measured three to four years after program start, and long term as more than four years after program start . Evaluations of long-term impact are limited to only three programs: (1) Bangladesh (Targeting the Ultra Poor, different phases); (2) Uganda (Youth Opportunity Program, YOP; Women’s Income-Generating Support, WINGS); and (3) India (Targeting the Hard-Core Poor program, West Bengal); as well as an experiment in Ethiopia . This chapter focuses primarily on short- and medium-term impacts, where there is more evidence, and comments on possible directions of long-term impact for this small subset of programs .
Challenges in generalizing and unpacking evidence. Not all studies provide suffi-cient details on the context in which the program operates . This has implications for the extent to which the evidence from specific (often small-scale) programs and contexts can be generalized to other contexts, other population groups, or at scale (Pritchett and Sandefur 2013) . With a few exceptions, most evaluations are not designed to isolate channels of impact . We speculate on the drivers of impact by drawing on nonevaluative qualitative and operational research (see appendix B for a bibliography) .

120
T H E S T A T E O F E C O N O M I C I N C L U S I O N R E P O R T 2 0 2 1 : T H E P O T E N T I A L T O S C A L E
FIGURE 5.2 Distribution of Studies Reporting on Specific Outcomes, by Lead Agency
6
3
10
8
13
15
22
25
24
9
8
10
20
20
30
30
39
44
0 10 20 30 40 50
Number of programs
60 70 80
Child health and nutrition
Psychosocial well-being
Child education
Employment/income diversification
Women’s empowerment
Savings
Consumption
Assets
Income and revenue
Government Nongovernment
Source: See appendix B for the detailed bibliography.Note: This summary reflects 97 quantitative impact evaluations for 71 programs for which complete information could be obtained.
FIGURE 5.3 Summary of Evidence on Overall Impact
10
8
11
16
22
37
37
50
51
5
3
9
12
11
8
15
14
17
0 10 20 30 40 50 60
Number of studies reporting on given outcomes
70 80 90 100
Child health and nutrition
Psychosocial well-being
Child education
Women's empowerment
Employment/income diversification
Savings
Consumption
Assets
Income and revenue
Positive and significantimpact
No impact (not significant, witha positive or negative sign)
Sources: See appendix B and its bibliography for a summary of the reviewed programs and studies. This summary reflects 97 quantitative impact evaluations for 71 programs for which complete information from the studies could be obtained.Note: In each outcome, the count of evaluations includes those that reported at least one indicator with a positive impact that was significant at the 10 percent level or higher or that reported no impact (i.e., none of the indicators in the outcome category were significant even at the 10 percent level, regardless of sign). None of the evaluations reported a significant negative impact for all indicators in the outcome category, although many nonsignificant impacts were negative in sign. If an evaluation reported more than one indicator in the broad outcome, the indicator at the highest level of aggregation was used (e.g., total asset index rather than the number of goats or total household consumption rather than household food consumption).

T H E S T A T E O F E C O N O M I C I N C L U S I O N R E P O R T 2 0 2 1 : T H E P O T E N T I A L T O S C A L E
121
Despite these caveats, the evidence base is strong for the primary outcomes of economic inclusion programming: enhancing income and assets. Other commonly reported outcomes relate to savings and consumption. A large number of studies also report on employment (including on diversification of income sources) and women’s empowerment outcomes. Only a few studies report on child outcomes (health, nutri-tion, or education) or on psychosocial well-being. The evidence base is smaller for government-led programs relative to nongovernment-led programs, particularly on psychosocial indicators of well-being, women’s empowerment, and savings.
In coming years, coordinated evaluation agendas hold the promise of establishing a more comparable body of evidence as well a deeper understanding of the channels of impact. This chapter draws on two such recently concluded research agendas (Banerjee et al. 2015; Maldonado et al. 2016). In the near future, a meta-analysis would be feasible, with the inclu-sion of comparable evidence from multicountry evaluations by, for example, the Food and Agriculture Organization of the United Nations (FAO 2018; Soares et al. 2018), Innovations for Poverty Action and the World Bank (Bossuroy et al. 2019), and the World Food Programme and the World Bank. In addition, over the next two years, a rich research pipeline of program-specific evaluations, including of SSN-plus interventions, will emerge that responds to the critical knowledge gaps identified in this chapter (see appendix B for details).5
Evidence of Overall Impact
A broad range of economic inclusion programs have shown promising—and potentially sustained—impact on a wide range of outcomes. Figure 5.3 presents a summary of the direction of impact across reviewed studies.6 Economic inclusion programs have helped participants invest in productive assets and to save, earn, and consume more than they could have without these programs. These absolute gains are typically quite small in size but often represent large increases for the poorest, given their low baseline values. Most programs increase household resilience to shocks by diversifying livelihoods and sources of income, facilitating savings and access to affordable credit, and building social networks. Many programs empower women by enhancing economic opportunities and social status (see spotlight 1). Evidence of impact on child well-being in participating households is more limited but suggests these programs may increase investments in human capital.
Short-Term Impact
Enhancing incomes and assets
By enabling more effective risk management, most programs (78 percent) enable participants to invest in productive assets. Programs with a business financial support element (such as an asset transfer or lump-sum cash grant) mitigate against the uncer-tainty of asset loss, while those with an SSN element (such as a regular cash trans-fer or public works) provide certainty and ease liquidity constraints, allowing poor households to maintain their investments. In programs with an asset transfer or cash grant element, these impacts are generally larger than the value of the initial transfer, suggesting that households have been able to increase, and often diversify, their asset holdings, typically their livestock. This suggests this is not merely a program effect. However, estimates of the size of increase vary widely.7
Many programs (82 percent) enable beneficiaries to save and reduce indebted-ness, although this does not always translate into increased access to formal sources of finance. Not surprisingly, this impact is more common for programs that encourage
122
T H E S T A T E O F E C O N O M I C I N C L U S I O N R E P O R T 2 0 2 1 : T H E P O T E N T I A L T O S C A L E
the formation of savings groups, suggesting at least some of this may be a program effect. For instance, Tanzania’s Productive Social Safety Net (PSSN) increased the share of participating households that were saving by 3.9 percentage points, representing an increase of 29 percent relative to nonparticipating households. This impact was likely due to the formation of savings groups. However, there is some evidence from Kenya’s Rural Entrepreneur Access Program (REAP) that shifts in saving behavior occur even before the introduction of such groups and that impacts persist after the program ends (Gobin, Santos, and Toth 2016). There is also the added benefit of reduced indebt-edness to high-interest informal lenders. In India, community-driven livelihood programs such as Indira Kranti Pratham and JEEViKA reduced debt-servicing costs and increased access to low-cost credit (Prennushi and Gupta 2014; Deininger and Liu 2013; Hoffmann et al. 2017). In a similar program, India’s National Rural Livelihood Mission (NRLM), an additional 2.5 years of membership in self-help groups increased total household savings by 28 percent and reduced the share of informal loans in total debt by 20 percent over baseline values (Kochar et al. 2020).
Economic inclusion programs broaden opportunities for poor households, enabling them to diversify incomes as household members shift from casual wage employment to farm and nonfarm self-employment. Among the programs reporting on employment outcomes, 67 percent reported a significant impact on the time participants spent work-ing or a shift from wage to self-employment. Because most poor people are typically employed as casual wage workers in precarious, seasonal, and sometimes hazardous work, economic inclusion programs provide an opportunity to shift to more productive self-employment in farm or nonfarm activities. For women, this is often a significant occupational transformation.8 For labor-unconstrained households, this also offers an opportunity to diversify household income, with some members continuing as wage workers while others start subsistence businesses, typically in livestock rearing, fisher-ies, and petty trade. While SSN programs tend to emphasize income diversification for resilience, L&J programs tend to do so for sustained income growth.
In most cases, the increased investment in productive assets and the shift in employment patterns translates into higher income. Most programs (75 percent of those reporting on this outcome) increased overall household or per capita incomes.9 The four SSN programs reporting an impact on income found a significant positive impact. For most L&J programs, this increased income effect persisted for one or two years after participants exited the program. In almost all cases, these improvements were driven by increased income from livestock or nonfarm petty trade that persisted for one or two years after program exit. In addition, programs often encourage adoption of good busi-ness practices, with these translating into income growth in some cases (such as youth in Uganda and Ethiopia and men in Sri Lanka) but not in others (such as women in Sri Lanka) (Blattman, Dercon, and Franklin 2019; Blattman, Fiala, and Martinez 2014; de Mel, McKenzie, and Woodruff 2012).
Although absolute gains tend to be small, even small increases can be meaning-ful, given low baseline values. Estimates of effect sizes vary considerably, but most participants in economic inclusion programs tend to experience small absolute gains. In Bangladesh, participants (all women) in phase 1 of TUP increased their total annual earnings by only $23 two years after program completion (and $26 four years after program completion), but this small amount represented a 34 percent increase two years after program completion (and 38 percent four years after) over their prepro-gram earnings (Bandiera et al. 2013). There are, however, some programs that have had larger impacts. In Afghanistan, participants in the TUP program increased their total monthly household income and revenues from productive activities by approxi-mately $19 relative to nonparticipants (a 23 percent increase) (Bedoya et al. 2019). In Uganda, participants in the Youth Opportunity Program (YOP) increased their monthly

T H E S T A T E O F E C O N O M I C I N C L U S I O N R E P O R T 2 0 2 1 : T H E P O T E N T I A L T O S C A L E
123
cash earnings by approximately $8.50 (41 percent) relative to nonparticipants, while participants in the Women’s Income-Generating Support (WINGS) program experienced an increase of approximately $5.19 (66 percent) relative to nonparticipants (Blattman, Fiala, and Martinez 2014; Blattman et al. 2016).
Improving household welfare and building resilience
Economic inclusion programs increase overall welfare in both monetary and nonmone-tary dimensions. Many economic inclusion programs (71 percent of those reporting on consumption outcomes) protect poor households against destitution, enabling them to cover their basic needs, maintain consumption levels, and enhance food security. The limited evidence on child outcomes finds largely positive impacts, suggesting that these programs may increase investments in human capital and belying the concern that the income-generating activities promoted by these programs crowd out investments in human capital.10
By increasing economic opportunities and asset ownership for women partici-pants, several programs also served to empower women. The quantitative evidence on women’s empowerment suggests only marginally positive impacts (with 57 percent of the 28 studies reporting on this outcome finding a positive impact). However, quali-tative assessments are overwhelmingly positive, pointing to improvements in mobil-ity, social status, household decision-making, and psychological well-being as critical outcomes for all participants but especially for women. See, for example, Moreno-Sánchez et al. (2018) and Moreno-Sánchez, Martínez, et al. (2018) for Colombia’s Produciendo Por Mi Futuro (PxMF).
Most programs make households more resilient to shocks and stresses. They accomplish this by providing regular, predictable transfers, by facilitating asset accumulation, income diversification, access to low-cost credit, and social networks (all of which provide some protection against risk and help households adopt noner-osive coping strategies) or both. A handful of SSN programs also report increased use of insurance products, reducing vulnerability to health shocks.11 These features help participants prepare, cope with, and recover from shocks.
In particularly shock-prone areas, programs strengthened household resil-ience ex ante. In Ethiopia, the Pastoralist Areas Resilience Improvement and Market Expansion (PRIME) project supported pastoralist households in coping with drought-induced animal mortality. During a period of multiple droughts, participants experienced a 40 percent lower decline in food security relative to nonparticipants (Smith et al. 2019). In the Sahel, SSN programs helped house-holds cope with the multiple and recurrent shocks (including drought, desertifica-tion, floods, conflict, and economic and health shocks) prevalent in the region. In Burkina Faso, for example, in addition to experiencing improvements in well- being, income, assets, and savings, participants in a cash-plus program also reduced their use of negative coping strategies in the first year of the program (FAO 2016). In Bangladesh, two economic inclusion programs increased awareness about disas-ter preparedness while also helping households cope with seasonal food insecurity during droughts or floods (Siddiki et al. 2014; Hernandez et al. 2016; HTSPE 2011).
Particularly relevant as the world grapples with the COVID-19 crisis, some programs explicitly support livelihood recovery after shocks. In Madagascar, the Fiavota program helped households revive their income-generating activities in severely drought-affected areas, with participants earning approximately $7 more per month compared to nonparticipants (Rakotomanana, Randrianatoandro, and Ravelosoa 2018).

124
T H E S T A T E O F E C O N O M I C I N C L U S I O N R E P O R T 2 0 2 1 : T H E P O T E N T I A L T O S C A L E
Impact over the Medium and Long Terms
Many of these impacts are sustained in the medium term. We define medium-term impact as measured three to four years after enrollment in the program; for one-off or time-bound programs, this is typically one or two years after beneficiaries exit the program. The following are examples:
• Programs offering time-bound interventions in Bangladesh (TUP), six CGAP–Ford Foundation pilot sites (in India–West Bengal, Ghana, Ethiopia, Pakistan, Peru, and Yemen), and Rwanda (Concern Worldwide Rwanda’s Graduation Program). Short-term gains in asset ownership, income, employment, and well-being remained positive and significant in the medium term. However, effect sizes were gener-ally smaller in magnitude, and the trajectories varied across countries, with gains continuing to increase on some dimensions in some countries and starting to decline in others. See figure 5.10 for effect sizes over time and across countries (Bandiera et al. 2017; Banerjee et al. 2015; Misha et al. 2019; Ahmed et al. 2009; Devereux and Sabates 2016; Emran, Robano, and Smith 2009). In two CGAP–Ford Foundation pilot sites (India–Andhra Pradesh and Honduras), participants experienced no signifi-cant gains (or decline) in assets, incomes, or consumption over time (Banerjee et al. 2015; Bauchet, Morduch, and Ravi 2015).
• Programs offering one-off capital grants and short-duration training (five days) to youth in Uganda and Ethiopia. Short-term increases in occupation, hours of work, and earnings were sustained in the medium term. Capital stocks, however, started to converge between participants and nonparticipants toward the end of four years (Blattman, Dercon, and Franklin 2019; Blattman, Fiala, and Martinez 2018).
• Programs providing an open-ended component (typically a cash transfer) in addition to time-bound interventions. In Ethiopia, among households receiv-ing the Household Asset-Based Program, those receiving a longer duration of the Productive Safety Net Program (PSNP) (five years as opposed to just one year) were able to significantly increase their crop yields and boost their agricultural productivity (Hoddinott et al. 2012).
Over the longer term—for up to seven years—some of these impacts continued to be sustained for the two programs for which this evidence is available.12 The Targeting the Hard-Core Poor (THCP) program in West Bengal had positive and accelerating long-term impact with respect to economic opportunities and material well-being of beneficia-ries even seven years after being enrolled in the program (nearly six years after program completion). For instance, the asset index (including production and household assets) was 0.89 standard deviations larger in the short term, 1.00 standard deviation larger in the medium term, and 0.99 standard deviations larger in the long term, relative to the baseline. Sustained improvements are also evident for total household income and consumption, while psychosocial impacts that had dissipated in the medium term improved in the long term (Banerjee et al. 2016). In Bangladesh, TUP also had sustained positive impact on income, savings, and food security for up to seven years. Long-term impact on asset owner-ship, however, was mixed: some studies found a sustained and even accelerating increase in productive assets (including land holdings) (Bandiera et al. 2017; Raza, Das, and Misha 2012; Asadullah and Ara 2016), but others found that vulnerability to shocks had resulted in asset losses for some households (Krishna, Poghosyan, and Das 2012).
However, longer-term impacts start to dissipate or reduce in size nine to ten years after program enrollment. In Bangladesh, some long-term impacts on assets, savings, employment, and food security persist even nine years after program enrollment, but effect sizes are very small (Asadullah and Ara 2016) or persisted only for existing

T H E S T A T E O F E C O N O M I C I N C L U S I O N R E P O R T 2 0 2 1 : T H E P O T E N T I A L T O S C A L E
125
entrepreneurs but not for others (Misha et al. 2019).13 A recent 10-year evaluation of the THCP program in West Bengal shows positive impacts on assets, income, consump-tion, and health persist even ten years later. For instance, beneficiaries still had higher asset ownership compared to nonbeneficiaries but the size was smaller after ten years relative to after seven years (0.35 standard deviations higher relative to 0.8 standard deviations). The impact on income and revenues, on the other hand, persisted at the same level (0.3 standard deviations higher than nonparticipants) even after ten years (Banerjee et al. 2020). In Ethiopia and Uganda, only some changes persisted, as most long-term impacts of L&J programs dissipated (Blattman, Dercon, and Franklin 2019; Blattman, Fiala, and Martinez 2018). For instance, nine years later, YOP participants in Uganda remained slightly more likely than nonparticipants to be in skilled trades, rather than in petty business, and to have household assets and livestock (Blattman, Fiala, and Martinez 2018). This declining long-term impact was partly due to catch-up by the nonparticipants, whose incomes, earnings, and consumption grew slightly faster than those of participants (in Bangladesh and Uganda), and partly due to coverage expansion of SSNs (in Bangladesh).
These findings are indicative of persistent impact on a range of outcomes, suggesting that these are not just short-term program effects of time-bound asset trans-fers, cash grants, or savings group mobilization. The fact that impacts persist at least in the medium term suggests that economic inclusion programming can, at minimum, launch the extreme poor into an upward trajectory. In addition, a handful of program evaluations find accelerating long-term impact of up to seven years and persisting for up to ten years. These findings are indicative of the potential of these programs to unlock poverty traps. Further research is warranted on a broader set of programs to conclusively establish whether this is the case.14
In the meantime, expectations need to be appropriately calibrated: impact of a one-off or time-bound intervention will be more likely to persist in the long term if the original participants have the option of receiving discrete “refresher” interventions over time, such as training and coaching to grow enterprises, labor market intermediation, support for market links, and so forth. Alternatively, the duration of support may need to be extended, especially in harsh ecosystems and settings of fragility, conflict, and violence (FCV). In other words, economic inclusion programming is far more likely to lead to transformative solutions to poverty and to sustained long-term income growth for the poorest if embedded in a continuum of support, at the micro and meso levels.
Impact at Scale
While a number of government-led programs have shown positive impact on incomes, assets, savings, and consumption, the effects are heterogeneous.15 The breadth and depth of the evidence base on government-led programs is more limited relative to that of nongovernment-led programs (see figure 5.2). The majority report positive impacts on assets (67 percent of programs reporting on this outcome), savings (100 percent), and employment outcomes (including diversification) (75 percent). More than half the studies of government-led programs also find posi-tive impact on income and consumption. We review these examples to highlight three main concerns in scaling up programs:
1. Sustaining impact as a program scales up coverage (and scope)
2. Achieving impact when economic inclusion programming scales up through comple-mentary programs that link to existing SSNs and L&J
3. Realizing indirect spillover effects on the wider local economy
126
T H E S T A T E O F E C O N O M I C I N C L U S I O N R E P O R T 2 0 2 1 : T H E P O T E N T I A L T O S C A L E
Some government-led programs have managed to sustain positive impact even as they expand functional scope and coverage to a large number of beneficiaries. In India, the NRLM (and its state-level precursors)16 built grassroots platforms of women’s self-help groups linking women to finance, livelihood opportunities, and other social programs. The state-level program in Andhra Pradesh increased access to finance, asset holdings, social networks, and well-being in the short and medium terms (Prennushi and Gupta 2014; Deininger and Liu 2009, 2013). In Bihar, poor households benefited from access to lower-cost credit and increased their ownership of assets over two years (Hoffmann et al. 2017). Several of these impacts were sustained in seven additional states under NRLM, with an increase in household income (a 19 percent increase over preprogram income), number of income sources, savings, and links to government programs. However, impact on assets, overall consumption, or women’s empowerment were more limited or not yet apparent in these states. For instance, although intra-household decision-making was not affected, the program helped women, especially those with some education, gain greater confidence in engaging with the community (Kochar et al. 2020).
Some complementary SSN and L&J programs have helped households increase household productivity and income, diversify income, and accumulate assets, including:
• Large-scale livelihood programs in Peru (Haku Wiñay) and Colombia (PxMF) that link with their countries’ conditional cash transfer programs (Juntos and Más Familias en Acción, respectively)17 offer a comprehensive bundle of interventions. These have helped participants increase their asset holdings, improve productivity, and shift from agricultural wage employment to self-employment, thereby raising income, consumption, and personal well-being (Escobal and Ponce 2016, Moreno-Sánchez, Maldonado, et al. 2018).
• Large-scale SSN programs that link their beneficiaries with existing livelihood programs have also experienced similarly positive results for some outcomes. In Ethiopia, households benefiting from PSNP and the Household Asset Building Program increased assets (livestock holdings and farm equipment), productivity, and food security (Berhane et al. 2014; Hoddinott et al. 2012; Sabates-Wheeler and Devereux 2012). Other complementary unconditional cash transfer and livelihood programs also increased asset accumulation and well-being in Lesotho and Malawi (FAO and UNICEF 2018; Pace et al. 2017).
• Some overlapping SSN and agriculture development programs have also increased productivity, income diversification, and financial inclusion in Brazil, El Salvador, and Peru.18 In El Salvador, the complementarity of a conditional cash transfer and agricultural development program increased income diversification for small- and medium-scale farmers and access to credit for subsistence farmers (de Sanfeliú, Ángel, and Shi 2016).
However, many such complementary programs fall short of their potential to achieve positive synergies. For some overlapping and complementary programs in Brazil, Colombia, Kenya, Mexico, and Peru, despite the positive impact of the individ-ual programs, there was no additive or multiplicative impact of the combination (Costa, Helfand, and Souza 2018; Yúnez-Naude et al. 2016; Moya 2016; Jensen, Barrett, and Mude 2017; Aldana, Vásquez, and Yancari 2016).19 This may be because the comple-mentary programs are not particularly well designed or effectively coordinated to provide a bundled set of interventions or because the bundle does not collectively address the multiple constraints faced by participants.

T H E S T A T E O F E C O N O M I C I N C L U S I O N R E P O R T 2 0 2 1 : T H E P O T E N T I A L T O S C A L E
127
Finally, we do not know enough about the indirect impact that large-scale economic inclusion programs might have on the broader local economy. Scaled-up programs may generate spillover effects in two ways: through network effects, such as demonstration effects or the sharing of information with nonparticipants, or through general equilibrium effects (economic multipliers). The handful of studies that report spillover effects on nonparticipants in a community find evidence of behavioral change and increased personal and social empowerment (Raza, Van de Poel, and van Ourti 2018; Misha et al. 2019; Deininger and Liu 2009). However, there remain concerns about sustaining implementation quality and hence impact on these outcomes (Hoffmann et al. 2018). Less is known about economic multipliers that may influence local economywide impact on material outcomes at scale. Program design and contex-tual factors matter: we would expect greater price effects for programs with high trans-fers, with large numbers of participants per locality, and in isolated communities with reliance on local rather than regional or national markets (see box 5.2).
BOX 5.2 Achieving Economic Inclusion in FCV Settings
Several economic inclusion programs operating in fragility, conflict, and violence (FCV) settings have had positive impacts on the income and resilience of the extreme poor. For instance, Afghanistan’s Targeting the Ultra Poor (TUP) program had a greater impact relative to similar programs in stable contexts (Bedoya et al. 2019). Similarly, Concern Worldwide Burundi’s Terintambwe, the Trickle Up graduation program in Burkina Faso, and Fonkoze’s Chemen Lavi Miyò (CLM) in Haiti had positive impacts on incomes, assets, savings, and child outcomes (Devereux et al. 2015; Karimli, Bose, and Kagotho 2019; Roelen and Saha 2019). In Côte d’Ivoire, a microenterprise program Projet d’Insertion Socio-Economique (PRISE), increased the likelihood of entry into self-employment as well as savings and investments, although it had no impact on earnings (Premand and Marguerie 2020). In contrast, a public works program (Projet d’Urgence de Création d’Emploi Jeunes et de Développement des Compétences, PEJEDEC) increased earnings from self-employment by approximately $12 (a 32 percent increase compared to nonparticipants) but had no impact on participation in wage- or self-employment (Bertrand et al. 2017). Another public works–plus program (Urban Youth Employment Program, UYEP) in Papua New Guinea was able to translate temporary wage employment into formal sector employment by directly influencing employer prefer-ences (Hoy and Naidoo 2019).
However, program disruption due to conflict can undermine impact. In South Sudan’s Youth Business Start-Up Grant Program, youths who received training and a cash grant substantially increased savings and consumption by about a 1.0 standard deviation and in psychological well-being by 0.8 standard deviations. Impacts were similar for men and women. Those who expected to receive the combination but received only training, due to program disruption following the outbreak of conflict, experienced no impact on savings and a small decline in consumption. For women, program disruption also led to a severe reduction in trust by 0.9 standard deviations (Müller, Pape, and Ralston 2019).In many cases, provision of economic opportunities is a means to improve social cohe-sion, especially for at-risk youth in FCV settings. Impact has been mixed on this front.
(Box continues next page)

128
T H E S T A T E O F E C O N O M I C I N C L U S I O N R E P O R T 2 0 2 1 : T H E P O T E N T I A L T O S C A L E
Factors That Mediate Impact
With a few exceptions, most evaluations are not designed to isolate mechanisms of impact. This is a critical knowledge gap with respect to two core elements of economic inclusion programming:
• Bundling of interventions
• Focusing on the extreme poor and vulnerable
The emerging evidence reveals the importance of coordinating multiple inter-ventions vis-à-vis stand-alone interventions. However, most programs have heteroge-neous impacts, with the poorest and most vulnerable experiencing the fewest gains. For programs that target both men and women, there is some evidence of differential impacts. Much of this evidence comes from NGO-led programs and from experimen-tal studies (some of which build on government programs). More recently, there have been some evaluations of government-led programs that explore these questions, and a pipeline of forthcoming research is anticipated that could start to answer these questions more definitively, including for government-led programs.
Bundled Interventions Have a Larger Impact Than Stand-Alone Interventions
A core feature of economic inclusion programming is combining different interventions to address multiple constraints; such interactions are likely to drive overall program impact. While stand-alone interventions can also impact incomes, assets, and resilience, a single intervention—a regular cash transfer, an asset transfer or a cash grant, business training, agricultural extension services, or access to finance—would not necessarily help those facing multiple constraints, or would do so to a lesser extent.20
A comprehensive suite of interventions has larger and more sustained impact on income, assets, and savings relative to stand-alone interventions. In pilot programs in Ghana (Graduating the Ultra Poor, GUP), South Sudan (TUP), and Uganda (Village Enterprise microenterprise program), the classic graduation package had significant positive impact on income, assets, consumption and food security, and women’s empowerment. In all three countries, stand-alone interventions had much more limited impact.
• In Ghana’s GUP, a stand-alone savings intervention had a short-term impact on assets, income, consumption, and savings. However, only the recipients of the
In Côte d’Ivoire, the PRISE program was able to increase group participation and soli-darity in the locality, even though there was little impact on broader indicators of social cohesion such as exposure to violence (Premand and Marguerie 2020) . Similarly, the UYEP program in Papua New Guinea had a substantial positive impact on participants’ interactions with their peer group and social behavior, but more limited effects on the socioeconomic causes of crime (Ivaschenko et al . 2016) .
BOX 5.2 Achieving Economic Inclusion in FCV Settings (continued)

T H E S T A T E O F E C O N O M I C I N C L U S I O N R E P O R T 2 0 2 1 : T H E P O T E N T I A L T O S C A L E
129
FIGURE 5.4 Comprehensive Package Showing Larger and More Sustained Impact Than Stand-Alone Interventions (Ghana, GUP)
–0.2
0
0.2
0.4
0.6
0.8
1.0
1.2
Assets(assets value
index)
Income(income index)
Savings(financialinclusion
index)
Consumption(consumption
index)
Assets(assets value
index)
Income(income index)
Savings(financialinclusion
index)
Consumption(consumption
index)
Short term Medium term
Savings only Classic graduation without savings Classic graduation
**n.s.
*
***
****
******
***
***
****
n.s.n.s.n.s.n.s.n.s.
n.s.n.s.
n.s.
n.s.
n.s.
Tre
atm
en
t e
�e
ct a
nd
sig
nifi
can
cele
ve
l by t
rea
tme
nt
arm
Source: Banerjee et al. 2018.Note: All outcomes plotted on the vertical axis are economic indices (of assets, income, savings, and consumption). Program duration was two years; short-term impact is estimated at the end of the program (two years after the start) and medium-term impact at three years after the start of the program. GUP = Graduating the Ultra Poor.* significance at 10 percent, ** 5 percent, *** 1 percent. n.s. = not significant.
full set of interventions (with or without a savings component) were able to grow businesses, invest in assets and savings, and sustain income gains in the medium term (figure 5.4). Similar findings emerged for a stand-alone asset transfer relative to the classic graduation bundle (even without a savings component) (Banerjee et al. 2018).
• In South Sudan’s TUP, a stand-alone cash grant increased consumption levels but had no impact on asset wealth relative to the comprehensive program (Chowdhury et al. 2017).
• In Uganda’s Village Enterprise program, a stand-alone cash grant improved asset ownership but had no other impact, although a combination of the grant with light-touch behavioral interventions possibly facilitated a shift from wage to self- employment and reduced child labor (Sedlmayr, Shah, and Sulaiman 2019).
These findings suggest that the poorest population groups derive higher economic value from a lump-sum cash grant or an asset transfer when also provided with complementary training, coaching, and regular transfers.21 In Peru, there was consid-erable heterogeneity in the bundle of interventions accessed by different households under Haku Wiñay; this had implications for the magnitude of impact.22 Grouping households into terciles based on the intensity of interventions, the tercile that received the lowest-intensity bundle increased income by 35 percent, as compared with a 51 percent increase for the tercile that received the highest-intensity bundle. Impact on resilience to shocks (and on empowerment) was significant only for the tercile receiv-ing the highest program intensity (Escobal and Ponce 2016).
In livelihood programs, bundling lump-sum cash grants with training and group formation can increase household incomes and welfare relative to either interven-tion in isolation. The cash grant eases capital constraints, training addresses human

130
T H E S T A T E O F E C O N O M I C I N C L U S I O N R E P O R T 2 0 2 1 : T H E P O T E N T I A L T O S C A L E
capital constraints, and group formation helps the poorest households form social networks. In Uganda’s WINGS, youths who were provided with a cash grant of $150, basic training and were mobilized into savings groups increased their incomes by a 0.15 standard deviation (significant at 10 percent) relative to those who received only the grant and basic training (figure 5.5). In addition, supervision increased their chances of business survival (Blattman et al. 2016). Similarly, in Sri Lanka, an exper-imental study found that a combination of cash grant and training was successful in getting women to start a subsistence business. Business training alone also increased business ownership but to a lesser extent, and the combination was needed to boost profits and capital stock (de Mel, McKenzie, and Woodruff 2014).
A combination of asset transfers and training has a similarly larger positive impact on household income and consumption relative to stand-alone interventions. In Rwanda’s Girinka (“one cow per poor family”) program, this effect persisted: house-holds that received both the livestock asset transfer and training had higher milk production, livestock productivity, earnings, and asset accumulation in the long term.23 In particular, complementary training provided at the same time as the asset transfer led to self-perpetuating gains over time; subsequent training, possibly of lower quality, did not have the same impact (Argent, Augsburg, and Rasul 2014). These findings are striking in contexts where households have weak links to markets and might be expected to have lower returns to such investments. In Burundi’s Terintambwe program, beneficiaries highlighted the importance of training and coaching that provided them the knowledge and confidence required to maximize their returns from the asset transfer and income support (Roelen and Devereux 2019).
Similarly, while cash transfers ease consumption constraints and enable risk taking, bundling livelihood interventions can amplify impact by further easing produc-tion constraints. These effects seem to vary depending on the nature of the additional intervention. In drought-affected areas, the government of Nicaragua added layers to a conditional cash transfer (Atención a Crisis) in the form of either a lump-sum cash grant (with some coaching) or vocational training. The combination of the cash grant with the regular transfer increased average income and consumption and increased household resilience to the negative impact of droughts, partly due to their role in
FIGURE 5.5 Bundling Cash Grants, Training, and Group Formation (Uganda, WINGS)
–0.4
–0.2
0
0.2
0.4
0.6
0.8
1.0
Nonfarm self-employment
Tre
atm
en
t e
�e
ct a
nd
sig
nifi
can
cele
ve
l by t
rea
tme
nt
arm
Index of incomemeasures
Durable assets(production)
Durable assets(consumption)
Control WINGS WINGS plus group training
***
***
***
************
***
Source: Blattman et al. 2016.Note: Nonfarm self-employment is the percentage of total beneficiaries in the control/treatment arm; all the other indicators are z-scores. Core program includes a cash grant and basic training and supervision. WINGS = Women’s Income-Generating Support program.* significance at 10 percent, ** 5 percent, *** 1 percent. n.s. = not significant.
T H E S T A T E O F E C O N O M I C I N C L U S I O N R E P O R T 2 0 2 1 : T H E P O T E N T I A L T O S C A L E
131
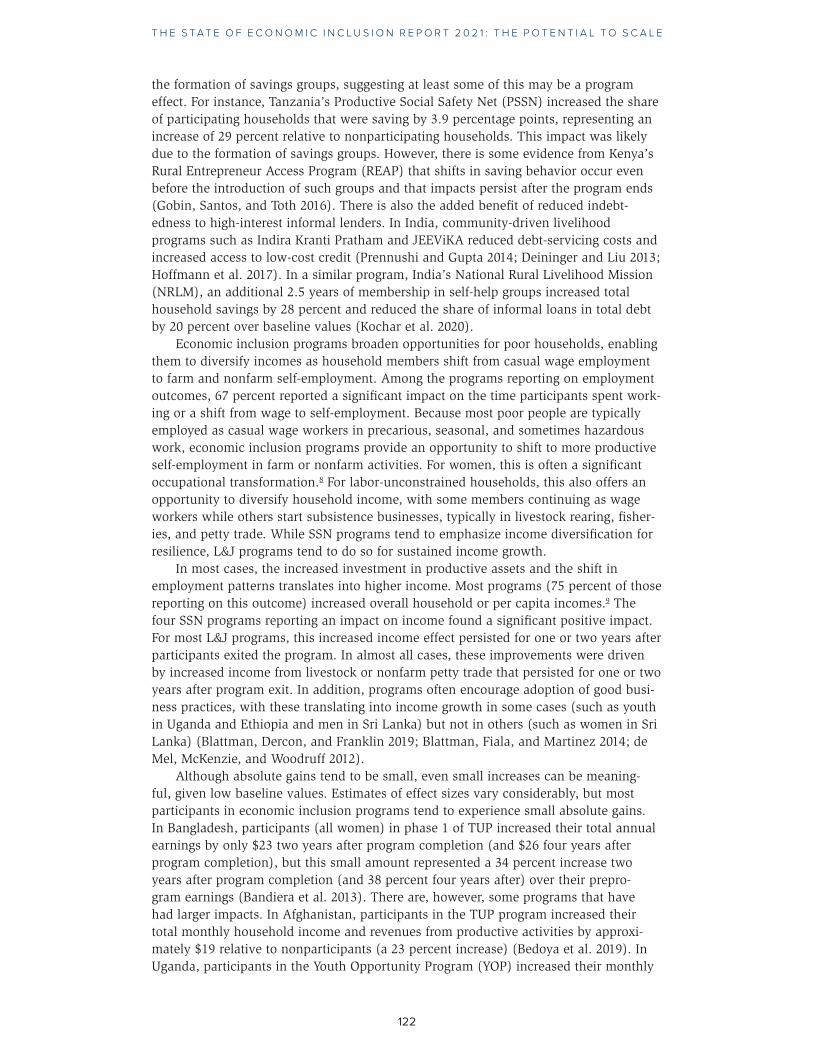
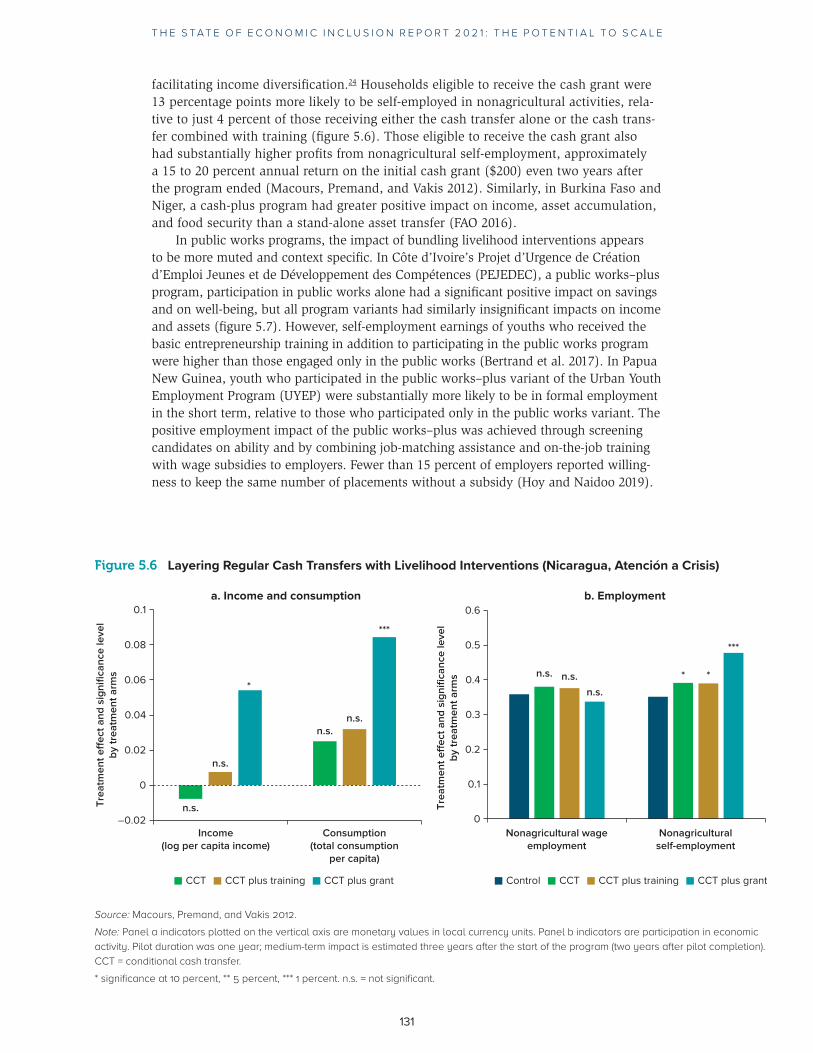
Figure 5.6 Layering Regular Cash Transfers with Livelihood Interventions (Nicaragua, Atención a Crisis)
–0.02
0
0.02
0.04
0.06
0.08
0.1
Income(log per capita income)
Tre
atm
en
t e
�e
ct a
nd
sig
nifi
can
ce le
ve
lb
y t
rea
tme
nt
arm
s
Tre
atm
en
t e
�e
ct a
nd
sig
nifi
can
ce le
ve
lb
y t
rea
tme
nt
arm
s
Consumption(total consumption
per capita)
a. Income and consumption
CCT CCT plus training CCT plus grant
n.s.
*
n.s.n.s.
n.s.
***
0
0.1
0.2
0.3
0.4
0.5
0.6
Nonagricultural wageemployment
Nonagriculturalself-employment
b. Employment
Control CCT CCT plus training CCT plus grant
n.s. *
n.s.
n.s.
***
*
Source: Macours, Premand, and Vakis 2012. Note: Panel a indicators plotted on the vertical axis are monetary values in local currency units. Panel b indicators are participation in economic activity. Pilot duration was one year; medium-term impact is estimated three years after the start of the program (two years after pilot completion). CCT = conditional cash transfer.* significance at 10 percent, ** 5 percent, *** 1 percent. n.s. = not significant.
facilitating income diversification.24 Households eligible to receive the cash grant were 13 percentage points more likely to be self-employed in nonagricultural activities, rela-tive to just 4 percent of those receiving either the cash transfer alone or the cash trans-fer combined with training (figure 5.6). Those eligible to receive the cash grant also had substantially higher profits from nonagricultural self-employment, approximately a 15 to 20 percent annual return on the initial cash grant ($200) even two years after the program ended (Macours, Premand, and Vakis 2012). Similarly, in Burkina Faso and Niger, a cash-plus program had greater positive impact on income, asset accumulation, and food security than a stand-alone asset transfer (FAO 2016).
In public works programs, the impact of bundling livelihood interventions appears to be more muted and context specific. In Côte d’Ivoire’s Projet d’Urgence de Création d’Emploi Jeunes et de Développement des Compétences (PEJEDEC), a public works–plus program, participation in public works alone had a significant positive impact on savings and on well-being, but all program variants had similarly insignificant impacts on income and assets (figure 5.7). However, self-employment earnings of youths who received the basic entrepreneurship training in addition to participating in the public works program were higher than those engaged only in the public works (Bertrand et al. 2017). In Papua New Guinea, youth who participated in the public works–plus variant of the Urban Youth Employment Program (UYEP) were substantially more likely to be in formal employment in the short term, relative to those who participated only in the public works variant. The positive employment impact of the public works–plus was achieved through screening candidates on ability and by combining job-matching assistance and on-the-job training with wage subsidies to employers. Fewer than 15 percent of employers reported willing-ness to keep the same number of placements without a subsidy (Hoy and Naidoo 2019).

132
T H E S T A T E O F E C O N O M I C I N C L U S I O N R E P O R T 2 0 2 1 : T H E P O T E N T I A L T O S C A L E
Some complementary programs also display these positive synergies, with the cumulative impact greater than that of the individual programs. For instance, in Brazil the overlapping implementation of Bolsa Família (a conditional cash transfer) and Pronaf (a subsidized agricultural credit) had a greater aggregate impact on land produc-tivity and income than the individual programs (Garcia, Helfand, and Souza 2016). In Malawi, the joint impact of an unconditional cash transfer and farm input subsidy was about 22 percent larger than that of the sum of the impacts of the stand-alone programs on the value of production (Daidone et al. 2017). As previously noted, however, many complementary programs do not have any additive or multiplicative impact of the combined programs.
It is possible that in some contexts further bundling may be necessary to address the multiple constraints faced by the target populations. In Peru (prior to Haku Wiñay), complementary programs—a conditional cash trans-fer (Juntos) and technical training (Sierra Sur)—influenced the adoption of new technologies and increased assets. However, these changes did not translate into higher income in the absence of financial or other support (Aldana, Vásquez, and Yancari 2016). Similarly, in Côte d’Ivoire, the Projet d’Insertion Socio-Economique program (PRISE) found very little difference across different vari-ants (combining training with semicredit, cash grant, or establishment of village savings and credit association). Possibly, additional interventions, such as a regu-lar cash transfer, may have been necessary in the fragile, postconflict setting (Premand and Marguerie 2020).
In summary, the emerging evidence suggests that a bundled set of interventions has greater impact than its constituent stand-alone interventions. However, knowledge of this key aspect of economic inclusion programming is still limited. Further research is needed to conclusively establish this finding, particularly if this holds at scale, for different population groups, and across a range of contexts. It is also important to better understand the marginal impact (and costs, see chapter 6) of each intervention, rela-tive to the overall impact of the program, in order to identify cost-effective bundles for different population groups and contexts.25
FIGURE 5.7 Bundling Public Works Programs with Other Livelihood Interventions (Côte d’Ivoire, PEJEDEC)
0
10,000
20,000
30,000
40,000
50,000
60,000
70,000
Savings(stock)
Income(total monthly
earnings)
Income(monthly earnings
in wage employment)
Income(monthly earnings
in self-employment )
Consumption(total monthlyexpenditure)
Control PWP PWP-plus wage-employment training PWP-plus self-employment training
**
n.s.
*** n.s.n.s.n.s.n.s.
n.s.n.s.n.s.n.s.
n.s.n.s.n.s.
Source: Bertrand et al. 2017.Note: PWP = public works program. All outcomes plotted on the vertical axis are monetary values in the shared Central African currency (CFAF). Short-term impact is estimated 12–15 months after program completion (with program duration approximately 7 months). PEJEDEC = Projet d’Urgence de Création d’Emploi Jeunes et de Développement des Compétences.* significance at 10 percent, ** 5 percent, and *** 1 percent. n.s. = not significant.

T H E S T A T E O F E C O N O M I C I N C L U S I O N R E P O R T 2 0 2 1 : T H E P O T E N T I A L T O S C A L E
133
Heterogeneity of Impact: Not Everyone Benefits to the Same Extent
Program impact often varies across participants, with greater impact on incomes and assets for the least poor among the target population. For instance, in the medium term, the impact of the classic graduation pilots on the asset index among people at the 90th percentile was more than 14 times greater than among those at the 10th percentile (Banerjee et al. 2015). In Afghanistan, a similar program (TUP) also found significantly higher impact on livestock holdings for the top relative to the bottom quintile (Bedoya et al. 2019). In Bangladesh’s TUP, these differences persist over time, with medium-term effects on savings and assets being greater at the 95th relative to the 5th percentile (Bandiera et al. 2017). This seems to hold in SSN-plus programs too. In Côte d’Ivoire, the PEJEDEC program also had substan-tially higher impact on income and savings for youths at the top end of the distribu-tion relative to those at the bottom, although these differences were muted after the program closed (Bertrand et al. 2017).
With respect to other dimensions of social exclusion, the picture may be more nuanced, especially in community-based programs. In Andhra Pradesh, Scheduled Tribes experienced greater increases in savings, livestock assets, consumption, and education outcomes compared to other participants in the state-level (pre-NRLM) program (Prennushi and Gupta 2014). Similarly, in Bihar’s JEEViKA, landless house-holds (predominantly Scheduled Caste) benefited more than landowning households with respect to reductions in cost of credit (Hoffmann et al. 2017). These patterns held in seven other states under NRLM, with greater gains to Scheduled Caste and Tribe households (Kochar et al. 2020). (For more on Scheduled Casts and Tribes, see case study 2.)
However, absolute gains are largely positive across the distribution. In some programs, the poor experienced larger impacts on food security, psychological well- being, and human capital investments. The classic graduation pilots, for example, increased food security only toward the lower end of the distribution, at the 25th percentile (Banerjee et al. 2015). Similar programs in Afghanistan (TUP) and Colombia (PxMF) yielded greater and more sustained improvements in subjective well-being and aspirations for the poorest and for those who started the program with lower life satisfaction compared to other participants (Moreno-Sánchez, Maldonado, et al. 2018; Bedoya et al. 2019).
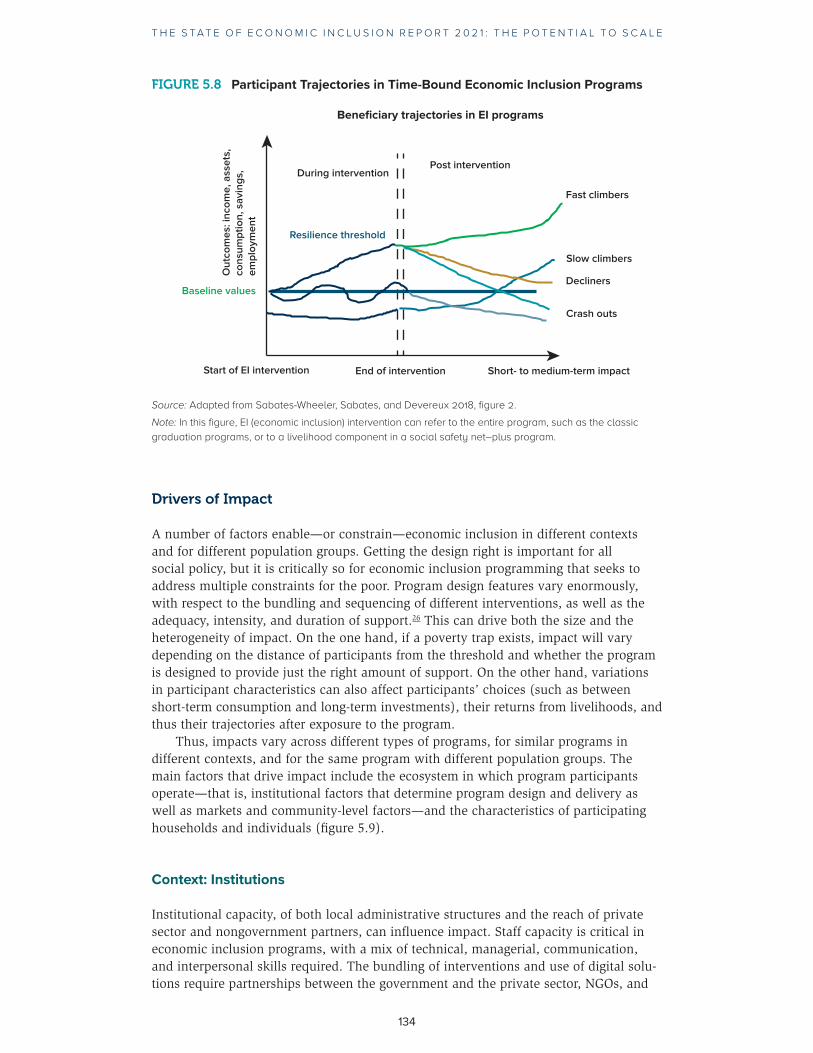
Participants also differ with respect to their trajectories during the program and after program exit (in the case of time-bound programs). Many participants—referred to as “improvers” or “fast climbers”—experience positive changes during the program and manage to sustain these changes afterward. These sustained changes include increasing income; diversifying income; increasing resilience to shocks; investing in their children’s health, nutrition, and education; and planning for the future with some degree of confidence. Another group of participants—referred to as “late improvers” or “slow climbers”—might only gradually start to show improve-ments. Yet others—referred to as “decliners”—who may or may not have experi-enced positive changes during the program are unable to sustain whatever changes they experienced and end up on a downward trajectory. Among this latter group, some (“crash outs”) may even fall back to preprogram levels (see figure 5.8). See Sabates-Wheeler, Sabates, and Devereux (2018) for trajectories of Concern Worldwide Rwanda participants, Shoaf and Simanowitz (2019) for Chemen Lavi Miyò in Haiti, and Sengupta (2012) for the classic graduation pilot in Ethiopia. These trajectories can vary across participants, depending on a number of factors mediating impact, as examined in the following material.
134
T H E S T A T E O F E C O N O M I C I N C L U S I O N R E P O R T 2 0 2 1 : T H E P O T E N T I A L T O S C A L E
Drivers of Impact
A number of factors enable—or constrain—economic inclusion in different contexts and for different population groups. Getting the design right is important for all social policy, but it is critically so for economic inclusion programming that seeks to address multiple constraints for the poor. Program design features vary enormously, with respect to the bundling and sequencing of different interventions, as well as the adequacy, intensity, and duration of support.26 This can drive both the size and the heterogeneity of impact. On the one hand, if a poverty trap exists, impact will vary depending on the distance of participants from the threshold and whether the program is designed to provide just the right amount of support. On the other hand, variations in participant characteristics can also affect participants’ choices (such as between short-term consumption and long-term investments), their returns from livelihoods, and thus their trajectories after exposure to the program.
Thus, impacts vary across different types of programs, for similar programs in different contexts, and for the same program with different population groups. The main factors that drive impact include the ecosystem in which program participants operate—that is, institutional factors that determine program design and delivery as well as markets and community-level factors—and the characteristics of participating households and individuals (figure 5.9).
Context: Institutions
Institutional capacity, of both local administrative structures and the reach of private sector and nongovernment partners, can influence impact. Staff capacity is critical in economic inclusion programs, with a mix of technical, managerial, communication, and interpersonal skills required. The bundling of interventions and use of digital solu-tions require partnerships between the government and the private sector, NGOs, and
FIGURE 5.8 Participant Trajectories in Time-Bound Economic Inclusion Programs
Start of EI intervention End of intervention Short- to medium-term impact
Baseline values
Fast climbers
Slow climbers
Crash outs
Decliners
Ou
tco
me
s: in
com
e, a
sse
ts,
con
sum
pti
on
, sa
vin
gs,
em
plo
ym
en
t
Resilience threshold
Post interventionDuring intervention
Beneficiary trajectories in EI programs
Source: Adapted from Sabates-Wheeler, Sabates, and Devereux 2018, figure 2.Note: In this figure, EI (economic inclusion) intervention can refer to the entire program, such as the classic graduation programs, or to a livelihood component in a social safety net–plus program.

T H E S T A T E O F E C O N O M I C I N C L U S I O N R E P O R T 2 0 2 1 : T H E P O T E N T I A L T O S C A L E
135
FIGURE 5.9 Factors That Mediate Program Impact
• Program design and delivery
Institutions
• Presence of and access to markets and services• General equilibrium e�ects
Markets • Infrastructure/level of development and other covariate constraints• External shocks (e.g., climate, conflict, disease)
• Social and gender norms
Community
• Endowments, social networks, resilience to shocks• Intrahousehold dynamics
Households • Education and experience (cognitive and noncognitive skills)
• Gender
Individuals
Source: Adapted from Sabates-Wheeler and Devereux 2013; Shoaf and Simanowitz 2019; and Huda 2009.
civil society. Uneven implementation across geographic locations can lead to variable impact across groups (Berhane et al. 2014), or can dilute impact, especially as programs scale up (Hoffmann et al. 2018).27
In particular, as reviewed in chapter 2, complementary programs require policy coherence and effective interagency coordination to unlock positive synergies across constituent programs. In most contexts, positive synergies from coordinated interventions are more likely to emerge where there are significant market failures, such as those faced by small farmers and rural microentrepreneurs. In these cases, cash transfers provide liquidity and certainty, while the complementary livelihood interventions and finan-cial services address production constraints, including technical knowledge and access to inputs, credit, and markets (Tirivayi, Knowles, and Davis 2013; Soares et al. 2017). However, these synergies will not necessarily materialize when programs are merely overlapping in geographic coverage, without any attempt at joint policy articulation or operational coordination (Slater et al. 2016). Programs designed for different target groups (in terms of poverty status, land or asset ownership, education, and ability, for example) would not achieve much complementarity in coverage or have much aggregate impact on economic inclusion.28
Context: Markets and communities
The broader ecosystem in which program participants operate shapes local live-lihoods and mediates impact from economic inclusion programs that seek to influence these livelihoods. These contextual factors include communitywide characteristics, such as location (for example, concerning remoteness and connec-tivity), level of development (such as availability and quality of infrastructure and services), local economy (including economic growth, agroclimatic conditions, labor demand, and purchasing power), access to input and output markets ( including integration of local markets with regional or national markets), and exposure to shocks (especially climate, conflict, and disease).
As a result, similar programs can yield very different outcomes in different locations. The evaluation of the CGAP–Ford classic graduation pilot projects implemented in a very wide range of contexts revealed significant impacts in all but one case, but the size varied across the pilots (see figure 5.10) (Banerjee et al. 2015; J-PAL and IPA Policy Bulletin 2015).

136
T H E S T A T E O F E C O N O M I C I N C L U S I O N R E P O R T 2 0 2 1 : T H E P O T E N T I A L T O S C A L E
Similarly, in India, the same model had significant impact on incomes and assets in one India state but not in another, largely due to differences in the local economy (Bauchet, Morduch, and Ravi 2015). In Peru’s Haku Wiñay, for example, heterogeneity of outcomes is associated with the level of economic dynamism of the local area (Asensio, Fernández, and Burneo 2016).29 In harsh ecosystems and FCV contexts, achieving impact is feasible but can be particularly challenging (box 5.2). In particular, shocks can disrupt program delivery such that households receiving partial inputs or inputs of a poorer quality than planned tend to fare poorly, in both material and psychosocial terms (Müller, Pape, and Ralston 2019).
Economic inclusion programming at scale needs to address these covariate constraints, particularly with respect to facilitating market access (see spotlight 3). Large-scale programs can generate spillover effects—positive and negative—especially in contexts where there are significant market failures (see box 5.3). For instance, programs promoting self-employment may lead to constrained market supply or market saturation if local input or output markets are weakly integrated with regional or national markets. Program participants in Paraguay and Colombia experienced market saturation in poorly integrated local markets (CADEP 2017; Sheldon 2016). However, this was not the case for program participants in Bangladesh, which had better regional market integration (Banerjee et al. 2015; Bandiera et al. 2017).
In addition, community norms can promote or restrict the extent to which participants benefit from the opportunities offered by economic inclusion programs. For instance, some communities have a strong practice of sharing in mutual support networks. While this is an important informal SSN, such sharing of in-kind and cash transfers from economic inclusion programs can dilute the expected impact ( Sabates-Wheeler, Lind, and Hoddinott 2013). In the Sahel, successful people face community pressure toward generosity to show solidarity with other community members (Bossuroy, Koussoubé, and Premand 2019). Many programs involve communities heavily in the selection of beneficiaries; while this is
FIGURE 5.10 Impact of Similar Programs Can Vary Substantially in Different Contexts: Evidence from the CGAP–Ford Foundation Classic Graduation Pilot Projects
0.50
0.25
0.01
0.65
0.33
0.10
0.60
0.34
–0.10
0.71
0.17
0.06
–0.2
0
0.2
0.4
0.6
0.8
Ethiopia Ghana Honduras India Pakistan Peru
Ch
an
ge
in s
tan
da
rd d
evia
tio
ns
Country-by-country impact of graduation on index oftotal value of household assets
Endline 1 Endline 2
Source: J-PAL and IPA Policy Bulletin 2015.Note: These percentage changes are over small baseline values. Endline 1: two years after program start; endline 2: three years after program start.* significance at 10 percent, ** 5 percent, and *** 1 percent. n.s. = not significant.

T H E S T A T E O F E C O N O M I C I N C L U S I O N R E P O R T 2 0 2 1 : T H E P O T E N T I A L T O S C A L E
137
BOX 5.3 Spillover Impact on Communities and the Local Economy
Livelihood programs that promote self-employment and microenterprises can poten-tially generate positive or negative spillover effects . In particular, integration with regional markets is important, as there are limits to how many similar enterprises a single community can support . In Paraguay’s Sembrando Oportunidades Familia por Familia and Colombia’s PxMF, participants reported low profitability due to lower than anticipated sales at low prices, as the small local market was flooded and resources were limited in the community . These low profit margins were reinforced by poor connectivity with markets for remote communities and weak input markets, which led to reliance on a few vendors providing poor-quality chickens and feed in some areas (CADEP 2017; Sheldon 2016) . However, this may not be the case for all programs and in all contexts . In Bangladesh’s Targeting the Ultra Poor (TUP) program, the program-in-duced shift from casual wage employment to self-employment for participants increased local casual wages but did not have negative spillover effects on village live-stock prices . This was possibly because there were dynamic regional livestock markets in the program areas . Also, general equilibrium effects may be small if scale-up takes the form of geographic expansion of a narrowly targeted program . Although the poor benefit, there might only be a modest impact on the village economy’s overall asset stock, output markets, and labor markets (Banerjee et al . 2015; Bandiera et al . 2017) .
For stand-alone social safety net (SSN) programs, there is considerable evidence of positive local economy impacts . In seven Sub-Saharan countries, a public works program and cash transfers generated substantial income multipliers (Taylor, Thome, and Filipski 2016; Filipski et al . 2017) . In Ethiopia, for example, the PSNP had substantial impact on supply, demand, wages, and prices in both PSNP and non-PSNP areas . There was considerable variation across regions, depending on program design as well as contextual factors, such as the structure of the local economy, types of household activ-ities, and degree of integration with outside markets .
Complementing SSNs with livelihood interventions can also have substantial spillover effects on the local economy, especially when each mitigates possible negative impacts of a stand-alone intervention . For example, much of the rationale for the expansion of cash and livelihood interventions in Malawi has been to compensate for the removal of ineffective and expensive farm input subsidies (Kagin et al . 2019; Filipski et al . 2017) .
critical in building support and utilizing local knowledge, it can also result in the crowd-ing out of other support, especially when programs are rationed. For instance, in Rwanda, participants in the Concern Worldwide graduation program were removed from the bene-ficiary lists of the government program, Vision 2020 Umurenge Programme, to make room for others not receiving any support (Devereux and Sabates 2016). These local norms are harder to shift through program design.
Context: Households and individuals
At the household level, initial endowments determine the magnitude of an impact. Most of the programs reviewed here found that households with prior asset ownership,

138
T H E S T A T E O F E C O N O M I C I N C L U S I O N R E P O R T 2 0 2 1 : T H E P O T E N T I A L T O S C A L E
more labor availability in the household or extended family, and better social rela-tions were in a better position to take advantage of the opportunities offered by economic inclusion programs. The effect of prior asset ownership is particularly import-ant if there are complementarities between asset types, such as land and livestock (Sabates-Wheeler, Sabates, and Devereux 2018). The age, sex, and skills of the labor pool available to households is important in defining its trajectory. Across the board, labor-constrained households, such as single-headed households (especially with a female head) and those with a large number of dependents, tend to fare worse.
Social networks help households manage risk and access formal and informal SSNs.30 Participants in many programs reported increased participation in community meetings and social events as well as improvements in trust and in the degree of inte-gration with their communities. For previously marginalized households, these social networks improved living conditions in both tangible ways, such as access to informa-tion and opportunities as well as cooperation in the form of labor sharing, cooperative cash cropping, and informal finance (Blattman et al. 2016), and intangible ways, such as by shaping attitudes and aspirations for the future (Macours and Vakis 2014). Some programs increased access to other government social programs and services (Escobal and Ponce 2016; Kochar et al. 2020). At the same time, there were also negative impacts in terms of resentment and abuse, loss of informal means of support, and sometimes even theft by nonparticipating households, particularly in contexts with limited natural resources (Siddiki et al. 2014) or rigid social hierarchies (Kabeer et al. 2012).
Shocks can halt or even reverse progress toward economic inclusion, but this effect is tempered by household resilience. In many programs, households that were unable to improve or maintain their socioeconomic situation (decliners or crash outs) were adversely affected by a series of shocks that overwhelmed their ability to cope. While shocks upended many upward trajectories, some households (improvers) had the resil-ience to overcome these setbacks and rebuild their livelihoods. This greater resilience was due to better risk management (in terms of greater diversification) and reliance on nonerosive coping strategies. However, the ability to diversify incomes itself depends on attitudes to risk and skills, some level of capital to invest in alternative activities, and household labor availability, while nonerosive coping mechanisms require some resources and access to credit and social networks.31 For instance, in Haiti’s Kore Lavi program, participants who had joined village savings and loans associations were more likely to adopt resilient coping strategies (CARE 2019). These are important levers for economic inclusion programs to influence.
Individual characteristics, such as education and experience, are also important in differentiating participant trajectories. Participants with some prior experience, espe-cially business experience, are able to make more informed decisions about livelihood options offered by economic inclusion programs and to increase their returns. This is particularly important for programs promoting self-employment. For instance, in Bangladesh’s TUP, while most participants were able to move to self-employment in the short to medium term, only existing entrepreneurs managed to sustain their busi-ness (relative to nonparticipants) in the long term (Misha et al. 2019). In many cases, particularly complementary programs, participants are typically selected based on an assessment of capability, employability, and business acumen of potential participants (see chapter 3). Even then, differences in education can impact income gains (Aldana, Vásquez, and Yancari 2016) and employment outcomes (Acosta and Avalos 2018). Some programs found younger participants benefited more than older participants, and, in some cases, positive income and labor supply impact was experienced only by younger and more educated participants (Almeida and Galasso 2010).
Program trajectories are often gendered, with intrahousehold dynamics and gender norms constraining progress toward economic inclusion. For women, social norms, labor availability, and relationship dynamics in the household are important
T H E S T A T E O F E C O N O M I C I N C L U S I O N R E P O R T 2 0 2 1 : T H E P O T E N T I A L T O S C A L E
139
determinants of participant trajectories and overall program impact. In Rwanda, male-headed households were better placed to take up new opportunities, leading to greater improvements in assets and food security relative to female-headed households. For instance, examining asset trajectories, only 36 percent of households grouped as improvers were female-headed, compared to 29 percent of decliners and 56 percent of crash outs (Sabates-Wheeler, Sabates, and Devereux 2018). The reverse was true in Bangladesh, where the program targeted women. In this case, female-headed house-holds substantially increased their incomes in the short term, relative to male-headed households, and were able to match them over time (Misha et al. 2019).
At the same time, personal agency and noncognitive abilities, such as drive, initia-tive, risk taking, and an entrepreneurial spirit, can also put some individuals and their households on a path of sustained income generation. This is particularly relevant for programs promoting self-employment. Many participants are self-employed by neces-sity; only some participants are self-employed by choice and have the necessarily entre-preneurial experience and traits to succeed (see chapter 3). In the Sahel subregion, for example, many focus group participants associated behavioral skills such as being hard working, determined, and courageous with success in farm or nonfarm activities (Bossuroy, Koussoubé, and Premand 2019). In West Bengal, indigenous women were among the fast climbers, despite being the most marginalized group and despite dealing with resentment and barriers to advancement in their communities. This was largely because they viewed the program as their only chance to improve their situation, while the self-help group approach taken by the program helped forge strong horizontal social bonds (Kabeer et al. 2012). In complementary programs, differences in the take-up of various constituent components in the program can also influence overall impact (Escobal and Ponce 2016).
Future Directions
This synthesis makes a strong case for the potential of a broad range of economic inclu-sion programs to impact a wide range of outcomes across diverse contexts. While the first round of evidence came from NGO-led programs, a new wave of evidence will soon emerge from government-led operations, which are increasingly moving to scale. There is a need to ensure that this emerging evidence base balances long-term evidence generation with monitoring and learning that ultimately strengthens program perfor-mance in real time. In this context, key priorities going forward are as follows:32
First, a more systematic evidence base, using comparable outcomes and indicators, would conclusively establish the overall impact of economic inclusion programming across all three entry points, at scale, and over time. In this context, greater effort is needed to expand the evidence base to evaluate the following programs:
• SSN-plus and FI programs
• Government-led programs33
• Programs operating in FCV settings
In addition to the upcoming coordinated research agendas (see appendix B), the next wave of evaluations could draw on the framework presented in chapter 1 to iden-tify common research questions and report on a common set of outcomes and indica-tors. Depending on study comparability, a meta-analysis could combine evidence from multiple evaluations to provide estimates of effect sizes, disaggregated by program entry points, institutional arrangements, program size, and context. The evidence base on the long-term sustainability of impacts also needs to be broadened beyond the

140
T H E S T A T E O F E C O N O M I C I N C L U S I O N R E P O R T 2 0 2 1 : T H E P O T E N T I A L T O S C A L E
current small set of programs. In particular, there is little information on the long-term impact of government-led programsprograms and on the nature of “refresher” interven-tions and other support that may be required for sustained long-term income growth for the poorest. Finally, addressing existing knowledge gaps will require complementing impact evaluations with real-time operational research (such as constraints analysis and other diagnostic studies, performance monitoring, process evaluations, etc.) to iden-tify opportunities to enhance program design and performance. Beyond knowing what works in terms of cost-effectiveness and scalability, program implementers need greater understanding on how to operationalize programs and make them work.
Second, a critical learning agenda is investigating differences in program impact across population groups and understanding the factors driving differences in benefi-ciary trajectories across fast climbers, slow climbers, and crash outs. About 39 percent of programs that reported undertaking an impact evaluation in the PEI Landscape Survey 2020 plan to evaluate customized bundles for different groups. This will require supplementing impact evaluations with operational research to allow cost-effective program customization to suit different characteristics and constraints (see box 6.2 in the next chapter for some emerging evidence on these strategies). A key priority is reconciling the differences between quantitative and qualitative research with respect to impact on women and children. This is critical to design economic inclusion programs that amplify positive impacts (such as personal empowerment and human capital and intergenerational outcomes), avoid unintended negative impacts (such as gender-based violence and child labor), and potentially course-correct and customize support depending on beneficiary trajectories.34
Third, the next wave of evaluations needs to help unpack the bundling of inter-ventions. Although the emerging evidence suggests that bundling interventions is crit-ical for impact, this comes with higher cost and complexity (see chapter 6). Further research is necessary to identify the marginal contribution of constituent interven-tions to overall impact, the role of timing and sequencing in maximizing the impact of a bundled set of interventions, and corresponding implications for cost-effectiveness. This knowledge would benefit operational teams in identifying a bundle that is well sequenced, appropriate to the context, and retains the positive impact of the program at a lower cost. This is particularly important for the scalability of high-cost interventions, such as coaching and training, whose marginal contribution to overall cost- effectiveness we do not yet know.35
Fourth, program evaluations need to be part of broader program monitoring, evaluation, and learning agendas. Supplementing impact evaluations with process evaluations and operational research would enable a deeper understanding of the mechanisms of impact, particularly the role of implementation and overall program performance, both for programs with proven impact and those with no discernible impact. In particular, impact and process evaluations of alternative program delivery models can help identify workable solutions for a variety of program innovations and refinements for a range of contexts, including, for instance, technology-based solutions in hard-to-reach contexts. This has taken on greater urgency in light of the COVID-19 containment measures.
Notes
1. This synthesis must be offered with one note of caution: the results presented here are unavoidably subject to publication bias, as publications usually present only positive findings. It should also be noted that this is not a meta-analysis, and consequently we cannot present estimates of average impact across programs.
T H E S T A T E O F E C O N O M I C I N C L U S I O N R E P O R T 2 0 2 1 : T H E P O T E N T I A L T O S C A L E
141
2. SSN-plus refers to social safety nets–plus, where the “plus” is additional inputs, service components, or links to external services, that complement the cash transfer. There is also a significant gap with respect to FI interventions, which largely mirrors the fact that this is often a secondary, rather than primary, entry point (see chapter 2).
3. As highlighted in chapter 2, stand-alone SSN interventions—like cash transfers—have shown an array of productive impacts, although sometimes with small size effects and often when these were not an explicit program objective. SSNs have led to investments in agricultural assets, inputs and livestock, business and enterprise, and savings, besides improving well-being (in terms of consumption, food security, and human capital) (Bastagli et al. 2016; Ralston, Andrews, and Hsiao 2017; Davis et al. 2016; O’Keefe, Dutta, and Palacios 2020).
4. These feature well-known SSNs, such as Ethiopia’s productive safety nets program (linked to the Household Asset Building Program) and Brazil’s Bolsa Família (linked to the agricultural credit program, Pronaf).
5. Of the total number of programs surveyed for this report, 80 percent have not yet been evaluated, as most are relatively recent.
6. Program duration: For ease of comparability across studies, we define short-term impact as measured immediately after a program concludes or in one to two years after program start (that is, when beneficiaries enroll in the program); medium term as three to four years after program start; and long term as four or more years after program start.
7. Examples include the following: the CGAP–Ford Foundation pilots in Ethiopia, Honduras, Ghana, India, Pakistan, and Peru increased total asset value by 0.26 standard deviations relative to the baseline (Banerjee et al. 2015); Paraguay’s Sembrando Oportunidades Familia por Familia increased total asset value by 0.31 standard deviations relative to that of nonparticipants (and 0.42 standard deviations compared to the baseline of participants) (Maldonado et al. 2019); and Afghanistan’s TUP program increased livestock assets and household assets by 1.06 and 0.36 standard deviations, respectively, relative to nonparticipants (Bedoya et al. 2019).
8. In Afghanistan, where women’s labor participation is very low, the TUP program increased women’s labor participation (including market work, self-employment, or job searching) by 22 percentage points (above a 35 percent average among nonparticipants) (Bedoya et al. 2019). In Tanzania’s PSSN, for example, women were 7.6 percentage points more likely to work on nonfarm activities relative to nonparticipating women. Men, however, were 6.5 percentage points more likely to work on farm activities relative to other men (Rosas et al. 2019).
9. For example, Kenya’s REAP increased the per capita income of participating groups by 34 percent (0.246 standard deviations) compared to nonparticipating groups (Gobin, Santos, and Toth 2016). In the six CGAP–Ford Foundation pilots, participating households increased their total income by 0.383 standard deviations (Banerjee et al. 2015).
10. Only 15 studies report on child health outcomes and 20 studies on education outcomes. In Bangladesh, TUP improved nutrition, reducing the likelihood of being underweight for children under 5 years of age by 10 percentage points (Raza, Van de Poel, and van Ourti 2018). Although older children increased hours spent on own-family livestock rearing and cultivation, this did not crowd out schooling (Bandiera et al. 2017). Haiti’s Chemen Lavi Miyò program resulted in no reduction in care for children and reduced the occurrence of children being sent to work as domestic help (Roelen and Saha 2019), while Burkina Faso’s Trickle Up program reduced children’s exposure to hazardous work (Karimli, Bose, and Kagotho 2019). See Roelen, Sherer, and Himmelstine (2020) for a review of impact on children.
11. A qualitative evaluation of Rwanda’s Vision 2020 Umurenge Programme found increased usage of insurance products due to links made through the program (Gahamanyi and Kettlewell 2015). Similarly, Tanzania’s PSSN increased take-up of health insurance, with 33 percent of participating households enrolled in a health insurance plan compared to just 11 percent of nonparticipating households (Rosas et al. 2019).
12. These results should be at best treated as indicative of the possible directions of programs, as long-term evidence up to seven years is limited to two programs (and an experiment) and up to nine to ten years to three programs only (see box 5.1).
13. Existing entrepreneurs managed to sustain their business (relative to nonparticipants) even nine years after program exit. However, households that had engaged primarily in begging or

142
T H E S T A T E O F E C O N O M I C I N C L U S I O N R E P O R T 2 0 2 1 : T H E P O T E N T I A L T O S C A L E
in domestic or casual wage work were able to sustain their newly created businesses only in the medium term. After nine years, the majority of these households had fallen back to their original employment (Misha et al. 2019). See box 3.3 in chapter 3 on differential profiles of reluctant and transformational entrepreneurs.
14. The long-term impact of stand-alone interventions, including SSNs, is also not yet conclusively established. See, for example, Millán et al. (2019).
15. This is a key concern in scaling up social policy. For stand-alone interventions (including SSNs, microcredit, financial literacy, and women’s empowerment programs), there is some evidence of heterogeneity in effect sizes across programs, with smaller effect sizes in government-led programs relative to experiments or NGO-led programs (Vivalt 2019). The evidence on economic inclusion programs at scale is more limited and, given the diversity in programs, we cannot compare effect sizes.
16. In Andhra Pradesh, Indira Kranti Pratham (IKP); in Bihar, JEEViKA (see case study 2).17. About 80 percent of Haku Wiñay families and 60 percent of PxMF families received
consumption support through the existing conditional cash transfer programs (Juntos and Más Familias en Acción, respectively) (Sheldon 2016).
18. In Brazil, Bolsa Família and Pronaf (Garcia, Helfand, and Souza 2016); in El Salvador, Comunidades Solidarias Rurales and Fondo de Inversión Social para el Desarrollo (de Sanfeliú, Ángel, and Shi 2016); in Peru, Juntos and agricultural credit (Loayza 2015).
19. In Brazil, Bolsa Família and the International Fund for Agricultural Development rural development program (Costa, Helfand, and Souza 2018); in Colombia, Familias en Acción and Oportunidades Rurales (Moya 2016); in Mexico, Prospera and Procampo (Yúnez-Naude et al. 2016); in Chile, Ingreso Ético Familiar (IEF) and enterprise support programs (El Fondo de Solidaridad e Inversión Social, FOSIS) (Fernández et al. 2016); in Kenya, Hunger Safety Net Program and index-based livestock insurance (Jensen, Barrett, and Mude 2017). The programs examined in these studies predate more comprehensive economic inclusion programming in some of the countries (notably, Brazil, Chile, Colombia, and Mexico).
20. See footnote 3 for evidence on stand-alone SSNs. The evidence on active labor market programs (including business grants and training) is mixed. For instance, training programs are likely to have a positive effect on post-program employment rates but not necessarily on earnings, at least in developing countries (Kluve 2016; Betcherman, Olivas, and Dar 2004; Ibarraran and Shady 2009; Card, Kluve, and Weber 2015). It is possible that effects may be more positive for women, especially if constraints on accessibility and child care are addressed (Buvinic and Furst-Nichols 2014), but many would not pass a cost-benefit test (Blattman and Ralston 2015; McKenzie 2017). The small evidence base for farmer field schools suggests impact on knowledge and practices, as well as agricultural production and farmers’ incomes, at least in small pilot projects (Waddington et al. 2014). Financial services such as savings, insurance, and, to a lesser extent, payments have substantial positive impact on building household resilience and empowering poor women; the evidence on other services, such as credit, is more mixed and contextual (El-Zoghbi, Holle, and Soursourian 2019).
21. There may also be important noneconomic benefits. For instance, in Burkina Faso’s Trickle Up livelihood program, supplementing the classic graduation package with family coaching on child protection issues improved children’s mental health functioning, fostered a supportive parenting environment, and reduced exposure to family violence (Karimli, Rost, and Ismayilova 2018; Ismayilova et al. 2018).
22. About 20 percent of Haku Wiñay participants did not qualify for the conditional cash transfer (Juntos) and so did not receive regular cash transfers for consumption support. There were also differences in interventions offered and take-up.
23. Households that received training with the asset transfer were more likely to produce milk (approximately 1.5 liters of milk more per day relative to less than 1 liter per day); this translated into a $0.82 increase in household income from milk, equivalent to about 66 percent of an untrained household’s daily income.
24. All variants had a positive impact on child outcomes (Macours, Schady, and Vakis 2012). 25. Emerging evidence from BRAC’s CFPR-TUP (Das et al. 2016) and Côte d’Ivoire’s PRISE
(Premand and Marguerie 2020) provide some insights with respect to program variants with a cash grant versus a credit or semicredit (chapter 6).

T H E S T A T E O F E C O N O M I C I N C L U S I O N R E P O R T 2 0 2 1 : T H E P O T E N T I A L T O S C A L E
143
26. See chapter 3 for a review of the global landscape of economic inclusion programs and chapter 6 for a detailed discussion on adequacy and component costs for a subset of programs.
27. This chapter does not investigate program performance to understand the extent to which deviations from the intended program design may drive impact.
28. For instance, Chile sought to complement its social protection program (IEF) with entrepreneurship through a public service (FOSIS) but had no impact. It is possible that the IEF beneficiaries (poor elderly and people living in the streets) did not have the right profile, with limited means or skills to participate in the business proposal contests required to access the FOSIS programs (Fernández et al. 2016). Similarly, the lack of aggregate impact of the Oportunidades and Procampo programs in Mexico between 2002 and 2007 may have been due to differences in their target populations; Procampo beneficiaries were not necessarily poor and hence not covered by Oportunidades (Yúnez-Naude et al. 2016).
29. Household and individual characteristics also play a role in explaining heterogeneity. See case study 4.
30. These include horizontal networks, which can provide financial support and share business expertise, and vertical networks, which facilitate opportunities and access to credit and government programs.
31. See Smith et al. (2019) for an analysis of resilience capacity among pastoralist beneficiaries of the PRIME program in drought-prone areas of Ethiopia.
32. Some of these will be addressed through the upcoming research pipeline (appendix B). 33. While the emerging evidence on the short- and medium-term impact of government-led
programs is promising, many programs continue to rely largely on nonevaluative performance assessments. Among programs that reported undertaking an impact evaluation in the PEI Landscape Survey 2020, about 26 percent are planning to evaluate impact at scale.
34. For instance, Innovations for Policy Action (IPA) and Village Enterprise are planning to evaluate the impact of a livelihood program in Ghana on intimate-partner violence and women’s empowerment. About 5 percent of the programs reporting a planned impact evaluation in the PEI Landscape Survey 2020 plan to evaluate intergenerational impact.
35. A subset of programs that reported undertaking an impact evaluation in the PEI Landscape Survey 2020 plan to evaluate the impact of various bundles (40 percent), sequencing (10 percent), impact on noncognitive skills (4 percent), and the marginal impact of some interventions (such as market links, 15 percent). For instance, IPA, Heifer International, and the Ford Foundation are planning to evaluate the impact of alternative bundles (including cognitive behavioral therapy) in Ghana. Upcoming multicountry research on SSN-plus bundling in the Sahel also seeks to answer these questions (Bossuroy et al. 2019).
References
Acosta, Pablo, and Jorge Avalos. 2018. “The Philippines Sustainable Livelihood Program: Providing and Expanding Access to Employment and Livelihood Opportunities.” World Bank Social Protection Policy Note 13, Washington, DC.
Ahmed, A. U., Mehnaz Rabbani, Munshi Sulaiman, and Narayan C. Das. 2009. “The Impact of Asset Transfer on Livelihoods of the Ultra Poor in Bangladesh.” Research Monograph Series 39, Research and Evaluation Division, BRAC, Dhaka.
Aldana, U., T. Vásquez, and J. Yancari. 2016. “Sierra Sur and Juntos: An Analysis Based on the Joint Implementation of Both Programs in Chumbivilcas, Cusco, Perú.” In Protection, Production, Promotion: Exploring Synergies between Social Protection and Productive Development in Latin America, edited by J. H. Maldonado, R. Moreno-Sánchez, J. A. Gómez, and V. L. Jurado. Bogotá: Universidad de los Andes.
Almeida, Rita K., and Emanuela Galasso. 2010. “Jump-Starting Self-Employment? Evidence for Welfare Participants in Argentina.” World Development 38 (5): 742–55. https://doi.org/10.1016/j.worlddev.2009.11.018.

144
T H E S T A T E O F E C O N O M I C I N C L U S I O N R E P O R T 2 0 2 1 : T H E P O T E N T I A L T O S C A L E
Argent, Jonathan, Britta Augsburg, and Imran Rasul. 2014. “Livestock Asset Transfers with and without Training: Evidence from Rwanda.” Journal of Economic Behavior and Organization 108: 19–39.
Asadullah, M. Niaz, and Jinnat Ara. 2016. “Evaluating the Long-Run Impact of an Innovative Anti-Poverty Program: Evidence Using Household Panel Data.” IZA Discussion Paper 9749, Institute of Labor Economics, Bonn.
Asensio, Raúl, Juan Fernández, and María Luisa Burneo. 2016. “Validación herramienta de género FAO para servicios de asesoramiento rural en Perú: Estudio de caso Haku Wiñay.” Manuscript, Instituto de Estudios Peruanos, Lima.
Bandiera, Oriana, Robin Burgess, Narayan Das, Selim Gulesci, Imran Rasul, and Munshi Sulaiman. 2017. “Labor Markets and Poverty in Village Economies.” Quarterly Journal of Economics 132 (2): 811–70.
Bandiera, Oriana, Robin Burgess, S. Gulesci, I. Rasul, and Munshi Sulaiman. 2013. “Can Entrepreneurship Programs Transform the Economic Lives of the Poor?” IZA Discussion Paper 7386, Institute of Labor Economics, Bonn.
Banerjee, Abhijit, Esther Duflo, Raghabendra Chattopadhyay, and Jeremy Shapiro. 2016. “The Long-Term Impacts of a ‘Graduation’ Program: Evidence from West Bengal.” J-PAL Working Paper, Cambridge, MA. https://www.povertyactionlab.org /evaluation/graduating-ultra-poor-india.
Banerjee, Abhijit, Esther Duflo, Nathaneal Goldberg, Dean Karlan, Robert Osei, William Parienté, Jeremy Shapiro, Bram Thuysbaert, and Christopher Udry. 2015. “A Multifaceted Program Causes Lasting Progress for the Very Poor: Evidence from Six Countries.” Science 348 (6236):1260799.
Banerjee, Abhijit, Dean Karlan, Robert Darko Osei, Hannah Trachtman, and Christopher Udry. 2018. “Unpacking a Multi-faceted Program to Build Sustainable Income for the Very Poor.” NBER Working Paper 247271, National Bureau of Economic Research, Cambridge, MA.
Banerjee, Abhijit V., Esther Duflo, and Garima Sharma. 2020. “Long-Term Effects of the Targeting the Ultra Poor Program.” NBER Working Paper w28074, National Bureau of Economic Research, Cambridge, MA.
Bastagli, Francesca, Jessica Hagen-Zanker, Luke Harman, Valentina Barca, Georgina Sturge, Tanja Schmidt, and Luca Pellerano. 2016. Cash Transfers: What Does the Evidence Say? A Rigorous Review of Programme Impact and of the Role of Design and Implementation Features. London: Overseas Development Institute.
Bauchet, Jonathan, Jonathan Morduch, and Shamika Ravi. 2015. “Failure vs. Displacement: Why an Innovative Anti-Poverty Program Showed No Net Impact in South India.” Journal of Development Economics 116: 1–16.
Bedoya, Guadalupe, Aidan Coville, Johannes Haushofer, Mohammad Isaqzadeh, and Jeremy Shapiro. 2019. “No Household Left Behind: Afghanistan Targeting the Ultra Poor Impact Evaluation.” Policy Research Working Paper 8877, World Bank, Washington, DC.
Berhane, Guush, Daniel O. Gilligan, John Hoddinott, Neha Kumar, and Alemayehu Seyoum Taffesse. 2014. “Can Social Protection Work in Africa? The Impact of Ethiopia’s Productive Safety Net Programme.” Economic Development and Cultural Change 63 (1): 1–26. doi:10.1086/677753.
Bertrand, M., Bruno Crépon, Alicia Marguerie, and Patrick Premand. 2017. “Contemporaneous and Post-Program Impacts of a Public Works Program: Evidence from Côte d’Ivoire.” Working Paper, World Bank and J-PAL, Washington, DC. https://www.povertyactionlab.org/evaluation/youth -employment-and-skills-development-cote-divoire.
Betcherman, G., K. Olivas, and A. Dar. 2004. “Impacts of Active Labor Market Programs: New Evidence from Evaluations with Particular Attention to Developing
T H E S T A T E O F E C O N O M I C I N C L U S I O N R E P O R T 2 0 2 1 : T H E P O T E N T I A L T O S C A L E
145
and Transition Countries.” World Bank Social Protection Discussion Paper 0402, Washington, DC.
Blattman, Christopher, Stefan Dercon, and Simon Franklin. 2019. “Impacts of Industrial and Entrepreneurial Jobs on Youth: Five-Year Experimental Evidence on Factory Job Offers and Cash Grants in Ethiopia.” Working Paper 2019-65, University of Chicago.
Blattman, Christopher, Nathan Fiala, and Sebastian Martinez. 2014. “Generating Skilled Self-Employment in Developing Countries: Experimental Evidence from Uganda.” Quarterly Journal of Economics 129: 697–752. doi:10.1093/qje/qjt057.
Blattman, Christopher, Nathan Fiala, and Sebastian Martinez. 2018. “The Long-Term Impacts of Grants on Poverty: Nine-Year Evidence from Uganda’s Youth Opportunities Program.” NBER Working Paper 24999, National Bureau of Econoic Research, Cambridge, MA.
Blattman, Christopher, Eric P. Green, Julian Jamison, M. Christian Lehmann, and Jeannie Annan. 2016. “The Returns to Microenterprise Support among the Ultrapoor: A Field Experiment in Postwar Uganda.” American Economic Journal: Applied Economics 8 (2): 35–64.
Blattman, C., and L. Ralston. 2015. “Generating Employment in Poor and Fragile States: Evidence from Labor Market and Entrepreneurship Programs.” Unpublished paper. http://dx.doi.org/10.2139/ssrn.2622220.
Bossuroy, Thomas, Estelle Koussoubé, and Patrick Premand. 2019. Constraints to Productive Employment Faced by Safety Nets Beneficiaries in the Sahel Results of a Multi-country Qualitative Assessment. Washington, DC: World Bank.
Bossuroy, Thomas, Julia Vaillant, William Parienté, Christopher Udry, Harounan Kazianga, Dean Karlan, Markus Goldstein, and Patrick Premand. 2019. “Promoting Productive Inclusion and Resilience among the Poor: Multi-country RCT of the Sahel Adaptive Social Protection.” AEA RCT Registry, August 29. https://doi .org/10.1257/rct.2544-4.0.
Buvinic, M., and R. Furst-Nichols. 2014. “Promoting Women’s Economic Empowerment: What Works?” World Bank Research Observer 31: 59–101.
CADEP (Centro de Análisis y Difusión de la Economía Paraguaya). 2017. Evaluacion de proceso del programa Sembrando Oportunidades Familia por Familia. Report prepared for La Plataforma de Evaluación y Aprendizaje del Programa Graduación en América Latina. Asunción, Paraguay: Centro de CADEP.
Card, D., J. Kluve, and A. Weber. 2015. “What Works? A Meta Analysis of Recent Active Labor Market Program Evaluations.” IZA Discussion Paper 9236, Institute of Labor Economics Bonn.
CARE. 2019. Kore Lavi Safety Net Beneficiary Resilience Assessment: Listening, Reflecting and Learning on Resilience and Food Security. Washington, DC: USAID.
Chowdhury, Reajul, Elliott Collins, Ethan Ligon, and Munshi Sulaiman. 2017. “Valuing Assets Provided to Low-Income Households in South Sudan.” Discussion Paper, BRAC University, Dhaka, Bangladesh.
Costa, Lorena Vieira, Steven M. Helfand, and André Portela Souza. 2018. No Impact of Rural Development Policies? No Synergies with Conditional Cash Transfers? An Investigation of the IFAD-Supported Gavião Project in Brazil. Rome: International Fund for Agricultural Development.
Daidone, S., B. Davis, M. Knowles, R. Pickmans, N. Pace, and S. Handa. 2017. The Social Cash Transfer Programme and the Farm Input Subsidy Programme in Malawi: Complementary Instruments for Supporting Agricultural Transformation and Increasing Consumption and Productive Activities? Rome: FAO.
Das, Narayan C., Sibbir Ahmad, Anindita Bhattacharjee, Jinnat Ara, and Abdul Bayes. 2016. “Grant vs. Credit-Plus Approach to Poverty Reduction: An Evaluation of BRAC’s Experience with Ultra Poor.” CFPR Working Paper 24, BRAC, Dhaka.

146
T H E S T A T E O F E C O N O M I C I N C L U S I O N R E P O R T 2 0 2 1 : T H E P O T E N T I A L T O S C A L E
Davis, Benjamin, Sudhanshu Handa, Nicola Hypher, Natalia Winder Rossi, Paul Winters, and Jennifer Yablonski. 2016. From Evidence to Action: The Story of Cash Transfers and Impact Evaluation in Sub-Saharan Africa. Oxford: Oxford University Press.
de Mel, Suresh, David McKenzie, and Christopher Woodruff. 2012. “One-Time Transfers of Cash or Capital Have Long-Lasting Effects on Microenterprises in Sri Lanka.” Science 335: 96266. doi:10.1126/science.1212973.
de Mel, Suresh, David McKenzie, and Christopher Woodruff. 2014. “Business Training and female Enterprise Start-Up, Growth, and Dynamics: Experimental Evidence from Sri Lanka.” Journal of Development Economics 106 (C): 199–210.
de Sanfeliú, Margarita Beneke, Amy Ángel, and Mauricio Arturo Shi. 2016. “Conditional Cash Transfer Programs and Rural Development in El Salvador.” In Protection, Production, Promotion: Exploring Synergies between Social Protection and Productive Development in Latin America, edited by J. H. Maldonado, R. Moreno-Sánchez, J. A. Gómez, and V. L. Jurado. Bogotá: Universidad de los Andes.
Deininger, Klaus, and Yanyan Liu. 2009. “Economic and Social Impacts of Self-Help Groups in India.” Policy Research Working Paper 4884, World Bank, Washington, DC.
Deininger, Klaus, and Yanyan Liu. 2013. “Economic and Social Impacts of an Innovative Self-Help Group Model in India.” World Development 43: 149–63. doi:10.1016/j .worlddev.2012.09.019.
Devereux, Stephen, Keetie Roelen, Ricardo Sabates, Dimitri Stoelinga, and Arnaud Dyevre. 2015. Final Evaluation Report: Concern’s Graduation Model Program in Burundi. Brighton, UK: Institute of Development Studies.
Devereux, Stephen, and Ricardo Sabates. 2016. Final Evaluation Report: Enhancing the Productive Capacity of Extremely Poor People in Rwanda. Dublin: Concern Worldwide and IDS.
El-Zoghbi, Mayada, Nina Holle, and Matthew Soursourian. 2019. “Emerging Evidence on Financial Inclusion: Moving from Black and White to Color.” CGAP Focus Note, Consultative Group to Address Poverty, Washington, DC.
Emran, M. S., V. Robano, and S. C. Smith. 2009. “Assessing the Frontiers of Ultra-poverty Reduction: Evidence from Challenging the Frontiers of Poverty Reduction/Targeting the Ultra-poor, an Innovative Program in Bangladesh.” Economic Development and Cultural Change 62: 339–80.
Escobal, Javier, and Carmen Ponce, eds. 2016. Combinando protección social con generación de oportunidades económicas: Una evaluación de los avances del programa Haku Wiñay. Lima: Grupo de Análisis para el Desarrollo.
FAO (Food and Agriculture Organization of the United Nations). 2016. Les transferts productifs (CASH+) au Niger et au Burkina Faso: Une approche innovante pour renforcer les moyens d’existence vulnérables au Sahel. Rome: FAO.
FAO. 2018. FAO and Cash+: How to Maximize the Impacts of Cash Transfers. Rome: FAO.
FAO and UNICEF. 2018. Impact Evaluation of Lesotho’s Child Grants Programme (CGP) and Sustainable Poverty Reduction through Income, Nutrition and Access to Government Services (SPRINGS) Project. Rome and Geneva: FAO and UNICEF.
Fernández, Maria Ignacia, Maria Fernanda Leiva, Jorge Ortega, and Macarena Weason. 2016. “Synergistic Effects between Ingreso Ético Familiar and the Enterprise Support Programs in Chile, 2012–2014.” In Protection, Production, Promotion: Exploring Synergies between Social Protection and Productive Development in Latin America, edited by J. H. Maldonado, R. Moreno-Sánchez, J. A. Gómez and V. L. Jurado. Bogotá: Universidad de los Andes.
Filipski, Mateusz, J. Edward Taylor, Getachew Ahmed Abegaz, Tadele Ferede, Alemayehu Seyoum Taffesse, and Xinshen Diao. 2017. General Equilibrium

T H E S T A T E O F E C O N O M I C I N C L U S I O N R E P O R T 2 0 2 1 : T H E P O T E N T I A L T O S C A L E
147
Impact Assessment of the Productive Safety Net Program in Ethiopia. New Delhi: International Initiative for Impact Evaluation (3ie).
Gahamanyi, Vincent, and Andrew Kettlewell. 2015. “Evaluating Graduation: Insights from the Vision 2020 Umurenge Programme in Rwanda.” IDS Bulletin 46 (2).
Garcia, F., S. M. Helfand, and A. P. Souza. 2016. “Conditional Cash Transfers and Rural Development Policies in Brazil: Exploring Potential Synergies between Bolsa Família and Pronaf.” In Protection, Production, Promotion: Exploring Synergies between Social Protection and Productive Development in Latin America, edited by J. H. Maldonado, R. Moreno-Sánchez, J. A. Gómez and V. L. Jurado. Bogotá: Universidad de los Andes.
Gobin, Vilas J., Paulo Santos, and Russell Toth. 2016. “Poverty Graduation with Cash Transfers: A Randomized Evaluation.” Monash University Economics Working Papers 23-16, Melbourne.
Hernandez, Ricardo, Akhter U. Ahmed, Arifeen Akter, Nusrat Zaitun Hossain, Samira Choudhury, and Mehrab Malek. 2016. An Evaluation of the Program on Enhancing Resilience to Natural Disasters and the Effects of Climate Change in Bangladesh. Dhaka: International Food Policy Research Institute.
Hoddinott, John, Guush Berhane, Daniel O. Gilligan, Neha Kumar, and Alemayehu Seyoum Taffesse. 2012. “The Impact of Ethiopia’s Productive Safety Net Programme and Related Transfers on Agricultural Productivity.” Journal of African Economies 21 (5): 761–86. doi:10.1093/jae/ejs023.
Hoffmann, Vivian, Vijayendra Rao, Upamanyu Datta, Paromita Sanyal, Vaishnavi Surendra, and Shruti Majumdar. 2018. “Poverty and Empowerment Impacts of the Bihar Rural Livelihoods Project in India.” International Initiative for Impact Evaluation (3ie), New Delhi.
Hoffmann, Vivian, Vijayendra Rao, Vaishnavi Surendra, and Upamanyu Datta. 2017. “Relief from Usury: Impact of a Community-Based Microcredit Program in Rural India.” Policy Research Working Paper 8021, World Bank, Washington, DC.
Hoy, Christopher, and Darian Naidoo. 2019. “The Marginal Benefit of an Active Labor Market Program Relative to a Public Works Program: Evidence from Papua New Guinea.” IZA Journal of Development and Migration 10. doi:10.2478 /izajodm-2019-0003.
HTSPE. 2011. Bangladesh: Independent Impact Assessment of the Chars Livelihoods Programme: Phase 1 Final Report. Hemel Hempstead, UK: HTSPE.
Huda, Karishma. 2009. “Mid-term (12 Month) Trickle Up India TUP Process Evaluation: CGAP–Ford Foundation Graduation Pilot.” BRAC Development Institute, Dhaka.
Ibarraran, P., and D. R. Shady. 2009. “Evaluating the Impact of Job Training Programmes in Latin America: Evidence from IDB Funded Operations.” Journal of Development Effectiveness 1 (2): 195–216.
Ismayilova, Leyla, and Leyla Karimli. 2018. “Harsh Parenting and Violence against Children: A Trial with Ultrapoor Families in Francophone West Africa.” Journal of Clinical Child and Adolescent Psychology 49: 1–18. doi:10.1080/15374416.2018 .1485103.
Ismayilova, Leyla, Leyla Karimli, Jo Sanson, Eleni Gaveras, Rachel Nanema, Alexice Tô-Camier, and Josh Chaffin. 2018. “Improving Mental Health among Ultra-Poor Children: Two-Year Outcomes of a Cluster-Randomized Trial in Burkina Faso.” Social Science and Medicine 208: 180–89. doi:10.1016/j.socscimed.2018.04.022.
Ivaschenko, Oleksiy, Darian Naidoo, David Newhouse, and Sonya Sultan. 2017. “Can Public Works Programs Reduce Youth Crime? Evidence from Papua New Guinea’s Urban Youth Employment Project.” IZA Journal of Development and Migration 7 (1): 9. doi:1086/s40176-017-0101-7.
J-PAL and IPA Policy Bulletin. 2015. “Building Stable Livelihoods for the Ultra-Poor.” Abdul Latif Jameel Poverty Action Lab and Innovations for Poverty Action, Cambridge, MA.

148
T H E S T A T E O F E C O N O M I C I N C L U S I O N R E P O R T 2 0 2 1 : T H E P O T E N T I A L T O S C A L E
Jensen, Nathaniel D., Christopher B. Barrett, and Andrew G. Mude. 2017. “Cash Transfers and Index Insurance: A Comparative Impact Analysis from Northern Kenya.” Journal of Development Economics 129: 14–28. doi:https://doi.org /10.1016/j.jdeveco.2017.08.002.
Kabeer, Naila, Karishma Huda, Sandeep Kaur, and Nicolina Lamhauge. 2012. “Productive Safety Nets for Women in Extreme Poverty: Lessons from Pilot Projects in India and Pakistan.” Discussion Paper 28/12, Centre for Development Policy and Research, School of Oriental and African Studies, London.
Kagin, Justin, J. Edward Taylor, Luca Pellerano, Silvio Daidone, Florian Juergens, Noemi Pace, and Marco Knowles. 2019. Local Economy Impacts and Cost-Benefit Analysis of Social Protection and Agricultural Interventions in Malawi. Rome: Food and Agriculture Organization of the United Nations.
Karimli, Leyla, Bijetri Bose, and Njeri Kagotho. 2019. “Integrated Graduation Program and Its Effect on Women and Household Economic Well-being: Findings from a Randomised Controlled Trial in Burkina Faso.” Journal of Development Studies 56 (7): 1–18. doi:10.1080/00220388.2019.1677887.
Karimli, Leyla, Lucia Rost, and Leyla Ismayilova. 2018. “Integrating Economic Strengthening and Family Coaching to Reduce Work-Related Health Hazards among Children of Poor Households: Burkina Faso.” Journal of Adolescent Health 62 (1): S6–S14. doi:10.1080/00220388.2019.1677887.
Kluve, J. 2016. A Review of the Effectiveness of Active Labour Market Programmes with a Focus on Latin America and the Caribbean. Geneva: International Labour Office Research Department.
Kochar, Anjini, Bidisha Barooah, Chandan Jain, Geeta Singh, Nagabhushana Closepet, Raghunathan Narayanan, Ritwik Sarkar, and Rohan Shah. 2020. Impact Evaluation of the National Rural Livelihoods Project. Impact Evaluation Report 128. New Delhi: International Initiative for Impact Evaluation (3ie).
Krishna, Anirudh, Meri Poghosyan, and Narayan Das. 2012. “How Much Can Asset Transfers Help the Poorest? Evaluating the Results of BRAC’s Ultra-poor Programme (2002–2008).” Journal of Development Studies 48: 254–67. doi:10.1080/00220388.2011.621942.
Loayza, Cesar Del Pozo. 2015. “Impact Assessment of Conditional Cash Transfers and Agricultural Credit on the Accumulation of Productive Assets by Rural Households in Peru.” Policy in Focus: Social Protection, Entrepreneurship and Labour Market Activation 12 (2).
Macours, Karen, Patrick Premand, and Renos Vakis. 2012. “Transfers, Diversification and Household Risk Strategies: Experimental Evidence with Lessons for Climate Change Adaptation.” Policy Research Working Paper 6053, World Bank, Washington, DC.
Macours, Karen, Norman Schady, and Renos Vakis. 2012. “Cash Transfers, Behavioral Changes, and Cognitive Development in Early Childhood: Evidence from a Randomized Experiment.” American Economic Journal: Applied Economics 4 (2): 247–73.
Macours, Karen, and Renos Vakis. 2014. “Changing Households’ Investment Behaviour through Social Interactions with Local Leaders: Evidence from a Randomised Transfer Programme.” Economic Journal 124 (576): 607–33. doi:10.1111/ecoj .12145.
Maldonado, Jorge H., Viviana Leon-Jurado, John Gomez, Daniel Rodriguez, and Laura I. Villa. 2019. “The Graduation Approach for the Reduction of Extreme Poverty: Impact Evaluation of Sembrando Oportunidades Familia Por Familia in Paraguay.” Documento CEDE no. 2019-19. http://dx.doi.org/10.2139/ssrn.3411131.
Maldonado, Jorge H., Rocio Moreno-Sánchez, J. A. Gómez, and V. L. Jurado, eds. 2016. Protection, Production, Promotion: Exploring Synergies between Social Protection and Productive Development in Latin America. Bogotá: Universidad de los Andes.

T H E S T A T E O F E C O N O M I C I N C L U S I O N R E P O R T 2 0 2 1 : T H E P O T E N T I A L T O S C A L E
149
McKenzie, D. 2017. “How Effective Are Active Labor Market Programs in Developing Countries? A Critical Review of Recent Evidence.” Policy Research Working Paper 8011, World Bank, Washington, DC.
Millán, Teresa Molina, Tania Barham, Karen Macours, John A. Maluccio, and Marco Stampini. 2019. “Long-Term Impacts of Conditional Cash Transfers: Review of the Evidence.” World Bank Research Observer 34 (1): 119–59. doi:10.1093/WBGro /lky005.
Misha, Farzana, Wameq Raza, J. Ara, and E. Poel. 2019. “How Far Does a Big Push Really Push? Long-Term Effects of an Asset Transfer Program on Employment Trajectories.” Economic Development and Cultural Change 68 (1): 41–62. doi:10.1086/700556.
Moreno-Sánchez, Rocío, Jorge H. Maldonado, Vanesa Martínez, and Arturo Rodríguez. 2018. “Qualitative Evaluation of the Poverty-Alleviation Program Produciendo por mi Futuro in Colombia.” Working Paper 24, Centro de Estudios Sobre Desarrollo Economico (CEDE) Bogotá.
Moreno-Sánchez, Rocío, Vanesa Martínez, Jorge H. Maldonado, and Arturo Rodríguez. 2018. “Changes in Subjective Well-Being, Aspirations and Expectations in Participants of Poverty Alleviation Programs: A Qualitative Analysis of Produciendo Por Mi Futuro in Colombia.” Working Paper 3, Centro de Estudios Sobre Desarrollo Economico (CEDE), Bogotá.
Moya, A. 2016. “Rural Poverty Alleviation Programs in Colombia: An Assessment of the Synergies between Oportunidades Rurales and Familias en Acción.” In Protection, Production, Promotion: Exploring Synergies between Social Protection and Productive Development in Latin America, edited by J. H. Maldonado, R. Moreno-Sánchez, J. A. Gómez and V. L. Jurado. Bogotá: Universidad de los Andes.
Müller, Angelika, Utz Pape, and Laura Ralston. 2019. “Broken Promises: Evaluating an Incomplete Cash Transfer Program.” Policy Research Working Paper 9016. World Bank, Washington, DC.
O’Keefe, Philip, Puja Vasudeva Dutta, and Robert Palacios. 2020. Diverse Paths: The Dynamic Evolution of Social Protection in Asia and the Pacific. Washington, DC: World Bank.
Pace, N., S. Daidone, B. Davis, S. Handa, M. Knowles, and R. Pickmans. 2017. “One Plus One Can Be Greater Than Two: Evaluating Synergies of Development Programmes in Malawi.” Journal of Development Studies 54 (11): 2023–60. doi:10.1080/00220388.2017.1380794.
Premand, Patrick, and Alicia Marguerie. 2020. Résultats de l’Evaluation d’Impact du Projet d’Insertion Socio-Economique pour les populations vulnérables de l’Ouest de Côte d’Ivoire (PRISE). Washington, DC: World Bank.
Prennushi, Giovanna, and A. Gupta. 2014. “Women’s Empowerment and Socio-Economic Outcomes Impacts of the Andhra Pradesh Rural Poverty Reduction Program.” Policy Research Working Paper 6841, World Bank, Washington, DC.
Pritchett, Lant, and Justin Sandefur. 2013. “Context Matters for Size: Why External Validity Claims and Development Practice Don’t Mix.” Center for Global Development Working Paper 336, Washington, DC.
Rakotomanana, Faly, Zo Tahiana Randrianatoandro, and Julia Rachel Ravelosoa. 2018. Mid-term Evaluation Results: The Fiavota Program—Main Report. Geneva and Washington, DC: UNICEF and World Bank.
Ralston, Laura R., Colin Andrews, and Allan Jer-Yu Hsiao. 2017. “The Impacts of Safety Nets in Africa : What Are We Learning?” Policy Research Working Paper WPS 8255, World Bank, Washington, DC.
Raza, W. A., N. C. Das, and F. A. Misha. 2012. “Can Ultra-Poverty Be Sustainably Improved? Evidence from BRAC in Bangladesh.” Journal of Development Effectiveness 4 (2): 257–76.
150
T H E S T A T E O F E C O N O M I C I N C L U S I O N R E P O R T 2 0 2 1 : T H E P O T E N T I A L T O S C A L E
Raza, Wameq A., Ellen Van de Poel, and Tom van Ourti. 2018. “Impact and Spillover Effects of an Asset Transfer Programme on Malnutrition: Evidence from a Randomised Control Trial in Bangladesh.” Journal of Health Economics 62: 105–20.
Roelen, K., and S. Devereux. 2019. “Money and the Message: The Role of Training and Coaching in Graduation Programming.” Journal of Development Studies 55 (6): 1121–39.
Roelen, Keetie, and Amrita Saha. 2019. Fonkoze’s CLM Ultra Poverty Programme: Understanding and Improving Child Development and Child Well-being—Endline Report. Brighton, UK: Institute of Development Studies, University of Sussex.
Roelen, K., M. Sherer, and C. L. Himmelstine. 2020. “The Role of Graduation Programming in Promoting Early Childhood Development: An Overview of the Evidence.” Journal of the British Academy 8 (s2): 133–61.
Rosas, Nina, Samantha Zaldivar, Maria Julia Granata, Gaew Lertsuridej, Nicholas Wilson, Albina Chuwa, Rainer Kiama, Mayasa Mahfoudh Mwinyi, and Asia Hassan Mussa. 2019. Evaluating Tanzania’s Productive Social Safety Net: Findings from the Midline Survey. Washington, DC: World Bank.
Sabates-Wheeler, Rachel, and Stephen Devereux. 2012. “Cash Transfers and High Food Prices: Explaining Outcomes on Ethiopia’s Productive Safety Net Programme.” Food Policy 35 (4): 274–85.
Sabates-Wheeler, Rachel, and Stephen Devereux. 2013. “Transforming Livelihoods for Resilient Futures: How to Facilitate Graduation in Social Protection Programmes.” Development and Change 35 (4): 274–85.
Sabates-Wheeler, Rachel, Jeremy Lind, and John Hoddinott. 2013. “Implementing Social Protection in Agro-pastoralist and Pastoralist Areas: How Local Distribution Structures Moderate PSNP Outcomes in Ethiopia.” World Development 50: 1–12. https://doi.org/10.1016/j.worlddev.2013.04.005.
Sabates-Wheeler, R., R. Sabates, and S. Devereux. 2018. “Enabling Graduation for Whom? Identifying and Explaining Heterogeneity in Livelihood Trajectories Post-Cash Transfer Exposure.” Journal of International Development 30: 1071–95.
Sedlmayr, Richard, Anuj Shah, and Munshi Sulaiman. 2019. “Cash-Plus: Poverty Impacts of Alternative Transfer-Based Approaches.” Journal of Development Economics 102418. https://doi.org/10.1016/j.jdeveco.2019.102418.
Sengupta, Anasuya. 2012. Pathways out of the Productive Safety Net Programme: Lessons from a Graduation Pilot in Ethiopia. Dhaka: BRAC Development Institute.
Sheldon, Tony, ed. 2016. Preserving the Essence, Adapting for Reach: Early Lessons from Large-Scale Implementations of the Graduation Approach. New York: Ford Foundation.
Shoaf, Emma, and Anton Simanowitz. 2019. Pathways to Sustained Exit from Extreme Poverty: Evidence from Fonkoze’s Extreme Poverty ‘Graduation’ Programme. Brighton, UK: Institute of Development Studies.
Siddiki, Omar Faruque, Rebecca Holmes, Ferdous Jahan, Fahim Subhan Chowdhury, and Jessica Hagen-Zanker. 2014. How Do Social Safety Nets Contribute to Social Inclusion in Bangladesh? Evidence from the Chars Livelihoods Programme and the Vulnerable Group Development Programme. London: Overseas Development Institute.
Slater, R., S. Wiggins, L. Harman, M. Ulrichs, L. Scott, M. Knowles, P. Pozarny, and G. Calcagnini. 2016. Strengthening Coherence between Agriculture and Social Protection: Synthesis of Seven Country Case Studies. Rome: FAO.
Smith, Lisa, Tim Frankenberger, K. Fox, S. Nelson, and T. Griffin. 2019. Ethiopia Pastoralist Areas Resilience Improvement and Market Expansion (PRIME) Project Impact Evaluation: Endline Survey Report. Prepared for the US Agency for International Development. Washington, DC: USAID.

T H E S T A T E O F E C O N O M I C I N C L U S I O N R E P O R T 2 0 2 1 : T H E P O T E N T I A L T O S C A L E
151
Soares, Fabio Veras, Marco Knowles, Silvio Daidone, and Nyasha Tirivayi. 2017. Combined Effects and Synergies between Agricultural and Social Protection Interventions: What Is the Evidence So Far? Rome: FAO.
Taylor, J. E., K. Thome, and M. Filipski. 2016. “Local Economy-wide Impact Evaluation of Social Cash Transfer Programmes.” In The Promise of Social Protection: Social and Productive Impacts of Cash Transfer Programmes in Sub-Saharan Africa, edited by B. Davis, S. Handa, N. Hypher, N. Winder Rossi, P. Winters, and J. Yablonski. Oxford: Oxford University Press.
Tirivayi, N., M. Knowles, and B. Davis. 2013. The Interaction between Social Protection and Agriculture: A Review of Evidence. Rome: FAO.
Vivalt, Eva. 2019. “How Much Can We Generalize from Impact Evaluations?” Unpublished paper. Australian National University.
Waddington, Hugh, Birte Snilstveit, Jorge Hombrados, Martina Vojtkova, Daniel Phillips, Philip Davies, and Howard White. 2014. Farmer Field Schools for Improving Farming Practices and Farmer Outcomes: A Systematic Review. Campbell Systematic Reviews 6. Oslo: Campbell Collaboration.
Yúnez-Naude, Antonio, George Dyer-Leal, Fabiola Rivera-Ramírez, and Omar Stabridis-Arana. 2016. “The Fight against Poverty Program and Rural Development Policies in Mexico: Impact Assessments and Alternative Policies.” In Protection, Production, Promotion: Exploring Synergies between Social Protection and Productive Development in Latin America, edited by J. H. Maldonado, R. Moreno-Sánchez, J. A. Gómez, and V. L. Jurado. Bogotá: Universidad de los Andes.