Embed Size (px)
Citation preview

CHAPTER 5 � AIR TOXICS 79
NATIONAL AIR QUALITY AND EMISSIONS TRENDS REPORT, 1999
C H A P T E R 5
Air Toxicshttp://www.epa.gov/oar/aqtrnd99/chapter5.pdf
Worth Noting:� For all 188 HAPs, there is a 23-percent
reduction in emissions between the1990�1993 baseline and 1996. For the33 urban HAPs, there is a 30-percentreduction in air toxics emissionsbetween baseline and 1996. Themajority of these reductions areattributable to two source types withexisting regulatory programs: majorsources and onroad mobile sources.
� Ambient monitoring results generallyreveal downward trends for mostmonitored HAPs. The most consistentimprovements are apparent for benzenewhich is predominantly emitted bymobile sources; and for total suspendedlead. From 1994�1999, annual averageconcentrations for these two HAPsdeclined 40 and 47 percent respectively.
Background
Hazardous air pollutants (HAPs),commonly referred to as air toxics ortoxic air pollutants are pollutantsknown to cause or suspected of caus-ing cancer or other serious humanhealth effects or ecosystem damage.The Clean Air Act (CAA) lists 188HAPs and directs EPA to regulatesources emitting major amounts ofthese identified pollutants.1 Examplesof HAPs include heavy metals (e.g.,mercury and chromium), volatilechemicals (e.g., benzene and perchlo-
roethylene), combustion byproducts(e.g., dioxins) and solvents (e.g., car-bon tetrachloride and methylenechloride). In addition, EPA has recent-ly listed diesel particulate matter plusdiesel exhaust organic gases as amobile source air toxic and has ad-dressed diesel exhaust in severalregulatory actions. EPA’s list of mo-bile source air toxics also includes 20other pollutants which are includedamong the list of 188 HAPs.
Hazardous air pollutants are emit-ted from literally thousands ofsources including large stationaryindustrial facilities (such as electricpower plants), smaller area sources(such as neighborhood dry cleaners),mobile sources (such as automobiles),indoor sources (such as some build-ing materials and cleaning solvents),and other sources (such as wildfires).
Factors such as weather, the terrain(i.e., mountains, plains, valleys), andthe chemical and physical propertiesof a pollutant determine how far it istransported, its concentration at vari-ous distances from the source, whatkind of physical and chemicalchanges it undergoes, and whether itwill degrade, remain airborne, ordeposit to land or water. Some HAPs(such as chromium) remain airborneand contribute to air pollution prob-lems far from the pollution source.Other HAPs (such as mercury) arereleased into the air and can be depos-ited to land and water bodies through
precipitation, or by settling directly outof the air onto land or water.
Health and Environmental EffectsThe degree to which a toxic air pol-lutant affects a person’s health de-pends on many factors, including thequantity of pollutant the person isexposed to, the duration and frequen-cy of exposures, the toxicity of thepollutant, and the person’s state ofhealth and susceptibility. The differ-ent health effects that may be causedby HAPs include cancer; neurologi-cal, cardiovascular, and respiratory
Potential Effectsof Air ToxicsHuman Health
� Cancer
� Birth defects
� Developmental delays
� Reduced immunity
� Difficulty in breathing and respiratorydamage
� Headache, dizziness, and nausea
Environmental
� Reproductive effects and developmentaldelays in wildlife
� Toxicity to aquatic plants and animals
� Accumulation of pollutants in the foodchain

80 AIR TOXICS � CHAPTER 5
NATIONAL AIR QUALITY AND EMISSIONS TRENDS REPORT, 1999
effects; effects on the liver, kidney,immune system, and reproductivesystem; and effects on fetal and childdevelopment. The timing and severi-ty of the effect (e.g., minor or revers-ible vs. serious, irreversible, andlife-threatening) may vary amongHAPs and with the exposure circum-stances. In some cases effects can beseen immediately; in other cases theresulting effects (e.g., liver damage orcancer) are associated with long-termexposures and may not appear untilyears after exposure. Roughly half ofthe 188 HAPs have been classified byEPA as “known,” “probable,” or“possible” human carcinogens.Known human carcinogens are thosethat have been demonstrated to causecancer in humans. Examples includebenzene, which has caused leukemiain workers exposed over severalyears in their workplace air, and ar-senic, which has been associated withelevated lung cancer rates in workersat metal smelters. Probable and possi-ble human carcinogens include chem-icals that we are less certain causecancer in people, yet for which labo-ratory animal testing or limited hu-man data indicate carcinogeniceffects. For example, EPA concludedthat diesel exhaust is likely to becarcinogenic to humans at environ-mental levels that the public faces(classifying it as a “probable humancarcinogen”).2
Some HAPs pose particular haz-ards to people of a certain stage in life(e.g., young children, adolescents,adults, or elderly people). SomeHAPs are developmental or repro-ductive toxicants in humans. Thismeans that exposure before birth orduring childhood may interfere withnormal development into a healthyadult. Other such exposures mayaffect the ability to conceive or give
birth to a healthy child. Ethyleneoxide, for example, has been associ-ated with increased miscarriages inexposed workers and has affectedreproductive ability in both male andfemale laboratory animals.
Some HAPs are of particular con-cern because they degrade veryslowly or not at all, as in the case ofmetals such as mercury or lead. Thesepersistent HAPs can remain in theenvironment for a long time and canbe transported great distances. Per-sistent and bioaccumulative HAPsare of particular concern in aquaticecosystems because the pollutantsaccumulate in sediments and maybiomagnify in tissues of animals atthe top of the food chain throughconsumption or uptake to concentra-tions many times higher than in thewater or air. In this case, exposure topeople occurs by eating contaminatedfood from waters polluted from thedeposition of these HAPs. As of July2000, for example, 40 states and theAmerican Samoa have issued fishconsumption advisories for mercury.Thirteen of those states have issuedadvisories for all water bodies in theirstate and the other 27 states haveissued advisories for more than 1900specific water bodies.3
Hazardous air pollutants can havea variety of environmental impacts inaddition to the threats they pose tohuman health. Like humans, animalscan experience health problems ifthey are exposed to sufficient concen-trations of HAPs over time. For ex-ample, exposures to PCBs, dioxins,and dibenzo-furans are suspected ofcausing death and deformities tovarious bird chicks.4 These pollut-ants are also thought to have hadadverse impacts on reproduction oflake trout.5 Mercury is also thought topose a significant risk to wildlife. Meth-
ylmercury levels in fish in numerouswaterbodies have been shown to ex-ceed levels associated with adverseeffects on birds.6 These and other ob-servations have led some scientists toconclude that fish-eating birds andmammals occupying a variety of habi-tats are at risk due to high levels ofmethylmercury in aquatic food webs.
National Air Toxics ControlProgramSince 1990, EPA has made consider-able progress in reducing emissionsof air toxics through regulatory, vol-untary, and other programs. To date,the overall air toxics program hasfocused on reducing emissions of the188 air toxics from major stationarysources through the implementationof technology-based emissions stan-dards as specified by Congress in the1990 CAA Amendments. These ac-tions have resulted in, or are project-ed to result in, substantial reductionsin air toxics emissions. Additionally,actions to address mobile sourcesunder other CAA programs haveachieved significant reductions in airtoxics emissions (e.g., the phase-outof lead from gasoline). Many motorvehicle and fuel emission controlprograms of the past have reduced airtoxics. Several current EPA programsfurther reduce air toxics emissionsfrom a wide variety of mobile sourc-es. These include the reformulatedgasoline (RFG) program, the nationallow emission vehicle (NLEV) pro-gram, and Tier 2 motor vehicle emis-sion standards and gasoline sulfurcontrol requirements. In addition, EPAhas recently issued regulations to ad-dress emissions of toxic air pollutantsfrom motor vehicles and their fuels aswell as stringent standards for heavy-duty trucks and buses and diesel fuelthat will lead to a reduction in emis-
CHAPTER 5 � AIR TOXICS 81
NATIONAL AIR QUALITY AND EMISSIONS TRENDS REPORT, 1999
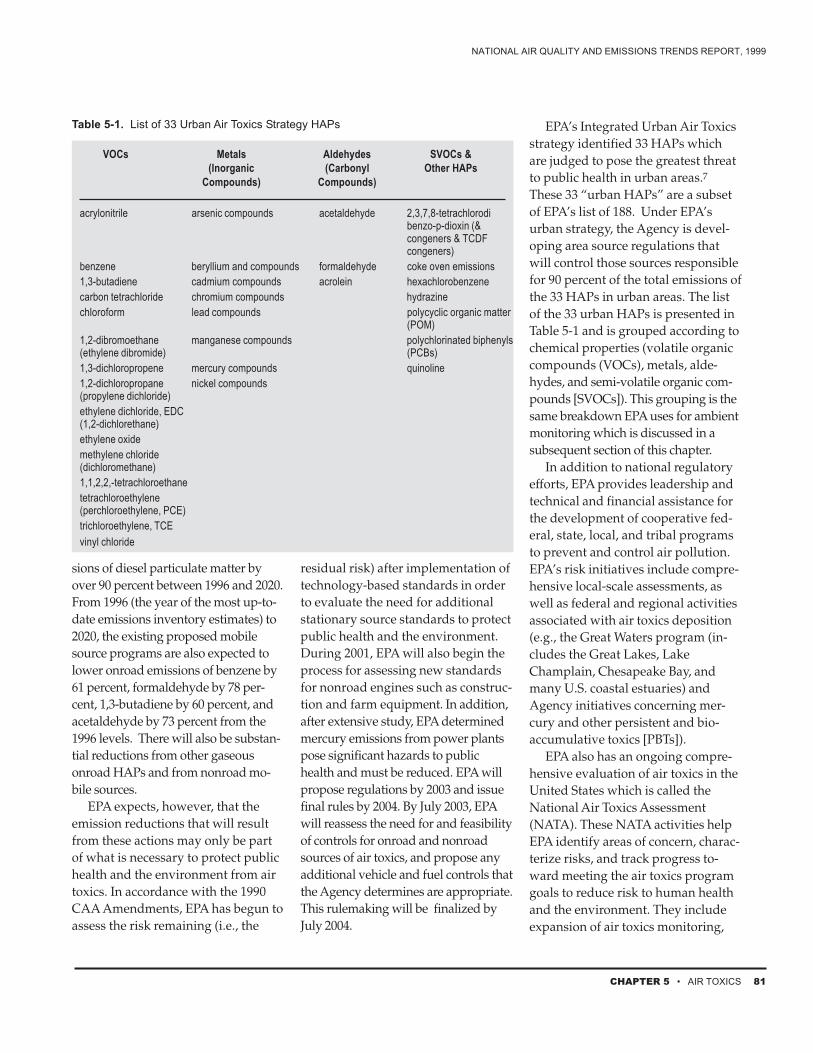
Table 5-1. List of 33 Urban Air Toxics Strategy HAPs
VOCs Metals Aldehydes SVOCs &(Inorganic (Carbonyl Other HAPs
Compounds) Compounds)
acrylonitrile arsenic compounds acetaldehyde 2,3,7,8-tetrachlorodibenzo-p-dioxin (&congeners & TCDFcongeners)
benzene beryllium and compounds formaldehyde coke oven emissions1,3-butadiene cadmium compounds acrolein hexachlorobenzenecarbon tetrachloride chromium compounds hydrazinechloroform lead compounds polycyclic organic matter
(POM)1,2-dibromoethane manganese compounds polychlorinated biphenyls(ethylene dibromide) (PCBs)1,3-dichloropropene mercury compounds quinoline1,2-dichloropropane nickel compounds(propylene dichloride)ethylene dichloride, EDC(1,2-dichlorethane)ethylene oxidemethylene chloride(dichloromethane)1,1,2,2,-tetrachloroethanetetrachloroethylene(perchloroethylene, PCE)trichloroethylene, TCEvinyl chloride
sions of diesel particulate matter byover 90 percent between 1996 and 2020.From 1996 (the year of the most up-to-date emissions inventory estimates) to2020, the existing proposed mobilesource programs are also expected tolower onroad emissions of benzene by61 percent, formaldehyde by 78 per-cent, 1,3-butadiene by 60 percent, andacetaldehyde by 73 percent from the1996 levels. There will also be substan-tial reductions from other gaseousonroad HAPs and from nonroad mo-bile sources.
EPA expects, however, that theemission reductions that will resultfrom these actions may only be partof what is necessary to protect publichealth and the environment from airtoxics. In accordance with the 1990CAA Amendments, EPA has begun toassess the risk remaining (i.e., the
residual risk) after implementation oftechnology-based standards in orderto evaluate the need for additionalstationary source standards to protectpublic health and the environment.During 2001, EPA will also begin theprocess for assessing new standardsfor nonroad engines such as construc-tion and farm equipment. In addition,after extensive study, EPA determinedmercury emissions from power plantspose significant hazards to publichealth and must be reduced. EPA willpropose regulations by 2003 and issuefinal rules by 2004. By July 2003, EPAwill reassess the need for and feasibilityof controls for onroad and nonroadsources of air toxics, and propose anyadditional vehicle and fuel controls thatthe Agency determines are appropriate.This rulemaking will be finalized byJuly 2004.
EPA’s Integrated Urban Air Toxicsstrategy identified 33 HAPs whichare judged to pose the greatest threatto public health in urban areas.7These 33 “urban HAPs” are a subsetof EPA’s list of 188. Under EPA’surban strategy, the Agency is devel-oping area source regulations thatwill control those sources responsiblefor 90 percent of the total emissions ofthe 33 HAPs in urban areas. The listof the 33 urban HAPs is presented inTable 5-1 and is grouped according tochemical properties (volatile organiccompounds (VOCs), metals, alde-hydes, and semi-volatile organic com-pounds [SVOCs]). This grouping is thesame breakdown EPA uses for ambientmonitoring which is discussed in asubsequent section of this chapter.
In addition to national regulatoryefforts, EPA provides leadership andtechnical and financial assistance forthe development of cooperative fed-eral, state, local, and tribal programsto prevent and control air pollution.EPA’s risk initiatives include compre-hensive local-scale assessments, aswell as federal and regional activitiesassociated with air toxics deposition(e.g., the Great Waters program (in-cludes the Great Lakes, LakeChamplain, Chesapeake Bay, andmany U.S. coastal estuaries) andAgency initiatives concerning mer-cury and other persistent and bio-accumulative toxics [PBTs]).
EPA also has an ongoing compre-hensive evaluation of air toxics in theUnited States which is called theNational Air Toxics Assessment(NATA). These NATA activities helpEPA identify areas of concern, charac-terize risks, and track progress to-ward meeting the air toxics programgoals to reduce risk to human healthand the environment. They includeexpansion of air toxics monitoring,
82 AIR TOXICS � CHAPTER 5
NATIONAL AIR QUALITY AND EMISSIONS TRENDS REPORT, 1999
improving and periodically updatingemissions inventories, developingbetter air toxics emission factors fornonroad sources, improving national-and local-scale modeling, continuedresearch on health effects and expo-sures to both ambient and indoor air,and improvement of assessment tools.
For indoor air toxics, EPA’s pro-gram has relied on education andoutreach to achieve reductions. EPA’svoluntary programs that focus onindoor air pollution have been verysuccessful in reducing indoor airpollution. For example, throughEPA’s voluntary Tools for Schools Pro-
gram, there have been significant reduc-tions in children’s exposure to air toxicsin 4,000 schools across the country.EPA is also developing a specific strat-egy for indoor air toxics that willpresent an approach to evaluate infor-mation, characterize potential indoorexposures and risks, and identify meth-ods to reduce air toxics indoors. Addi-tional information about indoor airtoxics activities is available at:www.epa.gov/iaq/pubs/index.html.
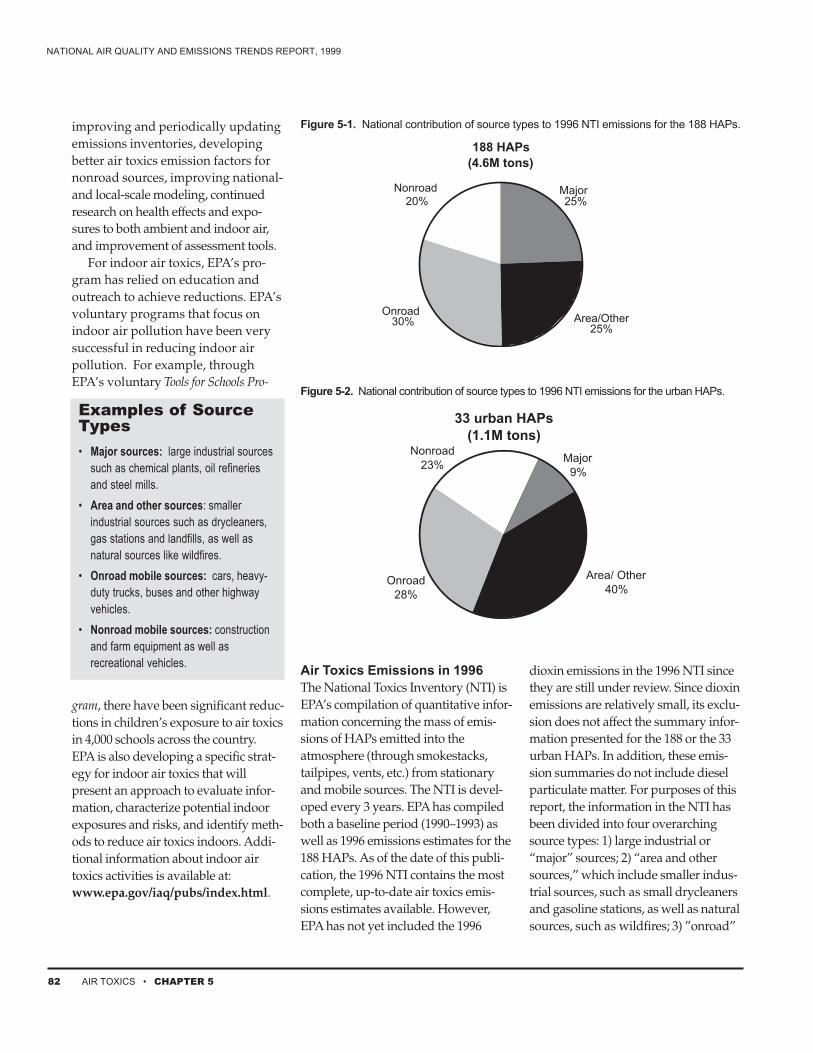
Figure 5-1. National contribution of source types to 1996 NTI emissions for the 188 HAPs.
Figure 5-2. National contribution of source types to 1996 NTI emissions for the urban HAPs.
Air Toxics Emissions in 1996The National Toxics Inventory (NTI) isEPA’s compilation of quantitative infor-mation concerning the mass of emis-sions of HAPs emitted into theatmosphere (through smokestacks,tailpipes, vents, etc.) from stationaryand mobile sources. The NTI is devel-oped every 3 years. EPA has compiledboth a baseline period (1990–1993) aswell as 1996 emissions estimates for the188 HAPs. As of the date of this publi-cation, the 1996 NTI contains the mostcomplete, up-to-date air toxics emis-sions estimates available. However,EPA has not yet included the 1996
dioxin emissions in the 1996 NTI sincethey are still under review. Since dioxinemissions are relatively small, its exclu-sion does not affect the summary infor-mation presented for the 188 or the 33urban HAPs. In addition, these emis-sion summaries do not include dieselparticulate matter. For purposes of thisreport, the information in the NTI hasbeen divided into four overarchingsource types: 1) large industrial or“major” sources; 2) “area and othersources,” which include smaller indus-trial sources, such as small drycleanersand gasoline stations, as well as naturalsources, such as wildfires; 3) ”onroad”
Examples of SourceTypes� Major sources: large industrial sources
such as chemical plants, oil refineriesand steel mills.
� Area and other sources: smallerindustrial sources such as drycleaners,gas stations and landfills, as well asnatural sources like wildfires.
� Onroad mobile sources: cars, heavy-duty trucks, buses and other highwayvehicles.
� Nonroad mobile sources: constructionand farm equipment as well asrecreational vehicles.

CHAPTER 5 � AIR TOXICS 83
NATIONAL AIR QUALITY AND EMISSIONS TRENDS REPORT, 1999
Figure 5-3. National contribution by emission source type for individual urban HAPs and diesel particulate matter, 1996.
mobile, including highway vehicles;and 4) “nonroad” mobile sources, likeaircraft, locomotives, and lawn mowers.
Figures 5-1 and 5-2 provide a sum-mary of the national emissions in the1996 NTI based on source types for the188 HAPs as well as the 33 urbanHAPs, respectively. Note that emis-sions of the 33 urban HAPs representroughly a quarter (23 percent) of the1996 emissions of the 188 HAPs. Asshown in Figure 5-1, the national emis-sions of the 188 HAPs are relativelyequally divided between the four typesof sources. For the 33 urban HAPs,however, area and other sources are thelargest overall contributor (40 percent),while major sources account for lessthan 10 percent of the nationwide emis-
sions and mobile sources make up theremaining 51 percent.
Figure 5-3 provides the percent ofemissions by source type for each ofthe 33 urban HAPs that have avail-able emissions information (i.e., ex-cluding dioxin). It also containsinformation on diesel particulatematter. Note that for each bar, theindividual contributions total to 100percent. Also, the center vertical linein the chart is zero so that the mobilesource contributions are shown onthe right side of the chart for ease ofdisplay. The contributions from eachsource type vary by pollutant. Forexample, acetaldehyde and benzenehave mobile sources as the dominantcontributor, hydrazine and coke ovenemissions are dominated by major
sources, and perchlorethylene is pre-dominantly from area and othersources. Since the other 156 HAPsare not represented here, this graphprovides a subset of information onwhat source types emit which HAPs.For example, nine of the 21 HAPsEPA has identified as mobile sourceair toxics are not included in Figure 5-3. Table A-21 shows the 21 mobilesource air toxics, including dieselparticulate matter, and their contribu-tions from mobile sources.
Also, note that Figure 5-3 does notprovide any information about therelative magnitude of emissions. Forexample, benzene and formaldehydetogether represent about 64 percent
Note: For aldehydeemissions (formaldehydeand acetaldehyde) contri-butions are for primarydirect emissions and donot include secondaryaldehydes formed viaphotochemical reactions.

84 AIR TOXICS � CHAPTER 5
NATIONAL AIR QUALITY AND EMISSIONS TRENDS REPORT, 1999
(roughly 32 percent each) of the totalemissions of these 32 urban HAPs.Conversely, 23 of the urban HAPs,including lead, chromium, and PCBseach represent less than 1 percent of thetotal emissions of the 33 urban HAPs.
Figure 5-4 provides additionaldetail on the source sector emissionsfrom the 1996 NTI to show the rela-tive percentages of sources that arefound in urban versus rural areas forall 188 HAPs. Figure 5-5 shows thissame breakdown for the 33 urbanHAPs subset. For the 188 HAPs,urban sources dominate the emis-sions for all source types. For the 33urban HAPs, there is one source type,area and other sources, which hasroughly the same percentage contri-bution of urban and rural sources.
Trends in Air Toxics EmissionsTrends in air toxics emissions areshown in Figure 5-6 based on com-parison of a baseline period of NTIemissions data (1990–1993) to the1996 NTI. The bar for each time peri-od includes both the national total forthe 188 HAPs as well as the fractionof the national emissions that areassociated with the urban HAPs. Forall 188 HAPs, there is a 23-percentreduction between the baseline and1996. For the 33 urban HAPs, there isa 30-percent reduction between base-line and 1996. The majority of thesereductions are attributable to twosource types with existing regulatoryprograms: major sources and onroadmobile sources. For the 188 HAPs,major source emissions (which ac-counted for 25 percent of the totalemissions in 1996) decreased by 58percent and onroad mobile sourceemissions (which accounted for 30percent of the total emission in 1996)decreased by 16 percent. Althoughdifferences in how EPA compiled the
Figure 5-5. Urban/rural splits by source type for the 1996 national emissions of 33urban HAPs.
Figure 5-4. Urban/rural splits by source type for the 1996 national emissions of 188 HAPs.
inventory over time could account forsome of the current estimates ofchanges in emissions, EPA and stateregulations, as well as voluntaryreductions by industry, have clearlyachieved large reductions in overallair toxic emissions.
Ambient MonitoringAmbient measurements, which pro-vide the concentration of a HAP at aparticular monitored location at a pointin time, are useful to characterize air
quality. These measurements are usedto derive trends in HAP concentrationsto help evaluate the effectiveness ofHAP reduction strategies. They also canprovide data to support and evaluatedispersion and deposition models.
Unlike criteria air pollutants, such ascarbon monoxide and sulfur dioxide(which have been monitored since the1970s), there is no national air toxicsmonitoring system. However, there areapproximately 300 monitoring sitescurrently producing ambient data on

CHAPTER 5 � AIR TOXICS 85
NATIONAL AIR QUALITY AND EMISSIONS TRENDS REPORT, 1999
HAPs. These include sites within sev-eral states that have long-standing airtoxics monitoring programs as well assites of the Interagency Monitoring ofProtected Visual Environments (IM-PROVE) visibility network which pro-vides historical information about HAPtrace metals in rural areas. The currentmonitoring sites also include thoseparticipating in the Urban Air ToxicsMonitoring Program which provides ayear’s worth of measurements of 39HAP VOCs and 13 carbonyl com-pounds.8 In addition, the Agency’sPhotochemical Assessment MonitoringStations (PAMS) program requiresroutine year-round measurement ofVOCs which include nine HAPs: acetal-dehyde, benzene, ethylbenzene, formal-dehyde, n-hexane, styrene, toluene,xylenes (m/p-xylene, o-xylene) and 2,2,4-trimethlypentane. For a more detaileddiscussion of the PAMS program, see theozone section in Chapter 2 of this re-port. At the present time, the collectionof current state and local air toxicsmonitoring data and PAMS data islimited in its geographic scope and it
Figure 5-6. Change in national air toxics emissions � baseline (1990�1993) to 1996.
does not cover many HAPs for moststates. In addition the sites are notnecessarily at locations which representthe highest area-wide concentrations.Nevertheless, they can still be used toprovide useful information on the trendsin ambient air toxics at this time.
EPA is working together with stateand local air monitoring agencies tobuild upon these sites to develop amonitoring network with the follow-ing objectives: to characterize airtoxics problems on a national scale; toprovide a means to obtain data on amore localized basis as appropriateand necessary (e.g., to evaluate po-tential “hot spots” near sources), andto help evaluate air quality models.However, there are a significant num-ber of the 188 HAPs for which EPAdoes not yet have a monitoringmethod developed. For this reason,EPA is devoting its resources onbuilding up the air toxics monitoringnetwork by first focusing on the 33urban HAPs. The states currentlyhave the capability to monitor for 28of the 33 urban HAPs. As the moni-
toring network is enhanced, EPA willassist the states to continue to add toboth the geographic scope of themonitoring as well as the number ofHAPs included. The network willrepresent an integration of informa-tion from many monitoring pro-grams, including existing state andlocal air toxic monitoring sites;PAMS, and the new urban PM2.5
chemical speciation and rural IM-PROVE program networks. This newnational network will be developedover the next several years.9
Trends In Ambient ConcentrationsThe most widely measured HAP hasbeen lead, which is also a criteriapollutant. Until recently, it has beenmonitored in most states, both inmetropolitan and non-metropolitanareas. Nineteen states have moni-tored other urban HAPs in their met-ropolitan areas since 1994. Inaddition, several VOCs, aldehydesand metals have good data history inmetropolitan areas. Most of thesemonitors, however, are concentratedin a few states, with 36 percent ofthem in California alone. Neverthe-less, these data can be used to pro-vide a preliminary picture ofnationwide trends in air toxics. Agood history of several trace metalconcentrations in rural areas is de-rived from the IMPROVE program.However, long-term monitoring inrural areas for VOCs and aldehydeshas generally been more limited. Thelocations for the urban and ruralmonitors with long-term data areshown in Figure 5-7.
Trends derived from these data areseparately presented for metropolitan(urban) and non-metropolitan (rural)sites. Table 5-2 presents a nationalsummary of these 6-year trends in

86 AIR TOXICS � CHAPTER 5
NATIONAL AIR QUALITY AND EMISSIONS TRENDS REPORT, 1999
ambient air toxics concentrations inmetropolitan statistical areas. Amongthe 33 HAPs on the urban strategylist, 25 pollutants have sufficienthistorical data for this 6-year trendsassessment. These air contaminantsinclude 13 of the 15 urban VOCs, alleight urban HAP trace metals, thethree aldehydes and several specificpolycyclic aromatic hydrocarbons(PAHs). Also included are styreneand toluene, which are two addi-tional pervasive air toxics whosemonitoring sites have good nation-wide coverage. The table presentsthe number of sites with increasesand decreases in measured ambientconcentrations from 1994–1999. Fortrace metals, the table includes resultsrepresenting more than one particu-late size fraction. Similarly, trends areshown separately for several indi-vidual PAHs which are constituentsof polycyclic organic matter (POM).For each of these HAPs with suffi-cient historical data, the number ofsites with statistically significantchanges are highlighted. When mostindividual locations reveal a consistentchange (and when many are statisti-cally significant), this is more character-istic of a national trend.
Although these ambient air toxicsdata are only available for a limitednumber of metropolitan areas, theresults generally reveal downwardtrends for most monitored HAPs.The most consistent improvementsare apparent for benzene which ispredominantly emitted by mobilesources; and for total suspended lead.From 1994–1999, annual averageconcentrations for these two HAPsdeclined 40 and 47 percent respec-tively. The majority of ambient con-centrations of lead once came fromthe tail pipe of cars. Since the mid-90s, however, lead has been largely
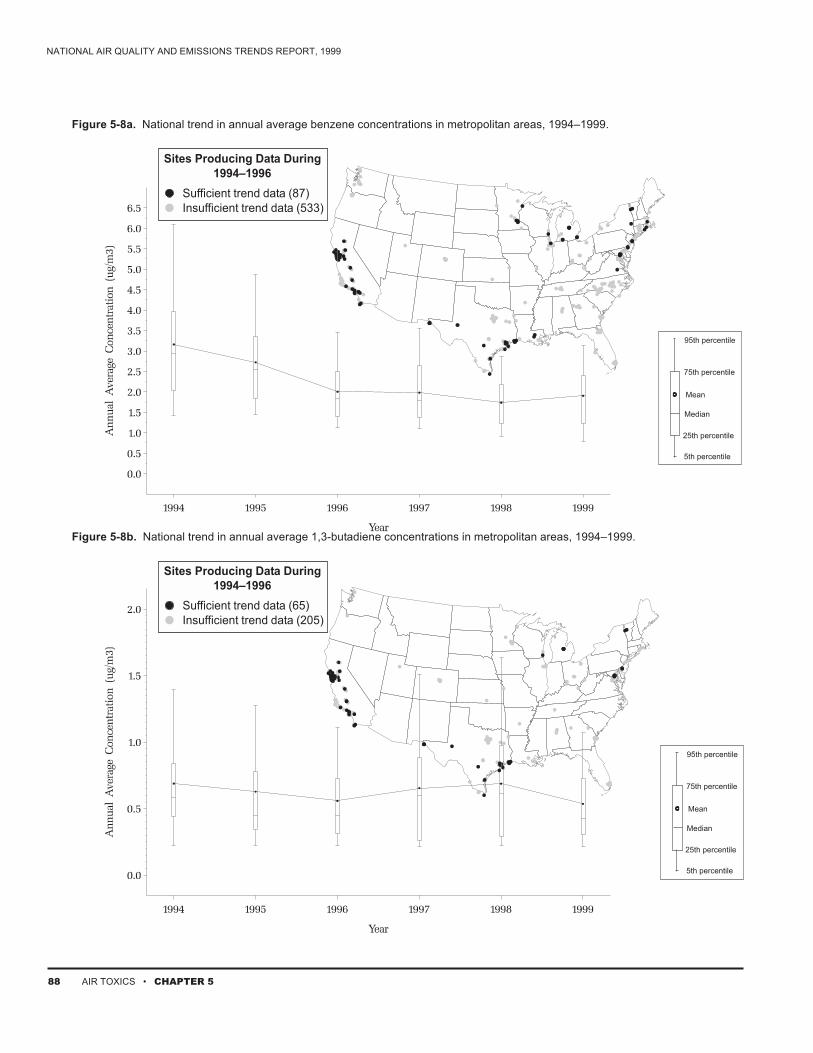
ene. These figures depict the concen-tration distributions among annualaverages in metropolitan areas from1994–1999. The accompanying mapdisplays the number and location ofthe monitoring “trend” sites. Forcomparison, the maps also show thenumber of sites that produced anymeasurement data during the 6-yearperiod. The average trend lines forbenzene, lead and toluene show moreimprovement in the first few years.The trend for toluene continuesthrough 1999. The benzene trend re-veals a small increase between 1998and 1999.
For the other HAPs in Table 5-2,most urban locations do not revealpredominant or consistent trendsamong all monitoring areas. In addi-tion, most observed trends for theseHAPs are not statistically significant.This is attributed in part to few stateswith long-term HAP monitoring, tothe large year-to-year variability incomputed annual average concentra-tions for some HAPs and the largevariety of contributing emission
removed from gasoline and almost allof these trace elements now typicallyemanate from major point sourcesand aircrafts with piston engines(e.g., small commuter aircraft). Thecriteria pollutant section in Chapter 2of this report contains more informa-tion about particulate lead. Thechange in national benzene emissionsis attributed to a combination of newcar emission standards, use of cleanerfuels in many states as well as station-ary source emission reductions. Am-bient concentrations of toluene(emitted primarily from mobilesources) also show a consistent de-crease over most reporting locations.Similar to benzene, annual averagetoluene concentrations dropped 48percent. Other HAPs (includingstyrene) also reveal air quality im-provement, but the downward trendsare not significant across large numbersof monitoring locations.
Figure 5-8 presents boxplots of thecomposite urban trends for six HAPs:benzene, 1,3-butadiene, lead,perchlorethylene, styrene and tolu-
Figure 5-7. Locations for urban and rural air toxics monitors with long-term data.
Number of sites located in an MSA (184):Number of sites not located in an MSA (80):

CHAPTER 5 � AIR TOXICS 87
NATIONAL AIR QUALITY AND EMISSIONS TRENDS REPORT, 1999
Table 5-2. National Summary of Ambient HAP Concentration Trends in Metropolitan Areas, 1994�1999
Number of Urban Sites by HAPPollutant Name Total Significant* Non-Significant No Trend Non-Significant Significant*
UP Trend UP Trend DOWN Trend DOWN TrendAcrylonitrile 4 4Benzene 84 2 8 52 221,3-Butadiene 62 3 23 5 22 9Carbon tetrachloride 57 1 10 6 26 14Chloroform 76 5 24 13 341,2-Dibromoethane 26 3 17 3 31,2-Dichloropropane 30 2 11 16 1Ethylene dichloride 58 5 26 21 6Methylene chloride 74 19 2 39 141,1,2,2-Tetrachloroethane 11 4 3 4Perchloroethylene 76 7 5 50 14Trichloroethylene 66 2 17 8 37 2Vinyl chloride 55 2 32 18 3
Arsenic (coarse) 9 9Arsenic (fine) 8 1 7Arsenic (PM10) 13 1 2 8 2Arsenic (TSP) 64 8 37 12 7Beryllium (PM10) 6 6Beryllium (TSP) 25 3 20 2Cadmium (PM10) 6 3 3Cadmium (TSP) 58 2 12 10 30 4Chromium (coarse) 9 1 8Chromium (fine) 8 1 1 5 1Chromium (PM10) 12 1 7 4Chromium (TSP) 70 4 27 9 27 3Chromium VI 19 9 10Lead (coarse) 9 7 2Lead (fine) 8 1 6 1Lead (PM10) 26 2 3 14 5 2Lead (TSP) 241 8 52 2 124 55Manganese (coarse) 9 1 7 1Manganese (fine) 8 4 4Manganese (PM10) 12 1 11Manganese (TSP) 63 20 1 34 8Mercury (fine) 8 1 7Mercury (PM10) 6 3 3Mercury (TSP) 22 1 16 2 3Mercury compounds 2 1 1Nickel (coarse) 9 2 5 2Nickel (fine) 8 1 6 1Nickel (PM10) 12 3 9Nickel (TSP) 69 12 3 39 15
Acetaldehyde 18 1 9 7 1Formaldehyde 18 1 12 4 1Acrolein 6 1 2 3
Benzo(a)pyrene(total PM10 & vapor) 18 1 13 4Dibenz(a,h)anthracene(total PM10 & vapor) 18 3 11 4Indeno(1,2,3-cd)pyrene(total PM10 & vapor) 18 1 13 4Benzo(b)fluoranthene(total PM10 & vapor) 18 3 13 2Benzo(k)fluoranthene(total PM10 & vapor) 18 3 11 4Styrene 61 13 5 38 5Toluene 80 1 4 42 33
*Statistically significant at the 10-percent level (See Appendix B: Methodology, Air Toxics Methodology section).
88 AIR TOXICS � CHAPTER 5
NATIONAL AIR QUALITY AND EMISSIONS TRENDS REPORT, 1999
Figure 5-8a. National trend in annual average benzene concentrations in metropolitan areas, 1994�1999.
Figure 5-8b. National trend in annual average 1,3-butadiene concentrations in metropolitan areas, 1994�1999.
Sites Producing Data During1994�1996
Sufficient trend data (65)Insufficient trend data (205)
Sites Producing Data During1994�1996
Sufficient trend data (87)Insufficient trend data (533)

CHAPTER 5 � AIR TOXICS 89
NATIONAL AIR QUALITY AND EMISSIONS TRENDS REPORT, 1999
Figure 5-8c. National trend in annual average total suspended lead concentrations in metropolitan areas, 1990�1999.
Figure 5-8d. National trend in annual average perchloroethylene concentrations in metropolitan areas, 1990�1999.
Sites Producing Data During1994�1996
Sufficient trend data (241)Insufficient trend data (215)
Sites Producing Data During1994�1996
Sufficient trend data (79)Insufficient trend data (283)

90 AIR TOXICS � CHAPTER 5
NATIONAL AIR QUALITY AND EMISSIONS TRENDS REPORT, 1999
Sites Producing Data During1994�1996
Sufficient trend data (64)Insufficient trend data (426)
Figure 5-8e. National trend in annual average styrene concentrations in metropolitan areas, 1994�1999.
Figure 5-8f. National trend in annual average toluene concentrations in metropolitan areas, 1994�1999.
Sites Producing Data During1994�1996
Sufficient trend data (83)Insufficient trend data (538)

CHAPTER 5 � AIR TOXICS 91
NATIONAL AIR QUALITY AND EMISSIONS TRENDS REPORT, 1999
sources for many of the air toxics. Forthese pollutants, a national compositetrend may not be meaningful at thistime. Although the general directionof change is down for most HAPs onthe urban list, several states revealsignificant 6-year increases at a fewlocations. The HAPs and some oftheir influencing sources are: 1,3-butadiene (mobile sources); chro-mium (power plants, electroplating);lead (smelters and aircraft); and semi-volatile particulates (various combus-tion sources). This list also includescarbon tetrachloride, chloroform, andtrichloroethylene whose ambientconcentrations are estimated to haverelatively high background contribu-tions. Background concentrations arecontributions to ambient air toxicsconcentrations resulting from naturalsources, persistence in the environ-ment of past years’ emissions andlong-range transport from distantsource. To illustrate a few of theHAPs without consistent trendsamong the current set of trend sites,boxplots for 1994–1999 are presentedfor 1,3-butadiene, styrene, and per-chloroethylene. The national trendlines for these HAPs show more year-toyear variability, but still appear to show6-year air quality improvements.
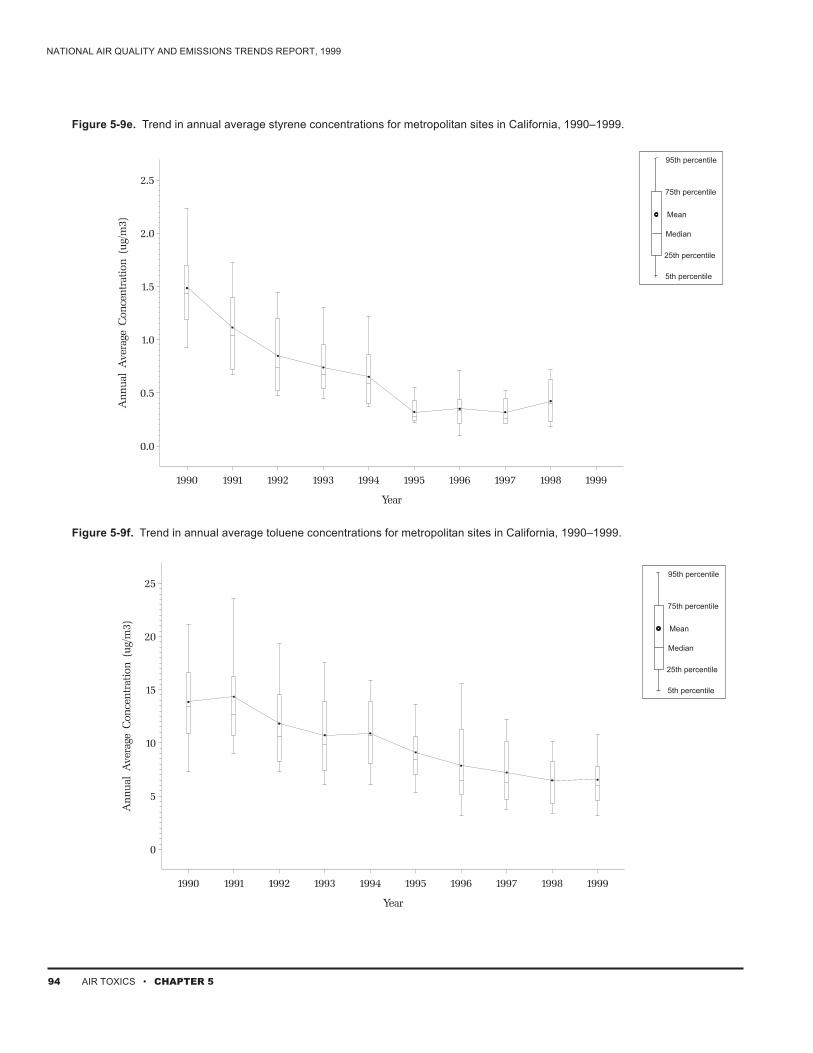
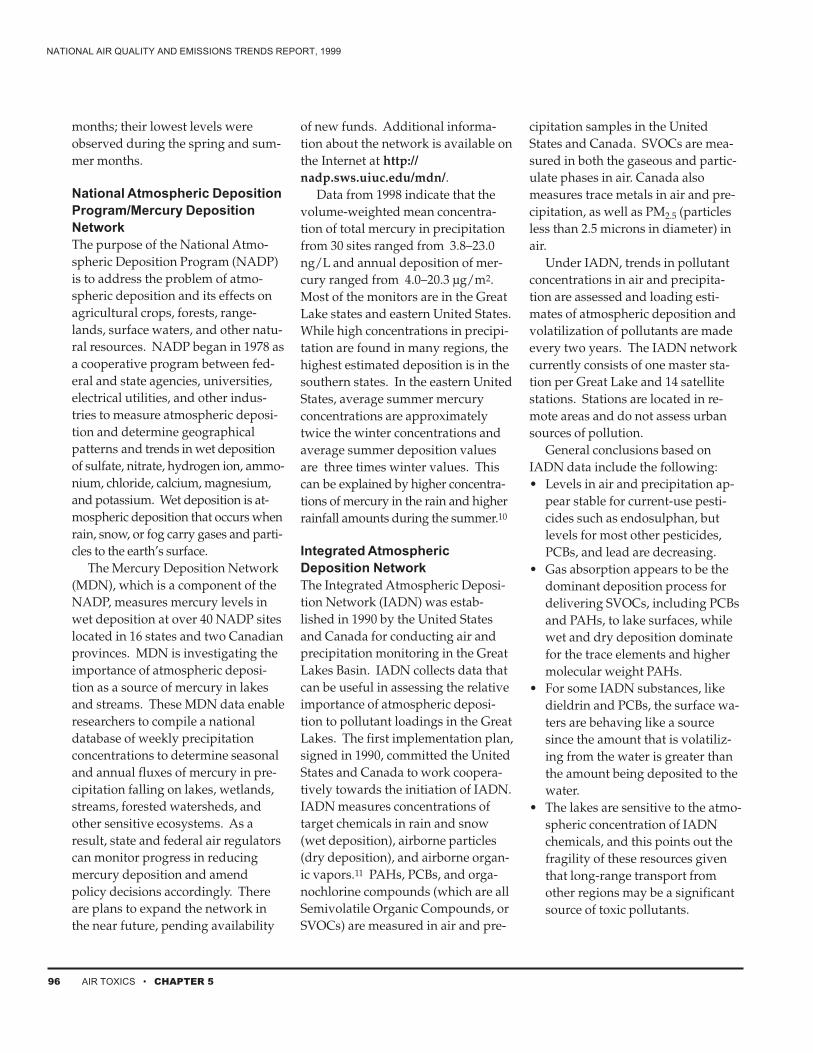
To illustrate the behavior of se-lected HAPs in a particular region ofthe country, trends of monitoringsites in California are presented Fig-ure 5-9. The state of California has thelargest and longest running air toxicsmonitoring network. They have over30 sites with a 10-year history forseveral VOCs and almost as many forseveral trace metals. These data al-low us to take a look at air toxicstrends over a longer period of time.Among the HAPs discussed in thissection, notable improvements are
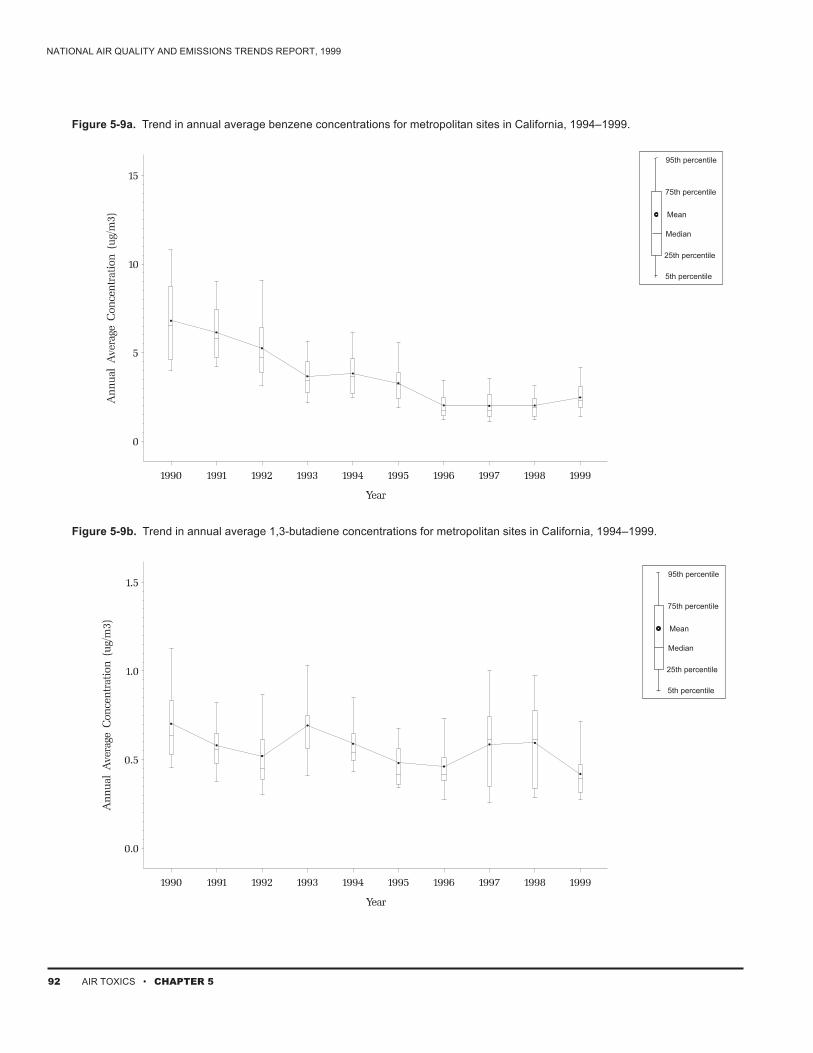
seen for benzene, 1,3-butadiene, lead,perchloroethylene, styrene and tolu-ene. The impressive air quality im-provement for urban benzene inCalifornia is shown in Figure 5-9a.This figure illustrates the large de-crease in ambient concentrationswhich occurred during the early1990s. Annual average concentrationsdeclined 64 and 35 percent over the1990–1999 and 1990–1999 periods.Ambient concentrations of perchloro-ethylene associated with dry cleanersis down 60 and 39 percent respec-tively (Figure 5-9d). Toluene associ-ated with mobile sources also showedconsistent 10-year declines whichaveraged 53 percent across the state(Figure 5-9f). Besides benzene, an-other HAP which predominantlycomes from mobile sources is 1,3-butadiene. Although site-specifictrends for this pollutant were mixed,the composite trend in Figure 5-9bshows an overall 40 percent and 28percent decline in ambient concentra-tions for the 10- and 6-year periods.
As was the case nationally, thereductions in ambient concentrationsof perchloroethylene are due to bettercontrols on the use of solvents. TheCalifornia improvements in benzene,1,3-butadiene and toluene are prima-rily attributed to the reformulation ofgasoline and new-car improvementsin terms of emission controls. (Formore information about trends inthese emissions, see the ozone sectionin Chapter 2.) For lead in TSP, annualaverage concentrations in Californiadeclined 46 percent over the 10 years,but appear to have leveled off overthe most recent years. For additionaldetail on the derivation of Figures 5-8ato 5-9f, see Appendix B: Methodology.
Ambient air toxics data in ruralareas are much more limited, but the
results in Table 5-3 also indicate wide-spread air quality improvement formany monitored HAPs. Significantdownward trends are noted among thefew rural sites for benzene and severalother VOCs. Lead concentrations inrural areas are also down.
While these data are useful todescribe general trends and geo-graphic variations in annual averageconcentrations, they only represent aselected group of monitoring sites.They do not necessarily highlight therange of concentrations or locate airtoxics problem areas that exist nation-wide. For example, a recent air toxicsstudy conducted in the Los Angelesarea has shown that higher concen-trations of air toxics generally occurnear their emission sources. In par-ticular, concentrations of compoundsthat are emitted primarily from sta-tionary and area sources tended to behighest within a few kilometers fromthe source location. More ubiquitousmobile source related compoundssuch as benzene and 1,3-butadienewere shown to be generally highthroughout the South Coast Air Ba-sin. However, the highest concentra-tions were estimated by air qualitymodels to occur along freeway corri-dors and junctions. In addition, highlevels of mobile source related com-pounds were estimated near majormobile source activities such as air-ports and other areas with majorindustrial activities. Also, annualaverages may tend to average outpeaks in the monitoring data. Thestudy showed that there were strongseasonal variations to the levels oftoxic air contaminants, primarily withthose pollutants associated with mo-bile sources. For example, benzeneand butadiene both had seasonalpeaks in the late fall and winter
92 AIR TOXICS � CHAPTER 5
NATIONAL AIR QUALITY AND EMISSIONS TRENDS REPORT, 1999
Figure 5-9a. Trend in annual average benzene concentrations for metropolitan sites in California, 1994�1999.
Figure 5-9b. Trend in annual average 1,3-butadiene concentrations for metropolitan sites in California, 1994�1999.

CHAPTER 5 � AIR TOXICS 93
NATIONAL AIR QUALITY AND EMISSIONS TRENDS REPORT, 1999
Figure 5-9c. Trend in annual average total suspended lead concentrations for metropolitan sites in California, 1990�1999.
Figure 5-9d. Trend in annual average perchloroethylene concentrations for metropolitan sites in California, 1990�1999.
94 AIR TOXICS � CHAPTER 5
NATIONAL AIR QUALITY AND EMISSIONS TRENDS REPORT, 1999
Figure 5-9e. Trend in annual average styrene concentrations for metropolitan sites in California, 1990�1999.
Figure 5-9f. Trend in annual average toluene concentrations for metropolitan sites in California, 1990�1999.

CHAPTER 5 � AIR TOXICS 95
NATIONAL AIR QUALITY AND EMISSIONS TRENDS REPORT, 1999
Table 5-3. National Summary of Ambient HAP Concentration Trends in Rural Areas, 1994�1999
Number of Rural Trend Sites by HAPPollutant Name Total Significant* Non-Significant No Trend Non-Significant Significant*
UP Trend UP Trend DOWN Trend DOWN TrendBenzene 6 61,3-Butadiene 4 1 2 1Carbon tetrachloride 2 2Chloroform 4 1 2 11,2-Dichloropropane 3 2 1
Ethylene dichloride 3 2 1Methylene chloride 4 1 31,1,2,2-Tetrachloroethane 1 1
Perchloroethylene 5 1 1 3Trichloroethylene 5 1 3 1Vinyl chloride 4 1 2 1
Arsenic (coarse) 2 1 1Arsenic (fine) 59 2 18 1 36 2Arsenic (PM10) 6 1 3 1 1Arsenic (TSP) 5 1 2 2Beryllium (PM10) 2 1 1Beryllium (TSP) 3 3Cadmium (PM10) 2 1 1Cadmium (TSP) 7 4 1 2Chromium (coarse) 2 1 1Chromium (fine) * 59 32 22 1 4Chromium (PM10) 6 1 2 3Chromium (TSP) 8 3 1 4Chromium VI 1 1Lead (coarse) 2 1 1Lead (fine) 59 3 32 20 4Lead (PM10) 8 1 2 2 2 1Lead (TSP) 33 5 16 12Manganese (coarse) 2 1 1Manganese (fine) 59 3 22 32 2Manganese (PM10) 6 2 3 1Manganese (TSP) 7 2 5Mercury (fine) 2 1 1Mercury (PM10) 4 2 1 1Mercury (TSP) 1 1Nickel (coarse) 2 1 1Nickel (fine) 59 12 1 32 14Nickel (PM10) 6 1 1 3 1Nickel (TSP) 8 1 6 1Acetaldehyde 3 2 1
Formaldehyde 4 1 3Acrolein 1 1
Styrene 6 2 3 1Toluene 7 3 3 1
*Statistically significant at the 10-percent level (See Appendix B: Methodology, Air Toxics Methodology section).** The apparent up trends in fine chromium concentrations may be an artifact of the detection limits for these measurements.
96 AIR TOXICS � CHAPTER 5
NATIONAL AIR QUALITY AND EMISSIONS TRENDS REPORT, 1999
months; their lowest levels wereobserved during the spring and sum-mer months.
National Atmospheric DepositionProgram/Mercury DepositionNetworkThe purpose of the National Atmo-spheric Deposition Program (NADP)is to address the problem of atmo-spheric deposition and its effects onagricultural crops, forests, range-lands, surface waters, and other natu-ral resources. NADP began in 1978 asa cooperative program between fed-eral and state agencies, universities,electrical utilities, and other indus-tries to measure atmospheric deposi-tion and determine geographicalpatterns and trends in wet depositionof sulfate, nitrate, hydrogen ion, ammo-nium, chloride, calcium, magnesium,and potassium. Wet deposition is at-mospheric deposition that occurs whenrain, snow, or fog carry gases and parti-cles to the earth’s surface.
The Mercury Deposition Network(MDN), which is a component of theNADP, measures mercury levels inwet deposition at over 40 NADP siteslocated in 16 states and two Canadianprovinces. MDN is investigating theimportance of atmospheric deposi-tion as a source of mercury in lakesand streams. These MDN data enableresearchers to compile a nationaldatabase of weekly precipitationconcentrations to determine seasonaland annual fluxes of mercury in pre-cipitation falling on lakes, wetlands,streams, forested watersheds, andother sensitive ecosystems. As aresult, state and federal air regulatorscan monitor progress in reducingmercury deposition and amendpolicy decisions accordingly. Thereare plans to expand the network inthe near future, pending availability
of new funds. Additional informa-tion about the network is available onthe Internet at http://nadp.sws.uiuc.edu/mdn/.
Data from 1998 indicate that thevolume-weighted mean concentra-tion of total mercury in precipitationfrom 30 sites ranged from 3.8–23.0ng/L and annual deposition of mer-cury ranged from 4.0–20.3 µg/m2.Most of the monitors are in the GreatLake states and eastern United States.While high concentrations in precipi-tation are found in many regions, thehighest estimated deposition is in thesouthern states. In the eastern UnitedStates, average summer mercuryconcentrations are approximatelytwice the winter concentrations andaverage summer deposition valuesare three times winter values. Thiscan be explained by higher concentra-tions of mercury in the rain and higherrainfall amounts during the summer.10
Integrated AtmosphericDeposition NetworkThe Integrated Atmospheric Deposi-tion Network (IADN) was estab-lished in 1990 by the United Statesand Canada for conducting air andprecipitation monitoring in the GreatLakes Basin. IADN collects data thatcan be useful in assessing the relativeimportance of atmospheric deposi-tion to pollutant loadings in the GreatLakes. The first implementation plan,signed in 1990, committed the UnitedStates and Canada to work coopera-tively towards the initiation of IADN.IADN measures concentrations oftarget chemicals in rain and snow(wet deposition), airborne particles(dry deposition), and airborne organ-ic vapors.11 PAHs, PCBs, and orga-nochlorine compounds (which are allSemivolatile Organic Compounds, orSVOCs) are measured in air and pre-
cipitation samples in the UnitedStates and Canada. SVOCs are mea-sured in both the gaseous and partic-ulate phases in air. Canada alsomeasures trace metals in air and pre-cipitation, as well as PM2.5 (particlesless than 2.5 microns in diameter) inair.
Under IADN, trends in pollutantconcentrations in air and precipita-tion are assessed and loading esti-mates of atmospheric deposition andvolatilization of pollutants are madeevery two years. The IADN networkcurrently consists of one master sta-tion per Great Lake and 14 satellitestations. Stations are located in re-mote areas and do not assess urbansources of pollution.
General conclusions based onIADN data include the following:• Levels in air and precipitation ap-
pear stable for current-use pesti-cides such as endosulphan, butlevels for most other pesticides,PCBs, and lead are decreasing.
• Gas absorption appears to be thedominant deposition process fordelivering SVOCs, including PCBsand PAHs, to lake surfaces, whilewet and dry deposition dominatefor the trace elements and highermolecular weight PAHs.
• For some IADN substances, likedieldrin and PCBs, the surface wa-ters are behaving like a sourcesince the amount that is volatiliz-ing from the water is greater thanthe amount being deposited to thewater.
• The lakes are sensitive to the atmo-spheric concentration of IADNchemicals, and this points out thefragility of these resources giventhat long-range transport fromother regions may be a significantsource of toxic pollutants.

CHAPTER 5 � AIR TOXICS 97
NATIONAL AIR QUALITY AND EMISSIONS TRENDS REPORT, 1999
• Air trajectory analyses indicatethat many SVOCs are potentiallyoriginating from outside the GreatLakes basin, whereas trace metalsand PAHs may be associated withlocal sources.The Second Implementation Plan
for IADN (IP2), signed in 1998, out-lines goals and plans for IADN forthe period 1998–2004. Under thisSecond Implementation Plan, theIADN will continue surveillance andmonitoring activities, related re-search, and provision of informationfor intergovernmental commitmentsand agreements. Additional work tobe completed under the SecondImplementation Plan is the develop-ment of a database for all U.S. andCanadian data. Potential modifica-tions will be discussed in relation tothe placement of satellite stations toassess urban inputs and air-water gasexchange, criteria for changes to theIADN chemical list, coordinationwith other research activities, qualityassurance and control of IADN op-erations, and communication ofIADN results.12
References
1. This list originally included 189chemicals. The CAA allows EPA tomodify this list if new scientific infor-mation becomes available that indi-cates a change should be made. Usingthis authority, the Agency modified thelist to remove caprolactam in 1996,reducing the list to 188 pollutants(Hazardous Air Pollutant List; Modifica-tion, 61 FR 30816, June 18, 1996).
2. U.S. EPA. 2000. Draft Health As-sessment Document for Diesel Ex-haust. July 2000.
3. Federal Register, 65 FR 79827.
4. Giesy, J.P., Ludwig, J.P., and Tillitt,D.E. 1994. Deformities in birds of theGreat Lakes region: assigning causali-ty. Environ. Sci. Technol. 28,128A-136A.
5. Cook, P.M., Zabel, E.W., and Peter-son, R.E. 1997. The TCDD toxicityequivalence approach for characteriz-ing risks for early life stage mortalityin trout. In: Chemically Induced Alter-ations in the Functional Development andReproduction of Fishes, pp. 9–27. (Rolland,R., Gilbertson, M., and Peterson R., Eds.).SETAC Press, Pensacola, FL.
6. Scheuhammer, A.M., and Blancher,P.J. 1994. Potential risk to commonloons (Gavia immer) from methylmer-cury exposure in acidified lakes. Hy-drobiol. 279,445-455.
7. “National Air Toxics Program: TheIntegrated Urban Strategy,” FederalRegister, 64 FR 38705, Washington,D.C., July 19, 1999. Available on theInternet at: http://www.epa.gov/ttn/atw/urban/urbanpg.html
8. “1997 Urban Air Toxics MonitoringProgram (UTAMP),” EPA-454/R-99-036. RTP, NC 27711, January 1999.Available on the Internet at http://www.epa.gov/ttn/amtic/airtxfil.html.
9. “Air Toxics Monitoring ConceptPaper,” U.S Environmental ProtectionAgency, Office of Air Quality Planningand Standards, RTP, NC, 27711. Febru-ary 29, 2000. Peer Review Draft. Avail-able on the Internet at: http://www.epa.gov/ttn/amtic/airtxfil.html.
10. Sweet, C.W., E. Prestbo, B. Bru-nette. 1999. Atmospheric wet deposi-tion of mercury in North America.Proceedings of the 92nd Annual Meet-ing of the Air and Waste ManagementAssociation. June 21–23, 1999, St.Louis, MO.
11. The target chemicals include PCBs,pesticides, PAHs and metals. Thecompounds included as “target chemi-cals” were selected based on the fol-lowing criteria: presence on List 1 ofAnnex 1 of the Great Lakes WaterQuality Agreement (substances be-lieved to be toxic and present in theGreat Lakes); established or perceivedwater quality problem; presence on theInternational Joint Commission’s Wa-ter Quality Board’s list of criteria pol-lutants; evidence of presence in theatmosphere and an important deposi-tion pathway; and feasibility of mea-surement in a routine monitoring net-work.
12. U.S./Canada IADN Scientific Steer-ing Committee. 1998. Technical sum-mary of progress under the integratedatmospheric depositions program1990–1996.

98 AIR TOXICS � CHAPTER 5
NATIONAL AIR QUALITY AND EMISSIONS TRENDS REPORT, 1999


![ENVIRONMENTAL PROTECTION AGENCY EPA-HQ-OAR-2009-0234; [FRL-XXXX … · EPA-HQ-OAR-2009-0234; [FRL-XXXX-X] RIN 2060-AS75 Mercury and Air Toxics Standards (MATS) Completion of Electronic](https://img.pdfslide.us/doc/110x75/5bc9e45609d3f2df158b6043/environmental-protection-agency-epa-hq-oar-2009-0234-frl-xxxx-epa-hq-oar-2009-0234.jpg)