Embed Size (px)
Citation preview

Chapter 5: Advanced Plotting

xy Plotting

Present Data Compactly

Logarithmic Plottinglog-log Plots are used for Plotting Sudden Changes in
Values: loglog(x, y)
log-log Plot: loglog(x, y)Rectangular xy Plot: plot(x, y)

Logarithmic PlottingSemi-log Plots: Only One Axis is Logarithmic:
semilogx(x, y) or semilogy(x, y)
log-log Plot: loglog(x, y)Semi-log Plot: semilogy(x, y)

Other PlotsStem Plots, Bar Plots, Stair Plots:

Three-Dimensional Plotsxyz Plots:

Three-Dimensional PlotsSurface Mesh Plots:

Three-Dimensional PlotsContour Plots:

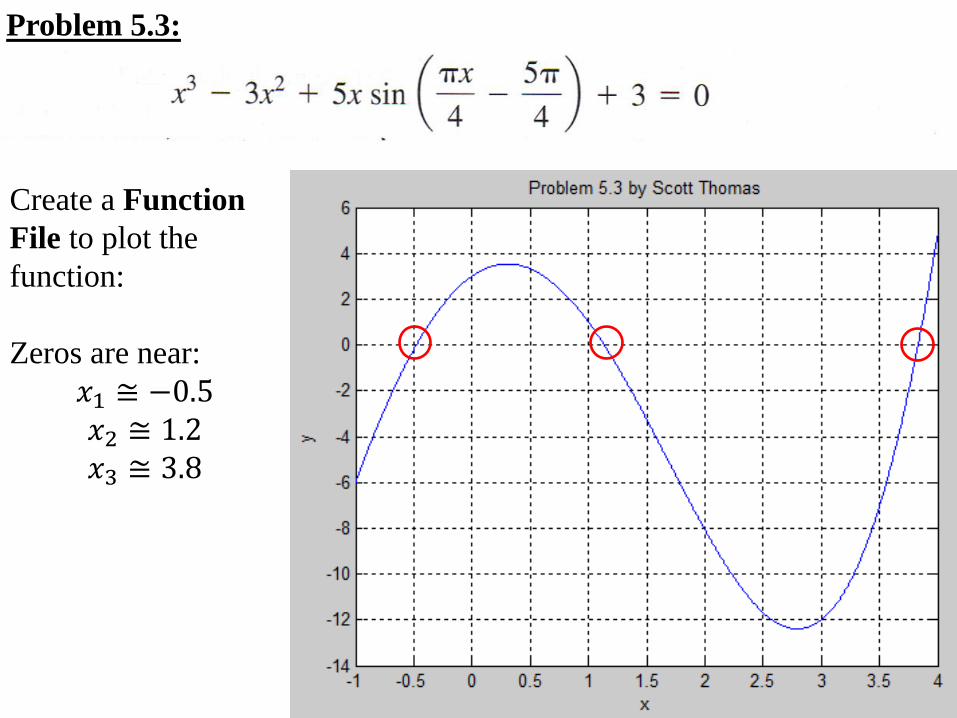
Problem 5.3:
Problem 5.3:
Create a Function
File to plot the
function:
Zeros are near:
𝑥1 ≅ −0.5𝑥2 ≅ 1.2𝑥3 ≅ 3.8

Problem 5.3:
fzero
Find root of continuous function of one variable.
x = fzero(fun,x0) tries to find a zero of fun near
x0, if x0 is a scalar. fun is a function handle. The
value x returned by fzero is near a point where fun
changes sign.

Problem 5.15:
The following functions describe the oscillations in electric circuits and
the vibrations of machines and structures. Plot these functions on the
same plot. Make sure to provide a plot title, x and y axis labels, and a
legend that describes the two graphs.

Problem 5.18:

Problem 5.18:

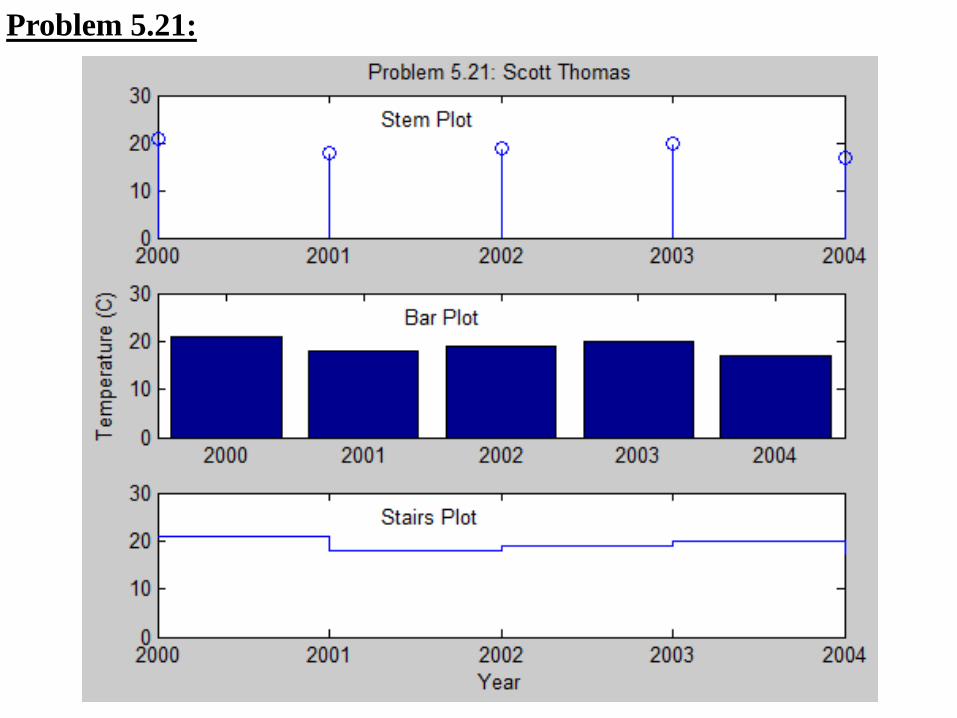
Problem 5.21:
The following table shows the average temperature for each year in a
certain city. Plot the data as a stem plot, a bar plot, and a stairs plot using
subplots. Use the following command to force the tick mark labels to be
whole numbers:
set(gca,'XTick',2000:1:2004)
subplot(2,1,1), plot(x)
subplot(2,1,2), plot(y)
plots x on the top half of the window and y on the bottom half.
text(x, y, 'Stem Plot')
Problem 5.21:

Problem 5.26:
Applying a sinusoidal voltage 𝑣𝑖 = 𝐴𝑖 sin(𝜔𝑡) to the RC (Resistor-
Capacitor) circuit shown results in an output voltage 𝑣𝑜 =𝐴𝑜 sin(𝜔𝑡 + 𝜙) that is also sinusoidal with the same frequency but with
a different amplitude and shifted in time relative to the input voltage.
The frequency response plot is a plot of 𝐴𝑜/𝐴𝑖versus frequency 𝜔. This
ratio depends on 𝜔 and RC as follows:𝐴𝑜𝐴𝑖
=1
𝑅𝐶𝑠 + 1where 𝑠 = 𝜔𝑖. For RC = 0.1 s, obtain the log-log plot of 𝐴𝑜/𝐴𝑖 versus
𝜔 and use it to find the range of frequencies for which the output
amplitude 𝐴𝑜 is less than 70 percent of the input amplitude 𝐴𝑖.

Problem 5.26:
logspaceGenerate logarithmically spaced vectors
Syntax
y = logspace(a,b)
y = logspace(a,b,n)
y = logspace(a,pi)
Description
The logspace function generates logarithmically spaced vectors.
Especially useful for creating frequency vectors, it is a logarithmic
equivalent of linspace and the ":" or colon operator.
y = logspace(a,b) generates a row vector y of 50 logarithmically spaced
points between decades 10^a and 10^b.
y = logspace(a,b,n) generates n points between decades 10^a and 10^b.
omega = logspace(0,2,N);
set(gca, ‘YTick’, linspace(0.1,1,10))

Problem 5.26:
omega = logspace(0,2,N); use find command to locate ω

Problem 5.28:

Problem 5.28:
plot3(x,y,z1,x,y,z2,x,y,z3)

Problem 5.30:

Problem 5.30:


![Formal Theories for Logspace Counting · book Logical Foundations of Proof Complexity [9], and without months of conversations as I digested that material and began to see how I could](https://img.pdfslide.us/doc/110x75/6044fb8370cec4775430d95b/formal-theories-for-logspace-counting-book-logical-foundations-of-proof-complexity.jpg)

![arXiv:1404.6996v2 [math.DG] 29 Apr 2014 · arXiv:1404.6996v2 [math.DG] 29 Apr 2014 LOGARITHMICALLY SPIRALING HELICOIDS CHRISTINE BREINER AND STEPHEN J. KLEENE Abstract. We construct](https://img.pdfslide.us/doc/110x75/5fd0d373a334e31bbc55d47d/arxiv14046996v2-mathdg-29-apr-2014-arxiv14046996v2-mathdg-29-apr-2014.jpg)