Embed Size (px)
Citation preview

Chapter 4
Transport Situation in Jakarta
Arif Wismadi,
Joewono Soemardjito
Heru Sutomo
PUSTRAL-UGM
June 2013
This chapter should be cited as
Wismadi, A., J. Soemardjito and H. Sutomo (2013), ‘Transport Situation in Jakarta’, in
Kutani, I. (ed.), Study on energy efficiency improvement in the transport sector through
transport improvement and smart community development in the urban area. ERIA
Research Project Report 2012-29, pp.29-58. Available at:
http:/www.eria.org/RPR_FY2012_No.29_Chapter_4.pdf

29
CHAPTER 4
Transport Situation in Jakarta
1. Introduction
This Chapter will conduct micro approach analysis of the energy efficiency related issues
in a transport sector by selecting Jakarta of Indonesia as a model city. In addition, the Chapter
will select target area and provide information on traffic conditions of the area which will be
utilized in a simulation analysis in the next Chapter.
The reason for selecting Jakarta of Indonesia as a model city will be explained as follows.
・ Jakarta is one of a large city in the region where facing chronic traffic congestion and
corresponding problems.
・ Necessary date set for simulation analysis (Origin-Destination data of traffic) can be
easily obtained by a support of JICA Indonesia.
For conducting such simulation, the model specification should be designed to
correspond with socio-economic setting of the location, the direction of on-going policy,
priority for implementing the policy and the financing capacity for potential implementing
agency to test the simulation results on the ground.
To serve the information for modelling work of simulation analysis, we observed current
socio-economic and urban transportation in DKI Jakarta, including the review of on-going
policy initiatives in Jakarta. An exercise for setting up the priority for implementing policies
in transport sector conducted by Coordinating Ministry of Economic Affair is also reported as
one of consideration to specify the simulation model. Moreover, a specific observation on
financial capacity for the potential implementing agency is conducted to estimate the scale of
infrastructure improvement to be simulated. Then, a recommendation for the site of
simulation model is provided with the description of current situation and future development
plan of the influencing area.
2. Socio-Economic Setting of DKI Jakarta
2.1 Land Use System
Spatial development in the Jakarta City is strongly influenced by the presence of other
cities around it, namely Bogor, Depok, Tangerang, and Bekasi as the satellite cities of

30
Jakarta. Social and economic interaction between the City of Jakarta and surrounding cities
has created an agglomeration of Greater Jakarta region so called JABODETABEK (Jakarta,
Bogor, Depok, Tangerang, Bekasi) with the complexity of social and economic issues.
Figure 4-1: Map of JABODETABEK region
The development of land use in Jakarta City shows that the urban physical development has
experienced to spread wider from the center to the sub-urban areas as illustrated in the Figure
4-2. During 1983 to 2002, the housing development has been moving from the center area to
the east, west, and south areas.

31
Figure 4-2: The Image of urban sprawl development in Jakarta region
Source: Landsat Image (2002).
From the trend of the spatial development of JABODETABEK, the location of "work
force" area does not have much change where the tendency of the increased intensity remains
at the center of Jakarta City. The pattern of people movement creates a commuter travel and
this has given an impact on the road traffic and capacity.
The disharmonic situation of development situation between the land use development
and the development of road infrastructure within the JABODETABEK has been triggered by
inconsistency in the spatial development implementation. In addition, the spatial development
of JABODETABEK did not experience the process of synchronization, and the inconsistency
of spatial development amongst the cities surroundings the Jakarta City, especially in the
suburban areas.
The above situation is reflected in the randomized people movement pattern which leads
to inefficient utilization of existing transportation infrastructure. This situation has been more
aggravated by the condition of the rapid growth of land use. This also happens in other cities
in Indonesia in general, as shown in Table 4-1 which shows that Indonesia has rapid growth
rate of urbanization and the highest level of urbanization amongst the cities within the East
Asia region. 1
1 Cities in Transition: Urban Sector Review in an Era of Decentralization in Indonesia, East Asia Working
Paper Series, Dissemination Paper No. 7, The World Bank. 2003.

32
Table 4-1: The growth and level of urbanization in the East Asia Region
Urbanization Level
Low
(<20%)
Medium
(20-40%)
High
(>40%)
Urb
an
iza
tio
n R
ate
Rapid
(>4%)
Cambodia
Lao PDR
Indonesia Philippines
Moderate
(2-4%)
China
Myanmar
Vietnam
Slow
(<2%) Thailand Mongolia
Source: the World Bank, 2003
The current trends, the role of the private sector in the spatial development is dominant
where the growth of new activity centers does not consider the carrying capacity of existing
transport networks. Based on the trend of development process seems that the development
intensity is running scattered in various locations and not concentrated in the certain areas.
This condition finally has formed the phenomenon of urban sprawl.
This situation creates an irregular travel patterns and with a growing motorcyle it tends to
generate the motorized short trips pattern which makes less of advantageous from the aspect
of mass public transportation service provision. This is possible because the existing
paradigm is that the provision of transport infrastructure and service is an obligation of
government but the strategic action to make it into realization is not in place. Furthermore,
the government is likely to encourage the private sector to play their role without being aware
of its ability to prepare and provide the sufficient transportation infrastructure in terms of
both time and cost. This condition is also exacerbated by the inconsistency in the planning
and implementation of policies in the border areas (sub-urban). This situation is reflected in
the transportation problems such as traffic congestion.2
2.2 Population Growth
The growth of population in Jakarta City and its surrounding cities during the last five
decades (1970-2010) can be seen in the Figure 4-3. In 2010, the number of population of DKI
Jakarta Province is approximately 9.6 million. During 1970 to 2000, the population growth in
DKI Jakarta Province tends to decrease from 3.5% per year (1970-1980) to 0.2% per year
2 The Macro Transportation Concept of Jakarta, Local Transportation Agency of DKI Jakarta, 2010

33
(1990-2000). This figure experienced to increase again during 2000 to 2010 with the number
of population growth 1.3% annually.
Figure 4-3: The population growth of JABODETABEK (1970-2010)
Source: Statistics Indonesia.
In the context of JABODETABEK region, number of population living in this region has
reached 26.6 million inhabitants3 or approximately 10% of the total population of Indonesia
in 2010 (amounting to 237.6 million inhabitants).4
The highest density of population in
Jakarta City reaches 30 thousand people per kilometer square where generally is located in
the core of Jakarta City (central and northern side).
3 The physical mobility at Metropolitan Jakarta: Urban Spatial, Marco Kusumawijaya, 2011
4 Trends of the Selected Socio-Economic Indicators of Indonesia, BPS, February 2012

34
Figure 4-4: The population density of JABODETABEK (2010)
Source: Kusumawijaya (2011).
The existence of strong interaction between the City of Jakarta and its surrounding cities
has created a roundtrip journey population which was estimated at 20.7 million trips per day
trip5. The population of cities around the Jakarta City continues to increase with the similar
pattern of growth during that period. The urban sprawl effect of DKI Jakarta has increased
the number of population and the people mobility in the surroundings cities of Jakarta. This
condition has stimulated the increase of transportation demand or needs in Jakarta.
2.3 Macro Economy Condition
The economics of DKI Jakarta Province during 2000-2012 tends to increase from year to
year (see Figure 4-4). The highest increase was in 2011 with a growth rate of 6.71 %.
Meanwhile, the lowest growth occurred in 2000 with a rate of 3.95 %. In the latest year, the
province's economy grew by 6.6 % per year or experienced to decrease when compared to the
previous year.
5
The Macro Transportation Concept of Jakarta, Local Transportation Agency of DKI Jakarta, 2010

35
Figure 4-5: The economics growth of DKI Jakarta during 2000-2012 (%)
Source: Statistic Agency of DKI Jakarta Province.
In 2010, the regional GDP of DKI Jakarta Province by market price reached
approximately 862 trillion IDR while by 2000 constant price which was recorded by local
government statistic agency has reached around 396 trillion IDR. The condition of macro
economics of DKI Jakarta Province during 2000-2010 can be seen in Table 4-2.
Table 4-2: The macro economics of DKI Jakarta Province during 2000-2010
Ekonomi Makro 2000 2005 2010
Regional GDP by 2000 Constant Price (trillion IDR) 228 295 396
Annual growth of Regional GDP (%) 3.95 6.01 6.51
Regional GDP by Market Price (trillion IDR) 228 436 862
Regional GDP per capita by market price (million IDR) 27 49 89
Regional GDP per capita by 2000 constant price (million IDR) 28 33 41 Source: Statistic Agency of DKI Jakarta Province.
When viewed from the level of welfare of population, the Province of DKI Jakarta has a
higher level of welfare relatively compared with other provinces in Java Island. Figure 4-6
shows the level of income per capita population of Jakarta (during the period 2004-2007) was
higher than the other provinces in Java Island such as West Java, Banten, Central Java,
Yogyakarta and East Java Provinces. Level of welfare of the population in Jakarta City when
viewed from the province's GDP per capita is in the range of 31.83 to 36.73 million IDR in
the same period.
3.95
4.714.89
5.31
5.65
6.01 5.9
6.416.2
5.01
6.516.71 6.6
4.92
3.32
3.66
4.1
5.13
5.6 5.5
6.36.1
4.5
6.26.46 6.5
0
1
2
3
4
5
6
7
8
2000 2001 2002 2003 2004 2005 2006 2007 2008 2009 2010 2011 2012
Pe
rce
nt (
%)

36
Figure 4-6: The progress of regional GDP/capita of DKI Jakarta amongst other
Provincesin Java Island during 2004-2009
Source: Central Bureau of Statistics of Indonesia.
The rapid growth of transport and communication sector development in Jakarta City
could not be separated from the income growth. This sector has become the main sector of
Jakarta City with the most rapid growth from year to year (see Table 4-3). One of the impacts
of the development of Jakarta’s people income is the private vehicle ownership growth which
has been growing rapidly in the last decade.
Table 4-3: The growth of regional GDP of DKI Jakarta from the real sectors during
2001-2010 (in %)
No. Sectors 2001 2005 2010
1 Agriculture -2.79 0.98 1.27
2 Mining and quarrying -1.01 -7.24 -1.73
3 Manufacturing industry 3.91 5.07 3.38
4 Electricity, gas and water supply 7.1 6.95 4.44
5 Construction 2.29 5.89 7.09
6 Trade, hotel and restaurant 5.44 7.89 6.95
7 Transport and Communication 14.16 13.26 14.80
8 Finance dwelling and business service 4.19 4.1 4.12
9 Services 4.09 5.06 6.68 Source: Regional statistics of DKI Jakarta Province (2010)
Jakarta regional income structure consists of two main components i.e. revenue from
local tax and balance fund from the Central Government. The amount of revenue from local
tax of Jakarta City was about 81.72 % of total revenue. In the last three years (2008-2010),

37
the acquisition tax of Jakarta City reached an average of 9.2 trillion IDR, with an increase of
6.7 % annually.6
3. Current Situation of Public Transportation
3.1 Trend of private vehicle ownerships and people mobility
Transportation system in Jakarta is supported by land, sea, and air transportation. As the
capital of Indonesia, the development of transportation in Jakarta City is the densest among
other provinces. According to the DKI Jakarta Police Office recorded that the number of
motor vehicles in Jakarta is consistently increasing each year. It can be seen from the number
of vehicles registered from annually. In 2011, total vehicle in Jakarta is recorded more than
13 million. Motorcycle is still dominant by number more than 9 million, followed by
passenger cars (2.5 million), and the rests are trucks and buses (0.9 million).
Table 4-4: Number of motorized vehicles in DKI Jakarta Province (in unit)
Year Motorcycle Passenger
Cars
Trucks Buses Total
2001 1,813,136 1,130,496 347,433 253,648 3,544,713
2002 2,257,194 1,195,871 366,221 254,849 4,074,135
2003 3,316,900 1,529,824 464,748 315,652 5,627,124
2003 3,940,700 1,645,306 488,517 316,396 6,390,919
2005 4,647,435 1,766,801 499,581 316,502 7,230,319
2006 5,310,068 1,835,653 504,727 317,050 7,967,498
2007 5,974,173 1,916,469 518,991 318,332 8,727,965
2008 6,765,723 2,034,943 538,731 308,528 9,647,925
2009 7,518,098 2,116,282 550,924 309,385 10,494,689
2010 8,764,130 2,334,883 565,727 332,779 11,997,519
2011 9,861,451 2,541,351 581,290 363,710 13,347,802 Source: Regional statistics of DKI Jakarta Province (2012).
JUTPI (Jabodetabek Urban Transportation Policy Integration, 2010) has indicated that
the rate of car ownerships around 17 % in 2002 and this figure has increased to 25 % in 2010
(see Figure 4-7). The number of motorcycle owners has been increasing rapidly. The share of
motorcycle owners of all households was one third in 2002. However, it was more than 70 %
in 2010. Furthermore, the number of households that have two or more motorcycles has been
increasing rapidly (see Figure 4-8).
6 Quoted from Revenue and Expenditure of DKI Jakarta Province during 2008-2010

38
Figure 4-7: The change of number of private cars owned by households (2002 and 2010)
Source: SITRAMP, JUTPI Commuter Survey Report (2012).
According to JUTPI project (2010), based on the strong economic growth, the number of
low income households has been reducing. The share of middle income households, those
with a monthly household income of more than 1.5 million Rupiah and less than 6 million
Rupiah, has been growing rapidly and is now more than 50 %. It seems that this condition has
influenced the way people to own their private motorized vehicle.
Figure 4-8: The change of transportation mode commuting in Jakarta (2002 and 2010)
Source: SITRAMP, JUTPI Commuter Survey Report (2012).
The area and population of DKI Jakarta is almost the same as the specified districts in
Tokyo Metropolitan area. The number of commuters to Jakarta has been increasing
dramatically and is now 1.5 times as many as of 2002 (see Figure 4-9).

39
Figure 4-9: The change in number of Commuters to DKI Jakarta
Source: SITRAMP, JUTPI Commuter Survey Report (2012).
3.2 Existing condition of Road Infrastructure
According to the DKI Jakarta Province Transportation Agency, the growth of motorized
vehicles over the last five years is approximately 10 % annually in average, with the growth
in passenger car type vehicles per day around 240 vehicles, while for the type of motorcycle
as much as 890 vehicles. Meanwhile, the growth of road development in DKI Jakarta
Province is very low at 0.01 % per year. In other words we can say that the growth rate of
motor vehicles in Jakarta cannot be balanced with the available space for motorized vehicles
movement. The length of road in DKI Jakarta Province is amounted 6,543,997.43 meter with
the status of road as follows.
Table 4-5: The length and areas of road by status in DKI Jakarta Province (2008)
Road Type Length (m) Areas (m2) Road Status
Toll roads 112,960.00 2,472,680.00 National
Primary Arteri roads 112,149.00 2,140,090.00 National
Primary Collector roads 51,630.75 671,384.50 National
Secondary Arteri roads 506,415.00 8,406,014.00 Province
Secondary Collector roads 823,913.91 6,970,938.77 Province
Urban roads 4,936,928.77 20,988,103.81 Municipality
Total 6,543,997.43 41,649,211.08
Source: Public Works Agency of DKI Jakarta Province

40
3.3 Congestion and Transport Energy Consumption
Traffic demand in the JABODETABEK area will be rapidly increasing from 66 million
trips in 2010 to 74 million trips in 20207. If there is no action taken (do-nothing), the share of
public transport will be declining and the traffic situation becomes worse. Below is the
illustration of Volume – Capacity ratio of daily traffic in JABODETABEK area in two
scenarios: (1) do-nothing and (2) do-something/Masterplan.
Table 4-6: The road based transportation performance in DKI Jakarta Province
Indicators 2010
(Existing)
2020
(do-nothing)
2020
(master plan
/do-something)
Total travel demand (trips) 66 mio 74 mio 74 mio
Share mode Cars 20% 28% 24%
Motorcycles 53% 50% 42%
Public transp 27% 22% 34%
Traffic Load PCU-km 150 mio 210 mio 179 mio
PCU-hours 10 mio 27 mio 15 mio
Traffic
performance
V/C (daily) 0.85 1.15 0.87
Travel speed 23.6 km/hour 15.2 km/hour 24.3 km/hour
Public
transportation
Pax-km/trip 9.3 km 9.2 km 9.2 km
Pax-hour/trip 0.41 hour 0.45 hour 0.4 hour Source: JAPTraPis Report (2012); not included the non-motorized public transport.
The result of SITRAMP project indicates that if there is no action taken, the number of
V/C ratio in JABODETABEK area is increasing becomes more that 1.2 in 2020. In this
situation, the road traffic will be congested in everywhere.
Figure 4-10: The predicted V/C ratio in JABODETABEK area in 2020 (do-nothing
situation)
Source: SITRAMP Report.
7 JAPTraPIS report, 2012

41
According to the travel speed survey conducted during the SITRAMP and JUTPI
projects has indicated that in some road segments in Jakarta City area, such as Pasar Minggu
– Manggarai segment showed to decrease from 16.1 km/hour (in 2000) to 6.1 km/hour (in
2011). This situation has also been experienced within Cilandak - Monas segment with the
travel speed decrease from 19.2 km/hour to 9.4 km/hour (see Figure 4-11).
Figure 4-11: The morning peak travel time and speed in Pasar Minggu-Manggarai
segment and Cilandak-Monas segment
Source: SITRAMP-travel speed survey (2000), JUTPI –travel speed survey (2011).
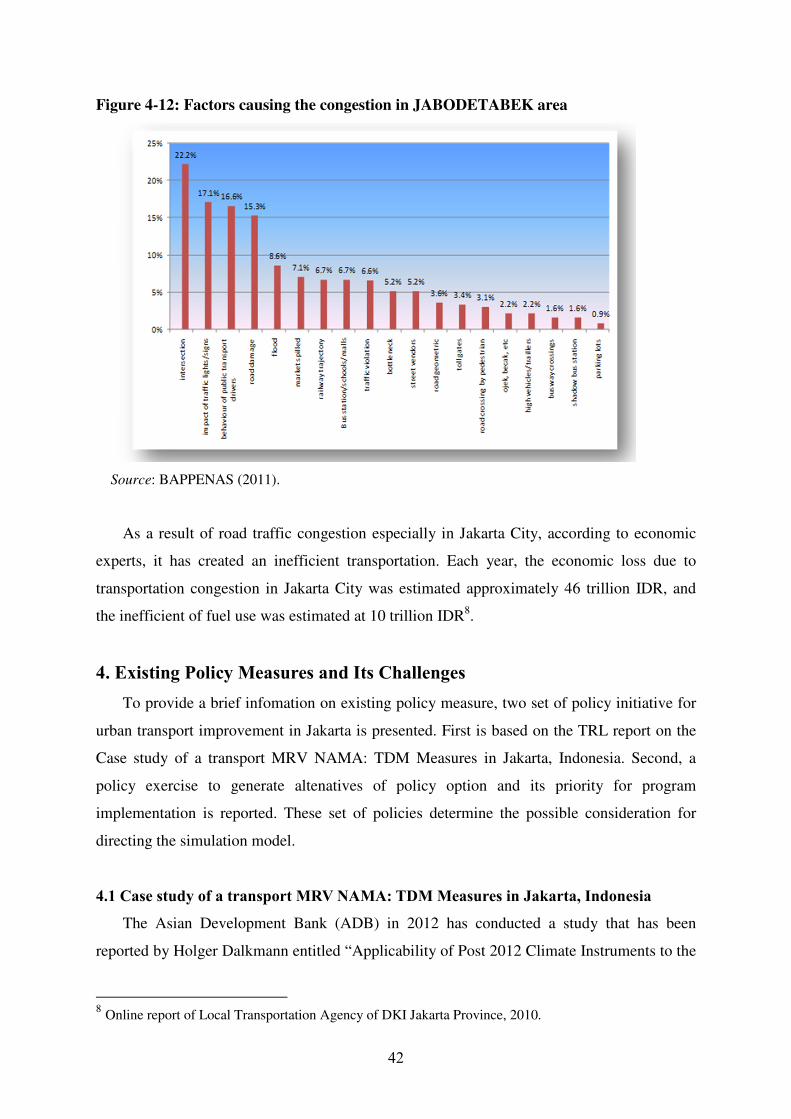
Currently, there are approximately 771 locations of road traffic congestion which are
spread across the JABODETABEK region. According to the inventory survey conducted by
National Development Planning Agency (BAPPENAS), showed that there are 20 factors
cause of the congestion, among others i.e.: bottle neck, narrow roads, markets spilled,
intersections/junctions, traffic lights/signs/ markers, flood, ramp toll booth, the trajectory of
the railway, and the damage of roads infrastructure. The dominant factor causes the
congestion is intersection/junctions.
42
Figure 4-12: Factors causing the congestion in JABODETABEK area
Source: BAPPENAS (2011).
As a result of road traffic congestion especially in Jakarta City, according to economic
experts, it has created an inefficient transportation. Each year, the economic loss due to
transportation congestion in Jakarta City was estimated approximately 46 trillion IDR, and
the inefficient of fuel use was estimated at 10 trillion IDR8.
4. Existing Policy Measures and Its Challenges
To provide a brief infomation on existing policy measure, two set of policy initiative for
urban transport improvement in Jakarta is presented. First is based on the TRL report on the
Case study of a transport MRV NAMA: TDM Measures in Jakarta, Indonesia. Second, a
policy exercise to generate altenatives of policy option and its priority for program
implementation is reported. These set of policies determine the possible consideration for
directing the simulation model.
4.1 Case study of a transport MRV NAMA: TDM Measures in Jakarta, Indonesia
The Asian Development Bank (ADB) in 2012 has conducted a study that has been
reported by Holger Dalkmann entitled “Applicability of Post 2012 Climate Instruments to the
8 Online report of Local Transportation Agency of DKI Jakarta Province, 2010.

43
Transport Sector (CITS)” as a first step to help ensure that the transport sector can benefit
from the revised/new climate change mitigation instruments under a post-2012 Climate
Change Agreement. This study was conducted in order to ensure that developing cities are
placed on a low-carbon growth path, and to realize the full benefits of a sustainable transport
system including lower air pollution and less congestion, it is imperative that actions at the
local level are fully supported by the Post-2012 climate framework centering upon the notion
of Nationally Appropriate Mitigation Actions (NAMAs).
The development of NAMAs has three specific areas thought to be of central concern to
the development of NAMAs, namely: (1) Measurable-reportable-verifiable/MRV
methodology, (2) institutional structure, and (3) the financial framework. This case study
examines all three types of NAMAs and their potential application for TDM in Jakarta
through technology and infrastructure intervention as described by the following table.
Table 4-7: Potential transport NAMAs (adapted from Bongardt & Sakamoto, 2009)
Technology Infrastructure/Behaviour
National level Energy efficiency policy
package
Long distance Avoid and Shift
policy package (freight/passenger)
Local level Vehicle and fuel
standards/requirements specific
to a city/region
Support programs for local Avoid
and Shift policies, e.g. urban
transport plants.
In the case of DKI Jakarta, the rapid growth in transport activity is seen most
prominently in the urban areas of Indonesia. It is known that the number of motorized
vehicles has grown at a pace of roughly 9.5% per annum for the last 5 years, to reach roughly
5.5.million vehicles. This consists of 98% private vehicles serving 44% of all trips, and 2% of
public transport vehicles serving 56% of all trips. The consequences of this rapid
motorization include for example;
• Chronic congestion, particularly in the peak periods where the total cost of traffic
congestion is estimated at Rp12.8 trillion per annum (approximately USD 1.4 billion)
(Based on time value, fuel consumption and health costs);
• Degradation of local air quality, with air quality hotspots throughout the city;
• Large levels of noise and vibration;
• Reductions in road safety, particularly for vulnerable street users such as pedestrians
and cyclists.
In an attempt to address these issues, stakeholders in the Jakarta capital region have
initiated a number of measures under a so-called “Transportation Masterplan”, including the

44
three core aspects of: (i) public transport development; (ii) traffic restraint; and (iii)
network capacity improvement.
As noted in above that Jakarta experiences severe traffic-related problems associated
with the exponential growth in traffic activity. There is growing recognition by policy
makers, academics and civil society alike, of the importance of TDM measures to stem these
problems. This is shown by the fact that TDM has already been implemented to some extent
in Jakarta, for example: (i) the development of a network of Bus Rapid Transit/BRT and
(ii) limiting access to a part of the central business district (during peak hours).
In this context, a number of additional and/or improved TDM measures are gaining
acceptance by local policy makers as options for implementation in the near future. These
include; (i) Electronic road pricing (ERP); (ii) parking restraint; and (iii) BRT provision.
By reducing the number of trips/distances travelled by private modes, the above three
collectively contribute to the reduction of transport emissions.
The MRV as a TDM model for Jakarta has been exercised by the University of Bandung
in order to assess the impact of TDM measures in the city of Jakarta. The approach utilizes an
“equilibrium flow” model which assesses the demand for travel by collating origin and
destination information, and then distributing these journeys across the existing network.
The model operates with passenger kms (and tonne kms), rather than vehicle kms.
Therefore, parameters such as occupancy levels, or vehicle fleet parameters (which determine
fuel consumption, and therefore carbon emissions) are extremely important in subsequently
calculating accurate emissions to air. The model incorporates the road transport network
(with a mode resolution of cars, motorbikes, buses, and lorries). Inclusion of trams or
monorail types systems are considered under the different scenarios, but may be achieved by
simply adding links to the network with the appropriate properties (such as flows across the
relevant network links).
Whilst the model is best suited to transport management and assessing congestion, it can
also be used for estimating vehicle kilometers and emissions of both carbon and air quality
pollutants (such as CO and NOx). The output of the model is provided by road link, giving a
very high spatial resolution.
An overview of the model and its inputs/outputs are shown in the Figure 4-13.

45
Figure 4-13: A schematic Diagram of Jakarta Transport Model
Source: ADB (2012).
The key messages of MRV for Jakarta are the followings.
• MRV is crucial in ensuring the transparency of mitigation actions, to allow an accurate
estimation of mitigation efforts in meeting domestic (voluntary) targets, as well as to
ensure accountability of the impacts of international support received.
• The TDM NAMA could be seen as an element of a city-wide approach to measuring
mitigation actions, which would enable the contribution of TDM to the meeting of
mitigation targets at the city level to be explicitly made (in the case of Jakarta, 30% below
BAU by 2030).
• The challenge of creating robust MRV methodology, which was seen as a barrier for
transport CDM projects, remains for the design of a transport NAMA.
• The measurement of CO2 mitigation and associated co-benefits would be made possible
by utilizing a bottom up methodology that combines a transport demand model
(equilibrium flow model) with data on the vehicle fleet (e.g. emission factors).
• The measurement of carbon could be cross-checked using top-down methods utilizing
(regional) fuel sales data, to improve the robustness.
• The lack of and poor quality of data is a major constraint in the accurate measurement of
the mitigation potential (and co-benefits) of the TDM NAMA. For example, assigning
traffic flows to the entire road network in Jakarta requires very extensive and detailed
traffic count information, supplemented by origin and destination data.
• Capacity building in the area of data collection, database development and management is
seen as a key priority in ensuring MRV of mitigation actions in the future, particularly in
allowing TDM to be implemented as a tradable NAMA. Such capacity building efforts
could be conducted as part of a supported NAMA, or through other means of
(international) support such as Official Development Assistance.

46
4.2. Policy exercise for transport sectors efficiency
This exercise consist of two sections, first is the introduced new framework based on a
supply chain of energy to generate policy alternatives. Second the priority setting for policy
and program implementation.
4.2.1. Policy framework with supply chain of energy and its relationship with transport
development
One big issue on energy sectors is how transport sector respond to the changes in fuel
consumption. One option to look at a variety of possible responses is to define the supply
chain of energy use for transport. By knowing the supply chain, the energy efficiency efforts
can be pursued. The following scheme is supply chain of energy related to the transport
sector development.
Figure 4-14: The supply chain of energy and its relationship with transport
development
Source: modified from Monitoring and Evaluation Team on National Transportation Policy, Coordinating
Ministry of Economic Affairs (2008)
Knowledge of the each part within the supply chain of energy is used to see the cost
effectiveness or value for money from a variety of policy and program interventions as
described in the Table 4-8.
energy supply
engine technology supply
regulation on the use of vehiclesand fuel consumption
demand management
infrastructureprovisionD
OWN STREAM -UPSTREAM
47
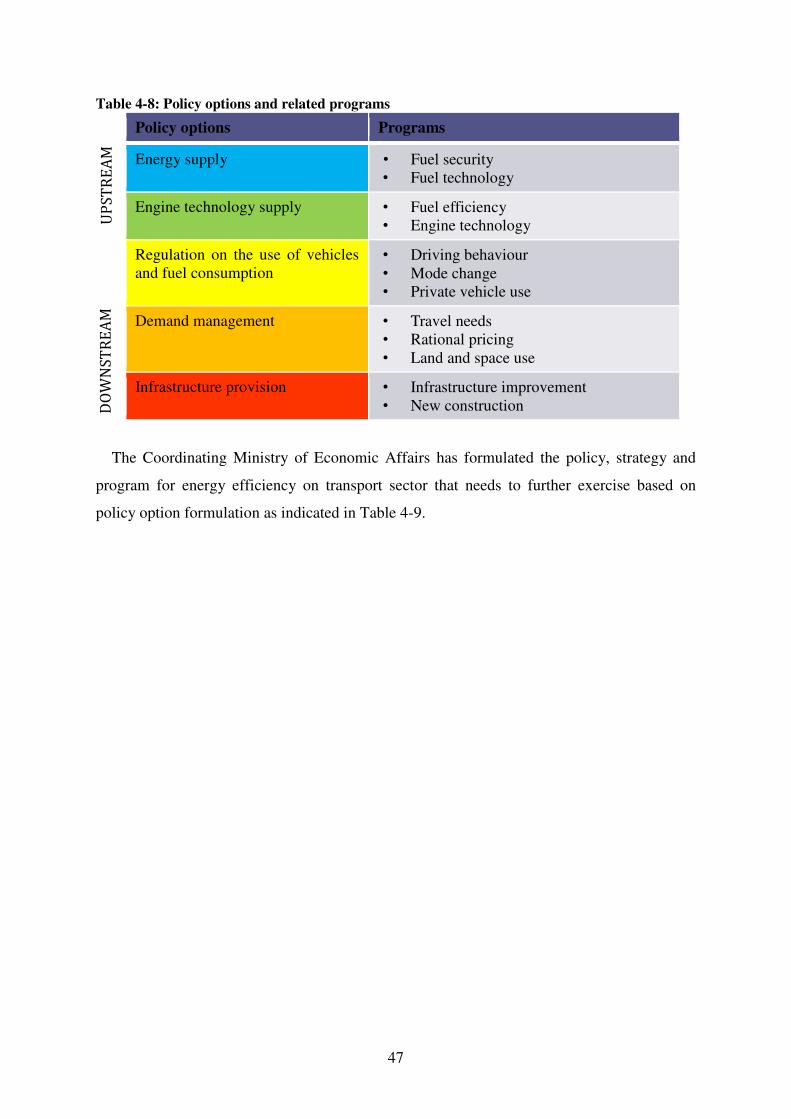
Table 4-8: Policy options and related programs
Policy options Programs
Energy supply • Fuel security
• Fuel technology
Engine technology supply • Fuel efficiency
• Engine technology
Regulation on the use of vehicles
and fuel consumption
• Driving behaviour
• Mode change
• Private vehicle use
Demand management • Travel needs
• Rational pricing
• Land and space use
Infrastructure provision • Infrastructure improvement
• New construction
The Coordinating Ministry of Economic Affairs has formulated the policy, strategy and
program for energy efficiency on transport sector that needs to further exercise based on
policy option formulation as indicated in Table 4-9.
UP
ST
RE
AM
D
OW
NS
TR
EA
M

48
Table 4-9: Policy, Strategy and Program for Energy Efficiency on Transport Sector
OBJECTIVE POLICY STRATEGY PROGRAM TARGET
The provision of
national
transport that
will be enabling
the energy
efficiency
1. Energy supply 1. Domestic energy security 1. to identify/explore new oil resources
2. to increase the strategic reservation of crude oil and its product processing
3. to increase oil production
4. to improve the access to energy
5. to improve the refinery technical capacity on oil and gas fuel supply
Short-term
Mid-term
Long-term
Short-term
Mid-term
2. Improving the
unconventional fuel
technology
1. renewable energy infrastructure development
2. renewable energy use prioritizing
3. to improve the supporting renewable energy business
4. encouraging the national energy conservation and diversification
5. to formulate the priority for renewable energy development based on potential and technology, financial and social feasibility
6. to develop the alternative fuel technology (such as bio diesel, bio ethanol, gas fuel, LPG, liquid coal, hydrogen, electricity, etc.)
Mid-term
Mid-term
Mid-term
Short-term
Short-term
Long-term
2. Engine technology
supply
1. Improving technology
which can support engine
and emission efficiency
1. to develop the motorized vehicle technology supported by alternative fuel use
2. to develop the lower capacity engine on motorized vehicle
Long-term
Mid-term
2. Environmentally-friendly
engine technology supply
1. to develop the environmentally-friendly engine technology
2. to encourage the catalytic converter use
Mid-term
Short-term
3. Travel demand and
fuel consumption
management
1. Encouraging the driving
behavior to support energy
efficiency
1. to train the public transport drivers to support the energy efficiency program
2. to improve the motorized vehicle driving license
Short-term
Short-term

49
OBJECTIVE POLICY STRATEGY PROGRAM TARGET
standard
2. Providing the
environmentally-friendly
modal
1. to realize the emission standard for EURO 4; EURO 5
2. to encourage the Clean Development Mechanism implementation
3. to improve the motorized vehicle evaluator competency
4. to implement the private motorized vehicle test
5. to improve the number of certified and accredited public motorized service stations
6. to develop the emission test facility
7. to encourage non-motorized vehicle use
Long-term
Long-term
Mid-term
Mid-term
Short-term
Mid-term
Long-term
3. Private vehicle use
restriction
1. to implement the progressif tax for private vehicle
2. to implement the parking progressif charge
3. to decrease the fuel subsidy for private vehicle
Mid-term
Short-tem
Mid-term
4. Motorized vehicle
operational life-time
restriction
1. Progressive tax for based on vehicle age
Mid-term
4. Travel demand
management
1. Encouraging the efficient
travel management
1. Travel Demand Management implementation
2. public transport route integration
3. to develop integrated ticketing of urban public transport
Short-term
Short-term
Mid-term
2. Encouraging rational
vehicle use (rational pricing)
1. road pricing implementation
2. bus priority lane development
3. mass public transport development
4. to increase modal share of the public transport
Mid-term
Mid-term
Mid-term
Short-term
3. Land and space use
management to create the
finest build environment and
to improve transport
1. Transit oriented development in big cities.
2. to create the compact and effective urban space
Long-term
Long-term

50
OBJECTIVE POLICY STRATEGY PROGRAM TARGET
accessibility and mobility
5. Infrastructure
management
1. Transport infrastructure
quality improvement
1. road infrastructure quality improvement Mid-term
2. developing new
infrastructure
1. railway infrastructure development Long-term
6. Sustainable
financing scheme
for national energy
efficiency program
on transport sector
1. Improving the tax and
retribution structure and
calculation
1. to allocate the revenue from taxes for alternative fuel development and incentives for efficient fuel technology development;
2. road congestion reduction funding through retribution;
Long-term
Short-term
2. Improving the sectoral and
special budget allocation
1. to increase budget allocation for research activities in the field of engine technology and alternative energy development;
2. to increase the special budget allocation for regional investment in term of transport sector development to support the energy efficiency program
Short-term
Mid-term
Source: Monitoring and Evaluation Team on National Transportation Policy, Coordinating Ministry of Economic Affairs (2008)

51
4.2.2. Policy exercise on the implementation priority
Referring to the above scheme, the exercise to set-up priority for policy intervention
of energy use in transport sector has been conducted to assess the relative important of
each program to the IMPACT and CAPACITY for implementation. By this approach,
the Government of Indonesia represented by Coordinating Ministry of Economic
Affairs together with the other related stakeholders, has formulated the priorities and
strategy to implement based on impact on fuel reduction and capacity implementation as
can be seen in the following table.
Table 4-10: Priorities and strategy to implement
No Based on
IMPACT ON Fuel Reduction
No Based on
CAPACITY IMPLEMENTATION
1 Mass public transport utilization 1 Fiscal disincentive on motorized
vehicle ownership
2 Shifting from fossil based fuel to
CNG for public transportation
vehicles
2 Mass public transport utilization
3 Vehicle retirement strategy 3 Vehicle Retirement Strategy
4 Fiscal dis-incentive on motorized
vehicle ownership
4 Shifting from fossil based fuel to CNG
for public transportation vehicles
5 Road pricing 5 Traffic management to improve the
road capacity performance
6 The use of “greener” automotive
technology and other alternative
energy for motorized vehicles
6 Road pricing
7 Traffic management to improve
the road capacity performance
7 The use of “greener” automotive
technology and other alternative
energy for motorized vehicles
8 Eco-driving implementation 8 Eco-driving implementation
The excercise is successfully generate a priority for the implementation (Table 4-
10). Surprisingly, there is no policy intervention for energy supply (BLUE color) and
infrastructure provision (RED color) listed. The overlooked policy options indicate that
the current initiatives on those option insufficiently result in impacts on fuel reduction.
On the other side, the intitutional capacity is also insufficient to implement those
policies. Therefore, we learnt that it is important to pay more attention to support

52
research activities related to the energy security issues and to enchance the capacity for
investing in infrastructure program. In addition, the necessity for infrastructure
improvement can be indicated from the prioritize policy option of energy technology
supply (GREEN color) that actually requires the auxiliary service infrastructure
networks (RED color).
From this policy exercise, we learnt that the result of exercise is in accordance to
the case study of a transport MRV NAMA which prioritize TDM program. With similar
concern on infrastructure improvement, we can expect that the TDM program would
significantly influence the new pattern of traffic flow, hence it needs to be supported by
infrastructure improvement programs.
5. Case for simulation
5.1 Finding a critical spot of urban traffic congestion
To find the proper case study for simulation an observation on one of the main
commuter corridor to the city center of Jakarta (Monas and Harmoni) has been
conducted. The observation involve travel time of three types of transport mode (bus,
taxi and motorcycle). The comparison of travel time, in particular motorcycle, indicate
the most congested segment. At the segment where motorcyle travel time is the highest
indicates that the congestion is very high and even the motorcycle that commonly easy
to navigate in a dense traffic could not move. Figure 4-15 shows that the most congested
segment where motorcycle as the highest travel time in comparison to taxi and bus
(BRT). Hence a location in Kuningan Area is proposed for conducted simulation.

53
Figure 4-15: Travel speed mode comparison to find the congestion spot in a
commuter corridor
Source: field survey (traffic counting), PUSTRAL-UGM (2012).
Figure 4-16 illustrates a situation in Kuningan Area where the congestion spot will
be selected for simulation model. A detailed observation on road traffic situation in
Kuningan Area is provided in next section to describe the condition of daily traffic
situation and vehicle occupancy level on Central Kuningan, Casablanca Street, Rasuna
Park, and West Kuningan .
Figure 4-16: Kuningan area, Jakarta

54
5.2. Traffic informatin in Kuningan Area, Jakarta
From the daily traffic data, the road traffic situation in Kuningan area can be
indicated by volume of motorized vehicle as shown in Table 4-11. The highest volume
of road traffic in Kuningan area is separately occurred in Rasuna Park segment with
number of vehicle more than 42,500 units for each direction dominated by private
motorized vehicles such as motorcycle and passenger cars. In the peak time, the number
of vehicle is around 3,800 units for each direction.
Table 4-11: Volume of motorized vehicle in Kuningan area
Segment Average Daily Traffic Peak time
South-North North-South South-North North-South
Central Kuningan 35,597 30,656 3,204 2,759
Rasuna Park 43,299 42,726 3,897 3,845
Casablanca street 25,332 41,137 2,280 3,702
West Kuningan 7,011 6,545 631 589
Source: field survey (traffic counting), PUSTRAL-UGM (2012).
Based on the field survey (2012), the level of vehicle occupancy that illustrates the
amount of movement of passengers that pass through the Kuningan area based on
occupancy rate per vehicle mode can be seen in Table 4-12.
Table 4-12: Vehicle occupancy level in Kuningan area
Segment Occupancy level
South to North North to South
Sta Kuningan Sentral 2,07 2,43
Sta Taman Rasuna 1,17 1,17
Sta Casablanca 1,53 1,47
Sta Kuningan Barat 1,60 1,73
Sta Mega Kuningan 1,13 1,20
Source: field survey (traffic counting), PUSTRAL-UGM (2012).

55
5.3. Landuse pattern and traffic flow problem in Kuningan Area
The high traffic volume in Kuningan area is caused by the condition of existing
land-use system. As it is known that the Kuningan area is a dense region in central
Jakarta were filled with commercial, administration, and socio-economic facilities and
activities. The future Kuningan area (Figure 4-17) will be developed to establish the
current pattern of high density business district development (blue, purple and red
colours).
Figure 4-17: Development Plan for Kuningan area 2030 (Draft), Jakarta
Source: The Government of DKI Jakarta Province.
Kuningan as a strategic bussiness district with a highly developed activities on the
both sides of the road also worstening traffic situation when the traffic from other side
of the road would across the road to access the building or sites on the other side. It

56
create a U-turn conflicted traffic that slowdown the through traffic on the main street. It
is important therefore in the simulation to take into account this traffic situation.
5.4. Estimating scale of investment for the simulation
To set the case of simulation model it is important to assess the system boundary of
the model. The determining factor is not only the area but also the scale of investment.
For the micro-simulation traffic model, the impementation should consider the available
budget of potential implementing agency (i.e Public Work and Transportation Agency).
If the implementation will be considered as a pilot project for smart community
development as proposed in this study, a reasonable amount of budget should be
estimated to ease the introduction of new approach for finding traffic congestion
solution. Hence, to get a reasonable amount of investment for piloting, the estimate will
not at the level of new road infrastructure, instead for a maintainance level. Learning
from the budget allocation for maintain and rehabilation of several road di DKI Jakarta
in 2012, the estimate of average cost/km is Mio IDR 9,151 (~ USD 1000,000).
Table 4-13: The estimate for road maintenance cost for Jakarta (2012)
Road Segments Cost
(Mio IDR)
Length
(Km)
Average
Cost/Km
(Mio IDR)
Average
Cost/100m
(Mio IDR)
S Parman, Gatot
Subroto, MT Haryono
30,000 5.400 5,555 555
Cakung Cilincing,
DI Panjaitan
24,500 2.439 10,045 1,004
RE Martadinata 42,800 1.930 22,176 2,217
TB Simatupang,
Mayjen Sutoyo
7,028 2.618 2,684 268
Jl Link Barat 1,152 0.225 5,120 512
Average 9,116 911
Source: Directorate General of Highway, Ministry of Public Works (2012).
The micro simulation is intended to provide a solution for certain spot i.e junction,
U-turn, hence the estimate of 100 meter lenght is quite reasonable volume for piloting.
Therefore, we recommend that USD 100.000 would be the maximum threshold for
designing engineering solution in the simulation. With this level of investment, a quick
yielding can be obtained and the new approach for addressing traffict congestion and
efficient transport sector could be bought-in by the implementing agency.