Embed Size (px)
Citation preview
Chapter 4
Tip-sample distance dependence
The tip-sample distance dependence of TER scattering of guanine and ClO−
4ions
adsorbed on a atomically flat Au(111) surface has been studied. The intensities of
the discrete Raman bands of the adsorbates decrease steeply by almost two orders of
magnitude upon retracting the tip by only about 20 nm. Together with the lateral
resolution, which was estimated to be about 30 nm,[53] this elucidates the high spatial
resolution of TERS not only parallel, but also perpendicular to the surface. The
measurement of the TER intensity over more than 20 nm of tip-surface distance
enabled the quantitative comparison with recent theoretical calculations by Notingher
et al.[35] The rapid decay of the band intensities is attributed to the fast decrease of
the near-field enhancement of excited LSP in the tip-substrate cavity with increasing
tip-sample distance z, following an z−10 behaviour.
In addition to studies on the dependence of TER band intensity on the tip-sample
distance, the behaviour of the TER background was investigated. It was attributed
to tip-enhanced fluorescence-like emission from the adsorbate (or an adsorbate-metal
complex). The background intensity shows a similar steep decrease with increasing
tip-sample distance as the Raman bands. As expected, the enhanced field acts equally
on both Raman and luminescence scattering. Our experimental results were compared
to several theoretical studies on the distance dependence of enhanced luminescence.
In contrast to the adsorbate bands, the background shifts significantly towards lower
frequencies during the retraction of the tip. This provides direct experimental evidence
33
4. Tip-sample distance dependence
for the frequency shift of LSP resonances in the tip-substrate cavity upon changing the
tip-sample distance, and, therefore, strongly underlines the electromagnetic nature of
the tip-enhancement mechanism. Such a blue shift with increasing distance had long
since been predicted by theory, but up to now never proven experimentally.
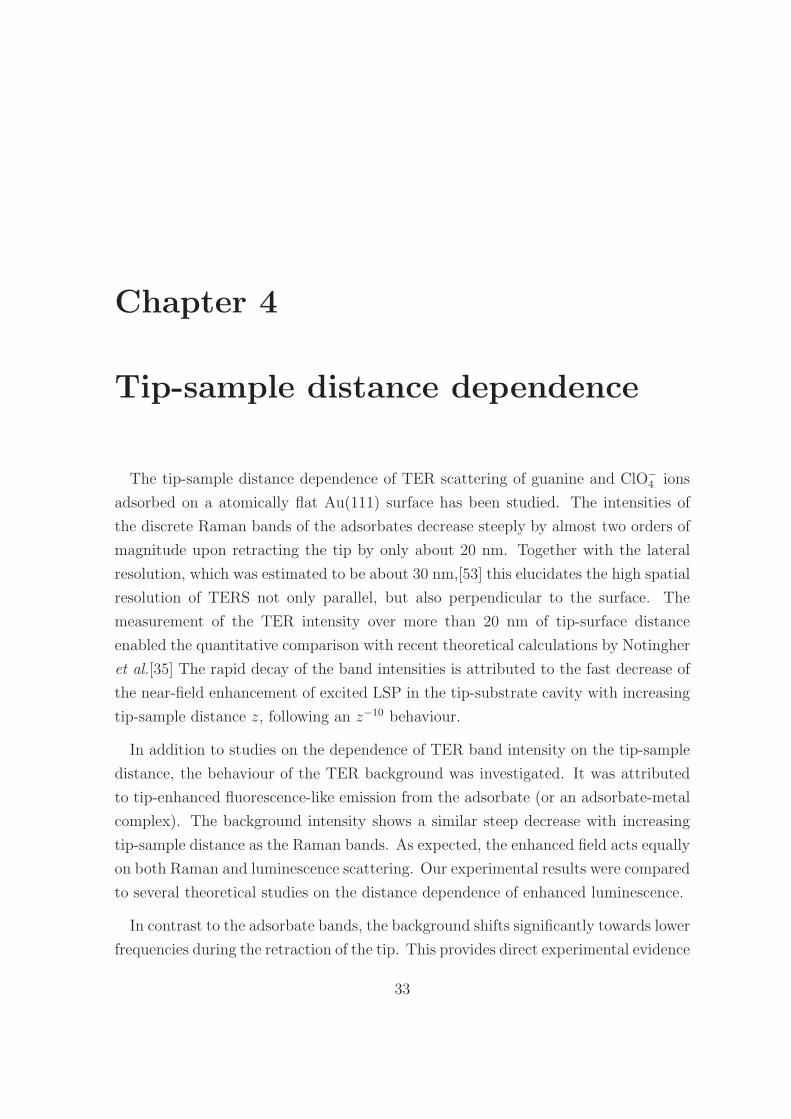
Our experimental data remarkably well resemble theoretical data published by Kall
et al.,[64] as seen in Fig. 4.1. See following text for a detailed discussion.
4.1 Experimental part
The experiments are performed on an atomically smooth Au(111) single crystal
surface prepared by flame-annealing, as described in Chapter 3. To coadsorb guanine
and perchlorate, the Au crystal is immersed into an ethanolic solution of 10−3 M
guanine and 10−1 M HClO4 for one hour. Afterwards, the sample is rinsed with
ethanol to remove multiple adlayers.
To measure the tip-sample distance dependence of the TER signal, the feed-back
loop of the STM is gated and the z-position of the tip controlled by a programmable
voltage-ramp generator. Tip retraction with constant speed is started 5 to 10 s after
gating the feed-back loop. During the retraction of the tip, a series of Raman spectra
(1 s integration time) is recorded at intervals of about 1.5 s.
Three different measurement series of different retraction speeds, 0.16 nm/s (8 nm
retraction distance zretr), 0.32 nm/s (zretr = 16 nm) and 1.6 nm/s (zretr = 80 nm), are
reported and analyzed. All spectra were normalized by subtracting the one recorded
without tip (z = 1 µm) to eliminate possible contribution from far-field illumination
or light scattering by the metal substrate.
4.2 Raman band decrease with increasing z
Our experimental set-up employing an STM leads to much more reliable data than
AFM-TERS studies on the band intensities versus distance behaviour found in the
literature:[55, 65–68] An STM-tip is held stable at a well-defined distance above the
sample, in contrast to an AFM-tip that oscillates with an amplitude of several tens of
34

4.2 Raman band decrease with increasing z
z = 1 nm z = 4 nm z = 7 nm z = 15 nm z = 20 nm
1.65 1.71 1.77 1.84
scat
teri
ng in
tens
ity / a.u.
photon energy / eV
01.90
A
B
Figure 4.1: A theoretical calculation by Kall and coworkers for a dye molecule”floating” between two Ag spheres (B) produces spectra that show a remarkablesimilarity to our experimental ones (A) if one takes into account the differentenergies for surface plasmons in Ag and in Au. Figure B reproduced from Ref.[64].
35
4. Tip-sample distance dependence
rtip
d
rtip
z
x0 x0
rtip
d
rtip
d
rtip
z
rtip
z
x0 x0
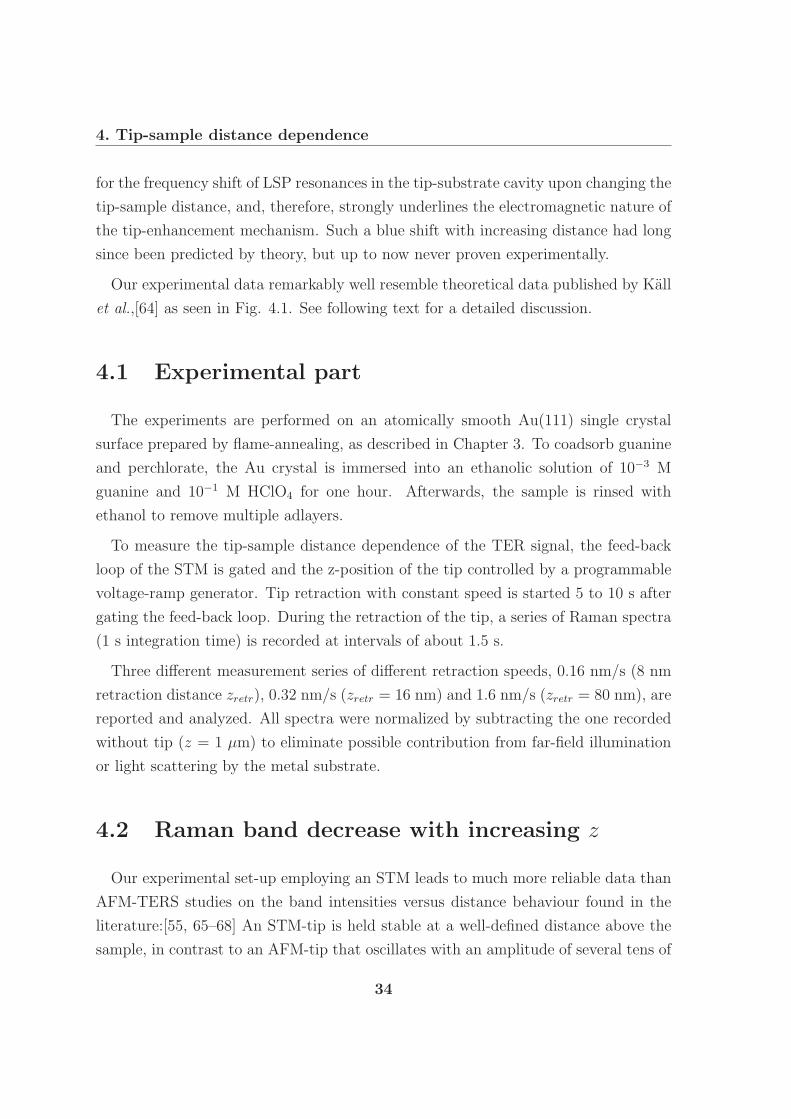
Figure 4.2: In tunneling contact, the tip is located approximately 1 nm abovethe sample surface. By the use of an external voltage ramp generator, the tip isretracted further over a retraction distance zretr during the experiment, so thatthe overall tip-sample distance z = d + zretr.
nanometres.[67, 68] For correct determination of the near-field distribution underneath
a metal tip, especially at smallest tip-sample separations of 1-5 nm, where the field
enhancement is maximal, such oscillations are an unsurmountable hindrance to data
interpretation as they inevitably lead to a nonlinear average of the Raman signal for
each data point. Therefore, we employ an STM-tip controlled by piezo crystals to
gain a much more precise insight into the band and background behaviour, i.e. the
vertical near-field distribution, with varying gap length.
Both adsorbed species, guanine and perchlorate, show TER scattering. With the tip
in tunneling position (d = 1 nm), a number of characteristic guanine bands appear very
weak in intensity, while perchlorate shows a characteristic, intense band at 930 cm−1,
assigned to its A1 breathing mode.[69] In contrast to the guanine bands that decrease
slowly with proceeding illumination without tip retraction due to bleaching, the ClO−
4-
band intensity remains unaffected. Therefore, for quantitative TER intensity versus
distance profiles, the intensity of this band was evaluated (compare Fig. 4.3). It should
be emphasized that the bands of coadsorbed guanine molecules decrease similarly with
increasing tip-sample distance.
The integral intensity of the Raman line at 930 cm−1 is plotted versus the tip-surface
distance in Fig. 4.4. The data are extracted from three series of TER spectra with
total retraction lengths of 6 nm, 12 nm and 50 nm (retraction speeds of 0.16 nm/s,
36
4.2 Raman band decrease with increasing z
900 950
in
tens
ity / a.u.
wavenumber / cm-1
ClO4- symmetric stretch
930 cm-1
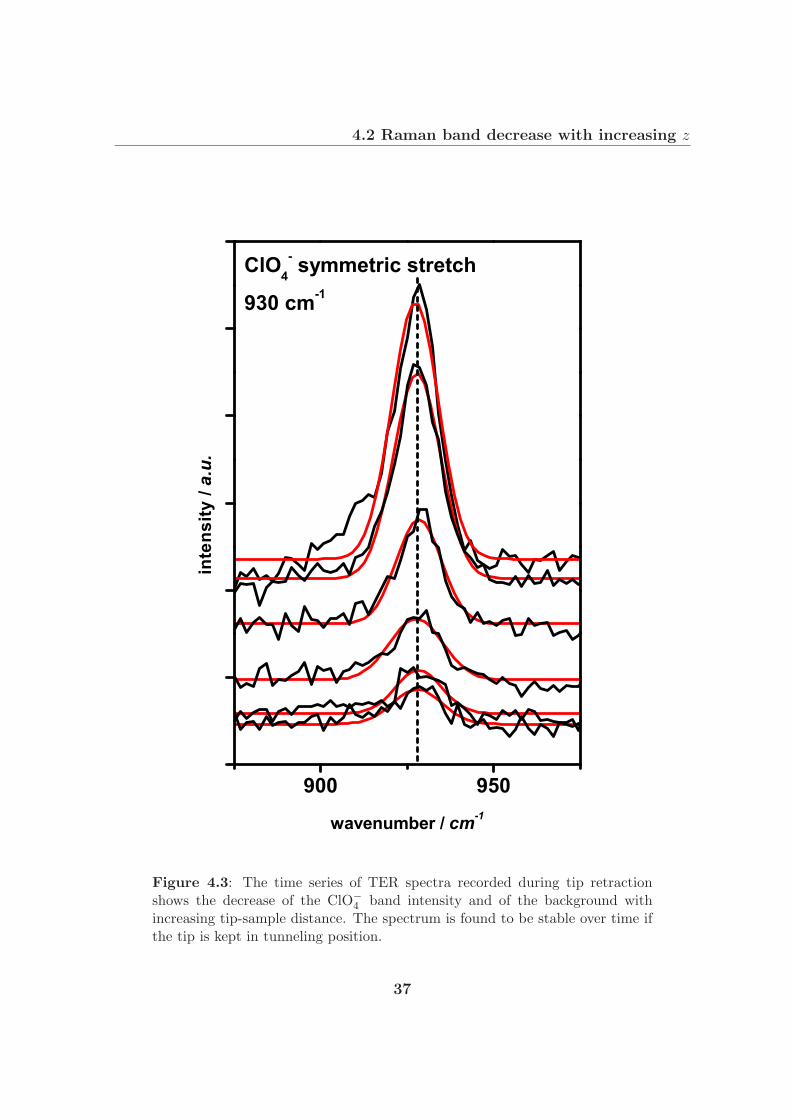
Figure 4.3: The time series of TER spectra recorded during tip retractionshows the decrease of the ClO−
4band intensity and of the background with
increasing tip-sample distance. The spectrum is found to be stable over time ifthe tip is kept in tunneling position.
37

4. Tip-sample distance dependence
0 5 10 15 20 25 30
0.0
0.2
0.4
0.6
0.8
1.0
norm
aliz
ed b
and
inte
nsity
tip-sample distance / nm
1.6 nm/s 0.32 nm/s 0.16 nm/s Pettinger 20 nm Notingher 20 nm Pettinger 30 nm
Figure 4.4: The ClO−
4band intensity vs tip-sample distance z is plotted. It
shows that hardly any Raman signal can be detected when z ≥ 15 nm, followinga 1/z10-distance dependence (see text for details). Squares: experimental data;solid line: fit according to Eq. 2.1.
38
4.2 Raman band decrease with increasing z
0.32 nm/s and 1.6 nm/s, respectively). For accurate determination of the integral
intensities, particularly for the weak band intensities at large tip-sample distances,
the 930 cm−1 band was fitted by two Gaussian curves and a linear background (Fig.
4.3). The integral band intensity was normalized to 1 at z = d = 1 nm, which is
the approximate tip-surface distance in tunneling mode. The TER intensities from
all three series exhibit the same steep decrease with increasing tip-surface distance,
reaching about one percent of the initial intensities at around 20 to 30 nm tip-sample
distance. This behaviour is independent of the retraction speed, as expected.
Applying Eqn 2.1,[53] the experimental data from Fig. 4.4 could be very well fitted
for rtip = 30 nm, which is in reasonable agreement with the measured radius of the tip
of approximately 20 nm. Within the framework of the sphere-substrate model, the
extended body of a real tip is accounted for by an effective sphere radius somewhat
larger than the real radius of the tip. Recent finite element calculations by Notingher
et al. (compare Chapter 2.5.2) on the distance dependence of the Raman enhancement
underneath a tip with rtip = 20 nm are also included in Fig. 4.4. Since in those
calculations the minimum tip-surface distance was 2 nm, Notingher’s theoretical data
was normalized to Pettinger’s theoretical intensity values (according to Eqn 2.1) at 2
nm distance, which also agrees well with the experimental average at this point.
Apparently, the experimental data match both calculations over two orders of mag-
nitude. However, in Notingher’s calculations, no metal substrate surface is taken into
account, and the Raman enhancement refers only to the position directly beneath the
tip apex, not considering the lateral extension of the near-field. The actions of these
two differences are likely to cancel each other. The general behaviour of the TER
intensity with increasing tip-sample distance is in agreement with the observations
by Raschke et al. for the tip-sample coupling upon elastic light scattering in AFM-
aSNOM. For very sharp metal tips, the scattered near-field signal was found to decay
strongly within 5 nm.[70] However, as our TERS apparatus is based on an STM, it
allows a much more precise positioning of the tip by piezo control than in the case of
AFM-TERS, where the tip is oscillating above the surface, which results in a smaller
error in our measurements.
39
4. Tip-sample distance dependence
4.3 Background decrease with increasing z
Integration over the entire spectral range reveals that the background continuum
actually represents the major part of the inelastic scattering. The very pronounced
Raman peaks that stick out from the background only contribute a minor part to
the overall scattering intensity. The origin of the background, which is commonly
observed in TE(R)R and SE(R)R spectra, but absent in normal Raman (NR) spectra,
is still under discussion, and spectra are therefore often presented after background
correction in the literature (e.g. Refs [32, 33, 53, 71]).
In 1979, it was proposed by Gersten et al. that the background is caused by lumi-
nescence from an electron-hole pair combination of an adsorbate-metal complex.[72]
Otto et al. explained it similarly as a by-product of a non-radiative charge transfer
between surface and molecule, an electron-hole pair formation and recombination.[73]
In a more recent publication, Le Ru and Etchegoin present theoretical calculations
in which they assign the background to a ”broad emission from all possible virtual
states”.[74]
It is highly unlikely that the background scattering stems from the metal alone, be-
cause the enhanced Raman intensity is found to be roughly proportional to the back-
ground intensity,[75] and no emission was found for a perfectly clean substrate.[76]
The background is undoubtedly connected to the adsorbate or an adsorbate-metal
complex.[77–80] Weiss and Haran report a connection between background and Ra-
man band intensity in their spectra.[81] They show that the background exists only in
the presence of the spectrum and vice versa. A similar association of SER scattering
and background continuum was found by Moore et al.[82]
Among the various theories on the origin of the broad continuum, one has recently
regained a lot of attraction: surface-enhanced luminescence.[83–86] Already in the
1980s, theoretical and experimental SERS papers dealt with the apparent concurrence
of quenching and enhancement at rough Ag surfaces.[87, 88] Pettinger and Gerolyma-
tou showed that, in fact, the background intensity in a SER spectrum is comparable
to the fluorescence spectrum from solution, although the quantum yield of surface-
enhanced fluorescence lies only around 10−4 because of metal damping effects.[89]
Kall et al. carried out a density matrix calculation of surface-enhanced resonant
40
4.3 Background decrease with increasing z
Raman scattering and fluorescence of a molecule trapped between two silver spheres,
discussing the influence of the field enhancement on these processes. Both are surface-
enhanced, but to a different degree, which results in a structured fluorescence back-
ground underneath the Raman bands (see Fig. 4.1).[64, 90]
Neither guanine nor perchlorate molecules show fluorescence in the visible in NR
spectroscopy. However, in the recorded TER spectra, a significant background is
found. Weitz et al. compared Raman band and background (fluorescence) intensity
of resonant and nonresonant molecules.[23] Interestingly, they found that the lower
the fluorescence quantum yield of the free molecule is, the higher enhanced the fluo-
rescence, in spite of the reduced emission via additional decay channels in the metal
surface. Therefore, we assume that the continuum is due to a fluorescent-like en-
hanced emission from the adsorbate or an adsorbate-metal complex. The mechanism
for particle-enhanced luminescence, however, is not quite understood yet: Part of the
effect might be due to the coupling of surface plasmons and either excitation light,
fluorescent radiation or both.[91] We have examined the background behaviour during
tip-retraction and compared it to experiment and theory in the literature.
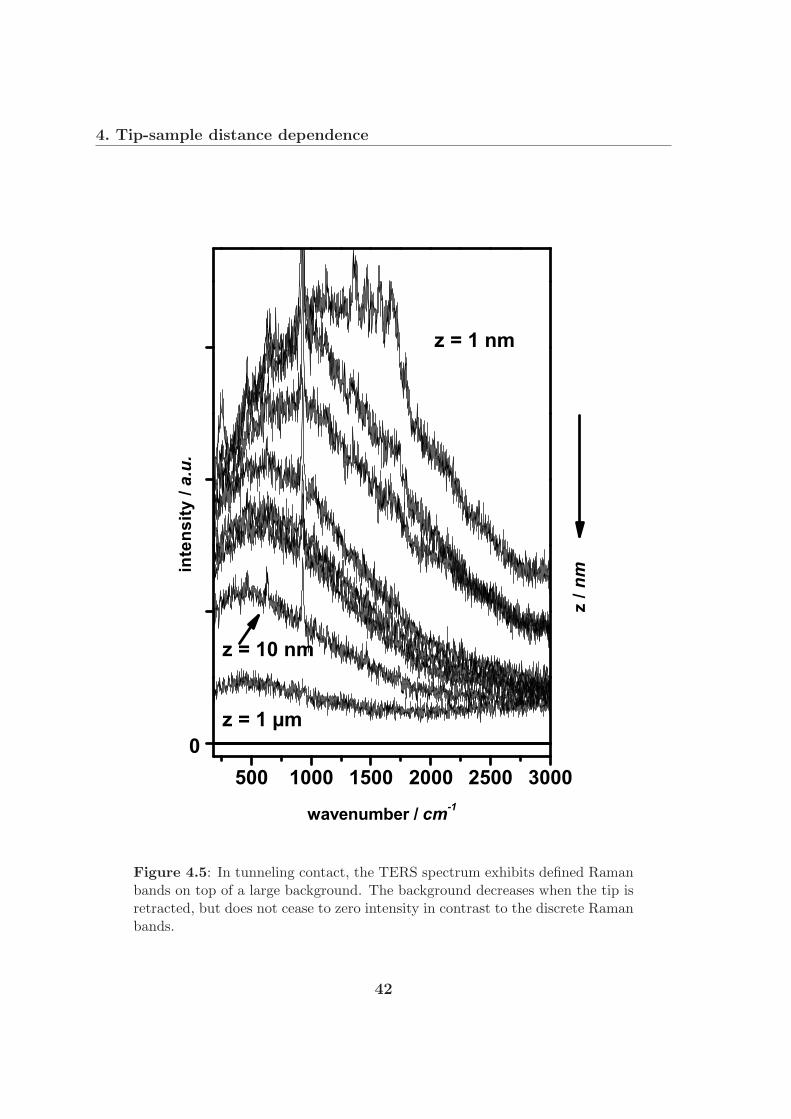
In Fig. 4.5, the spectral changes during tip retraction are shown. At tunneling dis-
tance, a very intense background continuum (in addition to the pronounced Raman
bands) is recorded that is slightly asymmetric with respect to the examined wavenum-
ber region, exhibiting a maximum at around 1300 cm−1. With increasing tip-sample
distance, the background alters its shape to an even less symmetric one, decreasing
in integral intensity and blue-shifting its maximum. Even at full retraction of the tip
(several tens of nanometers) the background is still present. Complete removal of the
tip (z = 1 µm) leads to another significant decrease of the signal, but a still measurable
intensity. which is attributed to far-field scattering of the adsorbate or of the metal
substrate itself: Typical fluorescence/luminescence cross sections (10−6 cm2) are so
much larger than typical Raman cross sections that it should be expected to obtain
relatively intense luminescence scattering by a monolayer from far-field illumination
only, i.e. molecules located in the broad laser focus. The given experimental condi-
tions cannot assure a perfectly clean substrate, and, especially at very low adsorbate
coverages (compare Chapter 5.3), part of the background may actually stem from
contamination adsorbate. With the current set-up, experiments with a supposedly
41
4. Tip-sample distance dependence
500 1000 1500 2000 2500 3000
z = 1 µm
z = 10 nm
z = 1 nm
inte
nsity
/ a.u.
wavenumber / cm-1
0
z
/ nm
Figure 4.5: In tunneling contact, the TERS spectrum exhibits defined Ramanbands on top of a large background. The background decreases when the tip isretracted, but does not cease to zero intensity in contrast to the discrete Ramanbands.
42
4.3 Background decrease with increasing z
”clean” gold substrate will always show Raman bands and a fluorescent-like back-
ground continuum resulting from unknown contamination. It would be interesting to
carry out TER studies on a pure Au(111) surface working in an inert gas atmosphere
to investigate possible spectral contributions from the substrate. The data presented
in the following has been corrected for this ”intrinsic” scattering to extract the near-
field contribution by subtraction of the TER spectrum recorded after tip removal (z
= 1 µm).
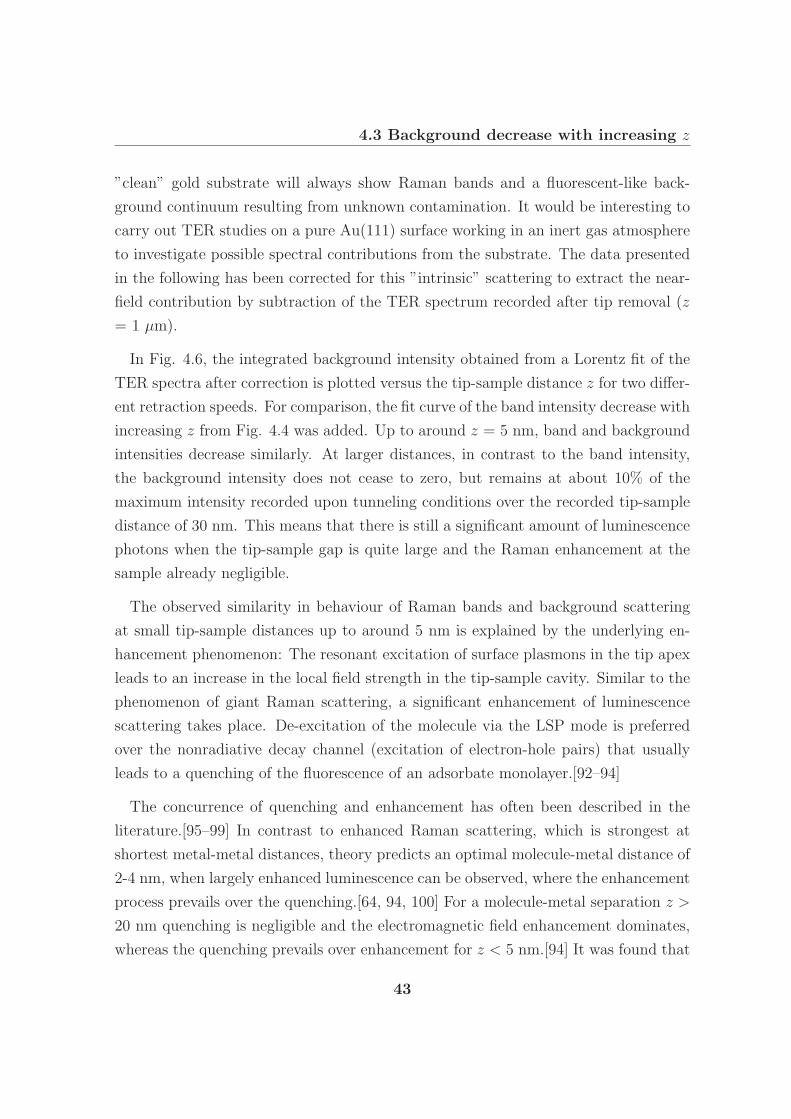
In Fig. 4.6, the integrated background intensity obtained from a Lorentz fit of the
TER spectra after correction is plotted versus the tip-sample distance z for two differ-
ent retraction speeds. For comparison, the fit curve of the band intensity decrease with
increasing z from Fig. 4.4 was added. Up to around z = 5 nm, band and background
intensities decrease similarly. At larger distances, in contrast to the band intensity,
the background intensity does not cease to zero, but remains at about 10% of the
maximum intensity recorded upon tunneling conditions over the recorded tip-sample
distance of 30 nm. This means that there is still a significant amount of luminescence
photons when the tip-sample gap is quite large and the Raman enhancement at the
sample already negligible.
The observed similarity in behaviour of Raman bands and background scattering
at small tip-sample distances up to around 5 nm is explained by the underlying en-
hancement phenomenon: The resonant excitation of surface plasmons in the tip apex
leads to an increase in the local field strength in the tip-sample cavity. Similar to the
phenomenon of giant Raman scattering, a significant enhancement of luminescence
scattering takes place. De-excitation of the molecule via the LSP mode is preferred
over the nonradiative decay channel (excitation of electron-hole pairs) that usually
leads to a quenching of the fluorescence of an adsorbate monolayer.[92–94]
The concurrence of quenching and enhancement has often been described in the
literature.[95–99] In contrast to enhanced Raman scattering, which is strongest at
shortest metal-metal distances, theory predicts an optimal molecule-metal distance of
2-4 nm, when largely enhanced luminescence can be observed, where the enhancement
process prevails over the quenching.[64, 94, 100] For a molecule-metal separation z >
20 nm quenching is negligible and the electromagnetic field enhancement dominates,
whereas the quenching prevails over enhancement for z < 5 nm.[94] It was found that
43
4. Tip-sample distance dependence
0 5 10 15 20 25 300.0
0.2
0.4
0.6
0.8
1.0
no
rmal
ized
bac
kgro
und
inte
nsity
tip-sample distance / nm
0.16 nm/s 1.6 nm/s fit band fit background
Figure 4.6: The background intensity vs tip-sample distance z is plotted to-gether with a fit to the experimental band and background decrease data. Sim-ilarly to the band intensity, the total background intensity shows a decreasewhen the tip is retracted. It does not cease to zero intensity even at severaltens of nanometers tip-sample distance, but reaches a minimum intensity limitof around 20% of the total intensity at d = 1 nm. For better comparison of theband and background behaviour, fit curves for both, the Raman band (compareFig. 4.4) and background decrease are plotted.
44
4.3 Background decrease with increasing z
molecules with low quantum yield show more strongly enhanced luminescence at a
shorter optimal distance, and vice versa.[100]
Following the argumentation of Kall et al., we explain our spectra with the fact
that the quenching effect cannot compete with the strong enhancement in the tip-
substrate configuration and is largely suppressed. Therefore, the broad background
remains under the Raman peaks at the investigated tip-sample separations.[64] The
Raman and luminescence scattering cross sections obtained from theoretical Raman
and background spectra of a particle placed between two Ag spheres (Ref. [90],
reproduced in Fig. 4.1) show a remarkably similar behaviour with increasing particle
separation to our curves in Fig. 4.6.[90] Note that the different background maximum
energies are due to the difference in the metal (Au and Ag, respectively) employed.
For a molecule located ”floating” in the center between two metal particles, the in-
creasing near-field enhances both, Raman and background scattering when decreasing
the particle separation from z → ∞ to a few nanometers. Approaching the particles
further, the molecule in between the particles couples more strongly to the metal
and luminescence is quenched. This results in an optimal distance, where lumines-
cence scattering enhancement is maximal and quenching not yet a problem. However,
the TERS case is slightly different, as the tip-substrate distance is varied, but the
molecule always is located at the metal substrate and not in the center between metal
substrate and tip. Thus, the radiationless decay channel via the metal substrate
is always present. We expect a steep increase in enhancement of luminescence with
decreasing z (increasing near-field strength) without passing through an optimum dis-
tance. At larger distances (z = 10-50 nm), the luminescence levels off to about 10%
of the initial intensity. From the experimental data at hand, we cannot determine
the behaviour of the background intensity until total tip removal, but a slow further
decrease approaching the z = 1 µm spectrum is expected.
In summary, the omnipresent background continuum in SERS and TERS experi-
ments is attributed to fluorescent-like scattering by the adsorbate or an adsorbate-
metal complex. At small tip-metal distances, a tenfold enhancement by the enhanced
field created in the tip-sample cavity is monitored. The influence of the strongly
enhanced electromagnetic field on the luminescence scattering at small tip-sample
distances up to around 5 nm results in a comparable behaviour of the background
45
4. Tip-sample distance dependence
intensity to the Raman scattering intensity. At large tip-metal distances, the far-field
spectra still show some background, but no pronounced Raman bands.
4.4 LSP resonance shift
While in NRS the background usually exhibits a flat characteristic, we find a pro-
nounced maximum in the TER spectral background. Itoh et al. showed that the
maximum energy of the ERS background coincides with the resonance energy of the
localized surface plasmons.[80] In other words, the background profile displays the
mode structure and energy profiles of LSPs excited in the tip-metal cavity. Hence,
the background becomes Lorentzian-shaped like the LSP resonance. By monitor-
ing the shift of the background maximum with varying tip-sample distance, we can
directly observe the corresponding changes in the gap resonance.
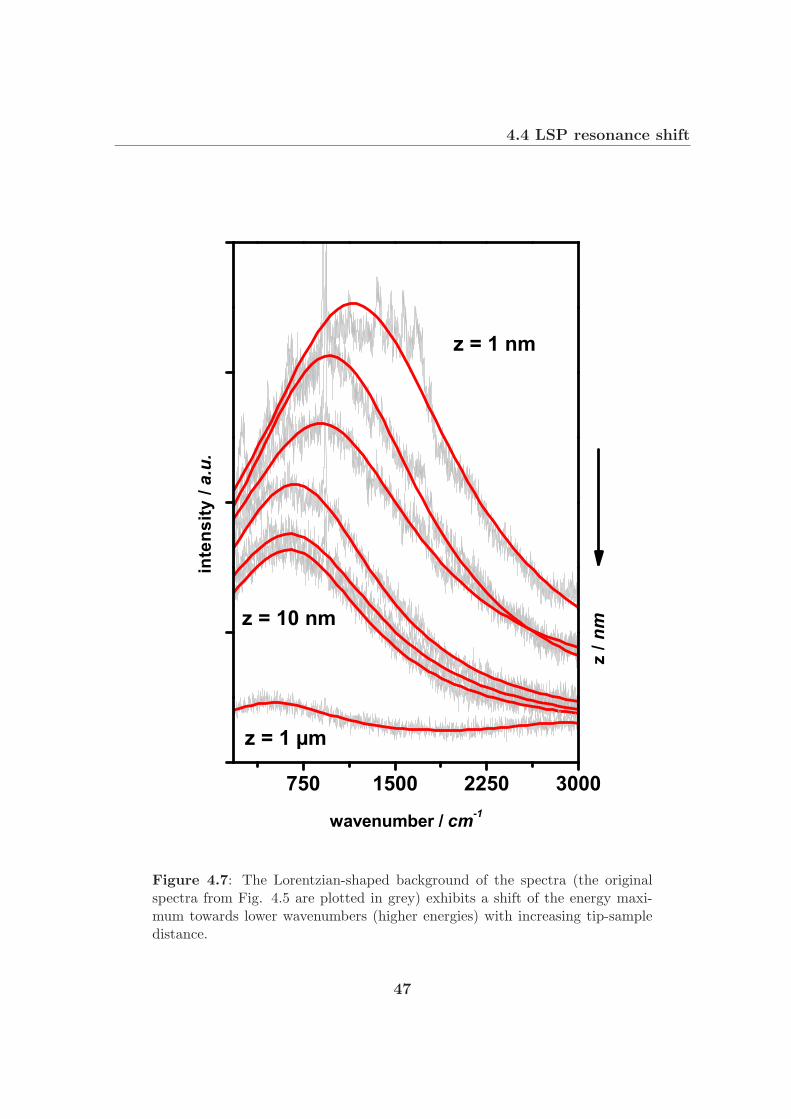
At z = d = 1 nm, the background maximum is located at around 1388 cm−1
(1.787 eV). While the positions of the discrete Raman lines remain constant during
the retraction of the tip, the background maximum shows a remarkable shift towards
higher energy with increasing tip-sample separation. The maximum energy shifts
from about 1.787 eV (1388 cm−1) for z = d = 1 nm to about 1.885 eV (603 cm−1)
for z = 5.2 nm (Fig. 4.7). Similar shifts were observed in other experiments with
different retraction speeds and increased total retraction distances up to 20 nm. An
isolated illuminated tip (z → ∞) shows a very weak background centered at 1.906
eV (430 cm−1). It is noteworthy that the FWHM of the background remains about
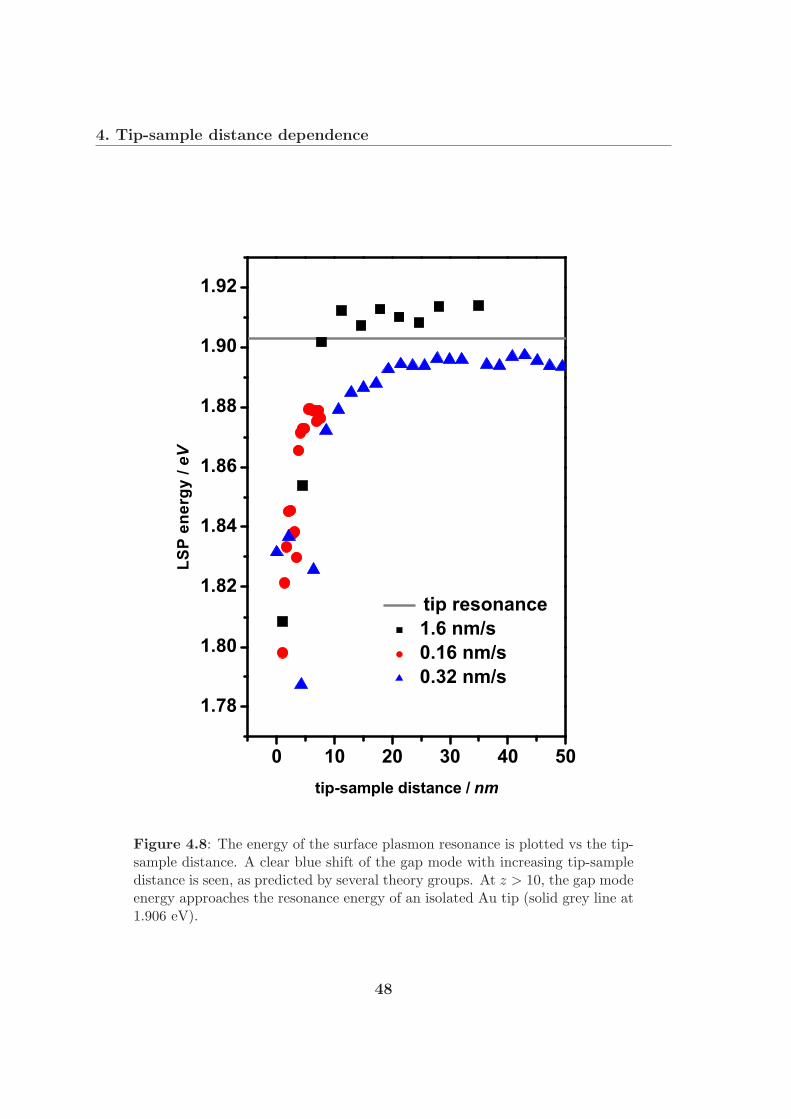
constant during tip retraction. Fig. 4.8 summarizes the energy shift by plotting the
background maximum energy versus tip-surface distance for three series of Raman
spectra up to tip-surface distances of 50 nm.
At larger distances above 5 nm, the experimental maximum frequency levels off and
stays about constant for z > 15-20 nm. This indicates that the mutual influence of
tip and surface ceases rather abruptly at about 5 nm distance. The observed limit
frequency at large distances should therefore represent the LSP of an isolated tip.
Indeed, the observed values of 1.89-1.91 eV agree very well with the maximum energy
measured for an isolated tip. In addition, this value is in reasonable agreement with
the surface plasmon frequency for an ellipsoidal Au particle with dimensions of the
46
4.4 LSP resonance shift
750 1500 2250 3000
z = 1 µm
z = 10 nm
in
tens
ity / a.u.
wavenumber / cm-1
z = 1 nm
z / n
m
Figure 4.7: The Lorentzian-shaped background of the spectra (the originalspectra from Fig. 4.5 are plotted in grey) exhibits a shift of the energy maxi-mum towards lower wavenumbers (higher energies) with increasing tip-sampledistance.
47
4. Tip-sample distance dependence
0 10 20 30 40 50
1.78
1.80
1.82
1.84
1.86
1.88
1.90
1.92
tip resonance 1.6 nm/s 0.16 nm/s 0.32 nm/s
LSP
ene
rgy
/ eV
tip-sample distance / nm
Figure 4.8: The energy of the surface plasmon resonance is plotted vs the tip-sample distance. A clear blue shift of the gap mode with increasing tip-sampledistance is seen, as predicted by several theory groups. At z > 10, the gap modeenergy approaches the resonance energy of an isolated Au tip (solid grey line at1.906 eV).
48
4.4 LSP resonance shift
tip apex. It should be noted at this point that considerable TER scattering was still
observed at distances up to about 25 nm, far beyond the range of appreciable influence
of the substrate surface on the LSP frequency.
The spectral blue-shift must be ascribed to changes in the LSP resonance with
increasing gap length. The concept of LSP was introduced by Rendell et al., who
calculated the LSP modes for a sphere-substrate system dependent on the sphere
diameter and the sphere-surface distance.[56] Indeed, a blue shift of the LSP was
predicted for increasing sphere-substrate distances. Similar blue shifts were reported
in more recent theoretical papers.[61, 64, 90, 101–103]
In particular, Porto et al. report LSP energies for a gold sphere of 40 nm radius
above a gold substrate of 1.83 eV, 1.95 eV and 2.07 eV at sphere-sample distances of
1 nm, 2 nm and 5 nm respectively.[61] Given the differences in radius and shape of
our tip (rtip = 20 nm), the absolute values obtained by theory are remarkably close to
the experimentally observed ones. Similar blue-shifts (at different energies) of around
0.3 eV for z = 8 nm were also reported by Demming et al.[104] and Downes et al.[54]
Related experimental work was published by Chumanov et al. and Jain et al.,
who investigated the extinction spectra of different nanoparticle concentrations, i.e.
different statistical interparticle distances. However, their results are contradictory:
Chumanov et al. report a red shift for lower particle concentrations,[105] whereas Jain
et al. observe the predicted blue shift for increased particle-particle separations.[106]
Well-defined experimental conditions, like polarization of the incident light and par-
ticle distribution, are crucial for a precise determination of the plasmon shift.[107]
The tip-sample configuration in the TERS experiment allows for a much more precise
investigation of the plasmon resonance with varying distance.
Our findings can be directly transferred to the case of SERS: In general, SERS also
exhibits a pronounced background maximum, often located at around 1000 cm−1.
Provided that SER scattering mainly arises from surface structures or particles which
are closely approaching each other, the low energy of the background maximum points
to a very close distance between these structures, a strong confinement of the EM field
and, thus, to a large EM enhancement.
In general, the background represents fluorescence-like inelastic light scattering from
the adsorbate-substrate system, as discussed in section 4.3, which in NRS usually
49
4. Tip-sample distance dependence
exhibits flat spectral characteristics with extremely weak intensities. In the presence of
substantial field enhancement, however, a measurable background with a pronounced
intensity maximum visualizing the LSP resonance is observed. The intensity profile
of the background directly reflects the underlying enhancement mechanism, i.e. the
excitation of LSPs. In other words, the background maximum is correlated with
the mode structure and energy profiles of LSPs in the tip-substrate cavity, or gap
modes, in the course of inelastic scattering processes. Hence, the background becomes
Lorentzian-shaped, like the LSP resonance, exhibiting a rather pronounced maximum.
The observed spectral blue shift of the background must be ascribed to changes of
the LSP resonances with increasing tip-sample distance.
4.5 Conclusions, difficulties & outlook
The behaviour of TER guanine band and spectral background with respect to
varying tip-sample distance was investigated. The TER band intensities follow an
z−10 behaviour, dropping to nearly zero after approximately 10 nm tip-retraction (for
rtip = 20 nm). The background shows a similarly steep decrease up to 5 nm gap
length. Approximately 10% of the enhanced background intensity is still present
at large tip-sample distances > 15 nm. We observe a blue-shift of the background-
maximum energy with increasing tip-sample-distance that directly visualizes the un-
derlying effect of plasmon excitation. The resonance energy of the gap modes shifts
to higher energies with larger gap distances, approaching the value of an isolated tip
from around 15 nm distance.
Originally, we wanted to study the guanine bands, and perchlorate was added to
the adsorption solution to increase the solubility. However, the guanine Raman bands
are much weaker in intensity and therefore not as easy to monitor as the ClO−
4stretch
band at 930 cm−1, and in addition, they show a decrease with the time (bleaching
effect). For strong perchlorate-metal interactions, we would expect a change in the
vibration frequency.[108] As the position of the perchlorate symmetric stretch band
in our spectra is not shifted with respect to the band in solution Raman spectra,
we conclude that the adsorption behaviour of perchlorate on gold is mainly governed
by electrostatic forces (nonspecific adsorption). For the present case, it is likely that
50
4.5 Conclusions, difficulties & outlook
adsorbate-adsorbate interactions with guanine play some role, but we have not inves-
tigated this problem any further.
With regard to the tip-sample distances that we calculate from opening times of
the spectrometer shutter, there are two points that need to be considered: First,
the measurement start is synchronized manually, i.e. the recording of the Raman
spectra and the gating of the feed-back loop. This results in some error for the first
data points (where the most rapid decay occurs) when calculating the real tip-sample
distance from the shutter time recorded by the Raman spectrometer. In addition, we
do not know how stable the tip is held with respect to the surface when controlled by
the external ramp generator. Recorded test spectra without feed-back control show
stable TER signals over at least 10 - 15 s. It is unclear, however, how the movement of
the tip will influence the stability. At fast retraction speeds, such internal vibrations
might be negligible, whereas the system might not be as stable at slow retraction over
a larger time period.
In order to gain more insight into the influence of the gold sample on the gap mode
excitation, one could perform similar experiments with a different metal or also an
insulator substrate and analyze the tip-sample distance behaviour as well as the LSP
resonance energies. It may also be of interest to employ a different excitation energy
to tune the latter.
51


![Fluorescence near metal tips: The roles of energy transfer ... › elec603 › spring2008 › Meeting_Blog › Ent… · fluorescence spectra [14, 21], tip-molecule distance dependence](https://img.pdfslide.us/doc/110x75/5f26a57ec04bc541de471408/fluorescence-near-metal-tips-the-roles-of-energy-transfer-a-elec603-a-spring2008.jpg)