Embed Size (px)
Citation preview
..y
Final Dra@ 5/30/2000 to be submitted to Phys. Chem. Chem. Phys.
m
Molecular Dynamic Simulations of the Lithium Coordination z r~
Environment in Phosphate Glasses Q %0W: I!!!-+~<-~m
Todd M. Alamat, Jian-Jie Liangb and Randall T. Cyganb a
a Organic Materials Department, Sandia National Laboratories, MS-1407, Albuquerque,NM 87185-1407, USA E-mail: [email protected]
b Geochemistry Department, Sandia National Laboratories, MS-0750, Albuquerque, NM87185-0750, USA
Abstract
A molecuku dynamics (MD) study of the lithium uhraphosphate glass series, xLi20.(1 -
X)P205 (O S x < 0.5) was used to investigate the changes in the Li environment with
increasing modifier concentration. The results from the MD simulations indicate that no
major structural variations in the Li coordination environment are observed. Changes in
the type of oxygen coordinated to the modifier are observed and correlate with the T~
minimum. Additionally, changes in the number of shared phosphorus vertices are
observed with increasing modifier concentration, in support of recent models involving
the role of the modifier in the extended range structure of phosphate glasses. Empirical
calculations of the 6Li NMR chemical shifts directly from the MD simulation structures is
also reported and compared to recent experimental solid-state NMR results.
+Author to whom correspondence should be addressed.
1

DISCLAIMER
This report was prepared as an account of work sponsoredby an agency of the United States Government. Neitherthe United States Government nor any agency thereof, norany of their empioyees, make any warranty, express orimpiied, or assumes any iegai iiabiiity or responsibility forthe accuracy, completeness, or usefulness of anyinformation, apparatus, product, or process disciosed, orrepresents that its use wouid not infringe privateiy ownedrights. Reference herein to any specific commercialproduct, process, or service by trade name, trademark,manufacturer, or otherwise does not necessarily constituteor impiy its endorsement, recommendation, or favoring bythe United States Government or any agency thereof. Theviews and opinions of authors expressed herein do notnecessarily state or refiect those of the United StatesGovernment or any agency thereof.

DISCLAIMER
Portions of this document may be illegible
in electronic image products. Images are
produced from the best available original
document.

.
,
1 Introduction
Phosphate glasses are technologically important materials, and are used in a variety of
applications including glass-to-metal seals, 1 sealing frits,2 nuclear waste forms,3-5
lasers,d-l 1 and optical components. 12 Understanding the relationship between the
structure and the observed physical properties of phosphate glasses remains an area of
active research. In many instances this structural-property correlation has not been
realized. For example, in binary alkali ultraphosphate glasses a minimum in the glass
transition temperature (TJ is observed near the 20 to 25 mole percent alkali modifier
concentration. Figure 1 shows the T~behavior for the xLi20”(1 ‘~)p2@ glasses as a
fi.mction of Li20 concentration. lg~lx An analogous T~minimum is not observed for
silicate glasses. While there have been numerous experimental investigations into this
anomalous T~behavior in phosphate glasses, including NMR, Raman and XRD studies
(See the recent reviews by Brow,15 and Hoppe and co-workers,ld plus references cited
therein), an explanation of the structural changes responsible for the anomalous T~
minimum has yet to be confirmed.
Both theoretical ab initio and molecuku dynamic (MD) investigations of
phosphate glass structure have also been reported. In contrast to the wealth of studies on
silicate glass systems, 17-25 the number of theoretical investigations in phosphates has
been limited, with the anisotropy of the phosphate bonding being a major complicating
factor. The phosphorus atom contains five valence electrons, and yet maintains a
tetrahedral hybridization such that the P-O bonds are intrinsically anisotropic. For
example, in the single component glass P205 this hybridization is clearly evident with
2
three of the P-O bonds being bridging (with a P-O bond distance of 1.581 ~) along with a
single terminal P=O bond (with a P-O distances of 1.432 ~). The theoretical
investigations to date show that for accurate simulations of phosphate materials the
structural asymmetry of the P bonding must be reproduced, along with the ability to
distinguish between P=O and P-O bonds. Uchino and co-workers have reported a series
of ab initio orbital calculations on the electronic, structure and vibrational properties of
alkali metaphosphate glasses.26-28 MD simulations have been reported for the NaP03,29
Mg(P03)2, Zn(P03)2 and Pb(P03)2 glasses,so~s 1 as well as the xCaO”(l-x)P205,32
xLi20”(l -X)P205,33 0.5Na20wA1203”(0.5 -x)P205 and (0.5 -x/2)Na20”A1203 ”(0.5-x/2)P205
glass series.so The MD simulations reported by Liang et al.gq for the uhraphosphate
xLi20.( 1-X)P205 (O S x < 0.5) glass system were the first theoretical study to directly
address the question of the anomalous T~behavior as a fimction of alkali modifier
concentration in ultraphosphate glasses. In that initial report, the minimum in the Tgwas
replicated, along with a preliminary analysis of the structural variations that were
observed with changing LizO concentration. It was demonstrated that the changes in the
phosphate ring stiucture correlated nicely with the T~minimum, and that ring strain may
play an important role in determining the glass properties.
Hoppe and co-workers~ b~gs~sbhave recently presented evidence that the
coordination and cross-linking of the alkali or alkaline earth cations used as backbone
modifiers also play a significant role in the observed physical properties of phosphate
glasses. In general, the initial addition of the modifying cation results in the
depolymerization of the phosphate cross-linked network with breaking of the P-O-P bond
and conversion of Q3 to Q2 units (in the Q“ terminology, n, denotes the number of P-O-P
3

bonds in the phosphate tetrahedra).37~38 This depolymerization process results in the
initial observed decrease of T~ At low modifier concentrations the cation is isolated and
is coordinated by both double bonded oxygens (DBO) and non-bridging oxygens (NBO).
Above some critical concentration it is proposed that the terminal oxygens (TO) are all
coordinated to the metal cations, and that the metal coordination tetrahedral (MeOJ begin
to link. In this higher concentration range there is a reorganization of the glass network
on the intermediate length scale resulting in an increasing T~with modifier concentration.
Hudgens and Martin13 attribute this increase in network structure to the ability of the
cations to form cross-links between adj scent phosphate chains. The effect of cross-
linking of different phosphate rings by coordinating alkali cations is also supported by ab
initio calculations on alkali metaphosphate glasses.28 In the model forwarded by Hoppe
and co-workers, structural reorganization of the glass network is predicted to occur when
the cation coordination number (CNMJ is equivalent to the number of terminal oxygens
per modi~ing cation (MTO). For glasses with the stoichiometry x(Me2jVO)”(l-X)P205, MTO
is defined by
\
M~O = v(l/ x) (1)
where v is the metal (Me) valency. For the Li modifier, with a CN -4-5,39 the critical
concentration is expected to occur for x -0.2-0.25, corresponding nicely with the
observed T~minimum.
It is therefore important to investigate the role of the alkali environment on the
phosphate glass structure as observed in MD simulations. In this manuscript we detail the
variations in the Li cation environment observed in the MD simulation of the Li
4

?
ultraphosphate series, xLizO”(l -X)P205 (O S x < 0.5). Correlation of this environment with
the Tg minimum will be discussed. In addition, a comparison between recently reported
6Li NMR resuhs39 and the Li chemical shifts empirically calculated from the simulated
MD structures is also presented.
2. Computational methods
2.1 MD simulations
The creation of a reliable force field to describe the interaction potentials
involving phosphates is a very important step in the modeling of phosphate systems. The
correct representation of the phosphate bonding anisotropy is important in the
development of accurate models. For the molecular dynamics (MD) simulations detailed
here a forcefield model that incorporates both two and three-body interactions was
employed.gg This model allows the P bonding asymmetry to be realized while treating
all oxygen atoms identically. The short-range two-body interactions were modeled using
a Lennard-Jones potential fimction
(2)
5
where r represents the interatomic distances, with r. and Do being adjustable parameters.
Partial charges instead of formal charges were used to describe the Coulombic, or

t r
electrostatic, component of the system. Three body interaction terms were incorporated
to describe both the O-P-O and P-O-P interactions being defined by
~g,e=$+l-coy,E (3)
where (1is either the O-P-O angle or the P-O-P angle, with adjustable parameters e. and
~. The parameters in Eqs. 2 and 3 were determined by fitting the structure of crystalline
lithium-metaphosphate, LiP03 and the two orthorhombic phases of P205 as previously
described.33 The parameters of this forcefield model are summarized in Table 1.
MD simulations for eight compositions in the solid solution series, xLi20” (1-x)
P205, x = 0.0, 0.1,0.15,0.2,0.25,0.3, 0.4, and 0.5, were preformed using the Cerius2
software and the OFF energy program.40 The MD simulations of the glasses were
performed using a constant volume and temperature (NVT) canonical ensemble. The
compositions were equilibrated at 3000 K to achieve active melting for 50 ps, utilizing 1
fs time steps. Quenching of this equilibrated system from 3000 K to 300 K was
performed in 500 K intervals (the last step from 500 K to 300 K), with each temperature
step lasting 7 ps. This simulation sequence corresponds to a quench rate of -7.1 x 10~1
K/s. At 300 K, an additional 50 ps simulation was used to equilibrate the system.
Additional details of the MD simulations, including cell size and number of atoms, have
previously been reported.33
The glass-transition (Tg) temperatures were determined by monitoring the
volume-temperature relationship for a given composition in the MD simulations where
6

t
the phosphate glass was treated as an NPT ensemble (constant pressure and temperature
at each given temperature step) as previously described.33 This computational approach
is analogous to the experimental determination
2.2 Calculation of 6Li NMR chemical shifts
of T~using dilatometry.
Keller et al.’ll has recently demonstrated that the observed NMR chemical shift of alkali
species can be related to a chemical shift parameter A, where A is defined as the
summation of the shift contributions for all the oxygens located within the first (and
possibly the second ) coordination sphere around the cation. For the present study of Li
phosphate glasses, the chemical shift correlates directly to bond valence of the
coordinating oxygen. An empirical bond valence (sti) between oxygen i and the cationj
can be calculated from the cation-oxygen bond length, r~, using 42-44
SU= exp[(r, -qJ )/B] (4)
where r. is the empirically derived oxygen-cation bond length of unit valence, and B =
0.37 is a constant previously defined.42-44 The total valence of the ith oxygen (W’i)is
simply the summation over all oxygen-cation bond valences Stifor each of thej cations
bonded to the oxygens, including both lithium and phosphorous cations:
~. =~sv.i
(5)
7

,
The chemical shifl parameter A will then be a summation of the oxygen shift
contributions with a 1/ q3 (where ~i is the Li-O bond distance) distance dependence:
(6)
The l/q3 dependence was empirically obtained previously by Keller et. a141 from fitting
of model compounds. The resulting A values obtained from the MD simulations are given
in Table 3. We recently reported an empirical linear relationship between the observed
‘Li chemical shift (8) and the chemical shift parameter A for lithium phosphate system,qg
8(’Li) = +4.30A -5.85 (7)
allowing the bLi chemical shifi to be determined from the MD simulations.
3. Results
3.1 Li Pair correlation functions
The variation of the Li environment for the phosphate ghiss series, xLizO”(l ‘~)p@s
(0.1 S x< 0.5) was determined by calculation of the Li pair distribution ii.mctions (PDF)
for Li-0, Li-P and Li-Li at various Li20 modifier concentrations for the MD simulations.
The structural distances and average coordination numbers (CN) derived from the Li PDF
plots (Figs. 2 -4) are given in Tables 2 and 3.
8

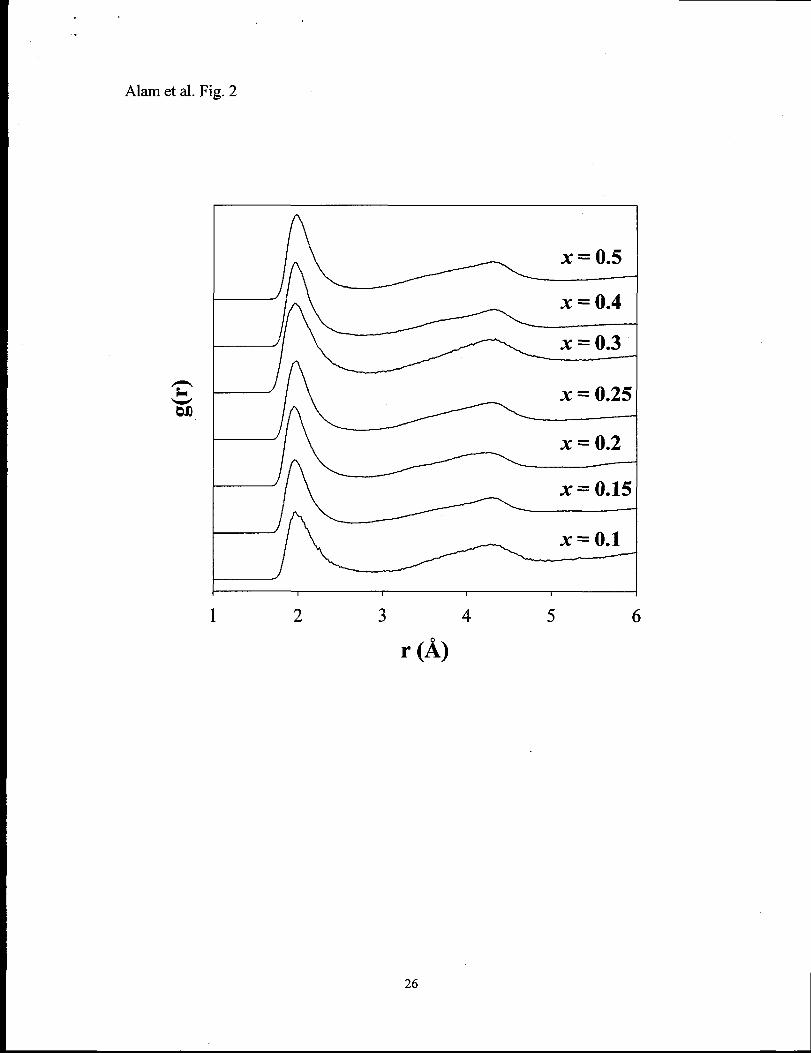
The Li-O pair distribution function (PDF) as a fiction of Li20 concentration is
shown in Figure 2. The shape of the Li-O PDF shows little variation with increasing
modifier concentration. The first peak for Li-O PDF ranges from 1.95 to 1.97 & with a
fill width at half maximum (FWHM) ranging from 0.32 to 0.35 ~. The first peak is
asymmetric, tailing towards longer coordination distances. As seen in Figure 2 the Li-O
PDF does not return to a null value after the fust coordination sphere, demonstrating that
there is overlap between the first and second coordination shells. A similar result has
been reported for the Na-O PDF in the MD simulation of NaP03 glass.29 Because of this#
coordination sphere overlap it is important to include the cut-off distances used in the
determination of structural parameters, including average bond lengths and CN.
Variations in the cut-off distance will have dramatic effects on the resultant values. Due
to this asymmetry and coordination sphere overlap an average Li-O distance using a 3.0
~ cutoff are also reported (Table 3). The average Li-O distance of 2.25 ~ for the
metaphosphate composition (x = 0.5) is longer than the 2.03 I%reported in the neutron
diffraction study of LiP03 glass,45?46 or the average 1.96 ~ Li-O bond distance observed
for crystalline LiP03. The second peak in the Li-O PDF, along with the average Li-O CN
as a function of LizO concentration are given in Tables 2 and 3. The average CN ranges
between 4 and 5, and is consistent with experimental estimations of CN.39~45J46
The Li-P PDF as a function of Li20 concentration is shown in Figure 3 with the
first coordination peak varying between 3.25 and 3.27 & and a FWHM between 0.5 and
0.63 ~. The second coordination peak is vary broad and asymmetric, such that the peak
position was not reliably determined. The shape of the Li-P PDF is unchanged with
increasing Li20 concentration. The average Li-P bond length calculated using a 4.5 ~
9
.t
cutoff was found to decrease gradually with increasing modifier concentration, and
reflects the change in the valency of the coordinated oxygen in the Li-O-P bond (see
discussion below). The average Li-P CN varied between 6.5 and 7.4 (see Table 3), but
did not show any clear trends.
The Li-Li PDF is shown in Figure 4, and shows a very broad and asymmetric
peak that varies between 2.45 and 2.93 & having a FWHM peak width ranging between
-0.5 to 1.5 ~. The average Li-Li distance using a 6 ~ cutoff varied between 4.05 and
4.88 ~. The average Li-Li CN show a steady increase between 1.6 and 14.2 between x =
0.1 and 0.5. For x >0.1 the Li-Li PDF shows significant tailing for Li-Li distances
greater than 4 ~. The x = 0.1 PDF is shifted to slightly smaller Li-Li distance, and does
not appear to have as many long range Li-Li distances present within the PDF. While
these may suggest shorter Li-Li interactions at very low Li20 concentrations, The very
low average Li-Li CN (Table 3) shows that initially the Li cations are relatively isolated.
The broad nature of the Li-Li PDF strongly suggest that the Li cations are randomly
distributed throughout the glass network for the entire ultraphosphate concentration
regime.
3.2 Coordination Environment
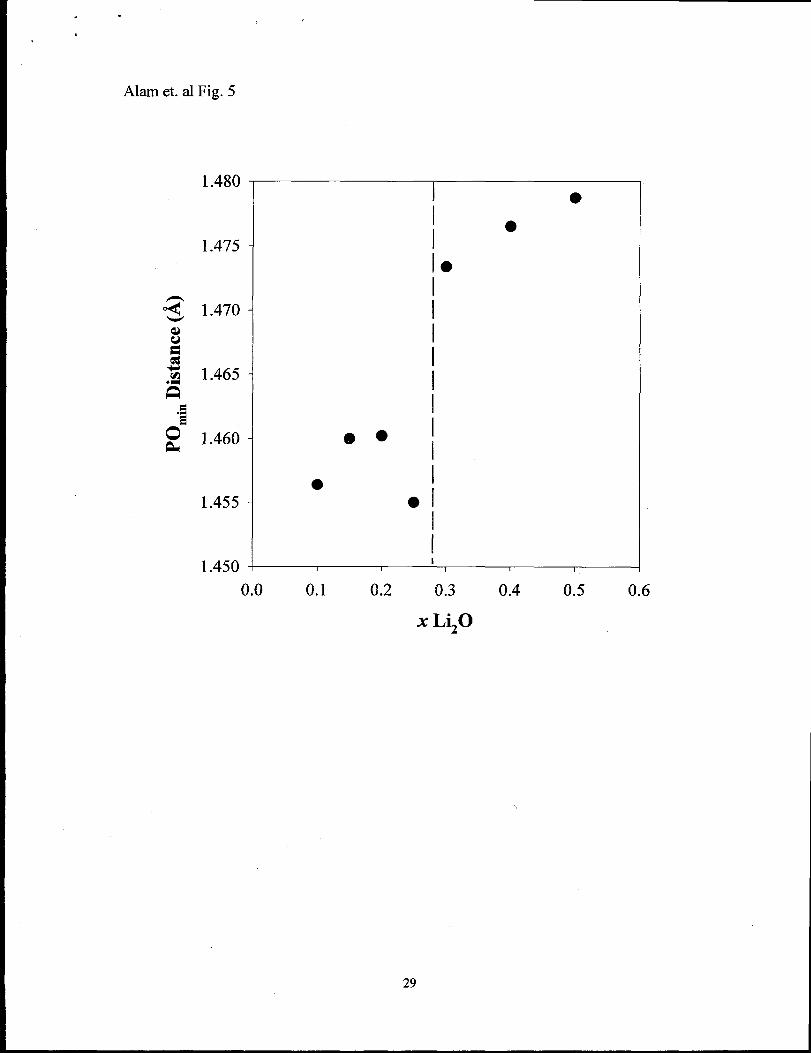
To address the change in the oxygen type that is coordinated to the Li with
variations of the Li20 concentration Figure 5 shows the average P-O bond distance for
oxygens that are within the first coordination sphere of the Li (cutoff distance 3.0 ~). The
minimum P-O distance for each coordinating oxygen was used to determine the average
shown in the figure. By utilizing the minimum P-O bond distance TO (both NBO and
DBO) and BO should be distinguishable, allowing the type of oxygen within the Li
coordination sphere to be addressed. Recall that the terminal doubly bonded P=O oxygen
(DBO) bond distance is significantly shorter (- 1.43 ~) than the bridging oxygen (BO)
bond distance (- 1.58 ~) in P205, and the non-bridging oxygen (NBO) is shorter (-1 .44
~) than the BO distance (-1.6 ~) in crystalline LiP03.
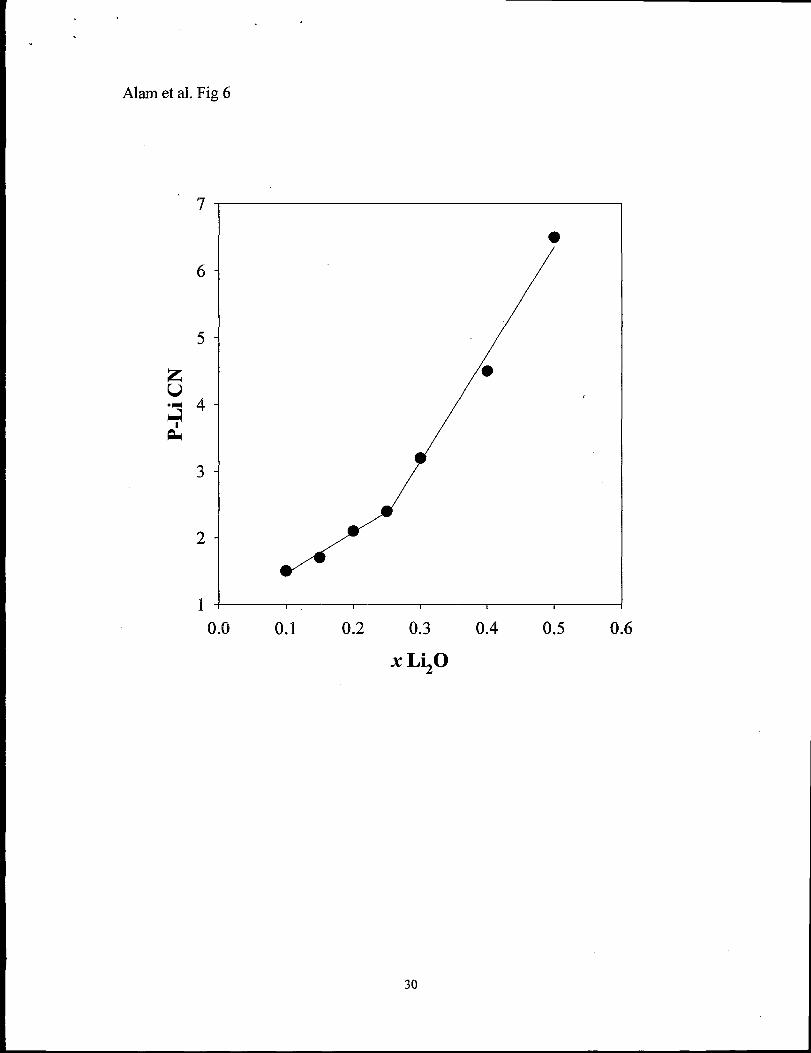
Figure 6 shows the variation of the average number of Li surrounding a
phosphorus atom as a fi.mction of Li20 concentration. A cutoff distance of 4.5 ~ was
utilized, and only CN for phosphorus that actually have Li within this coordination sphere
were utilized in calculation of the average CN. At x = 0.1 this P-Li CN is -1.5
suggesting that on average the Li do not significantly share P vertices. This coordination
increases steadily with higher Li20 concentration, with a distinct change in the variation
occurring near x = 0.25.
3.3 6Li NMR chemical shifts
In order to compare the structural information about the Li environment derived from
MD simulations to experimentally observed NMR results, the ‘Li chemical shifts were
calculated directly from the MD structures. The ‘Li NMR chemical shift is expected to be
sensitive to variations in the local Li coordination environment, and should reflect any
changes in the Li PDF. Using Eqs. 4-7 the average ‘Li chemical shift was calculated from
the MD structures as a i%nction of Li20 concentration and are given in Table 3 and
Figure 7. The intercept of this line can be adjusted by variation in the cutoff distance
used in the calculation of the A parameter. For example, increasing the cutoff distance to
include values >3.5 ~ will increase A and similarly 8 through Eqn 6 and 7. It is possible
11
.
to increase this cutoff distance to provide an improved fit between the experimental and
the MD calculated chemical shifts. For the present discussion a 3.5 ~ cutoff distance was
utilized, as this was the original cutoff distance used in the development of the empirical
relationship in Eqn 7.39
12
4 Discussion
Inspection of the Li PDF in Figures 2,3 and 4 show that in general there are only very
small variations of the Li environment with increasing LizO concentration. In particular,
there are no major structural changes in the Li coordination environment that would
correlate with the T~minimum observed in Figure 1. This is in contrast to the observation
of major changes in the phosphate ring structure as a function of modifier concentration
previously reported for this, xLi20”(l-x)P205 (O.1 S x S 0.5) glass series.33
The MD simulations presented here do reveal subtle variations in the Li
coordination environment that are consistent with the modifier restructuring model
forwarded by Hoppe and co-workers. 16~35Y36~47A schematic illustration of this model is
shown in Figure 8, for low, mid and high modifier concentrations. In Figure 5 there is a
step in the average minimum P-O bond distance for concentrations x >0.25, signaling a
change in the coordinating oxygen type, as would be predicted in the modifier
restructuring model. This fits well with the pictorial representation of the Hoppe model
where the initial coordination involves both DBO and NBO in isolated LiO~ polyhedra.
At the critical concentration the number of TO available (including both DBO and NBO)
is equal to the CN (M~o, Eqn 1), such that any additional increase in the LizO
concentration will require a LiOn po~yhedra to link together by corner and edges. This
change would be expected to manifest itself in the average coordinating oxygen
phosphorus bond length. The P-O bond distances at low Li20 concentrations is consistent
with a significant number of DBO bonds being involved in the coordination of Li, while
the P-O distance for oxygens coordinating Li at higher concentrations is consistent with
13

primarily NBO coordination. These average P-O distances demonstrate that very few BO
are involved in the Li cation coordination environment.
The low number of Li coordinating to a given phosphorus atom (Figure 6), along
with the low Li-Li CN (Table 3) show that initially the Li cations are relatively isolated,.
(CN - 1.5). Above the critical concentration of x - 0.25, the average coordination of Li
around a phosphorus increases dramatically, consistent with edge and corner sharing. The
increase in the average Li-Li CN (Table 3) is consistent with the formation of O-Li-O
crosslinks between neighboring phosphorus tetrahedr~ but an increase in the Li-Li CN is
also expected to result from increases in the Li number density.
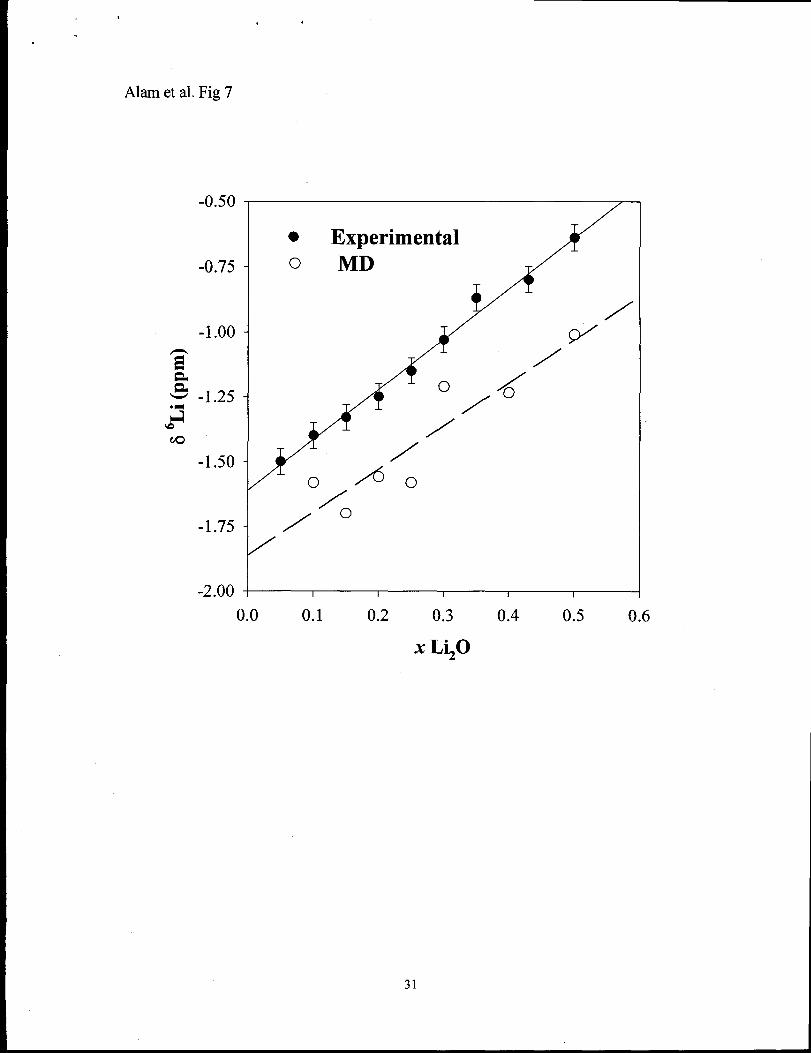
The MD simulations also provide insight into the surprising linear behavior of
the ‘Li MAS NMR chemical shifts. From Eqn. 6 changes in the Li-O CN would be
expected to produce a variation in the chemical shift, yet the observed ‘Li NMR chemical
shift is essentially linear for 0.05 S x S 0.5. From Table 2 we can see that there is a
minimum in Li-O CN at x -0.2, which should result in a minimum in the magnitude of
the shift parameter A, and subsequently a minimum in the chemical shift (Eqn. 7).
Inspection of Table 3 shows that there is also a variation of the Li-O bond distance with a
minimum near x -0.2, which maximizes the shift parameter zl. The combination of these
two non-linear effects tend to balance out to produce the observed linear behavior. This
observation demonstrates the NMR analysis of alkali chemical shifts may not reveal
subtle changes in the coordination environment, since the shift depends on the
combination of several different variables describing the coordination environment.
The results of the MD simulations also agree with recent NMR 7Li-31P and 31P-
7Li rotational-echo double resonance (REDOR) MAS experiments.48 REDOR
.
experiments allow a measure of the dipolar coupling between different nuclei, and those a
measure of spatial proximit y. REDOR experiments on Li phosphate glasses have shown
that the dipolar coupling between Li and P is rather independent of the Li20
concentration, demonstration that the P environment around a Li cations is unchanged.
The MD simulations (Tables 2 and 3) predict a similar behavior since the average Li-P
distance is constant, and the average Li-P CN shows only a small variation. The REDOR
experiments also demonstrate that the Li environment around a P changes distinctly near
x -0.25. This experimental observation may correspond to the change in slope noted in
the average P-Li CN (Figure 6) obtained for the MD simulations. A more future analysis
of these REDOR results is warranted.
The MD simulations also show that while there are changes in the Li environment
that do correlate with the observed T~minimum, the effects or changes are more gradated
that one would predict from the simplified cation restructuring model defined in Eqn. 1
and schematically detailed in Figure 8. A gradual variation of the coordination
environments with changes in modifier concentration would appear to be more realistic
than a sudden and distinct environmental change. Whether the anomalous Tg in alkali
ultraphosphate glasses can be caused solely by these Li environment changes, or result
from the formation of phosphate ring structures33 (still not experimentally verified), or is
a combination of these two effects remains to be determined. Further comparison
between MD simulations and experimental results in phosphate glass systems are being
pursued.
15
Acknowledgement
This work was supported by the Basic Energy Science (BES) program at Sandia National
Laboratories. Sandia is a mulitprogram laboratory operated by Sandia Corporatio~ a
Lockheed Martin Company, for the United States Department of Energy under Contract
DE-AC04-94AL85000.
16

.
References
1 J. A. Wilder, J Non-Cryst. Solids, 1980, 38!39, 879.
2 R. Morena, J Non-Crystalline Solids, 2000,263-264,382.
3 D. E. Day; Z. Wu; C. S. Ray; P. Hrma, J Non-C’ryst. Solids, 1998,241,1.
4 S. V. Raman, J Non-Crystalline Solids, 2000,263-264,395.
5X. Fang; C. S. Ray; G. K. Marasinghe; D. E. Day, J! Non-Cryst. solids, 2000,263-264,
293.
6 T. Hiirig; G. Huber; I. A. Shcherbakov, J Appl. Phys., 1981,52,4450.
7 M. J. Weber, A Non-Cryst. Solids, 1990,123,208.
8 S. A. Payne; M. L. Elder; J. H. Carnbell; G. D. Wilke; M. J. Weber; Y. T. Hayden,
Ceram. Trans., 1992,28,253.
9 J. H. Cambell; T. L Suratwala, J Non-Cryst. Solids, 2000,263-264,318.
10 D. L. Veasey; D. S. Funk; P. M. Peters; N. A. %nilord; G. E. Obarski; N. Fontaine; M.
Young; A. P. Peskin; W.-C. Liu; S. N. Houde-Walter; J. S. Hayden, J. Non-Cryst. Solids,
2000,263-264,369.
11 P.R. Ehrrnann; J. H. Carnbell; T. I. Suratwala; J. S. Hayden; D. Krashkevich; K.
Takeuchi, J Non-Cryst. Solids, 2000,263-264,251.
12 S. Jiang; T. Luo; B.-C. Hwang; F. Smekatala; k. Seneschal; J. Lucas; N.
Peyghambarian, J Non-Crystal. Solids, 2000,263-264,364.
13 J. J. Hudgens; S. W. Martin, J Am. Ceram. Sot., 1993,76,1691.
14 J. J. Hudgens; R. K. Brow; D. R. Tallant; S. W. Martin, J Non-Cryst. Solids, 1998,
223,21.
15 R. K. Brow, J Non-Cryst. Solids, 2000,263-264, 1.
17

.
16 U. Hoppe, J Non-Cryst. Solids, 2000,263-264,29.
17 F. L. Galeener, J Non-Cryst. Solids, 1982,49,53.
18 C. Huang; A. N. Cormack, J Chem. Phys., 1990,93,8180.
19 B. VessaI, A Non-Cryst. Solids, 1994,177, 103.
20 Y. Benino; K. Hirao; N. Soga, J Non-Cryst. Solids, 1995,183,22.
21 J. Habasaki; I. Okad~ Y. Hiwatari, J Non-Cryst. Solids, 1995,183,12.
22 T. Peres; D.A. Litton; J. A. Capobianco; S. H. Garofalini, J Non-Cry.st. Solids, 1997,
221,34.
23 T. Uchino; Y. Tokud~ T. Yoko, Physical Review B, 1998,58,5322.
24 B. Park; A. N. Cormack, J Non-Cryst. Solids, 1999,255,112.
25 N. T. Huffi E. Demiralp; T. Cagin; W. A. Goddard, J Non-Cryst. Solids, 1999,253,
133.
26 T. Uchino; Y. Ogata, J Non-Cryst. Solids, 1995, 181, 175.
27 T. Uchino; Y. Ogata, J Non-Cryst. Solids, 1995,191,56.
28 T. Uchino; T. Yoko, Z Non-Cryst. Solids, 2000,263-264, 180.
29A. Speghini; E. Sourial; T. Peres; G. Pinn~ M. Bettinelli; J. A. Capobianco, Phys.
Chem. Chem. Phys., 1999,1,173.
30 G. Cormier; J. A. Capobianco; A. Monteil, J Non-Cryst. Solids, 1994,168, 115.
31 E. Sourial; T. Peres; J. A. Capobianco; A. Speghini; M. Bettinelli, Phys. Chem. Chem.
Phys., 1999, 1,2013.
32 D. K. Belashchenko, Inorganic Materials, 1997,33,475.
33 J.-J. Liang; R. T. Cygan; T. M. Alarn, J Non-Cryst. Solids, 2000,263-264, 167.
18

34 H. Inoue; A. Makishimq T. Kanazawa; T. Nanba; I. Yusai, Phys. Chenz. Glasses,
1995,36,37.
35 U. Hoppe; G. Walter; R. Kranold; D. Stachel; A. Barz, J Non-Cryst. Solids, 1995,
192&193, 28.
36 U. Hoppe, J Non-Cryst. Solids, 1996,195,138.
37 R. J. Kirkpatrick; R. K. Brow, Solid State Nuclear Magnetic Resonance, 1995,5,9.
38 R. K. Brow; D. R. Tallant; J. J. Hudgens; S. W. Martin; A. D. Irwin, J ofNon-
Crystalline Solids, 1994,177,221.
39 T. M. Akun; S. Conzone; R. K. Brow; T. J. Boyle, J Non-Cryst. Solids, 1999,258,
140.
40 The MD simulations were performed using the Cerius2 software package and the off
energy program, Molecular Simulations Inc., 2000,
41 H. Keller; G. Engelhardt; A. P. M. Kentegens; J. Sauer, J I’hys. Chem., 1994,98,
1544.
42 L D. Brown; R. D. Shannon, Acts Cryst., 1973, A29, 266.
43 L D. Brown; D. Altermatt, Acts Cryst., 1985, B41, 244.
44 N. E. Brese; M. O’Keefee, Acts Cryst., 1991, B47, 192.
45 K. Muruganandam; M. Seshasayee; S. Patnaik, Solid State Ionics, 1996,89,313.
46 J. Swenson; A. Matic; A. Brodin; L. Borjesson; W. S. Howells, Phys. Review B.,
1998,58,11331.
47 U. Hoppe; G. Walter; D. Stachel; A. Barz; A. C. Hannon, 2. Naturforsch., 1997, 52a,
259.
48 L. Van Wuller, Li-P REDOR (Personal communications).
19
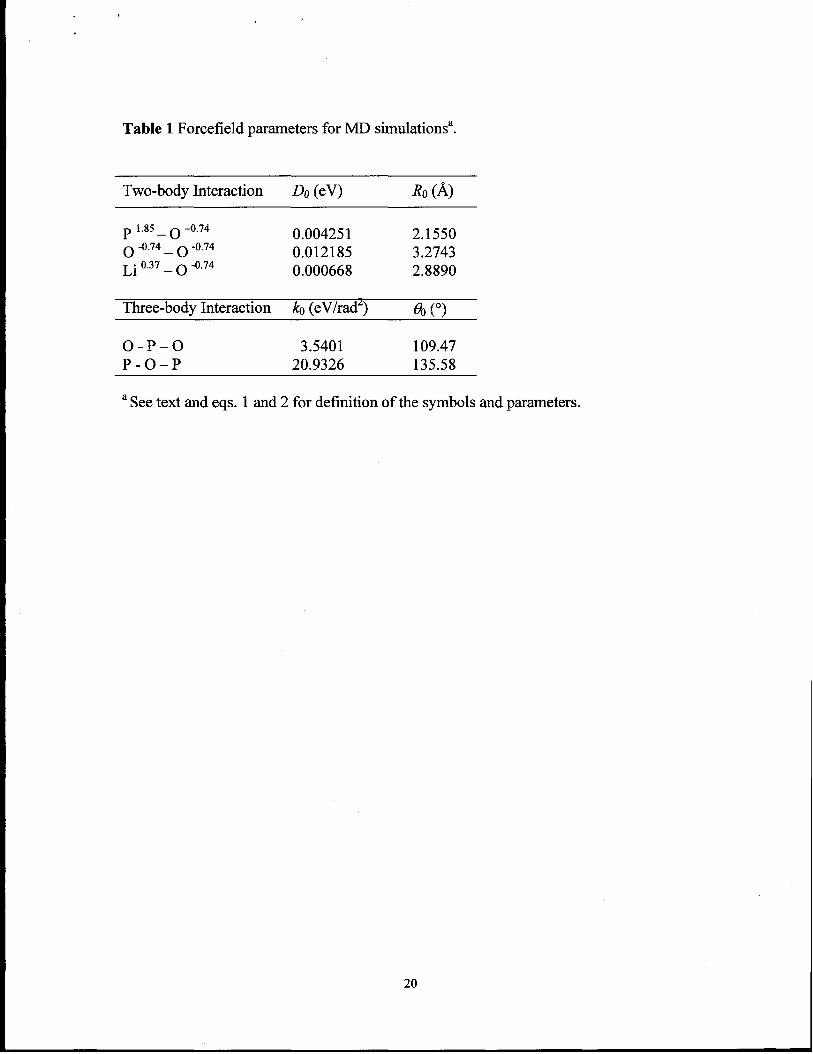
Table 1 Forcefield parameters for MD simulations’.
Two-body Interaction Do (eV) R. (~)
P 1.85 _ () -0.74 0.004251 2.1550~ -0.74_ ~ -0.74 0.012185 3.2743Li 0.37_ ~ ‘0.74 0.000668 2.8890
Three-body Interaction ~ (eV/rad’) en (0)
o- P-o 3.5401 109.47P-o–P 20.9326 135.58
aSee text and eqs. 1 and 2 for definition of the symbols and parameters.
20
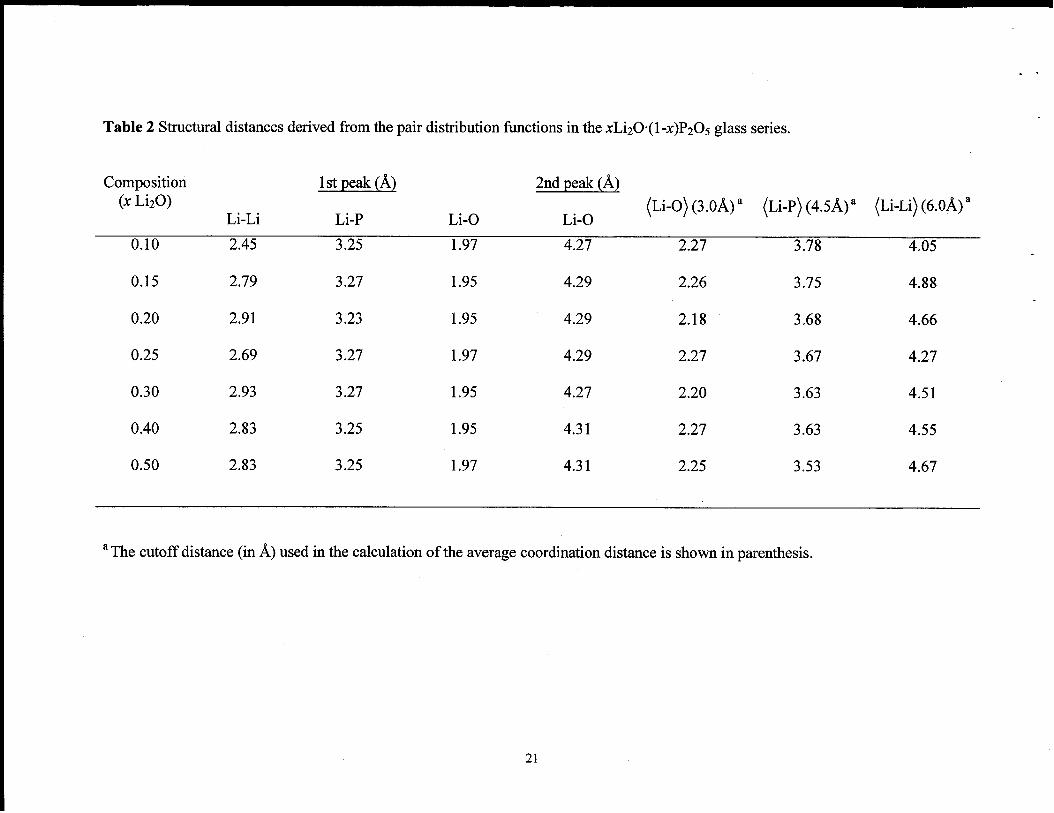
Table 2 Structural distances derived from the pair distribution I!hnctions in the xLi20”(l -X)P205 glass series.
Composition @l?%&.@ 2nd peak (~)(x Li20)
Li-Li Li-P Li-O(Li-0) (3.0~)a (Li-P) (4.5~)a (Li-Li)(6.0~)a
Li-O
0,10 2.45 3.25 1.97 4.27 2.27 3.78 4.05 ,
0.15 2.79 3.27 1.95 4.29 2.26 3.75 4.88
0.20 2.91 3.23 1.95 4.29 2.18 3.68 4.66
0.25 2.69 3.27 1.97 4.29 2.27 3.67 4.27
0.30 2.93 3.27 1.95 4.27 2.20 3.63 4.51
0.40 2.83 3.25 1.95 4.31 2.27 3.63 4.55
0.50 2.83 3.25 1.97 4.31 2.25 3.53 4.67
aThe cutoff distance (in ~) used in the calculation of the average coordination distance is shown in parenthesis.
21
. .
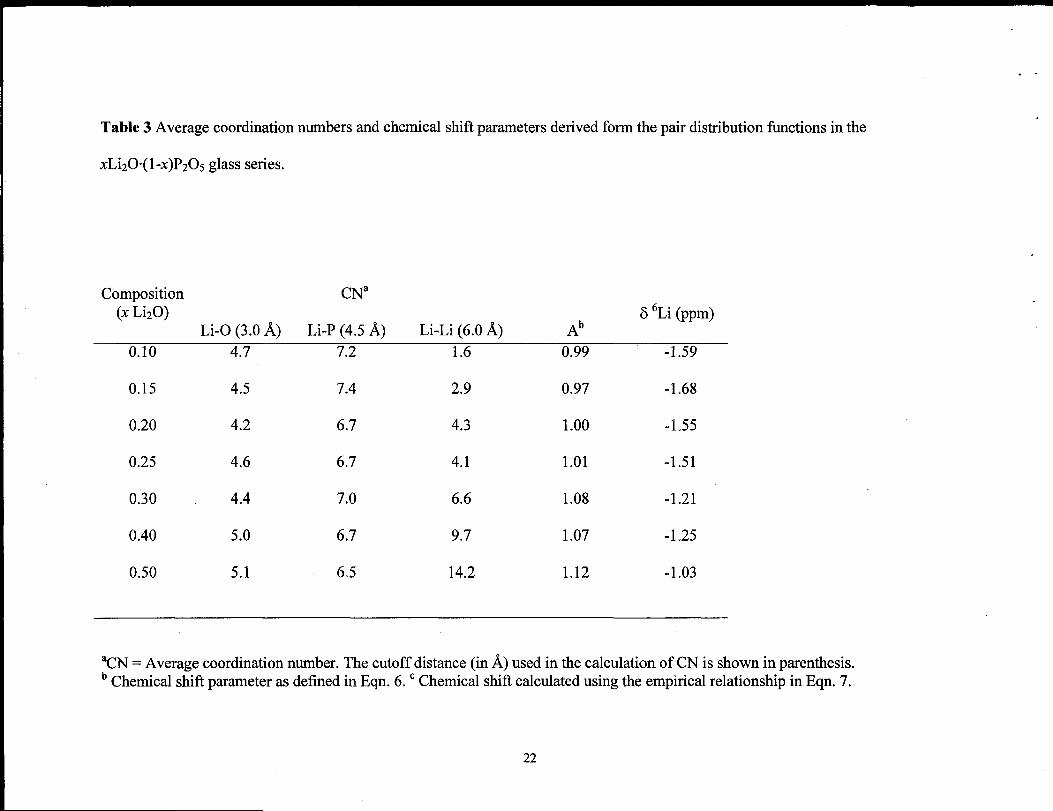
Table 3 Average coordination numbers and chemical shifl parameters derived form the pair distribution fimctions in the
xLi20”(l -X)P205 glass series.
Composition CNa(x LizO) 5 ‘Li (ppm)
Li-O (3.0 ~) Li-P (4.5 ~) Li-Li (6.0 ~) Ab
0.10 4.7 7.2 1.6 0.99 -1.59
0.15 4.5 7.4 2.9 0.97 -1.68
0.20 4.2 6.7 4.3 1.00 -1.55
0.25 4.6 6.7 4.1 1.01 -1.51
0.30 4.4 7.0 6.6 1.08 -1.21
0.40 5.0 6.7 9.7 1.07 -1.25
0.50 5.1 6.5 14.2 1.12 -1.03
aCN = Average coordination number. The cutoff distance (in ~) used in the calculation of CN is shown in parenthesis.b Chemical shift parameter as defined in Eqn. 6. c Chemical shift calculated using the empirical relationship in Eqn. 7.
22

Figures
Fig. 1 Variation of the glass transition temperature (T’) in the lithium ultraphosphate
glass series, xLi20”(l -X)P205 as a fhnction of Li20 concentration.
Fig. 2 Pair distribution function for the Li-O atomic pair for the xLi20”(l -X)P205 glass at
300 K from MD simulations as a function of Li20 concentration.
Fig. 3 Pair distribution fbnction for the Li-P atomic pair for the xLi20.(1 -X)P205 glass at
300 K from MD simulations as a fi.mction of Li20 concentration.
Fig. 4 Pair distribution fiction for the Li-Li atomic pair for the xLi20”(l-x)P205 glass at
300 K from MD simulations as a fhnction of Li20 concentration.
Fig. 5 Variation of the average minimum P-O bond distance for oxygens within the 3.5 ~
coordination sphere of Li from MD simulations as a function of Li20 concentration.
Fig. 6 Variation in the average number of Li cations coordinated to a P from MD
simulations as a function of Li20 concentration. Only those P with Li within 4.5 ~ are
considered in the average.
Fig. 7 Variation of the bLi NMR chemical shifl as a fimction of Li20 concentration (0 )
experimental and (0) predicted from MD simulations.
23
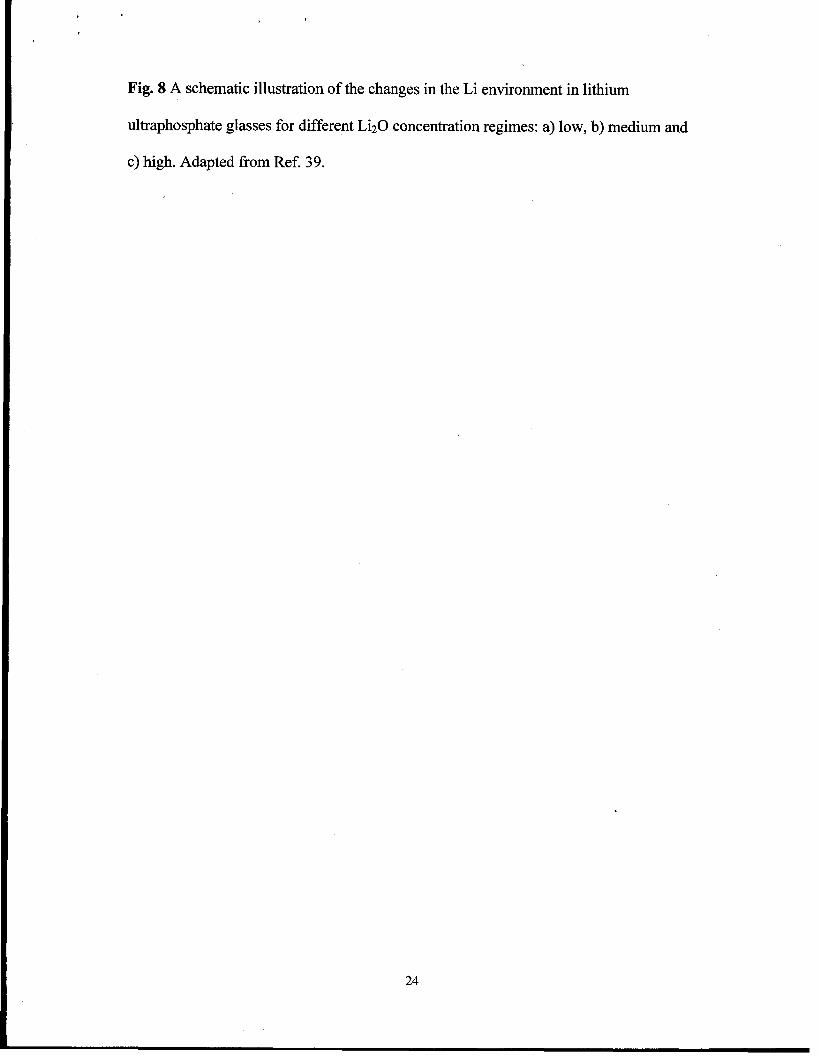
Fig. 8 A schematic illustration of the changes in the Li environment in lithium
ultraphosphate glasses for different LizO concentration regimes: a) low, b) medium and
c) high. Adapted from Ref. 39.
24

Alan et. al Figure 1
700
650
600
g
*“550
500
450
. Experiment1 OMD
●
o
0 000
0.0 0.1 0.2 0.3 0.4 0.5
x LizO
25
Alarn et al. Fig. 2
x = 0.25
x = 0.2
x = 0.15
1 2 3 4 5 6
r (A)
26

.
Alam et al. Fig. 3
x = 0.5
x = 0.4I /’
/x = 0.3
~ t---’/u- X = 0.25
x = 0.2
FA= x = 0.15
x = 0.1
1 2 3
r (A)
27
4 5 6

Alam et al. Fig. 4
x = 0.5
r~ x = 0.4
x = 0.3
X = 0.25
x = 0.2
/’x = 0.15
r ----...~—
x = 0.1
1 2 3 4 5 6 7 8
r (A)
28
Akun et. al Fig. 5
---1.480
1.475
1.470
1.465
1.460
1.455
1.4500.0
I ●
●
I
11 1 1 I I
0.1 0.2 0.3 0.4 0.5 0.6
‘
Alam et al. Fig 6
‘7
6
5
4
3
2
1
*
(9.0 0.1 0.2 0.3 0.4 0.5 0.6
30
Alanet al. Fig 7
-0.50
-0.75
-1.50
-1.75
,
.
● Experimental /2”o MD
//
o
/
/
-2.000.0 0.1 0.2 0.3 0.4 0.5
31
0.6

..
.
Alam et al. Fig. 8
a)
I
32