Embed Size (px)
Citation preview
Chapter 4Time-Domain Modelling of Group-Delayand Amplitude Characteristics inUltra-Wideband Printed-Circuit Antennas
Hung-Jui Lam, Yinying Lu, Huilian Du, Poman P.M. So, and Jens Bornemann
4.1 Introduction
With the release of the 3.1–10.6 GHz band for ultra-wideband (UWB) operation, avariety of typical UWB applications evolved; examples are indoor/outdoor commu-nication systems, ground-penetrating and vehicular radars, wall and through-wallimaging, medical imaging and surveillance, e.g. [1, 2].Many future systems willutilize handheld devices for such short-range and high bandwidth applications.Therefore, the realization of UWB antennas in printed-circuit technologies withinrelatively small substrate areas is of primary importance. And a number of suchantennas with either microstrip, e.g. [3–10] or coplanar waveguide feeds, e.g. [11–23], and in combined technologies, e.g. [24, 25], have been presented recently,mostly for the 3.1–10.6 GHz band, but also for higher frequency ranges, e.g. [26].
Since UWB systems involve the transmission and reception of short pulses, thevariations of radiated amplitudes and phases over frequency contribute to the distor-tion of the pulse. While the amplitude variation is usually indicated by changes inthe peak gain or radiation patterns, the frequency-dependent phase variation is oftenomitted, and related data is published only sporadically, e.g., [5, 7, 17, 26]. In orderto quantify this behavior, one of two methods is usually applied.
First, in the frequency domain, the spherical wave front in the far field is detectedfor each frequency, from which the apparent phase center along the antenna surfaceor axis can be calculated. Alternatively, the phase variation in the near field over themain beam is computed for different phase center points moved from a referencepoint on the surface of the antenna. Then a valid phase center location is detected ifthe phase variation over the main beam is within a few degrees. These methods arecomplicated and time-consuming [26].
H.-J. Lam (B), Y. Lu, H. Du, P.P.M. So, and J. BornemannDepartment of Electrical and Computer Engineering, University of Victoria, Victoria, BC, CanadaV8W 3P6e-mail: [email protected], [email protected], [email protected], [email protected],[email protected]
S. Lindenmeier and R. Weigel (eds.), Electromagnetics and Network Theoryand their Microwave Technology Applications, DOI 10.1007/978-3-642-18375-1_4,c� Springer-Verlag Berlin Heidelberg 2011
51
52 H.-J. Lam et al.
Secondly, in the time domain, a transient analysis is performed which leads tothe group delay. A pulse, whose frequency spectrum covers the bandwidth of theantenna, is generated, applied at the antenna input and its radiated pulse detected.Both pulses are Fourier transformed and their phase response recorded. The groupdelay is obtained from the derivative of the phase variation with respect to angularfrequency [7].
In this paper, the Transmission-Line Matrix (TLM) method in the time domainis utilized to determine the group delay of two printed circuit UWB antennas.The first one is a recently developed, new coplanar-waveguide antenna [27], thesecond a published microstrip antenna [9,10] with so far no information about phasevariations.
4.2 Coplanar UWB Antenna
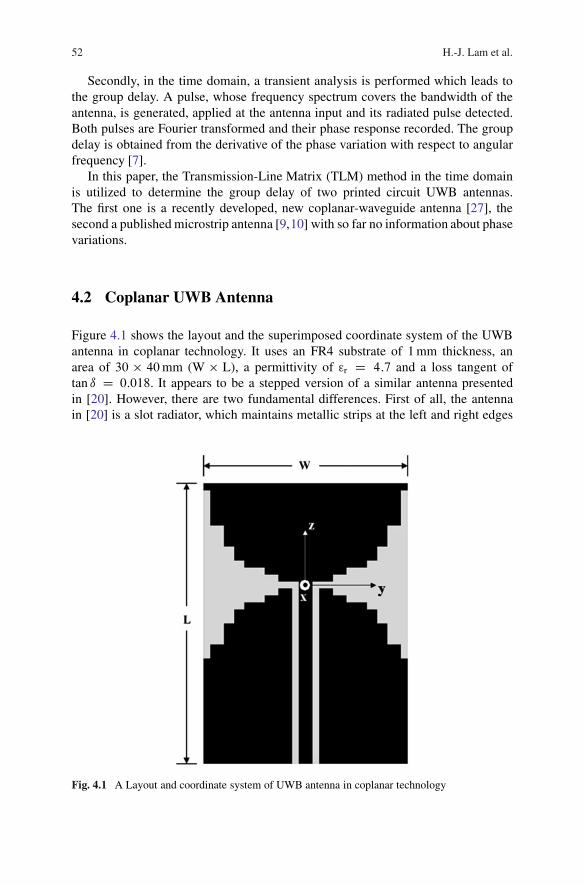
Figure 4.1 shows the layout and the superimposed coordinate system of the UWBantenna in coplanar technology. It uses an FR4 substrate of 1 mm thickness, anarea of 30 � 40 mm (W � L), a permittivity of ©r D 4:7 and a loss tangent oftan ı D 0:018. It appears to be a stepped version of a similar antenna presentedin [20]. However, there are two fundamental differences. First of all, the antennain [20] is a slot radiator, which maintains metallic strips at the left and right edges
Fig. 4.1 A Layout and coordinate system of UWB antenna in coplanar technology
4 Time-Domain Modelling of Group-Delay and Amplitude Characteristics 53
of the substrate. Such metallic strips are missing in Fig. 4.1 and thus result in asomewhat conical shape of the radiating profile – similar to a tapered slot antenna.Secondly, the stepping is chosen such that the smallest dimension is 0.5 mm. Thiscontributes to low manufacturing sensitivity. However, it also influences the charac-teristic impedance of the feeding coplanar waveguide, which is significantly higherthan the 50� coaxial line to be connected at the input. (Note that the coaxial line isalso used to physically connect the two ground planes.) As we will show later, thismismatch is not to the detriment of the antenna performance.
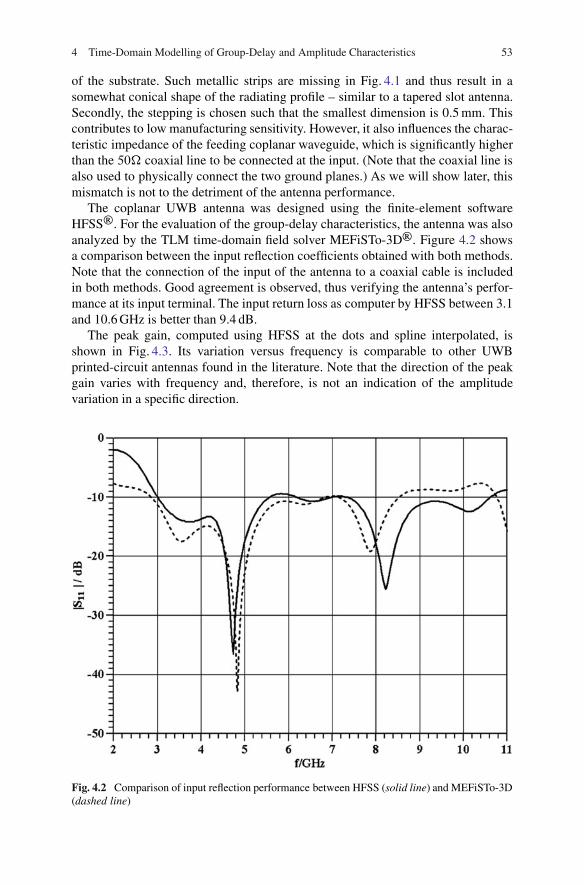
The coplanar UWB antenna was designed using the finite-element softwareHFSSr. For the evaluation of the group-delay characteristics, the antenna was alsoanalyzed by the TLM time-domain field solver MEFiSTo-3Dr. Figure 4.2 showsa comparison between the input reflection coefficients obtained with both methods.Note that the connection of the input of the antenna to a coaxial cable is includedin both methods. Good agreement is observed, thus verifying the antenna’s perfor-mance at its input terminal. The input return loss as computer by HFSS between 3.1and 10.6 GHz is better than 9.4 dB.
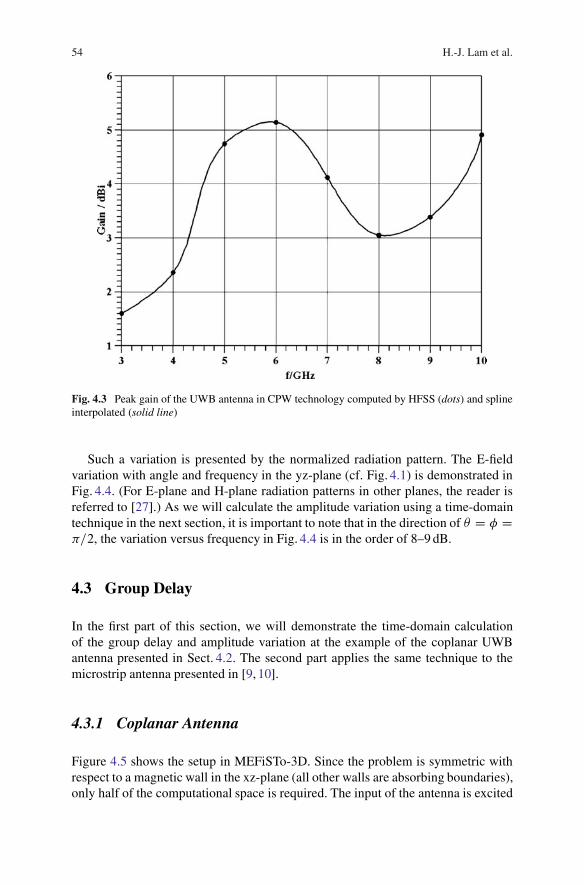
The peak gain, computed using HFSS at the dots and spline interpolated, isshown in Fig. 4.3. Its variation versus frequency is comparable to other UWBprinted-circuit antennas found in the literature. Note that the direction of the peakgain varies with frequency and, therefore, is not an indication of the amplitudevariation in a specific direction.
Fig. 4.2 Comparison of input reflection performance between HFSS (solid line) and MEFiSTo-3D(dashed line)
54 H.-J. Lam et al.
Fig. 4.3 Peak gain of the UWB antenna in CPW technology computed by HFSS (dots) and splineinterpolated (solid line)
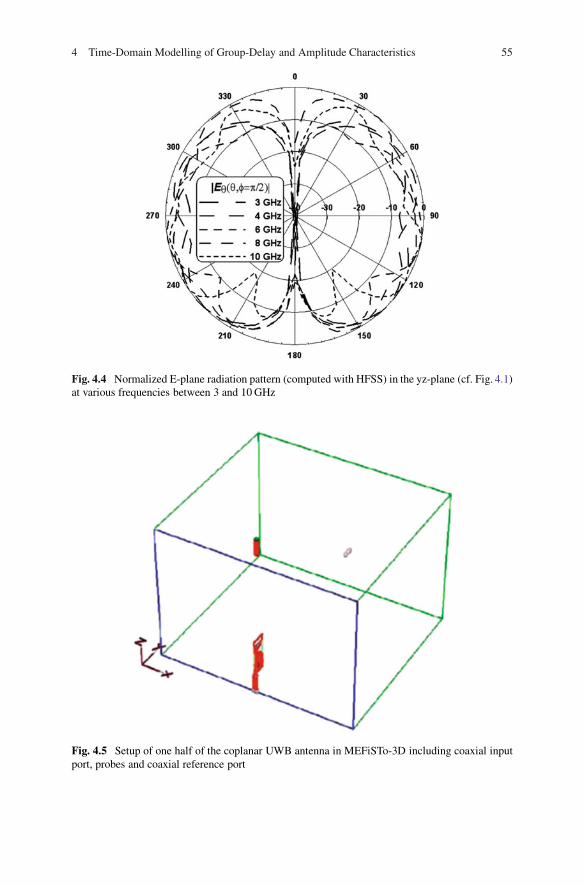
Such a variation is presented by the normalized radiation pattern. The E-fieldvariation with angle and frequency in the yz-plane (cf. Fig. 4.1) is demonstrated inFig. 4.4. (For E-plane and H-plane radiation patterns in other planes, the reader isreferred to [27].) As we will calculate the amplitude variation using a time-domaintechnique in the next section, it is important to note that in the direction of � D � D�=2, the variation versus frequency in Fig. 4.4 is in the order of 8–9 dB.
4.3 Group Delay
In the first part of this section, we will demonstrate the time-domain calculationof the group delay and amplitude variation at the example of the coplanar UWBantenna presented in Sect. 4.2. The second part applies the same technique to themicrostrip antenna presented in [9, 10].
4.3.1 Coplanar Antenna
Figure 4.5 shows the setup in MEFiSTo-3D. Since the problem is symmetric withrespect to a magnetic wall in the xz-plane (all other walls are absorbing boundaries),only half of the computational space is required. The input of the antenna is excited
4 Time-Domain Modelling of Group-Delay and Amplitude Characteristics 55
Fig. 4.4 Normalized E-plane radiation pattern (computed with HFSS) in the yz-plane (cf. Fig. 4.1)at various frequencies between 3 and 10 GHz
Fig. 4.5 Setup of one half of the coplanar UWB antenna in MEFiSTo-3D including coaxial inputport, probes and coaxial reference port
56 H.-J. Lam et al.
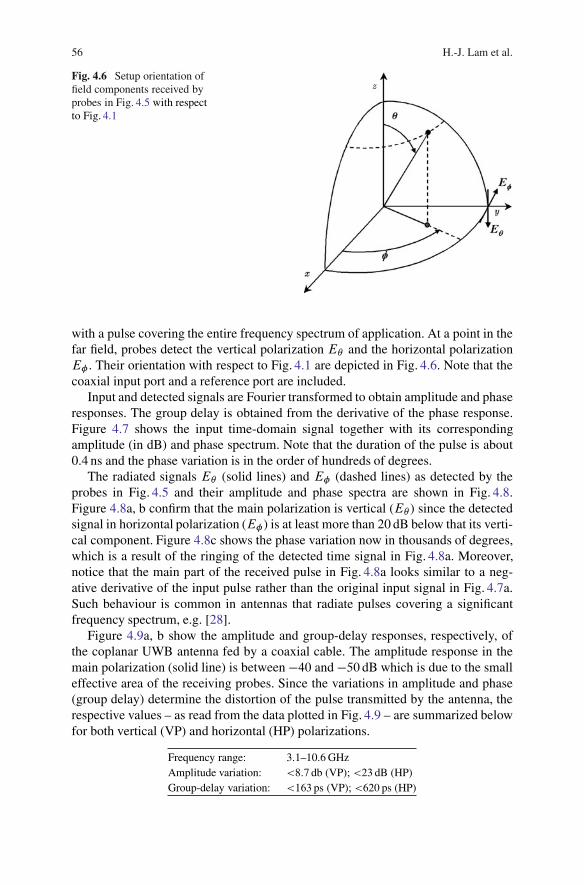
Fig. 4.6 Setup orientation offield components received byprobes in Fig. 4.5 with respectto Fig. 4.1
with a pulse covering the entire frequency spectrum of application. At a point in thefar field, probes detect the vertical polarization E� and the horizontal polarizationE� . Their orientation with respect to Fig. 4.1 are depicted in Fig. 4.6. Note that thecoaxial input port and a reference port are included.
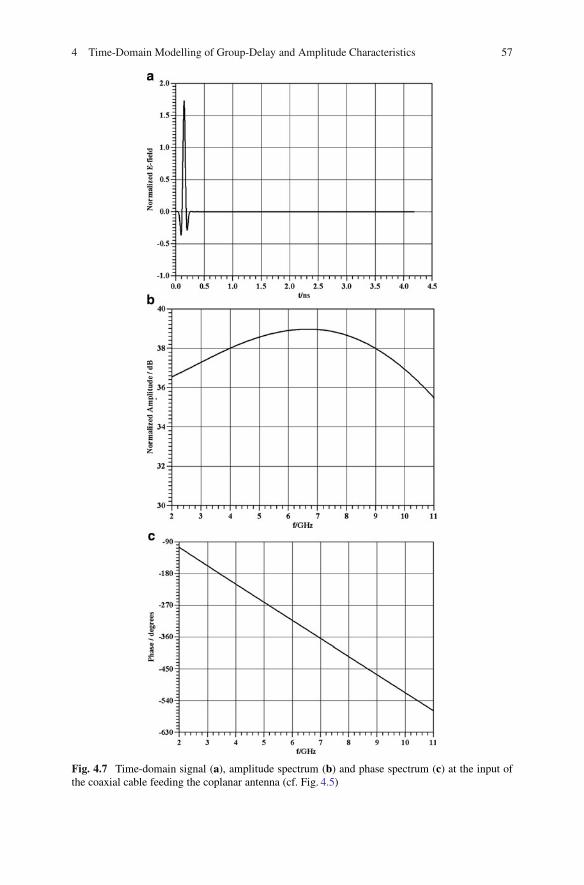
Input and detected signals are Fourier transformed to obtain amplitude and phaseresponses. The group delay is obtained from the derivative of the phase response.Figure 4.7 shows the input time-domain signal together with its correspondingamplitude (in dB) and phase spectrum. Note that the duration of the pulse is about0.4 ns and the phase variation is in the order of hundreds of degrees.
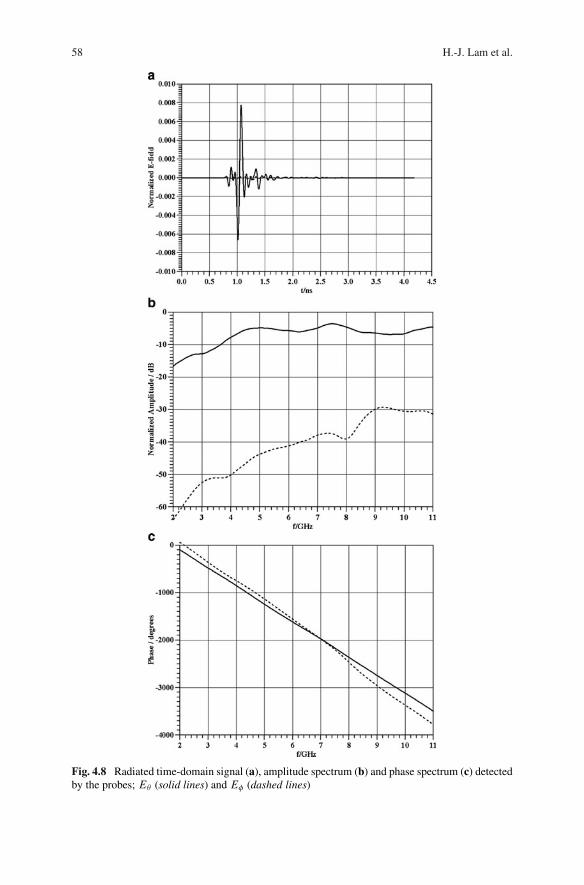
The radiated signals E� (solid lines) and E� (dashed lines) as detected by theprobes in Fig. 4.5 and their amplitude and phase spectra are shown in Fig. 4.8.Figure 4.8a, b confirm that the main polarization is vertical (E� ) since the detectedsignal in horizontal polarization (E�) is at least more than 20 dB below that its verti-cal component. Figure 4.8c shows the phase variation now in thousands of degrees,which is a result of the ringing of the detected time signal in Fig. 4.8a. Moreover,notice that the main part of the received pulse in Fig. 4.8a looks similar to a neg-ative derivative of the input pulse rather than the original input signal in Fig. 4.7a.Such behaviour is common in antennas that radiate pulses covering a significantfrequency spectrum, e.g. [28].
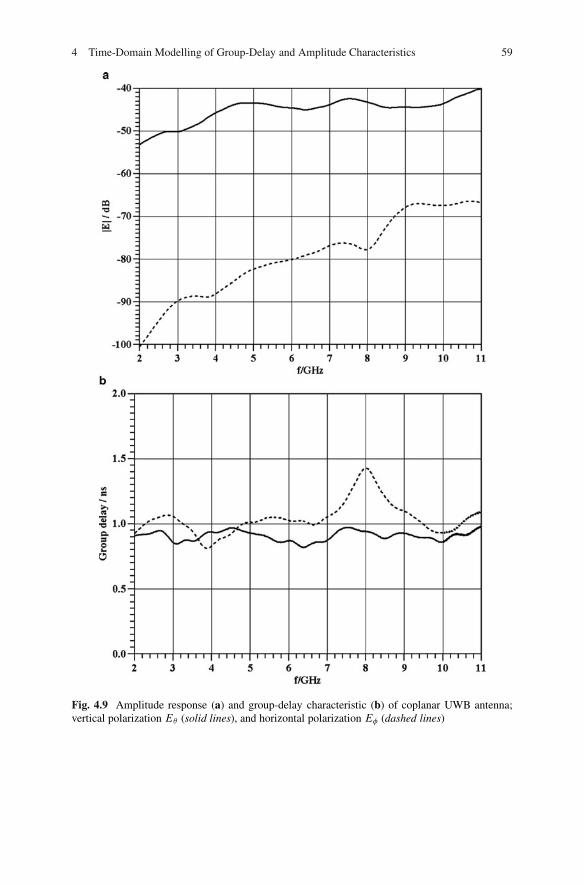
Figure 4.9a, b show the amplitude and group-delay responses, respectively, ofthe coplanar UWB antenna fed by a coaxial cable. The amplitude response in themain polarization (solid line) is between �40 and �50 dB which is due to the smalleffective area of the receiving probes. Since the variations in amplitude and phase(group delay) determine the distortion of the pulse transmitted by the antenna, therespective values – as read from the data plotted in Fig. 4.9 – are summarized belowfor both vertical (VP) and horizontal (HP) polarizations.
Frequency range: 3.1–10.6 GHzAmplitude variation: <8:7 db (VP); <23 dB (HP)Group-delay variation: <163 ps (VP); <620 ps (HP)
4 Time-Domain Modelling of Group-Delay and Amplitude Characteristics 57
Fig. 4.7 Time-domain signal (a), amplitude spectrum (b) and phase spectrum (c) at the input ofthe coaxial cable feeding the coplanar antenna (cf. Fig. 4.5)
58 H.-J. Lam et al.
Fig. 4.8 Radiated time-domain signal (a), amplitude spectrum (b) and phase spectrum (c) detectedby the probes; E� (solid lines) and E� (dashed lines)
4 Time-Domain Modelling of Group-Delay and Amplitude Characteristics 59
Fig. 4.9 Amplitude response (a) and group-delay characteristic (b) of coplanar UWB antenna;vertical polarization E� (solid lines), and horizontal polarization E� (dashed lines)
60 H.-J. Lam et al.
Note that the amplitude variation of 8.7 dB in vertical polarization (E� ) is invery good agreement with the radiation patterns displayed in Fig. 4.4 for individualfrequencies between 3 and 10 GHz. Since Fig. 4.9 was obtained from data computedby the time-domain solver MEFiSTo-3D and Fig. 4.4 from that of the frequency-domain package HFSS, this agreement (together with Fig. 4.2) verifies the designand performance of the coplanar UWB antenna.
4.3.2 Microstrip Antenna
In order to compare the results obtained for the coplanar UWB antenna with thoseof a different antenna, we apply the above time-domain method to the microstripUWB antenna presented in [9, 10].
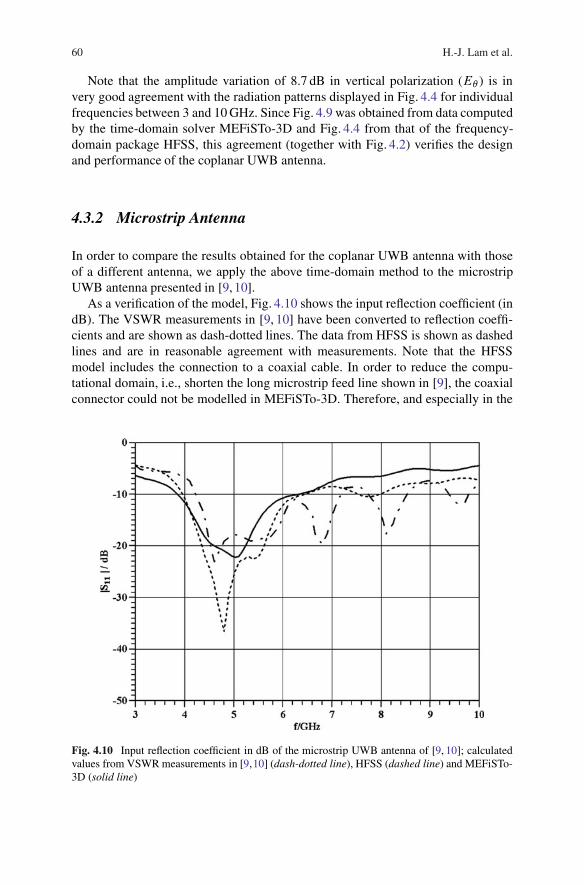
As a verification of the model, Fig. 4.10 shows the input reflection coefficient (indB). The VSWR measurements in [9, 10] have been converted to reflection coeffi-cients and are shown as dash-dotted lines. The data from HFSS is shown as dashedlines and are in reasonable agreement with measurements. Note that the HFSSmodel includes the connection to a coaxial cable. In order to reduce the compu-tational domain, i.e., shorten the long microstrip feed line shown in [9], the coaxialconnector could not be modelled in MEFiSTo-3D. Therefore, and especially in the
Fig. 4.10 Input reflection coefficient in dB of the microstrip UWB antenna of [9, 10]; calculatedvalues from VSWR measurements in [9,10] (dash-dotted line), HFSS (dashed line) and MEFiSTo-3D (solid line)
4 Time-Domain Modelling of Group-Delay and Amplitude Characteristics 61
higher frequency range, the agreement between measurements and iMEFiSTo-3D isnot as good as that with HFSS. However, the basic shape and the reasonably smalldiscrepancies validate the numerical computations.
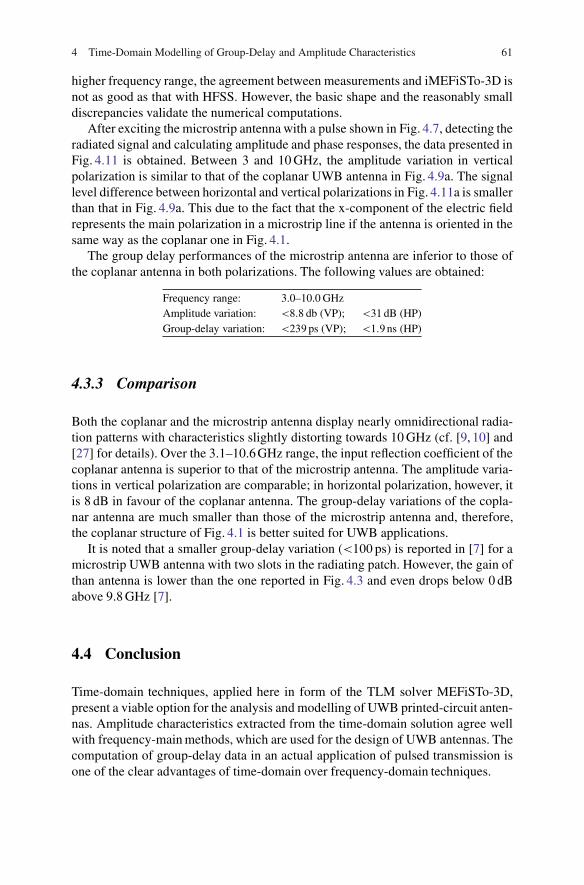
After exciting the microstrip antenna with a pulse shown in Fig. 4.7, detecting theradiated signal and calculating amplitude and phase responses, the data presented inFig. 4.11 is obtained. Between 3 and 10 GHz, the amplitude variation in verticalpolarization is similar to that of the coplanar UWB antenna in Fig. 4.9a. The signallevel difference between horizontal and vertical polarizations in Fig. 4.11a is smallerthan that in Fig. 4.9a. This due to the fact that the x-component of the electric fieldrepresents the main polarization in a microstrip line if the antenna is oriented in thesame way as the coplanar one in Fig. 4.1.
The group delay performances of the microstrip antenna are inferior to those ofthe coplanar antenna in both polarizations. The following values are obtained:
Frequency range: 3.0–10.0 GHzAmplitude variation: <8:8 db (VP); <31 dB (HP)Group-delay variation: <239 ps (VP); <1:9 ns (HP)
4.3.3 Comparison
Both the coplanar and the microstrip antenna display nearly omnidirectional radia-tion patterns with characteristics slightly distorting towards 10 GHz (cf. [9, 10] and[27] for details). Over the 3.1–10.6 GHz range, the input reflection coefficient of thecoplanar antenna is superior to that of the microstrip antenna. The amplitude varia-tions in vertical polarization are comparable; in horizontal polarization, however, itis 8 dB in favour of the coplanar antenna. The group-delay variations of the copla-nar antenna are much smaller than those of the microstrip antenna and, therefore,the coplanar structure of Fig. 4.1 is better suited for UWB applications.
It is noted that a smaller group-delay variation (<100 ps) is reported in [7] for amicrostrip UWB antenna with two slots in the radiating patch. However, the gain ofthan antenna is lower than the one reported in Fig. 4.3 and even drops below 0 dBabove 9.8 GHz [7].
4.4 Conclusion
Time-domain techniques, applied here in form of the TLM solver MEFiSTo-3D,present a viable option for the analysis and modelling of UWB printed-circuit anten-nas. Amplitude characteristics extracted from the time-domain solution agree wellwith frequency-main methods, which are used for the design of UWB antennas. Thecomputation of group-delay data in an actual application of pulsed transmission isone of the clear advantages of time-domain over frequency-domain techniques.
62 H.-J. Lam et al.
Fig. 4.11 Amplitude response (a) and group-delay characteristic (b) of the microstrip UWBantenna in [9, 10]; vertical polarization E� (solid lines), and horizontal polarization E� (dashedlines)
4 Time-Domain Modelling of Group-Delay and Amplitude Characteristics 63
The time-domain modelling procedure presented here is applied to two differentprinted-circuit UWB antennas, and agreement with frequency-domain computationsand measurements is demonstrated.
Acknowledgements The authors gratefully acknowledge financial support for this project throughthe TELUS Research Grant in Wireless Communications.
References
1. L. Yang, G.B. Giannakis, Ultra-wideband communications: An idea whose time has come.IEEE Signal Proc. Mag. 21, 26–54 (2004)
2. International Telecommunication Union, Radiocommunication Study Groups, Framework forthe introduction of devices using ultra-wideband technology. Document 1/85(Rev.1)-E, 09Nov 2005
3. K. Kiminami, A. Hirata, T. Shiozawa, Double-sided printed bow-tie antenna for UWBcommunications. IEEE Antennas Wireless Propag. Lett. 3, 152–153 (2004)
4. J. Liang, C.C. Chiau, X. Chen, C.G. Parini, Printed circular disc monopole antenna for ultra-wideband applications. IEE Electron. Lett. 40(20), 1246–1247 (2004)
5. S.H. Choi, J.K. Park, S.K. Kim, J.Y. Park, A new ultra-wideband antenna for UWB applica-tions. Microw. Opt. Technol. Lett. 40(5), 399–401 (2004)
6. J. Liang, C.C. Chiau, X. Chen, C.G. Parini, Study of a printed circular disc monopole antennafor UWB systems. IEEE Trans. Antennas Propag. 53, 3500–3504 (2005)
7. Z.N. Low, J.H. Cheong, C.L. Law, Low-cost PCB antenna for UWB applications. IEEEAntennas Wireless Propag. Lett. 4, 237–239 (2005)
8. J. Liang, C.C. Chiau, X. Chen, C.G. Parini, Printed circular ring monopole antennas. Microw.Opt. Technol. Lett. 45(5), 372–375 (2005)
9. C.-C. Lin, Y.-C. Kan, L.-C. Kuo, H.-R. Chuang, A planar triangular monopole antenna forUWB communication. IEEE Microw. Wireless Comput. Lett. 15, 624–626 (2005)
10. H.R. Chuang, C.C. Lin, Y.C. Kan, A printed UWB triangular monopole antenna. Microw. J.49, 108–120 (2006)
11. N. Fortino, G. Kossiavas, J.Y. Dauvignac, R. Staraj, Novel antennas for ultrawidebandcommunications. Microw. Opt. Technol. Lett. 41(3), 166–169 (2004)
12. W. Wang, S.S. Zhong, S.-B. Chen, A novel wideband coplanar-fed monopole antenna. Microw.Opt. Technol. Lett. 43(1), 50–52 (2004)
13. A.M. Abbosh, M.E. Bialkowski, M.V. Jacob, J. Mazierska, Investigations into an LTCC basedultra wideband antenna. in Proceedings Asia-Pacific Microwave Conference, Suzhou, China,Dec 2005. 4 p.
14. C.T.H. Lim, A GCPW-fed printed antenna for UWB applications. in Proceedings Asia-PacificMicrowave Conference, Suzhou, China, Dec. 2005, 3 p.
15. X. Chen, J. Liang, P. Li, L. Guo, C.C. Chiau, C.G. Parini, Planar UWB monopole antennas. inProceedings Asia-Pacific Microwave Conference, Suzhou, China, Dec 2005, 4 p.
16. H.K. Lee, J.K. Park, J.N. Lee, Design of a planar half-circle shaped UWB notch antenna.Microw. Opt. Technol. Lett. 47(1), 9–11 (2005)
17. T.-G. Ma, C.-H. Tseng, An ultrawideband coplanar waveguide-fed tapered ring slot antenna.IEEE Trans. Antennas Propag. 54, 1105–1110 (2006)
18. Y.-C. Lee, S.-C. Lin, J.-S. Sun, CPW-fed UWB slot antenna. in Proceedings Asia-PacificMicrowave Conference, Yokohama, Japan, Dec. 2006, 4 p.
19. S. Nikolaou, D.E. Anagnostou, G.E. Ponchak, M.M. Tentzeris, J. Papapolymerou, Compactultra wide-band (UWB) CPW-fed elliptical monopole on liquid crystal polymer (LCP). in IEEEAP-S International Symposium Digest, Albuquerque, USA, July 2006, pp. 4657–4660
64 H.-J. Lam et al.
20. E.S. Angelopoulos, A.Z. Anastopoulos, D.I. Kaklamani, Ultra-wideband bow-tie slot antennafed by a cpw-to-cpw transition loaded with inductively coupled slots. Microw. Opt. Technol.Lett. 48(9), 1816–1820 (2006)
21. X.-L. Liang, S.-S. Zhong, W. Wang, UWB printed circular monopole antenna. Microw. Opt.Technol. Lett. 48(8), 1532–1534 (2006)
22. J.-S. Sun, Y.-C. Lee, S.-C. Lin, New design of a CPW-fed ultrawideband slot antenna. Microw.Opt. Technol. Lett. 49(3), 561–564 (2007)
23. D.-B. Lin, I.-T. Tang, M.-Y. Tsou, A compact UWB antenna with CPW-feed. Microw. Opt.Technol. Lett. 49(3), 564–567 (2007)
24. Z.N. Chen, X. Qing, Research and development of planar UWB antennas. Suzhou, China,Dec 2005
25. B.L. Ooi, G. Zhao, M.S. Leong, K.M. Chua, C.W.L. Albert, Wideband LTCC CPW-fed two-layered monopole antenna. IEE Electron. Lett. 41(16), 9–10 (2005)
26. K. Rambabu, H.A. Thiart, J. Bornemann, S.Y. Yu, Ultrawideband printed-circuit antenna. IEEETrans. Antennas Propag. 54, 3908–3911 (2006)
27. H.-J. Lam, J. Bornemann, Ultra-wideband printed-circuit antenna in coplanar technology.in 2007 IEEE EMC-S International Symposium Digest, TU-PM-1–7, Honolulu, USA, July2007. 4 p.
28. D. Ghosh, A. De, M.C. Taylor, T.K. Sarkar, M.C. Wicks, E.L. Mokole, Transmission andreception by ultra-wideband (UWB) antennas. IEEE Trans. Antennas Propag. Mag. 48,67–99 (2006)