Embed Size (px)
Citation preview
4-1 Revision 0October 2015
Fermi 3Updated Final Safety Analysis Report
Chapter 4 Reactor
4.1 Summary DescriptionThe reactor assembly consists of the reactor pressure vessel (RPV), pressure-containingappurtenances including Control Rod Drive (CRD) housings and in-core instrumentation housings.The reactor internal components are described in Subsection 4.1.2, Reactor Internal Components.Figure 5.3-3 (Reactor Pressure Vessel System Key Features) shows the arrangement of thereactor assembly components. A summary of the important design and performance characteristicsof the reactor and plant is given in Table 1.3-1. Loading conditions for reactor assemblycomponents are specified within Subsection 3.9.5.
Section 4.3 presents the fuel and control rod design and core loading pattern that is adapted for theESBWR and is used as the basis for the system response studies in Section 5.2, Section 6.3 andChapter 15.
4.1.1 Reactor Pressure VesselThe reactor pressure vessel includes the shroud support. Flow restrictors are included in the steamoutlet nozzles and the Gravity-Driven Cooling System (GDCS) equalizing line nozzles. The reactorpressure vessel design and description are covered in Section 5.3.
4.1.2 Reactor Internal ComponentsThe major reactor internal components described within Subsection 3.9.5 include:
• Core support structures (shroud, shroud support, top guide, core plate, control rod guide tubes and fuel supports).
• Chimney and partitions.
• Chimney head and steam separator assembly.
• Steam dryer assembly.
• Feedwater spargers.
• Standby liquid control header, sparger and piping assembly.
• In-core guide tubes.
Except for the Zircaloy in the reactor core, these reactor internals are stress corrosion-resistantstainless steels or other high alloy steels. The fuel assemblies (including fuel rods and channels),control rods, chimney head and steam separator assembly, chimney partition assembly, steamdryers and in-core instrumentation assemblies are removable when the reactor vessel is opened forrefueling or maintenance.
4.1.2.1 Reactor CoreImportant features of the reactor core are:
4-2 Revision 0October 2015
Fermi 3Updated Final Safety Analysis Report
• The control rods are bottom-entry, cruciform shaped. Rods of this design were first introduced in the Dresden-1 reactor in April 1961 and have accumulated thousands of hours of service in Boiling Water Reactors (BWRs) around the world.
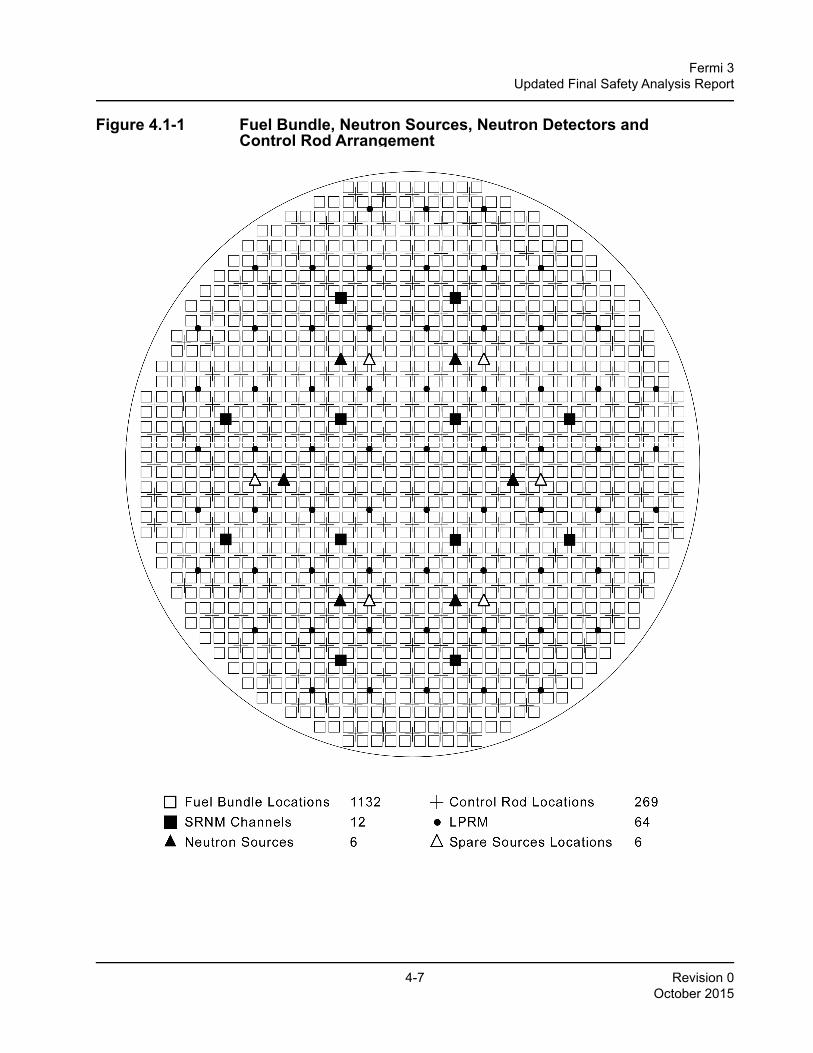
• Local Power Range Monitors (LPRMs) are in-core fission chambers that are assembled and fixed inside enclosing tubes located in the core. These instrument assemblies provide signals for continuous local power range neutron flux monitoring. Fixed in-core gamma detectors, called Automated Fixed In-Core Probe (AFIP) sensors, are also installed to provide axial local power information for LPRM calibration and core power calculation. The AFIP sensors are installed within the LPRM assembly with one sensor next to each LPRM detector. Startup Range Neutron Monitors (SRNMs) are provided for monitoring core neutron flux at low power conditions. The SRNM sensors are fixed inside tubes that are located as shown in Figure 4.1-1. The LPRM cover tubes contain holes for the reactor coolant flow, whereas the SRNM tubes are pressure barrier dry tubes. All in-core instrument leads enter from the vessel bottom; this allows instrument assemblies to remain undisturbed in service through refueling. More information on in-core instrumentation is presented in Subsection 7.2.2. The instrument tubes are protected from water flow by in-core guide tubes in the bottom head plenum (Subsection 3.9.5).
• As shown by experience obtained at Dresden-1 and other BWR plants that utilize the in-core flux monitor system, the desired power distribution can be maintained within a large core by proper control rod scheduling.
• The fuel channels provide a flow path for the boiling coolant, serve as a guiding surface for the control rods, and protect the fuel during handling operations.
• The mechanical reactivity control permits criticality checks during refueling and provides maximum plant safety. The core is designed to be subcritical at any time in its operating history with any single control rod, or rod pair, fully withdrawn and the other control rods fully inserted.
• The selected control rod pitch represents a practical value of individual control rod reactivity worth, and allows adequate clearance below the pressure vessel between CRD mechanisms for ease of maintenance and removal.
• The reactor core is arranged as an upright circular cylinder containing a large number of fuel cells and is located within the core shroud inside the reactor vessel.
4.1.2.1.1 Fuel Assembly DescriptionThe fuel assembly description is provided in Section 4.2.
4.1.2.1.2 Fuel Assembly Support and Control Rod LocationA few peripheral fuel assemblies that are not adjacent to a control rod are supported by the coreplate via single-assembly fuel supports. Otherwise, individual fuel assemblies in groups of four reston orificed fuel supports that are mounted on top of the control rod guide tubes. Each guide tube,with its orificed fuel support, bears the weight of four assemblies and is supported on a CRD
4-3 Revision 0October 2015
Fermi 3Updated Final Safety Analysis Report
penetration nozzle in the bottom head of the reactor vessel. The core plate provides lateral supportand guidance at the top of each control rod guide tube and directs most of the reactor coolant flowinto the fuel supports and the fuel assemblies. The top guide, mounted on top of the shroud,provides lateral support and guidance for the top of each fuel assembly.
The reactivity of the core is controlled by cruciform control rods and their associatedelectro-mechanical/hydraulic drive system (Section 4.6). The control rods occupy the cruciformspace created by four fuel cells. Each independent CRD inserts a control rod into the core from thebottom, and accurately positions its associated control rod during normal operation with an electricmotor-driven ball screw. Hydraulic pressure is applied on the hollow cylinder of a CRD to exertseveral times the force of gravity on the control rod for insertion during the scram mode of CRDoperation. Bottom entry allows optimum power shaping in the core, ease of refueling andconvenient drive maintenance.
4.1.2.1.3 Other InternalsInformation on other major reactor internal components identified in Subsection 4.1.2 is presentedin Subsection 3.9.5.
4.1.3 Reactivity Control Systems
4.1.3.1 OperationThe control rods perform dual functions of power distribution shaping and reactivity control. Powerdistribution in the core is controlled during operation of the reactor by manipulation of selectedpatterns of rods (Appendix 4A). These rods are positioned to counterbalance steam voids in the topof the core and effect significant power flattening. These groups of control elements, used for powerflattening, experience a somewhat higher duty cycle and neutron exposure than the other rods inthe control system.
The reactivity control function requires that all rods be available for either reactor “scram” (promptshutdown) or reactivity control. Because of this, the control elements are mechanically designed towithstand the dynamic forces resulting from a scram. They are connected to bottom-mounted,electro-hydraulically actuated drive mechanisms that allow either electric motor controlled axialpositioning for reactivity regulation or hydraulic scram insertion. The design of the rod-to-driveconnection permits each rod to be attached or detached from its drive without disturbing theremainder of the control system. The bottom-mounted drives permit the entire control system to beleft intact and remain operable for tests with the reactor vessel open.
4.1.3.2 Description of Control RodsA description of the control rods is presented in Section 4.2 with a description of the CRD system inSection 4.6.
4-4 Revision 0October 2015
Fermi 3Updated Final Safety Analysis Report
4.1.3.3 Supplementary Reactivity ControlThe core control requirements are met by use of the combined effects of the movable control rods,supplementary burnable poison, and the reactor coolant natural flow. A description of thesupplementary burnable poison is presented in Sections 4.2 and 4.3.
4.1.4 Analysis Techniques
4.1.4.1 Reactor Internal ComponentsComputer codes used for the analysis of the internal components are as follows:
• SAP4G07
• ANSYS
• SEISM03
4.1.4.1.1 SAP4G07SAP4G07 is a general-purpose finite element computer program used to perform stress, dynamic,and seismic analyses of structural, mechanical and piping components. Dynamic analysis can bedone using direct integration or mode superposition. Response spectrum analysis (a modesuperposition method) can include multiple support excitation. SAP4G07 is a GE Hitachi NuclearEnergy (GEH) in-house program based on similar programs developed by Professors E. L. Wilsonand K. J. Bathe at University of California, Berkeley.
4.1.4.1.2 ANSYSANSYS is a general-purpose finite element computer program designed to solve a variety ofproblems in engineering analysis. The ANSYS program features the following capabilities:
• Structural analysis, including static elastic, plastic and creep, dynamic, seismic and dynamic plastic, and large deflection and stability analyses.
• One-dimensional fluid flow analysis.
• Transient heat transfer analyses, including conduction, convection, and radiation with direct input to thermal-stress analyses.
• An extensive finite element library, including gaps, friction interfaces, springs, cables (tension only), direct interfaces (compression only), curved elbows, etc. Many of the elements contain complete plastic, creep, and swelling capabilities.
• Plotting - Geometry plotting is available for all elements in the ANSYS library, including isometric and perspective views of three-dimensional structures.
• Restart Capability - The ANSYS program has restart capability for several analysis types. An option is also available for saving the stiffness matrix once it is calculated for the structure, and using it for other loading conditions.
4-5 Revision 0October 2015
Fermi 3Updated Final Safety Analysis Report
ANSYS is used extensively in GEH for elastic and elastic-plastic analyses of the reactor pressurevessel, core support structures, reactor internals, fuel and fuel channel.
4.1.4.1.3 SEISM03SEISM03 is a GEH proprietary computer program for non-linear dynamic analysis. It is based onthe component element method developed by S. Levy and J.P. Wilkinson of General ElectricCorporate Research & Development. The method uses basic mass, spring, damper, gap, andcoupling elements in a direct integration approach to solve non-linear dynamic analysis. Thisdynamic analysis engineering computer program (ECP) is used in conjunction with the following:
• SEPRE: This ECP is a preprocessor for SEISM. It takes the output from CRTFI and phases the input time histories of all loads with the basic load time histories. SEPRE also converts all input loads to the format required for input to SEISM.
• SEPST: This ECP is the SEISM post-processor. SEPST condenses the SEISM output data into a form that is more practical to interpret. It determines and prints the initial values, the maximum and minimum values for all components, and the times of their occurrence. In addition, it generates the response time history plots of selected components.
• CRTFI: This ECP uses, as input, the scaled or composite horizontal acceleration time histories at the mid-fuel and end-fuel positions to determine (1) the clamping forces to be applied to the analysis model friction elements, (2) the scram uplift forces on a bundle, (3) inertial forces of the fuel in order to obtain reaction forces on both ends of the fuel, and (4) fuel-center deflection and uplift forces due to scram.
4.1.4.2 Fuel Design AnalysisThe fuel design analysis is discussed in Section 4.2.
4.1.4.3 Reactor Systems DynamicsThe analysis techniques and computer codes used in reactor systems dynamics are based onthose approved or developed using Nuclear Regulatory Commission (NRC) approved criteria.
4.1.4.4 Nuclear AnalysisThe analysis techniques are discussed in Section 4.3.
4.1.4.5 Neutron Fluence CalculationsNeutron vessel fluence calculations were carried out using a two-dimensional, discrete ordinates,Sn transport code with general anisotropic scattering.
The DORT code is the most widely used two-dimensional, discrete ordinates code that solves awide variety of radiation transport problems. The program solves both fixed source andmultiplication problems. Rectangular (X, Y), cylindrical (R, Z), or polar (R, θ) geometry is allowedwith various boundary conditions. The fluence calculations incorporate, as an initial starting point,
4-6 Revision 0October 2015
Fermi 3Updated Final Safety Analysis Report
neutron fission distributions prepared from core physics data as a distributed source. Anisotropicscattering is considered for all regions. The cross sections are prepared with 1/E flux weightingusing polynomial expansion matrices for anisotropic scattering. Resonance self-shieldingcomputation is included in the preparation of a working cross section library (Section 12.3).
4.1.4.6 Thermal-Hydraulic CalculationsThe thermal-hydraulic models are discussed in Section 4.4.
4.1.5 COL InformationNone.
4.1.6 ReferencesNone.
4-7 Revision 0October 2015
Fermi 3Updated Final Safety Analysis Report
Figure 4.1-1 Fuel Bundle, Neutron Sources, Neutron Detectors and Control Rod ArrangementESBWR Design Control Document/Tier 2

4-8 Revision 0October 2015
Fermi 3Updated Final Safety Analysis Report
4.2 Fuel System DesignThe fuel system is defined as consisting of the fuel assembly and the reactivity control assembly(control rod). The fuel assembly is comprised of the fuel bundle, channel and channel fastener. Thefuel bundle is comprised of fuel rods (some of which may contain burnable neutron absorbers),water rods, spacers, springs and assembly fittings. Design criteria for ESBWR fuel are shown inAppendix 4B. A reference core, based upon a current NRC-approved GE14 fuel design andmodified to account for the shorter active fuel length, is used to demonstrate the ESBWR systemresponse. The latest GE14 information is provided in the most recent revision of the GE FuelBundle Designs Report and its supplements (Reference 4.2-1).
This section also addresses the reactivity control elements (control rods) that extend from thecoupling interface of the control rod drive mechanism (per Regulatory Guide 1.70). The functionaldesign of the reactivity control system is detailed in Section 4.6. Design criteria for ESBWR controlrods are shown in Appendix 4C.
The following subsection provides the fuel system design bases and design limits. It is consistentwith the criteria of the NRC Standard Review Plan Section 4.2.
4.2.1 Design Bases
4.2.1.1 Fuel AssemblyThe fuel assembly (comprised of the fuel bundle, channel and channel fastener) is designed incompliance with requirements of 10 CFR 20, 10 CFR 50 and 10 CFR 100 to ensure that fueldamage does not result in the release of radioactive materials in excess of prescribed limits, andthat fuel assembly coolability is maintained during postulated accidents. The core nuclear andhydraulic characteristics, plant equipment characteristics, and instrumentation and protectionsystems are evaluated to assure that those requirements are met.
The thermal-mechanical design process emphasizes that:
• The fuel assembly provides substantial fission products retention capability during all potential operational modes.
• The fuel assembly provides sufficient structural integrity to prevent operational impairment of any reactor safety equipment.
The fuel assembly and its components are designed to withstand:
• The predicted thermal, pressure and mechanical interaction loadings occurring during startup testing, normal operation, anticipated operational occurrences (AOOs), infrequent events and accidents.
• Loading predicted to occur during handling.
Steady-state operating limits are established to ensure that actual fuel operation, including AOOs, ismaintained within the fuel rod thermal-mechanical design bases. These operating limits define the
4-9 Revision 0October 2015
Fermi 3Updated Final Safety Analysis Report
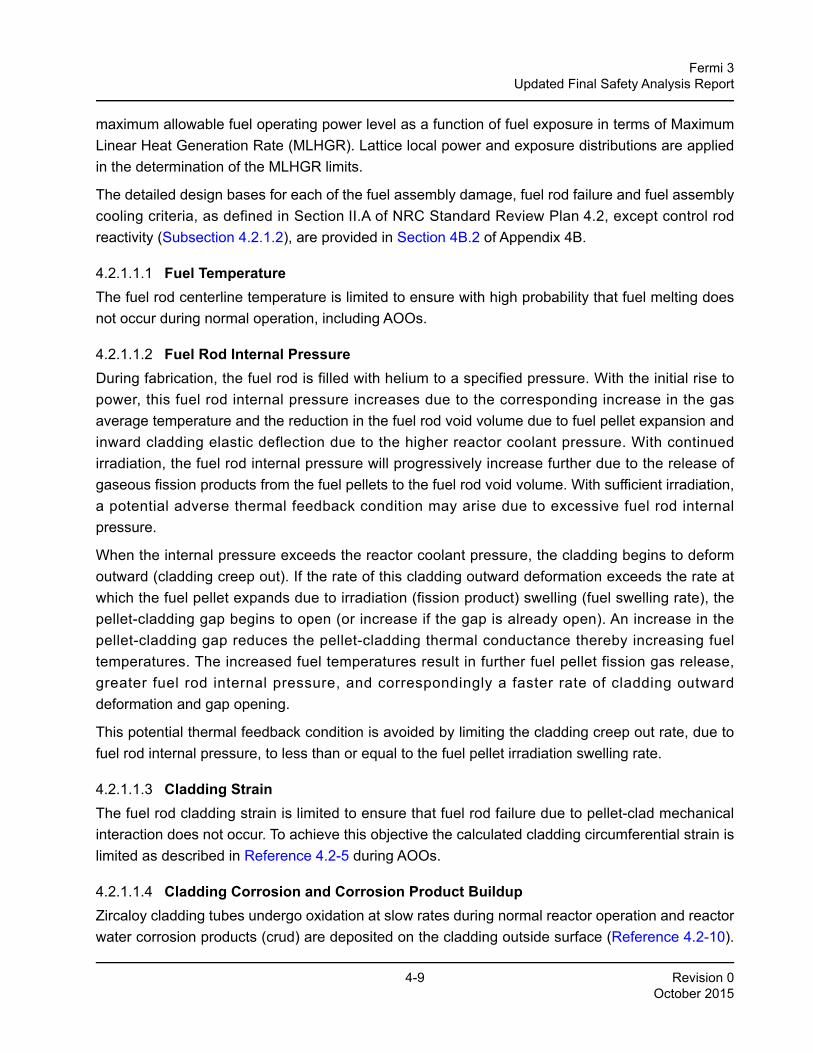
maximum allowable fuel operating power level as a function of fuel exposure in terms of MaximumLinear Heat Generation Rate (MLHGR). Lattice local power and exposure distributions are appliedin the determination of the MLHGR limits.
The detailed design bases for each of the fuel assembly damage, fuel rod failure and fuel assemblycooling criteria, as defined in Section II.A of NRC Standard Review Plan 4.2, except control rodreactivity (Subsection 4.2.1.2), are provided in Section 4B.2 of Appendix 4B.
4.2.1.1.1 Fuel TemperatureThe fuel rod centerline temperature is limited to ensure with high probability that fuel melting doesnot occur during normal operation, including AOOs.
4.2.1.1.2 Fuel Rod Internal PressureDuring fabrication, the fuel rod is filled with helium to a specified pressure. With the initial rise topower, this fuel rod internal pressure increases due to the corresponding increase in the gasaverage temperature and the reduction in the fuel rod void volume due to fuel pellet expansion andinward cladding elastic deflection due to the higher reactor coolant pressure. With continuedirradiation, the fuel rod internal pressure will progressively increase further due to the release ofgaseous fission products from the fuel pellets to the fuel rod void volume. With sufficient irradiation,a potential adverse thermal feedback condition may arise due to excessive fuel rod internalpressure.
When the internal pressure exceeds the reactor coolant pressure, the cladding begins to deformoutward (cladding creep out). If the rate of this cladding outward deformation exceeds the rate atwhich the fuel pellet expands due to irradiation (fission product) swelling (fuel swelling rate), thepellet-cladding gap begins to open (or increase if the gap is already open). An increase in thepellet-cladding gap reduces the pellet-cladding thermal conductance thereby increasing fueltemperatures. The increased fuel temperatures result in further fuel pellet fission gas release,greater fuel rod internal pressure, and correspondingly a faster rate of cladding outwarddeformation and gap opening.
This potential thermal feedback condition is avoided by limiting the cladding creep out rate, due tofuel rod internal pressure, to less than or equal to the fuel pellet irradiation swelling rate.
4.2.1.1.3 Cladding StrainThe fuel rod cladding strain is limited to ensure that fuel rod failure due to pellet-clad mechanicalinteraction does not occur. To achieve this objective the calculated cladding circumferential strain islimited as described in Reference 4.2-5 during AOOs.
4.2.1.1.4 Cladding Corrosion and Corrosion Product BuildupZircaloy cladding tubes undergo oxidation at slow rates during normal reactor operation and reactorwater corrosion products (crud) are deposited on the cladding outside surface (Reference 4.2-10).
4-10 Revision 0October 2015
Fermi 3Updated Final Safety Analysis Report
The cladding oxidation causes thinning of the cladding tube wall and introduces a resistance to thefuel rod-to-coolant heat transfer. Crud buildup can also introduce a resistance to heat transfer. Theexpected extent of the oxidation and the buildup of the corrosion products is specifically consideredin the fuel rod design analyses. Thus the impacts of the temperature increase, the correspondinglyaltered material properties and the thinning of the cladding wall resulting from cladding corrosion onfuel rod behavior relative to impacted design criteria (such as fuel temperature and cladding strain)are explicitly addressed. The design limit on cladding oxide thickness is specified in Reference4.2-5.
4.2.1.1.5 Fuel Rod Hydrogen AbsorptionThere are two considerations relative to fuel rod hydrogen absorption. The first considerationinvolves the potential for hydrogenous impurity evolution, historically from the fuel pellets, resultingin primary hydriding and fuel rod failure. This consideration is addressed by the application of aspecification limit on the as-fabricated fuel pellets. The absence of primary-hydriding induced fuelrod failures demonstrates the effectiveness of this limit since its first application in 1972. Thesecond consideration is the partial absorption by the fuel rod cladding of hydrogen liberated by thecladding waterside corrosion reaction. Mechanical properties testing demonstrates that thecladding mechanical properties can be affected by significant presence of hydrides. The effect ofhydrogen on cladding ductility is taken into account in the fuel cladding strain limit. Based onavailable mechanical properties test data of the irradiated cladding, a design basis hydrogen limit isspecified in Reference 4.2-5.
4.2.1.1.6 Cladding Creep CollapseThe fuel rod is evaluated to ensure that fuel rod failure due to cladding collapse into a fuel columnaxial gap does not occur. This criterion is discussed in detail in Reference 4.2-3.
4.2.1.1.7 Fuel Rod StressesBased upon the limits specified in ANSI/ANS 57.5, the fuel rod is evaluated to ensure that the fueldoes not fail due to cladding stresses or strains exceeding the cladding ultimate stress or straincapability. The figure of merit employed is termed the Design Ratio, where:
The effective stress or strain is determined by applying the distortion energy theory. The limit is thematerial ultimate stress or strain. To be within the limit, the Design Ratio must be less than 1.0.
Design Ratio Effective StressStress Limit
------------------------------------- orEffective StrainStrain Limit
-------------------------------------=
4-11 Revision 0October 2015
Fermi 3Updated Final Safety Analysis Report
4.2.1.1.8 Dynamic Loads / Cladding FatigueThe fuel rod is evaluated to ensure that cladding strains due to cyclic loadings do not exceed thecladding material fatigue capability. The design limit for fatigue cycling is determined from Zircaloyfatigue experiments and is conservatively specified to ensure with high confidence that failure bycladding fatigue does not occur. Based on the Light Water Reactor (LWR) cyclic design basispresented in Reference 4.2-5, the cladding fatigue life usage is calculated and maintained belowthe cladding material fatigue limit.
As noted in Subsection 4.2.1.1, for each fuel design, steady-state operating limits are established toensure that actual fuel operation, including AOOs, complies with the fuel rod thermal-mechanicaldesign and safety analysis bases above. These operating limits define the maximum allowable fueloperating power level as a function of fuel exposure. Lattice local power and exposure peakingfactors may be applied to transform the maximum allowable fuel power level into MLHGR limits forindividual fuel bundle designs.
4.2.1.2 Control RodsThe control rod is designed to have:
• Sufficient mechanical strength to prevent displacement of its reactivity control material
• Sufficient mechanical strength to prevent deformation that could inhibit its motion
The detailed design bases for the control rod are provided in Appendix 4C.
The control rod patterns and associated power distribution for an ESBWR are provided inAppendix 4A.
4.2.2 Description and Design Drawings
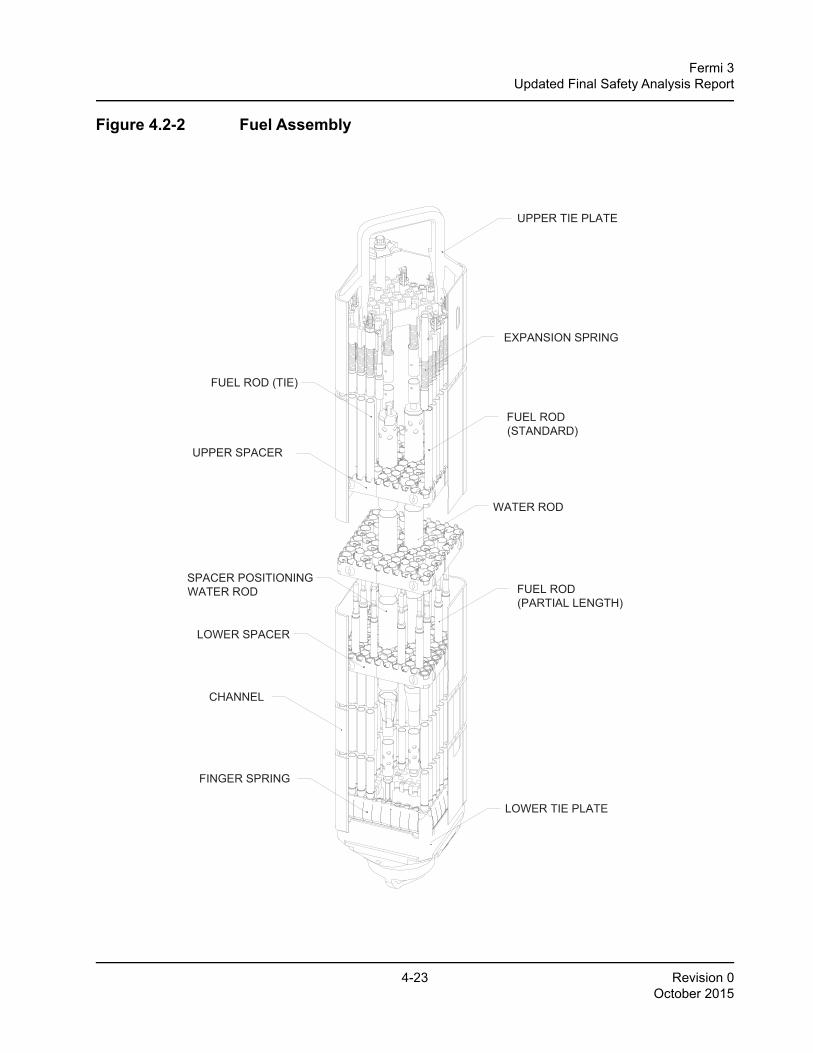
4.2.2.1 Fuel AssemblyThe components of the reference fuel assembly (GE14E) are shown in Figure 4.2-2, and consist ofa fuel bundle, a channel that surrounds the fuel bundle, and a channel fastener that attaches thebundle to the channel. The fuel and water rods are spaced and supported by upper and lower tieplates and intermediate spacers. The lower tie plate has a nosepiece that has the function ofsupporting the fuel assembly in the reactor. The upper tie plate has a handle for transferring the fuelbundle from one location to another. The identifying fuel assembly serial number is engraved on thetop of the handle; no two assemblies bear the same serial number. A boss projects from one side ofthe handle to ensure proper orientation of the assembly in the core. Finger springs are locatedbetween the lower tie plate and channel and are utilized to control the bypass flow through that flowpath. The differences between GE14E and GE14C are shown in Reference 4.2-4.
4-12 Revision 0October 2015
Fermi 3Updated Final Safety Analysis Report
4.2.2.1.1 Fuel RodsEach fuel rod consists of high density ceramic uranium dioxide fuel pellets stacked within Zircaloycladding that is evacuated, backfilled with helium and sealed with Zircaloy end plugs welded oneach end. A thin zirconium barrier liner is metallurgically bonded to the innermost part of theZircaloy cladding during cladding fabrication. Three types of fuel rods are used in a fuel bundle; tierods, standard rods, and partial length rods. The tie rods in each fuel bundle have lower end plugsthat thread into the lower tie plate and threaded upper end plugs that extend through the upper tieplate. A nut and locking tab are installed on the upper end plug to hold the fuel bundle together. Thetie rods support the weight of the assembly only during fuel handling operations. During normaloperation, the assembly is supported by the lower tie plate.
The end plugs of the standard rods have shanks that fit into holes in the tie plates. An expansionspring is located over the upper end plug shank of each rod in the bundle to support the weight ofthe upper tie plate, channel and channel fastener and to provide the necessary expansion space toaccommodate the maximum expected fuel rod growth.
The partial length rods reduce the bundle pressure drop and have lower end plugs that thread intothe lower tie plate, similar to the tie rods. The upper end plugs do not extend to the upper tie plateand are only used to seal the top end of the partial length rods.
U-235 enrichments may vary axially within a fuel rod and from fuel rod to fuel rod within a bundle toreduce local peak-to-average fuel rod power ratios. Selected fuel rods within each bundle mayinclude small amounts of gadolinium as a burnable poison.
Adequate free volume to accommodate gaseous fission products released from the fuel pelletsduring normal operation is provided within each fuel rod in the form of a pellet-to-cladding gap anda plenum region at the top of each fuel rod. A plenum spring, or retainer, is provided in the plenumspace to minimize the movement of the column of fuel pellets inside the fuel rod during shippingand handling.
4.2.2.1.2 Water RodsWater rods are hollow Zircaloy tubes with several holes around the circumference near each end toallow coolant to flow through the rod. One water rod in each bundle axially positions the spacers.This spacer-positioning water rod is designed with spacer positioning tabs that are welded to thetube exterior above and below each spacer location. An expansion spring is located between thewater rod shoulder and upper tie plate to allow for differential axial expansion similar to thefull-length fuel rods.
4.2.2.1.3 Fuel SpacerThe primary function of the spacer is to provide lateral support and maintain lateral spacing of thefuel rods, with consideration of thermal-hydraulic performance, fretting wear, strength, and neutroneconomy.
4-13 Revision 0October 2015
Fermi 3Updated Final Safety Analysis Report
4.2.2.1.4 Upper and Lower Tie platesStainless steel upper and lower tie plates carry the weight of the fuel and position the rod endslaterally during operation and handling.
4.2.2.1.5 Finger SpringsFinger springs may be employed to control the bypass flow through the channel-to-lower tie plateflow path for some fuel assemblies.
4.2.2.1.6 ChannelsThe fuel channel is composed of a zirconium based material or equivalent, and performs thefollowing functions:
• Forms the fuel bundle flow path outer periphery for bundle coolant flow.
• Provides surfaces for control rod guidance in the reactor core.
• Provides structural stiffness to the fuel bundle sufficient to support lateral loadings applied from fuel rods through the fuel spacers.
• Minimizes, in conjunction with the finger springs (if present) and bundle lower tie plate, coolant bypass flow at the channel/lower tie plate interface.
• Transmits fuel assembly seismic loadings to the core internal structure (fuel top guide and fuel support).
• Provides a heat sink during Loss-of-Coolant-Accident (LOCA).
• Provides a stagnation envelope for fuel sipping.
The channel is open at the bottom and makes a sliding seal fit on the lower tie plate surface. Theupper ends of the fuel assemblies in a four-bundle cell are positioned in the corners of the cellagainst the top guide beams by the channel fastener springs. At the top of the channel, twodiagonally opposite corners have welded tabs, which support the weight of the channel on the tworaised posts of the upper tie plate. One of these raised posts has a threaded hole. The channel isattached to the fuel bundle by threading the channel fastener screw into the upper tie plate postthread. The channel fastener assembly also includes the fuel assembly positioning spring. Properbundle alignment in the core is aided by the fuel bundle spacer buttons located on the upper portionof the channel above the control rod passage area.
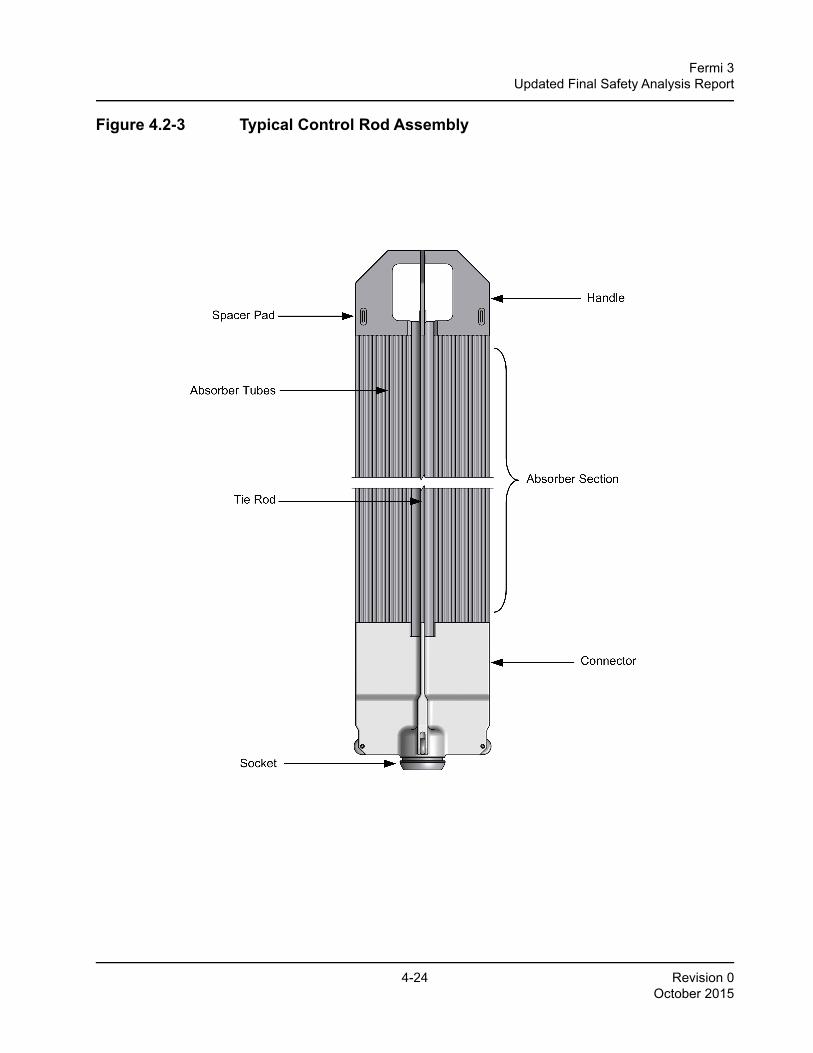
4.2.2.2 Control RodsThe control rod assemblies (Figure 4.2-3) perform the functions of power shaping, reactivity control,and scram reactivity insertion for safe shutdown response. Power distribution in the core iscontrolled during operation of the reactor by manipulating selected patterns of control rods tocounterbalance steam void effects at the top of the core.
4-14 Revision 0October 2015
Fermi 3Updated Final Safety Analysis Report
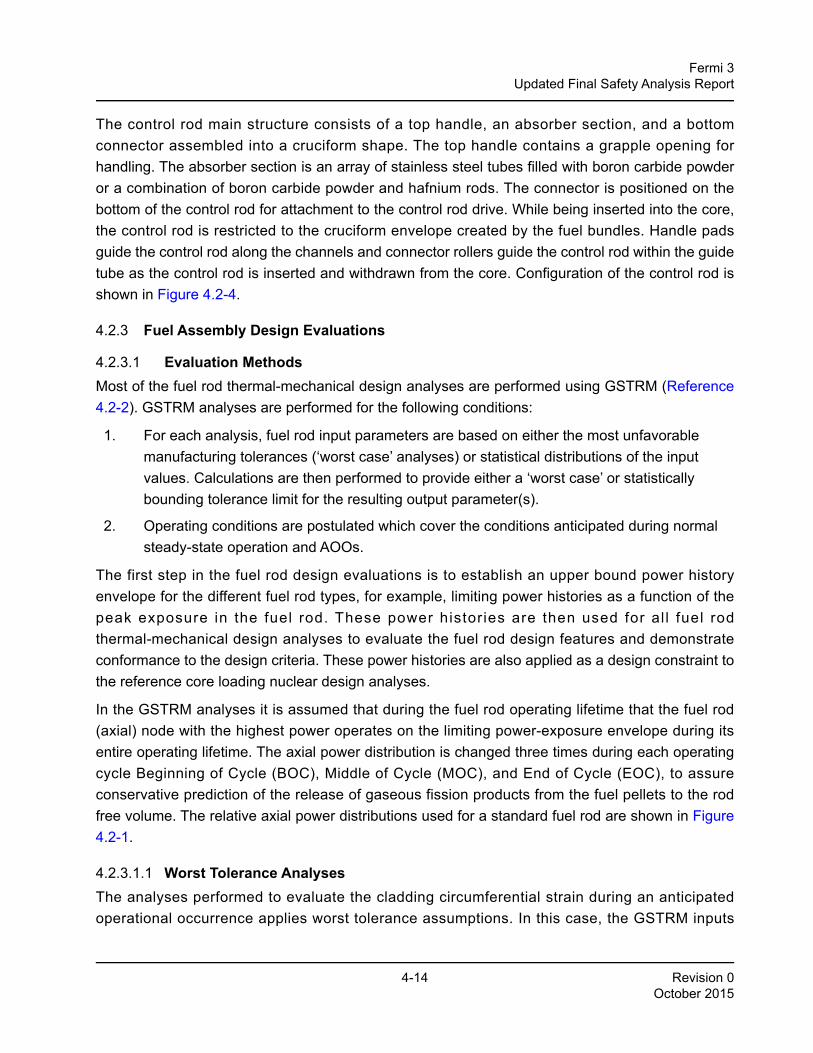
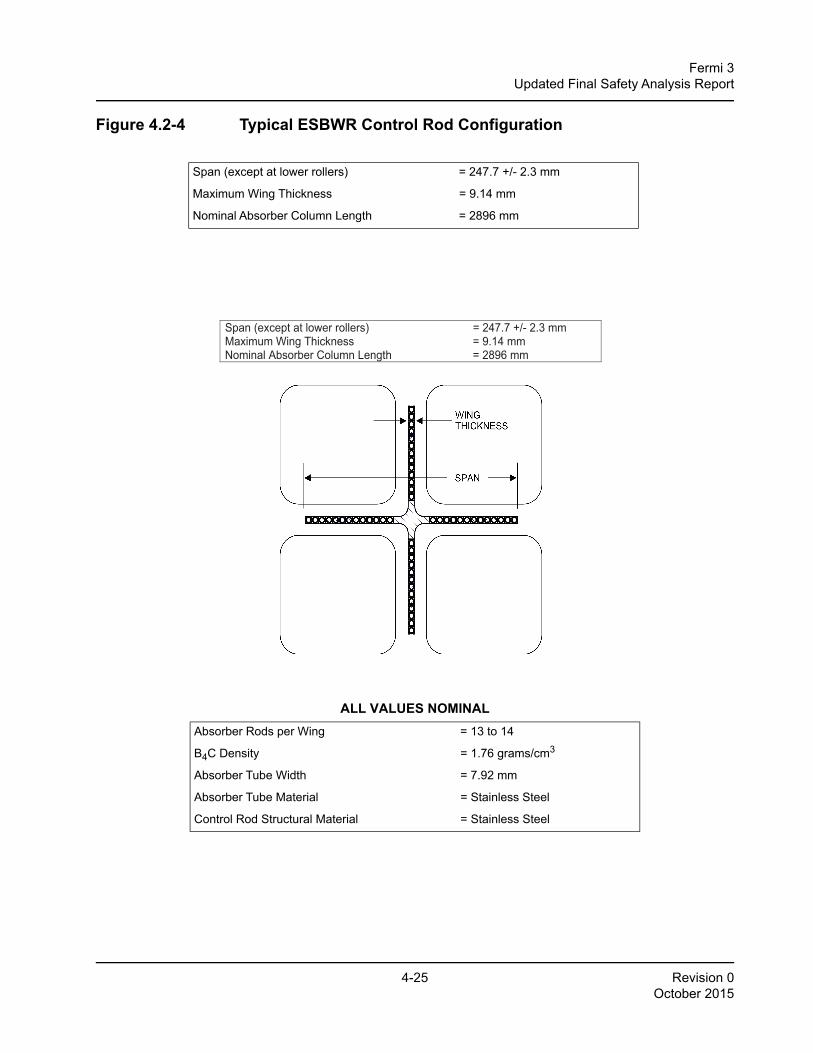
The control rod main structure consists of a top handle, an absorber section, and a bottomconnector assembled into a cruciform shape. The top handle contains a grapple opening forhandling. The absorber section is an array of stainless steel tubes filled with boron carbide powderor a combination of boron carbide powder and hafnium rods. The connector is positioned on thebottom of the control rod for attachment to the control rod drive. While being inserted into the core,the control rod is restricted to the cruciform envelope created by the fuel bundles. Handle padsguide the control rod along the channels and connector rollers guide the control rod within the guidetube as the control rod is inserted and withdrawn from the core. Configuration of the control rod isshown in Figure 4.2-4.
4.2.3 Fuel Assembly Design Evaluations
4.2.3.1 Evaluation MethodsMost of the fuel rod thermal-mechanical design analyses are performed using GSTRM (Reference4.2-2). GSTRM analyses are performed for the following conditions:
1. For each analysis, fuel rod input parameters are based on either the most unfavorable manufacturing tolerances (‘worst case’ analyses) or statistical distributions of the input values. Calculations are then performed to provide either a ‘worst case’ or statistically bounding tolerance limit for the resulting output parameter(s).
2. Operating conditions are postulated which cover the conditions anticipated during normal steady-state operation and AOOs.
The first step in the fuel rod design evaluations is to establish an upper bound power historyenvelope for the different fuel rod types, for example, limiting power histories as a function of thepeak exposure in the fuel rod. These power histories are then used for al l fuel rodthermal-mechanical design analyses to evaluate the fuel rod design features and demonstrateconformance to the design criteria. These power histories are also applied as a design constraint tothe reference core loading nuclear design analyses.
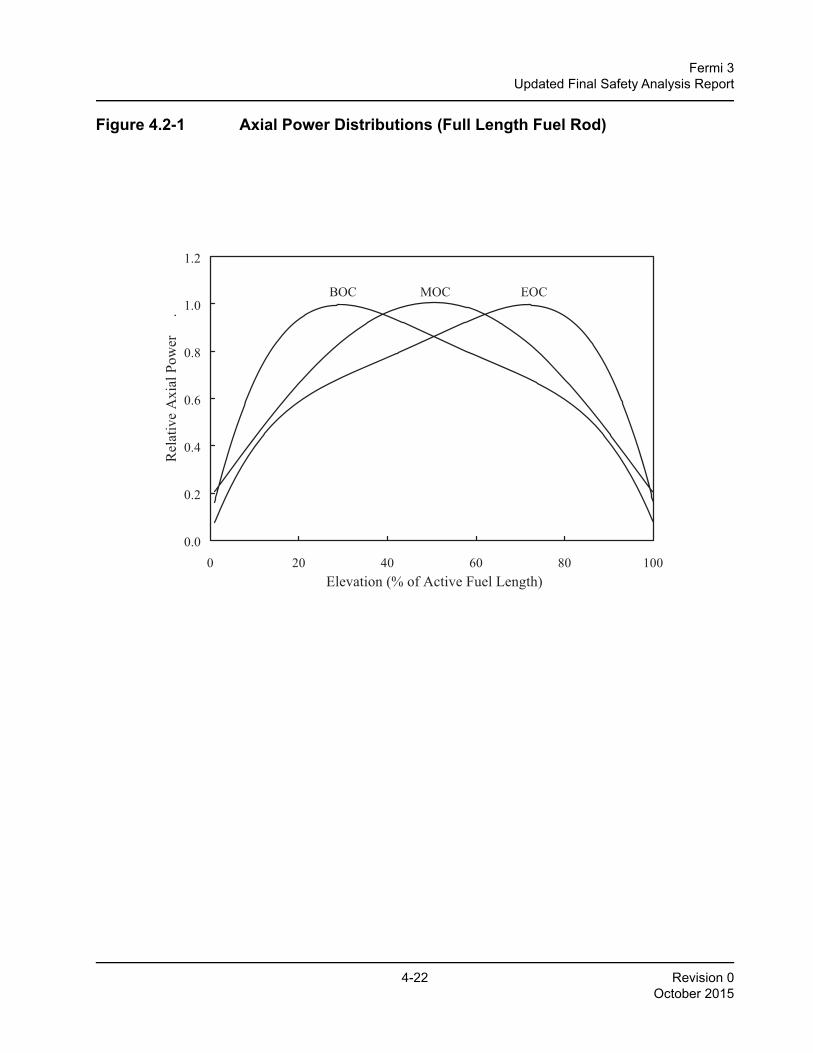
In the GSTRM analyses it is assumed that during the fuel rod operating lifetime that the fuel rod(axial) node with the highest power operates on the limiting power-exposure envelope during itsentire operating lifetime. The axial power distribution is changed three times during each operatingcycle Beginning of Cycle (BOC), Middle of Cycle (MOC), and End of Cycle (EOC), to assureconservative prediction of the release of gaseous fission products from the fuel pellets to the rodfree volume. The relative axial power distributions used for a standard fuel rod are shown in Figure4.2-1.
4.2.3.1.1 Worst Tolerance AnalysesThe analyses performed to evaluate the cladding circumferential strain during an anticipatedoperational occurrence applies worst tolerance assumptions. In this case, the GSTRM inputs
4-15 Revision 0October 2015
Fermi 3Updated Final Safety Analysis Report
important to this analysis are all biased to the fabrication tolerance extreme in the direction thatproduces the most severe result. The biases are discussed in detail in Reference 4.2-5.
4.2.3.1.2 Statistical AnalysesThe remaining GSTRM analyses are performed using standard error propagation statisticalmethods. The statistical analysis procedure is presented in Reference 4.2-5.
4.2.3.1.3 Fuel Lift and Seismic and Dynamic Load AnalysisThe fuel lift and seismic and dynamic load analyses will be completed prior to fuel release asdescribed in Reference 4.2-4.
4.2.3.2 Cladding StrainThe cladding strain analysis is performed using the GSTRM code and the worst-tolerancemethodology noted above. For each fuel rod type the cladding strain is calculated at differentexposure points, whereby an overpower is assumed relative to the limiting power history. At themost limiting exposure point, the magnitude of the overpower event is further increased until thecladding strain approaches limits described in Reference 4.2-5. The result from this analysis is usedto establish the mechanical overpower (MOP) discussed below.
4.2.3.3 Fuel Rod Internal PressureThe fuel rod internal pressure analysis is performed using the GSTRM code and the statisticalmethodology noted above. Values for the fuel rod internal pressure average value and standarddeviation are determined at different fuel rod exposure points. At each of these exposure points, thefuel rod internal pressure required to cause the cladding to creep outward at a rate equal to the fuelpellet irradiation swelling rate is also determined using the same method. Based on the twocalculated distributions a design ratio defined as the ratio of ‘cladding creep out rate-to-fuel swellingrate’ is determined such that, with at least 95% confidence, the fuel rod cladding does not creep outat a rate greater than the fuel pellet irradiation swelling rate.
4.2.3.4 Fuel Pellet TemperatureThe fuel pellet temperature analysis is performed statistically using the GSTRM code. For each fuelrod type the fuel pellet center temperature is statistically calculated at different exposure points,whereby an overpower is assumed relative to the limiting power history. At the most limitingexposure point, the magnitude of the overpower event is further increased until incipient fuelcenter-melting occurs. The result from this analysis establishes the thermal overpower (TOP)discussed below.

4-16 Revision 0October 2015
Fermi 3Updated Final Safety Analysis Report
4.2.3.5 Cladding Fatigue AnalysisThe cladding fatigue analysis is performed statistically using the GSTRM code. For calculating thecladding fatigue, variations in power and coolant pressure, as well as coolant temperature, aresuperimposed on the limiting power history.
The fuel duty cycles shown in Reference 4.2-5 represent conservative assumptions regardingpower changes anticipated during normal reactor operation including AOOs, planned surveillancetesting, normal control blade maneuvers, shutdowns, and special operating modes such as dailyload following. Based on these assumptions, the cladding strain cycles are analyzed as shown inReference 4.2-5.
4.2.3.6 Cladding Creep CollapseThe cladding creep collapse analysis consists of a detailed finite element mechanics analysis of thecladding. This evaluation is described in detail in References 4.2-3 and 4.2-5.
4.2.3.7 Fuel Rod Stress AnalysisThe fuel rod stress analysis is performed using the Monte Carlo statistical methodology andaddresses local fuel rod stress concerns, such as the stresses at spacer contact points, that are notaddressed by the GSTRM code. Results from GSTRM analyses are used to generate inputs for thestress analysis. The cladding stress analysis is described in detail in Reference 4.2-5.
4.2.3.8 Thermal and Mechanical OverpowersAs discussed above, analyses are performed to determine the values of the maximum overpowermagnitudes that do not result in violation of the cladding circumferential strain criterion MOP andthe incipient fuel center-melting criterion TOP. Conformance to these criteria is demonstrated as apart of the normal core design and transient analysis process by comparison of the calculated coretransient mechanical and thermal overpowers, as defined in Reference 4.2-5, to the mechanicaland thermal overpower limits determined by the GSTRM analyses.
4.2.3.9 Fretting WearTesting is performed to assure that the mechanical features of the design, particularly those relatedto spacers and tie plates, do not result in significant vibration and consequent fretting wear,particularly at spacer–fuel rod contact points. The vibration response of the new design is comparedto a design that has demonstrated satisfactory performance through discharge exposure.
4.2.3.10 Water RodsCalculations are performed to determine component stresses at the bounding load conditions andcompared to applicable criteria, such as yield and ultimate stresses. The load conditions take intoaccount shipping and handling loads, seismic induced bending moment, and the pressuredifferential across the water rod. The design is also evaluated using finite element analysis to
4-17 Revision 0October 2015
Fermi 3Updated Final Safety Analysis Report
determine the critical buckling load and insure adequacy relative to axial loads resulting fromdifferential growth of water rods and other fuel assembly components.
4.2.3.11 Tie PlatesAdequacy of tie plate designs is demonstrated by detailed finite element analysis and mechanicaltesting for bounding fuel handling and seismic load conditions.
4.2.3.12 SpacersFuel spacer acceptability is proven by testing in accordance with NRC-approved methods. Thebounding load condition is seismic loading. Tests are conducted to demonstrate spacer fatiguecapability and compliance with load limits and to demonstrate that a coolable geometry ismaintained by showing minimal deformation at the combined load condition. Fretting wear isaddressed by performing Flow-Induced Vibration (FIV) tests and evaluating the results relative tospacer designs that have demonstrated acceptable performance. Inspections, tests, analyses, andacceptance criteria (ITAAC) associated with the FIV tests of ESBWR fuel assemblies are providedin Tier 1. FIV testing will be performed on the fuel bundle design that will be loaded into the ESBWRinitial core and on the reference Global Nuclear Fuel (GNF) fuel design in reactor use during thetime of the tests. In addition, both bundles will be fully instrumented to capture any responsedifferences exhibited by the ESBWR fuel design at and near all design feature differences. FIVcharacteristics of the fuel design loaded into the ESBWR will be compared on a location-by-locationbasis to the reference GNF fuel design. Bundle and rod responses at various elevations betweenthe ESBWR design and the GNF fuel design with the most similar design features will be comparedto determine that ESBWR fuel design FIV response is adequate. The Fuel Assembly MechanicalDesign Report (Reference 4.2-4) contains the fuel-specific acceptance criteria.
4.2.3.13 ChannelChannel adequacy relative to applicable design criteria is confirmed by performing the followingevaluations:
• Calculation of elastic stress and deflection due to channel wall pressure difference.
• Calculation of thermal stresses due to the various temperature gradients to which the channel is subjected during normal operation and handling.
• Calculations of fatigue and stress rupture that consider the combined effect of pressure-temperature cycling and hold time.
• Elastic-plastic and creep calculations of channel wall permanent deflection.
• Calculation of channel stress due to control rod contact.
• Channel/lower tie plate differential thermal expansion analysis.

4-18 Revision 0October 2015
Fermi 3Updated Final Safety Analysis Report
4.2.3.14 ConclusionsThe results for the analyses described above are presented in detail in References 4.2-4 and 4.2-5.In summary, the GE14 design for ESBWR operation meets all the criteria noted above, plus thosethat address accidents discussed in References 4.2-4 and 4.2-5.
4.2.4 Control Rod Design EvaluationsThe control rod evaluation methods described in Section 4C.2 use established methodology forcontrol rods. The evaluation methodology history demonstrates that the criteria of Appendix 4C aresatisfactory for the ESBWR Marathon control rod. The Marathon control rod for the ESBWR isbased on the Marathon control rod design for the BWR/2 through BWR/6, which has beenapproved (Reference 4.2-7) and applied to actual plants. Where the BWR/2 through BWR/6 designand evaluations are not adequate to apply to the ESBWR, the Advanced Boiling Water Reactor(ABWR) design and evaluations are used.
4.2.4.1 ScramThe dynamic loads on the control rods are bounded by the fine motion control rod drive (FMCRD)imposed loads (scram loads) in the vertical direction. The ESBWR inoperative buffer loads are thehighest vertical loads experienced by the control rod due to the high terminal velocity. The controlrod is evaluated using a dynamic analysis in Reference 4.2-8. A model of mass, springs and gapelements is used to simulate a detailed representation of all the load bearing components of theassembly during a scram event. The computer program runs the model at cold temperature speedsand properties as well as elevated temperature speeds and properties. The resultant loads areevaluated using the material properties and geometry for the area subject to the load. The effectivestress is determined using distortion energy theory. The limit is the material ultimate stress or strain.
4.2.4.2 SeismicFuel channel deflections which result from seismic and LOCA events impose lateral loads on thecontrol rods. The Marathon control rod is analyzed for Safe Shutdown Earthquake (SSE) events,Reference 4.2-8. The BWR/2 through BWR/6 and the ABWR have similar channel lengths anddeflections. Due to the shorter length of the ESBWR channel with the same relative cross section,the expected deflection is less.
The SSE analysis is performed by evaluating the strain in the Marathon control rod absorbersection when deflected approximately 6 mm. During a seismic event, it is assumed the seismicdeflections could be added to any preexisting channel bow. The absorber section strain has beenanalyzed for channel deflections due to seismic and channel bow deflections when deflectedapproximately 10 mm and found to be acceptable, Reference 4.2-8.
Testing was performed on the ABWR Marathon control rod to confirm seismic scram capability. TheABWR Marathon control rod was tested at amplitudes of 10, 20, 30 and 40 mm. The scram timeswere found to be acceptable and the control rod was not damaged. The ESBWR channels are
4-19 Revision 0October 2015
Fermi 3Updated Final Safety Analysis Report
shorter making the fuel assembly stiffer and the fuel channel lateral deflections less. The increasein system stiffness and the decrease in lateral deflection make the ABWR Marathon control rodseismic scram capability test bounding for the ESBWR conditions.
4.2.4.3 Stuck RodCompression due to a stuck rod at the time of scram is controlled by the FMCRD. Assuming theFMCRD exerts the same compression loads, the shorter ESBWR control rod buckling isacceptable, even for one wing, Reference 4.2-8.
4.2.4.4 Absorber Burn-Up Related LoadsThe absorber containment licensed in Reference 4.2-7 is applicable to the ESBWR Marathoncontrol rod. The same methodology is used for ESBWR Marathon control rod in Reference 4.2-8.The square tube design accommodates loads created by the neutron irradiation of the absorbermaterial. In the case of B4C powder; tube wall stresses due to helium gas generation, B4C swelling,and moisture vapor heat-up are considered. The stress due to helium pressure and strain due toB4C swelling are adequate for the nuclear design life of the control rod.
4.2.4.5 Load Combinations and FatigueThe ESBWR Marathon control rod is designed to withstand load combinations including AOOs andfatigue loads associated with those combinations. Absorber tube loads are evaluated during aScram, in a cell with severe channel bow near end of control rod life when absorber burn-up heliumgas generation is highest. Absorber tube loads are evaluated during a seismic event near the endof control rod life when absorber burn-up helium gas generation is highest. Absorber section toconnector welds and absorber section to handle loads are evaluated during a SCRAM when theabsorber helium gas build-up is highest. Per Reference 4.2-8, the ESBWR Marathon control roddoes not exceed the ultimate stress or strain limit of the material. Based on the reactor cycles, thecombined loads are then evaluated for the cumulative effect of the cyclic loadings in Reference4.2-8. The fatigue usage is evaluated against a limit of 1.0.
4.2.4.6 Handling LoadsThe ESBWR Marathon control rod is designed to accommodate three times the weight of thecontrol rod, Reference 4.2-8.
4.2.4.7 HydraulicsInspection experience over 15 years has shown the Marathon control rod is not damaged by thevibrations or cavitations set up by coolant velocities and velocity distributions in the bypass regionbetween fuel channels.

4-20 Revision 0October 2015
Fermi 3Updated Final Safety Analysis Report
4.2.4.8 MaterialsMaterials selected for use in the Marathon control rod components are chosen to minimize thecomponent end-of-life radioactivity in order to reduce personnel exposure during handling on-site,and for final offsite shipping and burial. All Marathon control rod materials are less than 0.03 weightpercent cobalt. The average niobium content for the handle and absorber section, less boroncarbide and hafnium, is less than 0.1 weight percent.
4.2.4.9 Nuclear PerformanceThe nuclear lifetime of the initial ESBWR Marathon control rod type is established as a 10 percentreduction in reactivity worth (Δk/k) in any quarter axial segment, Reference 4.2-9.
4.2.4.10 Mechanical CompatibilitySimilar to the control rods supplied for the ABWR and BWR/2 through BWR/6, the ESBWRMarathon control rod is designed to be compatible with core and reactor internal interfaces.
The ESBWR Marathon control rod is designed to be compatible with the Control Rod Guide Tube(CRGT) cylindrical boundary, to provide a seat with the guide tube base during FMCRD removal, toprovide lower guide rollers for smooth transitions, and to have clearance with the orificed fuelsupport for insertion and withdrawal from the core.
The control rod coupling socket provides a compatible interface with the FMCRD. The couplingengages the FMCRD by rotating one-eighth turn (45°). With the FMCRD, Control Rod DriveHousing (CRDH), and CRGT positively assembled, any orientation of the cruciform control rodbetween the fuel assemblies is a coupled position, and rotation to an uncoupled position is notpossible during reactor operation. The four lobes of the FMCRD coupling spud are in line with thefour wings of the control rod in the coupled position.
The control rod is designed to permit coupling and uncoupling of the control rod drive from belowthe vessel for FMCRD servicing without necessitating the removal of the reactor vessel head. Thecontrol rod is also designed to allow uncoupling and coupling from above the vessel using controlrod handling tools.
The control rod is positively coupled to the FMCRD and is designed to remain coupled during allscrams and loading conditions, including inoperative buffer scram loads. The control rod withstandsthe loads induced by the FMCRD without exceeding the structural design criteria as stated inSubsections 4.2.4.1 and 4.2.4.2 above.
The control rod is dimensionally compatible with the fuel assemblies (unirradiated and irradiated).The control rod is guided, rotationally restrained and laterally supported by the adjacent fuelassemblies. The control rod is designed and constructed to establish and maintain the alignment ofthe control rod drive line (CRDH, CRGT, and fuel assemblies) so that control rod insertion andwithdrawal is predictable. The top of the active absorber of a fully withdrawn control rod is below the

4-21 Revision 0October 2015
Fermi 3Updated Final Safety Analysis Report
Bottom of the Active Fuel (BAF). Absorber gap requirements are placed on the control rod in theoperating condition to be compatible with the core nuclear design requirements.
4.2.5 Testing, Inspection, and Surveillance PlansGEH has an active program for the surveillance of both production and developmental fuel. TheNRC has reviewed the GEH program and approved it in Reference 4.2-6.
4.2.6 COL InformationNone.
4.2.7 References
4.2-1 Global Nuclear Fuel, “Global Nuclear Fuels Fuel Bundle Designs,” NEDE-31152P, Class III (Proprietary), Revision 9, May 2007, NEDO-31152, Class I (Non-proprietary), Revision 9, May 2007.
4.2-2 GE Nuclear Energy, “Fuel Rod Thermal-Mechanical Analysis Methodology (GSTRM),” NEDC-31959P, Class III (Proprietary), April 1991.
4.2-3 Global Nuclear Fuel, “Cladding Creep Collapse,” NEDC-33139P-A, Class III (Proprietary), July 2005.
4.2-4 Global Nuclear Fuel, “GE14E Fuel Assembly Mechanical Design Report,” NEDC-33240P-A, Class III (Proprietary), Revision 1, September 2010, NEDO-33240-A, Class I (Non-proprietary), Revision 1, September 2010.
4.2-5 Global Nuclear Fuel, “GE14 for ESBWR Fuel Rod Thermal-Mechanical Design Report,” NEDC-33242P-A, Class III (Proprietary), Revision 2, September 2010, and NEDO-33242-A, Class I (Non-proprietary), Revision 2, September 2010.
4.2-6 USNRC Letter, L. S. Rubenstein (NRC) to R. L. Gridley (GE), “Acceptance of GE Proposed Fuel Surveillance Program,” June 27, 1984.
4.2-7 GE Nuclear Energy, “GE Marathon Control Rod Assembly,” NEDE-31758P-A, Class III (Proprietary), October 1991.
4.2-8 GE Hitachi Nuclear Energy, “ESBWR Marathon Control Rod Mechanical Design Report,” NEDE-33244P-A, Class III (Proprietary), Revision 2, September 2010, and NEDO-33244-A, Class I (Non-proprietary), Revision 2, September 2010.
4.2-9 GE Hitachi Nuclear Energy, “ESBWR Marathon Control Rod Nuclear Design Report,” NEDE-33243P-A, Class III (Proprietary), Revision 2, September 2010, and NEDO-33243-A, Class I (Non-proprietary), Revision 2, September 2010.
4.2-10 GE Nuclear Energy, “GESTR-LOCA – A Model for Prediction of Fuel Rod Thermal Performance,” NEDE-23785-1-PA (Volume 1), Class III (Proprietary), Revision 1, October 1984 and NEDO-23785-1-A (Volume 1), Class I (Non-proprietary), Revision 1, February 1985.
4-22 Revision 0October 2015
Fermi 3Updated Final Safety Analysis Report
Figure 4.2-1 Axial Power Distributions (Full Length Fuel Rod)
26A6642AP Rev. 10 ESBWR Design Control Document/Tier 2
Figure 4.2-1. Axial Power Distributions (Full Length Fuel Rod)
0.0
0.2
0.4
0.6
0.8
1.0
1.2
0 20 40 60 80 100Elevation (% of Active Fuel Length)
Rel
ativ
e A
xial
Pow
er
.
BOC MOC EOC
4-23 Revision 0October 2015
Fermi 3Updated Final Safety Analysis Report
Figure 4.2-2 Fuel Assembly
FUEL ROD(PARTIAL LENGTH)
FUEL ROD(STANDARD)
CHANNEL
LOWER SPACER
FUEL ROD (TIE)
FINGER SPRING
LOWER TIE PLATE
EXPANSION SPRING
UPPER TIE PLATE
UPPER SPACER
SPACER POSITIONING WATER ROD
WATER ROD
4-24 Revision 0October 2015
Fermi 3Updated Final Safety Analysis Report
Figure 4.2-3 Typical Control Rod Assembly
26A6642AP Rev. 09 ESBWR Design Control Document/Tier 2
Figure 4.2-3. Typical Control Rod Assembly
4-25 Revision 0October 2015
Fermi 3Updated Final Safety Analysis Report
Figure 4.2-4 Typical ESBWR Control Rod Configuration
ALL VALUES NOMINALAbsorber Rods per Wing = 13 to 14
B4C Density = 1.76 grams/cm3
Absorber Tube Width = 7.92 mm
Absorber Tube Material = Stainless Steel
Control Rod Structural Material = Stainless Steel
26A6642AP Rev. 09 ESBWR Design Control Document/Tier 2
Span (except at lower rollers) = 247.7 +/- 2.3 mm Maximum Wing Thickness = 9.14 mm Nominal Absorber Column Length = 2896 mm
Span (except at lower rollers) = 247.7 +/- 2.3 mm
Maximum Wing Thickness = 9.14 mm
Nominal Absorber Column Length = 2896 mm

4-26 Revision 0October 2015
Fermi 3Updated Final Safety Analysis Report
4.3 Nuclear Design This section describes the design bases and functional requirements used in the nuclear design ofthe fuel, core and reactivity control system and relates these design bases to the General DesignCriteria (GDC) from 10 CFR Part 50, Appendix A (Reference 4.3-9).
4.3.1 Design BasisThe design bases are those that are required for the plant to operate, meeting all safetyrequirements. The safety design bases that are required fall into two categories:
• The reactivity basis, which prevents an uncontrolled positive reactivity excursion.
• The overpower bases for the control of power distribution, which prevent the core from operating beyond the fuel integrity limits.
4.3.1.1 Negative Reactivity Feedback BasesReactivity coefficients, the differential changes in reactivity produced by differential changes in coreconditions, are useful in calculating stability and evaluating the response of the core to externaldisturbances. The base initial condition of the system and the postulated initiating event determinewhich of the several defined coefficients are significant in evaluating the response of the reactor.The coefficients of interest are the Doppler coefficient, the moderator void reactivity coefficient andthe moderator temperature coefficient. Also associated with the BWR is a power reactivitycoefficient. The power coefficient is a combination of the Doppler and void reactivity coefficients inthe power operating range; this is not explicitly evaluated. The Doppler coefficient, the moderatorvoid reactivity coefficient and the moderator temperature coefficient of reactivity are negative forpower operating conditions, thereby providing negative reactivity feedback characteristics.
The above design basis meets GDC 11.
4.3.1.2 Control Requirements (Shutdown Margins)The core is capable of being made subcritical, with margin, in the most reactive conditionthroughout the operating cycle with the highest worth control rod, or rod pair, stuck in the full-outposition and all other rods fully inserted. This satisfies GDC 26.
4.3.1.3 Control Requirements (Overpower Bases)The nuclear design basis for control requirements is that MLHGR and Minimum Critical PowerRatio (MCPR) constraints are met during operation. The MCPR and MLHGR are determined suchthat, with 95% confidence, the fuel does not exceed required licensing limits during AOOs.
These parameters are defined as follows:
Maximum Linear Heat Generation Rate: The MLHGR is the maximum linear heat generation forthe fuel rod with the highest surface heat flux at a given nodal plane in the bundle. The MLHGRoperating limit is bundle type dependent. The MLHGR is monitored and the fuel is not operated at

4-27 Revision 0October 2015
Fermi 3Updated Final Safety Analysis Report
MLHGR values greater than those found to be acceptable within the body of the safety analysisunder normal operating conditions. Under AOO conditions, including the maximum overpowercondition, the MLHGR does not cause fuel melting nor cause the stress and strain limits to beexceeded, as discussed in Section 4.2.
Minimum Critical Power Ratio: The MCPR is the minimum Critical Power Ratio (CPR) allowed fora given bundle type to avoid boiling transition. The CPR is a function of several parameters; themost important are bundle power, bundle flow, the local power distribution and the details of thebundle mechanical design. The plant Operating Limit Minimum Critical Power Ratio (OLMCPR) isestablished by considering the limiting AOOs for each operating cycle. The OLMCPR is determinedsuch that 99.9% of the rods avoid boiling transition during the transient of the limiting analyzedAOO, as discussed in Section 4.4.
The above basis satisfies GDC 10.
4.3.1.4 Control Requirements (Standby Liquid Control System)GDC 27 requires that the reactivity control systems have a combined capability, in conjunction withpoison addition by the emergency core cooling system, of reliably controlling reactivity changesunder postulated accident conditions, with appropriate margin for stuck rods. The nuclear designbasis is that, assuming a stuck rod, or rod pair, the Standby Liquid Control (SLC) system providessufficient liquid poison into the system so that sufficient Shutdown Margin (SDM) is achieved.
4.3.1.5 Stability BasesThe GDCs related to stability are Criteria 10 and 12.
The reactor core and associated coolant, control, and protection systems are designed withappropriate margin to assure that specified acceptable fuel design limits are not exceeded duringany condition of normal operation, including the effects of AOOs.
The reactor core and associated coolant, control, and protection systems are designed to assurethat power oscillations that could result in conditions exceeding specified acceptable fuel designlimits are either not possible or can be reliably and readily detected and suppressed.
4.3.2 Nuclear Design Analytical Methods
4.3.2.1 Steady-State Nuclear MethodsThe principal tool used in the steady-state nuclear core analysis is the three-dimensional BWRsimulator code, which computes core reactivity, power distributions, exposure, and reactorthermal-hydraulic characteristics, with spatially varying voids, control rods, burnable poisons andother variables. It is used to calculate reactivity variations through the cycle, shutdown margins andthermal limits (MLHGR and MCPR).
4-28 Revision 0October 2015
Fermi 3Updated Final Safety Analysis Report
The steady-state nuclear evaluations of the reference core design are performed using theanalytical tools and methods approved in Reference 4.3-2. The applicability of these methods to thenuclear analysis of ESBWR is given in Reference 4.3-8. Changes may be made to thesetechniques provided that NRC-approved methods, models, and application methodologies areused.
Neutronic parameters used by the core simulator are obtained from a 2-D lattice physics code andparametrically fitted as a function of moderator density, exposure, control and moderator densityhistory for a given fuel type. Lattice physics calculations are performed using a two-dimensional,fine mesh, few group diffusion theory computer program that determines the nodal flux and powerdistributions in a fuel bundle (Reference 4.3-2). The lattice analyses are performed during thebundle design process. The results of these single bundle calculations are reduced to “libraries” oflattice reactivities, relative rod powers, and few group cross-sections as a function of instantaneousvoid, exposure, exposure-void history, control state and history, and fuel and moderatortemperature. The lattice analyses depend only on fuel lattice parameters and are valid for all plantsand cycles for a specific bundle design. The ESBWR core is of the N-lattice type, which is identicalto the ABWR, and the lattice physics methods have been qualified for this geometry, including coretracking of operating ABWRs.
The lattice physics code calculates lattice average nuclear constants, rod-by-rod distribution ofpower and lattice average isotopic data for an infinite array of identical lattices. These are allcalculated as a function of exposure, voids, control state, and temperature. Specific applications ofthe lattice physics program include fuel lattice design, fuel bundle design and fuel bundlereconstitution physics analysis.
The solution technique begins with the generation of thermal broad-group neutron cross sectionsfor all homogenized fuel rod cells and external regions in a bundle. In the thermal energy range, therod-by-rod thermal spectra are calculated by a collision probability method. The major difference isthat neutron leakage from rod to rod is taken into account. The leakage is determined by diffusiontheory and is fed into the thermal spectrum calculation. Iterations between diffusion theory andthermal spectrum calculations are carried out to determine accurate, spatially dependent, thermalcross sections. In the epithermal and fast energy range, the level-wise resonance integrals arecalculated by an improved intermediate resonance (IR) approximation in which the IR parametersare fuel-rod-temperature dependent. The fast and epithermal regional flux is determined by amulti-group collision probability process.
A two-dimensional, coarse-mesh, broad-group, diffusion-theory calculation is used to determine thenodal flux distributions in the bundle. By combining the two-dimensional, coarse-mesh, broad-groupflux and the intra-nodal collision probability flux profiles, the lattice intra-nodal flux and powerdistributions are obtained. In the depletion calculation, 100 nuclides are treated, including 25 fissileand fertile nuclides and up to 48 fission products, one pseudo fission product and one gadolinia tail
4-29 Revision 0October 2015
Fermi 3Updated Final Safety Analysis Report
pseudo product. A Runge-Kutta-Gill burnup integration scheme is employed to determine theisotopic inventory for fuel material depletion.
The BWR core simulator is a static, three-dimensional coupled nuclear-thermal-hydraulic computerprogram representing the BWR core exclusive of any external flow loops. Provisions are made forfuel cycle and thermal limits calculations. The program is used for detailed three-dimensionaldesign and operational calculations of BWR neutron flux and power distributions and thermalperformance as a function of control rod position, refueling pattern, coolant flow, reactor pressure,and other operational and design variables. A power-exposure iteration option is available for targetexposure distribution and cycle length predictions.
The nuclear model is based on coarse-mesh nodal, static diffusion theory. Eigenvalue iterationyields the fundamental mode solution. This is coupled to static parallel channel thermal-hydraulicscontaining a modified void-quality correlation. Pressure drop balancing yields the flow distributionamong the channels.
These methods include at least a 1½ energy group neutron diffusion model with non-linearlycoupled spatially asymptotic thermal flux model, spectral history reactivity model, control bladehistory reactivity and local peaking models, explicit temperature (density) dependence for coldcritical data, pin power reconstruction, and internal cross section library generation. The controlblade history model uses cross section data from a controlled depletion with uncontrolled restartsfor each specific fuel type. The impacts on reactivity and local peaking are included using anexponentially weighted scheme.
A simulator code is used in core design and operational calculations to produce reactivity, powerdistribution, and thermal performance information as functions of design and operational variablessuch as fuel loading pattern, control rod position, coolant flow, and reactor pressure. Specificapplications include fuel loading, fuel cycles, core design configuration, core management and onsite core monitoring.
TRACG is iteratively used with a simulator code to establish the total core flow for a given corepower. This iteration is described in Section 4.4. The application of TRACG to the ESBWR core isdescribed in Reference 4.3-7. The ESBWR core is not substantially different from operating BWRsfrom the viewpoint of steady-state nuclear simulations of core parameters.
4.3.2.2 Reactivity Coefficient MethodsThe Doppler reactivity coefficient is determined by using an NRC-approved lattice physics code.The Doppler coefficient is determined using the theory and methods for steady-state nuclearcalculations, described above.
The lattice physics code is used to calculate k∞ for any lattice at two temperatures. The firsttemperature is the standard hot operating temperature. The second temperature is set at 1773 K
4-30 Revision 0October 2015
Fermi 3Updated Final Safety Analysis Report
(2732ºF). The calculations are made as a function of void fraction and at every standard hotuncontrolled exposure depletion point.
The Doppler Reactivity Coefficient (DRC) is characterized as follows:
where:
T0 = normal hot operating temperature (Kelvin).
T1= elevated temperature (Kelvin).
= eigenvalue at elevated temperature.
= eigenvalue at normal operating temperature.
While the reactivity change caused by the Doppler effect is small compared to the moderator voidreactivity changes during normal operation, it becomes very important during postulated rapidpower excursions in which large fuel temperature changes occur (Chapter 15).
The 3D core simulator is used in determining the void coefficient of reactivity. A detailed discussionof the methods used to calculate moderator void reactivity coefficients, the accuracy and applicationto plant transient analyses, is presented in Reference 4.3-4. The In-Channel Void Coefficient(VODCOF) is the ratio of the change in k-effective to the change in (percent) void fraction becauseof a perturbation in some particular parameter:
The calculation of the void reactivity coefficient is accomplished through perturbation of the inletenthalpy to the core, although perturbation of pressure or core flow are also possible to effect achange in voids and reactivity. The derivative in the above equation is determined by a higher-ordernumerical scheme, which requires two points above and two points below the base point in additionto the base point itself. After evaluating four perturbations to the original system, one obtains abetter estimate than any of the original four approximate derivatives. This type of evaluation issubsequently less sensitive to the type and size of the perturbation for evaluation of a particularderivative.
The moderator temperature coefficient (MODCOF) is calculated using a combination of the latticephysics code and core simulator. The lattice physics code is used to evaluate infinite latticeproperties of each of the various lattices in the fuel bundle as a function of exposure, void historyand temperature. Introducing the temperature specific nuclear libraries from the lattice physics codeinto the core simulator and performing a standard cold eigenvalue calculation then simulates a coretemperature change. From the differential in core eigenvalue, the moderator temperature coefficientof reactivity may be obtained as:
DRC1000 kT1
kT0)–(
kT0T1 T0 )–(
---------------------------------------=
kT1
kT0
VODCOF 1k--- ∂k
∂ %VOID)(----------------------------=
MODCOF 1k--- ∂k
∂ °K)(---------------=
4-31 Revision 0October 2015
Fermi 3Updated Final Safety Analysis Report
4.3.2.3 Stability MethodsA detailed discussion of the methods used to analyze ESBWR thermal-hydraulic stability ispresented in Reference 4.3-7.
4.3.3 Nuclear Design EvaluationThe core design consists of a light-water moderated reactor, fueled with slightly enricheduranium-dioxide. The use of water as a moderator produces a neutron energy spectrum in whichfissions are caused principally by thermal neutrons. At normal operating conditions, the moderatorboils, producing a spatially variable distribution of steam voids in the core. The void reactivityfeedback effect is an inherent safety feature of the ESBWR system. Any system change whichincreases reactor power, either in a local or core-wide sense, produces additional steam voids andthus reduces the power.
4.3.3.1 Nuclear Design DescriptionThe reference core design is examined in detail for an equilibrium core in Reference 4.3-8 and foran initial core loading in Reference 4.3-10. The reference equilibrium core design is characterizedby the loading pattern given in Reference 4.3-8. These core designs are the basis for the systemanalyses in other sections of this document.
For cores other than the reference core designs the Reference Loading Pattern (RLP) is thenuclear design basis for fuel licensing. The RLP core is designed to represent, as closely aspossible, the actual core loading pattern. However, there may be occurrences where the numbers,types, or both number and types of bundles in the reference design and the actual core loading donot exactly agree. Any differences between the reference loading pattern and the actual loadingpattern are evaluated to ensure that there is no adverse impact to key parameters that may affectthe licensing calculations.
There are no changes to the fuel, control rod, or core design from that described in the referencedcertified design.
4.3.3.2 Negative Reactivity Feedback EvaluationReactivity coefficients are a measure of the differential changes in reactivity produced by differentialchanges in core conditions. These coefficients are useful in understanding the response of the coreto external disturbances. The Doppler reactivity coefficient and the moderator void reactivitycoefficient are the two primary reactivity coefficients that characterize the dynamic behavior ofboiling water reactors.
The safety analysis methods (described in Chapter 15) are based on system and core models thatinclude an explicit representation of the core space-time kinetics. Therefore, the reactivitycoefficients are not directly used in the safety analysis methods, but are useful in the generalunderstanding and discussion of the core response to perturbations.
4-32 Revision 0October 2015
Fermi 3Updated Final Safety Analysis Report
4.3.3.2.1 Doppler Reactivity Coefficient EvaluationThe Doppler coefficient is a measure of the reactivity change associated with an increase in theabsorption of resonance-energy neutrons caused by a change in the temperature of the material inquestion. The Doppler reactivity coefficient provides instantaneous negative reactivity feedback toany rise in fuel temperature, on either a gross or local basis. The magnitude of the Dopplercoefficient is inherent in the fuel design and does not vary significantly among BWR designs. Formost structural and moderator materials, resonance absorption is not significant, but in U-238 andPu-240 an increase in temperature produces a comparatively large increase in the effectiveabsorption cross-section. The resulting parasitic absorption of neutrons causes an immediate lossin reactivity.
Analyses were performed using the analytical models described above, as described in References4.3-8 and 4.3-10. The values are identical to the analysis supporting compliance for the GE14 fuelbundle found in Reference 4.3-3, which consists of examination of the lattice level Dopplercoefficients for several lattice configurations. Evaluating the Doppler coefficient at the 2D latticelevel obviates the need for more detailed calculations involving the 3D core simulator. For all casesevaluated, the calculated Doppler coefficient was found to be negative. A typical value calculated is-1.10 Δk / K0.5 (at zero exposure, 0.4 void fraction).
4.3.3.2.2 Moderator Void Coefficient EvaluationThe moderator void coefficient should be large enough to prevent power oscillation due to spatialxenon changes yet small enough that pressurization transients do not unduly limit plant operation.In addition, the void coefficient has the ability to flatten the radial power distribution and to provideease of reactor control due to the void feedback mechanism. The overall void coefficient is alwaysnegative over the complete operating range.
Analyses of the moderator void coefficient for the reference equilibrium core design and the initialcore were performed and are described in Reference 4.3-8 and Reference 4.3-10, respectively. Theresults of these analyses show that boiling of the moderator in the active channel flow area resultsin negative reactivity feedback for all expected modes of operation. The operating mode selected torepresent the most limiting condition (the least negative value of moderator void coefficient) was thecold critical state at the middle of an equilibrium cycle. The variation of the void coefficient as afunction of temperature is shown in Reference 4.3-8 for several exposure points in the referenceequilibrium fuel cycle.
4.3.3.2.3 Moderator Temperature Coefficient EvaluationThe moderator temperature coefficient is an aspect of the BWR core that is routinely evaluated aspart of core and fuel design. The moderator temperature coefficient is associated with the change inthe water moderating capability. A negative moderator temperature coefficient during poweroperation provides inherent protection against power excursions. Hot standby is the condition underwhich the BWR core coolant has reached rated pressure and temperature and is the state point at
4-33 Revision 0October 2015
Fermi 3Updated Final Safety Analysis Report
which a negative moderator temperature coefficient is required. Once boiling begins, the coredynamic response is dominated by the void coefficient.
The BWR core can exhibit a positive moderator temperature coefficient; although, fleet operationexperience has shown it is uncommon or otherwise manageable. The primary parameters that leadto a positive moderator temperature coefficient are the critical control rod density, the gadoliniacontent present, the lattice geometry and the enrichment. The two most important parameters arethe control rod density and the gadolinia content. As insertion of the control rod displaces water inthe intra-assembly gap, controlled nodes tend to contribute to a negative moderator temperaturecoefficient. Similarly, both gadolinia and control rods are strong local absorbers, and as neutronmigration area increases with moderator temperature, both absorbers become more effectiveleading to a negative moderator temperature coefficient. As the core is depleted through poweroperation both the critical control rod density and the gadolinia content reduced, which can lead topositive temperature coefficients at low temperature for late cycle startups. Most, if not all, modernBWR fuel designs can be evaluated as having a positive moderator temperature coefficient undercertain conditions at moderator temperatures below hot standby; however, as the transientresponse of the core to a positive moderator temperature coefficient during startup is slow due tothe time required to increase the coolant temperature, and reduce the fuel temperature after aninitial power increase, a positive moderator temperature coefficient does not pose a problem forreactivity control.
Analyses of the moderator temperature coefficient for the reference equilibrium core design and theinitial core were performed and are described in Reference 4.3-8 and Reference 4.3-10,respectively. The variation of the moderator temperature coefficient as a function of temperature isshown in Reference 4.3-8 for several exposure points in the reference fuel cycle.
The results of the analyses at these conditions indicate that the moderator temperature coefficientis negative for all moderator temperatures in the operating temperature range. Therefore, themoderator temperature coefficient criteria are met.
4.3.3.3 Control Requirements EvaluationThe ESBWR control rod system is designed to provide adequate SDM and control of the maximumexcess reactivity anticipated during the plant operation.
There are 135 Hydraulic Control Units (HCUs) that move all 269 control rods. Thus, there are134 HCUs associated with two control rods while the center control rod is powered by one HCU.Reference 4.3-8 provides the HCU to FMCRD assignments used to verify SDM.
4.3.3.3.1 Shutdown Margin EvaluationThe SDM is evaluated by calculating the core neutron multiplication with the core simulator atselected exposure points, assuming the highest worth control rod, or rod pair, is stuck out in the fullywithdrawn position.
4-34 Revision 0October 2015
Fermi 3Updated Final Safety Analysis Report
As exposure accumulates and burnable poison depletes in the lower exposure fuel bundles, anincrease in core reactivity can occur. The nature of the increase depends on the specifics of the fuelloading and control state. For fuel cycles beyond the initial core, the SDM is calculated based onthe carryover of the expected exposure at the end of the previous cycle. The core is assumed to bein the cold, xenon-free condition in order to ensure that the calculated values are conservative.Further discussion of the uncertainty of these calculations is given in Reference 4.3-5.
The cold keff is calculated with the highest worth control rod, or rod pair, out at various exposuresthrough the cycle. A value R is defined as the difference between the highest worth rod out keff atBeginning of Cycle (BOC) and the maximum calculated highest worth rod out keff at any exposurepoint.
The strongest rod, or rod pair, out keff at any exposure point in the cycle is equal to or less than
where R is conservatively determined to be greater than or equal to 0. The value of R includesequilibrium samarium.
For the reference equilibrium core design, the calculated keff with the highest worth rod pairwithdrawn at BOC and the uncontrolled and fully controlled keff values are also reported inReference 4.3-8. Corresponding information on the initial fuel cycle design is provided byReference 4.3-10. The minimum required shutdown margin is given in the Technical Specifications.
4.3.3.3.2 Reactivity Variation EvaluationThe excess reactivity designed into the core is controlled by the control rod system supplementedby gadolinia-urania fuel rods. When applied in any specific fuel cycle, these integral fuel burnableabsorber rods may be used to provide partial control of the excess reactivity available during thefuel cycle. The burnable absorber loading controls local peaking factors and lowers the reactivity ofthe fuel bundle. The burnable absorber performs this function by reducing the requirement forcontrol rod inventory in the core at the beginning of the fuel cycle, as described previously. Controlrods are used during the cycle to compensate for reactivity changes due to burnup and also tocontrol the power distribution.
The nuclear design of the fuel assemblies comprising the equilibrium cycle reference core design,including enrichment and burnable absorber distributions within the assembly, is given in Reference4.3-8, as is information relating to the reactivity variation through the cycle (that is, hot excessreactivity). The nuclear design for the initial core is provided in Reference 4.3-10. The control rodpatterns through the equilibrium cycle of the reference core design are given in Appendix 4A usinga quarter core (mirror reflected) representation. The initial core control rod patterns are given inReference 4.3-10.
keff keff Strongest rod withdrawn at BOC( ) R+=
4-35 Revision 0October 2015
Fermi 3Updated Final Safety Analysis Report
4.3.3.3.3 Standby Liquid Control System EvaluationThe SLC system is designed to provide the capability of bringing the reactor, at any time in a cycle,from full power with a minimum control rod inventory (which is defined to be at the peak of thexenon transient) to a subcritical condition with the reactor in the most reactive xenon-free state. TheSLC system is described in detail in Subsection 9.3.5.
The requirements of this system are dependent primarily on the reactor power level and on thereactivity effects of voids and temperature between full-power and cold, xenon-free conditions. Theshutdown capability of the SLC system for the reference equilibrium ESBWR core is discussed indetail in Reference 4.3-8. The shutdown capability of the SLC system for the ESBWR initial fuelcycle core is provided in Reference 4.3-10. The SDM is calculated for a uniformly mixed equivalentconcentration of natural boron, which is required in the reactor core to provide adequate cold SDMafter operation of the SLC system. Calculations are performed throughout the cycle including themost reactive critical, xenon-free condition. Calculations are performed with all control rodswithdrawn in order to provide a bounding control rod pattern. Reference 4.3-8 shows adequate SLCsystem SDM for the equilibrium ESBWR core compared to a limit of 1%. Corresponding informationfor the initial fuel cycle design is provided in Reference 4.3-10.
4.3.3.4 Criticality of Reactor During Refueling EvaluationThe basis for maintaining the reactor subcritical during refueling is presented in Subsection 4.3.1.2,and a discussion of how control requirements are met is given in Subsection 4.3.3.3.1. Theminimum required SDM is given in the technical specifications.
4.3.3.5 Power Distribution EvaluationThe core power distribution is a function of fuel bundle design, core loading, control rod pattern,core exposure distributions and core coolant flow rate. The thermal performance parameters,MLHGR and MCPR, limit the core power distribution. The analysis of the performance of thereference equilibrium and initial core designs in terms of power distribution, and the associatedMLHGR and MCPR distributions within the core throughout the cycle exposure, are given in detailin References 4.3-8 and 4.3-10, respectively.
4.3.3.5.1 Power Distribution MeasurementsThe techniques for measurement of the power distribution within the reactor core, together withinstrumentation correlations and operation limits, are discussed in Subsections 7.2.2 and 7.7.6.
4.3.3.5.2 Power Distribution AccuracyThe accuracy of the calculated power distribution is discussed in Reference 4.3-1.
4-36 Revision 0October 2015
Fermi 3Updated Final Safety Analysis Report
4.3.3.5.3 Power Distribution AnomaliesStringent inspection procedures are utilized to ensure the correct arrangement of the core followingfuel loading. A fuel loading error (a mislocated or a misoriented fuel bundle in the core) is a veryimprobable event, but calculations have been performed to determine the effects of such events.The fuel loading error is discussed further in Chapter 15.
The inherent design characteristics of the ESBWR are well suited to limit gross power tilting. Thestabilizing nature of the large moderator void coefficient effectively reduces the effect ofperturbations on the power distribution. In addition, the in-core instrumentation system, togetherwith the online computer, provides the operator with prompt information on the power distribution sothat control rods or other means to limit the undesirable effects of power tilting can readily be used.Because of these design characteristics, it is not necessary to allocate a specific margin in thepeaking factor to account for power tilt. If, for some reason, the power distribution cannot bemaintained within normal limits using control rods, then the total core power can be reduced.
4.3.3.6 Stability Evaluation
4.3.3.6.1 Xenon TransientsBoiling water reactors do not have instability problems due to xenon. This has been demonstratedby:
• Never having observed xenon instabilities in operating BWRs.
• Special tests which have been conducted on operating BWRs in an attempt to force the reactor into xenon instability.
• Calculations.
All of these indicators have proven that xenon transients are highly damped in a BWR due to thelarge negative moderator void feedback. Xenon stability analysis and experiments are reported inReference 4.3-6. Specific evaluations demonstrating the damping of xenon transients (oscillations)in the ESBWR core are carried out in Reference 4.3-8.
4.3.3.6.2 Thermal-Hydraulic StabilityThe most limiting stability condition in the ESBWR normal operating region is at the ratedpower/flow condition. Therefore, the ESBWR is designed so that the core remains stablethroughout the whole operating region, including plant startup. In order to establish a high degree ofconfidence that oscillations do not occur, conservative design criteria are imposed on the channel,core wide and regional decay ratios under all conditions of normal operation and anticipatedtransients. The ESBWR licensing basis for stability is satisfied by determining a stability criteriamap of channel, core wide, and regional decay ratios to establish margins to stability.
Because oscillations in power and flow are precluded by design, the requirements of GDC 10 aremet through the analysis for AOOs, and are automatically satisfied with respect to stability.

4-37 Revision 0October 2015
Fermi 3Updated Final Safety Analysis Report
In addition, a detect and suppress solution (DSS) is implemented to provide defense-in-depthprotection from instabilities that are not anticipated. This solution is developed based on the existingNRC approved detect and suppress solution – confirmation density (DSS-CD) with modifications ondetection algorithms and licensing basis for ESBWR application. The cycle dependent OscillationPower Range Monitor (OPRM) setpoints, used to implement this solution, are documented in theCore Operating Limits Report (COLR). The thermal-hydraulic stability is discussed in detail inAppendix 4D.
4.3.4 (Deleted)
4.3.5 COL Information
4.3-1-A Variances from Certified DesignThis COL Item is addressed in Subsection 4.3.3.1.
4.3.6 References
4.3-1 Letter from R.J. Reda (GE) to R.C. Jones (NRC), MFN-098-96, “Implementation of Improved GE Steady-State Methods,” July 2, 1996.
4.3-2 Letter from Stuart A. Richards to Glen A. Watford, “Amendment 26 to GE Licensing Topical Report NEDE–24011–P–A, GESTAR II – Implementing Improved GE Steady-State Methods (TAC No. MA6481),” November 10, 1999.
4.3-3 Global Nuclear Fuel, “GE14 Compliance With Amendment 22 of NEDE-24011-P-A (GESTAR II),” NEDC-32868P, Class III (Proprietary), Rev. 3, April 2009.
4.3-4 R. C. Stirn, “Generation of Void and Doppler Reactivity Feedback for Application to BWR Design,” NEDO–20964-A, Class I (Non-proprietary), December 1986.
4.3-5 General Electric Company, “BWR/4, 5, 6 Standard Safety Analysis Report,” Revision 2, Chapter 4, June 1977.
4.3-6 R. L. Crowther, “Xenon Considerations in Design of Large Boiling Water Reactors,” APED-5640, June 1968.
4.3-7 GE Hitachi Nuclear Energy, “TRACG Application for ESBWR Stability Analysis,”NEDE-33083 Supplement 1P-A, Class III (Proprietary), Rev. 2, B. S. Shiralkar, et al., September 2010, NEDO-33083 Supplement 1-A, Class I (Non-proprietary), Revision 2, September 2010.
4.3-8 Global Nuclear Fuel, “GE14 for ESBWR Nuclear Design Report,” NEDC-33239P-A, Class III (Proprietary), Revision 5, October 2010, NEDO-33239-A, Class I (Non-proprietary), Revision 5, October 2010.
4.3-9 Title 10, Part 50 Appendix A (10 CFR 50 Appendix A) of the Federal Code of Regulations, “General Design Criteria for Nuclear Power Plants.”

4-38 Revision 0October 2015
Fermi 3Updated Final Safety Analysis Report
4.3-10 Global Nuclear Fuel, “GE14E for ESBWR Initial Core Nuclear Design Report,” NEDC-33326-P-A, Class III (Proprietary), Revision 1, September 2010, NEDO-33326-A, Class I (Non-proprietary), Revision 1, September 2010.

4-39 Revision 0October 2015
Fermi 3Updated Final Safety Analysis Report
Table 4.3-1 (Deleted)
4-40 Revision 0October 2015
Fermi 3Updated Final Safety Analysis Report
Figure 4.3-1 Deleted)
Figure 4.3-2 (Deleted)
Figure 4.3-3 (Deleted)
Figure 4.3-4 (Deleted)
Figure 4.3-5 (Deleted)

4-41 Revision 0October 2015
Fermi 3Updated Final Safety Analysis Report
4.4 Thermal and Hydraulic DesignThis section describes the design bases and functional requirements used in the thermal andhydraulic design of the fuel, core and reactivity control system and relates these design bases tothe GDC. Subsections 4.4.1, 4.4.2, and 4.4.3 describe the design basis, methods and evaluationsof reactor core thermal hydraulics, respectively. Within each of these subsections, several topics,for example, critical power, void fraction, and pressure drop are discussed sequentially. A readermay therefore, go through Subsections 4.4.1.n, 4.4.2.n and 4.4.3.n to obtain the completeinformation on a particular topic, n.
4.4.1 Reactor Core Thermal and Hydraulic Design BasisThermal-hydraulic design of the core establishes the thermal-hydraulic safety limits for use inevaluating the safety margin in accordance with GDC 10. The thermal-hydraulic stabilityperformance of the core addressing GDC 12 is covered in Section 4.3 and Appendix 4D.
Margin to specified acceptable fuel design limits is maintained during normal steady-state operationwhen the MCPR is greater than the required OLMCPR and the Linear Heat Generation Rate(LHGR) is maintained below the maximum LHGR (MLHGR) limit(s). The steady-state OLMCPRand MLHGR limits are determined by analysis of the most severe AOOs, discussed in Section 15.2,to accommodate uncertainties and provide reasonable assurance that no fuel damage resultsduring AOOs.
4.4.1.1 Critical Power BasesThe objective for normal operation and AOOs is to maintain nucleate boiling and thus avoid atransition to film boiling. Limits are specified to maintain adequate margin to the onset of the boilingtransition. The figure of merit utilized for plant operation is the CPR. The CPR is the ratio of thebundle power at which some point within the assembly experiences onset of boiling transition to theoperating bundle power. Thermal margin is stated in terms of the minimum value of the CPR thatcorresponds to the most limiting fuel assembly in the core. The design requirement is based on astatistical analysis such that for AOOs at least 99.9% of the fuel rods would be expected to avoidboiling transition (References 4.4-8 and 4.4-9).
4.4.1.1.1 Fuel Cladding Integrity Safety Limit BasesGDC 10 requires, and safety limits ensure, that specified acceptable fuel design limits are notexceeded during steady-state operation, normal operational transients, and AOOs. Since theparameters that result in fuel damage are not directly observable during reactor operation, thethermal and hydraulic conditions that result in the onset of boiling transition have been used to markthe beginning of the region in which fuel damage could occur. The Fuel Cladding Integrity SafetyLimit (FCISL) is set such that no significant fuel damage is calculated to occur during normaloperation and AOOs. Although it is recognized that the onset of boiling transition would not result indamage to BWR fuel rods, a calculated fraction of rods expected to avoid boiling transition has
4-42 Revision 0October 2015
Fermi 3Updated Final Safety Analysis Report
been adopted as a convenient limit. The FCISL is defined as the fraction (%) of total fueled rodsthat are expected to avoid boiling transition during normal operation and AOOs. A value of 99.9%provides assurance that specified acceptable fuel design limits are met.
4.4.1.1.2 MCPR Operating Limit Calculation BasesA core-specific OLMCPR is established to provide adequate assurance that the FCISL for that plantis not exceeded during normal operation and any AOO. By operating with the MCPR at or abovethe OLMCPR, the FCISL for that plant is not exceeded during normal operation and AOOs. Thisoperating requirement is obtained by statistically combining the maximum ΔCPR/ICPR (the changein CPR through the transient divided by the initial CPR) value for the most limiting AOO fromconditions postulated to occur at the plant with the uncertainties associated with plant initialconditions and modeling of the transient ΔCPR.
4.4.1.1.3 MCPR Safety Limit BasesA core-specific safety limit MCPR (SLMCPR) is established to provide adequate assurance that99.9% of the total fuel rods are expected to avoid boiling transition during steady-state operation.The SLMCPR is a lower operating bound on the steady-state MCPR. This operating requirement isobtained by removing the delta CPR effect of the most limiting AOO from the OLMCPR.
4.4.1.2 Void Fraction Distribution BasesThe void fraction in a BWR fuel bundle has a strong effect on the nuclear flux and powerdistribution. Therefore, accurate prediction of the void fraction is important for evaluation of theperformance of the BWR reactor and fuel. In design and licensing calculations the void fraction isevaluated using empirical correlations based on the characteristic dimensions of the fuel bundleand hydraulic properties of the two-phase flow in the fuel bundle.
4.4.1.3 Core Pressure Drop and Hydraulic Loads BasesThe accuracy on the prediction of core pressure drop is essential to the modeling of fuel and coreinlet flow and hydraulic loads. Further details are given in Subsection 4.4.2.3.
4.4.1.4 Core Coolant Flow Distribution BasesBased on the prediction of core pressure drop, the distribution of flow into the fuel channels and thecore bypass regions are calculated. The core coolant flow distribution forms the basis of theprediction of steady-state and transient critical power and void fraction.
4.4.1.5 Fuel Heat Transfer BasesThe model must accurately predict heat transfer between the coolant, fuel rod surface, cladding,gap, and fuel pellet in the evaluation of core and fuel safety criteria. Standard and well-establishedheat transfer correlations between the coolant and the rod surfaces are used. Further details aregiven in Subsection 4.4.2.5.
4-43 Revision 0October 2015
Fermi 3Updated Final Safety Analysis Report
4.4.1.6 Maximum Linear Heat Generation Rate BasesThe Maximum Linear Heat Generation Rate (MLHGR) bases are described in Section 4.2. Theadequacy of MLHGR limits are evaluated for the most severe AOOs to provide reasonableassurance that no fuel damage results during AOOs.
4.4.1.7 Summary of Design BasesThe steady-state operating limits have been established to ensure that the design bases aresatisfied for the most severe AOO, discussed in Section 15.2. The effects of the limiting AOO do notresult in any violation of the acceptance criteria set forth in Subsection 15.0.3.1, for which the fuel,the reactor pressure vessel or the containment are designed. Therefore, these barriers maintaintheir integrity and function as designed.
4.4.2 Reactor Core Thermal and Hydraulic MethodsThis section contains a description of the application of NRC-approved methods to the ESBWR.Changes may be made to these techniques provided that NRC-approved (including applicability toESBWR) methods, models, and application methodologies are used.
4.4.2.1 Critical Power MethodsThe evaluations of the critical power methods for ESBWR are discussed in Subsection 4.4.3.
4.4.2.1.1 Bundle Critical Power Performance MethodThe bundle critical power performance methodology is described in References 4.4-8 and 4.4-16.These references describe the form of the critical power correlation, i.e., the GEXL correlation, andthe experimental qualification that demonstrates the GEXL correlation adequately predicts thebundle critical power over a wide range of fluid parameters, axial power shapes and heated lengths.Each fuel bundle design has a specific set of correlation coefficients developed from full-scale testdata. The specific GEXL correlation applied in the analysis of GE14E for ESBWR is designatedGEXL14. The applicability of GEXL14 to GE14E is addressed in Reference 4.4-12.
4.4.2.1.2 Fuel Cladding Integrity Safety Limit Statistical MethodThe statistical analysis utilizes a model of the core that simulates the core monitoring system. Themodel produces a CPR map of the core based on steady-state uncertainties defined in Table 5-1 ofReference 4.4-12. This is coupled with the TRACG ΔCPR/ICPR results to develop the OLMCPR.Details of the procedure are documented in Section 5.13 of Reference 4.4-12 and Subsection 4.6.3of Reference 4.4-9. Random Monte Carlo selections of all operating parameters based on theuncertainty ranges of manufacturing tolerances, uncertainties in measurement of core operatingparameters, calculation uncertainties, the uncertainty in the calculation of the transient ΔCPR/ICPRand statistical uncertainty associated with the critical power correlations are imposed on theanalytical representation of the core and the resulting bundle critical power ratios are calculated.
4-44 Revision 0October 2015
Fermi 3Updated Final Safety Analysis Report
The number of rods expected to avoid boiling transition is determined for each random Monte Carlotrial. The initial MCPR during normal operation corresponds to the OLMCPR when the FCISL(99.9% of the rods are expected to avoid boiling transition) is met for a statistical combination of thetrials. Reference 4.4-9 defines the statistical combination method.
4.4.2.1.3 MCPR Operating Limit Calculation MethodAll ESBWR AOO events are analyzed using the TRACG model described in Reference 4.4-10. Thecore thermal-hydraulic models have been qualified in Reference 4.4-11. Uncertainties have beendeveloped for all high and some medium ranked model parameters. The model uncertainties aredocumented in Reference 4.4-9. The ΔCPR/ICPR is calculated in accordance with Reference 4.4-9.
4.4.2.1.4 MCPR Safety Limit Calculation MethodThe MCPR Safety Limit is calculated in accordance with Section 5.14 of Reference 4.4-12.
4.4.2.2 Void Fraction Distribution MethodsThe empirical correlations used for the calculation of the void fraction are the GE Hitachi voidfraction correlation that is used in the 3D core simulator and steady state thermal hydrauliccalculations and the correlations for the interfacial shear that is used in TRACG. The GE Hitachivoid fraction model is described in Reference 4.4-15, and details on the qualification are containedin Attachment A to Reference 4.4-13. The TRACG void fraction model is described in Reference4.4-10 and details on the qualification are contained in Reference 4.4-11.
4.4.2.3 Core Pressure Drop and Hydraulic Loads MethodsThe total bundle pressure drop is defined as the sum of four components: friction, elevation,acceleration, and local losses. In these models, the bundle is also divided into control volumes overwhich the four components of total pressure drop are evaluated separately, thus allowing to capturethe effects on pressure drop of axially variable geometry parameters such as flow area, hydraulicdiameter, wetted/heated perimeters, heat flux, and spacer elevations. The hydraulic diameter isdefined as four times the axial flow area divided by the wetted perimeter, which includes the fuelrod, channel inner wall, and water rod perimeters. The geometry of heated surfaces consists of thenumber of fuel rods and the fuel rod diameter in a fuel assembly. For fuel assembly types withpartial length rods, the number of partial length rods and the partial length rod length(s) are alsoaccounted for in the definition of fuel assembly hydraulic diameter.
The TRACG methods for core pressure drop modeling are described in Reference 4.4-10. TheTRACG hydraulic formulation for core pressure drop is identical to the model utilized in the coredesign analysis with the exception of the acceleration pressure drop component. The modelsutilized in the core design analysis are as follows:
4.4.2.3.1 Friction Pressure DropFriction pressure drop is calculated with a basic model as follows:
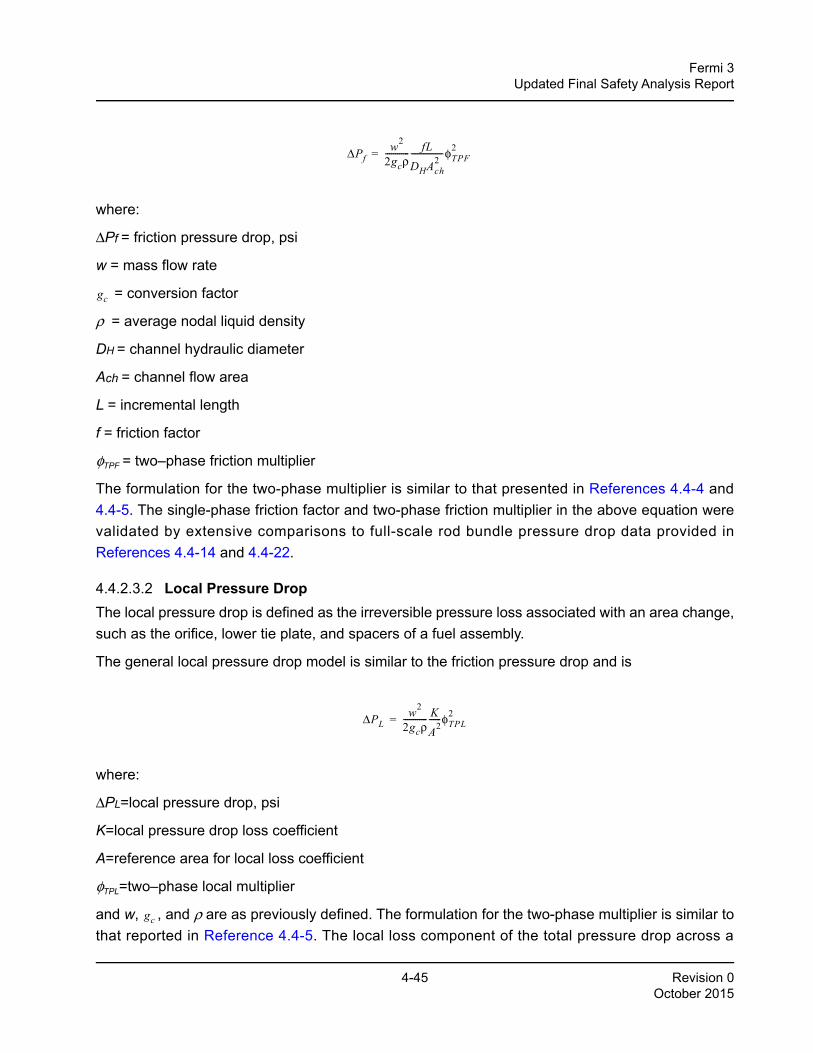
4-45 Revision 0October 2015
Fermi 3Updated Final Safety Analysis Report
where:
ΔPf = friction pressure drop, psi
w = mass flow rate
= conversion factor
ρ = average nodal liquid density
DH = channel hydraulic diameter
Ach = channel flow area
L = incremental length
f = friction factor
φTPF = two–phase friction multiplier
The formulation for the two-phase multiplier is similar to that presented in References 4.4-4 and4.4-5. The single-phase friction factor and two-phase friction multiplier in the above equation werevalidated by extensive comparisons to full-scale rod bundle pressure drop data provided inReferences 4.4-14 and 4.4-22.
4.4.2.3.2 Local Pressure DropThe local pressure drop is defined as the irreversible pressure loss associated with an area change,such as the orifice, lower tie plate, and spacers of a fuel assembly.
The general local pressure drop model is similar to the friction pressure drop and is
where:
ΔPL=local pressure drop, psi
K=local pressure drop loss coefficient
A=reference area for local loss coefficient
φTPL=two–phase local multiplier
and w, , and ρ are as previously defined. The formulation for the two-phase multiplier is similar tothat reported in Reference 4.4-5. The local loss component of the total pressure drop across a
ΔPfw2
2gcρ------------ fL
DHAch2
----------------φTPF2=
gc
ΔPLw2
2gcρ------------ K
A2------φTPL
2=
gc
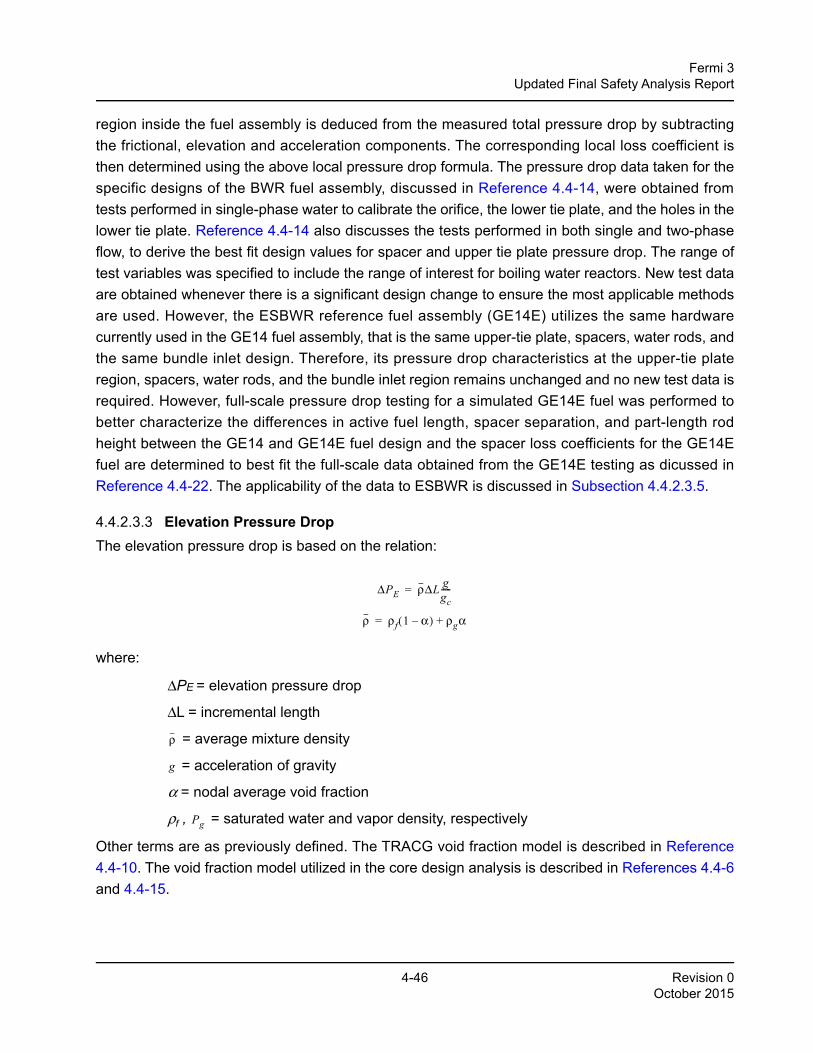
4-46 Revision 0October 2015
Fermi 3Updated Final Safety Analysis Report
region inside the fuel assembly is deduced from the measured total pressure drop by subtractingthe frictional, elevation and acceleration components. The corresponding local loss coefficient isthen determined using the above local pressure drop formula. The pressure drop data taken for thespecific designs of the BWR fuel assembly, discussed in Reference 4.4-14, were obtained fromtests performed in single-phase water to calibrate the orifice, the lower tie plate, and the holes in thelower tie plate. Reference 4.4-14 also discusses the tests performed in both single and two-phaseflow, to derive the best fit design values for spacer and upper tie plate pressure drop. The range oftest variables was specified to include the range of interest for boiling water reactors. New test dataare obtained whenever there is a significant design change to ensure the most applicable methodsare used. However, the ESBWR reference fuel assembly (GE14E) utilizes the same hardwarecurrently used in the GE14 fuel assembly, that is the same upper-tie plate, spacers, water rods, andthe same bundle inlet design. Therefore, its pressure drop characteristics at the upper-tie plateregion, spacers, water rods, and the bundle inlet region remains unchanged and no new test data isrequired. However, full-scale pressure drop testing for a simulated GE14E fuel was performed tobetter characterize the differences in active fuel length, spacer separation, and part-length rodheight between the GE14 and GE14E fuel design and the spacer loss coefficients for the GE14Efuel are determined to best fit the full-scale data obtained from the GE14E testing as dicussed inReference 4.4-22. The applicability of the data to ESBWR is discussed in Subsection 4.4.2.3.5.
4.4.2.3.3 Elevation Pressure DropThe elevation pressure drop is based on the relation:
where:
ΔPE = elevation pressure drop
ΔL = incremental length
= average mixture density
= acceleration of gravity
α = nodal average void fraction
ρf , = saturated water and vapor density, respectively
Other terms are as previously defined. The TRACG void fraction model is described in Reference4.4-10. The void fraction model utilized in the core design analysis is described in References 4.4-6and 4.4-15.
ΔPE ρΔL ggc-----=
ρ ρf 1 α–( ) ρgα+=
ρ
g
Pg
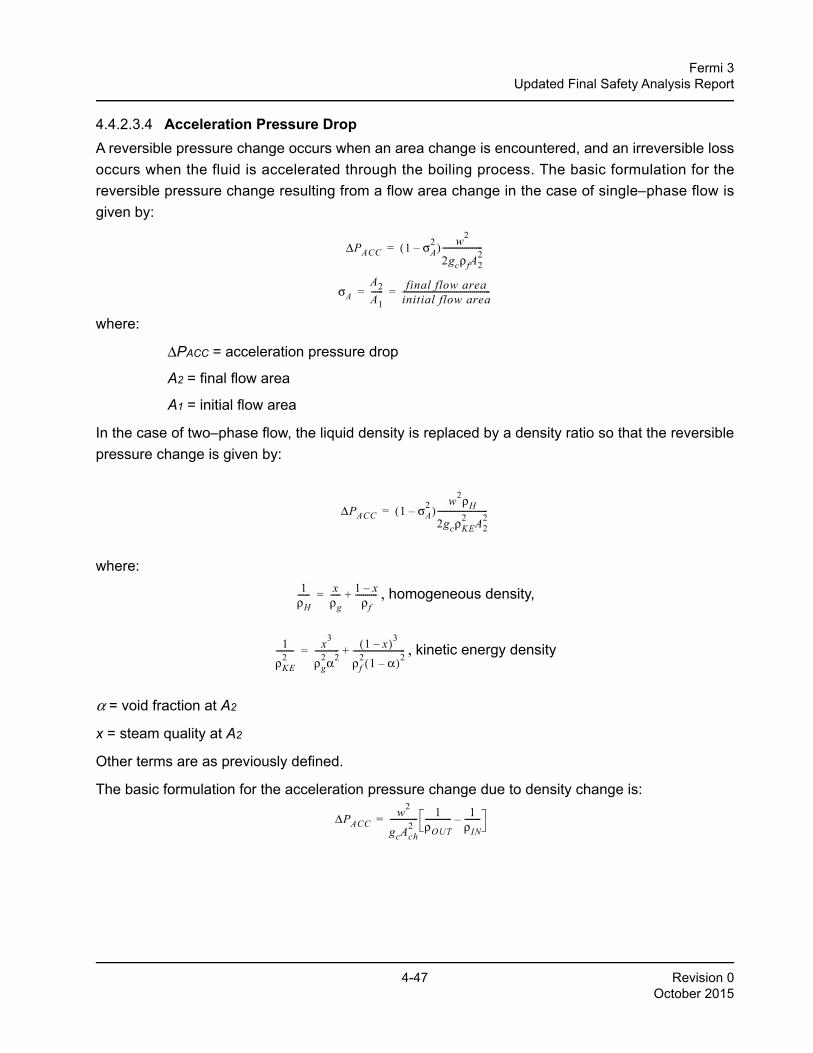
4-47 Revision 0October 2015
Fermi 3Updated Final Safety Analysis Report
4.4.2.3.4 Acceleration Pressure DropA reversible pressure change occurs when an area change is encountered, and an irreversible lossoccurs when the fluid is accelerated through the boiling process. The basic formulation for thereversible pressure change resulting from a flow area change in the case of single–phase flow isgiven by:
where:
ΔPACC = acceleration pressure drop
A2 = final flow area
A1 = initial flow area
In the case of two–phase flow, the liquid density is replaced by a density ratio so that the reversiblepressure change is given by:
where:
, homogeneous density,
, kinetic energy density
α = void fraction at A2
x = steam quality at A2
Other terms are as previously defined.
The basic formulation for the acceleration pressure change due to density change is:
ΔPACC 1 σA2–( ) w2
2gcρfA22
--------------------=
σAA2A1------ final flow area
initial flow area--------------------------------------------= =
ΔPACC 1 σA2–( )
w2ρH2gcρKE
2 A22
-------------------------=
1ρH------ x
ρg----- 1 x–
ρf-----------+=
1ρKE
2--------- x3
ρg2α2
------------ 1 x–( )3
ρf2 1 α–( )2
--------------------------+=
ΔPACCw2
gcAch2
-------------- 1ρOUT------------- 1
ρIN--------–=
4-48 Revision 0October 2015
Fermi 3Updated Final Safety Analysis Report
where ρ is either the homogeneous density, ρH, or the momentum density, ρM
ρ is evaluated at the inlet and outlet of each axial node. Other terms are as previously defined. Thetotal acceleration pressure drop in boiling water reactors is on the order of a few percent of the totalpressure drop. Note that the TRACG model is different for the acceleration pressure drop modeling(Reference 4.4-10).
4.4.2.3.5 Total Pressure Drop QualificationThe GE14 pressure drop is characterized in Reference 4.4-14. The loss coefficients are qualifiedagainst pressure drop test data. The test range includes the operating conditions for the ESBWR.The ESBWR reference fuel assembly (GE14E) utilizes the same hardware currently used in theGE14 fuel assembly, that is the same upper-tie plate, spacers, water rods, and the same bundleinlet design. Therefore, its pressure drop characteristics at the upper-tie plate region, spacers,water rods, and the bundle inlet region remains unchanged. However, full-scale pressure droptesting for a simulated GE14E fuel was performed to better characterize the differences in activefuel length, spacer separation, and part-length rod height between the GE14 and GE14E fueldesign and to qualify the spacer loss coefficients for the ESBWR application. Test results andassociated analysis are provided in Reference 4.4-22. Because operating conditions and geometryare compatible, the loss coefficients for the upper-tie plate, water rods, and bundle inlet based onthe GE14 pressure drop data can be applied to the ESBWR. The spacer loss coefficients for theGE14E fuel are determined to best fit the full-scale data obtained from the GE14E testing. Theuncertainty in the core pressure drop is defined by Reference 4.4-9 Subsection 4.4.1 item C23.
4.4.2.3.6 Hydraulic LoadsHydraulic loads are determined based on the reactor internal pressure differences (RIPD)discussed in Subsection 3.9.5.3. The TRACG computer code is used to analyze the transientconditions within the reactor vessel following AOOs, infrequent events and accidents (for example,LOCA).
4.4.2.4 Core Coolant Flow Distribution MethodsThe core coolant flow distribution methods used in TRACG are described in Reference 4.4-10Chapters 6 and 7. TRACG treats all fuel channels as one-dimensional (axial) components, but thevessel is modeled as a three-dimensional component. Hence, the pressure drop across two planesin the vessel is the same at all radial and azimuthal locations if the geometry of the components inthe vicinity of these planes has radial and azimuthal symmetry. Otherwise, this pressure differentialdisplays some (locally) radial and azimuthal non-uniformity.
1ρM------- x2
ρgα---------- 1 x–( )2
ρf 1 α–( )----------------------+=
4-49 Revision 0October 2015
Fermi 3Updated Final Safety Analysis Report
The flow distribution to the fuel assemblies and bypass flow paths in the core simulator model iscalculated on the assumption that the pressure drop across all fuel assemblies and bypass flowpaths is the same. The bundle pressure drop evaluation includes frictional, local, elevation, andacceleration losses (Subsections 4.4.2.3.1 - 4.4.2.3.4). The pressure drop methodology has beenqualified to the whole range of test data discussed in References 4.4-14 and 4.4-22. The core inletflow is an input to the core simulator model. The value used in the core design analysis isdetermined based on the TRACG prediction of the natural circulation core inlet flow. In operation,the core monitoring system determines core inlet flow based on plant instrumentation (Chapter 7).
The bypass flow methodology is described in Reference 4.4-10 Subsection 7.5.1. The samemethodology supports the core simulator model.
4.4.2.5 Fuel Heat Transfer MethodsThe Jens-Lottes (Reference 4.4-7) heat transfer correlation is used in fuel design to determine thecladding-to-coolant heat transfer coefficients for nucleate boiling. For the single-phase convectionor liquid region, the well-established Dittus-Boelter correlation is used. The methodology for fuelcladding, gap and pellet heat transfer is described in Section 4.2.
4.4.2.6 Maximum Linear Heat Generation Rate MethodsThe Maximum Linear Heat Generation Rate (MLHGR) methods are described in Section 4.2.Margin to design limits for circumferential cladding strain and centerline fuel temperature isevaluated for AOOs in accordance with Reference 4.4-9 Subsection 4.6.2.1.
4.4.3 Reactor Core Thermal and Hydraulic EvaluationsTypical thermal-hydraulic parameters for the ESBWR are compared to those for a typical BWR/6plant and the ABWR in Table 4.4-1a and Table 4.4-1b.
4.4.3.1 Critical Power Evaluations
4.4.3.1.1 Bundle Critical Power Performance EvaluationThe bundle critical power performance results are described in Reference 4.4-12. This referenceutilizes full-scale test data to support the development of the critical power correlation for ESBWR.Compliance to steady-state MCPR operating limits is demonstrated for a typical simulation of anequilibrium cycle in Appendix 4A.
4.4.3.1.2 Fuel Cladding Integrity Safety Limit EvaluationThe Fuel Cladding Integrity Safety Limit (FCISL) is defined as 99.9% of the total fueled rods areexpected to avoid boiling transition during normal operation and AOOs. Section 6 of Reference4.4-12 provides a summary of the basis for the representative operating limit MCPR used for theESBWR to protect the FCISL. Section 5 of Reference 4.4-12 provides the basis for theuncertainties specific to the ESBWR used in this evaluation.
4-50 Revision 0October 2015
Fermi 3Updated Final Safety Analysis Report
4.4.3.1.3 MCPR Operating Limit EvaluationThe MCPR Operating Limit ΔCPR/ICPR results are described in Section 15.2. The MCPROperating Limit development including incorporation of the Fuel Cladding Integrity Safety Limituncertainties is described in Reference 4.4-12.
4.4.3.1.4 MCPR Safety Limit EvaluationThe ESBWR representative MCPR safety limit is in Section 6 of Reference 4.4-12.
4.4.3.2 Void Fraction Distribution EvaluationsThe axial distribution of void fractions for an average power channel and a conservative hot channelas predicted by TRACG are given in Table 4.4-2a and Table 4.4-2b. The core average andmaximum exit values are also provided. Similar distributions for steam quality are given in Table4.4-3a and Table 4.4-3b. The axial power distribution used to produce these tables is given in Table4.4-4a and Table 4.4-4b. The axial void and power distributions for the channel with the highest exitvoid fraction for the core reference loading pattern (Appendix 4A) are given in Table 4.4-5.
The expected operating void fraction for the ESBWR is within the qualification basis of the voidfraction methods. The void fractions in Tables 4.4-2a and 4.4-2b are based on TRACG. The hotchannel in Table 4.4-2b is a hypothetical channel with a bundle power (radial power) set so as toresult in a CPR of 1.20. This hot channel has a maximum void fraction of 0.93. This is conservativecompared to the assumed OLMCPR for ESBWR. The void fraction qualification (Reference 4.4-11)contains void fractions in excess of 0.93 and covers the void fraction range expected for normalsteady-state operation as well as AOOs. The channel pressure drop qualification is discussed inSubsection 4.4.2.3.5. The core simulator maximum exit void fraction, for the steady-state simulationin Appendix 4A, is 0.89 as shown in Table 4.4-5. The results presented in Tables 4.4-2a to 4.4-5correspond to the reference equilibrium core discussed in Section 4.3 and Appendix 4A. Similarresults corresponding to the initial core, described in Reference 4.4-20, are presented in Reference4.4-17.
The TRACG AOO calculations in Chapter 15 include the consideration of uncertainty in the voidfraction.
During steady-state operations at full-power, nominal conditions, the bypass voiding at the highestLPRM (Level D) is less than 5%.
4.4.3.3 Core Pressure Drop and Hydraulic Loads EvaluationsThe expected operating pressure for the ESBWR is within the qualification basis of the pressuredrop methods. The TRACG AOO calculations in Chapter 15 include the consideration ofuncertainty in the channel pressure drop. The statistical OLMCPR method also assumes pressuredrop uncertainty. The impact of uncertainty in core pressure drop is included in the results provided
4-51 Revision 0October 2015
Fermi 3Updated Final Safety Analysis Report
in Reference 4.4-12. Evaluations of hydraulic loads for the reactor internals and the fuel assemblyare discussed in Subsections 3.9.5.4 and 4.2.3, respectively.
4.4.3.4 Core Coolant Flow Distribution EvaluationsThe impact of uncertainty in core flow distribution is included in the results provided in Reference4.4-12.
4.4.3.5 Fuel Heat Transfer EvaluationsThe fuel heat transfer models are included in evaluations described in Section 4.2 and Chapter 15.
4.4.3.6 Maximum Linear Heat Generation Rate EvaluationsThe AOO results are described in Chapter 15 Section 15.2. Compliance to steady-state MLHGRlimits is demonstrated for a typical simulation of an equilibrium cycle in Reference 4.4-21.
4.4.4 Description of the Thermal–Hydraulic Design of the Reactor Coolant System
4.4.4.1 Plant Configuration Data
4.4.4.1.1 Reactor Coolant System ConfigurationThe Reactor Coolant System (RCS) is described in Chapter 5. The ESBWR reactor coolant systemis shown in Figure 5.1-1. The ESBWR design is similar to that of the operating BWRs, except thatthe recirculation pumps and associated piping are eliminated. Circulation of the reactor coolantthrough the ESBWR core is accomplished via natural circulation. The natural circulation flow ratedepends on the difference in water density between the down comer region and the core region.The core flow varies according to the power level, as the density difference changes with changesin power levels. Therefore, a core power-flow map is only a single line and there is no active controlof the core flow at any given power level.
4.4.4.1.2 Reactor Coolant System Thermal-Hydraulic DataThe steady-state distribution of temperature, pressure and flow rate for each flow path in theReactor Coolant System is shown in Figure 1.1-3a.
4.4.4.1.3 Reactor Coolant System Geometric DataVolumes of regions and components within the reactor vessel are shown in Figure 5.1-1. Table4.4-6 provides the flow path length, height, liquid level, elevation of bottom of volume, and flow areafor each major flow path volume within the reactor vessel.
4.4.4.2 Operating Restrictions on PumpsNot Applicable to the ESBWR. The ESBWR is a natural circulation design.
4-52 Revision 0October 2015
Fermi 3Updated Final Safety Analysis Report
4.4.4.3 Power/Flow Operating MapThe core power-flow map is only a single line and there is no active control of the core flow at agiven power level. To provide additional operational flexibility, a core power-feedwater temperatureoperating map or domain is developed. The system hardware and control system required todevelop and implement such an operating domain is discussed in Subsections 10.4.7.2.2.3 and7.7.3, respectively. The typical operating domain of the ESBWR in the core power-feedwatertemperature map is shown in Figure 4.4-1. The details are discussed in Reference 4.4-18.
4.4.4.4 Temperature-Power Operating MapThe temperature-power operating map, typically employed for Pressurized Water Reactor (PWR),is not applicable to the ESBWR. However, as mentioned in Subsection 4.4.4.3 above, apower-feedwater temperature operating map has been developed for the ESBWR.
4.4.4.5 Load Following CharacteristicsLoad following is implemented through the Plant Automation System (PAS). This is described inChapter 7 Subsection 7.7.4.
4.4.4.6 Thermal-Hydraulic Characteristics Summary TablesThe thermal-hydraulic characteristics are provided in Table 4.4-1a, Table 4.4-1b and Table 4.4-6.The axial power distributions for the TRACG average and TRACG hot channels are shown in Table4.4-4a and Table 4.4-4b. The axial distribution of void fractions for the TRACG average powerchannel and the TRACG hot channel are given in Table 4.4-2a and Table 4.4-2b. The core averageand core maximum exit void fractions are also provided in Table 4.4-1a and Table 4.4-1b. Similardistributions for coolant flow quality are provided in Table 4.4-3a and Table 4.4-3b.
4.4.4.7 Inadequate Core Cooling Monitoring SystemThe issue of an Inadequate Core Cooling monitoring system is discussed in Appendix 1A(Response to TMI Related Matters), specifically, TMI Item II.F.2 in Table 1A-1 (TMI Action PlanItems) addresses this issue related to the ESBWR.
4.4.5 Loose-Parts Monitoring SystemThe Loose Parts Monitoring System (LPMS) has been withdrawn from the ESBWR designcertification; therefore Regulatory Guide 1.133 is no longer applicable to the ESBWR design. Thisdecision is supported by information documented in the License Topical Report, “RegulatoryRelaxation for BWR Loose Parts Monitoring Systems,” written by the BWR Owner’s Group(Reference 4.4-19).
The ESBWR design and operation minimizes the potential for loose parts in the reactor pressurevessel. The ESBWR design takes into consideration material selection for critical components, andutilizes FIV testing and temporary strainers during startup to prevent loose parts from entering the

4-53 Revision 0October 2015
Fermi 3Updated Final Safety Analysis Report
reactor vessel. Foreign Materials Exclusion (FME) programs and underwater vessel inspections areemployed to prevent loose parts from entering the reactor vessel. The ESBWR is capable ofperforming its safety-related functions without the LPMS.
4.4.6 Testing and VerificationThe testing and verification techniques to be used to assure that the planned thermal and hydraulicdesign characteristics of the core have been provided, and remain within required limits throughoutcore lifetime, are discussed in Chapter 14.
4.4.7 COL InformationNone.
4.4.7.1 (Deleted)
4.4.8 References
4.4-1 (Deleted).
4.4-2 General Electric Company, “Core Flow Distribution in a General Electric Boiling Water Reactor as Measured in Quad Cities Unit 1,” NEDO-10722A, Class I (Non-proprietary), August 1976.
4.4-3 General Electric Company, “Brunswick Steam Electric Plant Unit 1 Safety Analysis Report for Plant Modifications to Eliminate Significant In-Core Vibrations,” NEDO-21215, Class I (Non-proprietary), April 1976.
4.4-4 R.C. Martinelli and D.E. Nelson, “Prediction of Pressure Drops During Forced Convection Boiling of Water,” ASME Trans., 70, 695-702, 1948.
4.4-5 C.J. Baroczy, “A Systematic Correlation for Two-Phase Pressure Drop,” Heat Transfer Conference (Los Angeles), AIChE, reprint No. 37, 1965.
4.4-6 N. Zuber and J. A. Findlay, “Average Volumetric Concentration in Two-Phase Flow Systems,” Transactions of the ASME Journal of Heat Transfer, November 1965.
4.4-7 W. H. Jens and P. A. Lottes, “Analysis of Heat Transfer, Burnout, Pressure Drop and Density Data for High Pressure Water,” USAEC Report ANL-4627, 1951.
4.4-8 General Electric Company, “General Electric BWR Thermal Analysis Basis (GETAB): Data Correlation and Design Application,” NEDO-10958-A, Class I (Non-proprietary), January 1977.
4.4-9 GE Nuclear Energy, “TRACG Application for ESBWR,” NEDC-33083P-A Revision 1, Class III (Proprietary), September 2010 and NEDO-33083-A, Revision 1, Class I (Non-proprietary), September 2010.
4.4-10 GE Hitachi Nuclear Energy, “Licensing Topical Report TRACG Model Description,” NEDE-32176P, Revision 4, Class III (Proprietary), January 2008, NEDO-32176, Revision 4, Class I (Non-proprietary), January 2008.

4-54 Revision 0October 2015
Fermi 3Updated Final Safety Analysis Report
4.4-11 GE Nuclear Energy, “Licensing Topical Report TRACG Qualification,” NEDE-32177P, Revision 3, Class III (Proprietary), August 2007 and NEDO-32177, Revision 3, Class I (Non-proprietary), August 2007.
4.4-12 Global Nuclear Fuel, “GE14 for ESBWR-Critical Power Correlation, Uncertainty, and OLMCPR Development,” NEDC-33237P-A Revision 5, Class III (Proprietary), September 2010, and NEDO-33237-A, Revision5, Class I (Non-proprietary), September 2010.
4.4-13 GE Nuclear Energy, “Methodology and Uncertainties for Safety Limit MCPR Evaluations,” NEDC–32601P-A, Class III (Proprietary), August 1999 and NEDO-32601-A, Class I (Non-proprietary), August 1999.
4.4-14 Global Nuclear Fuel, “GE14 Pressure Drop Characteristics,” NEDC-33238P, Class III (Proprietary), December 2005 and NEDO-33238, Class I (Non-proprietary), December 2005.
4.4-15 GE Nuclear Energy, “TASC-03A, A Computer Program for Transient Analysis of a Single Channel,” NEDC-32084P-A, Revision 2, Class III (Proprietary), July 2002 and NEDO-32084-A, Revision 2, Class I (Non-proprietary), September 2002.
4.4-16 Letter, J.S. Charnley (GE) to C. O. Thomas (NRC), Amendment 15 to General Electric Licensing Topical Report NEDE-24011-P-A, January 25, 1986.
4.4-17 GE Hitachi Nuclear Energy, “ESBWR Initial Core Transient Analysis,” NEDO-33337, Class I (Non-proprietary), Revision 1, April 2009.
4.4-18 GE Hitachi Nuclear Energy, “ESBWR Feedwater Temperature Operating Domain Transient and Accident Analysis,” NEDO-33338, Class I (Non-proprietary), Revision 1, May 2009.
4.4-19 GE Nuclear Energy, “Regulatory Relaxation for BWR Loose Parts Monitoring Systems,” BWR Owner’s Group Licensing Topical Report NEDC-32975P-A, Class III (Proprietary), Revision 0, February 2001.
4.4-20 Global Nuclear Fuel, “GE14E for ESBWR Initial Core Nuclear Design Report,” NEDC-33326P-A, Class III (Proprietary), Revision 1, September 2010, NEDO-33326-A, Class I (Non-proprietary), Revision 1, September 2010.
4.4-21 Global Nuclear Fuel, “GE14 for ESBWR Nuclear Design Report,” NEDE-33239P-A, Class III (Proprietary), Revision 5, October 2010, NEDO-33239-A, Class I (Non proprietary), Revision 5, October 2010.
4.4-22 Global Nuclear Fuel, “Full-Scale Pressure Drop Testing for a Simulated GE14E Fuel Bundle,” NEDC-33456P, Class III (Proprietary), Revision 0, March 2009, NEDO-33456, Class I (Non-proprietary), Revision 0, March 2009.
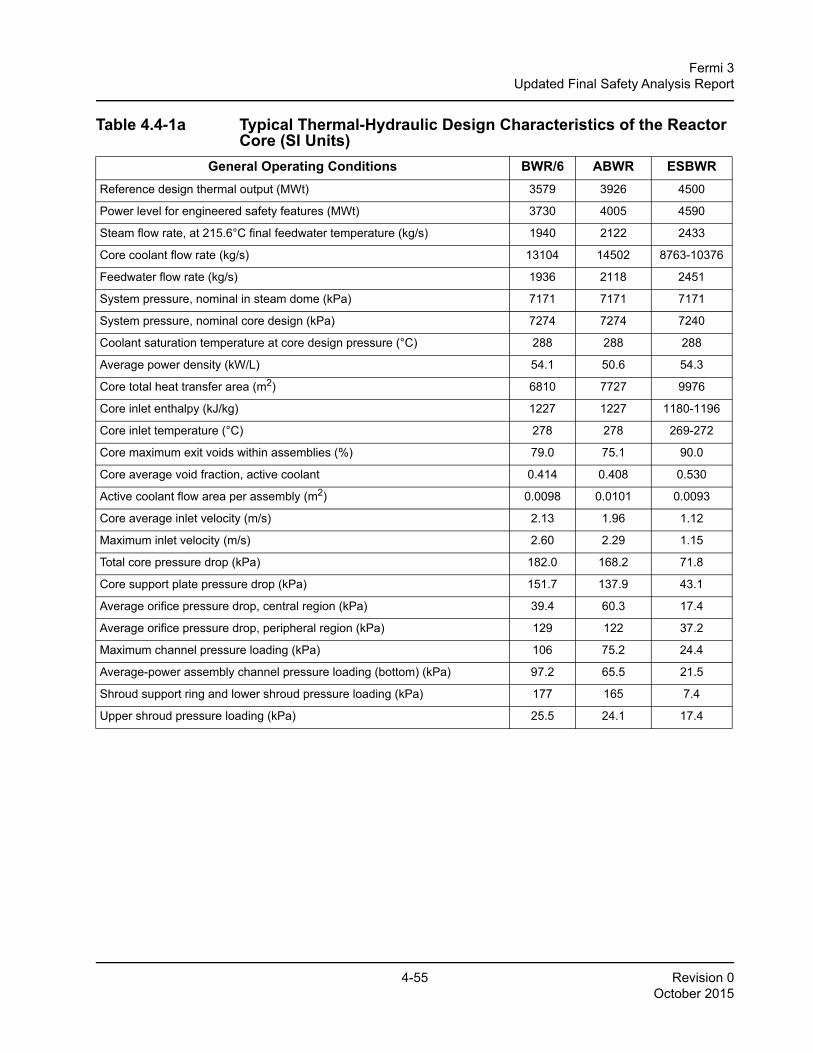
4-55 Revision 0October 2015
Fermi 3Updated Final Safety Analysis Report
Table 4.4-1a Typical Thermal-Hydraulic Design Characteristics of the Reactor Core (SI Units)
General Operating Conditions BWR/6 ABWR ESBWRReference design thermal output (MWt) 3579 3926 4500
Power level for engineered safety features (MWt) 3730 4005 4590
Steam flow rate, at 215.6°C final feedwater temperature (kg/s) 1940 2122 2433
Core coolant flow rate (kg/s) 13104 14502 8763-10376
Feedwater flow rate (kg/s) 1936 2118 2451
System pressure, nominal in steam dome (kPa) 7171 7171 7171
System pressure, nominal core design (kPa) 7274 7274 7240
Coolant saturation temperature at core design pressure (°C) 288 288 288
Average power density (kW/L) 54.1 50.6 54.3
Core total heat transfer area (m2) 6810 7727 9976
Core inlet enthalpy (kJ/kg) 1227 1227 1180-1196
Core inlet temperature (°C) 278 278 269-272
Core maximum exit voids within assemblies (%) 79.0 75.1 90.0
Core average void fraction, active coolant 0.414 0.408 0.530
Active coolant flow area per assembly (m2) 0.0098 0.0101 0.0093
Core average inlet velocity (m/s) 2.13 1.96 1.12
Maximum inlet velocity (m/s) 2.60 2.29 1.15
Total core pressure drop (kPa) 182.0 168.2 71.8
Core support plate pressure drop (kPa) 151.7 137.9 43.1
Average orifice pressure drop, central region (kPa) 39.4 60.3 17.4
Average orifice pressure drop, peripheral region (kPa) 129 122 37.2
Maximum channel pressure loading (kPa) 106 75.2 24.4
Average-power assembly channel pressure loading (bottom) (kPa) 97.2 65.5 21.5
Shroud support ring and lower shroud pressure loading (kPa) 177 165 7.4
Upper shroud pressure loading (kPa) 25.5 24.1 17.4
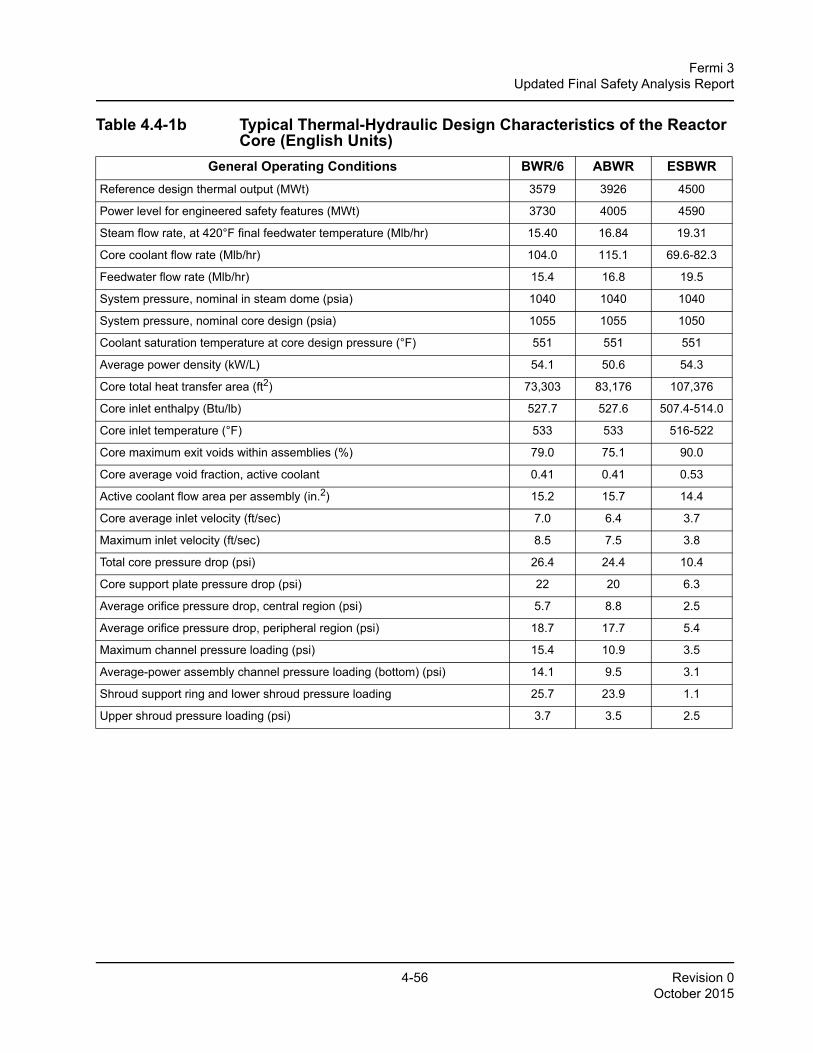
4-56 Revision 0October 2015
Fermi 3Updated Final Safety Analysis Report
Table 4.4-1b Typical Thermal-Hydraulic Design Characteristics of the Reactor Core (English Units)
General Operating Conditions BWR/6 ABWR ESBWRReference design thermal output (MWt) 3579 3926 4500
Power level for engineered safety features (MWt) 3730 4005 4590
Steam flow rate, at 420°F final feedwater temperature (Mlb/hr) 15.40 16.84 19.31
Core coolant flow rate (Mlb/hr) 104.0 115.1 69.6-82.3
Feedwater flow rate (Mlb/hr) 15.4 16.8 19.5
System pressure, nominal in steam dome (psia) 1040 1040 1040
System pressure, nominal core design (psia) 1055 1055 1050
Coolant saturation temperature at core design pressure (°F) 551 551 551
Average power density (kW/L) 54.1 50.6 54.3
Core total heat transfer area (ft2) 73,303 83,176 107,376
Core inlet enthalpy (Btu/lb) 527.7 527.6 507.4-514.0
Core inlet temperature (°F) 533 533 516-522
Core maximum exit voids within assemblies (%) 79.0 75.1 90.0
Core average void fraction, active coolant 0.41 0.41 0.53
Active coolant flow area per assembly (in.2) 15.2 15.7 14.4
Core average inlet velocity (ft/sec) 7.0 6.4 3.7
Maximum inlet velocity (ft/sec) 8.5 7.5 3.8
Total core pressure drop (psi) 26.4 24.4 10.4
Core support plate pressure drop (psi) 22 20 6.3
Average orifice pressure drop, central region (psi) 5.7 8.8 2.5
Average orifice pressure drop, peripheral region (psi) 18.7 17.7 5.4
Maximum channel pressure loading (psi) 15.4 10.9 3.5
Average-power assembly channel pressure loading (bottom) (psi) 14.1 9.5 3.1
Shroud support ring and lower shroud pressure loading 25.7 23.9 1.1
Upper shroud pressure loading (psi) 3.7 3.5 2.5

4-57 Revision 0October 2015
Fermi 3Updated Final Safety Analysis Report
TTable 4.4-2a Void Distribution for Analyzed Core - TRACG Average ChannelChannel Power = 4.340 MW, CPR = 1.66
Active Fuel Length = 3.048 m / 120.0 inches
Node(m above BAF) Average Node Value
Node(m above BAF) Average Node Value
1 (BAF+0.02) 0.00 17 (BAF+0.69) 0.44
2 (BAF+0.06) 0.00 18 (BAF+0.84) 0.54
3 (BAF+0.10) 0.00 19 (BAF+0.99) 0.61
4 (BAF+0.13) 0.00 20 (BAF+1.14) 0.66
5 (BAF+0.17) 0.03 21 (BAF+1.30) 0.70
6 (BAF+0.21) 0.05 22 (BAF+1.45) 0.72
7 (BAF+0.25) 0.07 23 (BAF+1.60) 0.74
8 (BAF+0.29) 0.10 24 (BAF+1.75) 0.74
9 (BAF+0.32) 0.13 25 (BAF+1.91) 0.75
10 (BAF+0.36) 0.16 26 (BAF+2.06) 0.77
11 (BAF+0.40) 0.19 27 (BAF+2.21) 0.79
12 (BAF+0.44) 0.22 28 (BAF+2.36) 0.81
13 (BAF+0.48) 0.25 29 (BAF+2.51) 0.82
14 (BAF+0.51) 0.27 30 (BAF+2.67) 0.83
15 (BAF+0.55) 0.30 31 (BAF+2.82) 0.84
16 (BAF+0.59) 0.33 32 (BAF+2.97) 0.85
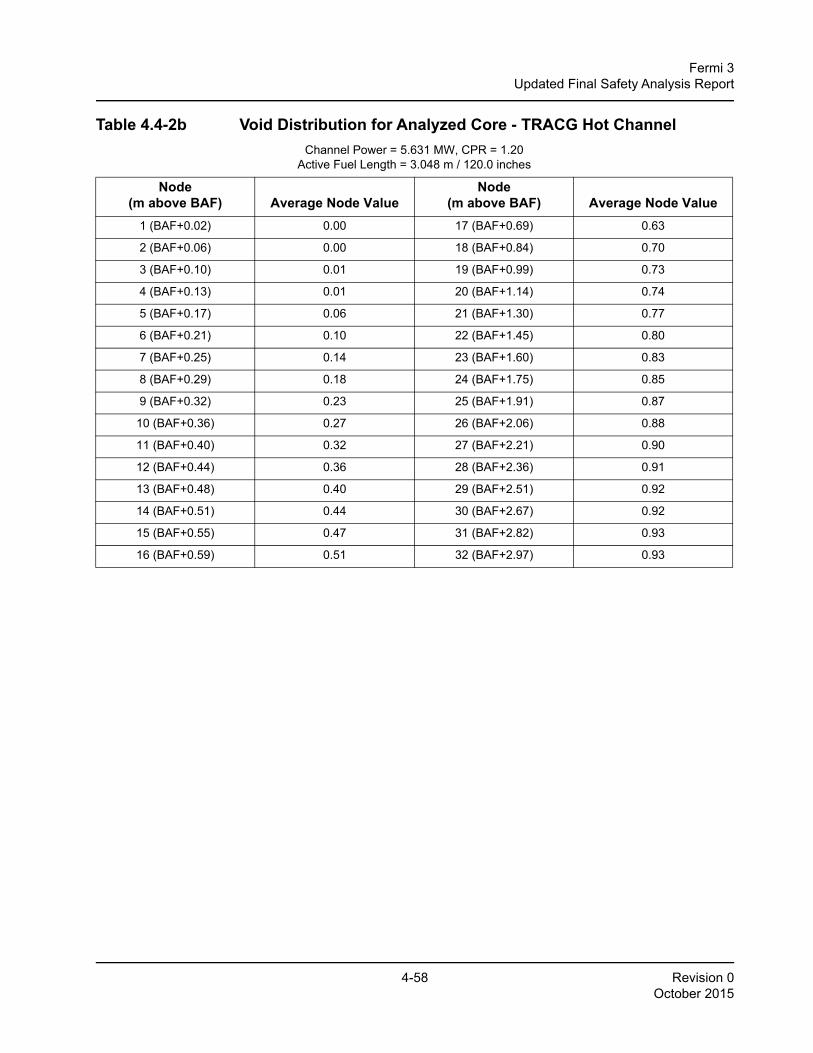
4-58 Revision 0October 2015
Fermi 3Updated Final Safety Analysis Report
Table 4.4-2b Void Distribution for Analyzed Core - TRACG Hot ChannelChannel Power = 5.631 MW, CPR = 1.20
Active Fuel Length = 3.048 m / 120.0 inches
Node(m above BAF) Average Node Value
Node(m above BAF) Average Node Value
1 (BAF+0.02) 0.00 17 (BAF+0.69) 0.63
2 (BAF+0.06) 0.00 18 (BAF+0.84) 0.70
3 (BAF+0.10) 0.01 19 (BAF+0.99) 0.73
4 (BAF+0.13) 0.01 20 (BAF+1.14) 0.74
5 (BAF+0.17) 0.06 21 (BAF+1.30) 0.77
6 (BAF+0.21) 0.10 22 (BAF+1.45) 0.80
7 (BAF+0.25) 0.14 23 (BAF+1.60) 0.83
8 (BAF+0.29) 0.18 24 (BAF+1.75) 0.85
9 (BAF+0.32) 0.23 25 (BAF+1.91) 0.87
10 (BAF+0.36) 0.27 26 (BAF+2.06) 0.88
11 (BAF+0.40) 0.32 27 (BAF+2.21) 0.90
12 (BAF+0.44) 0.36 28 (BAF+2.36) 0.91
13 (BAF+0.48) 0.40 29 (BAF+2.51) 0.92
14 (BAF+0.51) 0.44 30 (BAF+2.67) 0.92
15 (BAF+0.55) 0.47 31 (BAF+2.82) 0.93
16 (BAF+0.59) 0.51 32 (BAF+2.97) 0.93
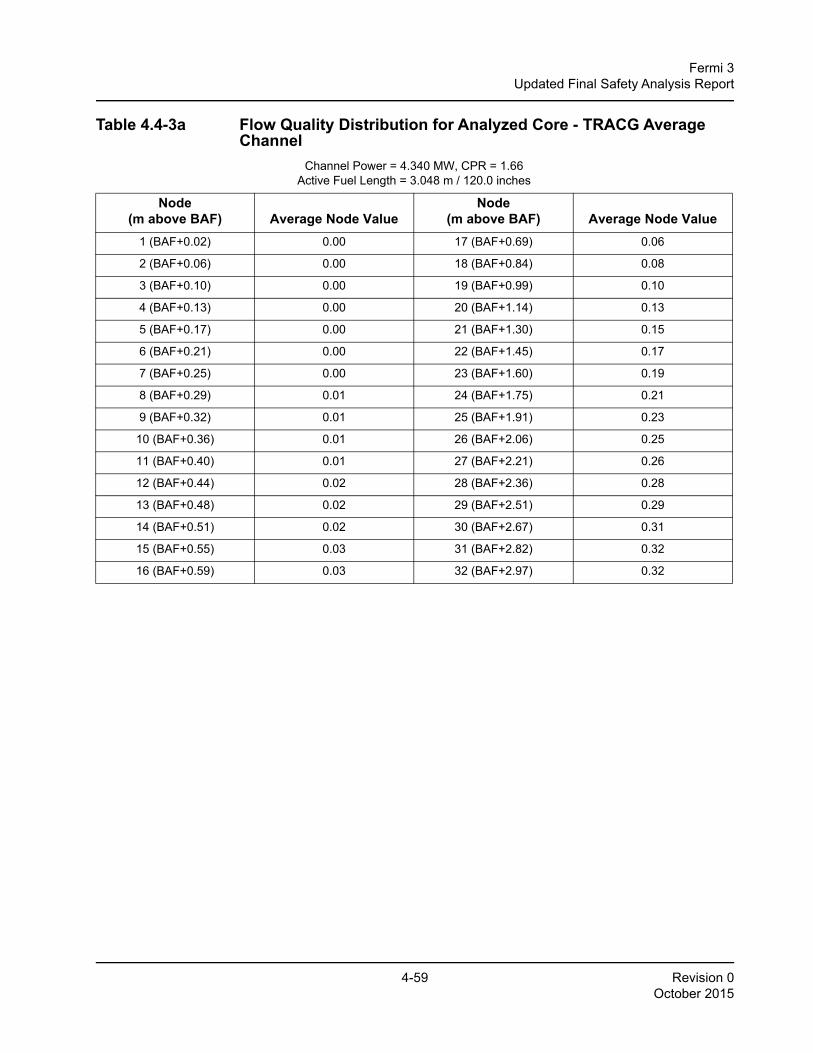
4-59 Revision 0October 2015
Fermi 3Updated Final Safety Analysis Report
Table 4.4-3a Flow Quality Distribution for Analyzed Core - TRACG Average Channel
Channel Power = 4.340 MW, CPR = 1.66Active Fuel Length = 3.048 m / 120.0 inches
Node(m above BAF) Average Node Value
Node(m above BAF) Average Node Value
1 (BAF+0.02) 0.00 17 (BAF+0.69) 0.06
2 (BAF+0.06) 0.00 18 (BAF+0.84) 0.08
3 (BAF+0.10) 0.00 19 (BAF+0.99) 0.10
4 (BAF+0.13) 0.00 20 (BAF+1.14) 0.13
5 (BAF+0.17) 0.00 21 (BAF+1.30) 0.15
6 (BAF+0.21) 0.00 22 (BAF+1.45) 0.17
7 (BAF+0.25) 0.00 23 (BAF+1.60) 0.19
8 (BAF+0.29) 0.01 24 (BAF+1.75) 0.21
9 (BAF+0.32) 0.01 25 (BAF+1.91) 0.23
10 (BAF+0.36) 0.01 26 (BAF+2.06) 0.25
11 (BAF+0.40) 0.01 27 (BAF+2.21) 0.26
12 (BAF+0.44) 0.02 28 (BAF+2.36) 0.28
13 (BAF+0.48) 0.02 29 (BAF+2.51) 0.29
14 (BAF+0.51) 0.02 30 (BAF+2.67) 0.31
15 (BAF+0.55) 0.03 31 (BAF+2.82) 0.32
16 (BAF+0.59) 0.03 32 (BAF+2.97) 0.32
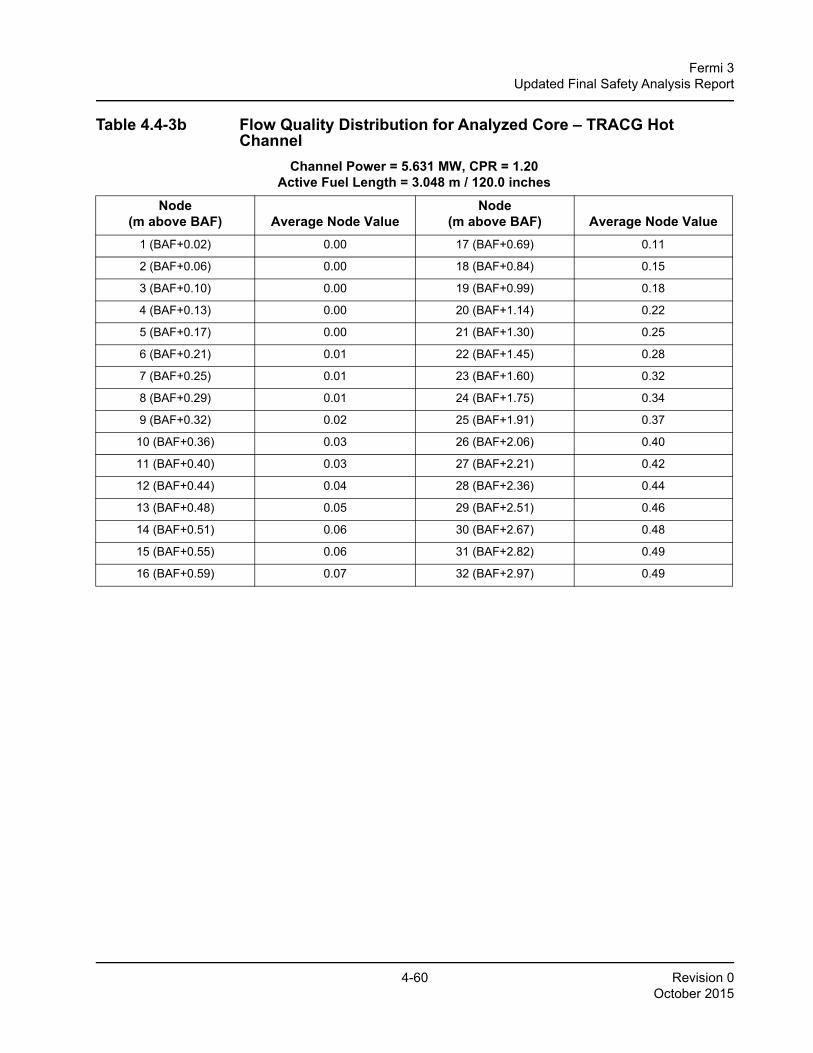
4-60 Revision 0October 2015
Fermi 3Updated Final Safety Analysis Report
Table 4.4-3b Flow Quality Distribution for Analyzed Core – TRACG Hot Channel
Channel Power = 5.631 MW, CPR = 1.20Active Fuel Length = 3.048 m / 120.0 inches
Node(m above BAF) Average Node Value
Node(m above BAF) Average Node Value
1 (BAF+0.02) 0.00 17 (BAF+0.69) 0.11
2 (BAF+0.06) 0.00 18 (BAF+0.84) 0.15
3 (BAF+0.10) 0.00 19 (BAF+0.99) 0.18
4 (BAF+0.13) 0.00 20 (BAF+1.14) 0.22
5 (BAF+0.17) 0.00 21 (BAF+1.30) 0.25
6 (BAF+0.21) 0.01 22 (BAF+1.45) 0.28
7 (BAF+0.25) 0.01 23 (BAF+1.60) 0.32
8 (BAF+0.29) 0.01 24 (BAF+1.75) 0.34
9 (BAF+0.32) 0.02 25 (BAF+1.91) 0.37
10 (BAF+0.36) 0.03 26 (BAF+2.06) 0.40
11 (BAF+0.40) 0.03 27 (BAF+2.21) 0.42
12 (BAF+0.44) 0.04 28 (BAF+2.36) 0.44
13 (BAF+0.48) 0.05 29 (BAF+2.51) 0.46
14 (BAF+0.51) 0.06 30 (BAF+2.67) 0.48
15 (BAF+0.55) 0.06 31 (BAF+2.82) 0.49
16 (BAF+0.59) 0.07 32 (BAF+2.97) 0.49
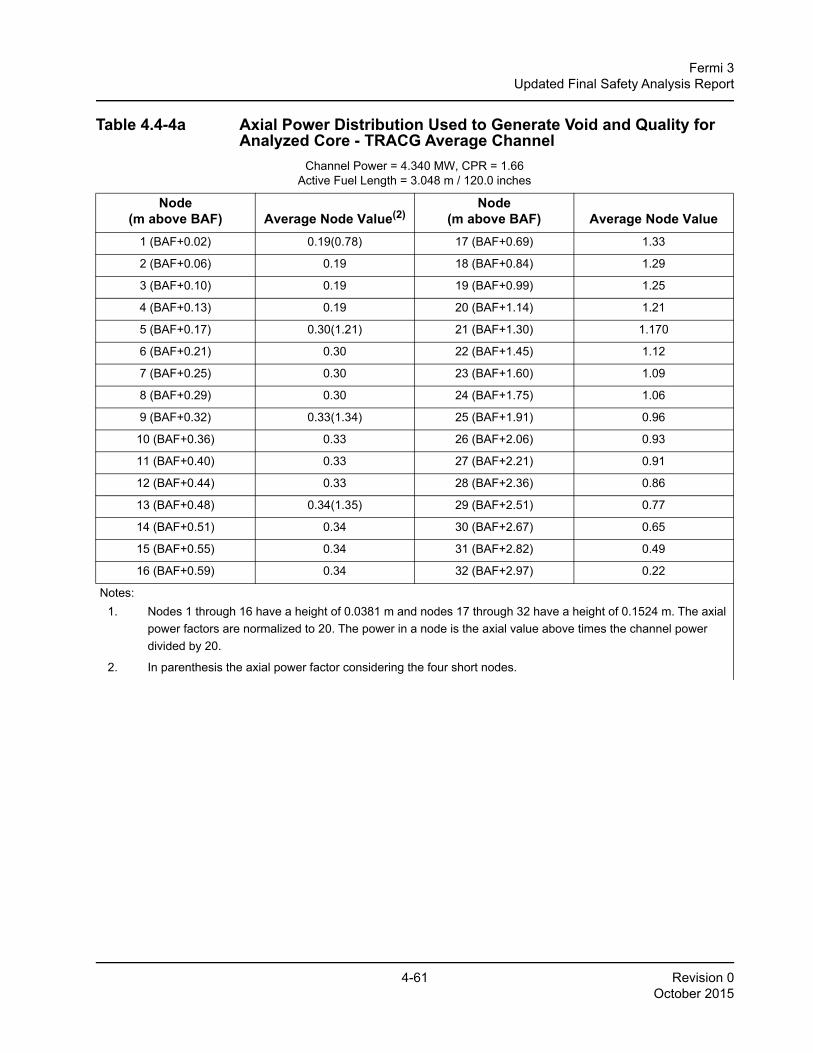
4-61 Revision 0October 2015
Fermi 3Updated Final Safety Analysis Report
Table 4.4-4a Axial Power Distribution Used to Generate Void and Quality for Analyzed Core - TRACG Average Channel
Channel Power = 4.340 MW, CPR = 1.66Active Fuel Length = 3.048 m / 120.0 inches
Node(m above BAF) Average Node Value(2)
Node(m above BAF) Average Node Value
1 (BAF+0.02) 0.19(0.78) 17 (BAF+0.69) 1.33
2 (BAF+0.06) 0.19 18 (BAF+0.84) 1.29
3 (BAF+0.10) 0.19 19 (BAF+0.99) 1.25
4 (BAF+0.13) 0.19 20 (BAF+1.14) 1.21
5 (BAF+0.17) 0.30(1.21) 21 (BAF+1.30) 1.170
6 (BAF+0.21) 0.30 22 (BAF+1.45) 1.12
7 (BAF+0.25) 0.30 23 (BAF+1.60) 1.09
8 (BAF+0.29) 0.30 24 (BAF+1.75) 1.06
9 (BAF+0.32) 0.33(1.34) 25 (BAF+1.91) 0.96
10 (BAF+0.36) 0.33 26 (BAF+2.06) 0.93
11 (BAF+0.40) 0.33 27 (BAF+2.21) 0.91
12 (BAF+0.44) 0.33 28 (BAF+2.36) 0.86
13 (BAF+0.48) 0.34(1.35) 29 (BAF+2.51) 0.77
14 (BAF+0.51) 0.34 30 (BAF+2.67) 0.65
15 (BAF+0.55) 0.34 31 (BAF+2.82) 0.49
16 (BAF+0.59) 0.34 32 (BAF+2.97) 0.22
Notes:1. Nodes 1 through 16 have a height of 0.0381 m and nodes 17 through 32 have a height of 0.1524 m. The axial
power factors are normalized to 20. The power in a node is the axial value above times the channel power divided by 20.
2. In parenthesis the axial power factor considering the four short nodes.
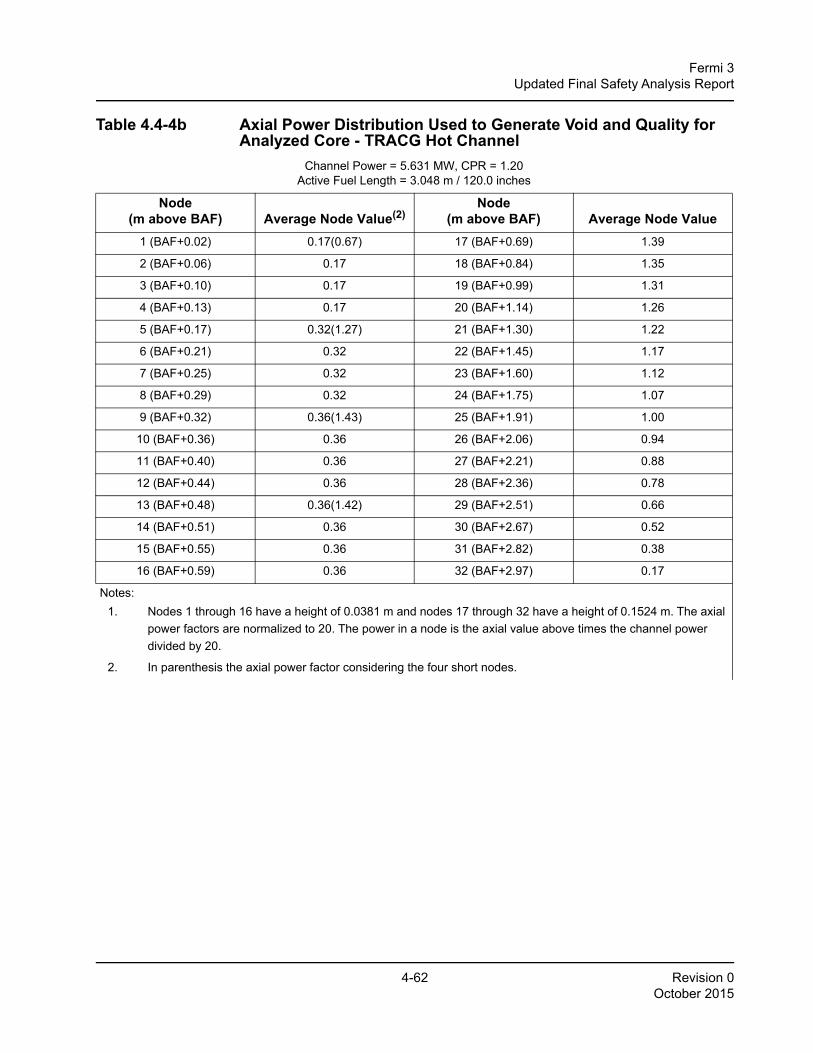
4-62 Revision 0October 2015
Fermi 3Updated Final Safety Analysis Report
Table 4.4-4b Axial Power Distribution Used to Generate Void and Quality for Analyzed Core - TRACG Hot Channel
Channel Power = 5.631 MW, CPR = 1.20Active Fuel Length = 3.048 m / 120.0 inches
Node(m above BAF) Average Node Value(2)
Node(m above BAF) Average Node Value
1 (BAF+0.02) 0.17(0.67) 17 (BAF+0.69) 1.39
2 (BAF+0.06) 0.17 18 (BAF+0.84) 1.35
3 (BAF+0.10) 0.17 19 (BAF+0.99) 1.31
4 (BAF+0.13) 0.17 20 (BAF+1.14) 1.26
5 (BAF+0.17) 0.32(1.27) 21 (BAF+1.30) 1.22
6 (BAF+0.21) 0.32 22 (BAF+1.45) 1.17
7 (BAF+0.25) 0.32 23 (BAF+1.60) 1.12
8 (BAF+0.29) 0.32 24 (BAF+1.75) 1.07
9 (BAF+0.32) 0.36(1.43) 25 (BAF+1.91) 1.00
10 (BAF+0.36) 0.36 26 (BAF+2.06) 0.94
11 (BAF+0.40) 0.36 27 (BAF+2.21) 0.88
12 (BAF+0.44) 0.36 28 (BAF+2.36) 0.78
13 (BAF+0.48) 0.36(1.42) 29 (BAF+2.51) 0.66
14 (BAF+0.51) 0.36 30 (BAF+2.67) 0.52
15 (BAF+0.55) 0.36 31 (BAF+2.82) 0.38
16 (BAF+0.59) 0.36 32 (BAF+2.97) 0.17
Notes:1. Nodes 1 through 16 have a height of 0.0381 m and nodes 17 through 32 have a height of 0.1524 m. The axial
power factors are normalized to 20. The power in a node is the axial value above times the channel power divided by 20.
2. In parenthesis the axial power factor considering the four short nodes.
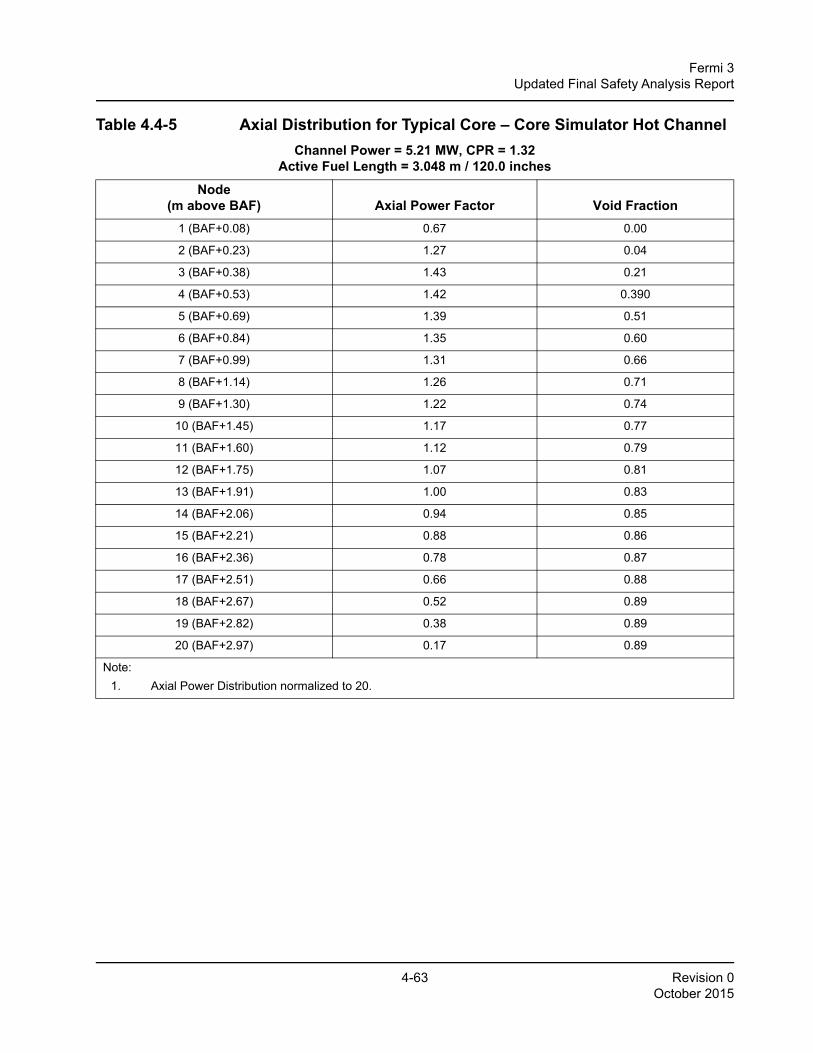
4-63 Revision 0October 2015
Fermi 3Updated Final Safety Analysis Report
Table 4.4-5 Axial Distribution for Typical Core – Core Simulator Hot ChannelChannel Power = 5.21 MW, CPR = 1.32
Active Fuel Length = 3.048 m / 120.0 inchesNode
(m above BAF) Axial Power Factor Void Fraction1 (BAF+0.08) 0.67 0.00
2 (BAF+0.23) 1.27 0.04
3 (BAF+0.38) 1.43 0.21
4 (BAF+0.53) 1.42 0.390
5 (BAF+0.69) 1.39 0.51
6 (BAF+0.84) 1.35 0.60
7 (BAF+0.99) 1.31 0.66
8 (BAF+1.14) 1.26 0.71
9 (BAF+1.30) 1.22 0.74
10 (BAF+1.45) 1.17 0.77
11 (BAF+1.60) 1.12 0.79
12 (BAF+1.75) 1.07 0.81
13 (BAF+1.91) 1.00 0.83
14 (BAF+2.06) 0.94 0.85
15 (BAF+2.21) 0.88 0.86
16 (BAF+2.36) 0.78 0.87
17 (BAF+2.51) 0.66 0.88
18 (BAF+2.67) 0.52 0.89
19 (BAF+2.82) 0.38 0.89
20 (BAF+2.97) 0.17 0.89
Note: 1. Axial Power Distribution normalized to 20.
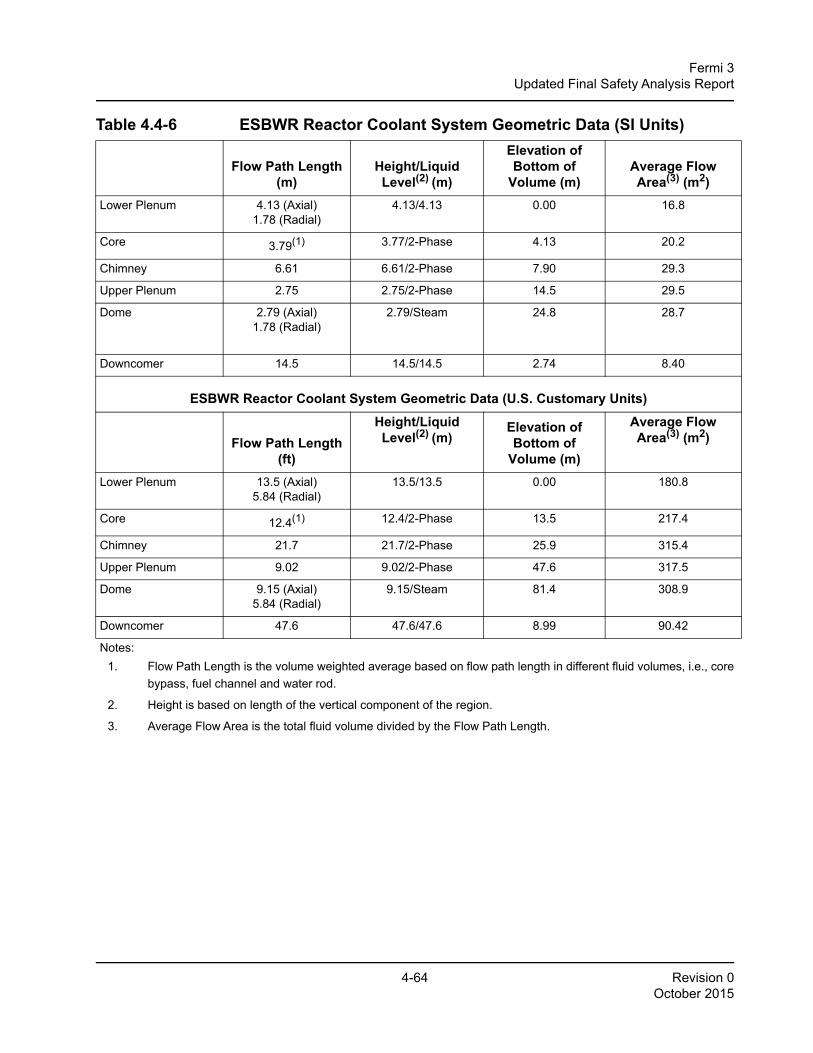
4-64 Revision 0October 2015
Fermi 3Updated Final Safety Analysis Report
Table 4.4-6 ESBWR Reactor Coolant System Geometric Data (SI Units)
Flow Path Length (m)
Height/Liquid Level(2) (m)
Elevation of Bottom of
Volume (m)Average Flow Area(3) (m2)
Lower Plenum 4.13 (Axial)1.78 (Radial)
4.13/4.13 0.00 16.8
Core 3.79(1) 3.77/2-Phase 4.13 20.2
Chimney 6.61 6.61/2-Phase 7.90 29.3
Upper Plenum 2.75 2.75/2-Phase 14.5 29.5
Dome 2.79 (Axial) 1.78 (Radial)
2.79/Steam 24.8 28.7
Downcomer 14.5 14.5/14.5 2.74 8.40
ESBWR Reactor Coolant System Geometric Data (U.S. Customary Units)
Flow Path Length (ft)
Height/Liquid Level(2) (m)
Elevation of Bottom of
Volume (m)
Average Flow Area(3) (m2)
Lower Plenum 13.5 (Axial)5.84 (Radial)
13.5/13.5 0.00 180.8
Core 12.4(1) 12.4/2-Phase 13.5 217.4
Chimney 21.7 21.7/2-Phase 25.9 315.4
Upper Plenum 9.02 9.02/2-Phase 47.6 317.5
Dome 9.15 (Axial) 5.84 (Radial)
9.15/Steam 81.4 308.9
Downcomer 47.6 47.6/47.6 8.99 90.42
Notes: 1. Flow Path Length is the volume weighted average based on flow path length in different fluid volumes, i.e., core
bypass, fuel channel and water rod.
2. Height is based on length of the vertical component of the region.
3. Average Flow Area is the total fluid volume divided by the Flow Path Length.
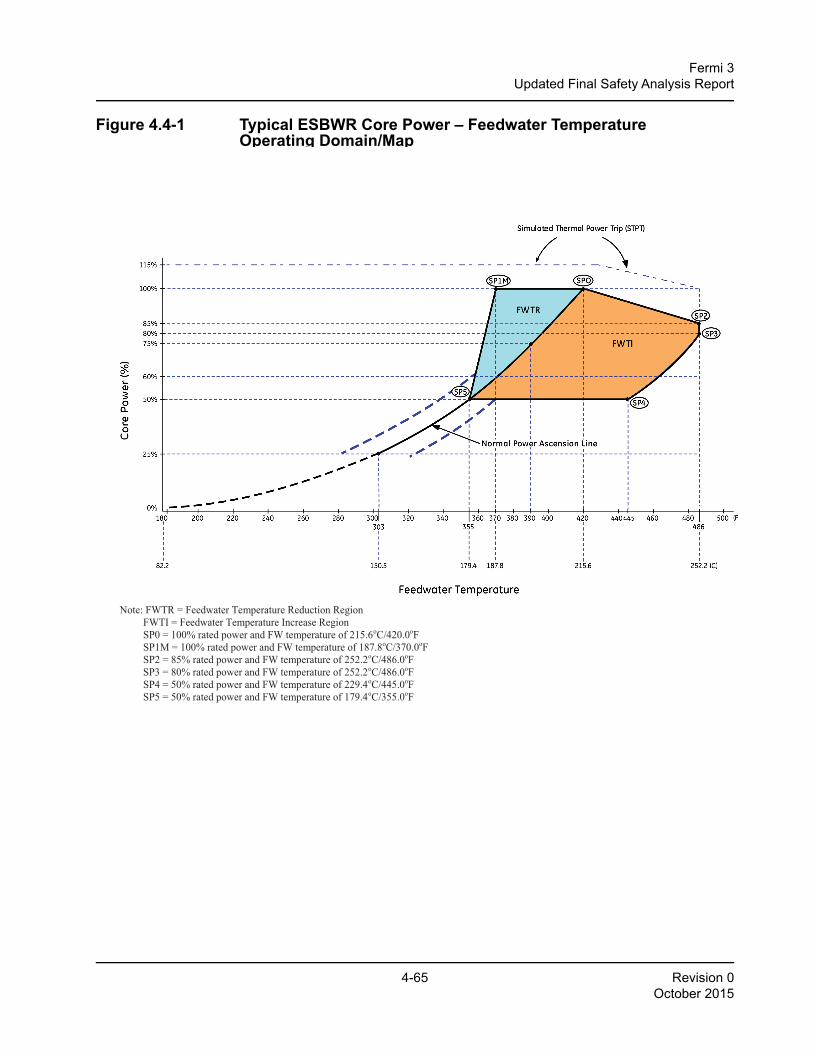
4-65 Revision 0October 2015
Fermi 3Updated Final Safety Analysis Report
Figure 4.4-1 Typical ESBWR Core Power – Feedwater Temperature Operating Domain/Map
26A6642AP Rev. 10 ESBWR Design Control Document/Tier 2
Note: FWTR = Feedwater Temperature Reduction Region FWTI = Feedwater Temperature Increase Region SP0 = 100% rated power and FW temperature of 215.6oC/420.0oF SP1M = 100% rated power and FW temperature of 187.8oC/370.0oF SP2 = 85% rated power and FW temperature of 252.2oC/486.0oF SP3 = 80% rated power and FW temperature of 252.2oC/486.0oF SP4 = 50% rated power and FW temperature of 229.4oC/445.0oF SP5 = 50% rated power and FW temperature of 179.4oC/355.0oF
Figure 4.4-1. Typical ESBWR Core Power – Feedwater Temperature Operating Domain/Map
4-66 Revision 0October 2015
Fermi 3Updated Final Safety Analysis Report
4.5 Reactor Materials
4.5.1 Control Rod Drive System Structural Materials
4.5.1.1 Material SpecificationsMaterials
The metallic structural components of the CRD mechanism are made from four types of materials:300 series stainless steel, Nickel-Chrome-Iron alloy X-750, XM-19 and 17-4 PH materials. The onlyprimary pressure boundary components are the lower housing of the spool piece assembly, andflange of the outer tube assembly. These components are made with 300 series stainless steelmaterials in accordance with the ASME Code, Section III.
The properties of the non-primary pressure retaining materials selected for the CRD mechanismare equivalent to those given in Parts A, B and D of Section II of the ASME Code, or are included inRegulatory Guide 1.84. Cold worked 300 series austenitic stainless steels are not used except forminor forming and straightening which are controlled by limiting the material hardness, bend radius,or the amount of strain induced by a process.
Special Materials
The bayonet coupling, latch and latch spring, and separation spring are fabricated from Alloy X-750in the annealed condition, and aged 20 hours at 704°C (1300°F). The ball spindle and ball-nut are17-4 PH in condition H-1075 [aged 4 hours at 580°C (1075°F)]. These are widely used materials,whose properties are well known. The parts are readily accessible for inspection and replaceable ifnecessary.
All materials for use in this system are selected for their compatibility with the reactor coolant asdescribed in Articles NB-2160 and NB-3120 of the ASME Code.
XM-19 is used for the bayonet coupling on the buffer assembly, the hollow piston tube, and theouter tube. This material has been successfully used for many years in similar drive mechanisms.Extensive laboratory tests have demonstrated that XM-19 is a suitable material and that it isresistant to stress corrosion in a BWR environment.
No austenitic stainless steels strengthened by cold working are employed in the CRD system. Forincidental cold working introduced during fabrication and installation, special controls are used tolimit the induced strain and hardness, and the bend radii are kept above a minimum value.
4.5.1.2 Austenitic Stainless Steel Components
4.5.1.2.1 Processes, Inspections and TestsAll austenitic stainless steels are used in the solution heat-treated condition. In all weldedcomponents that are exposed to service temperatures exceeding 93°C (200ºF), the carbon contentis limited not to exceed 0.02% for 300 series austenitic stainless steel. On qualification, there is a
4-67 Revision 0October 2015
Fermi 3Updated Final Safety Analysis Report
special process employed which subjects selected 300 series stainless steel components totemperatures in the sensitization range. The drive shaft and buffer sleeve are examples of hardsurfaced parts with Colmonoy and Stellite (or their equivalent). Colmonoy and Stellite (or theirequivalent) hard surfaced components have performed successfully for many years in drivemechanisms. It is normal practice to remove some CRDs at each refueling outage and disassemblethem for routine inspection. At this time, all drive parts, including the CRD bolting and hard-surfacedparts are accessible for visual examination in accordance with the manufacturer’s CRDmaintenance procedures. This inspection program is adequate to detect any incipient defectsbefore they could become serious enough to cause operating problems. The CRD penetration andbolting are included in the Reactor Coolant Pressure Boundary (RCPB) inservice inspectionprogram (Subsection 5.2.4). The degree of conformance to Regulatory Guide 1.44 is presented inSubsection 4.5.2.2.
4.5.1.2.2 Control of Delta Ferrite ContentDiscussion of this subject and conformance to Regulatory Guide 1.31 is presented inSubsection 4.5.2.2.
4.5.1.3 Other MaterialsStellite 3/Haynes 25 are used for the rollers/pins on the outside of the hollow piston latches andHaynes 25 for the latch joint pin. A Stellite 6 equivalent is used in the guide shaft at the top of theball spindle. Stellite 12 is used for the bushing at the top of the ball spindle and the bushing on thedrive shaft. Stellite Star J-metal is used for the ball check valve.
Non-cobalt hard alloys are used in guide rollers and guide pins. These components are locatedabove and below the labyrinth seal, on the stop piston, ball screw stationary guide, piston head andball-nut.
4.5.1.4 Cleaning and Cleanliness ControlAll the CRD parts are fabricated under a process specification that limits contaminants in cutting,grinding and tapping coolants and lubricants. It also restricts all other processing materials (markinginks, tape, etc.) to those that are completely removable by the applied cleaning process. Allcontaminants are then required to be removed by the appropriate cleaning process prior to any ofthe following:
• Any processing which increases part temperature above 93°C (200οF)
• Assembly which results in decrease of accessibility for cleaning
• Release of parts for shipment
The specification for packaging and shipping the control rod drive provides the following:
4-68 Revision 0October 2015
Fermi 3Updated Final Safety Analysis Report
The CRD is rinsed in hot de-ionized water and dried in preparation for shipment. The ends of thedrive are then covered with a vapor-tight barrier with desiccant. Packaging is designed to protectthe drive and prevent damage to the vapor barrier. Audits have indicated satisfactory protection.
Semiannual examination of 10% of the units humidity indicators is performed to verify that the unitsare dry and in satisfactory condition. The position indicator probes are not subject to this inspection.
Site or warehouse storage specifications require inside heated storage comparable to Level B ofNQA-2-1983, Part 2.2.
The degree of surface cleanliness obtained by these procedures meets the requirements ofRegulatory Guide 1.37.
4.5.2 Reactor Internal Materials
4.5.2.1 Material SpecificationsThe reactor internal materials are selected to be resistant to corrosion and stress corrosion crackingin the BWR steam/water environment. Improved material specifications and fabrication techniquesreduce the probability that reactor internal components experience Intergranular Stress CorrosionCracking (IGSCC) and Irradiation Assisted Stress Corrosion Cracking (IASCC). The austeniticstainless steel material for internals construction has a low carbon content to resist IGSCC.Wrought 300 series stainless steel materials have a 0.02% maximum carbon content, and largediameter forgings and cast materials have a 0.03% maximum carbon content. Reactor corestructural components are designed to be below fluence thresholds of exposure and/or stress toavoid IASCC (see Subsection 5.2.3.2.2). One design step to address Stress Corrosion Cracking(SCC) concerns is to avoid crevices, for example, by eliminating crevices from the top guide andcore plate designs in order to prevent the synergistic interaction with IGSCC or IASCC. Componentprocessing can reduce manufacturing induced stresses. For example, the use of forgings or weldedconstruction followed by solution annealing of the core shroud, are methods that reduce the effectsof cold work and weld residual stresses.
Reactor internal material specifications are provided in Table 4.5-1. All core support structures arefabricated from ASME specified materials, and designed in accordance with requirements of ASMECode Section III, Subsection NG. The other reactor internals are non-code, and they may befabricated from American Society of Testing Methods (ASTM) or American Society of MechanicalEngineers (ASME) specification materials or other equivalent specifications.
Steam dryers will be constructed from wrought 300 series and XM-19 stainless steel, and GradeCF3 stainless steel castings. Except for the steam dryer vane material, the maximum carboncontent of the wrought 300 series stainless steel is limited to 0.02% and the maximum hardness ofwrought 300 series stainless steel is limited to Rockwell B92.
4-69 Revision 0October 2015
Fermi 3Updated Final Safety Analysis Report
4.5.2.2 Controls on WeldingWelding is performed in accordance with Section IX (Welding and Brazing Qualification) andSection II Part C (Welding Rod Electrode and Filler Metals) of the ASME Boiler and PressureVessel (B&PV) Code. Austenitic stainless steel weldments require solution annealing to minimizethe possibility of sensitization. However, welded assemblies are exempt from this requirement whenthe assemblies are of 300 series material of low carbon content (less than 0.02%) and large forgingrepairs are exempt when the 300 series material’s carbon content is less than 0.03%. Type XM-19materials are exempt from this requirement. These controls are employed in order to comply withthe intent of Regulatory Guide 1.44.
The welding processes for austenitic stainless steel and nickel base alloys shall be controlled toensure acceptable welds. The controls include the following:
• Prior to welding, the joint surfaces and the base metal within 51 mm (2 in) of the joint shall be thoroughly cleaned. Such surfaces shall be free of moisture, phosphates, carbonaceous materials such as oil, grease, oxides, paint and marking materials, halogens and all other foreign materials, except that an anti-spatter compound may be applied to the adjacent base metal.
• Protective gas back purging shall be used for full penetration single side welded joints of stainless steel until a minimum of 5 mm (3/16 inch) of weld thickness is completed. Before welding, joints shall be back purged.
• The Shield Metal Arc Welding (SMAW) process shall not be used on the root pass.
• Each welding pass shall be visually examined for defects and bead shape prior to applying the next pass. The weld bead and the surfaces heated during welding shall be cleaned between passes to remove oxides. Porosity, slag, lack of fusion, cracks, and other defects shall be removed by grinding, machining, or chipping prior to depositing subsequent passes. Removal of cracks, other than crater cracks, shall be verified by a liquid penetrant examination.
• Grinding shall be controlled per Subsection 4.5.2.4.
Core support structures are fabricated in accordance with requirements of ASME Code Section III,Subsection NG-4000, and the examination and acceptance criteria shown in NG-5000. Theinternals, other than the core support structures meet the requirements of the industry standards,for example, ASME or American Welding Society (AWS), as applicable. ASME B&PV Code SectionIX qualification requirements are followed in fabrication of core support structures. All welds aremade with controlled weld heat input.
Electroslag welding is not applied for structural welds.
ESBWR fully complies with Regulatory Guide 1.31, “Control of Ferrite Content in Stainless SteelWeld Metal,” including application of the following provisions to all stainless steel weld filler metalapplied to reactor internal components: The delta ferrite content for weld materials used in welding
4-70 Revision 0October 2015
Fermi 3Updated Final Safety Analysis Report
austenitic stainless steel assemblies is verified on undiluted weld deposits for each heat or lot offiller metal and electrodes. The delta ferrite content is defined for weld materials as 5.0 FerriteNumber (FN) minimum, 8.0 FN average and 20 FN maximum for 308 L and 16 FN for 316 L. Ferritecontent is determined by use of magnetic instruments calibrated according to AWS A4.2. Thisferrite content is considered adequate to prevent any micro-fissuring (Hot Cracking) in austeniticstainless steel welds. This procedure complies with the requirements of Regulatory Guide 1.31.
4.5.2.3 Non-Destructive ExaminationMaterials for core support structures are in conformance with and certified to ASME Code SectionIII, Subsection NG. Examination of materials (examination methods and acceptance criteria) isspecified in NG-2500. Examination methods and acceptance criteria for core support structure weldedge preparations and welds are provided in NG-5000. Tubular products that are pressureboundary components (CRD and in-core hous ings) are examined as out l ined inSubsection 5.2.3.3.3. For non-ASME Code reactor internal structures and associated welds,examinations are established based on relevant design and analysis information, and takeguidance from NG-2500 and NG-5000 respectively.
4.5.2.4 Fabrication and Processing of Austenitic Stainless Steel—Regulatory Guide Conformance
Fabrication process controls are applied to minimize the degradation of material properties byforming, cold working, etc. Susceptibility to stress corrosion cracking is limited by careful control ofsolution heat treatment, sensitization testing and testing for intergranular attack (IGA). Significantlycold-worked stainless steels are not used in the reactor internals except for vanes in the steamdryers. During fabrication, cold work is controlled by applying limits on hardness, bend radii andsurface finish on ground surfaces. For components exposed to reactor coolant, the following stepswill be taken to mitigate the effects of cold working: Any surface that is cold worked by machining,grinding, or other mechanical processes, shall be evaluated for an acceptable surface condition.The evaluation shall address the service application and/or cold work mitigation. Some of thetechniques that may be used for mitigation of surface cold work include locally or fully re-solutionannealing, flappers, controlled machining in accordance with demonstrated procedure, mechanicalpolishing or electropolishing as well as other appropriately qualified methods.
The limitation placed upon the delta ferrite in austenitic stainless steel castings is 8% minimum anda maximum value of 20%. The maximum limit is used for those castings designed for a 60-year lifesuch as the fuel support pieces, in order to limit the effects of thermal aging degradation.
Furnace sensitized materials are not allowed. Proper solution annealing of the 300 series austeniticstainless steel is verified by testing per ASTM-A262, “Standard Practices for DetectingSusceptibility to Intergranular Attack in Austenitic Stainless Steels.”
4-71 Revision 0October 2015
Fermi 3Updated Final Safety Analysis Report
Careful control of all cleaning materials and process materials that contact stainless steel duringmanufacture and construction prevent exposure to contaminants. Any inadvertent surfacecontamination is removed to avoid potential detrimental effects.
Special care is exercised to insure removal of surface contaminants prior to any heating operation.Water quality for rinsing, flushing, and testing is controlled and monitored.
The degree of cleanliness obtained by these procedures meets the requirements of RegulatoryGuide 1.37.
4.5.2.5 Other MaterialsHardenable martensitic stainless steel and precipitation hardening stainless steels are not used inthe reactor internals.
Materials, other than Type-300 stainless steel, employed in reactor internals are:
• Type or Grade XM-19 stainless steel
• Niobium modified Alloy 600 per ASME Code Case No. N-580-1
• N07750 (Alloy X-750) or equivalent
All Niobium modified Alloy 600 material is used in the solution annealed condition.
Alloy X-750 components are fabricated in the annealed and aged condition. Where maximumresistance to stress corrosion is required, the material is used in the high temperature1093°C(2000οF) annealed plus single aged condition.
Hard chromium plating surface is applied to austenitic stainless steel couplings.
All materials used for reactor internals are selected for their compatibility with the reactor coolant asshown in ASME Code Section III, NG-2160 and NG-3120. The fabrication and cleaning controlspreclude contamination of nickel-based alloys by chloride ions, fluoride ions, sulfur, or lead.
All materials referenced in this subsection have been successfully used for many years in BWRapplications.
For nickel based alloy components exposed to reactor coolant, the steps outlined inSubsection 4.5.2.4 will be taken to mitigate the effects of cold working.
Use of Alloy 182 is prohibited in contact with reactor coolant.
4.5.3 COL InformationNone.
4.5.4 ReferencesNone.
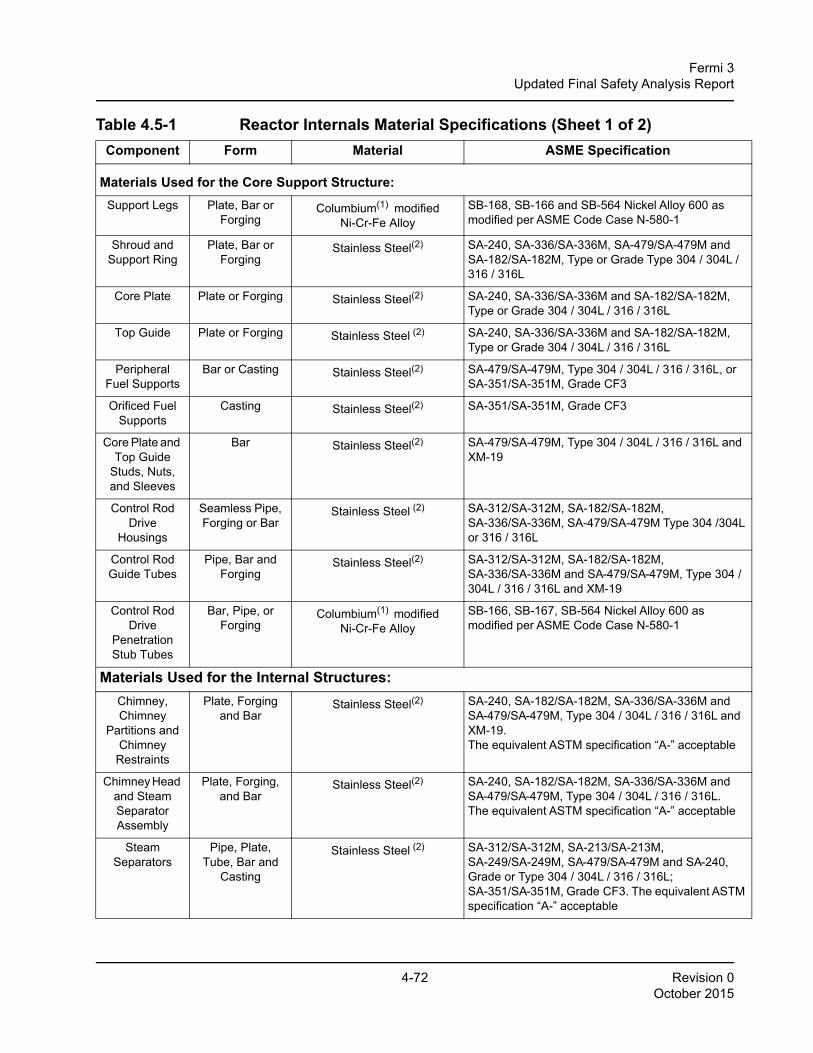
4-72 Revision 0October 2015
Fermi 3Updated Final Safety Analysis Report
Table 4.5-1 Reactor Internals Material Specifications (Sheet 1 of 2)Component Form Material ASME Specification
Materials Used for the Core Support Structure:Support Legs Plate, Bar or
ForgingColumbium(1) modified
Ni-Cr-Fe AlloySB-168, SB-166 and SB-564 Nickel Alloy 600 as modified per ASME Code Case N-580-1
Shroud and Support Ring
Plate, Bar or Forging
Stainless Steel(2) SA-240, SA-336/SA-336M, SA-479/SA-479M and SA-182/SA-182M, Type or Grade Type 304 / 304L / 316 / 316L
Core Plate Plate or Forging Stainless Steel(2) SA-240, SA-336/SA-336M and SA-182/SA-182M, Type or Grade 304 / 304L / 316 / 316L
Top Guide Plate or Forging Stainless Steel (2) SA-240, SA-336/SA-336M and SA-182/SA-182M, Type or Grade 304 / 304L / 316 / 316L
Peripheral Fuel Supports
Bar or Casting Stainless Steel(2) SA-479/SA-479M, Type 304 / 304L / 316 / 316L, or SA-351/SA-351M, Grade CF3
Orificed Fuel Supports
Casting Stainless Steel(2) SA-351/SA-351M, Grade CF3
Core Plate and Top Guide
Studs, Nuts, and Sleeves
Bar Stainless Steel(2) SA-479/SA-479M, Type 304 / 304L / 316 / 316L and XM-19
Control Rod Drive
Housings
Seamless Pipe, Forging or Bar
Stainless Steel (2) SA-312/SA-312M, SA-182/SA-182M, SA-336/SA-336M, SA-479/SA-479M Type 304 /304L or 316 / 316L
Control Rod Guide Tubes
Pipe, Bar and Forging
Stainless Steel(2) SA-312/SA-312M, SA-182/SA-182M, SA-336/SA-336M and SA-479/SA-479M, Type 304 / 304L / 316 / 316L and XM-19
Control Rod Drive
Penetration Stub Tubes
Bar, Pipe, or Forging
Columbium(1) modified Ni-Cr-Fe Alloy
SB-166, SB-167, SB-564 Nickel Alloy 600 as modified per ASME Code Case N-580-1
Materials Used for the Internal Structures:Chimney, Chimney
Partitions and Chimney
Restraints
Plate, Forging and Bar
Stainless Steel(2) SA-240, SA-182/SA-182M, SA-336/SA-336M and SA-479/SA-479M, Type 304 / 304L / 316 / 316L and XM-19.The equivalent ASTM specification “A-” acceptable
Chimney Head and Steam Separator Assembly
Plate, Forging, and Bar
Stainless Steel(2) SA-240, SA-182/SA-182M, SA-336/SA-336M and SA-479/SA-479M, Type 304 / 304L / 316 / 316L. The equivalent ASTM specification “A-” acceptable
Steam Separators
Pipe, Plate, Tube, Bar and
Casting
Stainless Steel (2) SA-312/SA-312M, SA-213/SA-213M, SA-249/SA-249M, SA-479/SA-479M and SA-240, Grade or Type 304 / 304L / 316 / 316L; SA-351/SA-351M, Grade CF3. The equivalent ASTM specification “A-” acceptable
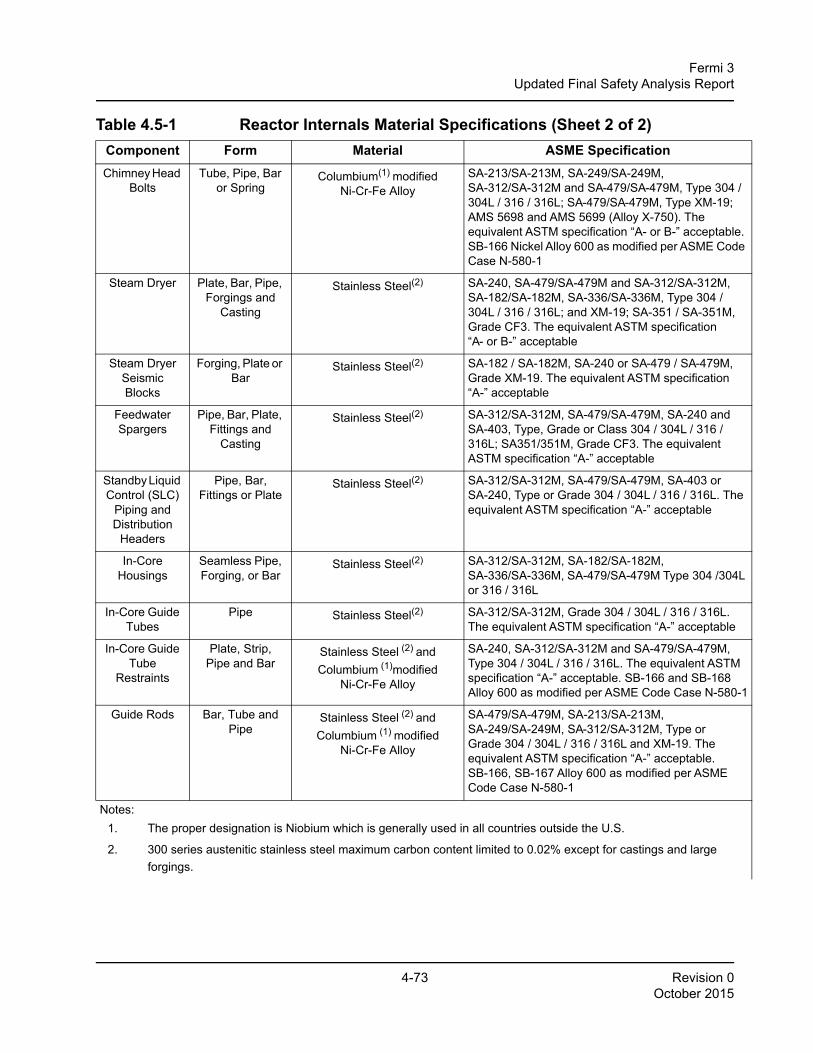
4-73 Revision 0October 2015
Fermi 3Updated Final Safety Analysis Report
Chimney Head Bolts
Tube, Pipe, Bar or Spring
Columbium(1) modified Ni-Cr-Fe Alloy
SA-213/SA-213M, SA-249/SA-249M, SA-312/SA-312M and SA-479/SA-479M, Type 304 / 304L / 316 / 316L; SA-479/SA-479M, Type XM-19; AMS 5698 and AMS 5699 (Alloy X-750). The equivalent ASTM specification “A- or B-” acceptable. SB-166 Nickel Alloy 600 as modified per ASME Code Case N-580-1
Steam Dryer Plate, Bar, Pipe, Forgings and
Casting
Stainless Steel(2) SA-240, SA-479/SA-479M and SA-312/SA-312M, SA-182/SA-182M, SA-336/SA-336M, Type 304 / 304L / 316 / 316L; and XM-19; SA-351 / SA-351M, Grade CF3. The equivalent ASTM specification “A- or B-” acceptable
Steam Dryer Seismic Blocks
Forging, Plate or Bar
Stainless Steel(2) SA-182 / SA-182M, SA-240 or SA-479 / SA-479M, Grade XM-19. The equivalent ASTM specification “A-” acceptable
Feedwater Spargers
Pipe, Bar, Plate, Fittings and
Casting
Stainless Steel(2) SA-312/SA-312M, SA-479/SA-479M, SA-240 and SA-403, Type, Grade or Class 304 / 304L / 316 / 316L; SA351/351M, Grade CF3. The equivalent ASTM specification “A-” acceptable
Standby Liquid Control (SLC)
Piping and Distribution
Headers
Pipe, Bar, Fittings or Plate
Stainless Steel(2) SA-312/SA-312M, SA-479/SA-479M, SA-403 or SA-240, Type or Grade 304 / 304L / 316 / 316L. The equivalent ASTM specification “A-” acceptable
In-Core Housings
Seamless Pipe, Forging, or Bar
Stainless Steel(2) SA-312/SA-312M, SA-182/SA-182M, SA-336/SA-336M, SA-479/SA-479M Type 304 /304L or 316 / 316L
In-Core Guide Tubes
Pipe Stainless Steel(2) SA-312/SA-312M, Grade 304 / 304L / 316 / 316L. The equivalent ASTM specification “A-” acceptable
In-Core Guide Tube
Restraints
Plate, Strip, Pipe and Bar
Stainless Steel (2) and Columbium (1)modified
Ni-Cr-Fe Alloy
SA-240, SA-312/SA-312M and SA-479/SA-479M, Type 304 / 304L / 316 / 316L. The equivalent ASTM specification “A-” acceptable. SB-166 and SB-168 Alloy 600 as modified per ASME Code Case N-580-1
Guide Rods Bar, Tube and Pipe
Stainless Steel (2) and Columbium (1) modified
Ni-Cr-Fe Alloy
SA-479/SA-479M, SA-213/SA-213M, SA-249/SA-249M, SA-312/SA-312M, Type or Grade 304 / 304L / 316 / 316L and XM-19. The equivalent ASTM specification “A-” acceptable. SB-166, SB-167 Alloy 600 as modified per ASME Code Case N-580-1
Notes:1. The proper designation is Niobium which is generally used in all countries outside the U.S.
2. 300 series austenitic stainless steel maximum carbon content limited to 0.02% except for castings and large forgings.
Table 4.5-1 Reactor Internals Material Specifications (Sheet 2 of 2)Component Form Material ASME Specification

4-74 Revision 0October 2015
Fermi 3Updated Final Safety Analysis Report
4.6 Functional Design of Reactivity Control SystemThe Reactivity Control System consists of:
• Control rods and Control Rod Drive (CRD) system
• Supplementary reactivity control in the form of gadolinia-urania fuel rods (Section 4.2)
• The Standby Liquid Control System (Subsection 9.3.5)
Conformance of these reactivity control systems to GDC 4, 23, 25, 26, 27, 28 and 29 is addressedin Section 3.1.
4.6.1 Information for Control Rod Drive System
4.6.1.1 Design Bases
4.6.1.1.1 Safety (10 CFR 50.2) Design BasesThe CRD system meets the following safety design bases:
• The design provides for rapid control rod insertion (scram) so that no fuel damage results from any AOO (Chapter 15).
• The design includes positioning devices, each of which individually supports and positions a control rod.
• Each positioning device is capable of holding the control rod in position and preventing it from inadvertently withdrawing outward during any non-accident, accident, post-accident and seismic condition.
• Each positioning device is capable of detecting the separation of the control rod from the drive mechanism to prevent a Rod Drop Accident (RDA).
• Each positioning device provides a means to prevent or limit the rate of control rod ejection from the core due to a break in the drive mechanism pressure boundary. This is to prevent fuel damage resulting from rapid insertion of reactivity.
• The design provides for isolation capability terminating high pressure makeup water injection, HP CRD, to ensure containment pressure remains within design limits.
4.6.1.1.2 Power Generation (Non-Safety) Design BasisThe CRD system design meets the following power generation design bases:
• The design provides for controlling changes in core reactivity by positioning neutron-absorbing control rods within the core.
• The design provides for movement and positioning of control rods in increments to enable optimized power control and core power shaping.
4-75 Revision 0October 2015
Fermi 3Updated Final Safety Analysis Report
• The design provides for the supply of high pressure makeup water to the reactor when the normal makeup supply system (feedwater) is unable to maintain water level.
• The design provides for isolation bypass capability allowing high pressure makeup water injection, HP CRD, into the RPV if GDCS is unsuccessful in injecting water into the RPV.
4.6.1.2 DescriptionThe CRD system is composed of three major elements:
• Electro-hydraulic fine motion control rod drive (FMCRD) mechanisms
• Hydraulic control units (HCU)
• Control rod drive hydraulic subsystem
The FMCRDs provide electric-motor-driven positioning for normal insertion and withdrawal of thecontrol rods and hydraulic-powered rapid insertion (scram) of control rods during abnormaloperating conditions.
The hydraulic power required for scram is provided by high pressure water stored in the individualHCUs. Each HCU contains a scram (nitrogen-water) accumulator charged to high pressure and thenecessary valves and components to scram two FMCRDs. Additionally, during normal operation,the HCUs provide a flow path for purge water to the associated FMCRDs.
The CRD Hydraulic Subsystem provides clean, demineralized water that is regulated anddistributed to provide charging of the scram accumulators and purge water flow to the FMCRDsduring normal operation. The CRD Hydraulic Subsystem is also the source of pressurized water forpurging the Reactor Water Cleanup/Shutdown Cooling (RWCU/SDC) system pumps and theNuclear Boiler System (NBS) reactor water level reference leg instrument lines. Additionally, theCRD Hydraulic Subsystem provides high pressure makeup water to the reactor during events inwhich the feedwater system is unable to maintain reactor water level. This makeup water issupplied to the reactor via a line off the CRD pump discharge header that connects to the feedwaterinlet piping via the RWCU/SDC return piping. During certain LOCA events the makeup water isisolated from the Reactor Pressure Vessel (RPV) and directed to the Condensate Storage Tank(CST) through the CRD pump minimum flow lines. The high pressure makeup isolation isbypassed, in response to signals indicating unsuccessful GDCS injection, to allow normal highpressure makeup injection to the RPV.
The CRD system performs the following functions:
• Controls changes in core reactivity by positioning neutron-absorbing control rods within the core in response to control signals from the Rod Control and Information System (RC&IS).
• Provides movement and positioning of control rods in increments to enable optimized power control and core power shape in response to control signals from the RC&IS.

4-76 Revision 0October 2015
Fermi 3Updated Final Safety Analysis Report
• Provides the ability to position large groups of rods simultaneously in response to control signals from the RC&IS.
• Provides rapid control rod insertion (scram) in response to manual or automatic signals from the Reactor Protection System (RPS) so that no fuel damage results from any plant AOO.
• In conjunction with the RC&IS, provides automatic electric motor-driven insertion of the control rods simultaneously with hydraulic scram initiation. This provides an additional, diverse means of fully inserting a control rod.
• Supplies rod status and rod position data for rod pattern control, performance monitoring, operator display and scram time testing by the RC&IS.
• In conjunction with the RC&IS, prevents undesirable rod pattern or rod motions by imposing rod motion blocks in order to protect the fuel.
• In conjunction with the RC&IS, prevents the Rod Drop Accident (RDA) by detecting rod separation and imposing rod motion block.
• Provides rapid control rod insertion (scram) in response to signals from the Diverse Protection System (DPS). Also in response to signals from the DPS, provides Alternate Rod Insertion (ARI), an alternate means of actuating hydraulic scram, should an Anticipated Transient Without Scram (ATWS) occur.
• In conjunction with the RC&IS, provides for Selected Control Rod Run-In (SCRRI), and Select Rod Insertion (SRI).
• Prevents rod ejection from the core due to a break in the drive mechanism pressure boundary or a failure of the attached scram line by means of a passive brake mechanism for the FMCRD motor and a scram line inlet check valve.
• Supplies high pressure makeup water to the reactor when the normal makeup supply system (feedwater) is unable to prevent reactor water level from falling below the normal water level range.
• Supplies purge water for the RWCU/SDC System pumps.
• Provides a continuous flow of water to the NBS to keep the reactor water level reference leg instrument lines filled.
• Isolates high pressure makeup from the reactor in response to certain LOCA events to ensure containment pressure remains within design limits.
• Bypasses the high pressure makeup isolation in response to signals indicating unsuccessful GDCS injection to allow normal high pressure makeup mode.
The design bases and further discussion of both the RC&IS and RPS, and their control interfaceswith the CRD system, are presented in Chapter 7.

4-77 Revision 0October 2015
Fermi 3Updated Final Safety Analysis Report
The CRD System is arranged in a manner that separates the safety-related equipment from thenonsafety-related portions of the system. The FMCRDs are mounted to the reactor vessel bottomhead inside containment. The HCUs are housed in four dedicated rooms located directly outside ofcontainment at the basemat elevation of the Reactor Building (RB). These rooms are arrangedaround the periphery of the containment wall. Each HCU room serves the FMCRDs associated withone quadrant of the reactor core. The HCUs are connected to the FMCRDs by the scram insertpiping that penetrates the containment wall.
The balance of the nonsafety-related hydraulic system equipment (pumps, valves, filters, etc.) isphysically separated from the HCUs and housed in a separate room in the reactor building. It isconnected to the HCUs by the nonsafety-related FMCRD purge water header, scram accumulatorcharging water header and scram air header. These headers are classified as Seismic Category IIso that they will maintain structural integrity during a seismic event and not degrade the functioningof the HCUs.
4.6.1.2.1 Fine Motion Control Rod Drive MechanismThe FMCRD used for positioning the control rod in the reactor core is a mechanical/hydraulicactuated mechanism (Figures 4.6-1 and 4.6-2). An electric motor-driven ball-nut and ball screwassembly is capable of positioning the drive at both nominal increments of 36.5 mm (1.44 in.) andcontinuously over its entire range at a nominal speed of 28 mm/sec(1.10 in/sec). Hydraulicpressure is used for scrams. The FMCRD penetrates the bottom head of the reactor pressurevessel. The FMCRD does not interfere with refueling and is operative even when the head isremoved from the reactor vessel.
The fine motion capability is achieved with a ball-nut and ball screw arrangement driven by anelectric motor. The ball-nut is keyed to the guide tube (roller key) to prevent its rotation andtraverses axially as the ball screw rotates. A hollow piston rests on the ball-nut, and upward motionof the ball-nut lifts the piston and drives the control rod into the core. The weight of the control rodkeeps the hollow piston and ball-nut in contact during withdrawal.
A single HCU powers the scram action of two FMCRDs. Upon scram valve initiation, high pressurenitrogen from the HCU raises the piston within the accumulator forcing water through the scrampiping. This water is directed to each FMCRD connected to the HCU. Inside each FMCRD, highpressure water lifts the hollow piston off the ball-nut and drives the control rod into the core. Aspring washer buffer assembly stops the hollow piston at the end of its stroke. Departure from theball-nut releases spring-loaded latches in the hollow piston that engage slots in the guide tube.These latches support the control rod and hollow piston in the inserted position. The control rodcannot be withdrawn until the ball-nut is driven up and engaged with the hollow piston. Stationaryfingers on the ball-nut then cam the latches out of the slots and hold them in the retracted position.A scram action is complete when every FMCRD has reached its fully inserted position.

4-78 Revision 0October 2015
Fermi 3Updated Final Safety Analysis Report
The use of the FMCRD mechanisms in the CRD system provides several features that enhanceboth the system reliability and plant operations. Some of these features are listed and discussedbriefly as follows:
Diverse Means of Rod Insertion — The FMCRDs can be inserted either hydraulically orelectrically. In response to a scram signal, the FMCRD is inserted hydraulically via the storedenergy in the scram accumulators. A signal is also given simultaneously to insert the FMCRDelectrically via its motor drive. This diversity provides a high degree of assurance of rod insertion ondemand.
Absence of FMCRD Piston Seals — The FMCRD pistons have no seals and, thus, do not requiremaintenance.
FMCRD Discharge — The water that scrams the control rod discharges into the reactor vessel anddoes not require a scram discharge volume, thus eliminating a potential source for common modescram failure.
Plant Maneuverability — The fine motion capability of the FMCRD allows rod pattern optimizationin response to fuel burnup or load-following demands.
Plant Automation — The relatively simple logic of the FMCRD permits plant automation. Thisfeature is utilized for automatic reactor startup and shutdown and for automatic load following.
Reactor Startup Time — The FMCRDs can be moved in large groups. Movements of large groupsof control rods (called gangs) are utilized to reduce the time for reactor startup.
Rod Drop Accident Prevention — The control rod separation detection feature of the FMCRDvirtually eliminates the possibility of a RDA by preventing rod withdrawal when control rodseparation is detected. Additionally, movement of rods in large groups during reactor startup greatlyreduces the maximum relative rod worth to levels lower than current rod pattern controls. Rodpattern controls provide verification of proper automatic rod movements and to mitigate theconsequences of a Rod Withdrawal Error (RWE).
The drives are readily accessible for inspection and servicing. The bottom location makesmaximum utilization of the water in the reactor as a neutron shield and provides low neutronexposure to the drive components. Using water from the condensate treatment system orcondensate storage tanks as the operating fluid eliminates the need for special hydraulic fluid.
4.6.1.2.2 FMCRD ComponentsFigure 4.6-1 provides a simplified schematic of the FMCRD operating principles. Figure 4.6-2illustrates the FMCRD in more detail.
The basic elements of the FMCRD are as follows:
4-79 Revision 0October 2015
Fermi 3Updated Final Safety Analysis Report
• Components of the FMCRD required for electrical rod positioning or fine motion control (including the motor, brake release, associated connector, ball screw shaft, ball-nut and hollow piston).
• Components of the FMCRD required for hydraulic scram (including hollow piston and buffer).
• Components of the FMCRD required for pressure integrity (including the outer tube, middle flange, installation bolts and spool piece).
• Rod position indication (position signal detectors).
• Reed position switches for scram surveillance.
• Control rod separation detection devices (dual safety-related CRD separation switches).
• Bayonet coupling between the hollow piston and control rod.
• Brake mechanism to prevent rod ejection in the event of a break in the FMCRD primary pressure boundary and ball check valve to prevent rod ejection in the event of a failure of the scram insert line.
• Integral internal blowout support (to prevent CRD blowout).
• Magnetic coupling.
These features and functions of the FMCRD are described below.
Components for Fine Motion Control
The fine motion capability is achieved with a ball-nut and ball screw arrangement driven by anelectric motor. The ball-nut is keyed to the guide tube (roller key) to prevent its rotation as ittraverses axially as the ball screw rotates. A hollow piston rests on the ball-nut and upward motionof the ball-nut drives the control rod into the core. The weight of the control rod keeps the hollowpiston and ball-nut in contact during withdrawal.
The drive motor, located outside the pressure boundary, is magnetically coupled to the drive shaftlocated inside the pressure boundary. A splined coupling connects the drive shaft to the ball screw.The lower half of the splined coupling is keyed to the drive shaft and the upper half keyed to the ballscrew. The tapered end of the drive shaft fits into a conical seat on the end of the ball screw to keepthe two axially aligned. A drive shaft thrust bearing carries the entire weight of the control rod anddrive internals.
The axially moving parts are centered and guided by radial rollers. The ball-nut and bottom of thehollow piston include radial rollers bearing against the guide tube. Radially adjustable rollers at bothends of the labyrinth seal keep the hollow piston precisely centered in this region.
A stationary guide supports the top of the ball screw against the inside of the hollow piston. Ahardened bushing provides the circumferential bearing between the rotating ball screw andstationary guide. Rollers of the guide run in axial grooves in the hollow piston to prevent the guidefrom rotating with the ball screw.
4-80 Revision 0October 2015
Fermi 3Updated Final Safety Analysis Report
Components for Scram
The scram action is initiated by the HCU. High pressure water lifts the hollow piston off the ball-nutand drives the control rod into the core. A spring washer buffer assembly stops the hollow piston atthe end of its stroke. Departure from the ball-nut releases spring-loaded latches in the hollow pistonthat engage slots in the guide tube. These latches support the control rod in the inserted position.
The control rod cannot be withdrawn until the ball-nut is driven up and engaged with the hollowpiston. Stationary fingers on the ball-nut cam the latches in the hollow piston out of the slots in theguide tube and hold them in the retracted position when the ball-nut and hollow piston arere-engaged.
Re-engagement of the ball-nut with the hollow piston following scram is automatic. Simultaneouswith the initiation of the hydraulic scram each FMCRD motor is signaled to start in order to causemovement of the ball-nut upward until it is in contact with the hollow piston. This action completesthe rod full-in insertion and leaves the drives in a condition ready for restarting the reactor. With thelatches in the hollow piston retracted, and the motor and brake de-energized, the control rods arekept fully inserted by the passive holding torque from the brake and the magnetic coupling betweenthe motor and drive shaft.
The automatic run-in of the ball-nut using the electric motor drive following the hydraulic scramprovides a diverse means of rod insertion as a backup to the accumulator scram.
FMCRD Pressure Boundary
The CRD housing (attached to the RPV) and the CRD middle flange and lower housing (spoolpiece) which enclose the lower part of the drive are a part of the reactor pressure boundary(Figure 4.6-1). The middle housing is attached to the CRD housing by four threaded bolts. Thelower housing (spool piece) is, in turn, held to the middle housing and secured to the CRD housingby a separate set of eight main mounting bolts that become a part of the reactor pressure boundary.This arrangement permits removing the lower housing, drive shaft and seal assembly withoutdisturbing the rest of the drive. Removing the lower housing transfers the weight of the drivelinefrom the drive shaft to the seat in the middle housing. Both the ball screw and drive shaft are lockedto prevent rotation while the two are separated.
The part of the drive inserted into the CRD housing is contained within the outer tube. The outertube is the drive hydraulic scram pressure boundary, eliminating the need for designing the CRDhousing for the scram pressure. The outer tube is welded to the middle flange at the bottom and isattached at the top with the CRD blowout support, which bears against the CRD housing. Theblowout support and outer tube are attached by a slip type connection that accounts for any slightvariation in length between the drive and the drive housing.
Purge water continually flows through the drive. The water enters through the ball check valve inthe middle housing and flows around the hollow piston into the reactor. O-rings seal the lower
4-81 Revision 0October 2015
Fermi 3Updated Final Safety Analysis Report
housing. A labyrinth seal near the top of the drive restricts the flow into the reactor. During a scram,the labyrinth seals the high pressure scram water from the reactor vessel without adverselyaffecting the movement of the hollow piston.
Rod Position Indication
Control rod position indication is provided by the FMCRDs to the control system by a positiondetection system, which consists of position detectors and position signal converters.
Each FMCRD provides two position detectors, one for each control system channel, in the form ofsignal detectors directly coupled to the motor shaft through gearing. The output signals from thesedetectors are analog. The analog signals are converted to digital signals by position signalconverters. This configuration provides continuous detection of rod position during normaloperation.
Scram Position Indication
Scram position indication is provided by a series of magnetic reed switches to allow formeasurement of adequate drive performance during scram. The magnetic switches are located atintermediate intervals over 60% of the drive stroke. They are mounted in a position indicator probeexterior to the drive housing. A magnet in the hollow piston trips each reed switch, in turn, as itpasses by.
As the bottom of the hollow piston contacts and enters the buffer, a magnet is lifted that operates areed switch, indicating scram completion. This continuous full-in indicating switch is shownconceptually in Figure 4.6-3. It provides indication whenever the drive is at the full-in latchedposition or above.
Control Rod Separation Detection
Two redundant and separate safety-related switches are provided to detect the separation of thehollow piston from the ball-nut. This means two sets of reed switches physically separated from oneanother with their cabling run through separate conduits. The separation switch is classifiedsafety-related, because its function detects a detached control rod and causes a rod block, therebypreventing a RDA. Actuation of either switch also initiates an alarm in the control room.
The principle of operation of the control rod separation mechanism is illustrated in Figure 4.6-4.During normal operation, the weight of the control rod and hollow piston resting on the ball-nutcauses the ball screw assembly to compress a spring on which the lower half of the splinedcoupling between the drive shaft and ball screw assembly rests (the lower half of the splinedcoupling is also known as the “weighing table”). When the hollow piston separates from the ball-nut,or when the control rod separates from the hollow piston, the spring is unloaded and pushes theweighing table and ball screw assembly upward. This action causes a magnet in the weighing tableto operate the safety-related reed switches located in probes outside the lower housing.
4-82 Revision 0October 2015
Fermi 3Updated Final Safety Analysis Report
Bayonet Couplings
There are two bayonet couplings associated with the FMCRD. The first is at the FMCRD/control rodguide tube/housing interface as illustrated in Figure 4.6-1. This bayonet coupling locks the FMCRDand the base of the control rod guide tube to the CRD housing and functions to retain the controlrod guide tube during normal operation and dynamic loading events. The bayonet coupling alsoholds the FMCRD against ejection in the event of a hypothetical failure of the CRD housing weld.The locating pin on the core plate that engages the flange of the control rod guide tube and the boltpattern on the FMCRD/housing flange assure proper orientation between the control rod guide tubeand the FMCRD to assure that the bayonet coupling is properly engaged.
The second bayonet coupling is located between the control rod and FMCRD as shown on Figure4.6-5. The coupling spud at the top end of the FMCRD hollow piston engages and locks into amating socket at the base of the control rod. The coupling requires a 45° rotation for engaging ordisengaging. Once locked, the drive and rod form an integral unit that can only be unlockedmanually by specific procedures before the components can be separated.
The FMCRD design allows the coupling integrity of this second bayonet coupling to be checked bydriving the ball-nut down into an overtravel-out position. After the weighing spring has raised theball screw assembly to the limit of its travel, further rotation of the ball screw in the withdrawdirection drives the ball-nut down away from the hollow piston (assuming the coupling is engaged).If the hollow piston is not properly coupled to the control rod, the hollow piston will remain in contactwith the ball-nut and move with it to the overtravel position. A reed switch at the overtravel positionwill detect this movement of the hollow piston.
FMCRD Brake and Ball Check Valve
The FMCRD design incorporates an electro-mechanical brake (Figure 4.6-6) keyed to the motorshaft. The brake is normally engaged by passive spring force when the FMCRD is stationary. It isdisengaged for normal rod movements by signals from the RC&IS. Disengagement is caused bythe energized magnetic force overcoming the spring load force. The braking torque of 49 N m (36 ftlbf)(minimum) and the magnetic coupling torque between the motor and the drive shaft aresufficient to prevent control rod ejection in the event of failure in the pressure retaining parts of thedrive mechanism. The brake is designed so that its failure does not prevent the control rod fromrapid insertion (scram).
The electromechanical brake is located in the motor unit. The stationary spring-loaded disk and coilassembly is contained within the brake mounting bolted to the bottom of the motor unit top flange.The rotating disk is keyed to the motor unit output shaft.
The brake is classified as passive safety-related because it performs its holding function when it isin its normally de-energized condition.

4-83 Revision 0October 2015
Fermi 3Updated Final Safety Analysis Report
A ball check valve is located in the middle flange of the drive at the scram inlet port. The checkvalve is classified as safety-related because it actuates to close the scram inlet port by reverse flowunder system pressure, fluid flow and temperature conditions caused by a break of the scram line.This prevents the loss of pressure to the underside of the hollow piston and the generation of loadson the drive that could cause a rod ejection.
Integral Internal Blowout Support
An internal CRD blowout support replaces the support structure of beams, hanger rods, grids andsupport bars used in BWR/6 and previous product lines. The internal support concept is illustratedschematically in Figure 4.6-7. This system utilizes the CRD outer tube integral with the internalsupport to provide the anti-ejection support. The outer tube is locked at top via the internal supportto the CRGT base by a bayonet coupling, which is described above. The outer tube is bolted to theCRD housing flange, as described above in a discussion on FMCRD pressure boundary, via themiddle flange welded to it at the bottom.
The CRD blowout support is designed to prevent ejection of the CRD and the attached control rodconsidering failures of two types at the weld (Point A in Figure 4.6-7) between the CRD housing andthe stub tube penetration of the RPV bottom head: (1) a failure through the housing along the fusionline just below the weld with the weld and the housing extension inside the vessel remaining intact,or (2) a failure of the weld itself with the entire housing remaining intact, but without support at thepenetration.
With a housing failure, the weight plus pressure load acting on the drive and housing would tend toeject the drive. In this event, the CRGT base remains supported by the intact housing extensioninside the vessel and the CRD remains supported in turn by its positive lock to the CRGT base.Coolant leakage is restricted to the small annular area between the CRD outer tube and the insideof the CRD housing. In the event of total failure of the weld itself, with the entire housing intact, thehousing would tend to be driven downward by the total weight plus vessel pressure. However, afterthe interconnected assembly of the CRD housing, CRD and CRGT moves down a short distance,the flange at the top of the CRGT contacts the core plate, stopping further movement of theassembly. Because the CRD is positively locked to the CRGT base, it cannot eject. In this case, theCRD housing, which bears on top of the blowout support, is also prevented from leaving thepenetration. Coolant leakage for this condition is restricted to the small annular area between theoutside of CRD housing and the inside of the penetration stub tube.
An orderly shutdown would result if either of the two failures were to occur, because the restrictedcoolant leakage would be less than the supply from the normal make up systems. The componentsthat provide the anti-ejection function are:
• Internal CRD blowout support
• CRD outer tube
• Entire CRD housing
4-84 Revision 0October 2015
Fermi 3Updated Final Safety Analysis Report
• CRGT
• Core plate
The materials of these components are specified to meet quality requirements consistent with thatfunction.
If a total failure of all the flange bolts attaching the spool piece flange and also the middle flangewith the CRD housing flange (Point B on Figure 4.6-7) were to occur, the drive would be preventedfrom moving downward by the middle flange seat provided for the ball screw adapter as part of theanti-rotation gear (Subsection 4.6.2.1.3).
Magnetic Coupling
The magnetic coupling is located at the bottom of the spool piece. It is employed to achieveseal-less, leak-free operation of the control rod drive mechanism. The magnetic coupling consistsof an inner and an outer rotor. The inner rotor is located inside the spool piece pressure boundary.The outer rotor is located outside the spool piece pressure boundary. Each rotor has permanentmagnets mounted on it. As a result, the inner and outer rotors are locked together by the magneticforces acting through the pressure boundary and work as a synchronous coupling. The outer rotoris coupled with the motor unit and driven by the motor and the inner rotor follows the rotation of theouter rotor.
The magnetic coupling is designed so that its maximum coupling torque exceeds the maximumtorque of the motor unit to prevent decoupling or slippage due to motor torque.
Materials of Construction
The materials of construction for the FMCRD are discussed in Subsection 4.5.1.
4.6.1.2.3 Hydraulic Control UnitsEach HCU furnishes pressurized water for hydraulic scram, on signal from the RPS, to two FMCRDunits. Additionally, each HCU provides the capability to adjust purge flow to the two drives. A testport is provided on the HCU for connection to a portable test station to allow controlled venting ofthe scram insert line to test the FMCRD ball check valve during plant shutdown. Operation of theelectrical system that supplies scram signals to the HCU is described in Chapter 7.
The basic components of each HCU are described in the following paragraphs. The HCUconfiguration is shown on Figure 4.6-8.
The check valves shown inside the HCU boundary on Figure 4.6-8 have an active safety-relatedfunction to close under system pressure, fluid flow and temperature conditions during scram. Thisensures that the water stored in the HCU accumulator is delivered to the FMCRDs to accomplishthe scram function.
4-85 Revision 0October 2015
Fermi 3Updated Final Safety Analysis Report
Scram Pilot Valve Assembly
The scram pilot valve assembly is operated from the RPS. The scram pilot valve assembly, with twosolenoids, controls the scram inlet valve. The scram pilot valve assembly is solenoid-operated andis normally energized. Upon loss of electrical signal (such as the loss of external AC power) to thesolenoids, the inlet port closes and the exhaust port opens. The pilot valve assembly (Figure 4.6-8)is designed so that the trip system signal must be removed from both solenoids before air pressurecan be discharged from the scram valve operators. This prevents the inadvertent scram of bothdrives associated with a given HCU in the event of a failure of one of the pilot valve solenoids.
Scram Inlet Valve
The scram inlet valve opens to supply pressurized water to the bottom of the drive piston. Thisquick opening globe valve is operated by an internal spring and system pressure. It is closed by airpressure applied to the top of its diaphragm operator. A position indicator switch on this valveenergizes a light in the control room as soon as the valve starts to open.
Scram Accumulator
The scram accumulator stores sufficient energy to fully insert two control rods at any reactorpressure. The accumulator is a hydraulic cylinder with a free-floating piston. The piston separatesthe water on top from the nitrogen below. A check valve in the accumulator charging line preventsloss of water pressure in the event that supply pressure is lost.
During normal plant operation, the accumulator piston is seated at the bottom of its cylinder. Loss ofnitrogen decreases the nitrogen pressure, which actuates a pressure switch and sounds an alarmin the control room.
To ensure that the accumulator is always able to produce a scram, it is continuously monitored forwater leakage. A float type level switch actuates an alarm if water leaks past the piston barrier andcollects in the accumulator instrumentation block.
Purge Water Orifice and Makeup Valve
Each HCU has a restricting orifice in the purge water line to control the purge flow rate to the twoassociated FMCRDs. This orifice maintains the flow at a constant value while the drives arestationary. A bypass line containing a solenoid-operated valve is provided around this orifice. Thevalve is signaled to open and increase the purge water flow whenever either of the two associatedFMCRDs is commanded to insert by the RC&IS. During FMCRD insertion cycles, the hollow pistonmoves upward, leaving an increased volume for water within the drive. Opening of the purge watermakeup valve increases the purge flow to offset this volumetric increase and precludes thebackflow of reactor water into the drive, thereby preventing long-term drive contamination.
4-86 Revision 0October 2015
Fermi 3Updated Final Safety Analysis Report
Test Connection for FMCRD Ball Check Valve Testing and Friction Testing
Contained within the HCU is a test port to allow connection of temporary test equipment forconducting FMCRD ball check valve testing and drive friction testing. This test port, which has aquick-connect type coupling, is located downstream of the restricting orifice and check valve in thepurge water line.
Performance of FMCRD ball check valve testing is accomplished by attaching the check valve testfixture to the HCU test port. The test fixture exercises the check valve by generating a controlledbackflow through the check valve housing, causing the valve to backseat. The backflow iscontained within a controlled volume inside the test fixture.
During plant shutdown, the friction of each control rod and its drive mechanism is measured toconfirm that there is no abnormal driveline resistance that would adversely affect drive operation.Friction testing is performed after FMCRD maintenance or fuel reshuffling. Connecting a portablefriction test cart between the CRD hydraulic system and the HCU test port using flexible hosesperforms this test. The test cart contains all the necessary hydraulic, electrical and pneumaticequipment, controls and instrumentation to apply hydraulic pressure to the bottom surface of theFMCRD hollow piston that is resting on the ball-nut. When the pressure under the hollow piston ishigh enough to overcome both the combined hollow piston and control rod weight and the drivelinefriction, the hollow piston will separate from the ball-nut and drift the control rod into the core. Thepressure acting on the bottom surface of the hollow piston is a direct indication of the drivelinefriction and is measured and recorded while the piston is being inserted. The recorded pressuretrace for each rod is then compared against a reference trace. Any fluctuation in the peak-to-peakreading that exceeds acceptable limits is considered abnormal and indicates further maintenance isrequired. Only one rod is tested at a time. Since one HCU drives two rods, the rod not under test isisolated. Discharge water during testing is directed back to the RPV via the FMCRD labyrinth seal.
4.6.1.2.4 Control Rod Drive Hydraulic SubsystemThe CRD Hydraulic Subsystem supplies water under high pressure to charge the accumulators,purge the FMCRDs and RWCU/SDC system pumps, provide makeup water to the NBS reactorwater level reference leg instrument lines and provide makeup water to the reactor vessel followingthe loss of the normal makeup supply (feedwater). The CRD Hydraulic Subsystem provides therequired functions with the pumps, valves, filters, piping, instrumentation and controls shown onFigure 4.6-8. Duplicate components are included where necessary to assure continuous systemoperation if an inservice component should require maintenance. For system and componentclassification see Section 3.2.
The CRD Hydraulic Subsystem hydraulic requirements and components are described in thefollowing paragraphs.
4-87 Revision 0October 2015
Fermi 3Updated Final Safety Analysis Report
Hydraulic Requirements
The CRD Hydraulic Subsystem process conditions are shown in Figure 4.6-9. The hydraulicrequirements, identified by the function they perform, are:
• The required purge water to the drives is shown in Table 4.6-1.
• The approximate purge flow provided to the RWCU/SDC pump is shown in Table 4.6-1. This flow is provided at approximately CRD pump discharge pressure. The RWCU/SDC system provides its own pressure breakdown equipment to satisfy its individual hydraulic requirements.
• The approximate purge flow provided to the NBS reference leg instrument lines is shown in Table 4.6-1. The purge flow maintains the RPV water level reference leg instrument lines filled to address the effects of noncondensible gases in the instrument lines to prevent erroneous reference information after a rapid RPV depressurization event.
• The approximate flow provided to the Process Sampling System (PSS) is shown in Table 4.6-1. The PSS monitors this flow for CRD water conductivity and dissolved oxygen level.
• The minimum flow supplied to the reactor in the high pressure makeup mode of operation is shown in Table 4.6-1. This flow is based on a reactor gauge pressure less than or equal to the reference pressure shown in Table 4.6-1.
CRD Supply Pump
One supply pump pressurizes the system with water from the condensate treatment system orcondensate storage tanks. One spare pump is provided for standby. A discharge check valveprevents backflow through the non-operating pump. A portion of the pump discharge flow isdiverted through a minimum flow line to the Condensate Storage Tank (CST). This flow is controlledby an orifice and is sufficient to prevent pump damage if the pump discharge is inadvertentlyclosed.
Redundant filters in both the pump suction and discharge lines process the system water. Adifferential pressure indicator and control room alarm monitor each filter element as they collectforeign materials.
For the high pressure makeup mode of operation, the CRD Hydraulic Subsystem operates withboth pumps running simultaneously. The standby pump is initiated automatically by low reactorwater level so that the combined flow from both pumps can provide the required high pressuremakeup flow to the reactor vessel. The standby pump also starts automatically if loss of dischargeheader pressure is sensed during normal operation, indicating a failure of the operating pump. Thisprevents a scram due to low-low scram accumulator charging water header pressure fromoccurring as a result of an inadvertent pump trip.
The pump suction filters are bypassed automatically during two-pump operation to assure thatadequate Net Positive Suction Head (NPSH) is available for the pumps. Two bypass lines are
4-88 Revision 0October 2015
Fermi 3Updated Final Safety Analysis Report
provided around the suction filters, each line containing a normally closed motor-operated valve.These valves are signaled to open when the high pressure makeup mode of operation is initiated.
Scram Accumulator Charging Water Header
The scram accumulator charging pressure is established by pre-charging the nitrogen accumulator(gas bottle) to a precisely controlled pressure at known temperature. During scram, the scramvalves open and permit the stored energy in the scram accumulators to discharge into the drives.The resulting pressure decrease in the scram accumulator charging water header allows the CRDsupply pump to “run out” (that is, flow rate to increase substantially) into the control rod drives viathe scram accumulator charging water header. The flow element upstream of the scramaccumulator charging water header senses high flow and provides a signal to the manual/auto flowcontrol station which in turn closes the system flow control valve. This action effectively blocks theflow to the purge water header so that the runout flow is confined to the scram accumulatorcharging water header.
Pressure instrumentation is provided in the scram accumulator charging water header to monitorheader performance. The pressure signal from this instrumentation is provided to both the RC&ISand RPS. If the scram accumulator charging water header pressure degrades, the RC&IS initiatesa rod block and alarm at a predetermined low pressure setpoint. If pressure degrades even further,the RPS initiates a scram at a predetermined low-low pressure setpoint. This ensures the capabilityto scram and reactor shutdown before the scram accumulator pressure can degrade to the levelwhere scram performance is adversely affected following the loss of scram accumulator chargingwater header pressure.
The scram accumulator charging water header contains a check valve and a bladder-typeaccumulator. The accumulator is located downstream of the check valve in the vicinity of the lowheader pressure instrumentation. The accumulator is sized to maintain the header pressuredownstream of the check valve above the scram setpoint until the standby CRD pump startsautomatically, following a trip or failure of the operating CRD pump. Pressure instrumentationinstalled on the pump discharge header, downstream of the CRD pump drive water filters, monitorssystem pressure and generates the actuation signals for startup of the standby pump if the pressuredrops below a predetermined value that indicates a failure of the operating pump.
An air-operated isolation valve is also provided in the scram accumulator charging water header. Itcloses automatically when the system is initiated into the high pressure makeup mode of operation.It blocks the flow through the header to allow all CRD Hydraulic Subsystem flow in this mode to bedirected to the reactor via the feedwater system. The valve is designed to preferentially fail closedupon loss of control power or instrument air.
4-89 Revision 0October 2015
Fermi 3Updated Final Safety Analysis Report
Purge Water Header
The purge water header is located downstream from the flow control valve. The flow control valveadjusts automatically to maintain constant flow to the FMCRDs as reactor vessel pressure changes.Because flow is constant, the differential pressure between the reactor vessel and CRD HydraulicSubsystem is maintained constant independent of reactor vessel pressure. A flow indicator in thecontrol room monitors system flow. A differential pressure indicator is provided at a local panel toindicate the difference between reactor vessel pressure and purge water pressure.
An air-operated isolation valve is also provided in the purge water header. It closes automaticallywhen the system is initiated into the high pressure makeup mode of operation. It blocks the flowthrough the header to allow all CRD Hydraulic Subsystem flow in this mode to be directed to thereactor via the feedwater system. The valve is designed to preferentially fail closed upon loss ofcontrol power or instrument air.
High Pressure Makeup Line
The CRD Hydraulic Subsystem supplies high pressure makeup water to the reactor vessel throughpiping connecting the discharge lines of the CRD pumps to the RWCU/SDC. The flow is then routedthrough RWCU/SDC piping to the feedwater system for delivery to the reactor via the feedwatersparger.
Each pump provides half the flow capacity for the high pressure makeup mode of operation.Located downstream of each pump is a flow control station containing the flow instrumentation andthe control valve for regulating the pump flow during high pressure makeup. The piping from the twoflow control stations is then combined together into a single line to deliver the combined pump flowto the RWCU/SDC. This line contains a check valve, a normally open motor-operated isolationvalve, two in-series air-operated HP CRD isolation valves, and in parallel with the two air-operatedHP CRD isolation valves are two motor-operated HP CRD isolation bypass valves. The check valveis provided to prevent backflow from the RWCU/SDC system. The single isolation valve is providedfor system testing. During testing, it isolates the line and diverts the flow to the system test line. Thetwo air-operated HP CRD isolation valves isolate the high pressure makeup water from the RPV toensure containment pressure remains within design limits during certain LOCA events. The twomotor-operated HP CRD isolation bypass valves provide a flow path around the two air-operatedHP CRD isolation valves in the event of a GDCS injection failure or loss of air.
System Test Line
A system test line is provided to allow testing of the high pressure makeup mode during normalplant operation without injecting the relatively cold CRD Hydraulic Subsystem water into the reactor.It connects with the high pressure makeup line at a point downstream of the two pump flow controlstations and is routed back to the CST. The line contains a variable position valve, which is used tothrottle the test flow so that the upstream pressure in the line can be varied to simulate operationover the full range of reactor pressure.
4-90 Revision 0October 2015
Fermi 3Updated Final Safety Analysis Report
4.6.1.2.5 Control Rod Drive System OperationThe operating modes of the CRD system are described in this subsection.
Normal Operation
Normal operation is defined as those periods of time when no control rod drives are in motion.Under this condition, the CRD system provides charging pressure to the HCUs and supplies purgewater to the control rod drives, the RWCU/SDC pumps and reactor water level reference leginstrument lines.
One of the two multi-stage centrifugal pumps supplies the system with water from the condensateand feedwater system or CST. The other pump is shutdown and on standby. A constant portion ofthe pump discharge is continuously bypassed back to the CST in order to maintain a minimum flowthrough the pump. This prevents overheating of the pump if the discharge line is blocked. The totalpump flow during normal operation is the sum of the minimum line flow, the FMCRD purge waterflow through the flow control valve, the RWCU/SDC pump purge flow, the flow to the reactor waterlevel reference leg instrument lines and the CRD Hydraulic Subsystem water sample flow. Thestandby pump provides a full capacity backup capability to the operating pump. It startsautomatically if failure of the operating pump is detected by pressure instrumentation located in thecommon discharge piping downstream of the drive water filters.
Redundant filters in both the pump suction and discharge lines process the system water. Onesuction filter and one drive water filter are normally in operation, while the backup filters are onstandby and valved out-of-service (OOS). Differential pressure Instrumentation and Control roomalarms monitor the filter elements as they collect foreign material.
The purge water header provides the purge water for each drive. The purge water flow control valveautomatically regulates the purge water flow to the drive mechanisms. The purge water flow rate isindicated in the control room.
In order to maintain the ability to scram, the scram accumulator charging water header maintainsthe scram accumulators at a high pressure. The scram valves remain closed except during andafter scram, so during normal operation no flow passes through the scram accumulator chargingwater header. Pressure in the scram accumulator charging water header is monitored continuously.A significant degradation in the scram accumulator charging water header pressure causes a lowpressure warning alarm and rod withdrawal block by the RC&IS. Further degradation, if occurring,causes a reactor scram by the RPS.
Pressure in the pump discharge header downstream of the drive water filters is also monitoredcontinuously. Low pressure in this line is used to indicate that the operating pump has failed ortripped. If it should occur, automatic startup of the standby pump is initiated and the system isquickly re-pressurized. A bladder-type accumulator located in the scram accumulator chargingwater header maintains the pressure in the header above the scram setpoint during the time delayassociated with startup of the standby pump. These features protect against a loss of scram
4-91 Revision 0October 2015
Fermi 3Updated Final Safety Analysis Report
accumulator charging water header pressure which may occur as a result of a malfunction of theoperating pump, and which could cause the reactor to scram due to a low-low scram accumulatorcharging water header pressure.
Control Rod Insertion and Withdrawal
The FMCRD design provides the capability to move a control rod in fine steps. Normal control rodmovement is under the control of the RC&IS. The RC&IS controls the input of actuation power tothe FMCRD motor from the electrical power supply in order to complete a rod motion command.The FMCRD motor rotates a ball screw that, in turn, causes the vertical translation of a ball-nut onthe ball screw. This motion is transferred to the control rod via a hollow piston that rests on theball-nut. Thus, the piston with the control rod is raised or lowered, depending on the direction ofrotation of the FMCRD motor and ball screw.
During a control rod insertion, opening the solenoid-operated purge water makeup valve within theassociated HCU increases the purge water flow to the drive. The increased flow offsets thevolumetric displacement within the drive as the hollow piston is inserted into the core and preventsreactor water from being drawn back into the drive.
Scram
In response to an automatic or a manual scram from the RPS, power is interrupted to both scramsolenoid pilot valve coils (for each HCU) and safety-related power is supplied to each backup scramvalve solenoid, either action resulting in insertion of all control rods.
Upon loss of electric power to both scram solenoid pilot valve (SSPV) coils, the scram valve in theassociated HCU opens inserting the control rods. Also, after the backup scram valve solenoids areenergized, the backup scram valves exhaust air from the scram air header, allowing the HCU scramvalves to open ensuring/causing a hydraulic scram. The hydraulic scram occurs by applying thehydraulic insert forces to its respective FMCRDs using high pressure water stored within theprecharged scram accumulator (the nitrogen-water accumulator having previously beenpressurized with charging water from the CRD Hydraulic Subsystem). Once the hydraulic force isapplied, the hollow piston disengages from the ball-nut and inserts the control rod rapidly. The waterdisplaced from the FMCRD is discharged into the reactor vessel. Indication that the scram hasbeen successfully completed (all rods full-in position) is displayed to the operator.
Table 4.6-2 shows the scram performance provided by the CRD system at full power operation, interms of the maximum elapsed time for each control rod to attain the listed scram position (percentinsertion) after loss of signal to the scram solenoid pilot valves (time zero).
The start of motion is the time delay between loss of signal to the scram solenoid pilot valve andactuation of the 0% reed switch.
Simultaneous with the hydraulic scram, each FMCRD motor is started in order to causeelectric-driven run-up of the ball-nut until it reengages with the hollow piston at the full-in position.
4-92 Revision 0October 2015
Fermi 3Updated Final Safety Analysis Report
This action is known as the scram follow function. It completes the rod full-in insertion and preparesthe drives for subsequent withdrawal to restart the reactor.
After reset of the RPS logic, each scram valve re-closes and allows the CRD Hydraulic Subsystemto recharge the scram accumulators.
Alternate Rod Insertion
The ARI function of the CRD system provides an alternate means for actuating hydraulic scram thatis diverse and independent from the RPS. The ARI is initiated by signals from the DPS ARI ATWSmitigation logic described in Subsection 7.8.1.1.2. Following receipt of an initiation signal,solenoid-operated valves on the scram air header actuate to depressurize the header, allowing theHCU scram valves to open. The FMCRDs then insert the control rods hydraulically in the samemanner as the RPS initiated scram. The same signals that initiate ARI simultaneously actuate theFMCRD motors to insert the control rods electrically.
The FMCRDs are capable of inserting the control rods hydraulically during ATWS pressuretransients with peak reactor pressures of 10.342 MPaG (1500 psig) or less.
High Pressure Makeup
The high pressure makeup mode of operation initiates on receipt of a low reactor water Level 2signal. When this occurs, the following actions take place automatically:
• The CRD pump suction filter bypass valves open.
• The standby CRD pump is actuated. Both CRD pumps are operated in parallel in order to deliver the required makeup flow capacity to the reactor.
• The flow control valves in the high pressure makeup lines open to regulate the makeup water flow rate to the reactor. The test valve in the high pressure makeup line to the RWCU/SDC system opens, if it is closed at the start of the event. The test valve in the return line to the CST closes, if it is open at the start of the event. The pump minimum flow isolation valve closes.
• The isolation valves in the purge water header and scram accumulator charging water header close so that all makeup flow is delivered to the reactor through the high pressure makeup lines.
At high reactor water Level 8, the high pressure makeup flow control valves close to stop flow to thereactor in order to prevent flooding of the Main Steam (MS) lines. Each pump minimum flow valvereopens and both pumps continue to operate in a low flow condition by directing their flow back tothe CST through the pump minimum flow lines. Alternately, the operator may choose at this time tomanually realign the system into its normal operation mode by shutting down one pump andreopening the scram accumulator charging water header and purge water header isolation valvesso that scram accumulator charging and FMCRD purge water flow can be reestablished. In eithercase, the system is reset for an automatic restart of high pressure makeup if the reactor water levelsubsequently reaches Level 2.
4-93 Revision 0October 2015
Fermi 3Updated Final Safety Analysis Report
During testing of this mode of operation, the high pressure makeup line isolation valve is closed andpump flow is directed back to the CST through the test line. The backpressure in the line is variedby positioning of the throttle valve in the test line to simulate system operation over the full range ofreactor pressure.
The high pressure makeup mode of operation is automatically stopped and the high pressuremakeup flow to the RPV isolated by coincident low water level in two of the three GDCS pools ordrywell pressure high and drywell level high. The flow is directed to the CST through the pumpminimum flow lines. This action prevents a reduction of the containment air space volume andincreased containment pressurization caused by injecting water from outside containment duringaccident conditions. In the event of a GDCS failure (GDCS initiation logic and a time delay to allowfor system actuation and a not low signal from two out of three GDCS pools) to successfully injectwater into the reactor the HP CRD isolation bypass valves provide a flow path around the HP CRDisolation valves for high pressure makeup water injection to the RPV. Manual inhibit capability existsfor the high pressure makeup isolation function and manual initiation capability exists for theisolation bypass function for either GDCS injection failure or loss of air.
4.6.1.2.6 Instrumentation and ControlInstrumentation
The instrumentation for the CRD system includes the following:
• Differential pressure sensors monitor pressure drop across the pump suction filters and drive water filters. High filter differential pressure is alarmed in the control room.
• A pressure sensor is located in the inlet piping to each CRD pump to monitor the suction pressure. A low pressure condition trips the associated pump and is alarmed in the control room.
• Two pressure sensors are located in the common pump discharge line downstream of the drive water filters to monitor system pressure. A low pressure condition indicates a failure of the operating pump. A low pressure signal from either sensor actuates the standby pump.
• Four safety-related pressure sensors are located in the scram accumulator charging water header. The output signals from these sensors are provided to the RC&IS logic and RPS logic. A low pressure condition from two-out-of-four sensors causes the RC&IS to generate an all-rod-withdrawal block. A low-low pressure condition causes the RPS to generate a reactor scram.
• A flow sensor is provided in the common pump discharge line downstream of the drive water filters and upstream of the scram accumulator charging water and purge water headers. The flow signal from this sensor provides the control input signal to the purge water flow control valves.
4-94 Revision 0October 2015
Fermi 3Updated Final Safety Analysis Report
• Each of the two high pressure makeup lines downstream of the CRD pumps contains a flow sensor. The flow control signal from these sensors provides the control input signals to the high pressure makeup flow control valves.
• A pressure sensor is provided in the scram air header piping at a location downstream of the air header dump valves and ARI valves and upstream of the scram valves. Both high and low pressure conditions in the header are alarmed in the control room.
• Status indication for the scram valve position is provided in the control room.
Controls and Interlocks
The controls and interlocks for the CRD system include the following:
• The high pressure makeup mode of operation is initiated by a low reactor water Level 2 signal. On receipt of this signal, the following automatic actions occur:
- The standby CRD pump is started. Both pumps operate in parallel to deliver the required makeup flow capacity to the reactor.
- The two pump suction filter bypass valves are opened.
- The scram accumulator charging water header isolation valve and purge water header isolation valve are closed.
- The pump minimum flow line isolation valve closes.
- The flow control valves in the high pressure makeup lines open to regulate the makeup water flow rate to the reactor.
- The test valve in the high pressure makeup line to the RWCU/SDC system opens if it is closed at the start of the event and the test valve in the return line to the CST closes if it is open at the start of the event.
- The high pressure makeup flow control valves close to stop flow to the reactor at high reactor water Level 8. Each pump minimum flow line isolation valve opens and both pumps continue to operate in a low flow condition by directing their flow back to the CST through the pump minimum flow lines. The control valves reopen and the pump minimum flow isolation valve closes to restart high pressure makeup flow if a subsequent Level 2 signal should occur.
• The standby CRD pump is started if a low system pressure condition occurs.
• The CRD pump trips upon receipt of a low suction pressure condition. An adjustable time delay is provided in the pump trip logic to protect against transient conditions.
• The CRD pumps are prevented from being started, or are tripped if running, if the pump lube oil pressure is low.
4-95 Revision 0October 2015
Fermi 3Updated Final Safety Analysis Report
• The RC&IS and the RPS sense the scram accumulator charging water header pressure. The following actions occur based on the level of pressure degradation. The actions are based on two-out-of-four logic. A time delay is provided in the RPS to avoid spurious or inadvertent trips.
- Alarm and all rod withdrawal block due to scram accumulator charging water header pressure - low.
- Reactor trip due to scram accumulator charging water header pressure - low-low.
• Control rod separation detection for any FMCRD causes both annunciation in the control room and a rod withdrawal block.
• The following signals in the CRD system initiate a rod withdrawal block by the RC&IS:
- Rod separation detection (individual rod block).
- Scram accumulator charging water header pressure - low (all rods block).
- Rod gang misalignment (all rods in gang block).
• The high pressure makeup flow control valves are prevented from opening when the inboard feedwater maintenance valve on the feedwater line through which the CRD system delivers flow to the reactor is closed.
• When in the high pressure makeup mode of operation, the high pressure makeup flow to the RPV is isolated on receipt of low water level signals from two-of-the-three GDCS pools or drywell pressure high and drywell level high. The flow is directed to the CST through the pump minimum flow lines.
• When in the high pressure makeup mode of operation and the CRD pumps are isolated due to certain LOCA events and a GDCS failure (GDCS initiation logic and a time delay to allow for system actuation and a not low signal from two out of three GDCS pools) to successfully inject water into the reactor occurs the HP CRD isolation bypass valves open to provide a flow path around the HP CRD isolation valves for high pressure makeup water injection to the RPV. Manual inhibit capability exists for the high pressure makeup isolation function and manual initiation capability exists for the isolation bypass function for either GDCS injection failure or loss of air.
4.6.1.2.7 Power SuppliesEach of the four divisional HCU charging header pressure sensors is powered from their respectivedivisional safety-related power supply. Independence is provided between the safety-relateddivisions for these sensors and between the safety-related and nonsafety-related equipment.
For the FMCRD separation switches, independence is provided between the safety-relateddivisions and between the safety-related divisions and the non-safety-related equipment.
The Medium Voltage Distribution System (MVD) provides the normal and standby electrical powerto the nonsafety-related FMCRD motors.
4-96 Revision 0October 2015
Fermi 3Updated Final Safety Analysis Report
4.6.1.2.8 Environmental QualificationThe CRD system safety-related electrical and mechanical equipment listed in Table 3.11-1 arequalified for harsh environment.
4.6.2 Evaluations of the CRD System
4.6.2.1 Safety EvaluationThe safety evaluation of the control rod drives is given below.
4.6.2.1.1 Evaluation of Scram Time The rod scram function of the CRD system provides the negative reactivity insertion required by theSafety Design Bases in Subsection 4.6.1.1.1. The required scram time is reflected in theChapter 15 safety analyses.
4.6.2.1.2 Scram ReliabilityHigh scram reliability is the result of a number of features of the CRD system. For example:
• Each accumulator provides sufficient stored energy to scram two CRDs at any reactor pressure.
• Each pair of drive mechanisms has its own scram valve and dual solenoid scram pilot valve; therefore, only a single scram valve needs to open for scram to be initiated. Both pilot valve solenoids must be de-energized to initiate a scram.
• The RPS and the HCUs are designed so that the scram signal and mode of operation override all others.
• The FMCRD hollow piston and guide tube are designed so they do not restrain or prevent control rod insertion during scram.
• Each FMCRD mechanism initiates electric motor-driven insertion of its control rod simultaneous with the initiation of hydraulic scram. This provides a diverse means to assure control rod insertion.
4.6.2.1.3 Precluding Excessive Rate of Reactivity Addition Excessive rates of reactivity addition are precluded in the design of the FMCRD. Prevention of rodejection due to FMCRD pressure boundary failure and prevention of control rod drop are describedbelow.
Control Rod Ejection Prevention
A failure of the CRD system pressure boundary generates differential pressure forces across thedrive, which tends to eject the CRD and its attached control rod. The design of the FMCRD includesfeatures that preclude rod ejection from occurring in these hypothetical circumstances. Thefollowing subsections describe how these features function for pressure boundary failures atvarious locations.
4-97 Revision 0October 2015
Fermi 3Updated Final Safety Analysis Report
Failures at Drive Housing Weld - The bottom head of the reactor vessel has a penetration foreach CRD location. A drive housing is raised into position inside each penetration and fastened bywelding. The drive is raised into the drive housing and bolted to a flange at the bottom of thehousing. In the event of a failure of the housing just below the housing-to-penetration weld, or afailure of weld itself with housing remaining intact, ejection of the CRD and attached control rod isprevented by the integral internal CRD blowout support. The details of this internal blowout supportare contained in Subsection 4.6.1.2.2.
Rupture of Hydraulic Line to Drive Housing Flange
For the case of a scram insert line break, a partial or complete circumferential opening is postulatedat or near the point where the line enters the housing flange. This failure, if not mitigated by specialdesign features, could result in rod ejection at speeds exceeding maximum allowable limits. Failureof the scram insert line would cause loss of pressure to the underside of the hollow piston. Theforce resulting from full reactor pressure acting on the cross-sectional area of the hollow piston,plus the weights of the control rod and hollow piston, is imposed on the ball-nut. The ball-nut, inturn, translates this resultant force into a torque acting on the ball screw. When this torque exceedsthe motor residual torque and seal friction, reverse rotation of the ball screw occurs permitting rodwithdrawal.
The FMCRD design provides two diverse means of protection against the results of a postulatedscram insert line failure. The first means of protection is a ball check valve located in the middleflange of the drive at the scram port. Reverse flow during a line break causes the ball to move to theclosed position. This prevents loss of pressure to the underside of the hollow piston, which, in turn,prevents the generation of loads on the drive that could cause rod ejection.
The second means of protection is the FMCRD brake described in Subsection 4.6.1.2.2. In theevent of the failure of the check valve, the passive brake prevents the ball screw rotation and rodejection.
Total Failure of All Drive Flange Bolts - The FMCRD design provides an anti-rotation devicewhich engages when the lower housing (spool piece) is removed for maintenance. This deviceprevents rotation of the ball screw and hence control rod motion when the spool piece is removed.The two components of the anti-rotation device are (1) the upper half of the coupling between thelower housing drive shaft and ball screw, and (2) the back seat of the middle flange (Figure 4.6-1).The coupling of the lower housing drive shaft to the ball screw is splined to permit removal of thelower housing. The underside of the upper coupling piece has a circumferentially splined surfacethat engages with a mating surface on the middle flange back seat when the ball screw is loweredduring spool piece removal. When engaged, ball screw rotation is prevented. In addition topreventing rotation, this device also provides sealing of leakage from the drive while the spool pieceis removed.
4-98 Revision 0October 2015
Fermi 3Updated Final Safety Analysis Report
In the unlikely event of total failure of all the drive flange bolts attaching the spool piece flange andthe middle flange of the drive to the housing flange, the anti-rotation device is engaged when thespool piece falls and the middle flange/outer tube/CRD blowout support is restrained by the controlrod guide tube base bayonet coupling, thus preventing rod ejection (Subsection 4.6.1.2.2).
Control Rod Drop Prevention
The following features prevent control rod drop:
• Two redundant safety-related switches in the FMCRD sense separation of the hollow piston, which positions the control rod, from the ball-nut. These switches sense either separation of the piston from the nut or separation of the control rod from the piston, and block further lowering of the nut thereby preventing drop of either the control rod or the control rod and hollow piston as an assembly (see Subsection 4.6.1.2.2 for further details).
• Two redundant spring-loaded latches on the hollow piston open to engage in the guide tube openings within the FMCRD to support the hollow piston if separation from the nut were to occur. These latches open to support the hollow piston (and control rod) following every scram until the ball-nut is run in to provide the normal support for the hollow piston (and control rod).
• The control rod to hollow piston coupling is a bayonet type coupling. Coupling is verified by pull test for the control rod upon initial coupling at refueling and again each time an attempt is made to drive beyond the “full out” position during reactor operation. The control rod can only be uncoupled from the FMCRD by relative rotation that is not possible during operation. The control rod cannot rotate, because it is always constrained between four fuel assemblies, and the hollow piston/CRD spud coupling cannot rotate, because the hollow piston has rollers that operate in a track within the FMCRD. Only structural failure would permit or result in control rod to FMCRD uncoupling, which, in turn, could only result in rod drop if the redundant switches failed to sense separation. In such failure scenarios, the rate of rod drop may exceed acceptable reactivity addition rates; however, the sequence of failures assumed involve so numerous a failure that the probability of occurrence would be low enough for the event to be categorized as an incredible event.
4.6.2.1.4 CRD MaintenanceThe procedure for removal of the FMCRD for maintenance or replacement is similar to previousBWR product lines. The control rod is first withdrawn to the full-out position. During removal of thelower housing (spool piece) following removal of the position indicator probes and motor unit, thecontrol rod backseats onto the control rod guide tube. This metal-to-metal contact provides the sealthat prevents draining of reactor water when the FMCRD is subsequently lowered out of the CRDhousing. The control rod normally remains in this backseated condition at all times with the FMCRDout; however, in the unlikely event it also has to be removed, a temporary blind flange is firstinstalled on the end of the CRD housing to prevent draining of reactor water.
4-99 Revision 0October 2015
Fermi 3Updated Final Safety Analysis Report
If the operator inadvertently removes the control rod after FMCRD is out without first installing thetemporary blind flange, or conversely, inadvertently removes the FMCRD after first removing thecontrol rod, an un-isolable opening in the bottom of the reactor is created, resulting in drainage ofreactor water. The possibility of inadvertent reactor drain-down by this means is considered remotefor the following reasons:
• Procedural controls similar to those of current BWRs provide the primary means for prevention. Current BWR operating experience demonstrates this to be an acceptable approach. There has been no instance of an inadvertent drain-down of reactor water due to simultaneous CRD and control rod removal.
• During drive removal operations, personnel are required to monitor under the RPV for water leakage out of the CRD housing. Abnormal or excessive leakage occurring after only a partial lowering of the FMCRD within its housing indicates the absence of the full metal-to-metal seal between the control rod and control rod guide tube required for full drive removal. In this event, the FMCRD can then be raised back into its installed position to stop the leakage and allow corrective action.
Maintenance procedures prohibit coincident removal of the control rod and FMCRD of the sameassembly. In addition, contingency procedures address core and spent fuel cooling capability andmitigative actions during FMCRD replacement with fuel in the vessel.
The FMCRD design also allows for separate removal of the motor unit, position indicator probe,separation indicator probe (SIP) and spool piece for maintenance during plant outages withoutdisturbing the upper assembly of the drive. While these FMCRD components are removed forservicing, the associated control rod is maintained in the fully inserted position by one of twomechanical locking devices that prevent rotation of the ball screw and drive shaft.
The first anti-rotation device (Detail A in Figure 4.6-10) is engaged when the motor unit consisting ofthe induction motor, reduction gear, brake and position signal detector is removed. It is aspring-actuated locking cam located on the bottom of the spool piece. When the motor unit islowered away from the spool piece, the locking cam is released from its normally retracted positionand engaged by spring force with gear teeth on the bottom of the magnetic coupling outer rotor,thereby locking the shaft in place.
With the motor unit removed, the locking cam can be visually checked from below the drive to verifythat it is properly engaged. When the vessel head is removed, another means of verification ofproper locking is for the operator to view the top of the control rod from over the reactor vessel. Ifthe top of the control rod is visible at its normal full in position, it provides both direct indication thatthe control rod remains fully inserted and additional assurance that the ball screw is restrained fromreverse rotation. The drive shaft remains locked in this manner until the motor unit is reattached tothe spool piece. During motor installation, a release pin on the motor unit pushes up a plungerlinked to the locking cam as the motor unit is raised into contact with the spool piece. The release
4-100 Revision 0October 2015
Fermi 3Updated Final Safety Analysis Report
pin forces the locking cam away from the teeth on the bottom of the magnetic coupling outer rotorand into the normally retracted, unlocked position.
The second anti-rotation device (Detail B in Figure 4.6-10) is engaged when the spool piece isremoved from the FMCRD. As described in Subsection 4.6.2.1.3, this device is a splinearrangement between the ball screw lower coupling and the middle flange backseat. Whenremoving and lowering the spool piece, the weight of the ball screw, hollow piston and control rodprovides a vertical force in the downward direction that brings the two splines together. This locksthe ball screw into the backseat and prevents reverse rotation. As with the first anti-rotation device,proper engagement of this device can be visually checked from below the drive. If the splines donot completely lock together, there is indication of this because the ball screw does not seat againstthe backseat and there is a small gap for leakage of water. If this should occur, removal of the spoolpiece can be discontinued and corrective action taken. If there is no leakage, it confirms that thesplines are properly locked together. Also as in the case of the first anti-rotation device, visualobservation of the top of the control rod from over the reactor vessel provides another means forverifying proper locking of the ball screw. The ball screw remains locked in this position until thespool piece is reattached to the FMCRD. During spool piece installation, the end of the drive shaftfits into a seat on the end of the ball screw. As the ball screw piece is raised off the middle flangebackseat, the anti-rotation splines disengage and the weight of the ball screw, hollow piston andcontrol rod is transferred to the spool piece assembly.
4.6.2.1.5 Control Rod Drop Potential Consequences• Even if a postulated Control Rod Drop Accident (CRDA) were to occur in the ESBWR, no clad
failures are predicted based on conservative adiabatic calculations using the maximum expected control blade worths.
• Compliance with GDC 28 has been demonstrated for an initial and an equilibrium ESBWR core by showing that the conservatively-calculated fuel enthalpy rises during CRDAs remain well below the lower bound clad failure limits given in Appendix B of Revision 3 to SRP Section 4.2.
• Postulated secondary consequences associated with release of fission gases and fission products, fuel dispersal, flow blockage and energetic increases in coolant pressure do not need to be considered because no clad failures are predicted.
• Cycle-specific confirmatory evaluations will be performed based on an NRC approved or NRC accepted method for reload cores to ensure that all current and emerging requirements pertaining to a postulated CRDA are met.
4.6.3 Testing and Verification of the CRDs
4.6.3.1 Factory Quality Control Tests The quality control specifications and procedures follow the general pattern established for suchspecifications and procedures in BWRs presently in operation.
4-101 Revision 0October 2015
Fermi 3Updated Final Safety Analysis Report
Quality control of welding, heat treatment, dimensional tolerances, material verification and similarfactors are maintained throughout the manufacturing process to assure reliable performance of themechanical reactivity control components.
Some of the quality control tests performed on the CRD mechanisms and HCUs are listed below:
• CRD Mechanism Tests
- Pressure welds on the drives are hydrostatically tested in accordance with ASME codes.
- Electrical components are checked for electrical continuity and resistance to ground.
- Drive parts that cannot be visually inspected for dirt are flushed with filtered water at high velocity. No significant foreign material is permitted in effluent water.
- Each drive is tested for shim (drive-in and -out) motion and control rod position indication.
- Each drive is subjected to cold scram tests at various reactor pressures to verify correct scram performance.
• HCU Tests
- Hydraulic systems are hydrostatically tested in accordance with the applicable code.
- Electrical components and systems are tested for electrical continuity and resistance to ground.
- Correct operation of the accumulator pressure and level switches is verified.
- Each HCU's ability to perform as part of a scram is demonstrated.
4.6.3.2 Functional Tests These tests evaluate drive performance under conditions of crud/contamination, seismicmisalignment, channel bulge, failed buffer, rod drop (to test hollow piston latch functionality), androd ejection (to test FMCRD brake functionality).
4.6.3.3 Operational Tests After installation, all rods and drive mechanisms can be tested through their full stroke foroperability.
The switches that detect separation provide indication and automatic rod withdrawal block should acontrol rod separate from the drive mechanism during rod withdrawal. Additionally, the operator canobserve the incore monitor indications to verify that the control rod is following the drivemechanism. All control rods that are partially withdrawn from the core can be tested forrod-following by inserting or withdrawing the rod one or two steps and returning it to its originalposition, while the operator observes the incore monitor indications.
4-102 Revision 0October 2015
Fermi 3Updated Final Safety Analysis Report
To make a positive test of control rod to CRD coupling integrity, the operator can withdraw a controlrod to the end of its travel and then attempt to withdraw the drive to the overtravel position. Failureof the hollow piston to overtravel-out demonstrates the integrity of the rod-to-drive coupling.
CRD Hydraulic Subsytem pressures can be observed from instrumentation in the control room.Scram accumulator pressures can be observed on the nitrogen pressure gauges.
4.6.3.4 Acceptance Tests Criteria for acceptance of the individual CRD mechanisms and the associated control andprotection systems is incorporated in specifications and test procedures covering three distinctphases:
• Pre-installation
• After installation prior to startup
• During startup testing
The pre-installation specification defines criteria and acceptable ranges of such characteristics asseal leakage, friction and scram performance under fixed test conditions that must be met beforethe component can be shipped.
The after-installation, preoperational tests (Section 14.2) include normal and scram motion and areprimarily intended to verify that piping, valves, electrical components and instrumentation areproperly installed. The test specifications include criteria and acceptable ranges for drive speed,scram valve response times, and control pressures. These are tests intended more to documentsystem condition rather than tests of performance.
As fuel is placed in the reactor, the startup test procedure (Section 14.2) is followed. The tests inthis procedure are intended to demonstrate that the initial operational characteristics meet the limitsof the specifications over the range of primary coolant temperatures and pressures from ambient tooperating. The detailed specifications and procedures are similar to those in BWRs presently inoperation.
4.6.3.5 Surveillance Tests The surveillance requirements for the CRD system are described as follows:
• Sufficient control rods are withdrawn, following a refueling outage when core alterations are performed, to demonstrate with adequate SDM that the core can be made subcritical at any time in the subsequent fuel cycle with the maximum worth control rod pair having the same HCU or the single rod attached to the unpaired HCU, if of greater worth, withdrawn and all other operable rods fully inserted.
• Each fully withdrawn control rod is exercised at least once each week. Each partially withdrawn control rod is exercised at least once each month.
4-103 Revision 0October 2015
Fermi 3Updated Final Safety Analysis Report
• The coupling integrity is verified for each withdrawn control rod as follows:
- When the rod is first withdrawn, observe the control rod separation switch response and discernible response of the nuclear instrumentation.
- When the rod is fully withdrawn the first time, observe that the drive does not go to the overtravel-out position. Observation of the separation switches provides direct indication that the control rod is following the drive during withdrawal, but does not provide a direct check on coupling integrity. Additionally, observation of a response from the nuclear instrumentation during an attempt to withdraw a control rod provides another indirect indication that the rod and drive are coupled. The overtravel-out position feature provides a positive check on the coupling integrity, for only an uncoupled drive can reach the overtravel-out position.
• During operation, accumulator pressure and level at the normal operating value are verified. Experience with CRD systems of the same type indicates that weekly verification of accumulator pressure and level is sufficient to assure operability of the accumulator portion of the CRD system.
• At each refueling outage, each operable control rod is subjected to scram time tests from the fully withdrawn position. Experience indicates that the scram times of the control rods do not significantly change over the time interval between refueling outages. A test of the scram times at each refueling outage is sufficient to identify any significant lengthening of the scram times. However, an additional test of a representative sample of the control rods, as defined in the plant Technical Specifications, is performed every 200 days of cumulative operation in Mode 1.
• Each affected control rod is subjected to scram tests from the fully withdrawn position following work on the control rod or CRD system that could affect scram time, and after fuel movement has occurred within the affected cell.
• The high pressure makeup mode of operation is tested every refueling outage to verify the automatic response of the system to a simulated or actual initiation signal. Every quarter each CRD pump is tested to verify that it can develop the required flow rate for high pressure makeup against a system head corresponding to the required reactor pressure. This test uses the system test return line to the CST. The HP CRD isolation valves will be tested as part of the IST program as shown in Table 3.9-8. The HP CRD isolation bypass valves will be tested at a frequency of 24 months to verify the automatic response to a simulated or actual initiation signal.
4.6.4 Information for Combined Performance of Reactivity Control Systems
4.6.4.1 Vulnerability to Common Mode Failures The Reactivity Control System is located such that it is protected from common mode failures dueto missiles, failures of moderate and high energy piping, and fire. Sections 3.5, 3.6, 3.7, and
4-104 Revision 0October 2015
Fermi 3Updated Final Safety Analysis Report
Subsection 9.5.1 discuss protection of safety-related systems against missiles, pipe breaks,seismic and fire, respectively.
4.6.4.2 Accidents Taking Credit for Multiple Reactivity SystemsThere are no postulated accidents documented in Chapter 15 that take credit for two or morereactivity control systems preventing or mitigating an accident.
4.6.5 Evaluation of Combined Performance As indicated in Subsection 4.6.4.2, credit is not taken for multiple reactivity control systems for anypostulated accidents documented in Chapter 15.
4.6.6 COL InformationNone.
4.6-1-A CRD and FMCRD Maintenance Procedures (Deleted)
4.6.7 ReferencesNone.
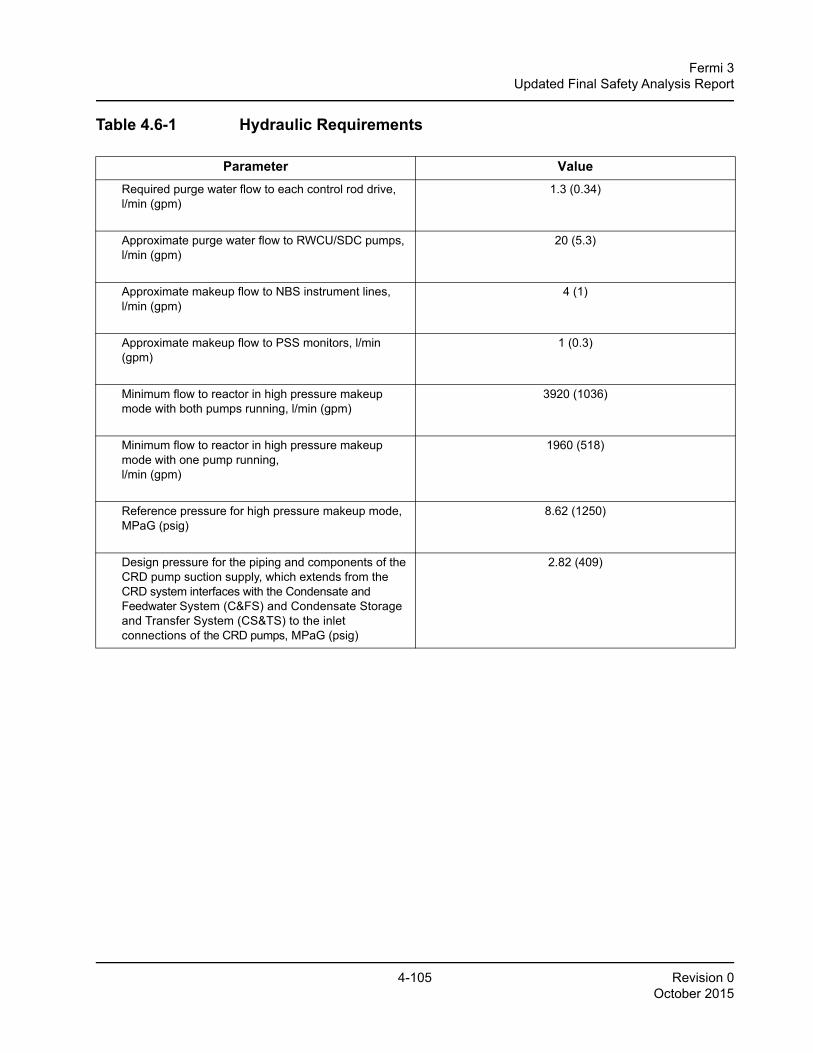
4-105 Revision 0October 2015
Fermi 3Updated Final Safety Analysis Report
Table 4.6-1 Hydraulic Requirements
Parameter ValueRequired purge water flow to each control rod drive, l/min (gpm)
1.3 (0.34)
Approximate purge water flow to RWCU/SDC pumps, l/min (gpm)
20 (5.3)
Approximate makeup flow to NBS instrument lines, l/min (gpm)
4 (1)
Approximate makeup flow to PSS monitors, l/min (gpm)
1 (0.3)
Minimum flow to reactor in high pressure makeup mode with both pumps running, l/min (gpm)
3920 (1036)
Minimum flow to reactor in high pressure makeup mode with one pump running, l/min (gpm)
1960 (518)
Reference pressure for high pressure makeup mode, MPaG (psig)
8.62 (1250)
Design pressure for the piping and components of the CRD pump suction supply, which extends from the CRD system interfaces with the Condensate and Feedwater System (C&FS) and Condensate Storage and Transfer System (CS&TS) to the inlet connections of the CRD pumps, MPaG (psig)
2.82 (409)
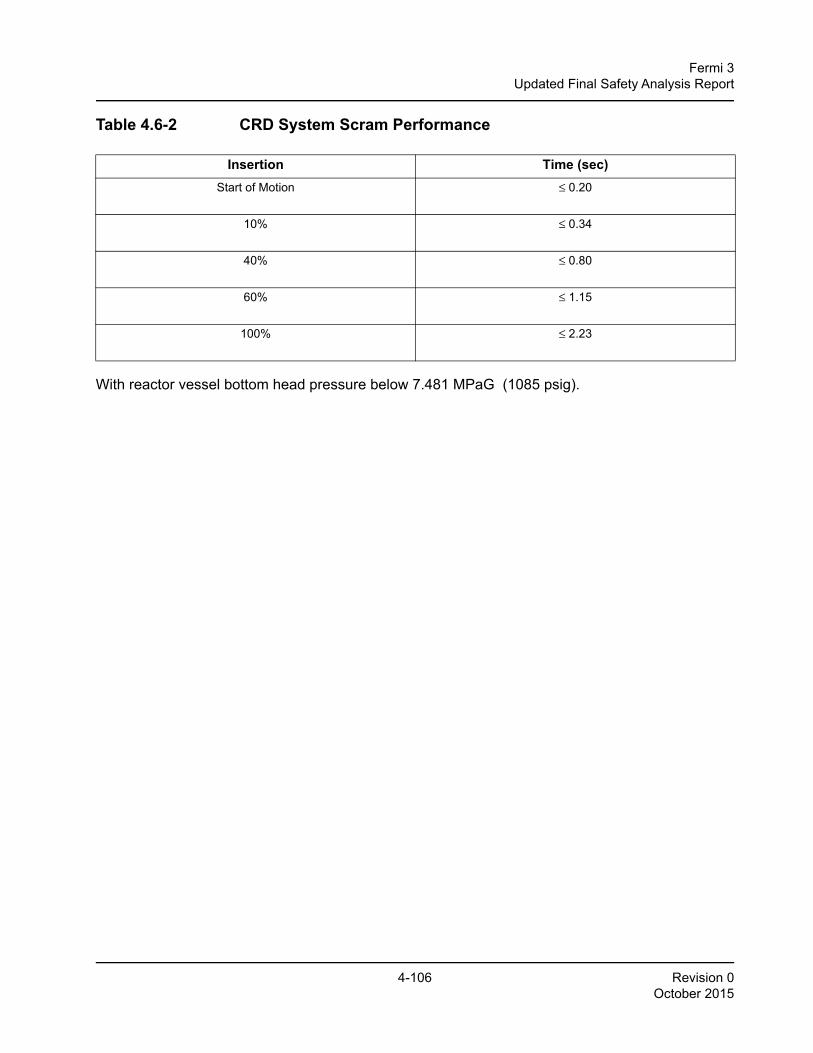
4-106 Revision 0October 2015
Fermi 3Updated Final Safety Analysis Report
Table 4.6-2 CRD System Scram Performance
With reactor vessel bottom head pressure below 7.481 MPaG (1085 psig).
Insertion Time (sec)Start of Motion ≤ 0.20
10% ≤ 0.34
40% ≤ 0.80
60% ≤ 1.15
100% ≤ 2.23
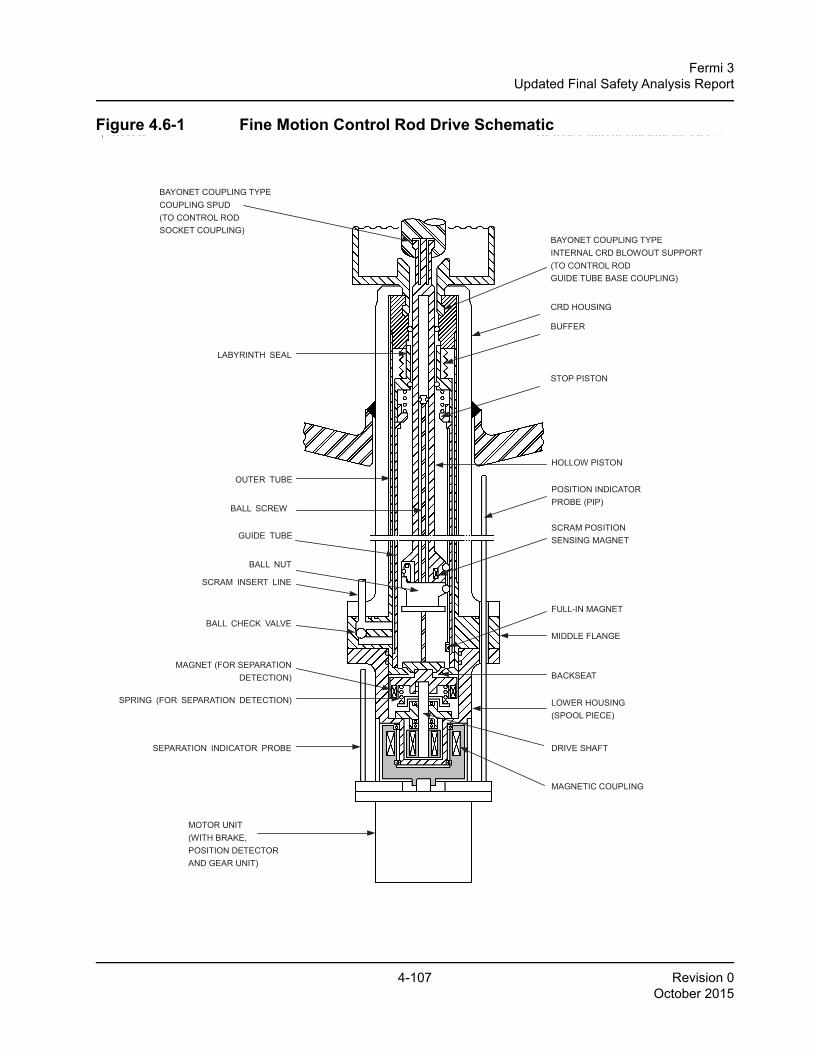
4-107 Revision 0October 2015
Fermi 3Updated Final Safety Analysis Report
Figure 4.6-1 Fine Motion Control Rod Drive SchematicESBWR Design Control Document/Tier 2
BAYONET COUPLING TYPE INTERNAL CRD BLOWOUT SUPPORT (TO CONTROL ROD GUIDE TUBE BASE COUPLING)
STOP PISTON
HOLLOW PISTON
POSITION INDICATOR PROBE (PIP)
SCRAM POSITION SENSING MAGNET
MIDDLE FLANGE
BACKSEAT
MAGNETIC COUPLING
LOWER HOUSING (SPOOL PIECE)
SEPARATION INDICATOR PROBE
SPRING (FOR SEPARATION DETECTION)
MAGNET (FOR SEPARATIONDETECTION)
BALL CHECK VALVE
SCRAM INSERT LINE
BALL NUT
BALL SCREW
OUTER TUBE
LABYRINTH SEAL
BAYONET COUPLING TYPE COUPLING SPUD (TO CONTROL ROD SOCKET COUPLING)
GUIDE TUBE
MOTOR UNIT (WITH BRAKE, POSITION DETECTOR AND GEAR UNIT)
BUFFER
CRD HOUSING
DRIVE SHAFT
FULL-IN MAGNET
Figure 4.6-1. Fine Motion Control Rod Drive Schematic
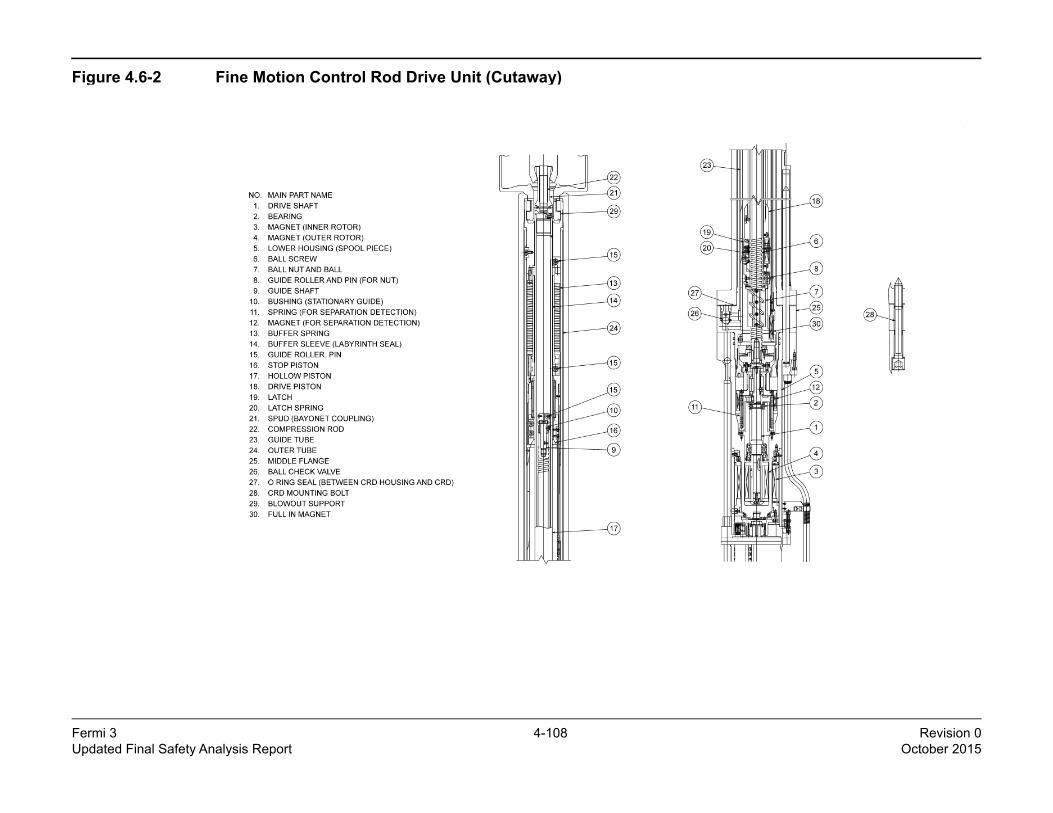
Fermi 3 4-108 Revision 0Updated Final Safety Analysis Report October 2015
Figure 4.6-2 Fine Motion Control Rod Drive Unit (Cutaway)
26A6642AP Rev. 09 ESBWR Design Control Docum
4.6-32
Figure 4.6-2. Fine Motion Control Rod Drive Unit (Cutaway)
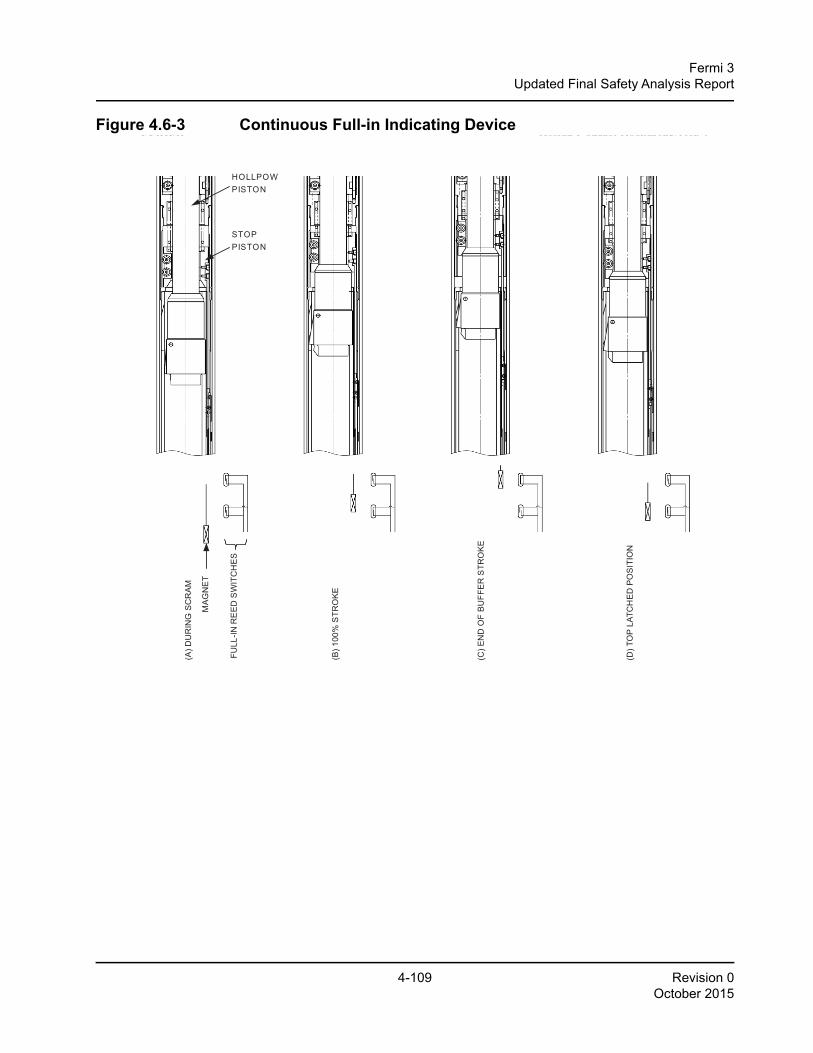
4-109 Revision 0October 2015
Fermi 3Updated Final Safety Analysis Report
Figure 4.6-3 Continuous Full-in Indicating DeviceESBWR Design Control Document/Tier 2
(A
) DU
RIN
G S
CR
AM
FULL
-IN R
EE
D S
WIT
CH
ES
MA
GN
ET
(B) 1
00%
STR
OK
E
(C) E
ND
OF
BU
FFE
R S
TRO
KE
(D) T
OP
LATC
HE
D P
OS
ITIO
N
HOLLPOW PISTON
STOP PISTON
Figure 4 6-3 Continuous Full-in Indicating Device
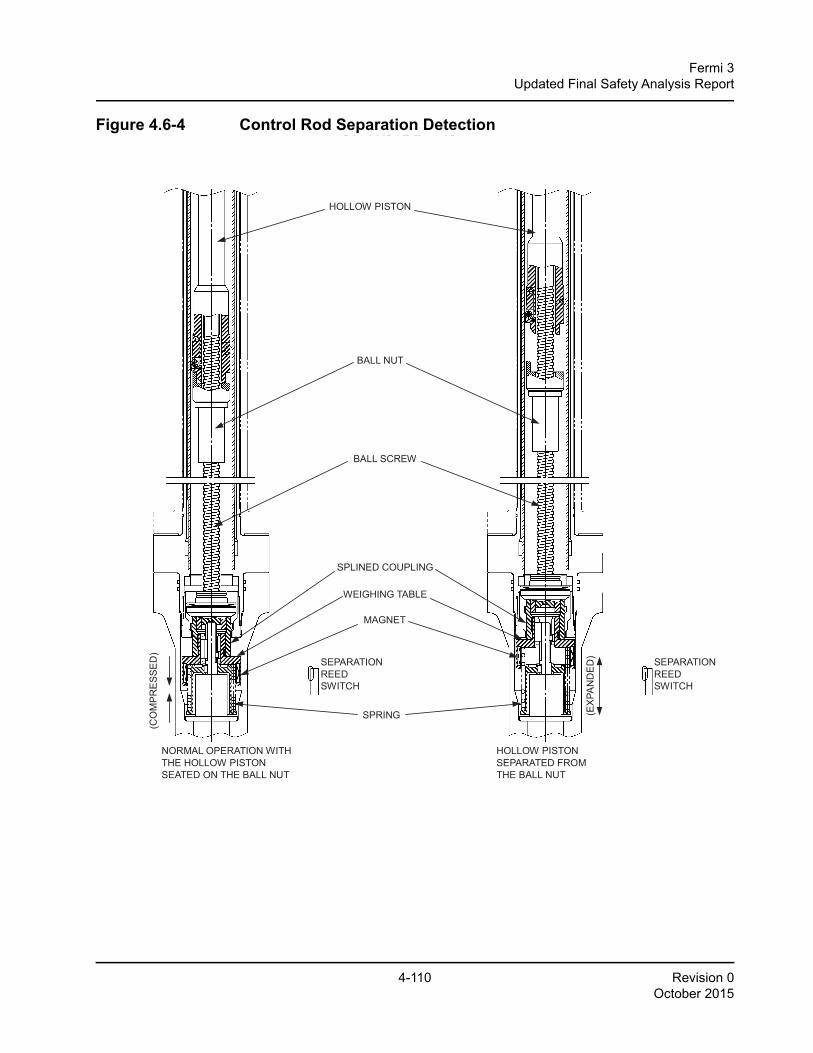
4-110 Revision 0October 2015
Fermi 3Updated Final Safety Analysis Report
Figure 4.6-4 Control Rod Separation Detection26A6642AP Rev. 10
ESBWR Design Control Document/Tier 2
HOLLOW PISTON
SPRING
MAGNET
BALL SCREW
BALL NUT
NORMAL OPERATION WITH THE HOLLOW PISTON SEATED ON THE BALL NUT
HOLLOW PISTON SEPARATED FROM THE BALL NUT
(CO
MP
RES
SED
)
(EX
PAN
DE
D)
SPLINED COUPLING
SEPARATION REED SWITCH
WEIGHING TABLE
SEPARATION REED SWITCH
Figure 4.6-4. Control Rod Separation Detection
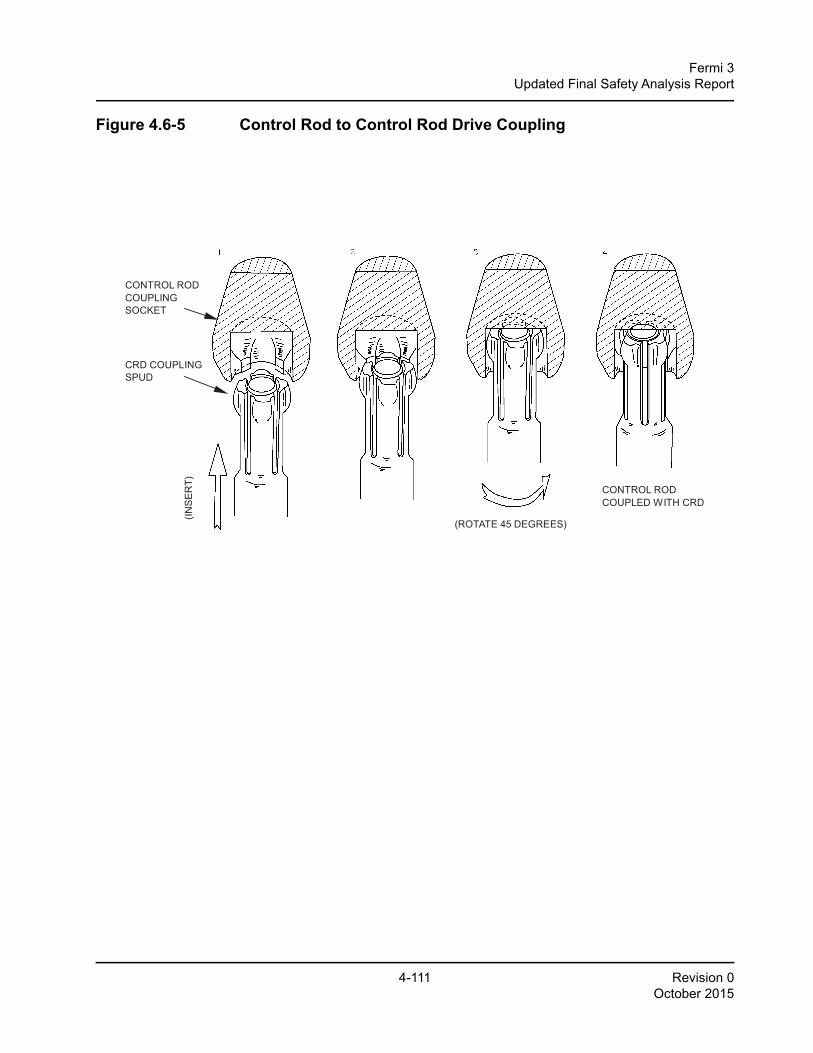
4-111 Revision 0October 2015
Fermi 3Updated Final Safety Analysis Report
Figure 4.6-5 Control Rod to Control Rod Drive Coupling26A6642AP Rev. 10
ESBWR Design Control Document/Tier 2
CONTROL ROD COUPLING SOCKET
CRD COUPLING SPUD
(INS
ER
T)
(ROTATE 45 DEGREES)
CONTROL ROD COUPLED WITH CRD
Figure 4.6-5. Control Rod to Control Rod Drive Coupling
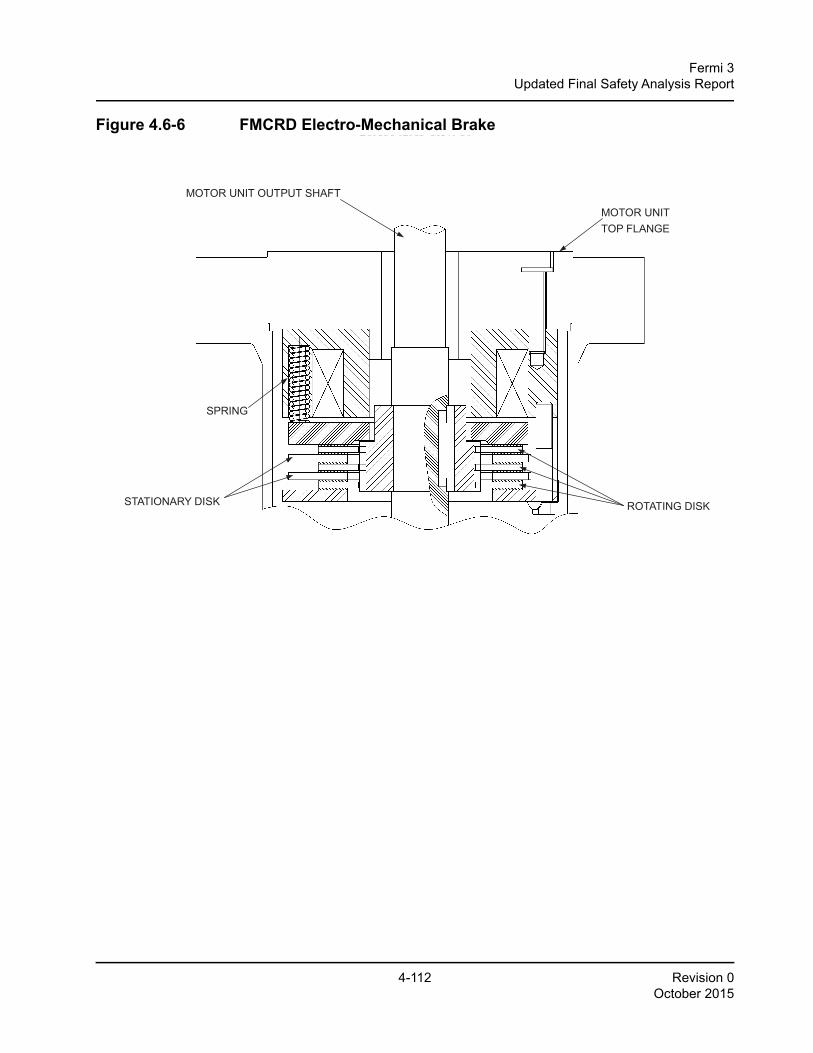
4-112 Revision 0October 2015
Fermi 3Updated Final Safety Analysis Report
Figure 4.6-6 FMCRD Electro-Mechanical Brake26A6642AP Rev. 10 ESBWR Design Control Document/Tier 2
MOTOR UNITTOP FLANGE
MOTOR UNIT OUTPUT SHAFT
SPRING
STATIONARY DISK ROTATING DISK
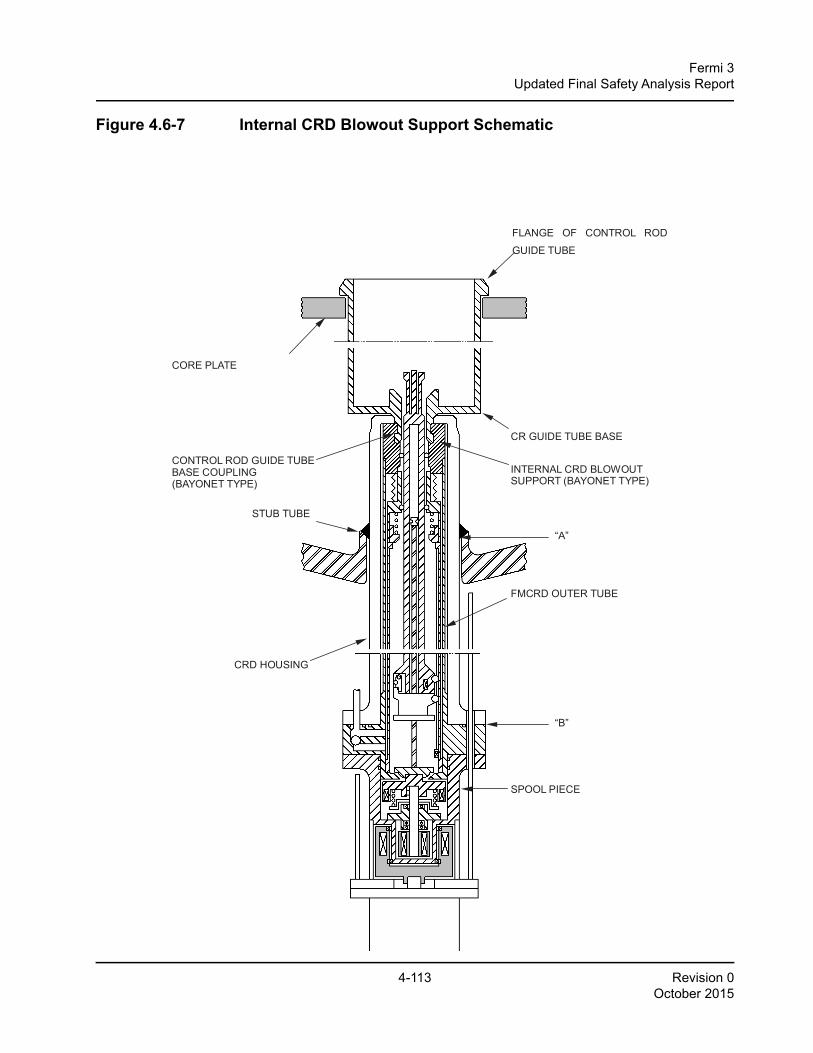
4-113 Revision 0October 2015
Fermi 3Updated Final Safety Analysis Report
Figure 4.6-7 Internal CRD Blowout Support Schematic
26A6642AP Rev. 10 ESBWR Design Control Document/Tier
FLANGE OF CONTROL ROD
GUIDE TUBE
CORE PLATE
CR GUIDE TUBE BASE
INTERNAL CRD BLOWOUT SUPPORT (BAYONET TYPE)
CONTROL ROD GUIDE TUBE BASE COUPLING (BAYONET TYPE)
STUB TUBE
“A”
FMCRD OUTER TUBE
“B”
SPOOL PIECE
CRD HOUSING
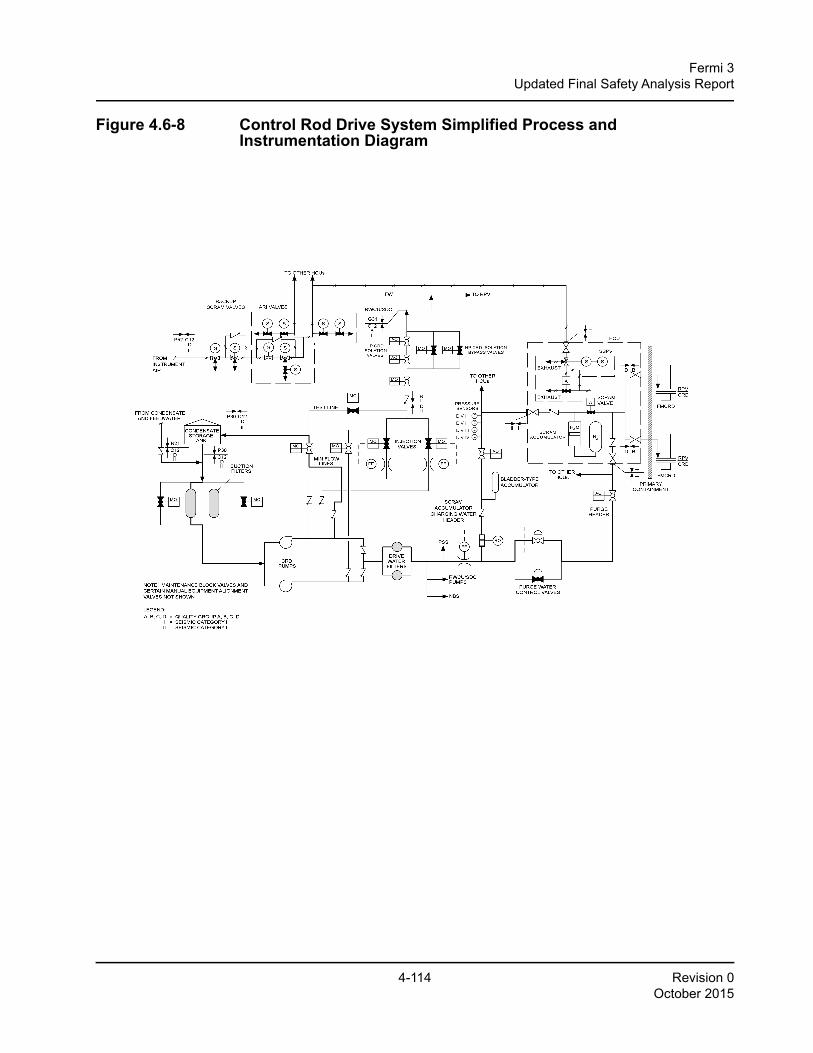
4-114 Revision 0October 2015
Fermi 3Updated Final Safety Analysis Report
Figure 4.6-8 Control Rod Drive System Simplified Process and Instrumentation Diagram
26A6642A
P Rev. 09
ESBWR
Design C
ontrol Docum
ent/Tier 2
Figure 4.6-8. C
ontrol Rod D
rive System Sim
plified Process and Instrumentation D
iagram
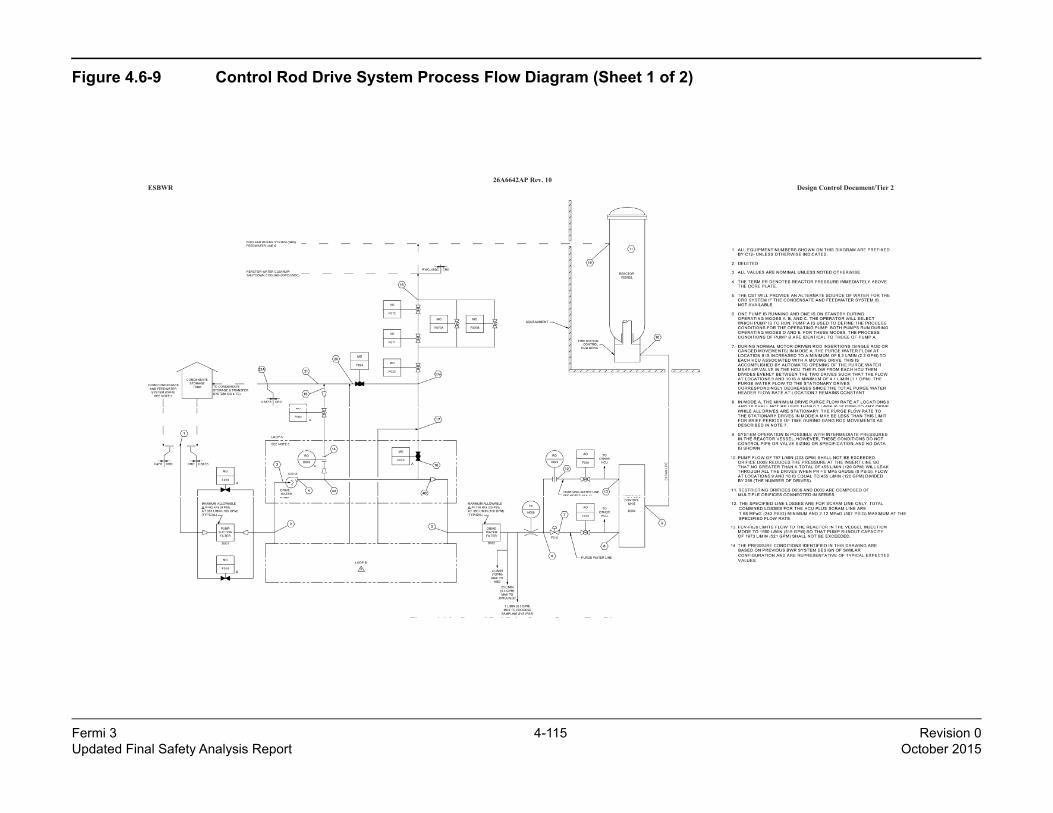
Fermi 3 4-115 Revision 0Updated Final Safety Analysis Report October 2015
Figure 4.6-9 Control Rod Drive System Process Flow Diagram (Sheet 1 of 2)
26A6642AP Rev. 10 ESBWR Design Control Document/Tier 2
Fi 4 6 9 C t l R d D i S t P Fl Di
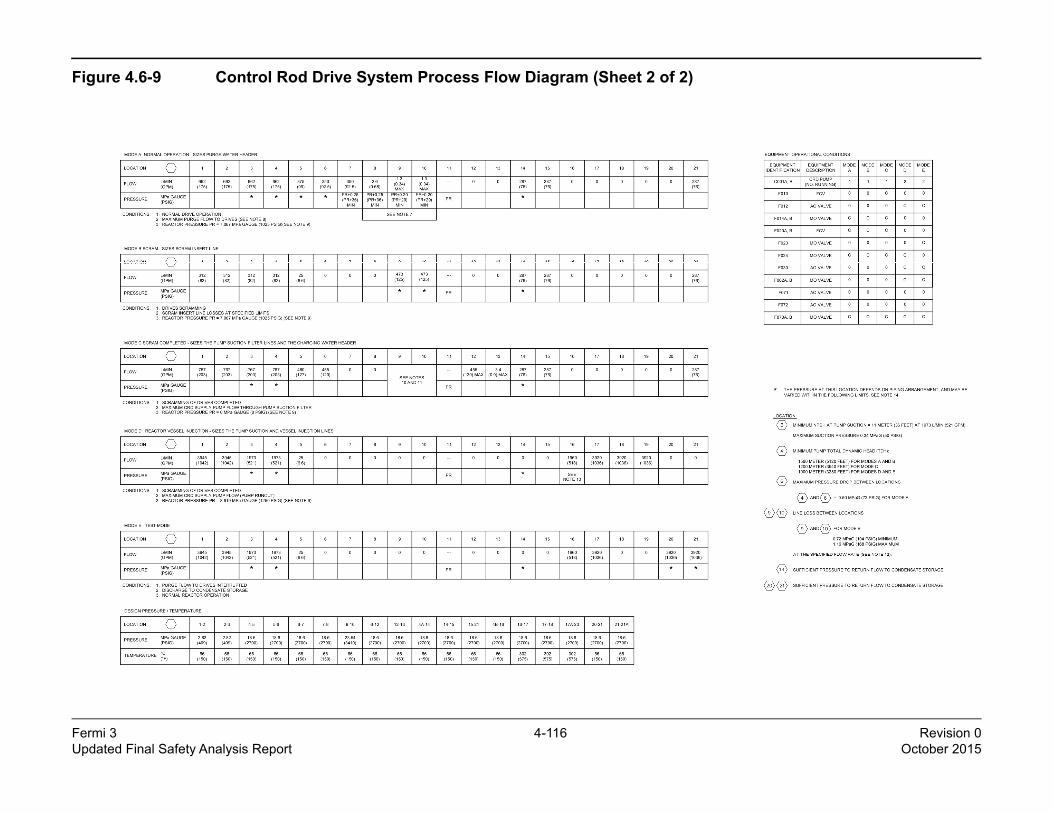
Fermi 3 4-116 Revision 0Updated Final Safety Analysis Report October 2015
Figure 4.6-9 Control Rod Drive System Process Flow Diagram (Sheet 2 of 2)
26A6642AP Rev. 10 ESBWR Design Control Document/Tier 2
Figure 4.6-9. Control Rod Drive System Process Flow Diagram
(Sheet 2 of 2)
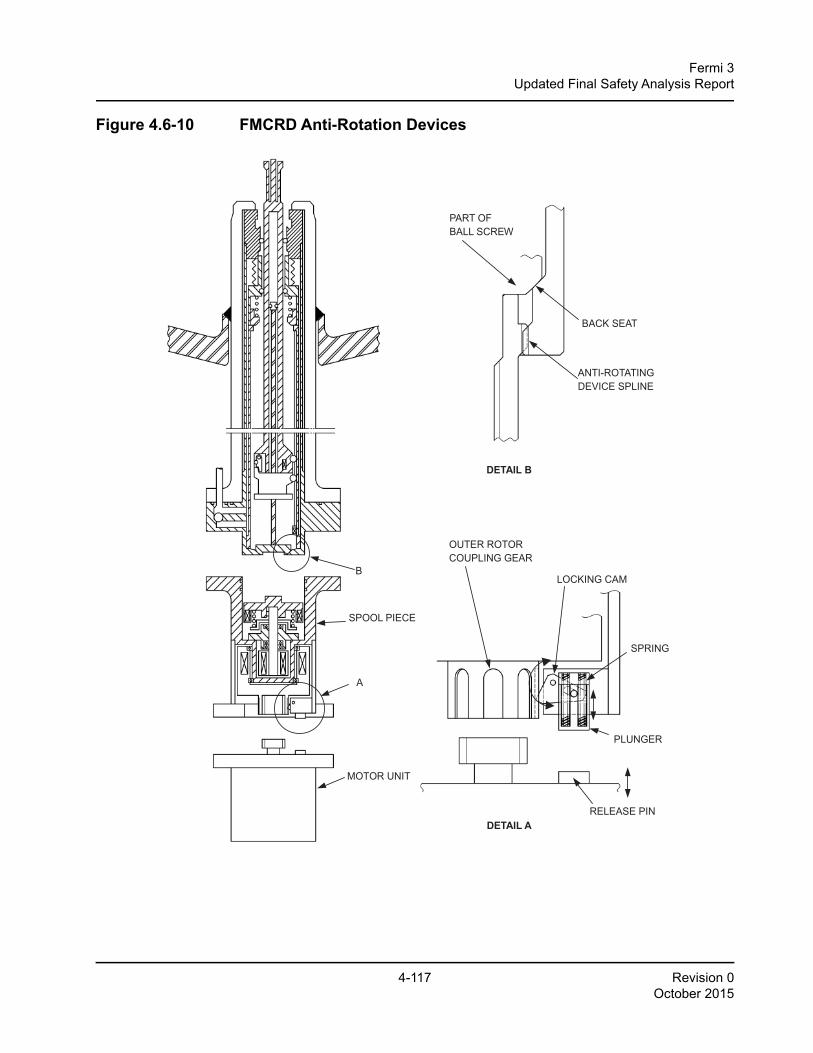
4-117 Revision 0October 2015
Fermi 3Updated Final Safety Analysis Report
Figure 4.6-10 FMCRD Anti-Rotation Devices
B
SPOOL PIECE
A
MOTOR UNIT
LOCKING CAM
SPRING
RELEASE PIN
OUTER ROTOR COUPLING GEAR
DETAIL A
DETAIL B
PART OF BALL SCREW
ANTI-ROTATING DEVICE SPLINE
BACK SEAT
PLUNGER
Figure 4.6-10. FMCRD Anti-Rotation Devices
4-118 Revision 0October 2015
Fermi 3Updated Final Safety Analysis Report
Appendix 4A Typical Control Rod Patterns and Associated Power Distribution for ESBWR
4A.1 IntroductionThis appendix identifies Reference 4A-2 for a simulation of a representative equilibrium cycle. Thecontrol rod patterns used in Reference 4A-2 are just one example of a set of control rod patternswhich could be used and result in radial and axial power distributions that meet required operatingthermal limits. Reference 4A-1 provides control rod patterns and results for an initial core designwhich meet the required operating thermal limits.
The basic control rod strategy for this case consists of control rod patterns used only to compensatefor excess reactivity and to aid in shaping the axial power profile.
There are no changes to the fuel, control rod, or core design from that described in the referencedcertified design.
4A.2 Results of Core Simulation StudiesReference 4A-2 provides the stepwise control rod patterns, relative axial power and exposuredistributions, relative integrated power per bundle, and average bundle exposure during the cycle.The results demonstrate that this design can be operated throughout this cycle with adequatethermal margins to allow for routine operating maneuvers. All Specified Acceptable Fuel DesignLimits are satisfied with margin.
4A.3 COL Information
4A-1-A Variances from Certified DesignThis COL item is addressed in Appendix 4A.1.
4A.4 References
4A-1 Global Nuclear Fuel, "ESBWR Initial Core Nuclear Design Report," NEDC-33326P-A, Class III (Proprietary), Revision 1, September 2010, NEDO-33326-A, Class I (Non-proprietary), Revision 1, September 2010.
4A-2 Global Nuclear Fuel, "GE14 for ESBWR Nuclear Design Report," NEDC-33239P-A, Class III (Proprietary), Revision 5, October 2010, NEDO-33239-A, Class I (Non-proprietary), Revision 5, October 2010.

4-119 Revision 0October 2015
Fermi 3Updated Final Safety Analysis Report
Table 4A-1 (Deleted)
4-120 Revision 0October 2015
Fermi 3Updated Final Safety Analysis Report
Figure 4A-1a (Deleted) Figure 4A-1b (Deleted) Figure 4A-1c (Deleted) Figure 4A-1d (Deleted) Figure 4A-1e (Deleted) Figure 4A-2a (Deleted) Figure 4A-2b (Deleted) Figure 4A-2c (Deleted) Figure 4A-2d (Deleted) Figure 4A-2e (Deleted) Figure 4A-3a (Deleted) Figure 4A-3b (Deleted) Figure 4A-3c (Deleted) Figure 4A-3d (Deleted) Figure 4A-3e (Deleted) Figure 4A-4a (Deleted) Figure 4A-4b (Deleted) Figure 4A-4c (Deleted) Figure 4A-4d (Deleted) Figure 4A-4e (Deleted) Figure 4A-5a (Deleted) Figure 4A-5b (Deleted) Figure 4A-5c (Deleted) Figure 4A-5d (Deleted) Figure 4A-5e (Deleted) Figure 4A-6a (Deleted) Figure 4A-6b (Deleted) Figure 4A-6c (Deleted) Figure 4A-6d (Deleted) Figure 4A-6e (Deleted) Figure 4A-7a (Deleted) Figure 4A-7b (Deleted) Figure 4A-7c (Deleted) Figure 4A-7d (Deleted) Figure 4A-7e (Deleted)
4-121 Revision 0October 2015
Fermi 3Updated Final Safety Analysis Report
Figure 4A-8a (Deleted) Figure 4A-8b (Deleted) Figure 4A-8c (Deleted) Figure 4A-8d (Deleted) Figure 4A-8e (Deleted) Figure 4A-9a (Deleted) Figure 4A-9b (Deleted) Figure 4A-9c (Deleted) Figure 4A-9d (Deleted) Figure 4A-9e (Deleted) Figure 4A-10a (Deleted) Figure 4A-10b (Deleted) Figure 4A-10c (Deleted) Figure 4A-10d (Deleted) Figure 4A-10e (Deleted) Figure 4A-11a (Deleted) Figure 4A-11b (Deleted) Figure 4A-11c (Deleted) Figure 4A-11d (Deleted) Figure 4A-11e (Deleted) Figure 4A-12a (Deleted) Figure 4A-12b (Deleted) Figure 4A-12c (Deleted) Figure 4A-12d (Deleted) Figure 4A-12e (Deleted) Figure 4A-13a (Deleted) Figure 4A-13b (Deleted) Figure 4A-13c (Deleted) Figure 4A-13d (Deleted) Figure 4A-13e (Deleted) Figure 4A-14a (Deleted) Figure 4A-14b (Deleted) Figure 4A-14c (Deleted) Figure 4A-14d (Deleted) Figure 4A-14e (Deleted)
4-122 Revision 0October 2015
Fermi 3Updated Final Safety Analysis Report
Figure 4A-15a (Deleted) Figure 4A-15b (Deleted) Figure 4A-15c (Deleted) Figure 4A-15d (Deleted) Figure 4A-15e (Deleted) Figure 4A-16a (Deleted) Figure 4A-16b (Deleted) Figure 4A-16c (Deleted) Figure 4A-16d (Deleted) Figure 4A-16e (Deleted) Figure 4A-17a (Deleted) Figure 4A-17b (Deleted) Figure 4A-17c (Deleted) Figure 4A-17d (Deleted) Figure 4A-17e (Deleted) Figure 4A-18a (Deleted) Figure 4A-18b (Deleted) Figure 4A-18c (Deleted) Figure 4A-18d (Deleted) Figure 4A-18e (Deleted) Figure 4A-19 (Deleted)
4-123 Revision 0October 2015
Fermi 3Updated Final Safety Analysis Report
Appendix 4B Fuel Licensing Acceptance CriteriaThe fuel licensing acceptance criteria are presented in the following subsections.
4B.1 General CriteriaThe following is a summary of the principal requirements, which must be met by the fuel supplied toany facility utilizing the certified design.
• Fuel rod failure is predicted to not occur as a result of normal operation and anticipated operational occurrences.
• Control rod insertion will not be prevented as a result of normal operation, anticipated operational occurrences or postulated accident.
• The number of fuel rod failures will not be underestimated for postulated accidents.
• Coolability will be maintained for all design basis events, including seismic and LOCA events.
• Specified acceptable fuel design limits (thermal and mechanical design limits) will not be exceeded during any condition of normal operation, including the effects of anticipated operational occurrences.
• In the power operating ranges, the prompt inherent nuclear feedback characteristics will tend to compensate for a rapid increase in reactivity.
• The reactor core and associated coolant, control and protection systems will be designed to assure that power oscillations which can result in conditions exceeding specified acceptable fuel design limits are not possible or can be reliably and readily detected and suppressed.
The following is a summary of the principal requirements, which must be met by the fuel channelsupplied to any facility using the certified design:
• During any design basis events including the mechanical loading from safe shutdown earthquake event combined with LOCA event, fuel channel damage will not be so severe as to prevent control rod insertion when it is required.
• Coolability will be maintained for all design basis events.
• Channel bowing will not cause specified acceptable fuel design limits to be exceeded during normal operation and anticipated operational occurrences.
4B.2 Thermal-MechanicalA set of design limits is defined, and applied in the fuel rod thermal-mechanical design analyses, toensure that fuel rod mechanical integrity is maintained throughout the fuel rod design lifetime. Thedesign criteria were developed by Global Nuclear Fuel (GNF) and other specific industry groups tofocus on the parameters most significant to fuel performance and operating occurrences that canrealistically limit fuel performance. The specific criteria are patterned after ANSI/ANS-57.5(Reference 4B-1) and Standard Review Plan 4.2, Fuel System Design (Reference 4B-2). Table
4-124 Revision 0October 2015
Fermi 3Updated Final Safety Analysis Report
4B-1 presents a summary of the design criteria. The bases for the design criteria listed in Table4B-1 are presented below.
1. Cladding Lift-Off / Fuel Rod Internal Pressure (Item 1 of Table 4B-1)
The fuel rod is filled with helium during manufacture to a specified fill gas pressure. With the initial rise to power, this fuel rod internal pressure increases due to the corresponding increase in the gas average temperature and the reduction in the fuel rod void volume due to fuel pellet expansion and inward cladding elastic deflection due to the higher reactor coolant pressure. With continued irradiation, the fuel rod internal pressure progressively increases due to the release of gaseous fission products from the fuel pellets to the fuel rod void volume. With further irradiation, a potential adverse thermal feedback condition may arise due to excessive fuel rod internal pressure.
In this case, the tensile cladding stress resulting from a fuel rod internal pressure greater than the coolant pressure causes the cladding to deform outward (cladding creepout). If the rate of the cladding outward deformation (cladding creepout rate) exceeds the rate at which the fuel pellet expands due to irradiation swelling (fuel swelling rate), the pellet-cladding gap begins to open (or increase if already open). An increase in the pellet-cladding gap reduces the pellet-cladding thermal conductance thereby increasing fuel temperatures. The increased fuel temperatures results in further fuel pellet fission gas release, greater fuel rod internal pressure, and correspondingly a faster rate of cladding creepout and gap opening.
This potential adverse thermal feedback condition is avoided by limiting the cladding creepout rate, due to fuel rod internal pressure, to less than or equal to the fuel pellet irradiation swelling rate. This is confirmed through the calculation of a design ratio (of internal pressure to critical pressure) and ensuring that the calculated design ratio is less than 1.00 at any point in time for all fuel rod types.
2. Fuel Temperature (Melting, Item 2 of Table 4B-1)
Numerous irradiation experiments have demonstrated that extended operation with significant fuel pellet central melting does not result in damage to the fuel rod cladding. However, the fuel rod performance is evaluated to ensure that fuel melting will not occur. To achieve this objective, the fuel rod is evaluated to ensure that fuel melting during normal steady-state operation and anticipated operational occurrences does not occur.
3. Cladding Strain
After the initial rise to power and the establishment of steady-state operating conditions, the pellet-cladding gap will eventually close due to the combined effects of cladding creep- down, fuel pellet irradiation swelling, and fuel pellet fragment outward relocation. Once hard pellet-cladding contact, Pellet Cladding Mechanical Interaction, has occurred, cladding outward diametral deformation can occur. The consequences of this cladding deformation are dependent on the deformation rate (strain rate).
4-125 Revision 0October 2015
Fermi 3Updated Final Safety Analysis Report
- High Strain Rate (Anticipated Operational Occurrences, Item 3 of Table 4B-1)Depending on the extent of irradiation exposure, the magnitude of the power increase, and the final peak power level, the cladding can be strained due to the fuel pellet thermal expansion occurring during rapid power ramps. This high strain rate deformation can be a combination of (a) Plastic deformation during the power increase due to the cladding stress exceeding the cladding material yield strength, and (b) Creep deformation during the elevated power hold time due to creep-assisted relaxation of the high cladding stresses. This cladding deformation during anticipated operational occurrences is limited to ensure that loss of fuel rod mechanical integrity (cladding circumferential strain greater than 1%) doesn't occur due to pellet-cladding mechanical interaction. The specific strain criteria, i.e., percentage of plastic or total, will be defined in the fuel thermal-mechanical design licensing topical report for each licensed design.
To ensure that uniform properties of the cladding are maintained, a design oxide thickness and hydrogen limit will be specified for each fuel design in the fuel thermal- mechanical design licensing topical report for each licensed design.
In non-barrier cladding, fast power ramps can also cause a chemical/mechanical pellet cladding interaction commonly known as Pellet Clad Interaction / Stress Corrosion Cracking (PCI/SCC). To prevent PCI/SCC failures in non-barrier cladding, reactor operational restrictions must be imposed. To reduce the potential for PCI/SCC failures without imposing reactor operational restrictions, GNF invented and developed barrier cladding. Barrier cladding utilizes a thin zirconium layer on the inner surface of Zircaloy tubes. The minimum thickness of the zirconium layer is specified to ensure that small cracks which are known to initiate on the inner surface of barrier cladding (the surface layer subject to hardening by absorption of fission products during irradiation) will not propagate through the zirconium barrier into the Zircaloy tube. The barrier concept has been demonstrated by experimental irradiation testing and extensive commercial reactor operation to be an effective measure for reducing PCI/SCC failures.
- Low Strain Rate (Steady-State Operation, no limit in Table 4B-1)During normal steady-state operation, once the cladding has come into hard contact with the fuel, subsequent fuel pellet irradiation swelling causes the cladding to deform gradually outward. The fuel pellet swelling rate is very slow. The effect of this slow fuel pellet expansion is the relaxation of low stresses imposed by the fuel swelling, resulting in a low strain-rate outward creep deformation of the cladding. Similarly, when the fuel rod internal pressure exceeds the external pressure exerted by the reactor coolant, the cladding will also slowly creep outward. Under both of these conditions, irradiated Zircaloy exhibits substantial creep ductility. Therefore, no specific limit is applied to low-strain rate cladding deformation.
4-126 Revision 0October 2015
Fermi 3Updated Final Safety Analysis Report
4. Dynamic Loads / Cladding Fatigue (Item 4 of Table 4B-1)
As a result of normal operational variations, cyclic loadings are applied to the fuel rod cladding by the fuel pellet. Therefore, the fuel rod is evaluated to ensure that the cumulative duty from cladding strains due to these cyclic loadings will not exceed the cladding fatigue capability. The Zircaloy fatigue curve employed represents a statistical lower bound to the existing fatigue experimental measurements. The design limit for fatigue cycling, to assure that the design basis is met, is that the value of calculated fatigue usage must be less than the material fatigue capability (fatigue usage < 1.0).
5. Elastic Buckling / Cladding Creep Collapse (Item 5 of Table 4B-1)
The condition of an external coolant pressure greater than the fuel rod internal pressure provides the potential for elastic buckling or possibly even plastic deformation if the stresses exceed the material yield strength. Fuel rod failure due to elastic buckling or plastic collapse has never been observed in commercial nuclear reactors. However, a more limiting condition that has been observed in commercial nuclear reactors is cladding creep collapse. This condition occurs at cladding stress levels far below that required for elastic buckling or plastic deformation. In the early 1970s, excessive in-reactor fuel pellet densification resulted in the production of large fuel column axial gaps in some PWR fuel rods. The high PWR coolant pressure in conjunction with thin cladding tubes and low helium fill gas pressure resulted in excessive fuel rod cladding creep and subsequent cladding collapse over fuel column axial gaps. Such collapse occurs due to a slow increase of cladding initial ovality due to creep resulting from the combined effect of reactor coolant pressure, temperature and fast neutron flux on the cladding over the axial gap. Since the cladding is unsupported by fuel pellets in the axial gap region, the ovality can become large enough to result in elastic instability and cladding collapse.
6. Fuel Rod Stresses (Item 6 of Table 4B-1)
The fuel rod is evaluated to ensure that fuel rod failure does not occur due to stresses or strains exceeding the fuel rod mechanical capability. In addition to the loads imposed by the difference between the external coolant pressure and the fuel rod internal gas pressure, a number of other stresses or strains can occur in the cladding tube. These stresses or strains are combined through application of the distortion energy theory to determine an effective stress or strain. The applied limit is patterned after ANSI/ANS-57.5 (Reference 4B-1). The figure of merit employed is termed the Design Ratio where
where the stress or strain limit is the failure stress or strain. The value of the Design Ratio must be less than 1.00.
Design Ratio Effective StressStress Limit
------------------------------------------ or Effective StrainStrain Limit------------------------------------------=
4-127 Revision 0October 2015
Fermi 3Updated Final Safety Analysis Report
7. Fuel Rod Hydrogen (Item 7 of Table 4B-1)
GNF experience has demonstrated that excessive fuel rod internal hydrogen content due to hydrogenous impurities can result in fuel rod failure due to localized hydriding. The potential for primary hydriding fuel rod failure is limited by the application of specification limits on the fuel pellets in conjunction with fabrication practices that eliminate hydrogenous contaminants from all sources during the manufacturing process.
4B.3 NuclearA negative Doppler reactivity coefficient is maintained for any operating condition. The Dopplerreactivity coefficient is of high importance in reactor safety. The Doppler coefficient of the core is ameasure of the react iv i ty change associated with an increase in the absorpt ion ofresonance-energy neutrons caused by a change in the temperature of the material and is a functionof the average of the bundle Doppler coefficients. A negative Doppler coefficient providesinstantaneous negative reactivity feedback to any rise in fuel temperature, on a gross or local basisand thus assures the tendency of self-control.
A negative core moderator void reactivity coefficient resulting from boiling in the active flowchannels is maintained for any operating conditions. The core moderator void coefficient resultingfrom boiling in the active flow channels is maintained negative over the complete range of ESBWRoperation. This flattens the radial power distribution and provides ease of reactor control due to thenegative void feedback mechanism.
A negative moderator temperature reactivity coefficient is maintained for temperatures equal orgreater than hot shutdown. The moderator temperature coefficient is associated with a change inthe moderating capability of the water. Once the reactor reaches the power producing range, boilingbegins and the moderator temperature remains essentially constant. The moderator temperaturereactivity coefficient is negative during power operation.
To prevent a super prompt critical reactivity insertion accident originating from any operatingcondition, the net prompt reactivity feedback due to prompt heating of the moderator and fuel isnegative. The mechanical and nuclear designs of the fuel are such that the prompt reactivityfeedback (requiring no conductive or convective heat transfer and no operator action) provides anautomatic shutdown mechanism in the event of a super prompt reactivity incident. Thischaracteristic ensures rapid termination of super prompt critical accidents, with additional long-termshutdown capability due to negative void coefficient, for those cases where conductive heat transferfrom the fuel to the water results in boiling in the active channel region.
A negative power reactivity coefficient (as determined by calculating the reactivity change due to anincremental power change from a steady-state base power level) is maintained for all operatingpower levels above hot shutdown. A negative power coefficient provides an inherent negativefeedback mechanism to provide more reliable control of the plant as the operator performs powermaneuvers. It is particularly effective in preventing xenon initiated power oscillations in the core.

4-128 Revision 0October 2015
Fermi 3Updated Final Safety Analysis Report
The power coefficient is effectively the combination of Doppler, void and moderator temperaturereactivity coefficients.
The core is capable of being made subcritical with margin in the most reactive condition throughoutan operating cycle with the most reactive control rod, or rod pair, in the full-out position and all otherrods fully inserted. This parameter is dependent upon the core loading and is calculated for eachplant cycle prior to plant operation of that cycle.
4B.4 (Deleted)
4B.5 (Deleted)
4B.6 Critical PowerThe fuel cladding integrity will be maintained by ensuring that during normal operation and duringanticipated operational occurrences, at least 99.9% of the fuel rods in the core do not experienceboiling transition.
4B.7 (Deleted)
4B.8 (Deleted)
4B.9 (Deleted)
4B.10 (Deleted)
4B.11 COL InformationNone.
4B.12 References
4B-1 "American National Standard for Light Water Reactors Fuel Assembly Mechanical Design and Evaluation, American Nuclear Society Standards Committee Working Group," ANS 57.5, ANSI/ANS-57.5.
4B-2 US Nuclear Regulatory Commission, Standard Review Plan 4.2 – “Fuel System Design,” (USNRC SRP 4.2), NUREG-0800 Rev. 3 Draft, April 1996.

4-129 Revision 0October 2015
Fermi 3Updated Final Safety Analysis Report
Table 4B-1 Fuel Rod Thermal-Mechanical Design Criteria
Criterion Governing Equation
1. The cladding creepout rate ( cladding_creepout), due to fuel rod internal pressure, shall not exceed the fuel pellet irradiation swelling rate ( fuel_swelling).
cladding_creepout ≤ fuel_swelling
2. The maximum fuel center temperature (Tcenter) shall remain below the fuel melting point (Tmelt).
Tcenter < Tmelt
3. The cladding circumferential strain ( ) during an anticipated operational occurrence shall not exceed 1%. The specific strain criteria, i.e., percentage of plastic or total, will be defined in the fuel thermal-mechanical design licensing topical report for each licensed design
4. The fuel rod cladding fatigue life usage (
where ni=number of applied strain cycles at amplitude εi and nf=number of cycles to failure at amplitude εi) shall not exceed the material fatigue capability.
5. Cladding structural instability, as evidenced by rapid ovality changes, shall not occur.
No creep collapse
6. Cladding effective stresses (σe)/strains (εe) shall not exceed the failure stress (σf)/strain (εf).
,
7. The as-fabricated fuel pellet evolved hydrogen (CH is content of hydrogen) at greater than 1800°C shall not exceed prescribed limits.
CH ≤ Manufacturing Specifications
ε·
ε·ε· ε·
εθ
εθ 1%≤
ninf----
i ni
nf---- 1.0<
i
σe σf < εe εf<
4-130 Revision 0October 2015
Fermi 3Updated Final Safety Analysis Report
Appendix 4C Control Rod Licensing Acceptance Criteria
A set of acceptance criteria has been established for evaluating control rod designs. Control roddesign compliance with these criteria constitutes the basis for NRC acceptance and approval of thedesign. The control rod design licensing acceptance criteria and their bases are provided below.Any change to these criteria must have prior NRC review and approval.
4C.1 General CriteriaThe control rod design meets the following acceptance criteria:
• Control rod stresses, strains, and cumulative fatigue are evaluated to not exceed the ultimate stress or strain limit of the material, structure, or welded connection.
• The control rod design is evaluated to be capable of insertion into the core during all modes of plant operation within the limits assumed in the plant analyses.
• Control rod materials are shown to be compatible with the reactor environment.
• Control rod reactivity worth is included in the plant core analyses.
4C.2 Basis for Acceptance CriteriaThe following licensing bases are provided for the acceptance criteria given in Section 4C.1:
Stress, Strain and Fatigue
The control rod design is evaluated to assure that it does not fail because of loads due to shipping,handling, normal operation, including the effects of anticipated operational occurrences (AOOs),infrequent incidents and accidents. To ensure that the control rods do not fail, these loads must notexceed the ultimate stress and strain limit of the material, structure, or welded connection. Fatiguemust not exceed a fatigue usage factor of 1.0.
The loads evaluated include those due to normal operational transients (scram and jogging),pressure differentials, thermal gradients, flow and system induced vibration, and irradiation growthin addition to the lateral and vertical loads expected for each condition. Fatigue usage is basedupon the cumulative effect of the cyclic loadings. The analyses include corrosion and cruddeposition as a function of time, as appropriate.
Conservatism is included in the analyses by including margin to the limit or by assuming loadsgreater than expected for each condition. Higher loads can be incorporated into the analyses byincreasing the load itself or by statistically considering the uncertainties in the value of the load.
Control Rod Insertion
The control rod design is evaluated to be sure that it can be inserted during normal operationsincluding the effects of AOOs, infrequent incidents and accidents. These evaluations include acombination of analyses of the geometrical clearance and actual testing. The analyses consider the

4-131 Revision 0October 2015
Fermi 3Updated Final Safety Analysis Report
effects of manufacturing tolerances, swelling and irradiation growth. Tests may be performed todemonstrate control rod insertion capability for conditions such as control rod or fuel channeldeformation and vibrations due to safe shutdown earthquakes.
Control Rod Material
The external control rod materials must be capable of withstanding the reactor coolant environmentfor the life of the control rod. Effects of crudding, crevices, stress corrosion and irradiation upon thematerial must be included in the control rod design and core evaluations. Irradiation effects to beconsidered include material hardening and absorber depletion and swelling.
Reactivity
The reactivity worth of the control rod design is determined by the initial amount and type ofabsorber material and irradiation depletion. Scram time insertion performance must also beincluded in the plant core analyses including normal operations, including the effects of AOOs, andaccidents.
4C.3 COL InformationNone.
4C.4 ReferencesNone.
4-132 Revision 0October 2015
Fermi 3Updated Final Safety Analysis Report
Appendix 4D Stability EvaluationThe stability licensing criterion for all nuclear power plants is set forth in 10 CFR 50 Appendix A,GDC 12. This requires assurance that power oscillations, which can result in conditions exceedingspecified acceptable fuel design limits, are either not possible or can be reliably detected andsuppressed. Because the limiting stability condition in the ESBWR normal operating region is at therated power condition, the ESBWR is designed so that power oscillations are not possible (that is,remains stable) throughout the whole operating region, including plant startup. In addition, theESBWR is designed to be stable during AOOs. As a backup, the ESBWR implements a Detect andSuppress solution as a defense-in-depth system.
This appendix summarizes the stability evaluation of the ESBWR design. Section 4D.1 presents thestability performance during power operation and Section 4D.2 presents the stability performanceduring plant startup. Section 4D.3 presents the details of defense-in-depth stability solution forESBWR.
4D.1 Stability Performance During Power Operation
4D.1.1 Stability CriteriaCompliance with General Design Criterion 12 is assured by implementing design criteria for thedecay ratio. GEH uses a stability criteria map of core decay ratio vs. channel decay ratio toestablish margins to stability (Figure 4D-1). Stability acceptance criteria for BWRs are establishedon this map at core decay ratio = 0.8 and limiting channel decay ratio = 0.8, with an allowance forregional mode oscillations in the top right corner of the defined rectangle. These boundaries areestablished considering model uncertainties of the order of 0.2 in the core and channel decay ratioin the GEH analysis methods (FABLE and ODYSY). There is also margin in the regional boundary,which is drawn below available plant regional oscillation data, though the amount of conservatismhas not been quantified. The NRC has approved application of ODYSY to the E1A Long TermStability Solution (References 4D-1 and 4D-2).
The ESBWR core size of 1132 bundles is significantly larger than the largest operating BWR(ABWR with 872 bundles). The sub-criticality of the azimuth harmonic, which is relevant for regionaloscillations, decreases with core size. The regional stability boundary is expected to move inwardsin the Core Decay ratio vs. Channel Decay Ratio plane as the sub-criticality decreases. Rather thanmodifying the operating plant stability map, the regional decay ratio is calculated directly andcompared with an acceptance criterion of 0.8. The margin of 0.2 in the calculation of the regionaldecay ratio is reasonable and consistent with the values for the channel and core decay ratios.Figure 4D-2 shows the three-dimensional stability map and the design criteria for channel, core andregional stability.
The design goal is for the nominal values of the core, channel and regional decay ratios at ratedpower and flow to be less than or equal to 0.4, or about half the design criteria. This is consistent
4-133 Revision 0October 2015
Fermi 3Updated Final Safety Analysis Report
with the BWR design philosophy of maintaining the decay ratios in the flow control rangeapproximately half of the limiting values.
The design requirement is for the core, channel and regional decay ratios to be less than theacceptance criteria of 0.8 at the 2σ level of uncertainty. Because the ESBWR is a new plant andthere is no plant data, the uncertainties include operating state and model uncertainties, eventhough there is already an explicit allowance for model uncertainty in the acceptance criteria.
4D.1.2 Analysis MethodsThe TRACG computer code is used for the analysis of ESBWR stability margins. TRACG is a GEHproprietary version of the Transient Reactor Analysis Code (TRAC). TRACG uses advanced one-dimensional and three-dimensional methods to model the phenomena that are important inevaluating the operation of BWRs. The NRC has approved TRACG for ESBWR LOCA (ECCS andcontainment) analysis (Reference 4D-3). The application of TRACG for Anticipated OperationalOccurrences (AOOs) and for ATWS overpressure calculations for operating BWRs has also beenapproved by the NRC (References 4D-4 and 4D-5).
TRACG has a multi-dimensional, two-fluid model for the reactor thermal hydraulics and a three-dimensional reactor kinetics model. The models can be used to accurately simulate a large varietyof test and reactor configurations. These features allow for realistic simulation of a wide range ofBWR phenomena, and are described in detail in the TRACG Model Description Licensing TopicalReport, (Reference 4D-6).
TRACG has been extensively qualified against separate effects tests, component performancedata, integral system effects tests and operating BWR plant data. The details are presented in theTRACG Qualification Licensing Topical Report (Reference 4D-7). Specific qualification studies fortests simulating passive BWR design features are reported in References 4D-8 and 4D-9.
The stability analysis statistically accounts for the uncertainties and biases in the models and plantparameters using a Monte Carlo method for the Normal Distribution One-Sided Upper ToleranceLimit (ND-OSUTL) if the output distribution is normal, or the Order Statistics method if it is not.Conservative values are used in place of probability distributions for some plant parameters forconvenience. The uncertainties and biases considered include the following:
• Model uncertainties
• Experimental uncertainties and any uncertainties related to test scale-up
• Plant uncertainties
• Process measurement errors
• Manufacturing tolerances
The overall analysis approach followed is consistent with the Code Scaling, Applicability, andUncertainty (CSAU) analysis methodology (Reference 4D-10).

4-134 Revision 0October 2015
Fermi 3Updated Final Safety Analysis Report
The application methodology of TRACG for Stability is described in the TRACG Application forESBWR Stability Analysis Licensing Topical Report (Reference 4D-11) and is approved by theNRC.
4D.1.3 Steady State Stability Performance
4D.1.3.1 Baseline AnalysisA baseline analysis is performed for the ESBWR at rated conditions, which are limiting from theperspective of stability due to the highest power/flow ratio (Reference 4D-11). Analysis is conductedfor equilibrium GE14E core at various points in the cycle: BOC, Middle of Cycle (MOC) at the PeakHot Excess (PHE) reactivity point, and End of Cycle (EOC). The initial conditions are tabulated inTable 4D-1. The core average axial power shapes for the three exposure points are shown in Figure4D-3. Additional analysis is conducted at points with small exposure increment through the cycle inorder to make sure that the limiting exposure level in terms of Regional Stability is identified. Basedon the analysis results, it is determined that the limiting exposure is at the PHE cycle point for theequilibrium core.
Channel Stability
Channel stability is evaluated for the highest power channels by perturbing the inlet flow velocitywhile maintaining constant channel power. The calculation is performed at MOC conditionsbecause this is the limiting exposure.
Super Bundle Stability
A super bundle is defined as a group of 16 bundles below a common chimney cell. Thehydrodynamic stability of the highest power super bundle is analyzed by perturbing the inlet flow tothe group of 16 bundles while maintaining constant power. The calculation is performed at MOCconditions because this is limiting for channel hydrodynamic stability.
Core wide Stability
Core stability is evaluated at BOC, MOC and EOC conditions. The calculations are made with the 3-D kinetics model interacting with the thermal hydraulics parameters. The response to a pressureperturbation in the steam line is analyzed to obtain the decay ratio.
Regional Stability
The ‘nominal’ decay ratio for out-of-phase regional oscillations is calculated by perturbing the coreinlet flow rate in the out-of-phase mode about the line of symmetry for the azimuthal harmonicmode.
The initial conditions are the same as for the channel and core stability cases at nominal conditions.The decay ratio calculations are made at MOC conditions because of the lowest value of the sub-criticality and highest axial/radial peakings are at these conditions. The channel decay ratio is
4-135 Revision 0October 2015
Fermi 3Updated Final Safety Analysis Report
also the highest at MOC because of the bottom peaked axial flux shape. The decay ratios areextracted from the responses for the individual channel groups.
Results
The results for channel, super bundle, core and regional stability are tabulated in Table 4D-2. Thechannel decay ratio is the highest at MOC because of the bottom peaked axial power shape. Thechannel decay ratios meet the design goal of 0.4. The oscillation time period is approximately twicethe transit time for the void propagation through the channel. The transit time through the chimneydoes not contribute to the oscillation time period. There is pressure equalization at the top of thebypass region, which reduces the importance of the chimney. Moreover, there are insignificantfrictional losses in the chimney and the static head does not affect the stability performance.
The super bundle decay ratio is lower than that for the single high power bundle, because of thelower average power for the group of 16 bundles. Again, the transit time through the chimney doesnot contribute to the oscillation time period. The slightly larger time period relative to the hot bundleis also due to the lower average power level.
The core decay ratio is the highest at MOC conditions due to the combination of axial power shapeand void coefficient. The oscillation time period corresponds to twice the vapor transit time throughthe core region. The core decay ratios meet the design criteria of 0.8.
The decay ratios for regional stability are extracted from the responses for the individual channelgroups. The results for the limiting channel group are tabulated in Table 4D-2. Several otherchannel groups are within 0.01 of the highest group. The regional decay ratio meets the designcriteria of 0.8. The maximum decay ratio is obtained at MOC conditions, which is determined to bethe limiting exposure for regional mode oscillations.
4D.1.4 Statistical Analysis of ESBWR Stability
4D.1.4.1 Channel Decay Ratio Statistical AnalysisA Monte Carlo analysis of channel stability is performed at rated power and flow and BOCconditions as an example. A total of 59 trials are made. In each trial, random draws are made foreach of the parameters determined to be important for stability. Some of these parameters are notimportant for channel stability per se, but the same set of parameters are perturbed for bothchannel and core stability. These parameters and their individual probability distributions are listedin Reference 4D-11. The value for each of these parameters is drawn from the individual probabilitydistribution for that parameter. A TRACG calculation is made with this perturbed set of parametersto obtain a new steady state. The channel decay ratio for the highest power channel is thencalculated by applying a perturbation in inlet velocity. This constitutes one trial in the Monte Carloprocess. A One-Sided Upper Tolerance Limit with 95% content and 95% confidence level(OSUTL95/95) is calculated from the Monte Carlo distribution. Table 4D-3 shows the value of theOSUTL95/95 for the channel decay ratio.
4-136 Revision 0October 2015
Fermi 3Updated Final Safety Analysis Report
4D.1.4.2 Core Wide Decay Ratio Statistical AnalysisThe Monte Carlo analysis of core stability is performed at rated power and flow and an exposurepoint near the PHE conditions as an example. Similar to the channel stability, a total of 59 trials aremade. In each trial, random draws are made for each of the parameters determined to be importantfor stability. A TRACG calculation is made with this perturbed set of parameters to obtain a newsteady state. The core decay ratio is then calculated by applying a pressure perturbation in turbineinlet pressure. This constitutes one trial in the Monte Carlo process. An OSUTL95/95 is calculatedfrom the Monte Carlo distribution. Table 4D-3 shows the value of the OSUTL95/95 for the coredecay ratio.
4D.1.4.3 Regional Decay Ratio Statistical AnalysisThe Monte Carlo analysis of regional stability is performed at rated power and flow. Similar to thechannel stability, a total of 59 trials are made. In each trial, random draws are made for each of theparameters determined to be important for regional stability. A TRACG calculation is made with thisperturbed set of parameters to obtain a new steady state. The regional decay ratio is thencalculated by applying an instantaneous inlet velocity perturbation. A positive perturbation isapplied to all channel groups on one side of the line of symmetry of the harmonic mode; a negativeperturbation is applied to the channel groups on the other side. The decay ratio is extracted for thehigh power channel group from the transient response where any underlying noise in the corepower (typically less than 2%) is removed, consistent with past practice. This constitutes one trial inthe Monte Carlo process. An OSUTL95/95 is calculated from the Monte Carlo distribution. Table4D-3 shows the value of the OSUTL95/95 for the regional decay ratio.
4D.1.4.4 Comparison with Design LimitsThe baseline and OSUTL95/95 results for core, channel and regional decay ratios as given in Table4D-3 are compared against the design limits. Note that these values are calculated at differenttimes in the cycle, therefore, the combination of these decay ratios at the same time is not possible.Nevertheless, the core, channel and regional decay ratios (OSUTL95/95) are simultaneouslycompared against the design limits.
4D.1.5 Stability Performance During AOOsIn general, the stability margin reduces when the reactor power increases and/or core flow reduces.Because the ESBWR design relies on natural circulation for core flow circulation, the core flowduring full power operation is primarily dependent upon the vessel water level. Higher water levelmeans higher core flow, and vice versa. During normal operation, the water level is tightly controlledwithin a pre-set range (between Level 4 and Level 7 setpoints) through the feedwater and levelcontrol system. During AOOs, a reactor scram is initiated when the water level is too high (higherthan Level 8 setpoint) or too low (below Level 3 setpoint). In addition, high neutron flux scram andhigh simulated thermal power scram are initiated to prevent the reactor from operating at high
4-137 Revision 0October 2015
Fermi 3Updated Final Safety Analysis Report
power. Another measure is to automatically initiate the Selected Control Rod Run-In/Select RodInsert (SCRRI/SRI) upon the detection of feedwater temperature reduction of 16.7°C (30.0°F) orhigher during AOOs to limit the increase in power as the feedwater temperature drops. Therefore,the stability during AOOs is assured by SCRRI/SRI and the scram protection.
Two limiting AOOs are identified based on the above discussion: Loss of Feedwater Heating(LOFWH), which results in increased power; and Loss of Feedwater (LOFW), which results in alower flow. The trajectories of the transients in the power – flow map are shown in Figure 4D-5. Thecurve A - A corresponds to operation with a reduced level in the downcomer. The lower level leadsto a reduction in flow. Different points on A - A correspond to changes in control reactivity orchanges in core inlet subcooling.
LOFWH is a slow transient, in which the power increases slowly as the feedwater temperaturedrops. If the operator takes no action, the power would increase until SCRRI/SRI is initiated at16.7ºC (30.0°F) reduction in feedwater temperature. The worst operating point would be one wherethe drop in feedwater temperature is about 16.7ºC (30.0ºF) such that the power increases to ahigher value (~ 106%) than the rated and levels off at that value. Therefore, power is not expectedto reach the high simulated thermal power scram setpoint.
Stability analysis is performed at new steady state conditions due to the loss of the feedwaterheating at MOC condition that is determined to be the limiting exposure. Decreasing the feedwatertemperature simulated the transient. The power increased to approximately 106% due to thefeedwater temperature reduction of ~ 16.7ºC (30.0ºF). The circulation flow increased slightly andthe average core void fraction stayed almost constant.
Stability analysis is performed for LOFWH AOO at new power/flow/feedwater conditions after asteady state is achieved. Under these conditions the feedwater temperature drops from ~ 216°C(421°F) to ~ 199°C (~ 391°F) and reactor power had increased from 4500 to ~ 4790 MWt (~ 106%).The decay ratio for the limiting oscillation mode, which is determined to be regional mode based onthe results in Table 4D-2, is shown in Table 4D-4 and are well below the stability design limits.
Stability analysis is performed for the LOFW AOO. The transient is rapid and unless feedwater flowis restored, the reactor scrams in a few seconds on a trip at Level 3 (L3). In this period, the flow,power and subcooling are dropping and pressure is responding to the pressure controller. Ratherthan imposing a pressure perturbation on top of the transient response to evaluate the decay ratio,the following approach is adopted. When the level reduces below L3, the feedwater flow is restoredto maintain a reduced level. This leads to a new steady state where the circulation flow is reducedslightly and the power stabilized close to the initial value with a reduced core inlet temperature. Thisoperating point is more severe than the rated condition as the core flow is reduced at the samepower level. It provides a conservative evaluation of the LOFW transient, as the power is higherthan is expected during a LOFW. Regional stability analysis is performed at the new steady state
4-138 Revision 0October 2015
Fermi 3Updated Final Safety Analysis Report
conditions where the level is below L3 at PHE conditions that are determined to be limiting forstability.
Results of stability analysis for the reduced level case are shown in Table 4D-4. The results fromthese studies show that adequate margin is maintained to the stability design criteria even for thesemore severe operating states.
4D.1.6 Stability Performance for Feedwater Temperature Operating DomainThe demonstration of stability margins, in the previous subsections, is performed for an equilibriumcore based on the GE14E fuel design described in Reference 4D-27. Similar studies are performedwith bounding operation in the feedwater temperature domain for initial and equilibrium cores. Thedecay ratios for the limiting regional stability mode at baseline cases and during limiting AOO arewithin the design limits. The details are presented in References 4D-20 and 4D-21.
If a different core design is chosen, verification is required to confirm that the design limits are met.If the nominal decay ratios are higher than the calculated values as presented in Table 4D-2, thestatistical analysis of decay ratios is performed and the results checked versus the design limits oracceptance criteria.
4D.1.7 Stability Performance During Anticipated Transients Without ScramThe ATWS mitigation design for the ESBWR is summarized in Subsection 15.5.4. This includesautomatic feedwater runback and automatic boron injection. The TRACG analysis resultspresented in Subsection 15.5.4 confirm the conclusion that oscillations remain damped duringATWS transients.
4D.2 Stability Performance During Plant StartupIn contrast to operating BWRs, the ESBWR plant starts up without recirculation pumps. At lowpressure, the initiation of voiding in the core and chimney causes perceptible changes in the drivinghead because of the large difference between liquid and vapor densities. Consequently, startupprocedures are developed to assure smooth ascension in pressure and power.
Tests in experimental natural circulation loops (References 4D-12, 4D-13 and 4D-14) identify twomechanisms for potential flow oscillations at low pressure. First, at very low flows, a periodic“geysering” flow oscillation was found to occur due to condensation of core exit vapor in thesubcooled chimney region. Condensation-induced oscillations may occur under these conditions.The chimney subcooling and the rate of vapor production in the core determine the condensationrate. Oscillations of this kind are unlikely given the ESBWR startup procedures, which are designedto avoid vapor generation in the core prior to reaching saturated conditions in the chimney, and aresimilar to those of the natural circulation Dodewaard reactor. Dodewaard experienced no“geysering” oscillation in its 22 refuel cycles of operation. Second, initiation of vapor production inthe chimney region leads to a reduction in hydrostatic head in the chimney and a resultant core flowincrease. This, in turn, could cause voids to collapse in the chimney, leading to a reduction in flow.
4-139 Revision 0October 2015
Fermi 3Updated Final Safety Analysis Report
This type of oscillations termed 'Type 1' instability (Reference 4D-15) is unavoidable in a naturalcirculation reactor as the instability region must be crossed prior to establishing a steady two-phasevoided region in the chimney (Figure 4D-6). However, the magnitude of the flow oscillations istypically very small and this phenomenon had also never been observed at Dodewaard. In the finalcycle of its operation, a special startup test was performed to probe the low pressure portion of thestartup trajectory. Though no oscillations were detectable on the APRMs, it was possible to infer thepresence of small oscillations in core velocity from the auto correlation function of the AveragePower Range Monitor (APRM) signal, (Figure 4D-7 and Reference 4D-16). These were smalloscillations superposed on the core velocity with little, if any, reactivity impact, as the core flow issingle-phase in this phase of the startup transient. Reference 4D-11 provides more discussion ofthe applicability of the Dodewaard experience to the ESBWR.
In this section, the mechanism of the hydrostatic oscillations is examined and startup trajectoriesare analyzed with TRACG. The results show that large margins to transition boiling are maintainedthroughout the startup scenario.
4D.2.1 Phenomena Governing Oscillations during StartupDuring startup, the water in the ESBWR vessel is initially heated to about 85ºC (185ºF) by decayheat supplemented by auxiliary heaters. Following de-aeration, control rods are pulled to criticalityand nuclear heatup begins at a low core power. As the water circulates through the core anddowncomer by natural circulation, it is gradually heated up. The RWCU system removes a portionof the heat by draining water from the downcomer and lower plenum, cooling it in heat exchangersand returning it through the feedwater sparger. Because of the large height of the ESBWR vessel,the pressure at the water level (near the top of the separators) is lower than the core pressure byabout 100 kPa (14.5 psi). Figure 4D-8 shows a schematic of the vessel and the axial pressureprofile. At low pressures corresponding to startup conditions, the pressure gradient gives rise to asignificant difference in the saturation temperature between the core exit and the top of theseparators. The saturation temperature profile is shown on the right side of the figure. As thecirculating water is slowly heated up, saturation temperature is first reached at the top of theseparators. Vapor generation at the top of the separators results in a reduction in the density headin the separators, and the voids propagate downwards. The formation of voids also results in alarger driving head for natural circulation flow. The increase in natural circulation flow reduces thecore exit temperature and leads to a collapse of the voids. This completes one cycle of thehydrostatic head oscillation. The sequence of events for one cycle is illustrated in the right handportion of Figure 4D-8. These oscillations persist until the inlet temperature to the core increasesand a steady void fraction is established in the separators. Small oscillations in the flow rate areharmless when the flow in the core is single phase and consequently there is a very large margin tothermal limits. This type of oscillation is termed Type 1 instability in the literature.
4-140 Revision 0October 2015
Fermi 3Updated Final Safety Analysis Report
Figure 4D-6 is a schematic of a generalized stability map in the plane of Subcooling Number vs.Zuber Number. (The figure does not represent a quantitative stability map specifically for theESBWR and is used primarily for illustrative purposes.) Two different boundaries are shown forcore-wide (in-phase) and regional (out-of-phase) oscillations that are discussed in Section 4D.1.These are driven by density wave oscillations and are known as Type 2 oscillations. The regionabove the lower (out-of-phase) stability boundary curve is unstable; the region under the curve isstable. The Type 1 oscillations appear at the onset of voiding and occupy a narrow region next tothe line that demarcates the single-phase region from the two-phase region. At normal conditionsthe ESBWR is very stable as shown in the figure, with significant margin to the stability boundary.During startup, the Type 1 instability region is reached to obtain rated pressure and power. It is bestto cross the Type 1 instability region at low power before boiling starts in the core to maintain a largemargin to thermal limits. Once steady voiding is established in the separators and chimney, the corepower can be raised along a trajectory to full power.
The parameters that control Type 1 instability are the Zuber Number and Subcooling Number. TheFroude Number is a parameter that is relevant in determining the relationship between the riserbuoyancy and the circulation flow. This is important in establishing a scaling basis for tests facilitydesign, but not for loop stability once the scaled flow characteristics are known. Another group thatis important for tall columns of liquid at low system pressure is the Flashing Number. Thesedimensionless numbers are defined below:
(4D-1)
where
= density (kg/m3)
V c= core average inlet velocity (m/s)
Q = core thermal power (kW)
W c= core flow (kg/s)
h = enthalpy (kJ/kg)
h f= saturated liquid enthalpy (kJ/kg)
NZuρ1
ρgsd---------- Q
Wchfg--------------=
Nsubρ1
ρgsd----------
hfsd hin–( )hfg
---------------------------=
NFrVc
2
gHdc------------=
Nflρ1
ρgsd----------
hfin hfsd–( )hfg
-----------------------------=
ρ
4-141 Revision 0October 2015
Fermi 3Updated Final Safety Analysis Report
hfg = latent heat of evaporation at steam dome pressure (kJ/kg)
Hdc = downcomer height (m)
and subscripts
l = liquid (general)
f = liquid (saturated)
g = vapor (saturated)
"sd" denotes properties at the steam dome pressure and "in" denotes properties at the inlet to thecore.
The significance of these quantities is discussed below with the aid of Figure 4D-9.
The Zuber Number is a measure of the enthalpy increase in the core. As there is no increase in theenthalpy in the chimney, the Zuber number is also a measure of the total enthalpy increase in thecore and chimney regions. The Flashing Number has special relevance for tall columns of liquid atlow pressure. It is a measure of the enthalpy margin to flashing at the core exit (Figure 4D-9) whenthe flow just reaches saturation at the top of the chimney. The Subcooling Number is a measure ofthe enthalpy margin to saturation at the core inlet. At low system pressures, the definition of theSubcooling Number must be considered carefully because of the difference in pressure at differentelevations. In Equation 4D.1, it is defined with respect to the saturated enthalpy at the steam domepressure.
With the above definitions, when saturated conditions are reached at the top of the riser (Path A inFigure 4D-9), an energy balance leads to:
(4D.2)
For Type 1 oscillations that occur when voiding begins at the top of the riser, Nsub is the relevantparameter to be used in the stability map of Figure 4D-6.
For a rapid heatup rate corresponding to Path C in Figure 4D-9, saturated conditions may bereached at the top of the core (that is, at a pressure close to core inlet pressure) with a subcooledchimney. In the extreme case when the entire chimney is still subcooled:
(4D.3)
These heatup rates can lead to condensation-induced oscillations. A large flashing number requiresa correspondingly higher Zuber number (enthalpy increase in the core) to trigger such oscillationsand thus provides a buffer to the occurrence of this phenomenon.
At intermediate conditions, as the void initiation location moves down into the chimney,
This corresponds to Path B in Figure 4D-9.
NZu Nsub=
NZu Nsub Nfl+=
Nsub NZu N( sub Nfl )+< <
4-142 Revision 0October 2015
Fermi 3Updated Final Safety Analysis Report
For the ESBWR at 200 kPa (29 psia), the Zuber Number is of the order of 22, the subcoolingnumber is 22 and the flashing number is 25 and the trajectory corresponding to Path A is followedduring the heatup.
4D.2.2 TRACG Analysis of Typical Startup Trajectories
4D.2.2.1 ESBWR Plant StartupDetailed startup procedures for the ESBWR are developed at a later stage under the guidance ofthe human factor engineering (Section 18.9 and Reference 4D-19). These procedures are requiredto observe the rod withdrawal sequence and coolant heatup rate limits, as determined in theanalyses reported in the following sections and Reference 4D-20.
The startup process is expected to generally follow the established procedure from the Dodewaardplant. The Dodewaard plant started up for 22 cycles of operation without any problems related toflow or power oscillations.
Figure 4D-10 shows the stages of the startup process. In the De-aeration Period, the reactorcoolant is de-aerated by drawing a vacuum on the main condenser and reactor vessel usingmechanical vacuum pumps with the steam drain lines open. The reactor coolant is heated up tobetween 80ºC (176ºF) and 90ºC (194ºF) with auxiliary heat and decay heat. The reactor pressure isreduced to about 50 kPa (7.25 psia) to 60 kPa (8.7 psia). Following de-aeration control rods arewithdrawn to criticality with the Main Steam Isolation Valves (MSIVs) either left open or closed. Theanalysis here presents simulation results with the equilibrium core documented in Reference 4D-27and keeping MSIVs closed. (Plant startup with initial core and MSIVs open is documented inReference 4D-20.) Startup period is initiated by pulling groups of control rods to criticality. Fissionpower is used to heat the reactor water, while maintaining the water level close to the top of theseparators but well below the steam lines. Steaming at the free surface starts to pressurize thereactor vessel. The core region remains subcooled due to the large static head in the chimney andseparators.
As the reactor heats up and pressurizes, the RWCU/SDC system heat exchangers are used tocontrol the downcomer temperature, enhance coolant flow and reduce lower plenum stratification.The MSIVs are reopened at the end of the Startup Period, when pressure reaches 6.3 MPa (~ 914psia). Subsequently, the turbine bypass valves are used to control pressure. The reactor power isincreased and preparations made to roll the turbine.
4D.2.2.2 TRACG Calculations for Simulated Startup ScenariosThe startup transient for the ESBWR is simulated with TRACG. These TRACG calculations areperformed with imposed core power, without activating the kinetics model. This is valid as long asthere are no feedbacks from oscillations in the core void fraction during the startup transient. Thisassumption is validated as part of the calculation. The calculation is initiated at the end of thede-aeration period with the steam dome pressure at 52 kPa (7.54 psia) and RPV water at 82ºC (~
4-143 Revision 0October 2015
Fermi 3Updated Final Safety Analysis Report
180ºF). The water level is maintained near the top of the separators. The MSIVs are closed toisolate the RPV. To simplify comparisons, the power level is maintained constant until the pressurereached 6.3 MPa (914 psia). Subsequently, the MSIVs are opened and the power level is increasedin steps to achieve rated pressure at 300 MWt (6.67% of rated power).
Three heatup rates are considered. The lowest power level of 50 MWt corresponds to a heatup rateof 30ºC/hour (54ºF/hour) and is likely to be close to the actual value for startup. The median powerlevel of 85 MWt yields a heatup rate of 55ºC/hour (99ºF/hour), which is the highest allowable tocomply with reactor vessel thermal stress requirements. The highest power level of 125 MWt heatsup the reactor vessel water at 82ºC/hour (148ºF/hour) which is above allowable limits, and is onlyincluded as a sensitivity study. The three power trajectories are shown in Figure 4D-11.
Figure 4D-12 shows the pressure response for the three cases. The circulating water heats upbecause of the core power. The heat exchangers in the RWCU/SDC system are enabled to removea part of the energy and control the core inlet subcooling. Steam generation begins at the watersurface and starts to pressurize the vessel.
Figure 4D-13 shows the variation in core inlet subcooling as a function of time. The local inletsubcooling drops from an initial value around 40°C (72°F) to less than 10°C (18°F) as the systempressurizes to 6.3 MPa (914 psia). The core flow transient response is shown in Figure 4D-14. Forthe lowest heatup rate, the flow trace shows a minor oscillation (noise) between 3000 to 5500 s.The cause of this noise can be traced to the beginning of voiding at the top of the separators(Figure 4D-15). The flow noise is terminated when a steady void fraction is established at the top ofthe separators. This is the symptom of a Type 1 oscillation at the onset of voiding in the riser. At apower level of 85 MWt, the noise is spread over two periods: early on there is some void initiation inthe separators (500 to 1000 s) followed by a more sustained period of void generation beginningaround 9000 s (Figure 4D-16). At the highest heatup rate (125 MWt), the flow becomes noisier. Thehighest oscillation amplitude occurs between 500 to 1500 s and again between 5000 to 9000 s. Thevoid fractions in the separator are shown in Figure 4D-17.
Further insight into the core flow response is obtained by examining the core void fractions,specifically in the highest power bundles. Figure 4D-18 shows the void fractions for the 50 MWtcase in the high power bundle at the exit and at cell 30, which is close to the top of the bundle.Voids are not produced even in the high power bundles until 13000 s, well after the noisy flowperiod is over and the system is pressurized to above 1.5 MPa (~ 218 psia). Figure 4D-19 showsthat for the 85 MWt case, vapor generation begins at the top of the high power bundles at 5000 s,after the initial flow noise is reduced. At this time the pressure is about 800 kPa (116 psia). Voidspropagate to cell 30 at about 7000 s, by which time the system pressure is above 2.5 MPa (~ 363psia). The high power level (125 MWt) leads to extreme conditions during the heatup. Vaporgeneration in the core begins early. Figure 4D-20 shows that the high power bundle exit voidfraction is 15% at 4000 s. Rapid heating of the core leads to conditions that favor condensation-induced oscillations because vapor is generated in the core while the chimney is not yet at
4-144 Revision 0October 2015
Fermi 3Updated Final Safety Analysis Report
saturated conditions. These are the extreme conditions examined in the tests by Aritomi (Reference4D-12) and Kuran, et al (Reference 4D-14). The situation is further illustrated by looking at the flowsin individual bundles. The exit flows in the high power and the low power peripheral bundles areexamined. Figure 4D-21 depicts the exit flows in the high power bundle for the three cases. Thesetraces follow the core average flow response shown in Figure 4D-14. The exit flows in theperipheral bundles (Figure 4D-22) show a more dramatic distribution. In the two lower power cases,the peripheral bundles are in upflow throughout the transient, despite the noise imposed on theaverage flow rate. However, at 125 MWt, large condensation induced oscillations lead to flowreversals between 3500 to 4000 s.
Margins to thermal limits CPR are calculated for the three startup scenarios. The thermal margin forthe high power bundles is shown in Figure 4D-23. Large margins are maintained throughout. Figure4D-24 is the corresponding plot for the peripheral bundles. Again, large margins are maintainedthroughout the transient. This is true even for the extreme case with 125 MWt. Despite the flowreversals, the heat fluxes are low enough that critical heat flux conditions are not approached.
4D.2.2.3 TRACG Calculation of ESBWR Startup with Neutronic FeedbackA TRACG simulation of ESBWR startup with the neutronic feedback is performed using the limitingheat up rate. This is an example of a startup transient. Results of this simulation demonstrate that atthe limiting heat up rate, no difficulties and no large power oscillations are encountered during thestartup transient. This TRACG calculation is performed activating the 3D kinetics model. Thecalculation is initiated at the end of the de-aeration period, similar to the calculations in the previoussection. The water level is maintained near the top of the separators. The MSIVs are closed toisolate the RPV. Initially, all control rods are in fully inserted position.
The 269 control rods in ESBWR are divided into ten groups and the rod group positions are shownin Figure 4D-25. Rod Group #10 represents the control rods for the 25 control cells. The grouping ofcontrol rods and the withdrawal sequence during the startup are similar to those used for operatingplants. The withdrawal speeds for each of these groups during the transient are specified asTRACG input to simulate the operator actions to maintain the reactor at power during the startuptransient. These rod groups are slowly withdrawn to maintain the total reactivity close to 0.0 and thetotal power level is maintained at around 85 MWt until the reactor is pressurized to the desiredvalue. Subsequently, the MSIVs are opened and the power level is increased in steps (by means ofadditional rod withdrawals) to achieve rated pressure.
Figure 4D-26 shows the withdrawal fraction for all control rods. After Groups 1, 2 and 3 are fullywithdrawn, the control rod withdrawal fraction is 0.37, that is, 63% of all rods are in fully insertedposition. At this time, the reactor is critical. Groups 4 and the next several groups are withdrawnwith slower speed to avoid rapid change in total reactivity and reactor power.
Figure 4D-27 shows the total reactor power. For the first 1500 seconds, the total reactor powerconsists mainly of decay heat. After the core becomes critical, there is a step increase in total
4-145 Revision 0October 2015
Fermi 3Updated Final Safety Analysis Report
reactor power. From this time on, the rod groups are slowly withdrawn to maintain the total reactorpower at around 85 MWt. The total power is maintained around 85 MWt by the continuouswithdrawal of the control rods. No significant core void is calculated until the MSIVs are opened,when the temperature and pressure are near the operating conditions. The heatup rate for this caseis slightly below the maximum allowed rate considering thermal stress of 55ºC/hour (99ºF/hour).
Figure 4D-28 shows the steam dome pressure response for this case. The RPV pressurizes to 6.3MPa (914 psia) in 3.6 hours (12,960 seconds) and the MSIVs are opened. With the MSIVs open thepower is limited by BOP systems not by heatup rate. The control rods are withdrawn further to stepup the power and to reach the rated pressure at 4.4 hours (15,840 seconds). At this time, RodGroups 1 to 7 are fully withdrawn and Group 8 is 50% withdrawn. Groups 9 and 10 (25 control cellrods) are in fully inserted position.
Figure 4D-29 shows the core inlet subcooling as a function of time. The local inlet subcooling dropsas the system pressurizes to 6.3 MPa (914 psia). The core flow transient response is shown inFigure 4D-30. There are two periods with small flow noise: around 2000 seconds corresponding tothe step increase in power (Figure 4D-27) and around 4500 seconds corresponding to some voidinitiation at the top of separators. Steady void fraction is established at the top of the separatorsafter 9000 seconds. There are no fluctuations in the neutron flux during these periods. The flowresult is similar to the case with no reactor kinetics modeled.
Figure 4D-31 shows core void in the highest power bundles. Vapor generation begins at the top ofthe high power bundles at pressure of about 500 kPa (72.5 psia). Voids propagate about a quarterof the height into the bundle at 11000 s, by which time the system pressure is above 3 MPa (~ 435psia). The high power bundle flow follows the core average flow response. The peripheral bundlesare in upflow throughout the transient.
Margins to thermal limits CPR are calculated for this startup case. Large margins are maintained forall bundles throughout the transient.
4D.3 Defense-In-Depth Stability SolutionUnder certain conditions, BWRs may be susceptible to coupled neutronic/thermal-hydraulicinstabilities. These instabilities are characterized by periodic power and flow oscillations. If theseoscillations become large enough, and the associated density waves contain a sufficiently high voidfraction, the fuel cladding integrity safety limit could be challenged.
Several different stability long-term solution options have been developed for BWRs. Certainsolutions depend upon automatic reactor instability detection and suppression. The defense-in-depth stability solution developed for ESBWR is based on the existing NRC approved Detect andSuppress Solution - Confirmation Density (DSS-CD) solution, particularly the defense-in-depthalgorithms in Section 3.4 of Reference 4D-22 with modifications on specified settings for ESBWRapplication.
4-146 Revision 0October 2015
Fermi 3Updated Final Safety Analysis Report
The stability evaluation results as documented in Section 4D.1, show that ESBWR is free ofundamped oscillations and other thermal-hydraulic instabilities for all conditions of normal operationand for anticipated operational occurrences (AOOs) and conformance to GDC 12. Therefore, adetect and suppress solution is implemented to provide defense-in-depth protection frominstabilities that are not anticipated.
To provide defense-in-depth, the ESBWR stability solution includes detection algorithms that arenot credited to prevent exceeding specified fuel acceptance criteria per GDC 12 but provideadditional protection. The defense-in-depth detection algorithms used are:
1. Period Based Detection Algorithm (PBDA) with two Confirmation Density cells per OPRM Channel.
2. Amplitude Based Algorithm (ABA).
3. Growth Rate Algorithm (GRA).
These algorithms are capable of initiating a trip signal to limit the size of an oscillation. The followingsection provides a description of Backup Stability Protection (BSP) approaches that may be usedwhen the primary defense-in-depth solution is declared inoperable.
This section provides the methodology of defense-in-depth stability solution for ESBWR.Subsection 4D.3.1 describes the solution design philosophy and defense-in-depth protectionapproach. Subsection 4D.3.2 provides a detailed description of the key solution elements fordefense-in-depth oscillation detection algorithms. Subsection 4D.3.3 describes the BSP feature tobe employed in the unlikely event that the primary defense-in-depth solution is declared inoperable.
4D.3.1 Design ApproachThe design philosophy used in the development of the defense-in-depth stability solution forESBWR and associated hardware/software is discussed in this subsection. The hardware design isunchanged from either DSS-CD or Option III solution described in Reference 4D-22. Thefirmware/software is modified relative to the standard DSS-CD defense-in-depth detection methodsfor ESBWR specific application, which may include an upgrade to the automatic signal processorcard.
The defense-in-depth algorithms examine aspects of the oscillation (local oscillation period,oscillation amplitude and oscillation growth rate) for oscillations that are not anticipated.
To ensure adequate implementation of the defense-in-depth stability solution and to avoidunnecessary spurious reactor scrams, the system will be checked during the startup test programoutlined in Subsection 14.2.8.2.35.5. During this system check out period, reactor instabilityprotection is provided by the BSP, described in Subsection 4D.3.3.
To detect all anticipated oscillation modes, the outputs from closely spaced LPRM detectors arecombined into OPRM cell signals. Thus, small regions of the core are effectively monitored for
4-147 Revision 0October 2015
Fermi 3Updated Final Safety Analysis Report
instabilities. Multiple cells distributed throughout the core provide input to each of the OPRMchannels. This ensures that the system is sensitive to all of the expected oscillation modes, andalso provides substantial redundancy for the input signals and accommodates out-of-service orfailed LPRMs. The number of LPRM-to-OPRM cell assignment for ESBWR (i.e., number andlocation of the LPRMs that comprise the OPRM cells) is given in Figure 7.2-10. The ESBWR OPRMcell assignments are consistent with Option III and DSS-CD OPRM cell assignment options.
4D.3.2 Solution DescriptionSome elements of the solution common to DSS-CD long-term solution are contained in Reference4D-22. Where there are common elements, the description provided in this document is applicableto the ESBWR solution. The defense-in-depth algorithms are described in this section along withtheir key setpoints.
4D.3.2.1 System Input and LPRM AssignmentThe LPRM-to-OPRM cell assignment for ESBWR (i.e., number and location of the LPRMs thatcomprise the OPRM cells) is given in Figure 7.2-10.
The cell signal is filtered to remove noise components with frequencies above the range of stabilityrelated power oscillations. This is accomplished by a second order Butterworth filter with a cutofffrequency (referred to as the "conditioning" filter), or equivalent. The conditioned signal is filteredagain using a second order Butterworth filter with a shorter cutoff frequency, or equivalent, toproduce a time-averaged value. The conditioned and time-averaged signals are used by the threealgorithms to detect reactor instabilities.
Each OPRM cell is assigned to an OPRM channel and a RPS trip channel. If a trip condition is metfor an OPRM channel, then the corresponding RPS channel trips. A reactor scram occurs when thenecessary combination of channel trips occurs (voted two-out-of-four). The ESBWR stabilitysolution does not add new requirements to the RPS logic.
4D.3.2.2 Defense-In-Depth AlgorithmsThe design objective for the defense-in-depth algorithms is to provide automatic action to limit thesize of the oscillations of unanticipated events, thereby preventing fuel cladding damage. Asdiscussed in Reference 4D-22, as long as the clad re-wets between cycles, power oscillations up to200% of rated power produce a temperature transient such that no cladding failure is expected. Thedefense-in-depth detection algorithms offer a high degree of assurance that fuel failure does notoccur as a result of unanticipated stability related oscillations.
Table 4D-5 lists the ESBWR defense-in-depth algorithm setpoints. The choice of setpoints for theABA and GRA is consistent with References 4D-24, 4D-22 and 4D-26. For the PBDA, nominalsetpoint values are recommended on a generic basis. These setpoints would reasonably limit thesize of unanticipated stability related power oscillations. They are selected to provide earlyprotection without signif icantly increasing the likelihood of a inadvertent scram. The
4-148 Revision 0October 2015
Fermi 3Updated Final Safety Analysis Report
defense-in-depth trips with the specified setpoints provide backup protection greater than thatprovided by the Average Power Range Monitor (APRM) high flux scram, in particular for theregional mode of oscillations. No further analysis is required to justify these setpoints.
4D.3.2.2.1 Period Based Detection Algorithm The PBDA is described in References 4D-22 and 4D-26. The PBDA utilizes the observation thatLPRM noise becomes progressively more coherent during the approach to the inception of aninstability event, before the amplitude becomes large. The PBDA uses a combination of periodconfirmation count and amplitude setpoint to determine if a trip is required. The period confirmationcount portion of the PBDA is referred to as the Period Based Algorithm (PBA). It constitutes theentire algorithm with the exception of the amplitude aspect.
The PBA focuses on the periodicity of the oscillation in the approximate range between time periodlimits (Tmin and Tmax). Tmin and Tmax are conservatively selected to bound the anticipated instabilityfrequency range. The algorithm interrogates the OPRM cell signal based on a short sample time(ti). When the time difference between successive peaks (or successive minima) in an OPRM cellsignal is consistent with the time period limits, this time difference is defined as the base period, T0.The next period (T1) calculated between successive peaks (or minima) must be within a small timewindow, period tolerance (+ε), of T0 to produce a "confirmation" that oscillatory behavior exists. Anew base period is defined as the average of all consecutively confirmed periods in that cell. Basedon evaluation of BWR data, as the decay ratio increases toward 1.0, the oscillation period becomesconstant, resulting in many consecutive confirmations. If a successive period is not confirmed to bewithin the period tolerance of the base period, the period count is reset to zero and the search for anew base period is initiated. The PBA period confirmation process is illustrated in Figure 3-9 ofReference 4D-22.
The PBDA is programmed to identify an instability based on the occurrence of a fixed number ofconsecutive period confirmations, which is considered evidence of a stability related poweroscillation. A trip is generated for an OPRM cell if:
• The number of successive period confirmations exceeds its setpoint value (Np), and
• The relative signal exceeds a specified amplitude setpoint, Sp.
The value of Sp is set sufficiently above the noise level to minimize the likelihood of an inadvertentscram. This balances the probability that the system trips when needed to suppress an instabilityevent and does not trip when it is not required.
For ESBWR application, the PBDA successive period confirmations setpoint, Np, is selected abovethe setpoint in DSS-CD long-term because there is no sudden core flow reduction event andinstability develop slower than forced flow BWRs. This setpoint is representative of the higher endof the range provided in Reference 4D-24, Appendix E because for ESBWR the oscillations areexpected to grow slowly. This selection is made to further reduce the likelihood of a inadvertent
4-149 Revision 0October 2015
Fermi 3Updated Final Safety Analysis Report
scram by the PBDA, which is appropriate given the function is defense-in-depth. The PBDAamplitude setpoint, Sp, is given in Table 4D-5 and is consistent with the other defense-in-depthalgorithms.
References 4D-22 and 4D-26 define two adjustable parameters that affect period confirmations,and are used to achieve proper plant-specific system calibration, the period tolerance (ε) and theconditioning filter cutoff frequency (fc). Based on existing experience and to ensure adequateinstability detection by the PBA, these parameters' values are determined for ESBWR applicationsin Table 4D-5. The assigned values for these parameters are expected to provide continuousconfirmations upon transition from stable reactor operation to a growing reactor instability.
The normalized OPRM signal processed by the PBA is constructed as the ratio of the filtered inputsignal to the OPRM signal average. Reference 4D-26 specifies a typical range for the time constantassociated with the signal averaging process. This range provides an appropriate signal averagevalue for ESBWR steady state or quasi steady state operation (Table 4D-5), especially consideringthat there is no fast flow reduction event as in forced flow BWRs.
4D.3.2.2.2 Amplitude Based Algorithm The ABA is described in References 4D-22 and 4D-26. The value of the OPRM cell relative signalis compared at each detection time step to a threshold setpoint, S1 (greater than 1.0). If the relativesignal exceeds S1, then the algorithm checks to determine if the relative signal decreases to asecond setpoint, S2 (less than 1.0), within a time period typical of an instability oscillation. If thesignal goes below S2 in the expected time window (T1), then the algorithm will repeat this check foranother cycle of S1 and S2, then the algorithm looks for the next peak in the relative signal. Additionof another confirmation cycle of S1 and S2 allows more robust solution against inadvertent scramwhen amplitude spike exists in signal noise. If the relative signal exceeds the trip setpoint, Smax, inthe expected time window (T2), a trip is generated for that OPRM cell (and hence for that RPSchannel). Values for S1, S2, Smax, T1, and T2 are given in Table 4D-5.
4D.3.2.2.3 Growth Rate AlgorithmThe GRA is described in References 4D-22 and 4D-26. It examines OPRM cell signals for rapidlygrowing oscillations. As for the ABA, the value of the OPRM cell relative signal is compared at eachdetection time step to a threshold setpoint, S1 (greater than 1.0). If the relative signal exceeds S1,then the algorithm checks to determine if the relative signal decreases to a second setpoint, S2(less than 1.0), within a time period typical of an instability oscillation. If the signal goes below S2 inthe expected time window (T1), then the algorithm will repeat this check for another cycle of S1 andS2, then the algorithm looks for the next peak in the relative signal. Addition of another confirmationcycle of S1 and S2 allows more robust solution against inadvertent scram when amplitude spikeexists in signal noise. A trip signal is generated by the GRA if the setpoint S3 is exceeded in theexpected time window. S3 is calculated from the peak of the previous cycle (P1) and the desiredmaximum allowable growth rate (GR3):
4-150 Revision 0October 2015
Fermi 3Updated Final Safety Analysis Report
S3 = GR3 x (P1 - 1.0) + 1.0
If the signal goes above S1, then below S2 in the expected time window, and then exceeds S3within the expected time window, a trip is generated for that OPRM cell (and hence for that RPSchannel). The GRA uses the same values for S1, S2, T1, and T2 as the ABA. Values for S1, S2,GR3, T1 and T2 are given in Table 4D-5.
4D.3.2.3 System OperabilityTo provide its specified stability protection function, the stability monitoring system is required to beoperable above a power level set at the lower boundary of the Armed Region defined by the MCPRmonitoring threshold power level. For ESBWR, the MCPR monitoring threshold power level is at25%, therefore, the defense-in-depth stability solution for ESBWR is automatically armed when thepower is above 25% of rated.
For operation outside the Armed Region, the system is disarmed to reduce the probability ofspurious scrams and alarms. If the system protection is not assured, a supplemental backup, asspecified in the plant Technical Specifications, is required. For ESBWR, the BSP approaches aredescribed in Subsection 4D.3.3.
4D.3.3 Backup Stability ProtectionThis section provides a description of BSP approaches that may be used when the OPRM systemis inoperable. The elements of the BSP are confirmed on a cycle specific basis to provideconsistency with the long-term solution general requirement of long-term applicability.
The BSP for ESBWR with initial core of GE14E fuel assemblies (Reference 4D-23) consists of aboundary defined in the ESBWR core power-feedwater temperature operating domain (Reference4D-21) where potential instability events can be effectively addressed by specified operator actions.
The basis for defining BSP boundary is presented in the following subsections.
4D.3.3.1 Backup Stability Protection Boundary GenerationThe following elements are included in the BSP Boundary generation process:
• A conservative Decay Ratio criterion (0.6) that is consistent with the criterion used in the controlled entry region boundaries in DSS-CD (Subsection 7.2.3.2 of Reference 4D-22) is established for defining the BSP boundary.
• The limiting event for ESBWR in terms of instability is LOFWH; the BSP Region is established based on two intercept state points on the ESBWR core Power-Feedwater Temperature Operation Domain, one on the LOFWH AOO trajectory from rated feedwater temperature conditions (100% power, FW temperature of 216°C [420°F]) and the other on the LOFWH trajectory from reduced feedwater temperature conditions (100% power, FW temperature of 188°C [370°F]). The TRACG stability calculations for regional mode are performed at both intercept points to confirm that the corresponding decay ratios are bounded by the criteria
4-151 Revision 0October 2015
Fermi 3Updated Final Safety Analysis Report
established in the previous step. The methodology for regional stability analysis is documented in Reference 4D-11.
• The BSP Region is then completed by drawing a constant power line using the lowest power resulting from the two BSP calculations and extending to all possible feedwater temperature conditions.
Figure 4D-32 illustrates the resulting BSP Boundary determined for ESBWR.
4D.3.3.2 Operator ActionIf the BSP region is entered, immediate exit from the region is required. The region can be exited bycontrol rod insertion or FW temperature maneuvering.
The guidance and actions recommended by the BSP emphasize instability prevention to minimizethe burden placed on the operator when monitoring for the onset of power oscillations. Therefore,caution is required whenever operating near the BSP Region boundary, and it is recommended thatthe amount of time spent operating near this region be minimized.
4D.3.3.3 BSP Reload ApplicationA fuel cycle specific assessment is required to confirm the applicability or update the BSP region.The BSP regions are documented in the Core Operating Limits Report (COLR) in accordance withTechnical Specifications.
4D.4 COL InformationNone.
4D.5 References
4D-1 GE Nuclear Energy, J. S. Post and A. K. Chung, "ODYSY Application for Stability Licensing Calculations,” NEDC-32992P-A, Class III (Proprietary), July 2001.
4D-2 GE Nuclear Energy, “BWR Owners' Group Long-Term Stability Solutions Licensing Methodology,” NEDO-31960-A, Class I (Non-proprietary), November 1995.
4D-3 GE Nuclear Energy, B. S. Shiralkar and Y. K. Cheung, “TRACG Application for ESBWR,” NEDC-33083P-A, Class III (Proprietary), Revision 1, September 2010, NEDO-33083-A, Class I (Non-proprietary), Revision 1, September 2010.
4D-4 GE Nuclear Energy, J. G. M. Andersen, et al., “TRACG Application for Anticipated Operational Occurrences (AOO) Transient Analyses,” NEDE-32906P-A, Class III (Proprietary), Revision 3, September 2006, NEDO-32906-A, Revision 3, Class I (Non-proprietary), September 2006.
4D-5 GE Nuclear Energy, F. T. Bolger and M. A. Holmes, “TRACG Application for Anticipated Transient Without Scram Overpressure Transient Analyses,” NEDE-32906P, Class III
4-152 Revision 0October 2015
Fermi 3Updated Final Safety Analysis Report
(Proprietary), Supplement 1-A, November 2003 and NEDO-32906, Class I (Non-proprietary), Supplement 1-A, November 2003.
4D-6 GE Hitachi Nuclear Energy, J. G. M. Andersen, et al., “TRACG Model Description,” NEDE-32176P, Revision 4, Class III (Proprietary) January 2008, and NEDO-32176, Revision 4, Class I (Non-proprietary), January 2008.
4D-7 GE Nuclear Energy, J. G. M. Andersen, et al., “TRACG Qualification,” NEDE-32177P, Class III (Proprietary), Revision 3, August 2007 and NEDO-32177, Class I (Non-proprietary), Revision 3, August 2007.
4D-8 GE Nuclear Energy, J. R. Fitch, et al., “TRACG Qualification for SBWR,” NEDC-32725P, Class III (Proprietary), Revision 1, Vol. 1 and 2, August 2002.
4D-9 GE Nuclear Energy, J. R. Fitch, et al., “TRACG Qualification for ESBWR,” NEDC-33080P, Class III (Proprietary), Revision 1, May 2005 and NEDO-33080, Class I (Non-proprietary), Revision 1, January 2006.
4D-10 USNRC, “Quantifying Reactor Safety Margins: Application of Code Scaling, Applicability, and Uncertainty Evaluation Methodology to a Large-Break, Loss-of-Coolant Accident,” NUREG/CR-5249, December 1989.
4D-11 GE Nuclear Energy, B.S.Shiralkar, et al, “TRACG Application for ESBWR Stability Analysis,” NEDE-33083 Supplement 1P-A, Class III (Proprietary), Revision 2, September 2010 and NEDO-33083 Supplement 1-A, Class I (Non-proprietary), Revision 2, September 2010.
4D-12 M. Aritomi, J. H. Chiang. M. Mori, “Fundamental Studies on Safety-Related Thermal- Hydraulics of Natural Circulation Boiling Parallel Channel Flow System under Startup Conditions (Mechanism of Geysering in Parallel Channels),” Nuclear Safety, Vol. 33, No.2, pp. 170-182, 1992.
4D-13 F. Inada, Y. Yasuo, “The Boiling Flow Instability of a Natural Circulation BWR with a Chimney at Low Pressure Startup,” Proc. International Conference on the Design and Safety of Advanced Nuclear Power Plants (ANP 1992), Tokyo, Japan, Paper 25.3, October 25-29, 1992.
4D-14 S. Kuran, M. Ishii, X. Sun, L. Cheng, Y. Xu, H. Yoon, S.T. Revankar, “Nuclear Coupled Flow Instability Study for Natural Circulation BWR Startup Transient,” Paper N6P002, 6th International Conference on Nuclear Thermal Hydraulics, Operation and Safety (NUTHOS-6), Nara, Japan, October 2004.
4D-15 D.D.B. van Bragt and T.H.J.J. van der Hagen, “Stability of Natural Circulation Boiling Water Reactors: Part II - Parametric Study Of Coupled Neutronic-Thermohydraulic Stability," Nuclear Technology 121 (1998), 52-62.
4D-16 T.H.J.J. van der Hagen, F.J. van der Kaa, J. Karuza, W.H.M. Nissen, A.J.C. Stekelenburg, J.A.A. Wouters, "Startup of the Dodewaard Natural Circulation Boiling Water Reactor," GKN Report 92-017/FY/R, 1992.
4-153 Revision 0October 2015
Fermi 3Updated Final Safety Analysis Report
4D-17 A. Manera and T.H.J.J. van der Hagen, "Stability Of Natural-Circulation-Cooled Boiling Water Reactors During Start-Up: Experimental Results," Nuclear Technology, 143 (2003), 77-88.
4D-18 (Deleted)
4D-19 GE Hitachi Nuclear Energy, "ESBWR Man-Machine Interface System and Human Factors Engineering Implementation Plan," NEDE-33217P, Class III (Proprietary), Revision 6, February 2010, and NEDO-33217,Class I (Non-proprietary), Revision 6, February 2010.
4D-20 GE Hitachi Nuclear Energy, "ESBWR Initial Core Transient Analyses," NEDO-33337, Class I (Non-proprietary), Revision 1, April 2009.
4D-21 GE Hitachi Nuclear Energy, "ESBWR Feedwater Temperature Operating Domain Transient and Accident Analysis," NEDO-33338, Class I (Non-proprietary), Revision 1, May 2009.
4D-22 GE Hitachi Nuclear Energy, "General Electric Boiling Water Reactor Detect and Suppress Solution – Confirmation Density," NEDC-33075P-A, Class III (Proprietary), Revision 6, January 2008 and NEDO-33075-A, Class I (Non-proprietary), Revision 6, January 2008.
4D-23 Global Nuclear Fuel, "GE14E for ESBWR Initial Core Nuclear Design Report," NEDC- 33326P-A, Class III (Proprietary) Revision 1, September 2010, NEDO-33326-A, Class I (Non-proprietary), Revision 1, September 2010.
4D-24 GE Nuclear Energy and BWR Owners' Group, NEDO-32465-A, Class I (Non-proprietary), "Reactor Stability Detect and Suppress Solutions Licensing Basis Methodology for Reload Applications," August 1996.
4D-25 (Deleted)
4D-26 GE Nuclear Energy, NEDO-31960-A, Class I (Non-proprietary), Supplement 1, "BWR Owners' Group Long-Term Stability Solutions Licensing Methodology," November 1995.
4D-27 [Global Nuclear Fuel, "GE14 for ESBWR Nuclear Design Report," NEDC-33239P-A, Class III (Proprietary), Revision 5, October 2010, NEDO-33239-A, Class I (Non-proprietary), Revision 5, October 2010.
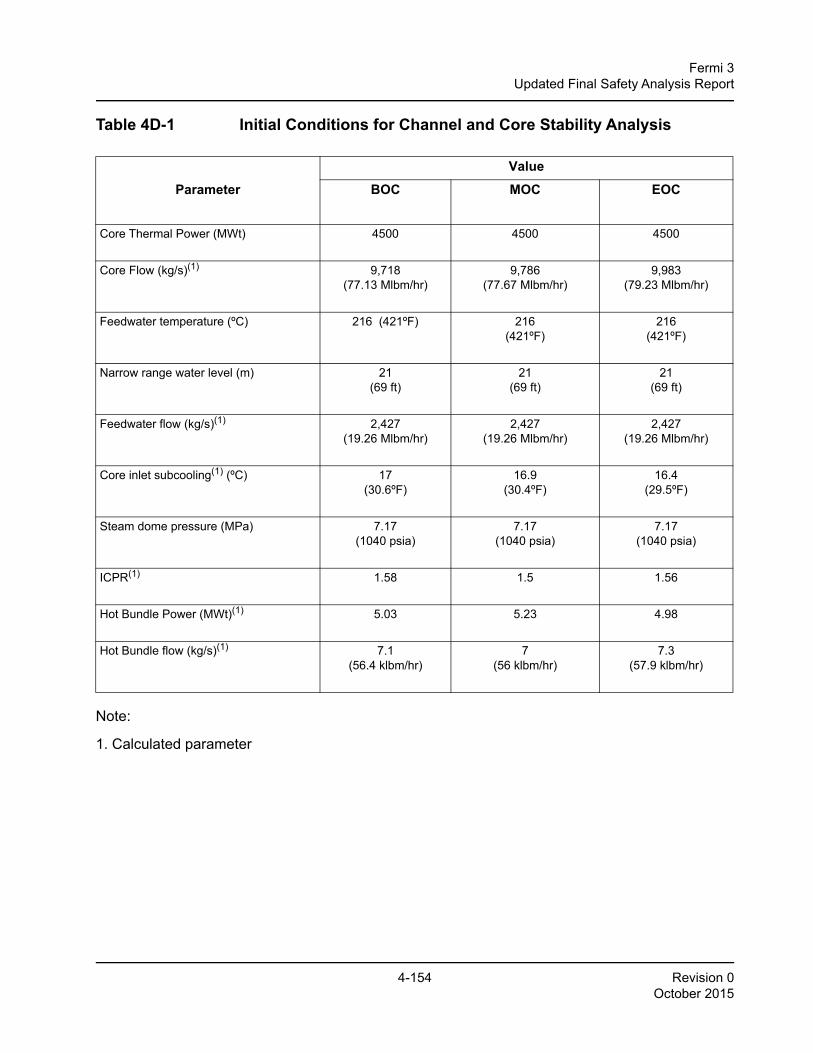
4-154 Revision 0October 2015
Fermi 3Updated Final Safety Analysis Report
Table 4D-1 Initial Conditions for Channel and Core Stability Analysis
Note:
1. Calculated parameter
ParameterValue
BOC MOC EOC
Core Thermal Power (MWt) 4500 4500 4500
Core Flow (kg/s)(1) 9,718(77.13 Mlbm/hr)
9,786(77.67 Mlbm/hr)
9,983(79.23 Mlbm/hr)
Feedwater temperature (ºC) 216 (421ºF) 216 (421ºF)
216 (421ºF)
Narrow range water level (m) 21(69 ft)
21(69 ft)
21(69 ft)
Feedwater flow (kg/s)(1) 2,427(19.26 Mlbm/hr)
2,427(19.26 Mlbm/hr)
2,427(19.26 Mlbm/hr)
Core inlet subcooling(1) (ºC) 17(30.6ºF)
16.9(30.4ºF)
16.4(29.5ºF)
Steam dome pressure (MPa) 7.17(1040 psia)
7.17(1040 psia)
7.17(1040 psia)
ICPR(1) 1.58 1.5 1.56
Hot Bundle Power (MWt)(1) 5.03 5.23 4.98
Hot Bundle flow (kg/s)(1) 7.1(56.4 klbm/hr)
7(56 klbm/hr)
7.3(57.9 klbm/hr)
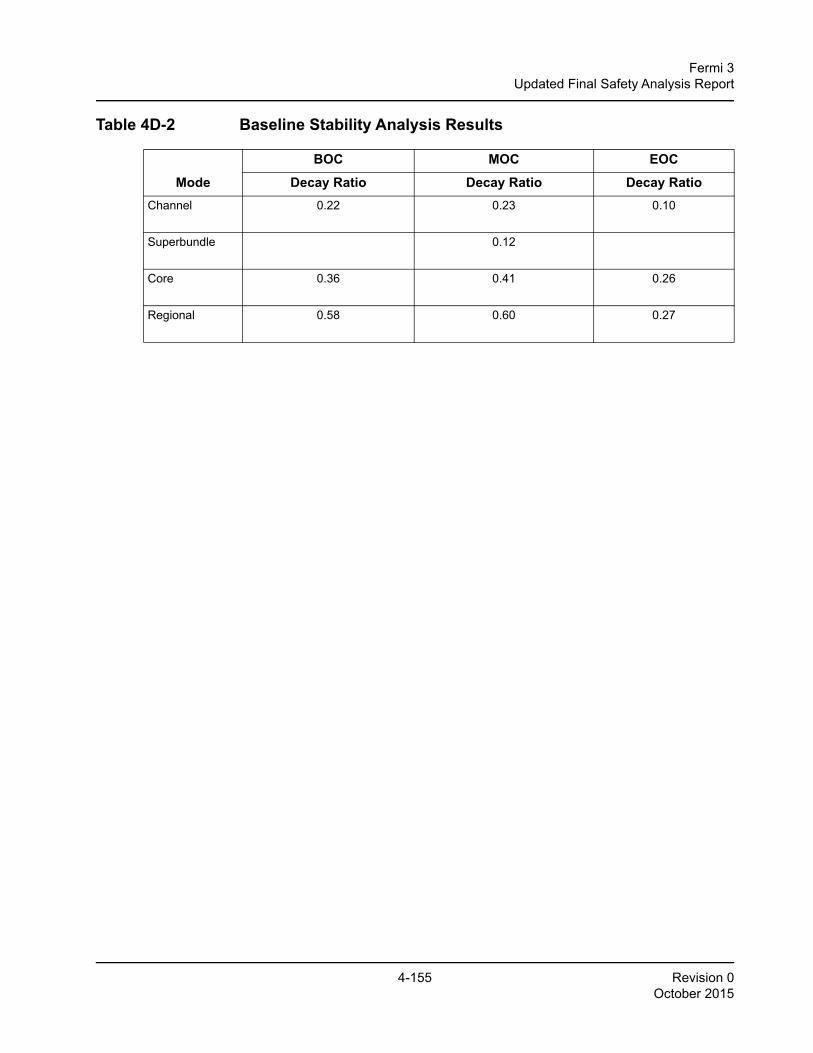
4-155 Revision 0October 2015
Fermi 3Updated Final Safety Analysis Report
Table 4D-2 Baseline Stability Analysis Results
ModeBOC MOC EOC
Decay Ratio Decay Ratio Decay RatioChannel 0.22 0.23 0.10
Superbundle 0.12
Core 0.36 0.41 0.26
Regional 0.58 0.60 0.27
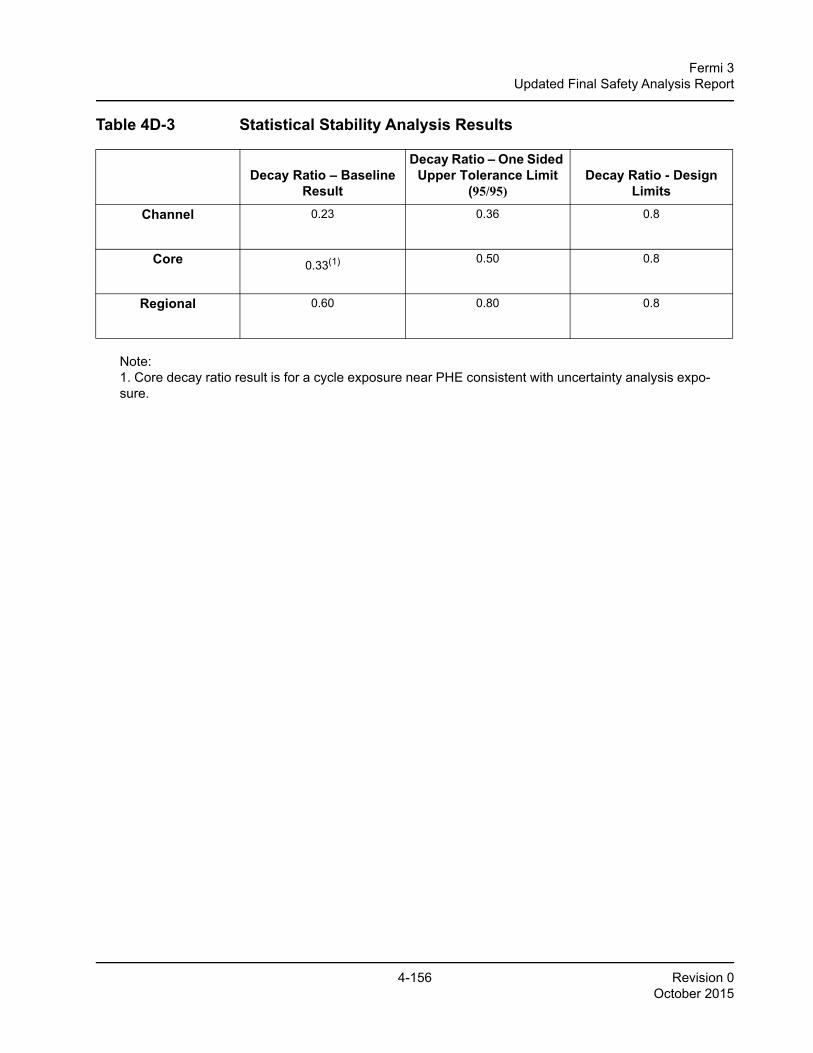
4-156 Revision 0October 2015
Fermi 3Updated Final Safety Analysis Report
Table 4D-3 Statistical Stability Analysis Results
Note:1. Core decay ratio result is for a cycle exposure near PHE consistent with uncertainty analysis expo-sure.
Decay Ratio – Baseline Result
Decay Ratio – One Sided Upper Tolerance Limit
(95/95)Decay Ratio - Design
LimitsChannel 0.23 0.36 0.8
Core 0.33(1) 0.50 0.8
Regional 0.60 0.80 0.8
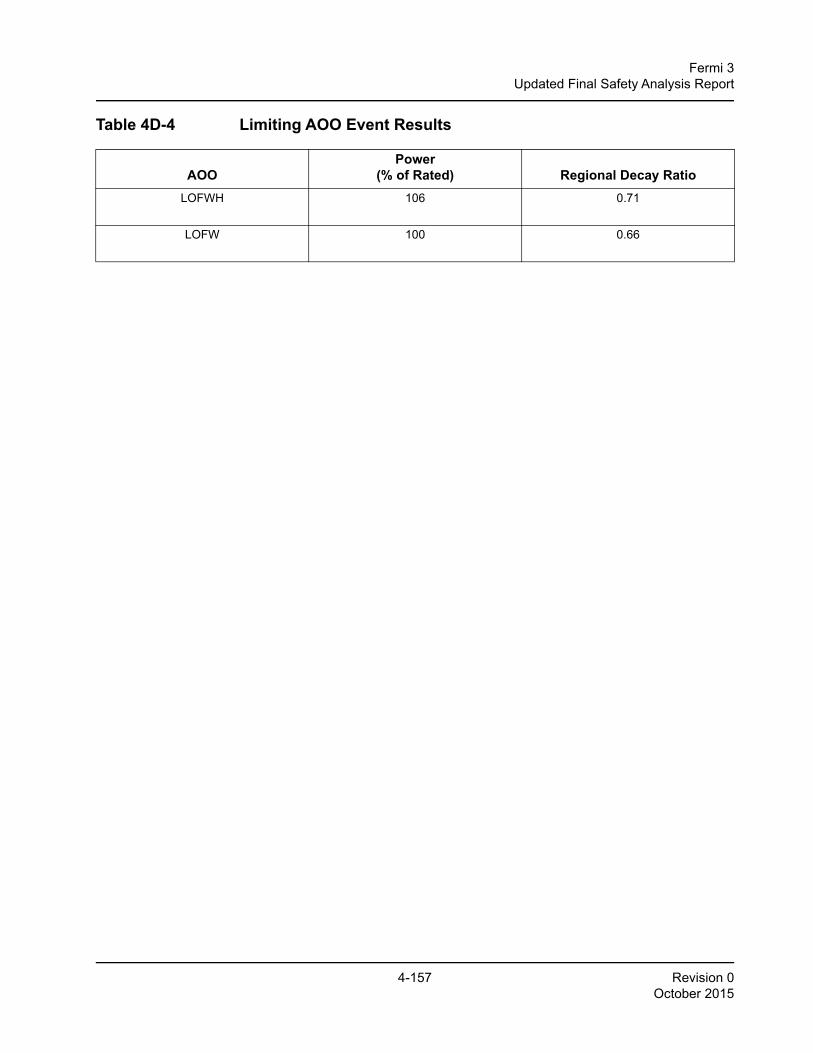
4-157 Revision 0October 2015
Fermi 3Updated Final Safety Analysis Report
Table 4D-4 Limiting AOO Event Results
AOOPower
(% of Rated) Regional Decay RatioLOFWH 106 0.71
LOFW 100 0.66
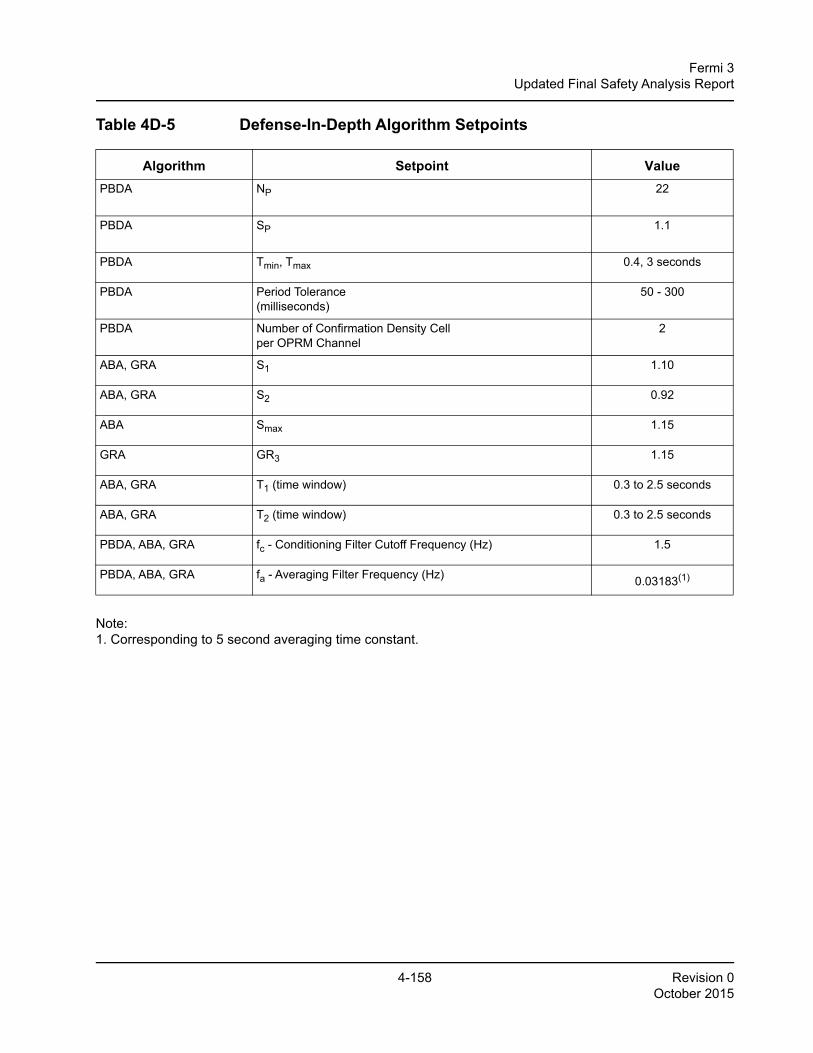
4-158 Revision 0October 2015
Fermi 3Updated Final Safety Analysis Report
Table 4D-5 Defense-In-Depth Algorithm Setpoints
Note:1. Corresponding to 5 second averaging time constant.
Algorithm Setpoint ValuePBDA NP 22
PBDA SP 1.1
PBDA Tmin, Tmax 0.4, 3 seconds
PBDA Period Tolerance(milliseconds)
50 - 300
PBDA Number of Confirmation Density Cell per OPRM Channel
2
ABA, GRA S1 1.10
ABA, GRA S2 0.92
ABA Smax 1.15
GRA GR3 1.15
ABA, GRA T1 (time window) 0.3 to 2.5 seconds
ABA, GRA T2 (time window) 0.3 to 2.5 seconds
PBDA, ABA, GRA fc - Conditioning Filter Cutoff Frequency (Hz) 1.5
PBDA, ABA, GRA fa - Averaging Filter Frequency (Hz) 0.03183(1)
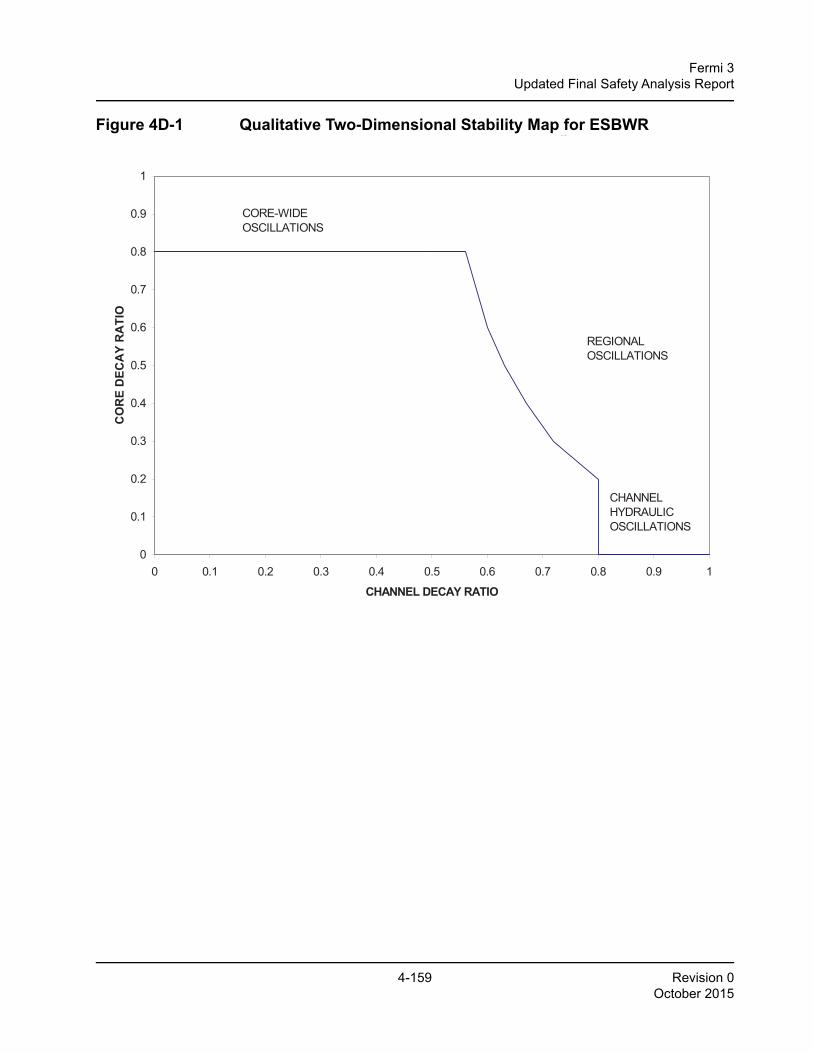
4-159 Revision 0October 2015
Fermi 3Updated Final Safety Analysis Report
Figure 4D-1 Qualitative Two-Dimensional Stability Map for ESBWRg
0
0.1
0.2
0.3
0.4
0.5
0.6
0.7
0.8
0.9
1
0 0.1 0.2 0.3 0.4 0.5 0.6 0.7 0.8 0.9 1
CHANNEL DECAY RATIO
CO
RE
DEC
AY
RA
TIO
CORE-WIDE OSCILLATIONS
CHANNEL HYDRAULIC OSCILLATIONS
REGIONAL OSCILLATIONS
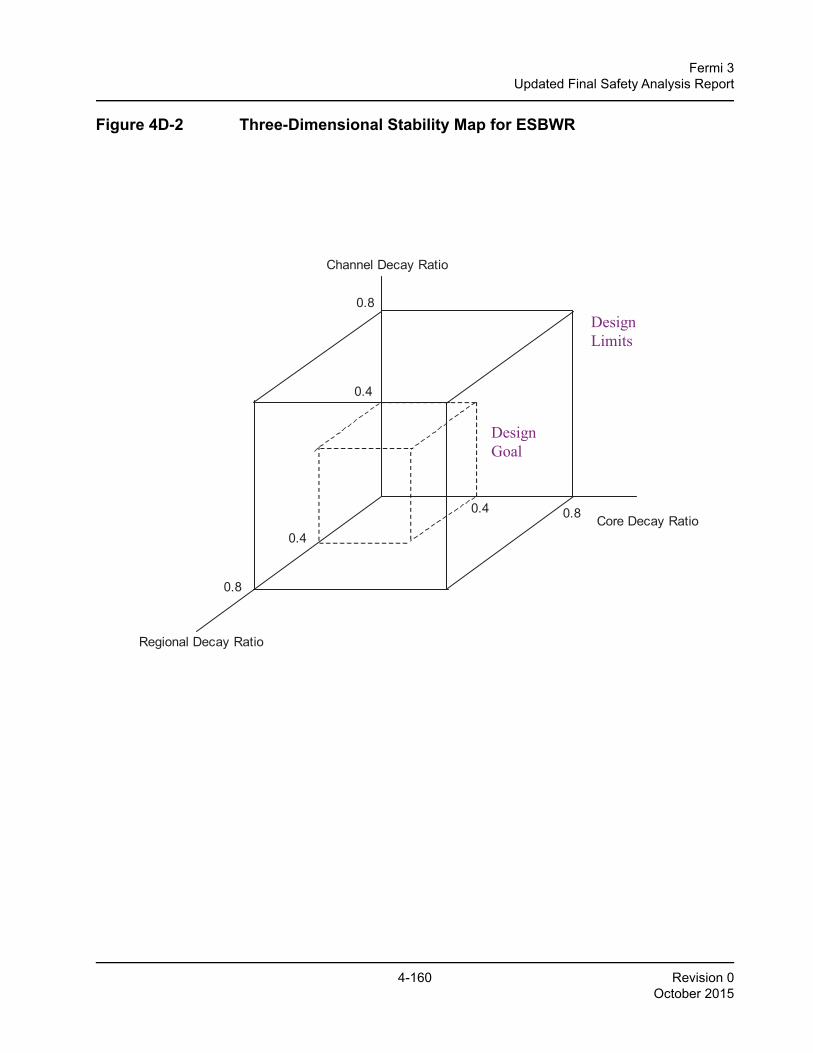
4-160 Revision 0October 2015
Fermi 3Updated Final Safety Analysis Report
Figure 4D-2 Three-Dimensional Stability Map for ESBWR
26A6642AP Rev. 10 ESBWR Design Control Document/Tier
Figure 4D-2. Three-Dimensional Stability Map for ESBWR
Core Decay Ratio
Regional Decay Ratio
Channel Decay Ratio
0.8
0.8
0.80.4
0.4
0.4
Design Goal
Design Limits
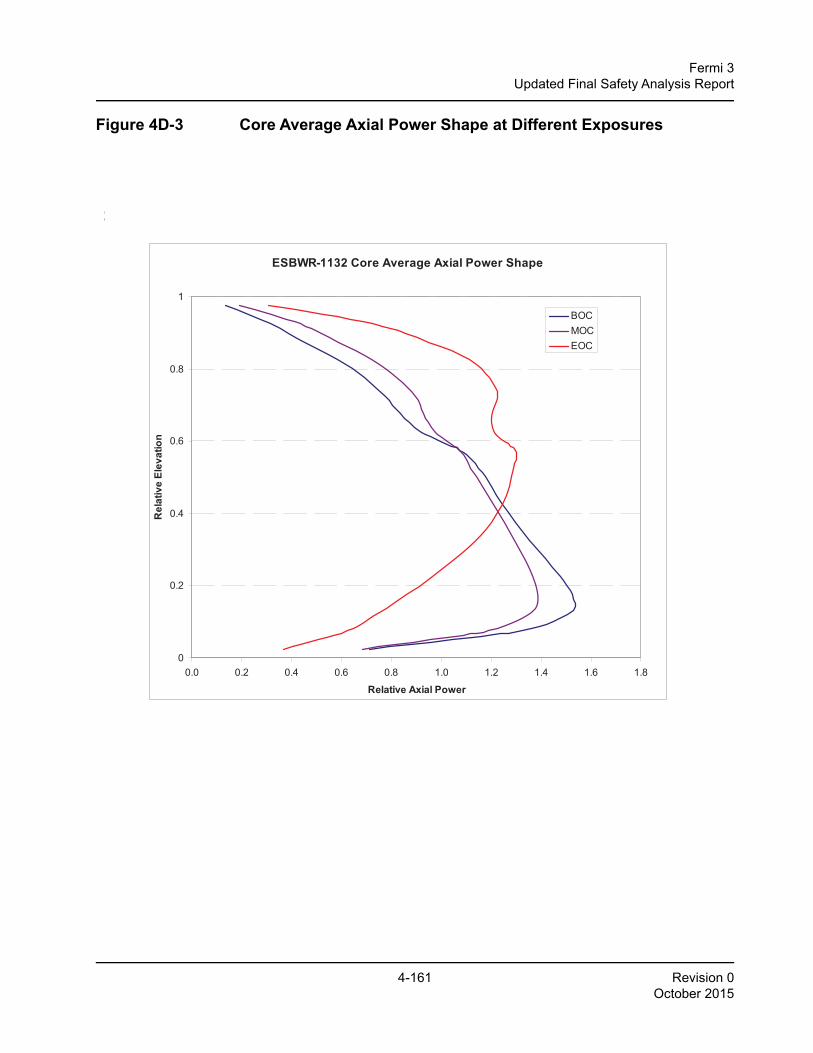
4-161 Revision 0October 2015
Fermi 3Updated Final Safety Analysis Report
Figure 4D-3 Core Average Axial Power Shape at Different Exposures
26A6642AP Rev. 10 ESBWR Design Control Document/Tier 2
Figure 4D-3. Core Average Axial Power Shape at Different Exposures
ESBWR-1132 Core Average Axial Power Shape
0
0.2
0.4
0.6
0.8
1
0.0 0.2 0.4 0.6 0.8 1.0 1.2 1.4 1.6 1.8
Relative Axial Power
Rel
ativ
e El
evat
ion
BOCMOCEOC

4-162 Revision 0October 2015
Fermi 3Updated Final Safety Analysis Report
Figure 4D-4 (Deleted)
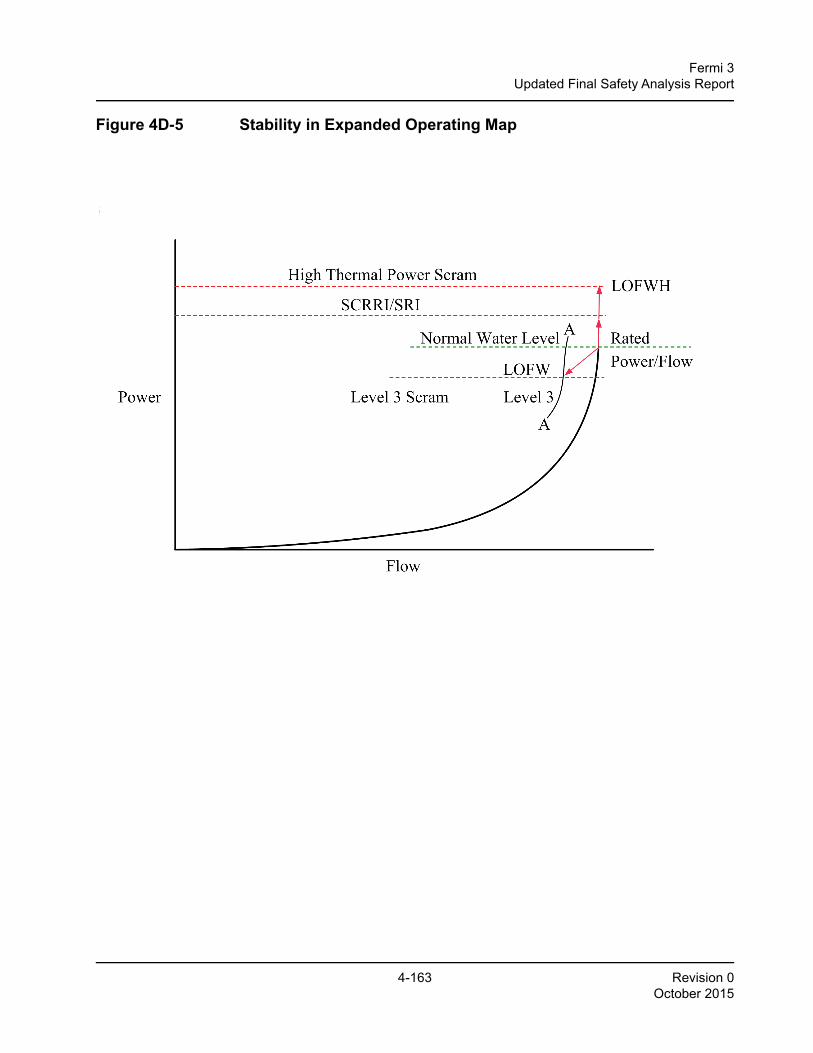
4-163 Revision 0October 2015
Fermi 3Updated Final Safety Analysis Report
Figure 4D-5 Stability in Expanded Operating Map
26A6642AP Rev. 10 ESBWR Design Control Document/Tier 2
Figure 4D-5. Stability in Expanded Operating Map
5
ρ ρ
ρρ
Δ
6 bar
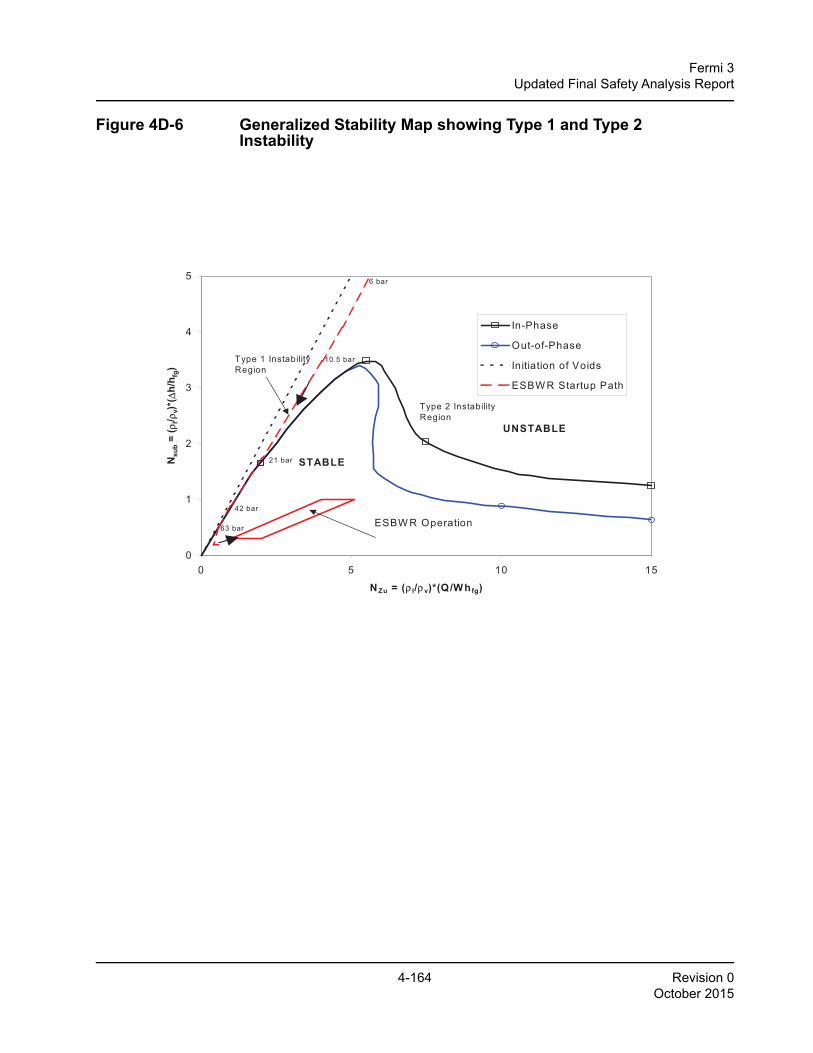
4-164 Revision 0October 2015
Fermi 3Updated Final Safety Analysis Report
Figure 4D-6 Generalized Stability Map showing Type 1 and Type 2 Instability
4D-30
Figure 4D-5. Stability in Expanded Operating Map
Figure 4D-6. Generalized Stability Map showing Type 1 and Type 2 Instability
0
1
2
3
4
5
0 5 10 15
NZu = (ρ l/ρv)*(Q/Whfg)
Nsu
b = ( ρ
l/ ρv)*
( Δh/
h fg)
In-Phase
Out-of-Phase
Initiation of Voids
ESBW R Startup Path
STABLE
UNSTABLE
ESBW R Operation
6 bar
21 bar
10.5 bar
42 bar
63 bar
Type 1 InstabilityRegion
Type 2 InstabilityRegion
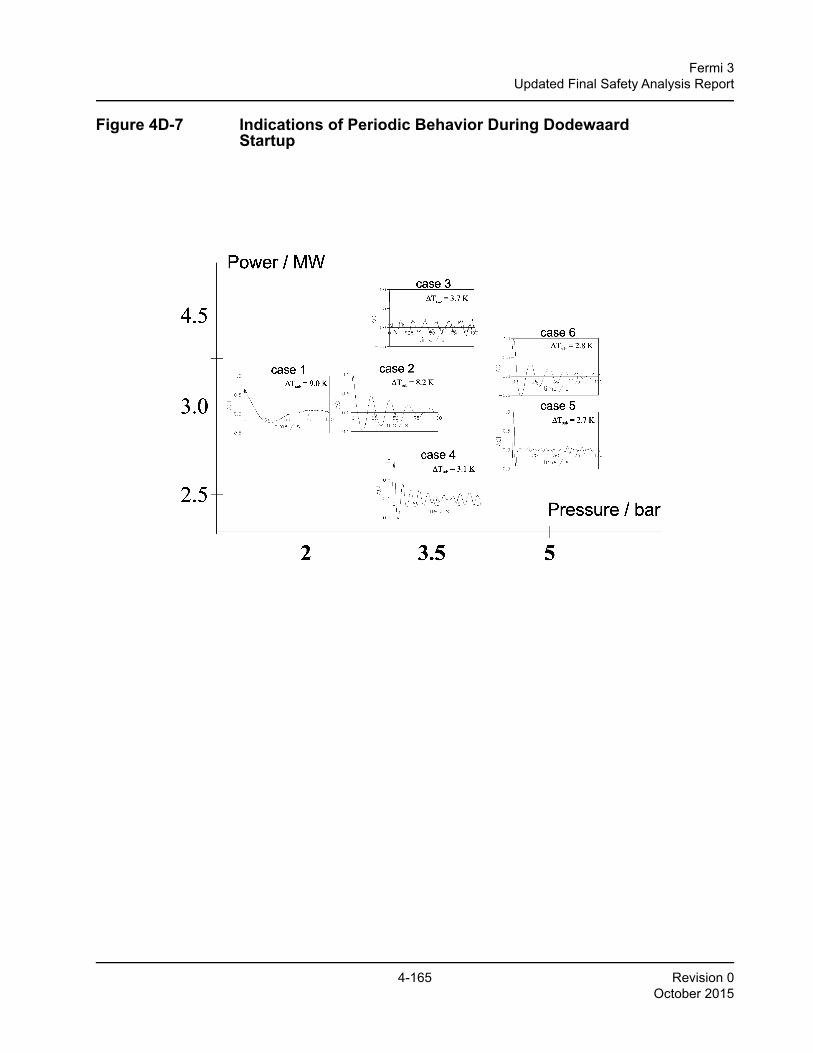
4-165 Revision 0October 2015
Fermi 3Updated Final Safety Analysis Report
Figure 4D-7 Indications of Periodic Behavior During Dodewaard Startup
26A6642AP Rev. 10 ESBWR Design Control Document/Tier 2
Figure 4D-7. Indications of Periodic Behavior During Dodewaard Startup
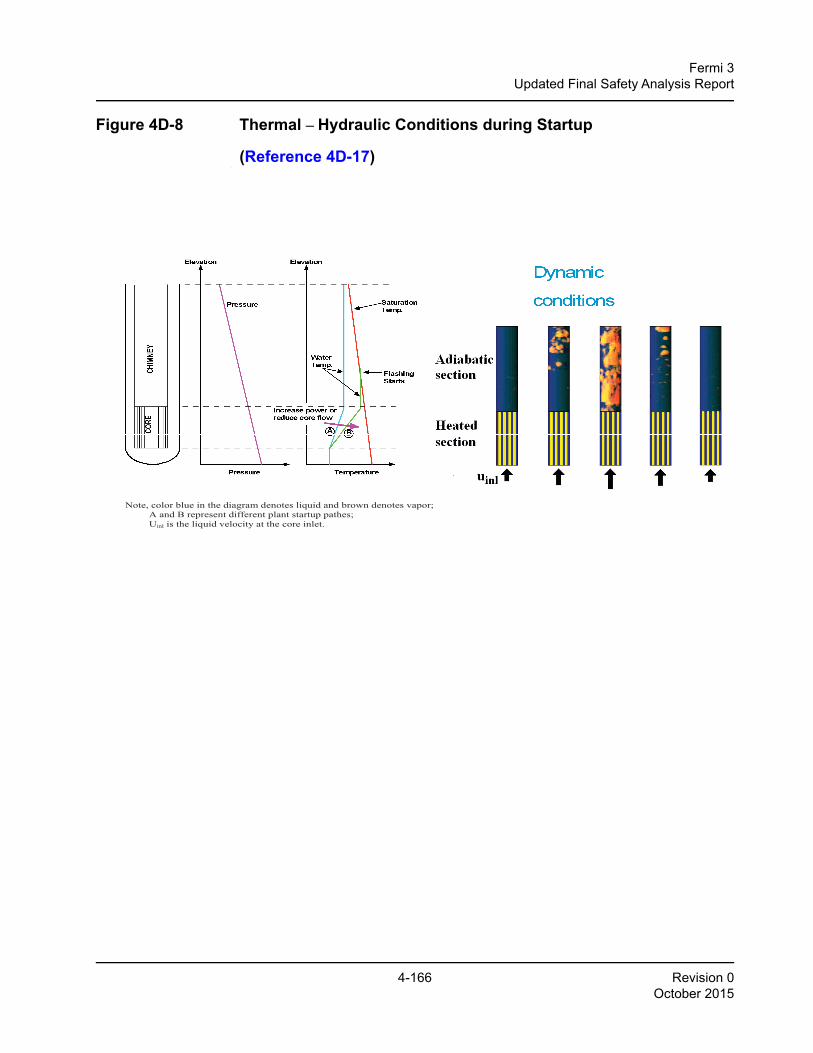
4-166 Revision 0October 2015
Fermi 3Updated Final Safety Analysis Report
Figure 4D-8 Thermal – Hydraulic Conditions during Startup
(Reference 4D-17)
4D-31
Figure 4D-7. Indications of Periodic Behavior During Dodewaard Startup
Note, color blue in the diagram denotes liquid and brown denotes vapor; A and B represent different plant startup pathes; Uinl is the liquid velocity at the core inlet.
Figure 4D-8. Thermal – Hydraulic Conditions during Startup
(Reference 4D-17)
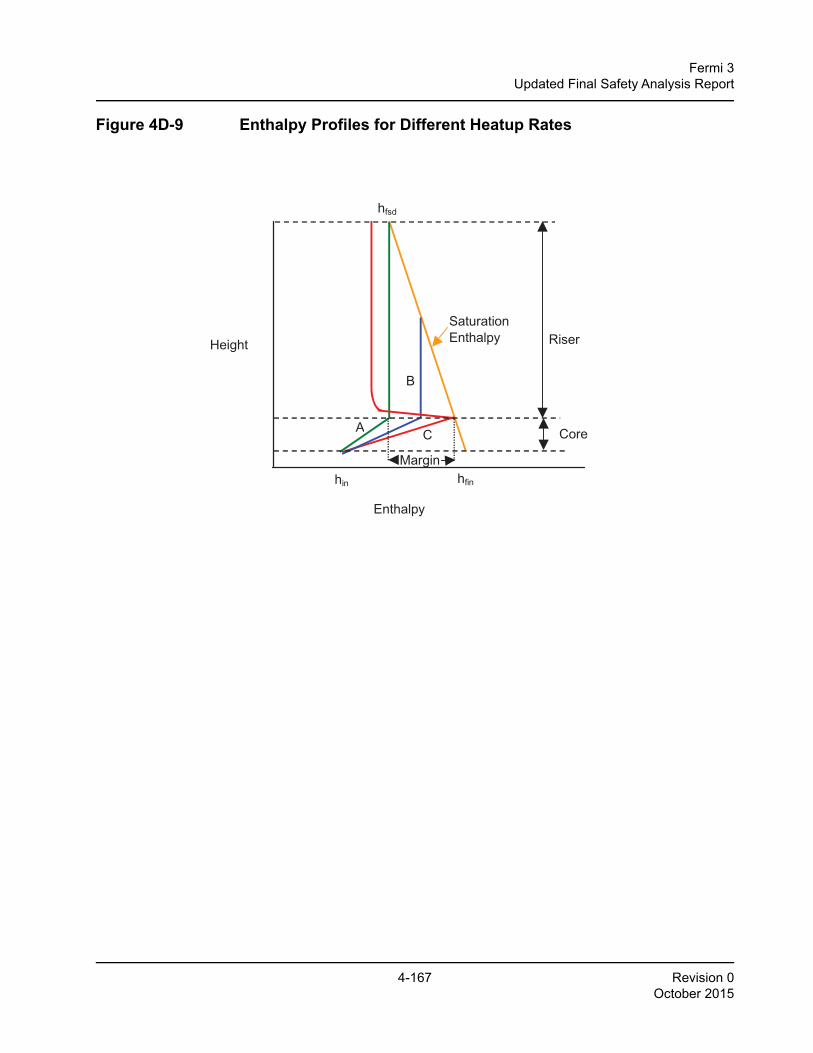
4-167 Revision 0October 2015
Fermi 3Updated Final Safety Analysis Report
Figure 4D-9 Enthalpy Profiles for Different Heatup Rates26A6642AP Rev. 10
WR Design Control Document/Ti
Figure 4D-9. Enthalpy Profiles for Different Heatup Rates
Height
Enthalpy
hin hfin
hfsd
Core
Riser
A
B
C
SaturationEnthalpy
Margin
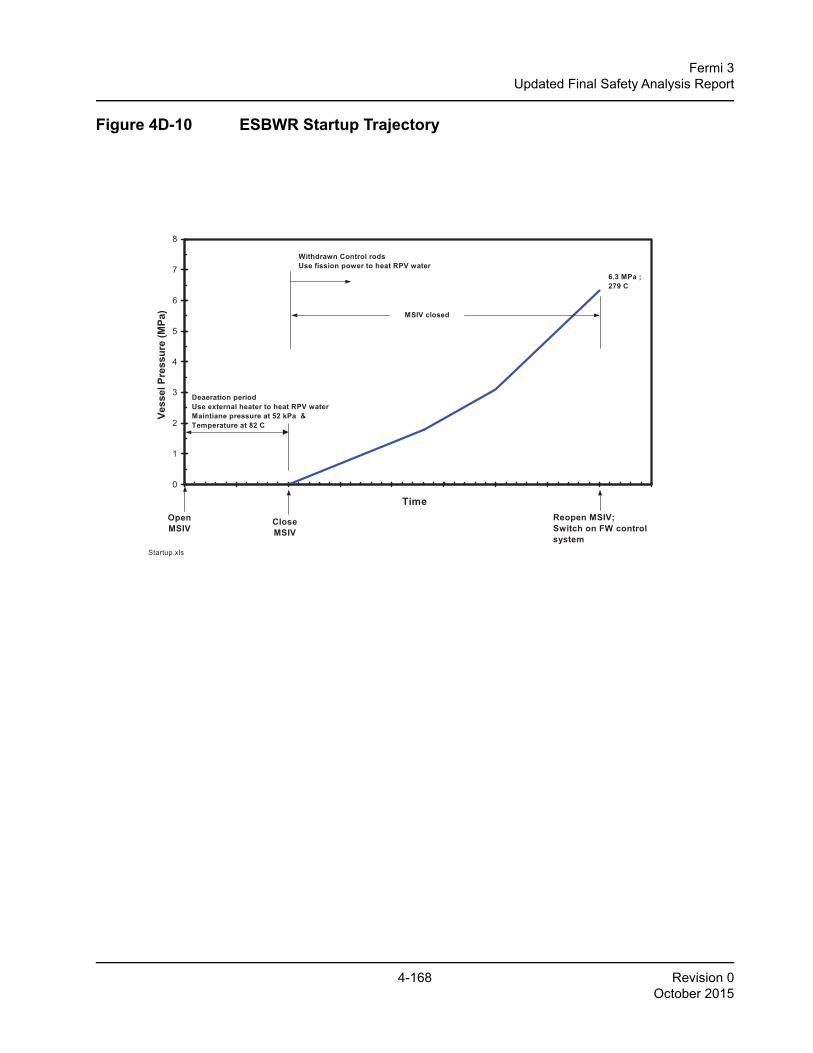
4-168 Revision 0October 2015
Fermi 3Updated Final Safety Analysis Report
Figure 4D-10 ESBWR Startup Trajectory
4D-32
Figure 4D-9. Enthalpy Profiles for Different Heatup Rates
Figure 4D-10. ESBWR Startup Trajectory
0
1
2
3
4
5
6
7
8
0 5 10 15 20 25 30 35 40 45Time
Vess
el P
ress
ure
(MPa
) .
Open MSIV
Close MSIV
Reopen MSIV;Switch on FW control system
Deaeration period Use external heater to heat RPV waterMaintiane pressure at 52 kPa &Temperature at 82 C
Withdrawn Control rods Use fission power to heat RPV water
6.3 MPa ; 279 C
Startup.xls
MSIV closed
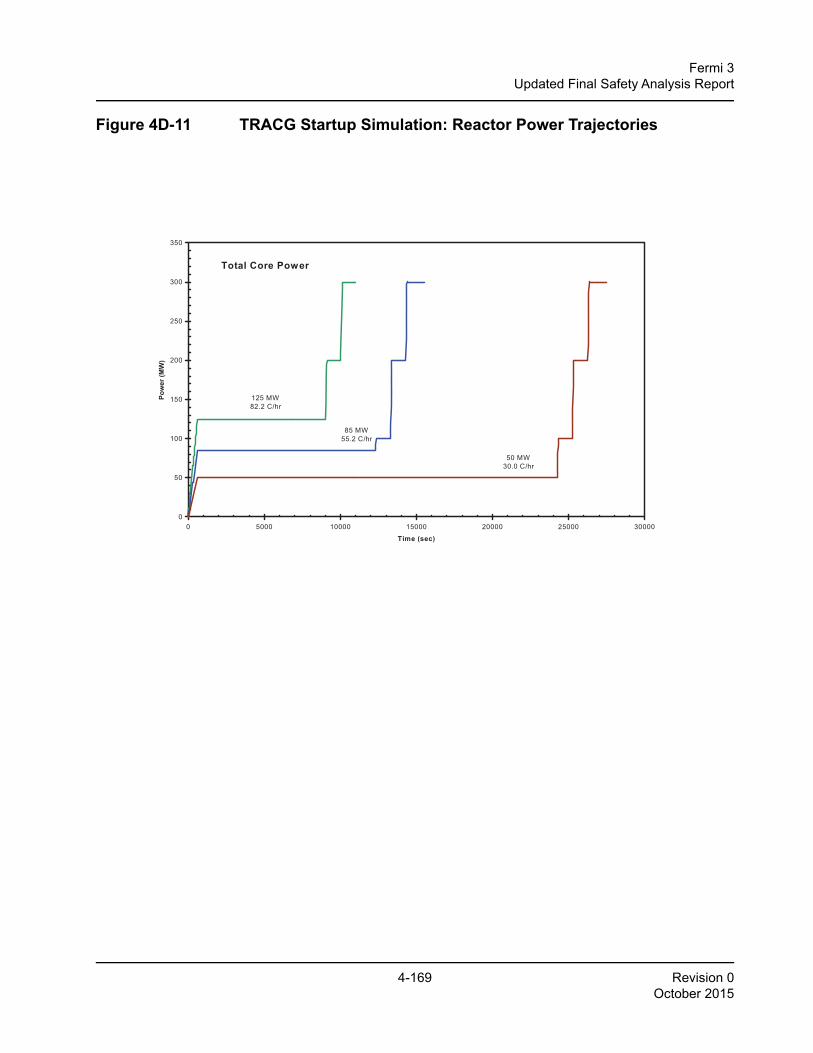
4-169 Revision 0October 2015
Fermi 3Updated Final Safety Analysis Report
Figure 4D-11 TRACG Startup Simulation: Reactor Power Trajectories
26A6642AP Rev. 10 SBWR Design Control Document/Tier 2
Figure 4D-11. TRACG Startup Simulation: Reactor Power Trajectories
0
50
100
150
200
250
300
350
0 5000 10000 15000 20000 25000 30000
Time (sec)
Pow
er (M
W)
125 MW82.2 C/hr
85 MW55.2 C/hr
50 MW30.0 C/hr
Total Core Power
7
8
RPV Pressure
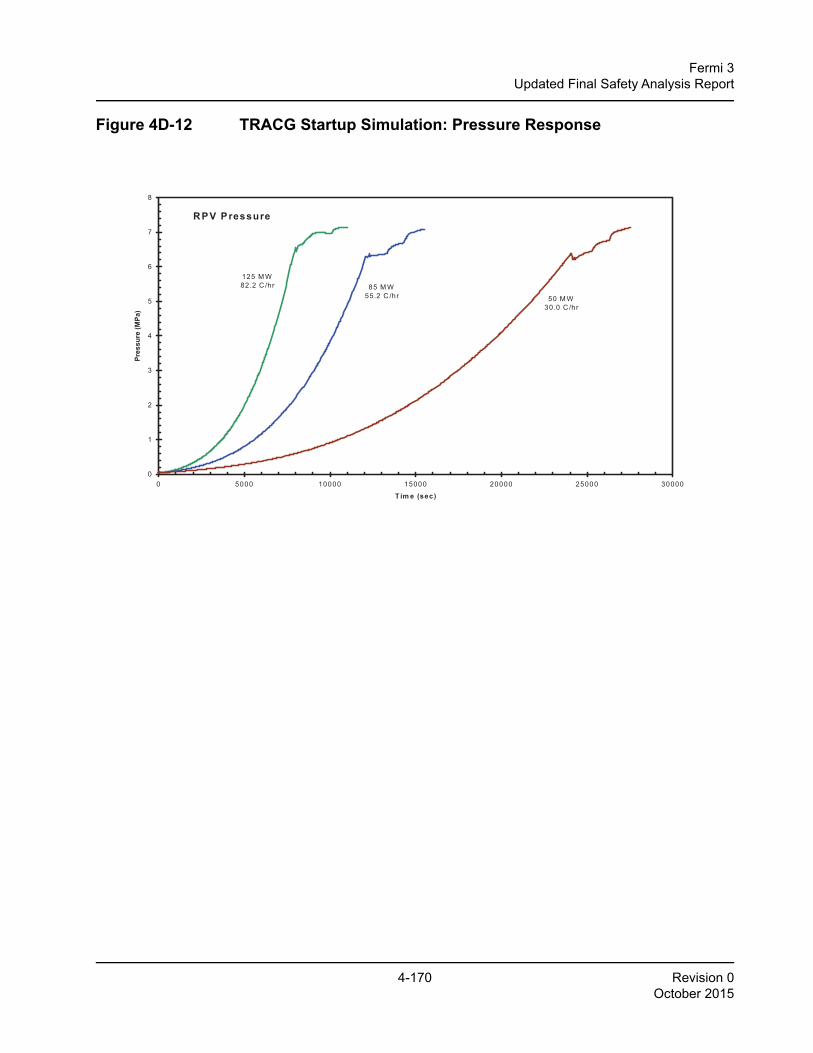
4-170 Revision 0October 2015
Fermi 3Updated Final Safety Analysis Report
Figure 4D-12 TRACG Startup Simulation: Pressure Response
4D-33
Figure 4D-12. TRACG Startup Simulation: Pressure Response
0
1
2
3
4
5
6
7
8
0 5000 10000 15000 20000 25000 30000
T im e (sec)
Pres
sure
(MPa
)
125 M W82.2 C /hr 85 M W
55.2 C /hr 50 M W30.0 C /hr
RPV Pressure
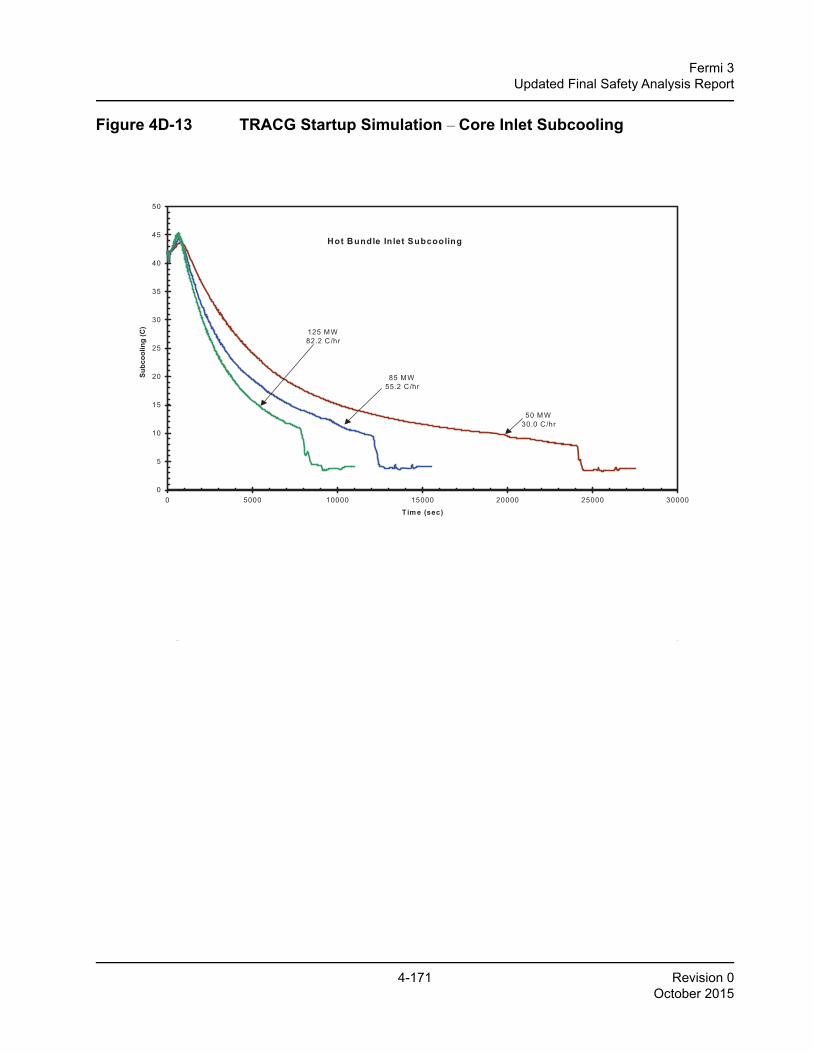
4-171 Revision 0October 2015
Fermi 3Updated Final Safety Analysis Report
Figure 4D-13 TRACG Startup Simulation – Core Inlet Subcooling26A6642AP Rev. 10
ESBWR Design Control Document/Tier 2
Figure 4D-13. TRACG Startup Simulation – Core Inlet Subcooling
0
5
10
15
20
25
30
35
40
45
50
0 5000 10000 15000 20000 25000 30000
Tim e (sec)
Subc
oolin
g (C
) .
Hot Bundle Inlet Subcooling
125 MW82.2 C /hr
85 MW55.2 C/hr
50 M W30.0 C /hr
7000
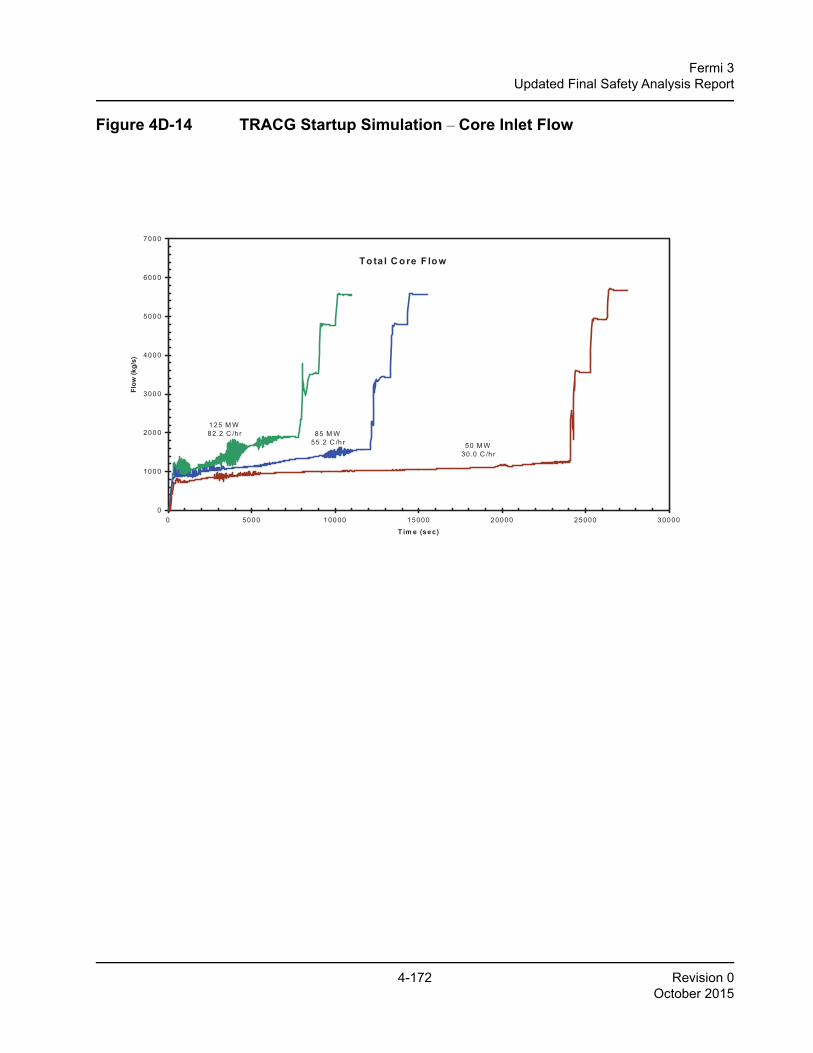
4-172 Revision 0October 2015
Fermi 3Updated Final Safety Analysis Report
Figure 4D-14 TRACG Startup Simulation – Core Inlet Flow
Figure 4D-13. TRACG Startup Simulation – Core Inlet Subcooling
Figure 4D-14. TRACG Startup Simulation – Core Inlet Flow
0
1000
2000
3000
4000
5000
6000
7000
0 5000 10000 15000 20000 25000 30000
T im e (sec)
Flow
(kg/
s)
125 M W82.2 C /h r 85 M W
55.2 C /hr 50 M W30.0 C /h r
Tota l C ore F low
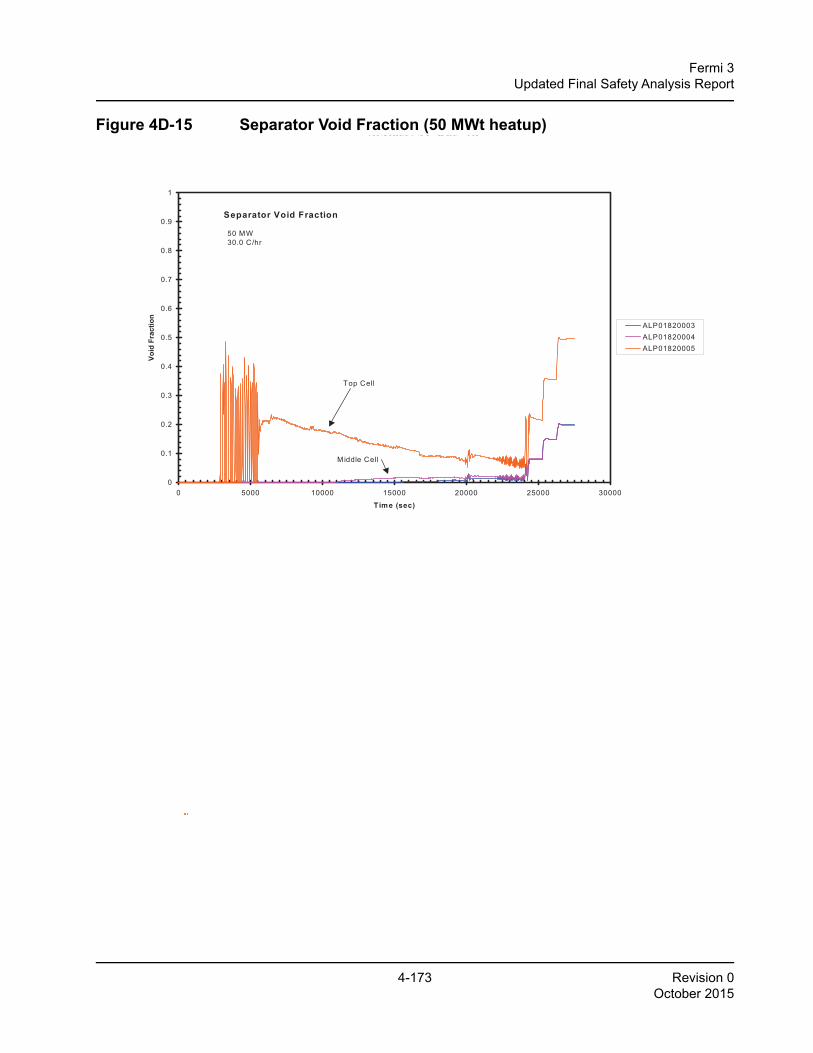
4-173 Revision 0October 2015
Fermi 3Updated Final Safety Analysis Report
Figure 4D-15 Separator Void Fraction (50 MWt heatup)26A6642AP Rev. 10
ESBWR Design Control Document/Tier
Figure 4D-15. Separator Void Fraction (50 MWt heatup)
0
0.1
0.2
0.3
0.4
0.5
0.6
0.7
0.8
0.9
1
0 5000 10000 15000 20000 25000 30000
Time (sec)
Void
Fra
ctio
n
ALP01820003ALP01820004ALP01820005
Top Cell
Middle Cell
50 MW30.0 C/hr
Separator Void Fraction
0.3
0.4
0.5
0.6
0.7
0.8
0.9
1
Void
Fra
ctio
n
ALP01820003ALP01820004ALP01820005
85 M W55.2 C /hr
S eparator Void Fraction
T op C ell
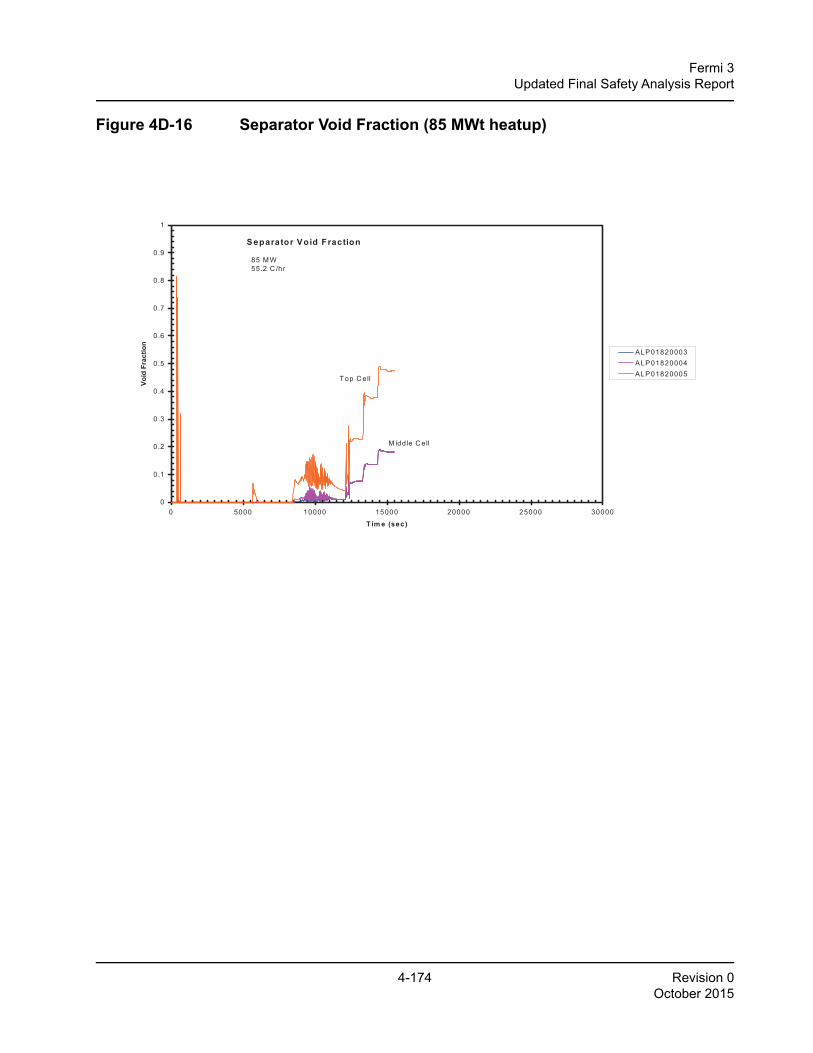
4-174 Revision 0October 2015
Fermi 3Updated Final Safety Analysis Report
Figure 4D-16 Separator Void Fraction (85 MWt heatup)Figure 4D-15. Separator Void Fraction (50 MWt heatup)
Figure 4D-16. Separator Void Fraction (85 MWt heatup)
0
0.1
0.2
0.3
0.4
0.5
0.6
0.7
0.8
0.9
1
0 5000 10000 15000 20000 25000 30000
T im e (sec)
Void
Fra
ctio
n
ALP01820003ALP01820004ALP01820005
85 M W55.2 C /hr
S eparator Void Fraction
T op C ell
M iddle C ell
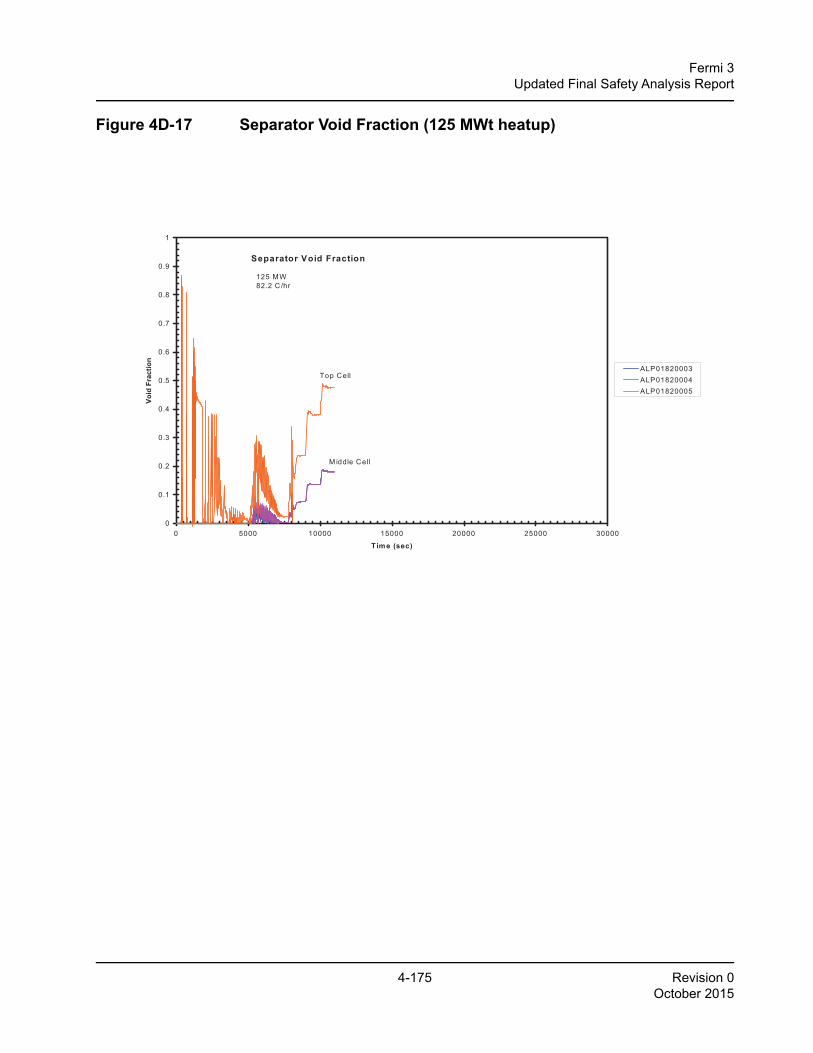
4-175 Revision 0October 2015
Fermi 3Updated Final Safety Analysis Report
Figure 4D-17 Separator Void Fraction (125 MWt heatup)
26A6642AP Rev. 10 ESBWR Design Control Document/Tier 2
Figure 4D-17. Separator Void Fraction (125 MWt heatup)
0
0.1
0.2
0.3
0.4
0.5
0.6
0.7
0.8
0.9
1
0 5000 10000 15000 20000 25000 30000
Tim e (sec)
Void
Fra
ctio
n
ALP01820003ALP01820004ALP01820005
125 MW82.2 C/hr
Separator Void Fraction
M iddle Cell
Top Cell
0.35
0.4
Hot Bundle Void Fraction, Section 1, R ing 1
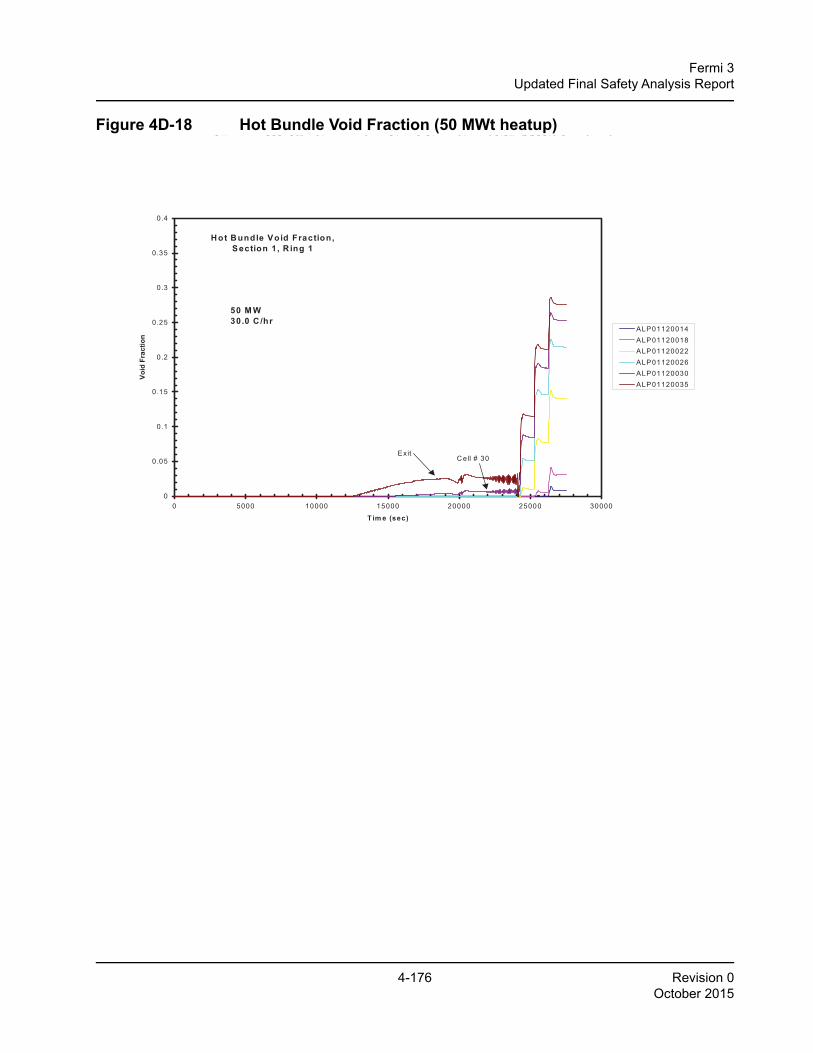
4-176 Revision 0October 2015
Fermi 3Updated Final Safety Analysis Report
Figure 4D-18 Hot Bundle Void Fraction (50 MWt heatup)
4D-36
Figure 4D-17. Separator Void Fraction (125 MWt heatup)
Figure 4D-18. Hot Bundle Void Fraction (50 MWt heatup)
0
0.05
0.1
0.15
0.2
0.25
0.3
0.35
0.4
0 5000 10000 15000 20000 25000 30000
T im e (sec)
Void
Fra
ctio
n
ALP01120014ALP01120018ALP01120022ALP01120026ALP01120030ALP01120035
Hot Bundle Void Fraction, Section 1, R ing 1
ExitC ell # 30
50 M W 30.0 C /hr
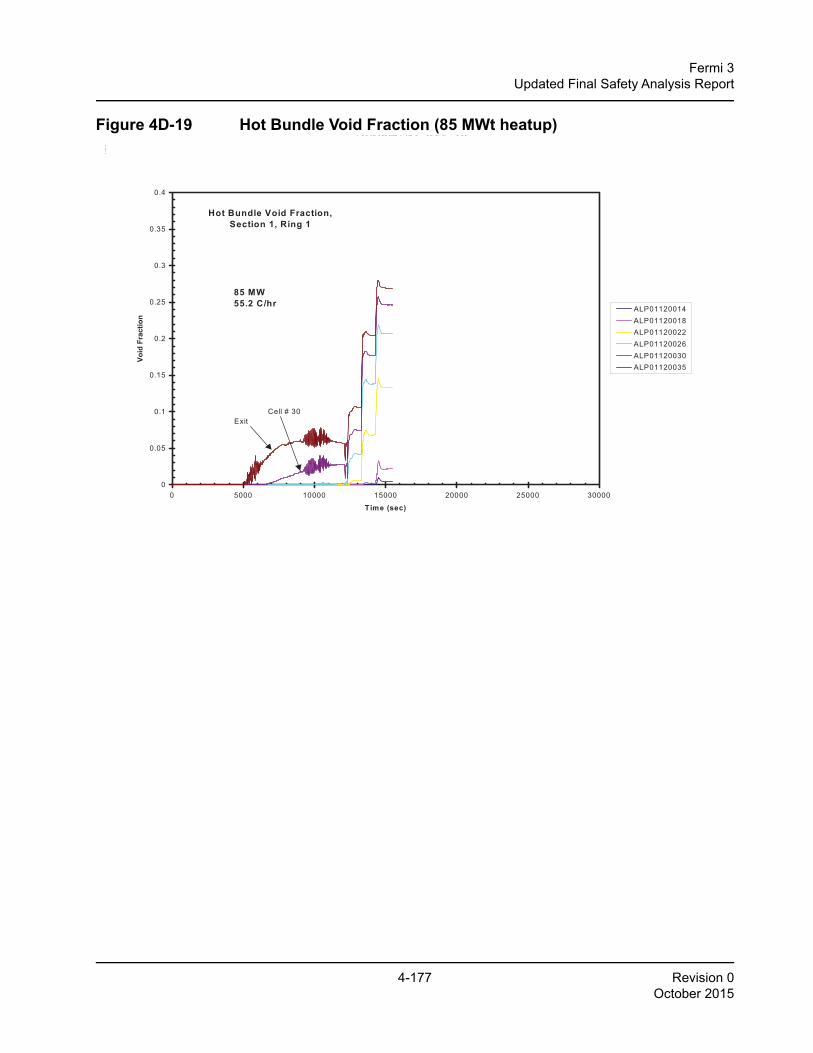
4-177 Revision 0October 2015
Fermi 3Updated Final Safety Analysis Report
Figure 4D-19 Hot Bundle Void Fraction (85 MWt heatup)26A6642AP Rev. 10 ESBWR Design Control Document/Tier 2
Figure 4D-19. Hot Bundle Void Fraction (85 MWt heatup)
0
0.05
0.1
0.15
0.2
0.25
0.3
0.35
0.4
0 5000 10000 15000 20000 25000 30000
Time (sec)
Void
Fra
ctio
n
ALP01120014ALP01120018ALP01120022ALP01120026ALP01120030ALP01120035
Hot Bundle Void Fraction, Section 1, Ring 1
ExitCell # 30
85 MW 55.2 C/hr
0.3
0.35
0.4
Hot Bundle Void Fraction, Section 1, Ring 1
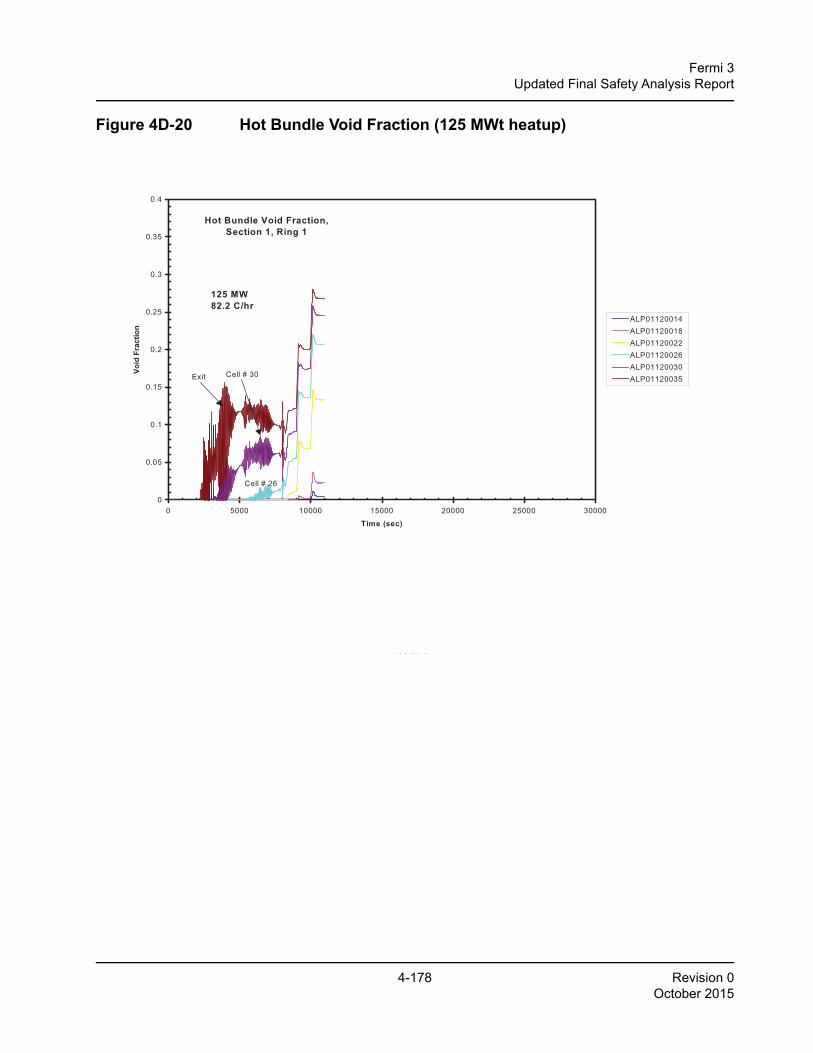
4-178 Revision 0October 2015
Fermi 3Updated Final Safety Analysis Report
Figure 4D-20 Hot Bundle Void Fraction (125 MWt heatup)
4D-37
Figure 4D-20. Hot Bundle Void Fraction (125 MWt heatup)
0
0.05
0.1
0.15
0.2
0.25
0.3
0.35
0.4
0 5000 10000 15000 20000 25000 30000
Time (sec)
Void
Fra
ctio
n
ALP01120014ALP01120018ALP01120022ALP01120026ALP01120030ALP01120035
Hot Bundle Void Fraction, Section 1, Ring 1
Exit Cell # 30
Cell # 26
125 MW 82.2 C/hr
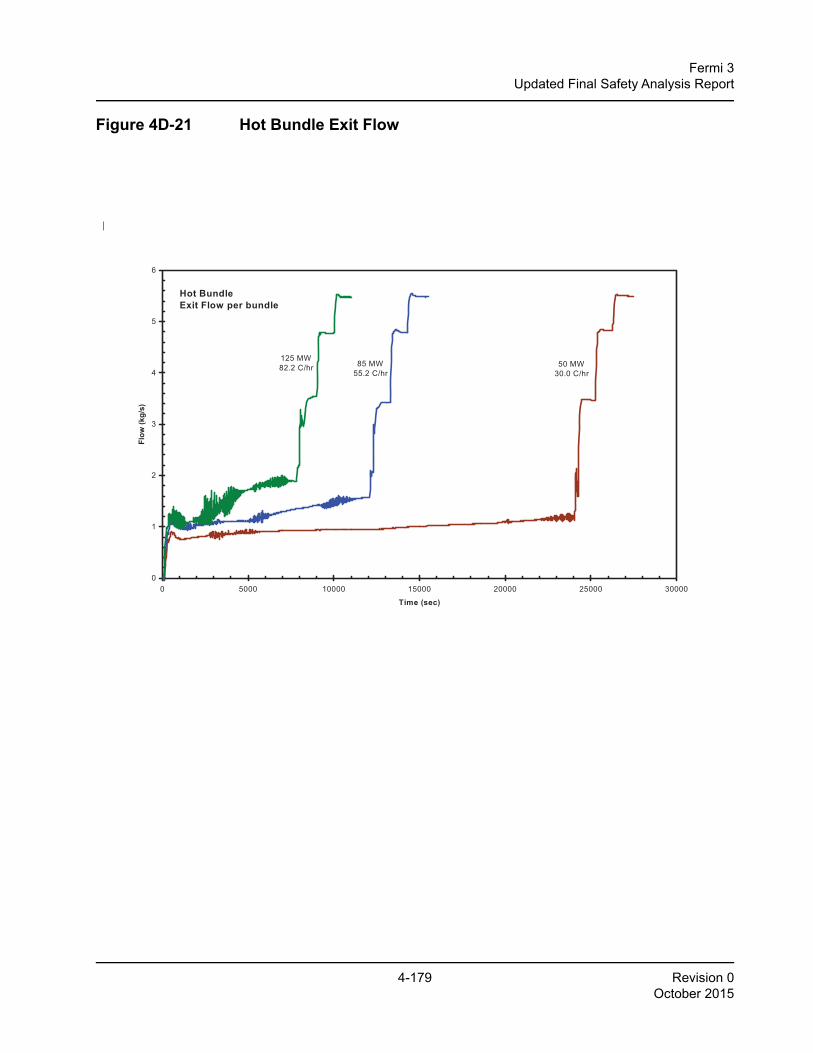
4-179 Revision 0October 2015
Fermi 3Updated Final Safety Analysis Report
Figure 4D-21 Hot Bundle Exit Flow
26A6642AP Rev. 10 ESBWR Design Control Document/Tier 2
Figure 4D-21. Hot Bundle Exit Flow
0
1
2
3
4
5
6
0 5000 10000 15000 20000 25000 30000
Time (sec)
Flow
(kg/
s)
Hot Bundle Exit Flow per bundle
125 MW82.2 C/hr 85 MW
55.2 C/hr50 MW
30.0 C/hr
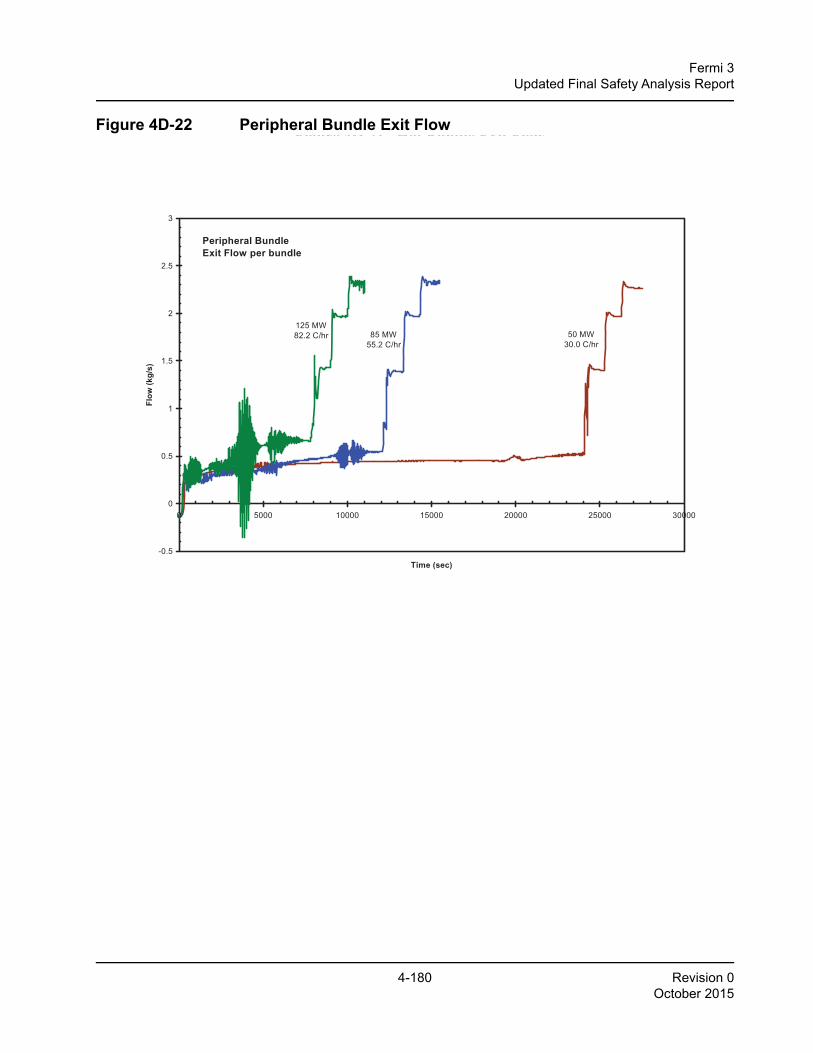
4-180 Revision 0October 2015
Fermi 3Updated Final Safety Analysis Report
Figure 4D-22 Peripheral Bundle Exit Flow
4D-38
Figure 4D-21. Hot Bundle Exit Flow
Figure 4D-22. Peripheral Bundle Exit Flow
-0.5
0
0.5
1
1.5
2
2.5
3
0 5000 10000 15000 20000 25000 30000
Time (sec)
Flow
(kg/
s)
Peripheral Bundle Exit Flow per bundle
125 MW82.2 C/hr 85 MW
55.2 C/hr50 MW
30.0 C/hr
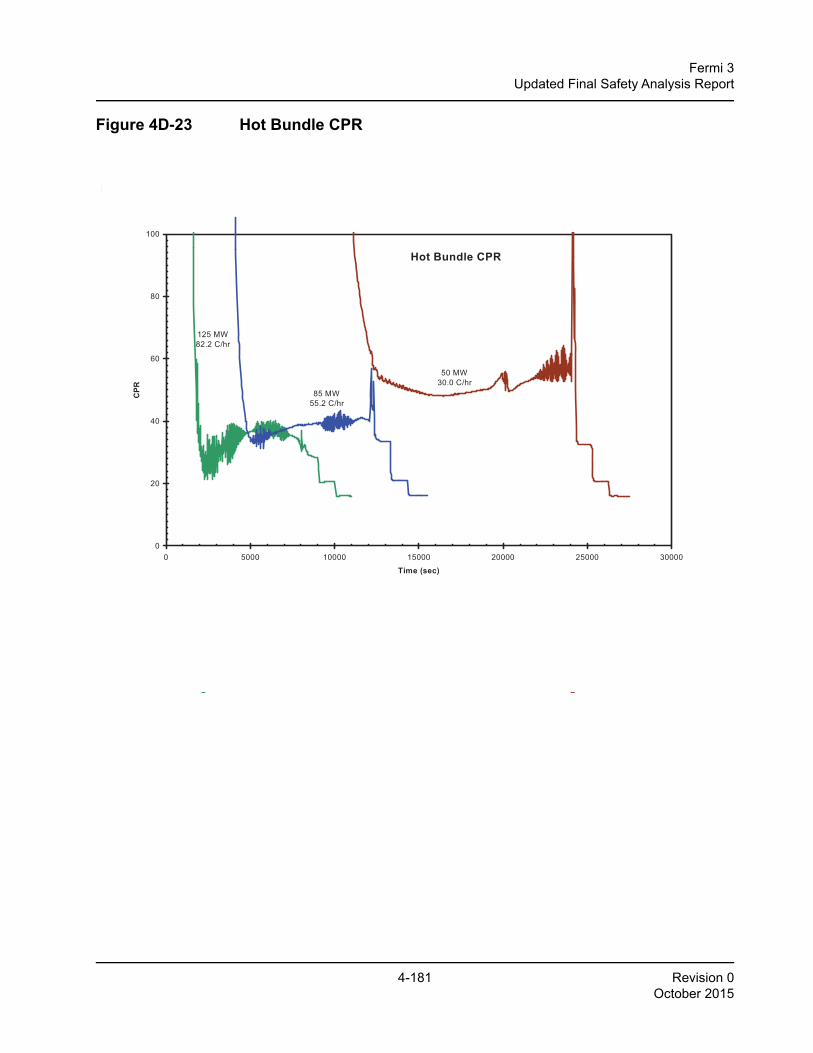
4-181 Revision 0October 2015
Fermi 3Updated Final Safety Analysis Report
Figure 4D-23 Hot Bundle CPR
26A6642AP Rev. 10 ESBWR Design Control Document/Tier 2
Figure 4D-23. Hot Bundle CPR
0
20
40
60
80
100
0 5000 10000 15000 20000 25000 30000
Time (sec)
CPR
125 MW82.2 C/hr
85 MW55.2 C/hr
50 MW30.0 C/hr
Hot Bundle CPR
100
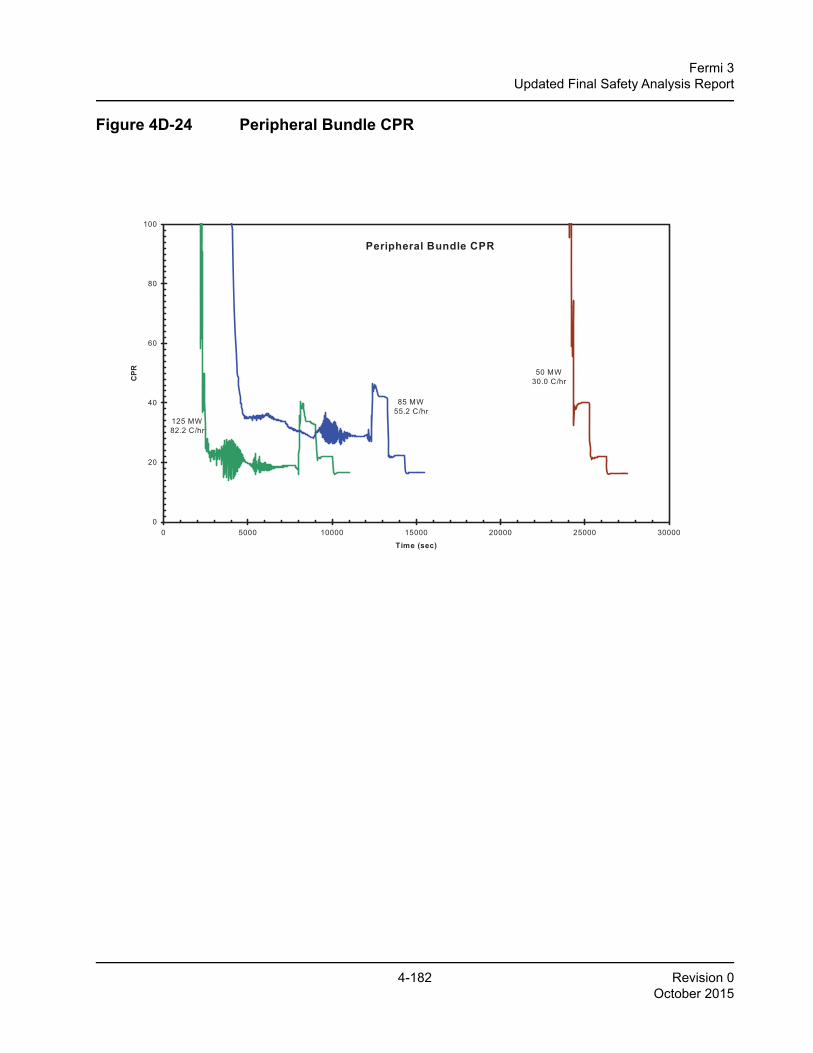
4-182 Revision 0October 2015
Fermi 3Updated Final Safety Analysis Report
Figure 4D-24 Peripheral Bundle CPR
4D-39
Figure 4D-23. Hot Bundle CPR
Figure 4D-24. Peripheral Bundle CPR
0
20
40
60
80
100
0 5000 10000 15000 20000 25000 30000
Time (sec)
CPR
125 MW82.2 C/hr
85 MW55.2 C/hr
50 MW30.0 C/hr
Peripheral Bundle CPR
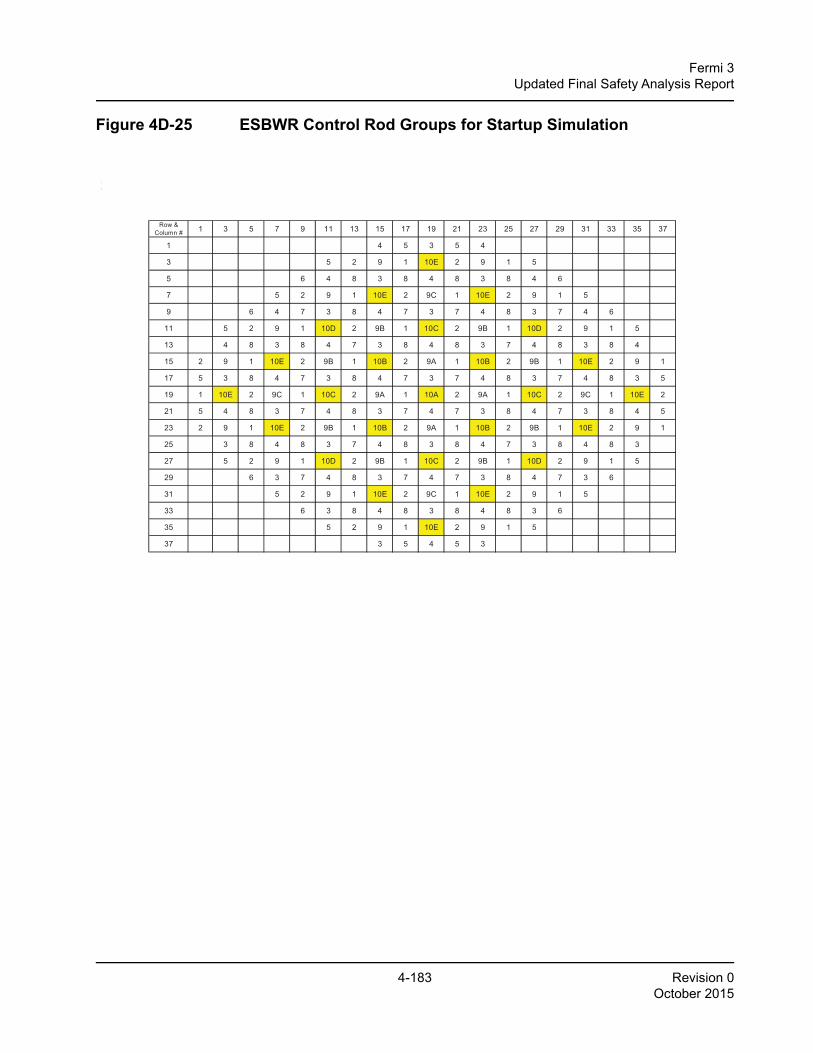
4-183 Revision 0October 2015
Fermi 3Updated Final Safety Analysis Report
Figure 4D-25 ESBWR Control Rod Groups for Startup Simulation
26A6642AP Rev. 10 ESBWR Design Control Document/Tier 2
Figure 4D-25. ESBWR Control Rod Groups for Startup Simulation
Row & Column # 1 3 5 7 9 11 13 15 17 19 21 23 25 27 29 31 33 35 37
1 4 5 3 5 4
3 5 2 9 1 10E 2 9 1 5
5 6 4 8 3 8 4 8 3 8 4 6
7 5 2 9 1 10E 2 9C 1 10E 2 9 1 5
9 6 4 7 3 8 4 7 3 7 4 8 3 7 4 6
11 5 2 9 1 10D 2 9B 1 10C 2 9B 1 10D 2 9 1 5
13 4 8 3 8 4 7 3 8 4 8 3 7 4 8 3 8 4
15 2 9 1 10E 2 9B 1 10B 2 9A 1 10B 2 9B 1 10E 2 9 1
17 5 3 8 4 7 3 8 4 7 3 7 4 8 3 7 4 8 3 5
19 1 10E 2 9C 1 10C 2 9A 1 10A 2 9A 1 10C 2 9C 1 10E 2
21 5 4 8 3 7 4 8 3 7 4 7 3 8 4 7 3 8 4 5
23 2 9 1 10E 2 9B 1 10B 2 9A 1 10B 2 9B 1 10E 2 9 1
25 3 8 4 8 3 7 4 8 3 8 4 7 3 8 4 8 3
27 5 2 9 1 10D 2 9B 1 10C 2 9B 1 10D 2 9 1 5
29 6 3 7 4 8 3 7 4 7 3 8 4 7 3 6
31 5 2 9 1 10E 2 9C 1 10E 2 9 1 5
33 6 3 8 4 8 3 8 4 8 3 6
35 5 2 9 1 10E 2 9 1 5
37 3 5 4 5 3
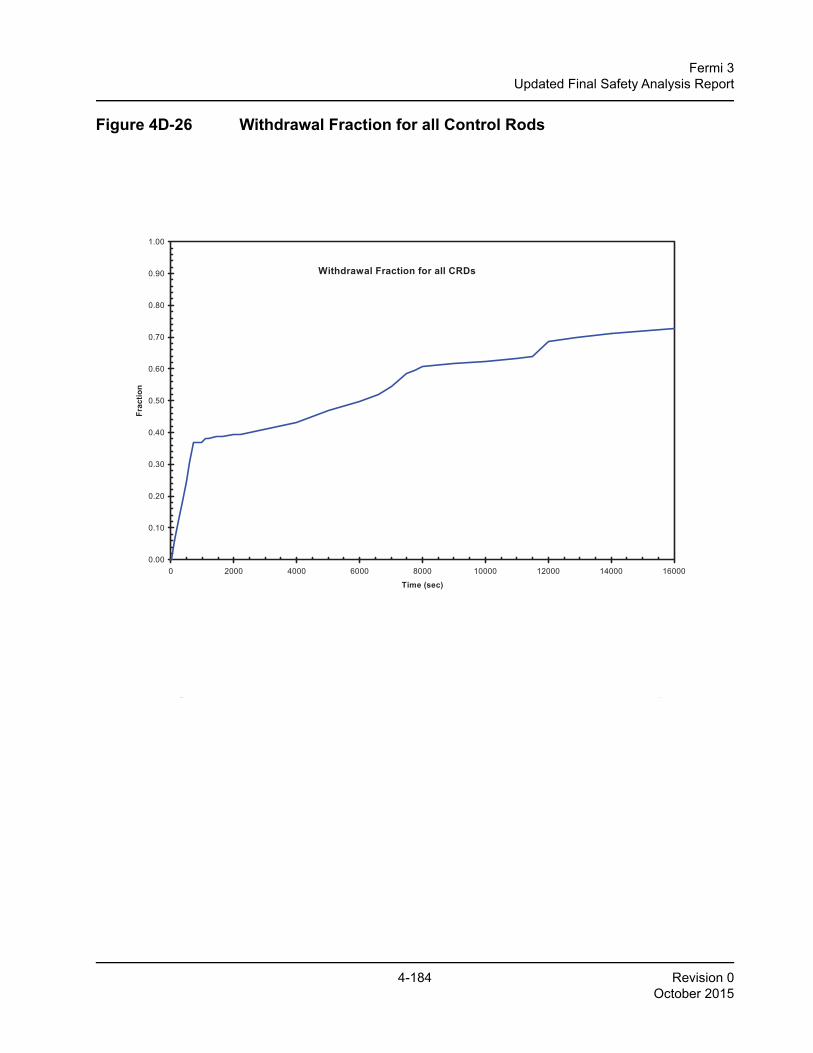
4-184 Revision 0October 2015
Fermi 3Updated Final Safety Analysis Report
Figure 4D-26 Withdrawal Fraction for all Control Rods
26A6642AP Rev. 10 ESBWR Design Control Document/Tier 2
Figure 4D-26. Withdrawal Fraction for all Control Rods
0.00
0.10
0.20
0.30
0.40
0.50
0.60
0.70
0.80
0.90
1.00
0 2000 4000 6000 8000 10000 12000 14000 16000
Time (sec)
Frac
tion
Withdrawal Fraction for all CRDs
250
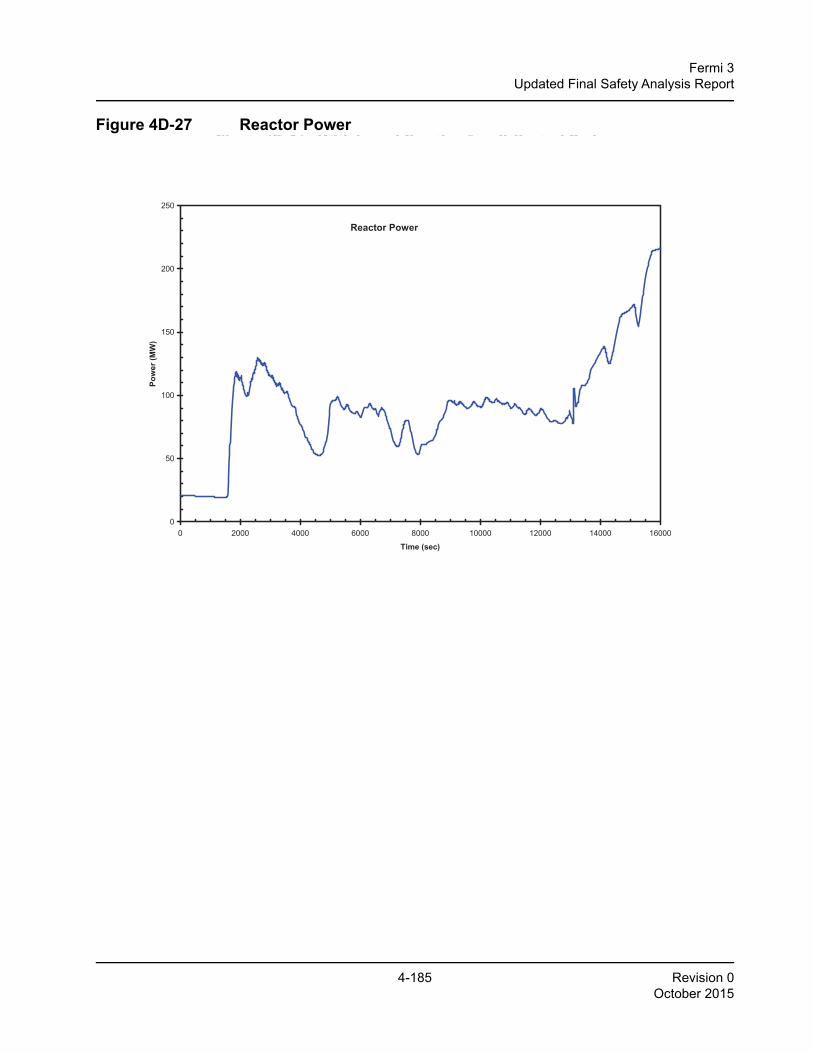
4-185 Revision 0October 2015
Fermi 3Updated Final Safety Analysis Report
Figure 4D-27 Reactor Power
4D-41
Figure 4D-26. Withdrawal Fraction for all Control Rods
Figure 4D-27. Reactor Power
0
50
100
150
200
250
0 2000 4000 6000 8000 10000 12000 14000 16000
Time (sec)
Pow
er (M
W)
Reactor Power
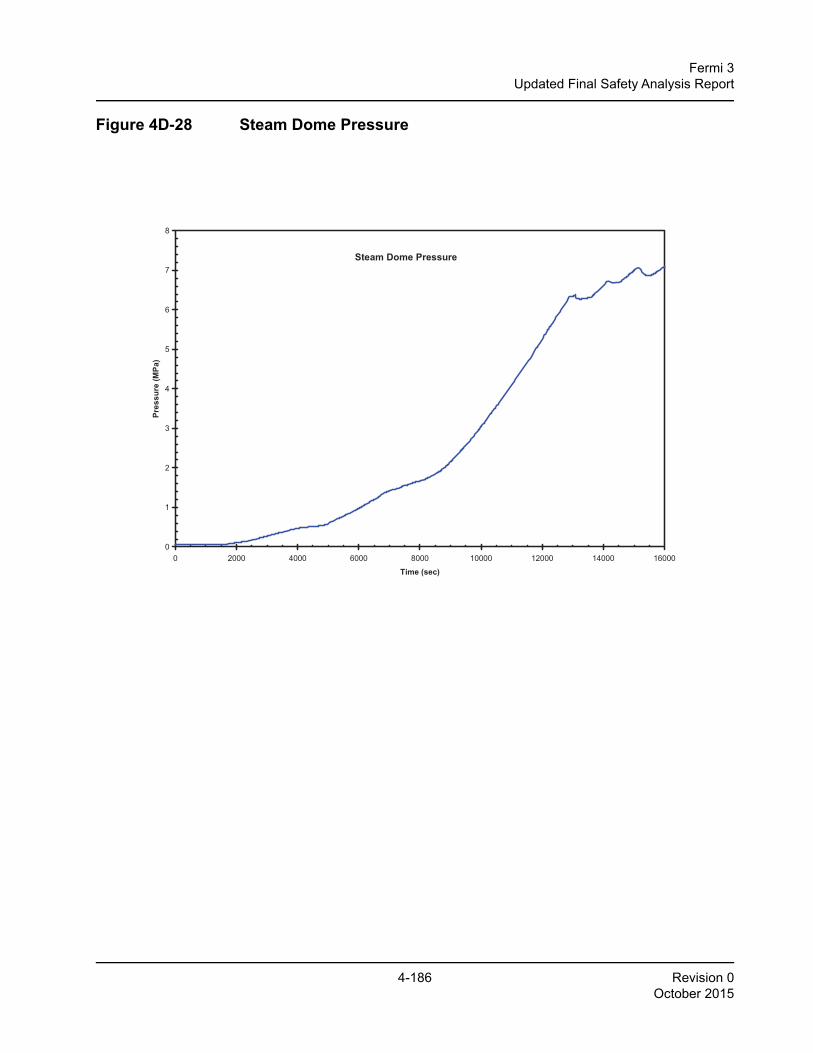
4-186 Revision 0October 2015
Fermi 3Updated Final Safety Analysis Report
Figure 4D-28 Steam Dome Pressure
26A6642AP Rev. 10 ESBWR Design Control Document/Tier 2
Figure 4D-28. Steam Dome Pressure
0
1
2
3
4
5
6
7
8
0 2000 4000 6000 8000 10000 12000 14000 16000
Time (sec)
Pres
sure
(MPa
)
Steam Dome Pressure
60
H t B dl I l t S b li
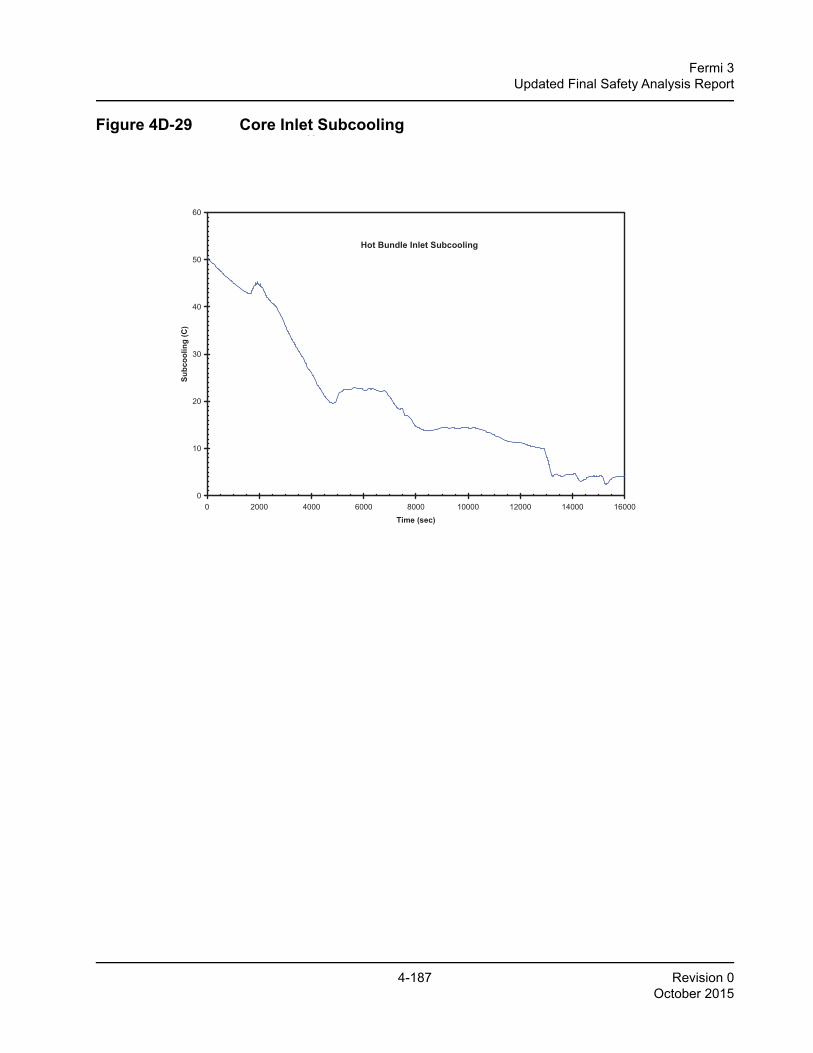
4-187 Revision 0October 2015
Fermi 3Updated Final Safety Analysis Report
Figure 4D-29 Core Inlet Subcooling
4D-42
g
Figure 4D-29. Core Inlet Subcooling
0
10
20
30
40
50
60
0 2000 4000 6000 8000 10000 12000 14000 16000
Time (sec)
Subc
oolin
g (C
)
Hot Bundle Inlet Subcooling
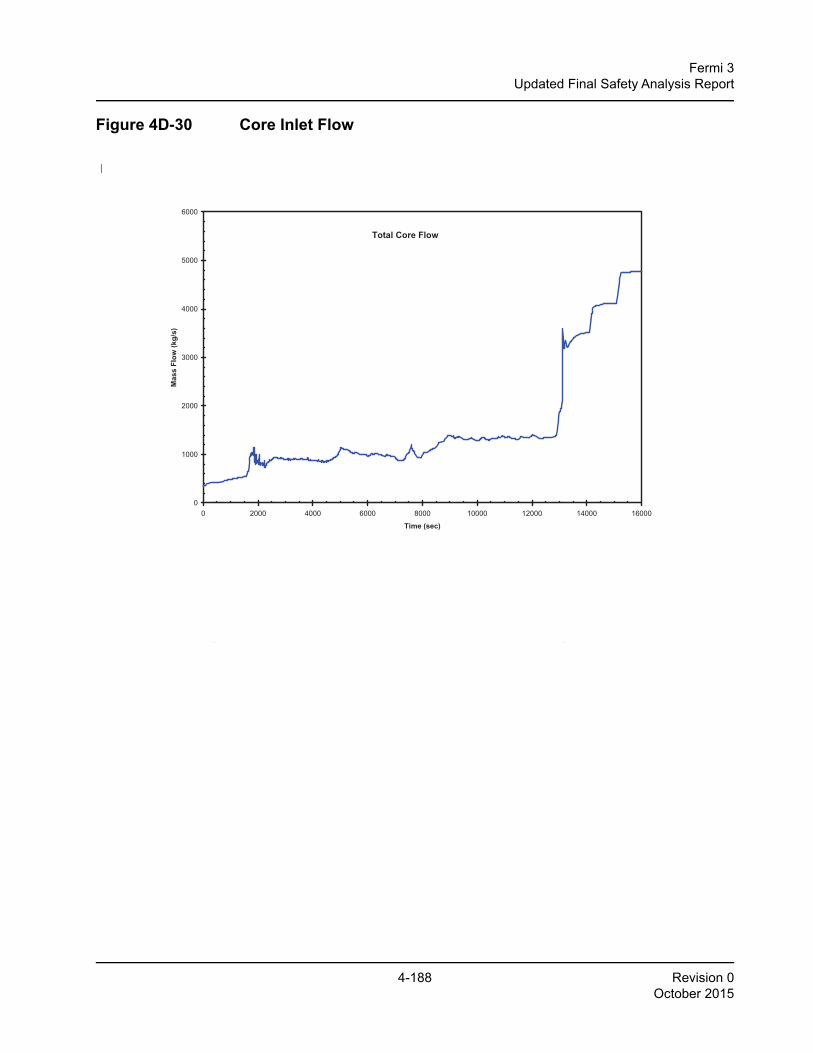
4-188 Revision 0October 2015
Fermi 3Updated Final Safety Analysis Report
Figure 4D-30 Core Inlet Flow26A6642AP Rev. 10
ESBWR Design Control Document/Tier 2
Figure 4D-30. Core Inlet Flow
0
1000
2000
3000
4000
5000
6000
0 2000 4000 6000 8000 10000 12000 14000 16000
Time (sec)
Mas
s Fl
ow (k
g/s)
Total Core Flow
0.20
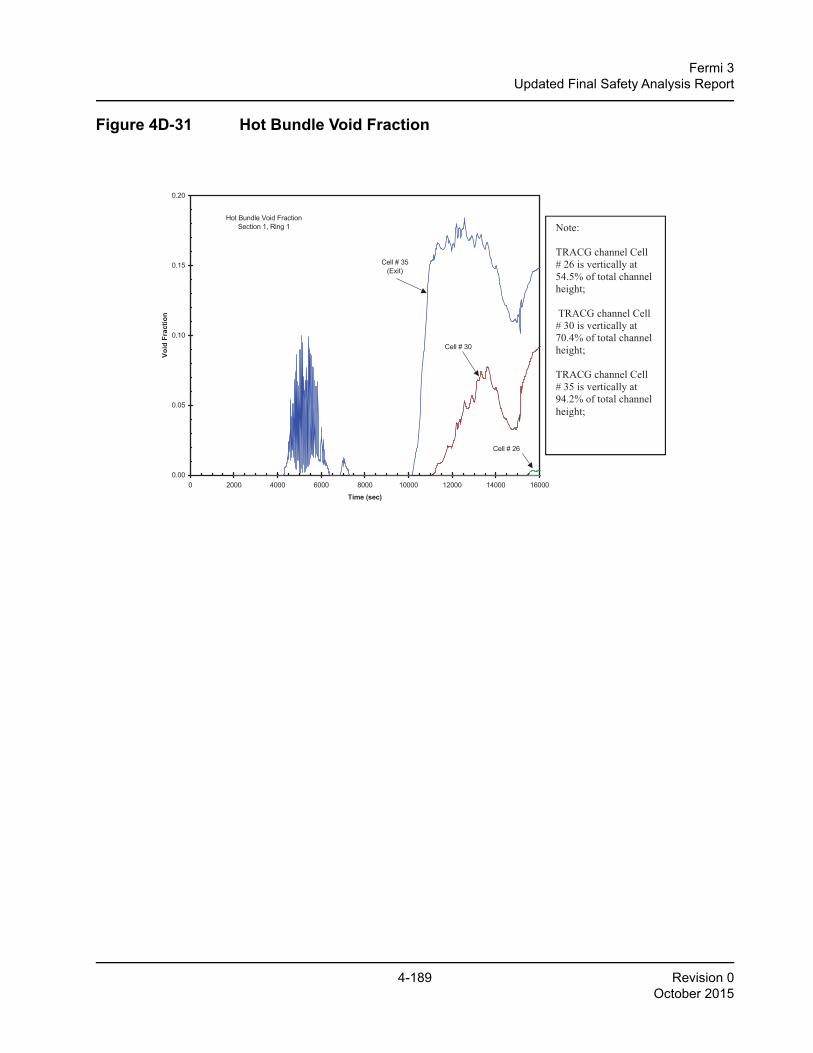
4-189 Revision 0October 2015
Fermi 3Updated Final Safety Analysis Report
Figure 4D-31 Hot Bundle Void Fraction
Figure 4D-31. Hot Bundle Void Fraction
0.00
0.05
0.10
0.15
0.20
0 2000 4000 6000 8000 10000 12000 14000 16000
Time (sec)
Void
Fra
ctio
n
ALP01120014ALP01120018ALP01120022ALP01120026ALP01120030ALP01120035
Cell # 35(Exit)
Cell # 30
Cell # 26
Hot Bundle Void FractionSection 1, Ring 1 Note:
TRACG channel Cell # 26 is vertically at 54.5% of total channel height; TRACG channel Cell # 30 is vertically at 70.4% of total channel height; TRACG channel Cell # 35 is vertically at 94.2% of total channel height;
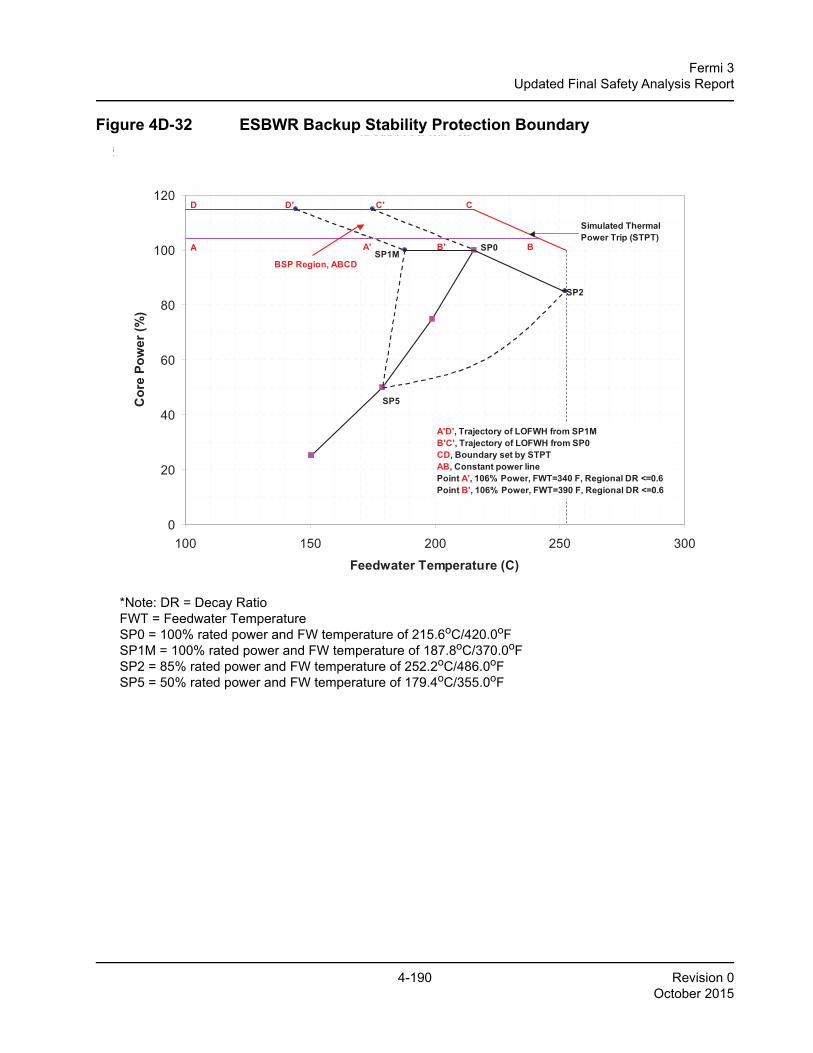
4-190 Revision 0October 2015
Fermi 3Updated Final Safety Analysis Report
Figure 4D-32 ESBWR Backup Stability Protection Boundary
*Note: DR = Decay RatioFWT = Feedwater TemperatureSP0 = 100% rated power and FW temperature of 215.6oC/420.0oFSP1M = 100% rated power and FW temperature of 187.8oC/370.0oFSP2 = 85% rated power and FW temperature of 252.2oC/486.0oFSP5 = 50% rated power and FW temperature of 179.4oC/355.0oF
26A6642AP Rev. 10 SBWR Design Control Document/Tier
0
20
40
60
80
100
120
100 150 200 250 300
Feedwater Temperature (C)
Cor
e Po
wer
(%)
A' B'
C'D'
SP0SP1M
SP2
SP5
BSP Region, ABCD
Simulated Thermal Power Trip (STPT)
A'D', Trajectory of LOFWH from SP1MB'C', Trajectory of LOFWH from SP0CD, Boundary set by STPTAB, Constant power line Point A', 106% Power, FWT=340 F, Regional DR <=0.6Point B', 106% Power, FWT=390 F, Regional DR <=0.6
A
D
B
C