Embed Size (px)
Citation preview
8/6/2019 Chapter 4 Measures of Central Etndency and Dispersion 2008
http://slidepdf.com/reader/full/chapter-4-measures-of-central-etndency-and-dispersion-2008 1/21
Measures of central tendency and Dispersion
Measures of Central Tendency: attempt to quantifywhat we mean when we think of as the "typical" or"average" score in a data set.
A single value to summarize a set of epidemiologicaldata.
For example, we often want to know before purchasinga car its average distance per liter of petrol. Or beforeaccepting a job, you might want to know what a
typical salary is for people in that position so you willknow whether or not you are going to be paid whatyou are worth. Statistics geared toward measuringcentral tendency all focus on this concept of "typical"
or "average."
8/6/2019 Chapter 4 Measures of Central Etndency and Dispersion 2008
http://slidepdf.com/reader/full/chapter-4-measures-of-central-etndency-and-dispersion-2008 2/21
Statisticians use three measures of central
tendency
�The Mode
�The Median
�The Mean
8/6/2019 Chapter 4 Measures of Central Etndency and Dispersion 2008
http://slidepdf.com/reader/full/chapter-4-measures-of-central-etndency-and-dispersion-2008 3/21
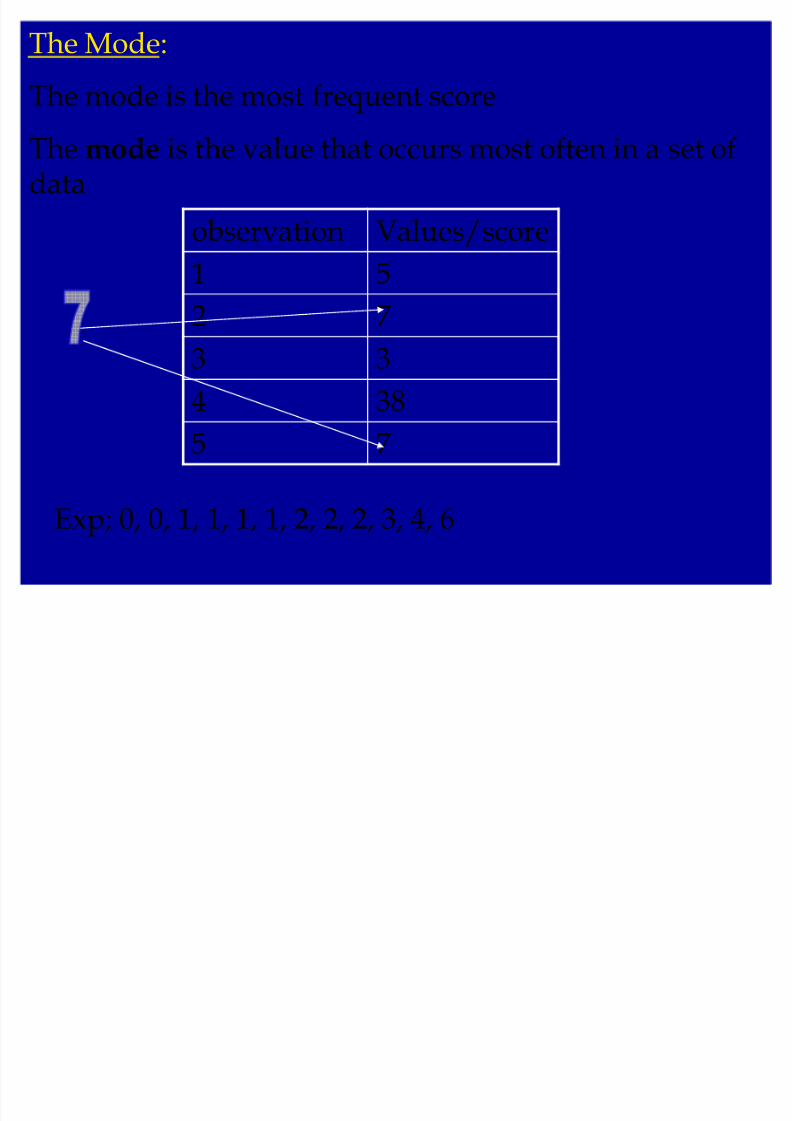
The Mode:
The mode is the most frequent score
The mode is the value that occurs most often in a set ofdata
observation Values/score
1 52 7
3 3
4 385 7
Exp; 0, 0, 1, 1, 1, 1, 2, 2, 2, 3, 4, 6
8/6/2019 Chapter 4 Measures of Central Etndency and Dispersion 2008
http://slidepdf.com/reader/full/chapter-4-measures-of-central-etndency-and-dispersion-2008 4/21
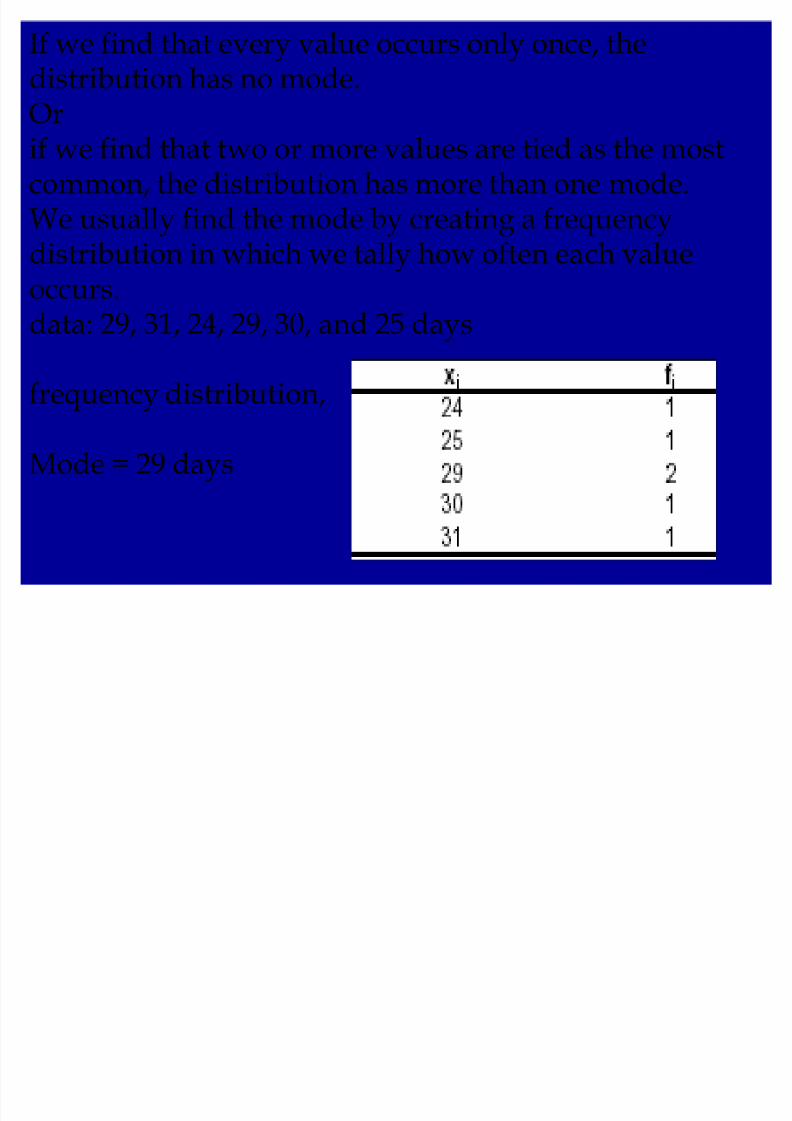
If we find that every value occurs only once, thedistribution has no mode.Orif we find that two or more values are tied as the mostcommon, the distribution has more than one mode.We usually find the mode by creating a frequencydistribution in which we tally how often each valueoccurs.data: 29, 31, 24, 29, 30, and 25 days
frequency distribution,
Mode = 29 days
8/6/2019 Chapter 4 Measures of Central Etndency and Dispersion 2008
http://slidepdf.com/reader/full/chapter-4-measures-of-central-etndency-and-dispersion-2008 5/21
Example� find the mode for the following set of data:
15, 9, 19, 13, 17, 11.
� find the mode for the following set of data:17, 9, 15, 9, 17, 13.
8/6/2019 Chapter 4 Measures of Central Etndency and Dispersion 2008
http://slidepdf.com/reader/full/chapter-4-measures-of-central-etndency-and-dispersion-2008 6/21
�The Median
(average)
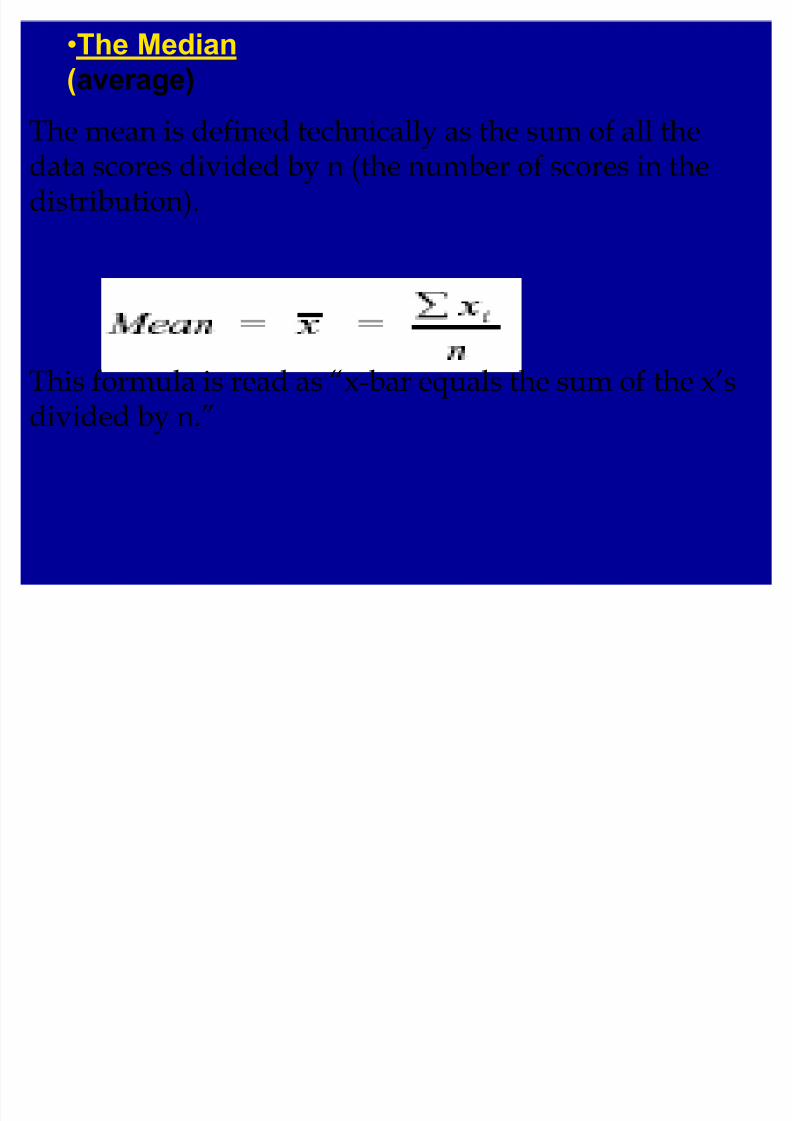
The mean is defined technically as the sum of all thedata scores divided by n (the number of scores in thedistribution).
This formula is read as ´x-bar equals the sum of the x·s
divided by n.µ
8/6/2019 Chapter 4 Measures of Central Etndency and Dispersion 2008
http://slidepdf.com/reader/full/chapter-4-measures-of-central-etndency-and-dispersion-2008 7/21
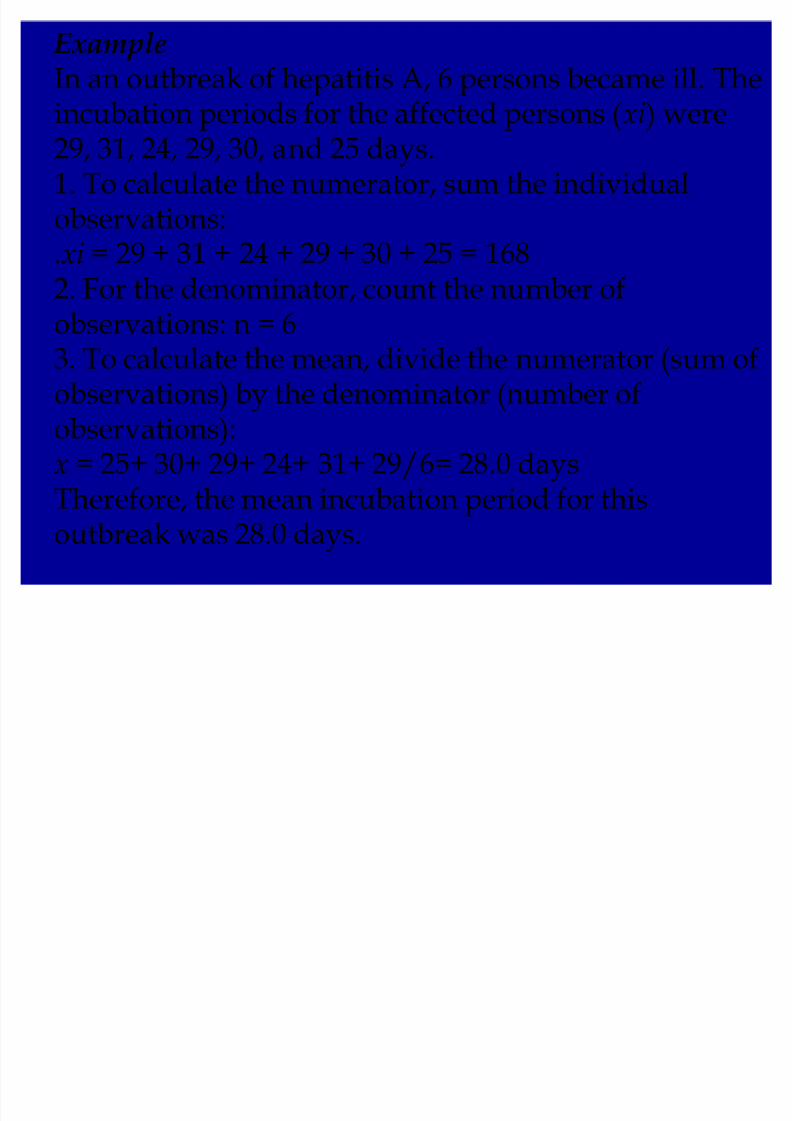
ExampleIn an outbreak of hepatitis A, 6 persons became ill. Theincubation periods for the affected persons (xi) were29, 31, 24, 29, 30, and 25 days.1. To calculate the numerator, sum the individualobservations:.xi = 29 + 31 + 24 + 29 + 30 + 25 = 1682. For the denominator, count the number ofobservations: n = 63. To calculate the mean, divide the numerator (sum ofobservations) by the denominator (number ofobservations):x = 25+ 30+ 29+ 24+ 31+ 29/6= 28.0 daysTherefore, the mean incubation period for thisoutbreak was 28.0 days.
8/6/2019 Chapter 4 Measures of Central Etndency and Dispersion 2008
http://slidepdf.com/reader/full/chapter-4-measures-of-central-etndency-and-dispersion-2008 8/21
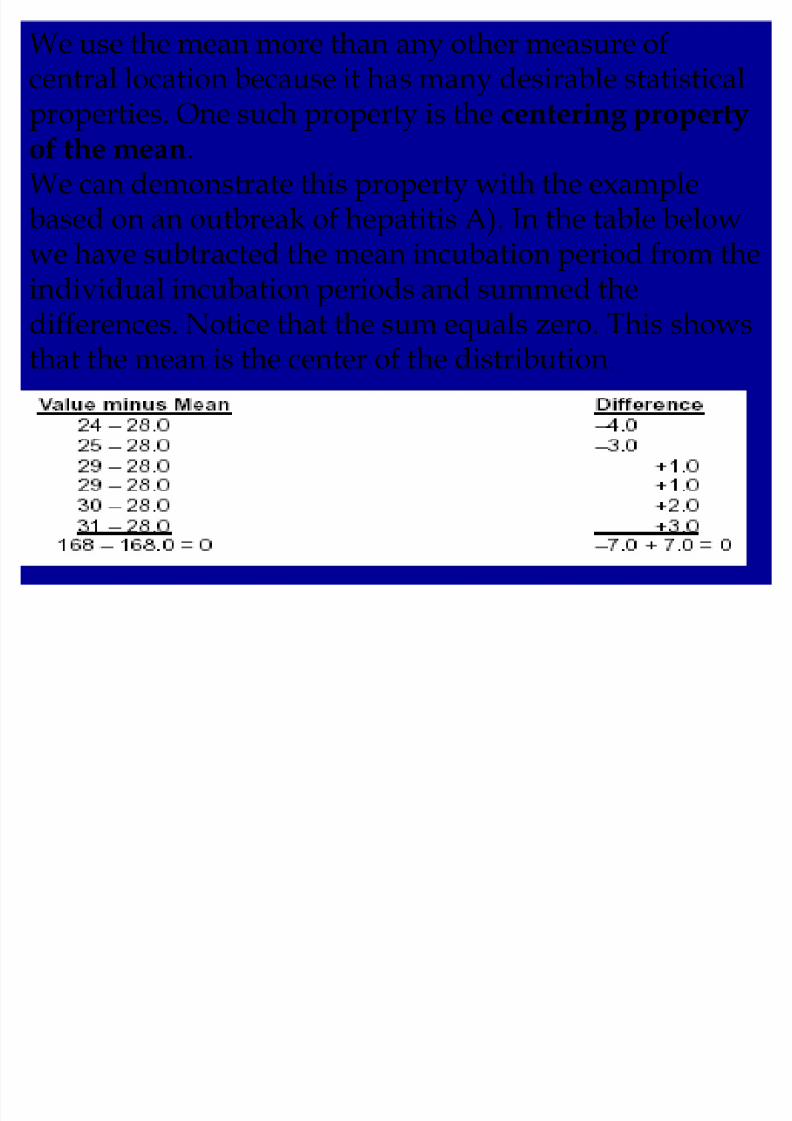
We use the mean more than any other measure ofcentral location because it has many desirable statisticalproperties. One such property is the centering property
of the mean.We can demonstrate this property with the examplebased on an outbreak of hepatitis A). In the table belowwe have subtracted the mean incubation period from theindividual incubation periods and summed thedifferences. Notice that the sum equals zero. This showsthat the mean is the center of the distribution.
8/6/2019 Chapter 4 Measures of Central Etndency and Dispersion 2008
http://slidepdf.com/reader/full/chapter-4-measures-of-central-etndency-and-dispersion-2008 9/21
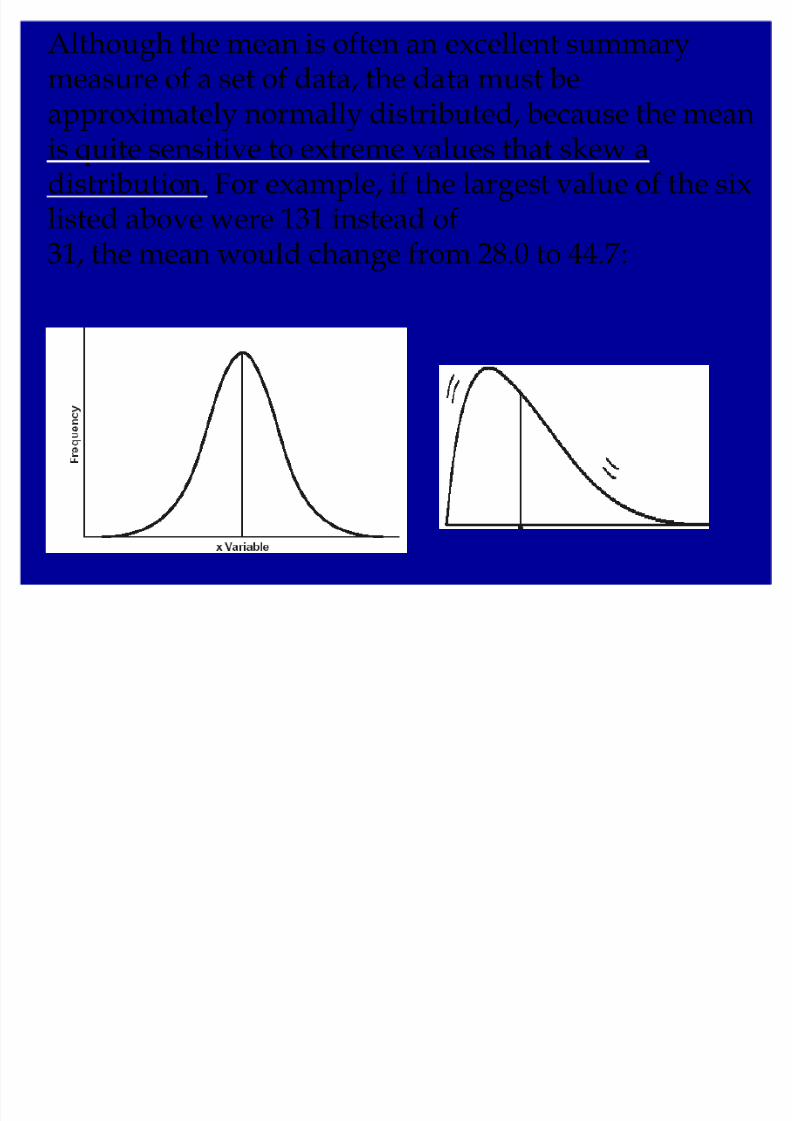
Although the mean is often an excellent summarymeasure of a set of data, the data must beapproximately normally distributed, because the mean
is quite sensitive to extreme values that skew adistribution. For example, if the largest value of the sixlisted above were 131 instead of31, the mean would change from 28.0 to 44.7:
8/6/2019 Chapter 4 Measures of Central Etndency and Dispersion 2008
http://slidepdf.com/reader/full/chapter-4-measures-of-central-etndency-and-dispersion-2008 10/21
The MedianAnother common measure of central location is themedian. As you will see, it is especially useful when
data are skewed.Median means middle, and the median is the middle of aset of data that has been put into rank order. Specifically,it is the value that divides a set of data into two halves,with one half of the observations being larger than themedian value, and one half smaller. For example,suppose we had the following set of systolic bloodpressures (in mm/Hg):110, 120, 122, 130, 180
median is 122 mm/Hg,
8/6/2019 Chapter 4 Measures of Central Etndency and Dispersion 2008
http://slidepdf.com/reader/full/chapter-4-measures-of-central-etndency-and-dispersion-2008 11/21
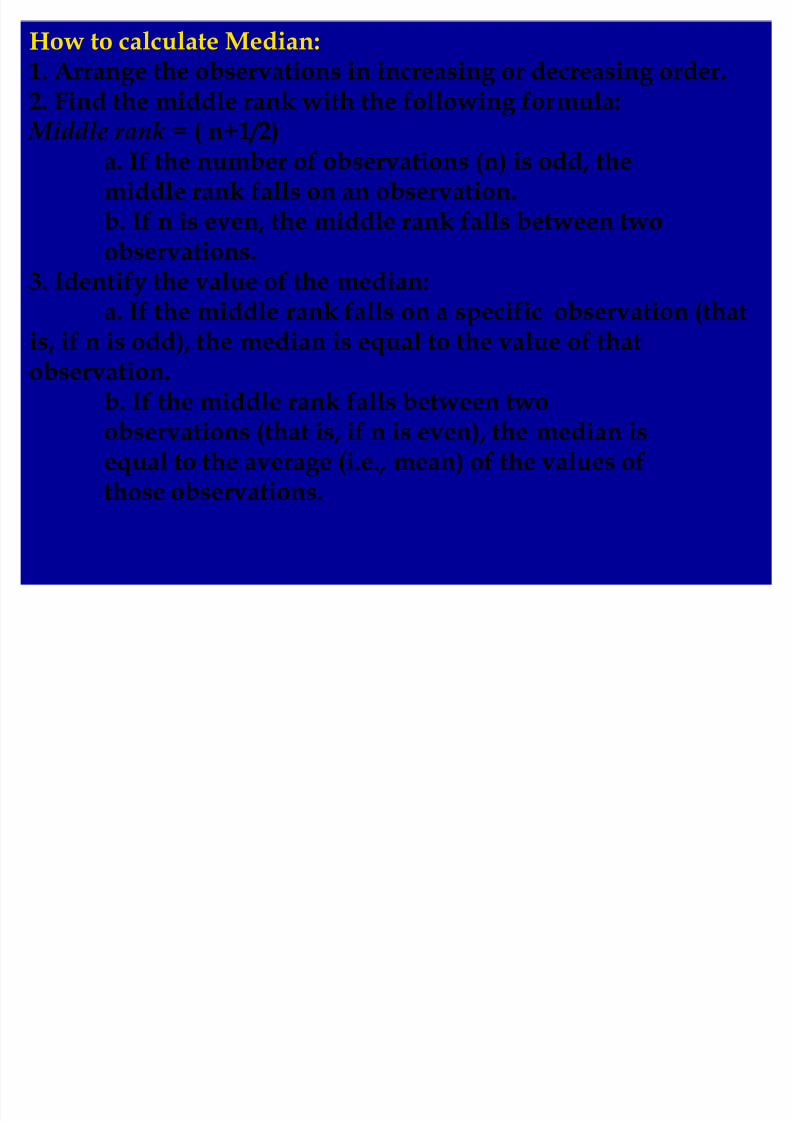
How to calculate Median:1. Arrange the observations in increasing or decreasing order.2. Find the middle rank with the following formula:
Midd le rank = ( n+1/2)a. If the number of observations (n) is odd, themiddle rank falls on an observation.b. If n is even, the middle rank falls between twoobservations.
3. Identify the value of the median:a. If the middle rank falls on a specific observation (that
is, if n is odd), the median is equal to the value of thatobservation.
b. If them
iddle rank falls between twoobservations (that is, if n is even), the median isequal to the average (i.e., mean) of the values ofthose observations.
8/6/2019 Chapter 4 Measures of Central Etndency and Dispersion 2008
http://slidepdf.com/reader/full/chapter-4-measures-of-central-etndency-and-dispersion-2008 12/21
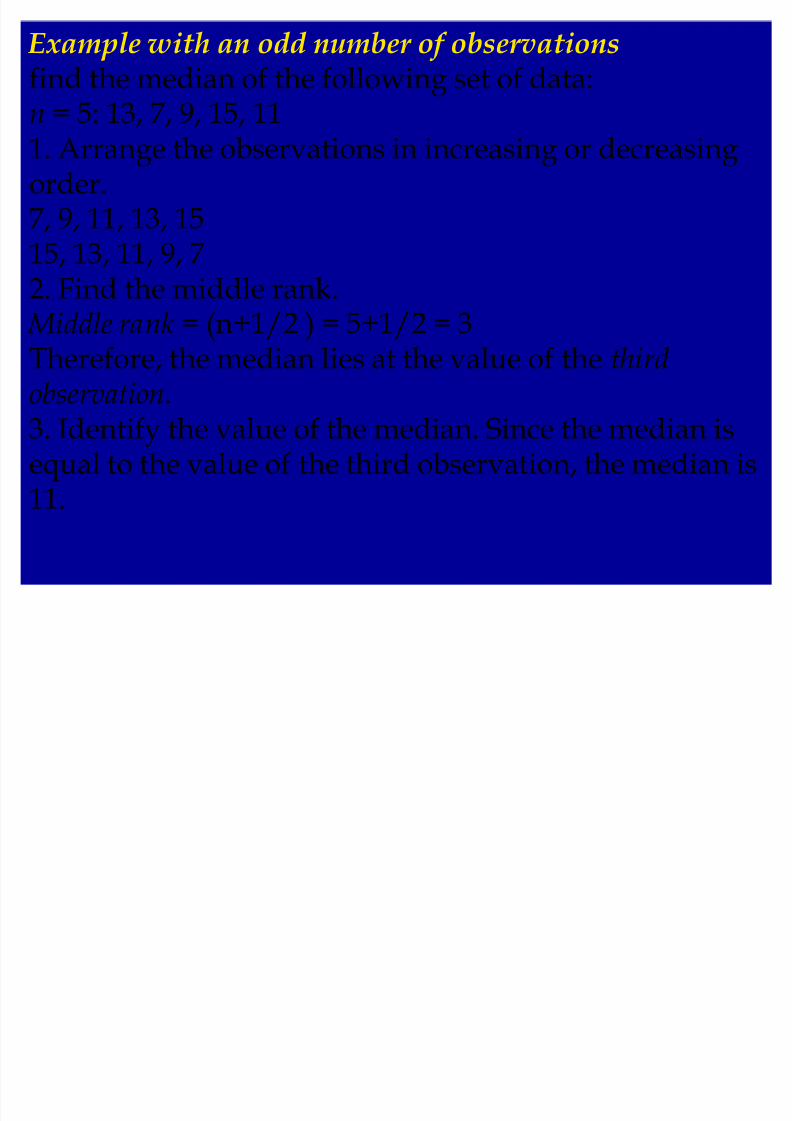
Example with an odd number of observationsfind the median of the following set of data:n = 5: 13, 7, 9, 15, 11
1. Arrange the observations in increasing or decreasingorder.7, 9, 11, 13, 1515, 13, 11, 9, 72. Find the middle rank. Middle rank = (n+1/2 ) = 5+1/2 = 3Therefore, the median lies at the value of the thirdobservation.3. Identify the value of the median. Since the median isequal to the value of the third observation, the median is11.
8/6/2019 Chapter 4 Measures of Central Etndency and Dispersion 2008
http://slidepdf.com/reader/full/chapter-4-measures-of-central-etndency-and-dispersion-2008 13/21
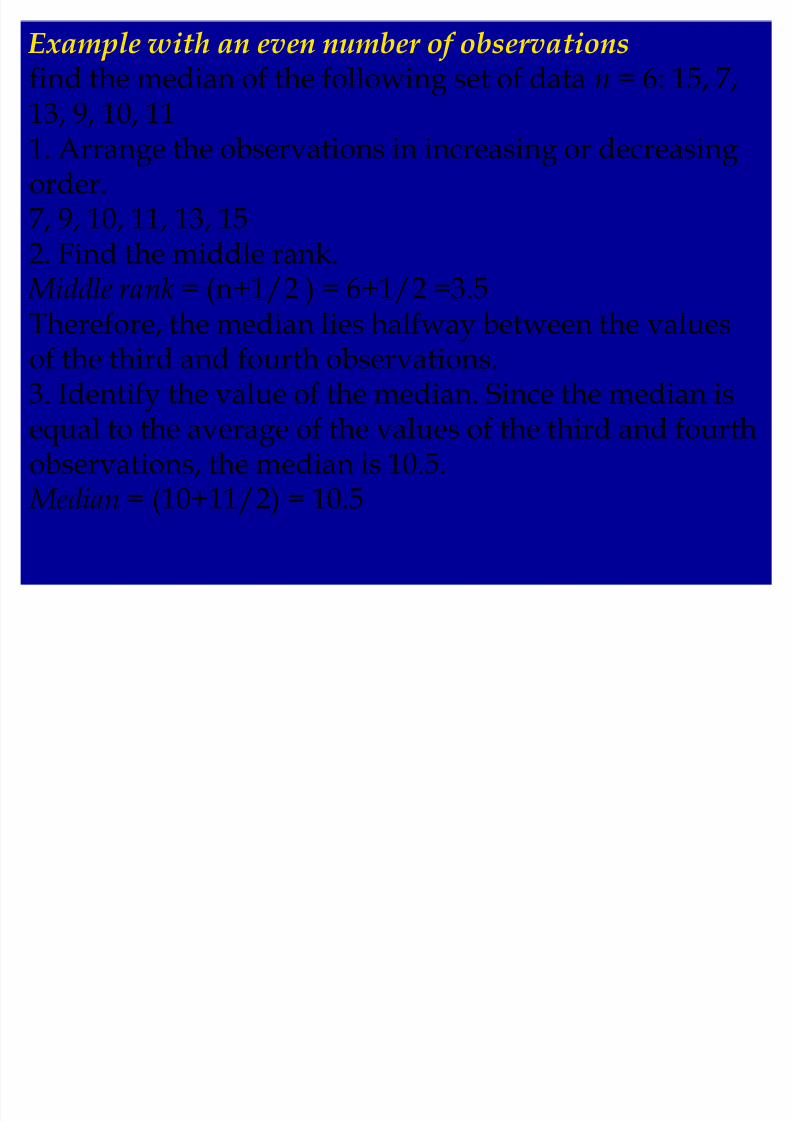
Example with an even number of observationsfind the median of the following set of data n = 6: 15, 7,13, 9, 10, 11
1. Arrange the observations in increasing or decreasingorder.7, 9, 10, 11, 13, 152. Find the middle rank. Middle rank = (n+1/2 ) = 6+1/2 =3.5Therefore, the median lies halfway between the valuesof the third and fourth observations.3. Identify the value of the median. Since the median isequal to the average of the values of the third and fourthobservations, the median is 10.5. Median = (10+11/2) = 10.5

8/6/2019 Chapter 4 Measures of Central Etndency and Dispersion 2008
http://slidepdf.com/reader/full/chapter-4-measures-of-central-etndency-and-dispersion-2008 14/21
Example� find the median of the 5 variables A-E shown below.A: 0, 0, 1, 1, 1, 5, 9, 9, 9, 10, 10
B: 0, 4, 4, 4, 5, 5, 5, 6, 6, 6, 10C: 0, 1, 2, 3, 4, 5, 6, 7, 8, 9, 10D: 0, 1, 1, 2, 2, 2, 3, 3, 3, 4, 10E: 0, 6, 7, 7, 7, 8, 8, 8, 9, 9, 10

8/6/2019 Chapter 4 Measures of Central Etndency and Dispersion 2008
http://slidepdf.com/reader/full/chapter-4-measures-of-central-etndency-and-dispersion-2008 15/21
1. Arrange the observations in increasing order ( alreadydone).2. Find the middle rank: (11 observations + 1)/2 = 12/2
= 63. Identify the value of the median which is the 6thobservation:Median for variables A, B, and C is 5.Median for variable D = 2Median for variable E = 8
8/6/2019 Chapter 4 Measures of Central Etndency and Dispersion 2008
http://slidepdf.com/reader/full/chapter-4-measures-of-central-etndency-and-dispersion-2008 16/21
8/6/2019 Chapter 4 Measures of Central Etndency and Dispersion 2008
http://slidepdf.com/reader/full/chapter-4-measures-of-central-etndency-and-dispersion-2008 17/21
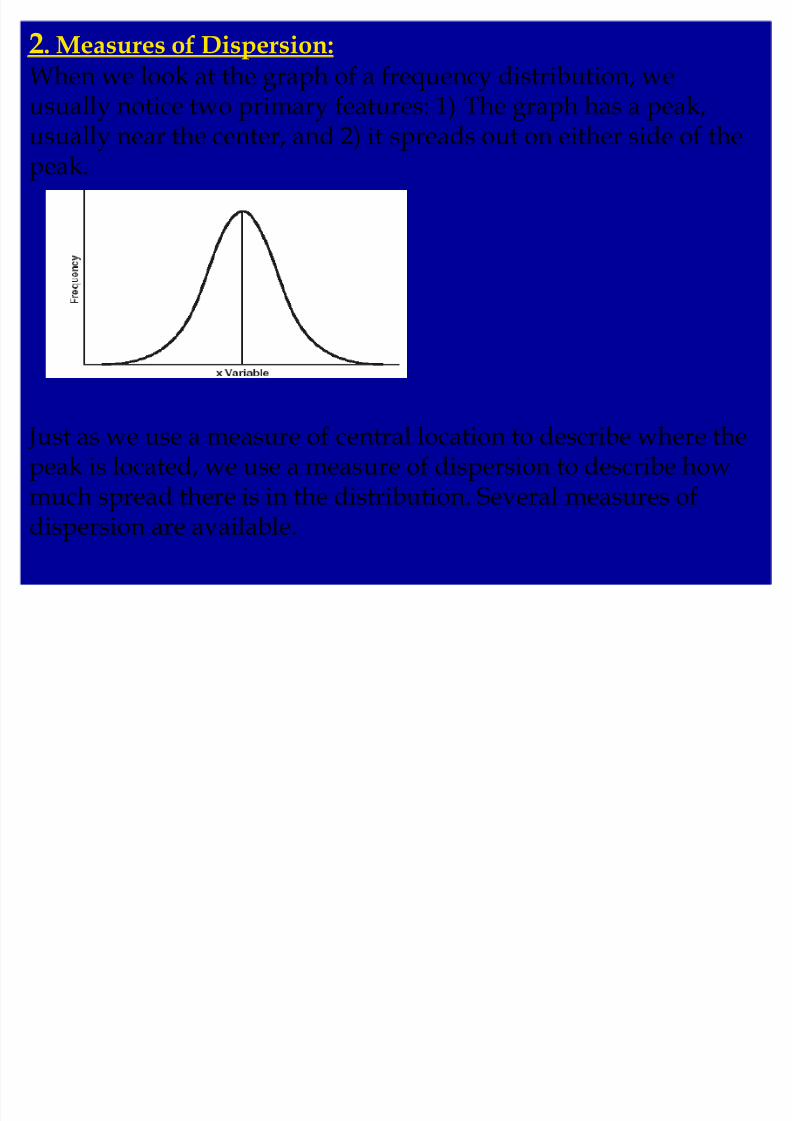
2. Measures of Dispersion:When we look at the graph of a frequency distribution, weusually notice two primary features: 1) The graph has a peak,
usually near the center, and 2) it spreads out on either side of thepeak.
Just as we use a measure of central location to describe where thepeak is located, we use a measure of dispersion to describe howmuch spread there is in the distribution. Several measures ofdispersion are available.
8/6/2019 Chapter 4 Measures of Central Etndency and Dispersion 2008
http://slidepdf.com/reader/full/chapter-4-measures-of-central-etndency-and-dispersion-2008 18/21
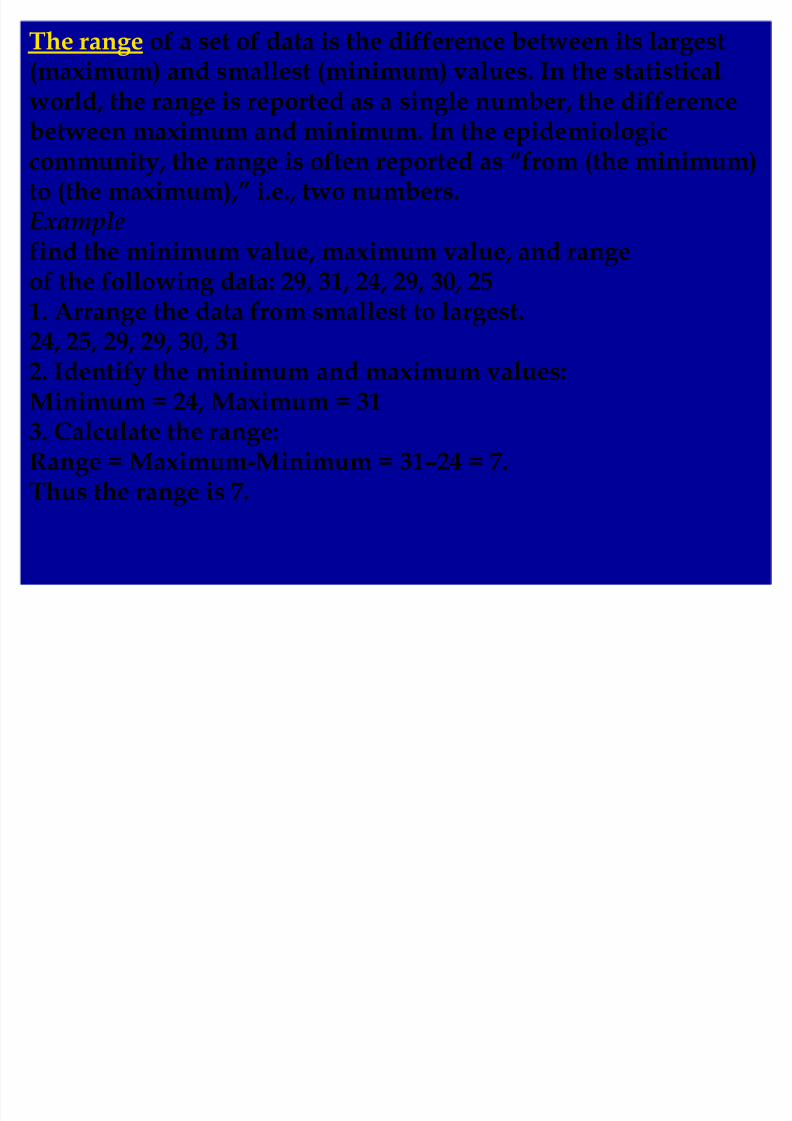
The range of a set of data is the difference between its largest(maximum) and smallest (minimum) values. In the statisticalworld, the range is reported as a single number, the difference
betweenm
axim
um
andm
inim
um
. In the epidem
iologiccommunity, the range is often reported as ´from (the minimum)to (the maximum),µ i.e., two numbers.
Examplefind the minimum value, maximum value, and range
of the following data: 29, 31, 24, 29, 30, 251. Arrange the data from smallest to largest.24, 25, 29, 29, 30, 312. Identify the minimum and maximum values:Minimum = 24, Maximum = 313. Calculate the range:Range = Maximum-Minimum = 31²24 = 7.Thus the range is 7.
8/6/2019 Chapter 4 Measures of Central Etndency and Dispersion 2008
http://slidepdf.com/reader/full/chapter-4-measures-of-central-etndency-and-dispersion-2008 19/21
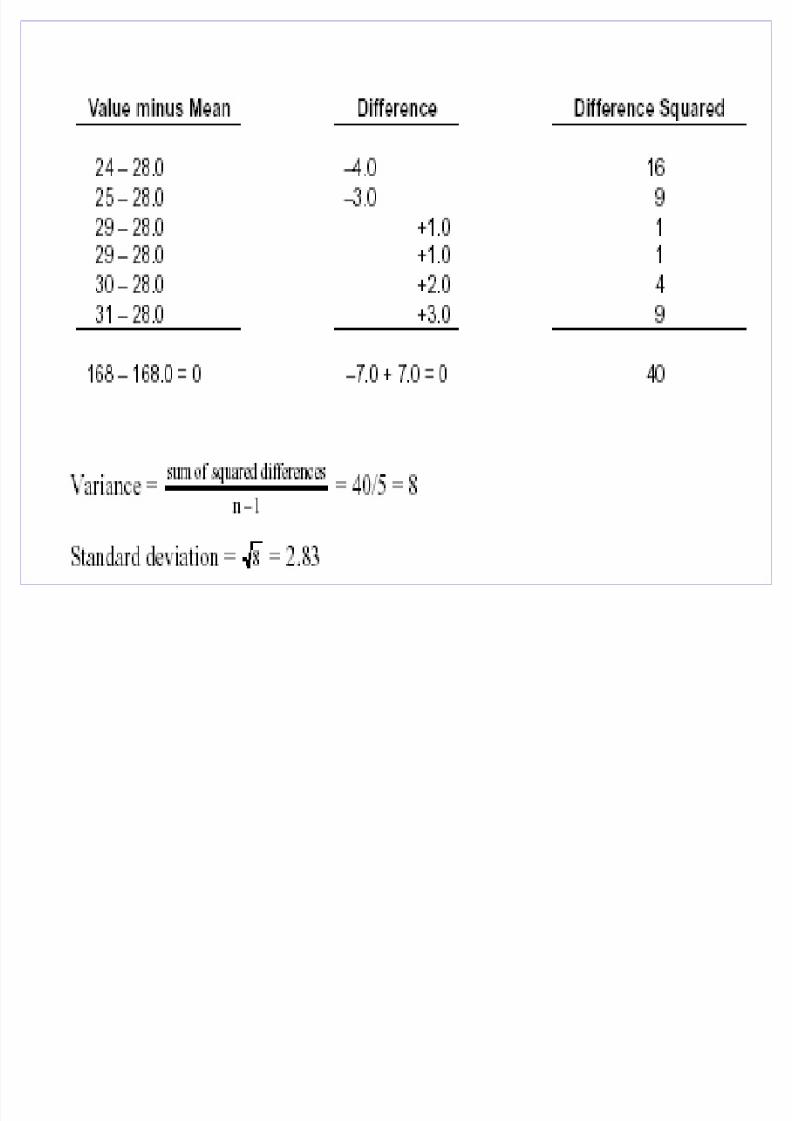
Variance and Standard DeviationWe showed you earlier that if we subtract the mean fromeach observation, the sum of the differences is 0. This
concept of subtracting the mean from each observation isthe basis of two further measures of dispersion, thevariance and standard deviation. For thesemeasures we square each difference to eliminatenegative numbers. We then sum the squareddifferences and divide by n²1 to find an ´averageµsquared difference. This ´averageµ is the variance. Weconvert the variance back into the units we began withby taking its square root. The square root of the varianceis called the standard deviation..
8/6/2019 Chapter 4 Measures of Central Etndency and Dispersion 2008
http://slidepdf.com/reader/full/chapter-4-measures-of-central-etndency-and-dispersion-2008 20/21

8/6/2019 Chapter 4 Measures of Central Etndency and Dispersion 2008
http://slidepdf.com/reader/full/chapter-4-measures-of-central-etndency-and-dispersion-2008 21/21