Embed Size (px)
Citation preview

Meghalaya Human Development Report 2008Meghggggg alayyyyya Human Developmpppp ent Repopppp rt 2008
4.1 Introduction
The role of education enters the discourse on development from several perspectives. Traditionally, lack of education has been discussed as one of the indicators of underdevelopment. Most of the developing countries are reported to have very low levels of literacy when these countries embark upon the path of the development. However, education entered into the formal economic analyses much later. In path breaking papers, Uzawa (1965), Lucas (1988), Barro (1991) and Mankiw et al (1992) have used human capital stock to highlight the differences in growth rates of countries1. But it is the pioneering work of Sen (1985) that brought into focus the role of literacy rate and education to evaluate standard of living of countries (Basu and Foster, 1998).
However, Sen’s (1985) was not an isolated instance of taking literacy as one of the indicators of level of living. By late 1970s, many development economists felt that GNP (and per capita income) as a measure of economic development was too ‘crude’ as it captures only one aspect (of development), income. There are many other aspects of development that need to be taken into account. An indicator of development, it was felt, needs to be such that it captures the improvement in people’s life. Consequently, there has been a purposeful move to search for an alternative indicator of development that included more than what income and its variants capture. Many researchers, e.g, Kolm (1977), Atkinson and Bourguignon (1982), Maasoumi (1989), argued that the construction of a composite index could be a worthwhile exercise.
Morris (1979) developed the concept of the Physical Quality of Life Index (PQLI). He stressed on the importance of education as an important dimension of well-being and suggested that PQLI could have three components; Life expectancy, Infant mortality, and Literacy. Morris’ PQLI as an alternative measure of development, has two major attractions. Its simplicity and focus on output (direct measure of well-being) rather than inputs (indirect measures e.g. per capita input of calories or years of schooling). Among other attempts, Streeten and Jolly (1981) suggested adoption of a Basic-Needs approach. The essential basic needs considered were nutrition, basic education, health, sanitation, water supply and housing and related infrastructure.
These attempts by the individual researchers were encouraged by the United Nations Development Programmes (UNDP). UNDP consolidated the attempts of researchers and introduced the Human Development Index (HDI) in 1990. The main index in the fi rst HDR, HDI, uses adult literacy rate as one of its three components. Human Development denotes both the process of widening people’s choices and the levels of well being achieved (UNDP, 1990). There are three main dimensions of human development, viz., leading a healthy life captured by life expectancy and infant mortality, education and knowledge captured by literacy and a decent standard of living captured by the per capita income.
From the preceding discussion it is apparent that the most fundamental aspect and crucial determinant of human development and economic growth is education. All the other indicators of human development are in some way or the other related to education. Education plays a crucial role in enlarging choices by opening up a world of opportunities for the people, enhancing skills and capabilities, enabling the individuals and households to access information and generate new ideas. At the same time education improves the ability to make better choices by improving the decision
79
_________________________________________________ 1For an excellent summary of the implication of the human capital stock on economic growth, see Ray (1988), Chapter 4.
Chapter 4 Education

Meghalaya Human Development Report 2008Meghgggg alayyyya Human Developmpp ent Repopp rt 2008 Chapter 4
making process of individuals and gives a wider vision. In other words, education empowers people and builds stronger nations. It improves human condition by creating human capital, increasing labour productivity and labour force participation rates, particularly in case of women.
Education especially of women improves health outcomes like life expectancy and mortality rates that indirectly contributes to production. Besides, education leads to personal development, it also raises awareness and leads to greater participation in civic life. The numerous benefi ts of education in improving social as well as economic conditions in terms of reducing poverty, unemployment and inequality, improving health, thereby promoting economic growth and development thus cannot be overlooked. These aspects of education have been extensively investigated in the recent literature on economic development. For example, in a pioneering work Behrman et al (1999) report that there exists a signifi cant and positive relationship between maternal literacy and child schooling that has unique contribution to economic growth. Similarly, Self and Grabowski (2004) fi nd signifi cant and positive relationship between education and economic growth in India, especially that of primary education of females.
There are other links between education and economic development that, too, have been extensively investigated. In two pioneering papers, London and Hadden (1989) and London (1992) have examined the relationship spread of education and fertility decline. Using data from Thailand in London and Hadden (1989) and from a section of over 50 developing countries London (1992) provide a strong support for the hypothesis that spread of education reduced fertility2.
There is in fact a two-way relation between human development and economic growth, one leads to the other (UNDP, 1991). The interrelation between human development and economic growth is a widely discussed issue. According to Gustav Ranis (2004), “to the extent greater freedom and capabilities improve economic performance, human development will have an important effect on growth. Similarly, to the extent that increased incomes will increase range of choices and capabilities enjoyed by households and government, economic growth will enhance human development”. It will therefore not be wrong to say that if achieving human development and growth is the goal, education is the key to it.
In view of the importance of education in promoting human development-led growth, a great deal of importance is being given to promote and improve the quality and standard of education in almost all the developing countries of the world including India. Considering the crucial role that education plays, promoting education has been recommended as one of major social objective of the government. The right to free and compulsory education to all children in the age group 6 to 14 years was set as a fundamental right in the Constitution of India. In addition, several programs at the central and the state levels have been implemented over the years; for example, the National Literacy Mission (NLM) set up in May 1988; Operation Black Board launched in 1987 and the Sarva Siksha Abhiyan (SSA) launched in 2000, that aims at providing useful and relevant elementary education for all children in the age 6-14 years by 2010.
Education is a subject on the ‘Concurrent List’. Every year a considerable share of government budget is allocated for the improvement and expansion of this sector. In Meghalaya, the Tenth Plan projected outlay for the General Education Sector is Rs. 25400 lakh. The expenditure incurred duringthe fi rst four years of the Plan was Rs 22910.46 lakh. The approved outlay during 2006-2007 is Rs.7000 lakh and the entire amount is expected to be utilized in full. The total anticipated expenditure during the Tenth Plan is Rs 29910.46 lakh. The proposed outlay for the Eleventh Five Year Plan 2007-2012 is
80
_________________________________________________2This is a rather limited review of existing literature just to point out that there are multidimensional effect of education on development

Meghalaya Human Development Report 2008Meghggggg alayyyyya Human Developmpppp ent Repopppp rt 2008Chapter 4
Rs.80000 lakh and the proposed outlay for the Annual Plan 2007-2008 is Rs.12000 lakh. Given the importance that education has been accorded in evaluating level of development in countries as well as construction of new indices of development, it is important to investigate the education levels at various levels of disaggregation. This chapter critically examines the achievements in the fi eld of education in Meghalaya.
It is often argued that returns to education at the elementary level are much higher than at the higher levels of education (Self and Grabowski, 2004). Consequently, we have confi ned our analysis mainly to the progress and condition at the elementary education level. In doing so, we look into the various facets of education, most importantly the literacy rate which is considered the fi rst step in knowledge building and hence, human development. Besides we have also taken into consideration the enrolment rates and other infrastructure related issues. However, it should be noted in this context that though our main focus has been on the progress and growth of elementary education in Meghalaya, we have provided information for higher levels of education as well.
The rest of the chapter is organized in the following fashion. Section 4.2 discusses status of literacy and enrolment in Meghalaya. This is followed by a discussion of quality and access to schooling in Meghalaya in section 4.3. Section 4.4 reports the result of the econometric estimate carried out to fi nd the factors affecting current attendance in primary schooling in Meghalaya. Section 4.5 summarizes and concludes the chapter.
4.2 Status of Education in Meghalaya and Changes over the Years
4.2.1 LITERACY RATES
In this section, we have traced the temporal change and spatial variation in literacy in Meghalaya. Literacy has been measured as the proportion of population aged 7 years and above that can read and write (and understand) a simple message (GOI, 2001).3 Recently, Basu and Foster (1998) pointed out a fl aw in the measurement of literacy in this manner. They argue that traditional measure of literacy does not capture the distribution of literacy among households. In this paper we report the level of literacy using both traditional as well as modifi ed literacy rate as suggested by Basu and Foster (1998).
In table 4.1 we have reported the literacy rate in Meghalaya and also for the seven districts separately by the place of residence. Over a period of two decades there has been a considerable increase in the literacy rates in Meghalaya. From 34.08 percent in 1981 the literacy rate in Meghalaya increased to 63.31 percent in 2001 i.e. an increase of about 29 percentage points. Increase in the literacy rate is more in the rural areas than the urban areas. We observe an increase of about 30 percentage points (from 27.45 percent in 1981 to 57 percent in 2001) in the rural areas, against 23 percentage points (from 64.12 percent in 1981 to 87.12 percent in 2001) in the urban areas. However, rural literacy rates remain lower than those of the urban areas.
Table 4.1 also reports literacy rates for all India in the last row for three years, 1981, 1991 and 2001. During all the three years, literacy rate in Meghalaya is marginally, typically around two percentage points, lower than all India. Lower literacy rate in Meghalaya appears to be due to the fact that the literacy rates are lower in Rural Areas of Meghalaya than all India. While urban areas of Meghalaya had consistently higher literacy rate than India, this advantage is outweighed by the larger proportion of rural population in the total literacy rate.
81
_________________________________________________3The age group of the population has not been fi xed though. In India, for example during 1951 and also in a few subsequent Censuses, literacy was measured for the population group 6 years plus.
Meghalaya Human Development Report 2008Meghgggg alayyyya Human Developmpp ent Repopp rt 2008 Chapter 4
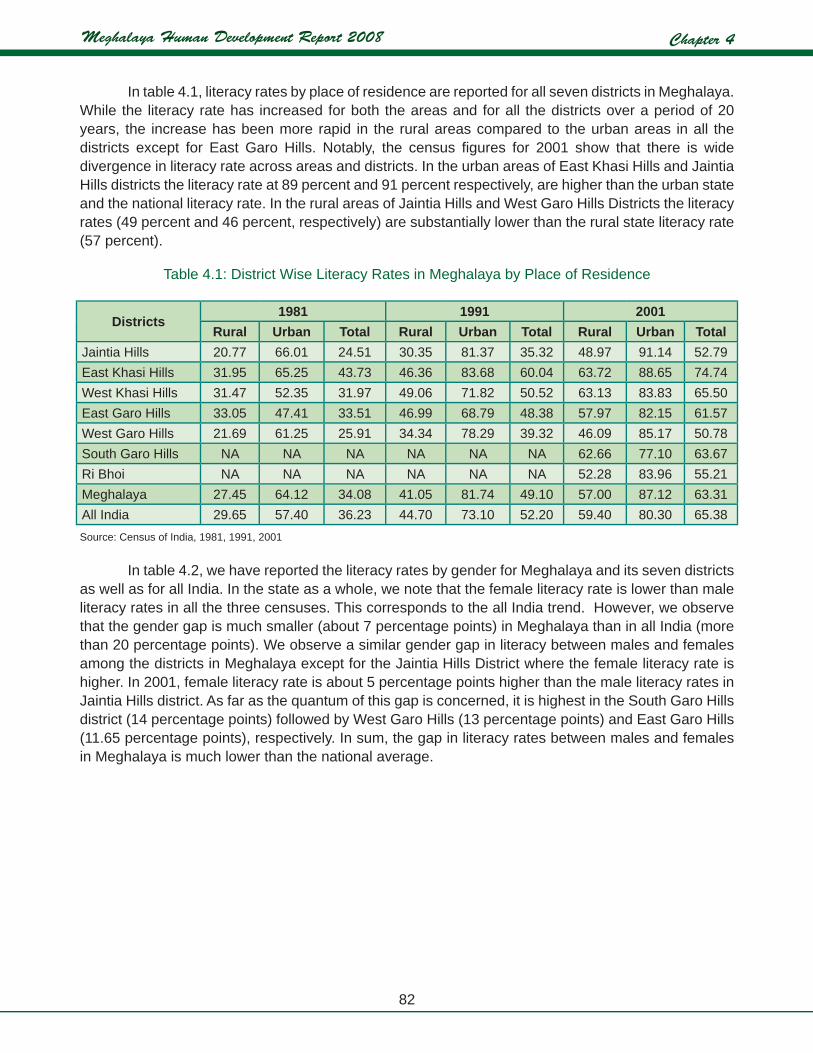
In table 4.1, literacy rates by place of residence are reported for all seven districts in Meghalaya. While the literacy rate has increased for both the areas and for all the districts over a period of 20 years, the increase has been more rapid in the rural areas compared to the urban areas in all the districts except for East Garo Hills. Notably, the census fi gures for 2001 show that there is wide divergence in literacy rate across areas and districts. In the urban areas of East Khasi Hills and Jaintia Hills districts the literacy rate at 89 percent and 91 percent respectively, are higher than the urban state and the national literacy rate. In the rural areas of Jaintia Hills and West Garo Hills Districts the literacy rates (49 percent and 46 percent, respectively) are substantially lower than the rural state literacy rate (57 percent).
Table 4.1: District Wise Literacy Rates in Meghalaya by Place of Residence
Districts1981 1991 2001
Rural Urban Total Rural Urban Total Rural Urban TotalJaintia Hills 20.77 66.01 24.51 30.35 81.37 35.32 48.97 91.14 52.79East Khasi Hills 31.95 65.25 43.73 46.36 83.68 60.04 63.72 88.65 74.74West Khasi Hills 31.47 52.35 31.97 49.06 71.82 50.52 63.13 83.83 65.50East Garo Hills 33.05 47.41 33.51 46.99 68.79 48.38 57.97 82.15 61.57West Garo Hills 21.69 61.25 25.91 34.34 78.29 39.32 46.09 85.17 50.78South Garo Hills NA NA NA NA NA NA 62.66 77.10 63.67Ri Bhoi NA NA NA NA NA NA 52.28 83.96 55.21Meghalaya 27.45 64.12 34.08 41.05 81.74 49.10 57.00 87.12 63.31All India 29.65 57.40 36.23 44.70 73.10 52.20 59.40 80.30 65.38Source: Census of India, 1981, 1991, 2001
In table 4.2, we have reported the literacy rates by gender for Meghalaya and its seven districts as well as for all India. In the state as a whole, we note that the female literacy rate is lower than male literacy rates in all the three censuses. This corresponds to the all India trend. However, we observe that the gender gap is much smaller (about 7 percentage points) in Meghalaya than in all India (more than 20 percentage points). We observe a similar gender gap in literacy between males and females among the districts in Meghalaya except for the Jaintia Hills District where the female literacy rate is higher. In 2001, female literacy rate is about 5 percentage points higher than the male literacy rates in Jaintia Hills district. As far as the quantum of this gap is concerned, it is highest in the South Garo Hills district (14 percentage points) followed by West Garo Hills (13 percentage points) and East Garo Hills (11.65 percentage points), respectively. In sum, the gap in literacy rates between males and females in Meghalaya is much lower than the national average.
82

Meghalaya Human Development Report 2008Meghggggg alayyyyya Human Developmpppp ent Repopppp rt 2008Chapter 4
Table 4.2: District Wise Literacy Rates in Meghalaya by Sex
Districts 1981 1991 2001
Male Female Per-sons Male Female Per-
sons Male Female Persons
Jaintia Hills 24.63 24.38 24.51 34.37 36.31 35.32 50.52 55.54 53.00East Khasi Hills 46.96 40.30 43.73 62.86 57.04 60.04 78.12 75.82 76.98West Khasi Hills 34.08 29.75 31.97 52.98 47.94 50.52 67.02 64.21 65.64East Garo Hills 39.01 27.66 33.51 54.70 41.70 48.38 67.39 55.74 61.70West Garo Hills 32.04 19.55 25.91 46.93 31.32 39.32 57.51 44.51 51.03South Garo Hills NA NA NA NA NA NA 62.60 48.61 55.82
Ri Bhoi NA NA NA NA NA NA 69.22 62.67 66.07Meghalaya 37.89 30.08 34.08 53.12 44.88 49.10 66.14 60.41 63.31
All India 46.89 24.82 36.23 64.13 39.29 52.21 75.85 54.16 65.38Source: Census of India, 1981, 1991 and 2001.
Figure 4.1: District Wise Gender Gap in Literacy Rate in Meghalaya
-10.00
-5.00
0.00
5.00
10.00
15.00
20.00
Jain
tia H
ills
East
Khas
i Hill
s
Wes
t Kha
si Hi
lls
East
Garo
Hill
s
Wes
t Gar
o Hill
s
Sout
h Gar
o Hill
s
Ribh
oi
Districts
Gen
der G
ap (P
erce
ntag
e Poi
nts)
198119912001
Source: Census of India, 1981, 1991 & 2001
In fi gure 4.1, we have plotted the gender gap in literacy rate for all the seven districts of Meghalaya for the years 1981, 1991 and 2001. As discussed above, except in Jaintia Hills district in all the three years, there is disparity in the literacy rates of the male and females. Interestingly, this disparity in the literacy rate was higher for almost all the districts in 1991 compared to 1981. However; there is a clear reduction in the same in 2001.
Table 4.3 shows literacy rate fi gures for all the states of the NE region. Meghalaya ranks second from the bottom after Arunachal Pradesh as per 2001 Census, though the literacy rate has increased considerably over the years. However, the situation in the rural areas of the state appears to be worse compared to the other states in the northeastern region. In 1981 about 28 percent of the rural population of Meghalaya was literate. This is the second lowest literacy rate in the region after
83

Meghalaya Human Development Report 2008Meghgggg alayyyya Human Developmpp ent Repopp rt 2008 Chapter 4
Arunachal Pradesh (19 percent). Rural Meghalaya continued to be second ranked from bottom in 1991 as well as in 2001. The urban areas of the state have done relatively better than the rural areas within the state though in terms of ranking, Meghalaya ranks fourth among the seven states in the region.
Table 4.3: Literacy Rates in Northeastern States
State 1981 1991 2001Rural Urban Total Rural Urban Total Rural Urban Total
Arunachal Pradesh 18.51 53.22 20.79 37.02 71.59 41.59 49.22 79.85 56.70
Assam NA NA NA 49.32 79.39 52.89 59.73 85.34 64.28Manipur 37.37 52.44 41.35 55.79 70.53 59.89 65.57 81.27 69.28Meghalaya 27.45 64.12 34.08 41.05 81.74 49.10 57.00 87.12 63.31Mizoram 55.24 74.06 59.88 72.47 93.45 82.27 76.62 95.26 83.28Nagaland 38.59 64.23 42.57 57.23 83.10 61.65 61.42 88.24 65.10Tripura 38.23 73.66 42.12 56.08 83.09 60.44 67.39 89.29 71.02
Source: Census of India, 1981, 1991, 2001.
Figure 4.2: Literacy Rates in NE States (2001 Census)
Source: Census of India, 2001
Education of the adults in a household is expected to have a considerable infl uence on the education as well choices and access to information of other members of the household as a whole. Using this line of argument, Basu and Foster (1998) point out a specifi c defi ciency in the conventional measure of literacy rates that we have discussed above, namely, that it fails to capture distribution of literate persons across households. They argue that the proximity to at least one literate member in the household is likely to have a positive externality on every members of the household including an illiterate member in terms of accessing information and accomplishing tasks that require literacy skills (see also Subramanian, 2004). Consequently, a more even distribution of literacy in terms of presence of a literate adult in the household is desirable.
Following Basu and Foster (1998) and Subramanian (2004), we report the proportion of households with at least one literate member in 1993-94 and 2004-05 in table 4.4. We observe that in Meghalaya,
84

Meghalaya Human Development Report 2008Meghggggg alayyyyya Human Developmpppp ent Repopppp rt 2008Chapter 4
75 percent of the households in 1993-94 and 93 percent of the households in 2004-05 had at least one literate member in the household. The All India fi gures were 66 percent and 78 percent, respectively. Thus, in the sense of Basu and Foster (1998) measure of literacy, Meghalaya appears to be better off compared to all India. This is exactly opposite of the picture that we observed with the conventional measure of literacy.
Table 4.4: Proportion of Households having One Adult Literate Member
( in %)Areas Meghalaya All India
1993-94 2004-05 1993-94 2004-05Rural 71.69 91.61 59.38 73.27Urban 94.22 98.95 83.13 90.90Total 75.09 92.69 65.72 78.12
Source: Special tabulation by the authors of the background paper using NSS 50th & 61st round Employment and Unemployment Data.
A break-up of proximate literacy measure by place of residence suggests that in rural Meghalaya there were about 12 percent more households (71.69 percent) than all India (58.38 percent) who have at least one adult literate member in 1993-94. We also observe an increase in the proximate literacy rates for both rural Meghalaya and India in 2004-05. But the gap between the two has widened with Meghalaya having nearly 15 percentage points higher proportion of households with proximate literacy than all India in 2004-05. We observe a similar picture in urban areas where Meghalaya has over 94 percent proximate literacy rate compared to over 83 percent at all India level in 1993-94. There is a marginal improvement in these numbers in 2004-05. These fi ndings suggest that though Meghalaya has lower literacy rates, but literates are more evenly distributed across households in both rural and urban areas than all India.
4.2.2 SCHOOL ATTENDANCE AT VARIOUS AGES4
While the data source for literacy, especially at the disaggregated levels is generally the decennial census, the major shortcoming of this data is that is not available for various age groups of population. Moreover the census data also does not provide details of the current status of each person. This shortcoming in the Census data is somewhat corrected in the large sample surveys conducted by the NSSO. In this and also in the next section, we use household level data on employment and unemployment to investigate the school participation as well as enrolment of children and youth in different age-groups in Meghalaya and compare it with all India.
The NSSO collects information on the principal status of the person. This information is based on what a person has generally been doing during preceding one year at the time of survey. Based on this information it is possible to fi nd out the proportion of population whose main engagement was attending educational institutions one year prior to the date of survey. In tables 4.5 and 4.6 we report the proportion of children and youth attending educational institutions in Meghalaya as well as All India for the years 1993-94 and 2004-05.
_________________________________________________4Sections 4.2.2, 4.2.3 and 4.2.4 are based on the analysis of Employment and Unemployment data collected by the NSSO during 1993-94 and 2004-05. The
tables discussed in these sections for smaller states like Meghalaya are indicative only.
85

Meghalaya Human Development Report 2008Meghgggg alayyyya Human Developmpp ent Repopp rt 2008 Chapter 4
Table 4.5: Proportion of Children Attending Educational Institutions by Areas and Sex in 1993-94
Age Group (in years)
Rural UrbanBoys Girls All Boys Girls All
Meghalaya7-11 81.29 83.82 82.52 98.52 100.00 99.16
12-14 82.10 85.11 83.46 100.00 95.00 97.1315-18 31.83 27.31 29.67 66.04 63.50 64.8219-25 5.30 4.45 4.83 46.97 29.07 35.74
All 42.41 37.09 39.70 78.63 66.98 72.53All India
7-11 78.36 62.88 71.15 89.61 85.76 87.7812-14 74.38 51.13 63.76 85.54 78.37 82.1815-18 43.03 21.56 33.43 59.43 51.99 56.0319-25 9.68 2.27 5.90 21.46 12.92 17.39
All 49.66 32.28 41.42 59.33 52.36 56.05 Source: As in Table 4.4.
Evidently, in both the years under consideration Meghalaya presents a better picture than the country as a whole. For example, in 1993-94, in Meghalaya 100 percent of urban girls in the age of 7-14 years were mainly attending educational institutions as against 86 percent for all India. Similarly, in the rural areas 85 percent of the girls in the age of 12-14 years were attending school in 1993-94 as against the countrywide fi gure of 51 percent.
It is interesting to note that in Meghalaya the proportion of children aged 14 years or less attending educational institution is higher for girls than for boys in both the areas. The opposite is true in case of All India. However, even if the school attendance fi gures in Meghalaya are higher than that of the country as a whole up to the age of 14 years, it is lower for boys aged 15 years and above in the rural areas. Absence of educational institutions in the vicinity could possibly be one of the reasons for lower attendance at this stage.
We observe a similar kind of situation in 2004-05 as well, except for the fact that in 2004-05 there is an increase in the proportion of boys and girls attending school in both the areas and all age groups under consideration (table 4.6).
86
Meghalaya Human Development Report 2008Meghggggg alayyyyya Human Developmpppp ent Repopppp rt 2008Chapter 4
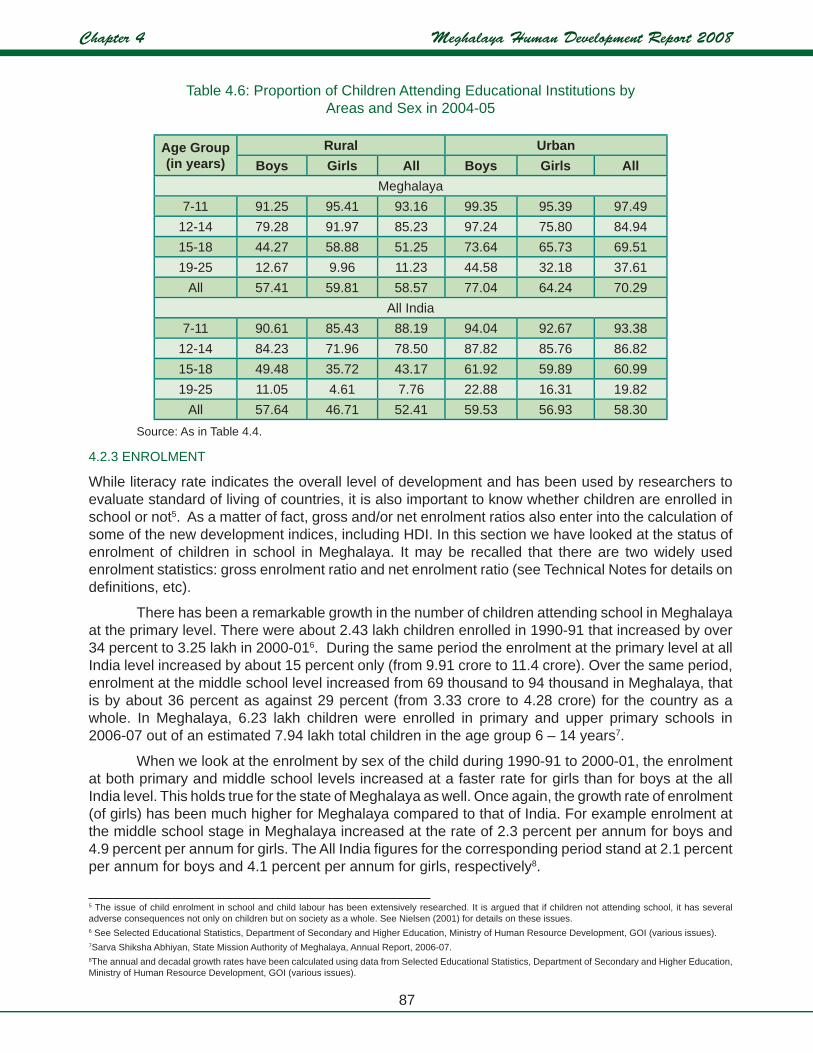
Table 4.6: Proportion of Children Attending Educational Institutions by Areas and Sex in 2004-05
Age Group (in years)
Rural UrbanBoys Girls All Boys Girls All
Meghalaya7-11 91.25 95.41 93.16 99.35 95.39 97.49
12-14 79.28 91.97 85.23 97.24 75.80 84.9415-18 44.27 58.88 51.25 73.64 65.73 69.5119-25 12.67 9.96 11.23 44.58 32.18 37.61
All 57.41 59.81 58.57 77.04 64.24 70.29All India
7-11 90.61 85.43 88.19 94.04 92.67 93.3812-14 84.23 71.96 78.50 87.82 85.76 86.8215-18 49.48 35.72 43.17 61.92 59.89 60.9919-25 11.05 4.61 7.76 22.88 16.31 19.82
All 57.64 46.71 52.41 59.53 56.93 58.30 Source: As in Table 4.4.
4.2.3 ENROLMENT
While literacy rate indicates the overall level of development and has been used by researchers to evaluate standard of living of countries, it is also important to know whether children are enrolled in school or not5. As a matter of fact, gross and/or net enrolment ratios also enter into the calculation of some of the new development indices, including HDI. In this section we have looked at the status of enrolment of children in school in Meghalaya. It may be recalled that there are two widely used enrolment statistics: gross enrolment ratio and net enrolment ratio (see Technical Notes for details on defi nitions, etc).
There has been a remarkable growth in the number of children attending school in Meghalaya at the primary level. There were about 2.43 lakh children enrolled in 1990-91 that increased by over 34 percent to 3.25 lakh in 2000-016. During the same period the enrolment at the primary level at all India level increased by about 15 percent only (from 9.91 crore to 11.4 crore). Over the same period, enrolment at the middle school level increased from 69 thousand to 94 thousand in Meghalaya, that is by about 36 percent as against 29 percent (from 3.33 crore to 4.28 crore) for the country as a whole. In Meghalaya, 6.23 lakh children were enrolled in primary and upper primary schools in 2006-07 out of an estimated 7.94 lakh total children in the age group 6 – 14 years7.
When we look at the enrolment by sex of the child during 1990-91 to 2000-01, the enrolment at both primary and middle school levels increased at a faster rate for girls than for boys at the all India level. This holds true for the state of Meghalaya as well. Once again, the growth rate of enrolment (of girls) has been much higher for Meghalaya compared to that of India. For example enrolment at the middle school stage in Meghalaya increased at the rate of 2.3 percent per annum for boys and 4.9 percent per annum for girls. The All India fi gures for the corresponding period stand at 2.1 percent per annum for boys and 4.1 percent per annum for girls, respectively8.
__________________________________________5 The issue of child enrolment in school and child labour has been extensively researched. It is argued that if children not attending school, it has several adverse consequences not only on children but on society as a whole. See Nielsen (2001) for details on these issues. 6 See Selected Educational Statistics, Department of Secondary and Higher Education, Ministry of Human Resource Development, GOI (various issues).7Sarva Shiksha Abhiyan, State Mission Authority of Meghalaya, Annual Report, 2006-07. 8The annual and decadal growth rates have been calculated using data from Selected Educational Statistics, Department of Secondary and Higher Education, Ministry of Human Resource Development, GOI (various issues).
87

Meghalaya Human Development Report 2008Meghgggg alayyyya Human Developmpp ent Repopp rt 2008 Chapter 4
Table 4.7: Gross Enrolment Ratio by Place of Residence and Sex (1993-94)
(in %)
StandardRural Urban
Boys Girls All Boys Girls AllMeghalaya
Primary 70.79 75.26 72.96 84.63 88.29 86.22Middle 115.47 122.74 118.74 157.35 126.54 139.68
Secondary/Higher Secondary 26.43 26.37 26.40 84.97 91.04 87.87Graduate and Above 5.96 1.75 3.59 40.38 22.08 28.90
All IndiaPrimary 78.96 64.29 72.12 86.60 78.86 82.92Middle 75.93 52.81 65.36 89.74 87.15 88.53
Secondary/Higher Secondary 43.62 24.47 35.06 61.69 56.34 59.25Graduate and Above 10.54 3.23 6.81 27.95 18.82 23.60
Source: As in Table 4.4.
Table 4.8: Gross Enrolment Ratio by Place of Residence and Sex (2004-05)
(in %)
StandardRural Urban
Boys Girls All Boys Girls AllMeghalaya
Primary 117.22 118.12 117.63 105.97 96.62 101.58Middle 51.96 66.69 58.87 110.17 72.42 88.52
Secondary/Higher Secondary 44.29 48.46 46.28 91.47 93.76 92.66Graduate and Above 1.29 3.32 2.36 16.91 12.67 14.53
All IndiaPrimary 112.05 106.86 109.63 105.92 100.10 103.09Middle 80.96 69.44 75.57 85.35 82.71 84.07
Secondary/Higher Secondary 57.30 41.52 50.05 72.19 72.54 72.35Graduate and Above 7.73 4.49 6.08 18.42 15.99 17.29
Source: As in Table 4.4.
Turning to the gross enrolment and net enrolment in the state at the elementary level (table 4.7 to table 4.10), we observe that in the rural areas gross enrolment has increased considerably at the primary stage between 1993-94 and 2004-05.
Most surprising result that we see from these tables (tables 4.7 and 4.8) is that over the same period (i.e. between 1993-94 and 2004-05) there is a large decline in the gross enrolment at the middle school level especially in the rural areas. The division of enrolment into boys and girls reveals that the decline is more for the boys than for the girls. A comparison of Meghalaya’s enrolment ratios with national fi gures suggests that Meghalaya had lower enrolment ratios. But it is enrolment of rural youth at middle and higher levels of education where Meghalaya appears to be lagging behind the rest of the country. Absence or lack of access to educational institutions in the rural areas can possibly be one of the reasons behind low enrolment rates at higher levels in the rural areas.
88

Meghalaya Human Development Report 2008Meghggggg alayyyyya Human Developmpppp ent Repopppp rt 2008Chapter 4
Another way of looking at school enrolment is age-specifi c enrolment, called net enrolment, in primary and secondary levels. Net Enrolment Ratio gives the real picture about the number of children of appropriate age group actually registered at various levels of schooling. Tables 4.9 and 4.10 report net enrolment ratios for Meghalaya and all India for two years 1993-94 and 2004-05, by sex and place of residence.
Table 4.9: Net Enrolment Ratio by Place of Residence and Sex (1993-94)
(in %)
StandardRural Urban
Boys Girls All Boys Girls AllMeghalaya
Primary 51.50 53.79 52.61 58.88 56.76 57.96Middle 60.39 60.90 60.62 57.80 73.85 67.00Secondary/Higher Secondary 19.20 16.53 17.92 51.19 57.88 54.39Graduate and Above 2.55 0.85 1.60 26.19 15.79 19.66
All IndiaPrimary 52.84 43.17 48.33 56.81 53.67 55.32Middle 40.51 27.22 34.44 49.22 45.67 47.55Secondary/Higher Secondary 27.82 14.37 21.81 38.51 34.65 36.75Graduate and Above 5.98 1.50 3.70 17.32 10.76 14.19
Source: As in Table 4.4
Table 4.10: Net Enrolment Ratio by Place of Residence and Sex (2004-05)
(in %)
StandardRural Urban
Boys Girls All Boys Girls AllMeghalaya
Primary 77.07 68.78 73.27 68.92 60.90 65.15Middle 31.54 36.71 33.96 42.84 28.37 34.54Secondary/Higher Secondary 28.57 31.90 30.16 49.78 55.38 52.70Graduate and Above 1.21 1.31 1.26 10.26 10.69 10.50All IndiaPrimary 74.85 70.69 72.91 70.47 68.12 69.33Middle 46.98 39.90 43.67 47.36 44.58 46.01Secondary/Higher Secondary 35.98 24.75 30.82 45.44 42.95 44.31Graduate and Above 5.78 2.81 4.26 13.49 10.40 12.04
Source: As in Table 4.4.
While the gross enrolment ratios discussed above were very high at the elementary level (more than 100 percent in some cases), the net enrolment is relatively low. In 1993-94 just about 50-60 percent of the children of age 7-11 years were enrolled at the elementary level. In 2004-05, at the primary stage we observe an increase in the net enrolment in both areas over the 1993-94 fi gures. An intriguing result is the fall in the net enrolment ratios in the urban areas except at the primary level. The rural areas also exhibited a decline in enrolment in the middle and graduate levels.
89
Meghalaya Human Development Report 2008Meghgggg alayyyya Human Developmpp ent Repopp rt 2008 Chapter 4
The combined enrolment ratios of Meghalaya indicate that the state is at a low level of achievement in this respect. A combined GER of 74.18 percent in 2004-05 as per NSSO estimates (see Table A.3 or Figure 4.4) is lower than the all India average of 76.84 percent. The state ranks fi fth from the bottom in enrolment among the 35 states and Union Territories in the country. Meghalaya is ahead of only Bihar (66.87 percent), Orissa (70.60 percent), Jharkhand (71.09 percent) and Madhya Pradesh (74.08 percent) in the combined gross enrolment of Classes I – XII in 2004-05.
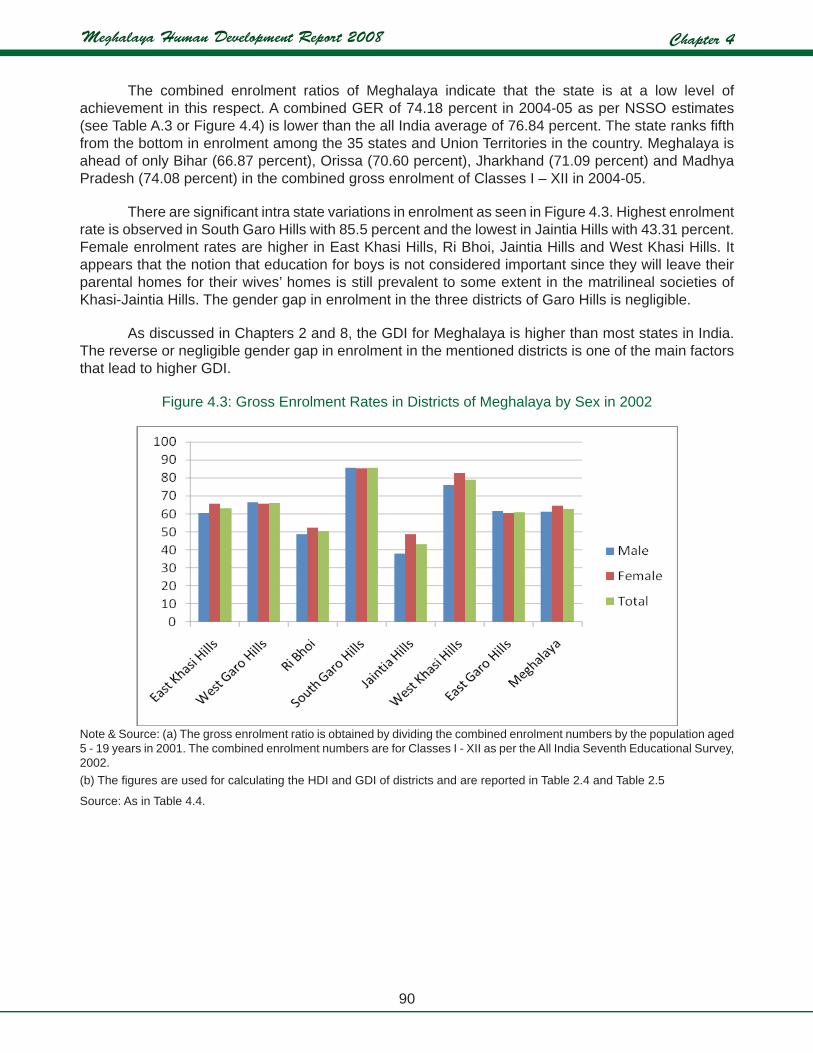
There are signifi cant intra state variations in enrolment as seen in Figure 4.3. Highest enrolment rate is observed in South Garo Hills with 85.5 percent and the lowest in Jaintia Hills with 43.31 percent. Female enrolment rates are higher in East Khasi Hills, Ri Bhoi, Jaintia Hills and West Khasi Hills. It appears that the notion that education for boys is not considered important since they will leave their parental homes for their wives’ homes is still prevalent to some extent in the matrilineal societies of Khasi-Jaintia Hills. The gender gap in enrolment in the three districts of Garo Hills is negligible.
As discussed in Chapters 2 and 8, the GDI for Meghalaya is higher than most states in India. The reverse or negligible gender gap in enrolment in the mentioned districts is one of the main factors that lead to higher GDI.
Figure 4.3: Gross Enrolment Rates in Districts of Meghalaya by Sex in 2002
Note & Source: (a) The gross enrolment ratio is obtained by dividing the combined enrolment numbers by the population aged 5 - 19 years in 2001. The combined enrolment numbers are for Classes I - XII as per the All India Seventh Educational Survey, 2002.(b) The fi gures are used for calculating the HDI and GDI of districts and are reported in Table 2.4 and Table 2.5
Source: As in Table 4.4.
90

Meghalaya Human Development Report 2008Meghggggg alayyyyya Human Developmpppp ent Repopppp rt 2008Chapter 4
Figure 4.4: Combined Gross Enrolment Ratios of the States/UTs in 2004-05
Note: Gross Enrolment in Classes I–XII in the age group of 6 - 18 years is taken into consideration.
Source: National Sample Survey on Employment and Unemployment, 61st round.
4.2.4 OUT OF SCHOOL CHILDREN AND YOUTH
In the last section the discussion of the net enrolment ratio suggests that there are signifi cant proportions of children who are not enrolled in any educational institution. It is important to investigate whether these children join school at a later stage or remain out of school. From the NSSO data, we can carry out this analysis. In table 4.11 we report the proportion of population not attending any educational institutions for the year 2004-05 by age groups.
We have taken into consideration population in the age group 7-25 years. The population in
91

Meghalaya Human Development Report 2008Meghgggg alayyyya Human Developmpp ent Repopp rt 2008 Chapter 4
this age group is then divided it into four groups taking into account the level of education at which the person is expected to be in, viz., 7-11 years (primary school), 12-14 years (middle school), 15-18 years (secondary and higher secondary) and 19-25 years (graduation and above).
From table 4.11 we observe that in Meghalaya a large proportion of population in all age groups is not attending any educational institutions. The proportion of population not engaged in any academic endeavor is higher in the age group 15–25 years which is expected. For example, in the rural areas in 2004-05 about 86 percent of the men in the age of 19-25 years were not currently enrolled in any educational institutions. Similarly, about 87 percent of the rural women in the age group 19-25 years were not enrolled in any educational institutions. Lack of diverse and adequate educational opportunities in the state could be one possible explanation.
Table 4.11: Proportion of Population not attending Educational Institutions by Areas and Sex (2004-05)
(in %)
Age Group (in years)Rural Urban
Boys Girls All Boys Girls AllMeghalaya
7-11 9.31 4.86 7.27 0.81 4.61 2.5912-14 20.61 8.03 14.71 1.84 22.94 13.9415-18 55.54 39.58 47.91 26.36 32.42 29.5219-25 85.86 87.00 86.46 52.35 66.31 60.19
All India7-11 9.24 14.30 11.60 6.00 7.24 6.60
12-14 15.69 28.05 21.47 12.71 14.26 13.4615-18 50.00 63.35 56.13 38.76 40.44 39.5319-25 87.71 93.99 90.91 76.37 82.55 79.26
Source: As in Table 4.4.
The situation in the urban areas appears to be slightly better than that in the rural areas. Seemingly, so far as the current attendance in school is concerned the situation in Meghalaya is better than at the all India level. Except for boys in the age of 15-18 years in the rural areas the proportion of both boys and girls not attending any educational institutions in all other the age groups for both the areas is lower in Meghalaya than the all India fi gures for the same.
4.2.5 EDUCATION FOR ALL: A NOTE ON SARVA SHIKSHA ABHIYAN (SSA)9
SSA is a fl agship programme of the Government of India to achieve the goals of Universalization of Elementary Education (UEE). The programme aims to provide useful and relevant elementary education for all children in the age group 6 – 14 by 2010. It also aims to get the active participation of the community in the management of schools. It aims to bridge all gender and social category gaps at primary stage by 2007 and at Elementary Education level by 2010. It focuses on elementary education of satisfactory quality with emphasis on education for life.
To implement the SSA in Meghalaya, a State Mission Authority registered as a Society under the chairmanship of the Chief Minister has been set up. The activities of the Mission are being implemented by an Executive Committee under the chairmanship of the Chief Secretary. To liaise
_________________________________________________9Source: Directorate of Elementary and Mass Education, Shillong.
92

Meghalaya Human Development Report 2008Meghggggg alayyyyya Human Developmpppp ent Repopppp rt 2008Chapter 4
between the Central Government and the District /Block Level Offi ce, a State Mission Director who is the Commissioner & Secretary, Education Department and State Project Director who is Secretary Education have been appointed who are assisted by manpower already available in the Department with additional assistance of Consultants and Coordinators appointed on contract basis for various interventions under the scheme.
The District/ Block/ Village units have also been constituted for effective implementation of the scheme. The District Unit functions under the chairmanship of the concerned Deputy Commissioner and District Mission Coordinators are in place in all the 7 districts of the State. At the sub-district level, 39 Block Resource Centres (BRC) and 295 Cluster Resource Centres (CRC) have been set up. At the village level, Village Education Committees have been set up.
Physical Achievements: Upto March 2007, 837 Lower Primary (LP) schools have been provided grant-in-aid for teachers’ salary @ Rs.3000/- per month per school for 2 teachers. 723 LP schools have been upgraded to Upper primary (UP) schools by extending teachers’ salary @ Rs. 6000/- per month per school. 837 LP schools have been provided a one time grant of Rs.10,000/- per school for teaching and learning equipments. 723 UP schools have been provided a one-time grant of Rs.50,000/- per school for teaching and learning equipments. The ratio of UP to LP schools has improved from 1:4.3 to 1:3.3.
Text books have been given to 400030 LP school children and 160540 to UP school children. 6579 children with special needs have been assessed in 22 Blocks out of whom 3477 are in schools. Assessment camps in the remaining 17 Blocks are being taken up.
All existing LP and UP schools in the state have been given school grants of Rs. 2000/- per school. All existing LP and UP school teachers have been provided Rs. 500/- per annum for purchase of materials required for making low cost teaching aids. 8675 existing teachers have been given in service training. 1964 EGS Centres have been opened. 1245 LP and UP school teachers have been deputed to undergo the CPE Course being conducted by IGNOU for the session July 2005. All BRCs are also being geared up to function as Study Centres for the CPE Course being conducted by IGNOU for training of teachers.
There are a number of problems. During 2006-07, 109636 children were estimated to be out of school. As per DERT study, 15.47 percent of the children dropout at UP level and 30.24 percent drop out at LP stage. 40.59 percent of the LP teachers and 58.51 percent of the UP teachers are untrained. There are 765 Single Teacher Schools. The teacher pupil ratio at the LP level is 1:32 and at the UP level 1:23.
The SSA Mission aims to address these issues through the following strategies:• Set up schools in viable areas• Set up alternative schooling facilities in unviable villages• Strengthen existing facilities• Impart quality training to untrained teachers• Ensure appointment of pre-service trained teachers• Improve infrastructure• Provide teaching learning equipments• Provide incentive schemes• Setting up of State Resource Centre, District Resource Centre, Block and Cluster Resource
Centres• Formation of Village Education Committees
93

Meghalaya Human Development Report 2008Meghgggg alayyyya Human Developmpp ent Repopp rt 2008 Chapter 4
• Completion of Household Survey• Mass mobilization and awareness campaign• Training programmes at all levels.
4.3 Infrastructure Related Issues
In the last two sections we discussed literacy rates and school attendance and enrolment of children in Meghalaya and changes therein over time. The attendance and enrolment in school depends on several factors that include school availability and infrastructural facilities that schools and colleges have. In this section we look at the status of schools and related infrastructure in Meghalaya.
4.3.1 NUMBER OF SCHOOLS AND HIGHER EDUCATIONAL INSTITUTIONS
There has been a steady increase in the number of schools and higher educational institutions in Meghalaya over the years. The number of schools (primary to higher secondary level) increased from 5161 in 1987-88 to 7522 in 2004-0510. Similarly there are 45 Degree Colleges and one university in the state of Meghalaya, viz., The North Eastern Hill University. However, there is a lack of technical and vocational education in the state. There is just one Polytechnic College and three Technical and Industrial Schools in Meghalaya.
Furthermore, the distribution of schools in the different categories as well as the colleges is very uneven among the districts as can be seen from table 4.12. Two districts, namely, East Khasi Hills and West Garo Hills districts account for more than 41.26 percent of Primary Schools, 45.89 percent of the Upper Primary Schools, 52.83 percent of the Secondary Schools and 59.04 percent of the Higher Secondary Schools of Meghalaya. Out of 74 Higher Secondary Schools, 30 are located in East Khasi Hills and just two are in South Garo Hills. The situation is no different in case of the Degree colleges; out of the total of 45 colleges 23 colleges are in East Khasi Hills and just one college is in the South Garo Hills district. Clearly, out of seven districts the two most recently created districts, Ri Bhoi and South Garo Hills are the most undeveloped as far as availability of schools and higher educational institutions and related infrastructure is concerned.
Table 4.12: Number of Schools in Different Categories in the Various Districts of Meghalaya
Districts Primary Schools
Upper Primary Schools
Secondary Schools
Higher Secondary
Schools
Total Number of Schools
Degree Colleges having Classes
XI & XIIJaintia Hills 668 124 49 11 852 5
East Khasi Hills 1110 253 160 30 1553 23West Khasi Hills 1202 220 86 10 1518 3East Garo Hills 791 100 59 7 957 3West Garo Hills 1286 244 145 11 1686 8South Garo Hills 404 58 29 2 493 1
Ri Bhoi 346 84 30 3 463 2Meghalaya 5807 1083 558 74 7522 45
Notes: (a) Primary refers to Class I-IV, Upper Primary (Class V- VII), Secondary (Class VIII- X), Higher Secondary (Class XI- XII).
(b) Data for Secondary and Higher Secondary Schools are for 2005 Sources: (a) For Secondary and Higher Secondary Schools, Directorate of Higher and Technical Education, GoM, Shillong
(b) For others, NEDFi Databank Quarterly, 2004_________________________________________________10The numbers reported here in the text have been taken from two different sources. Therefore, these might not be strictly comparable.
94

Meghalaya Human Development Report 2008Meghggggg alayyyyya Human Developmpppp ent Repopppp rt 2008Chapter 4
Between 1990-91 and 2000-01, there has been an increase in the number of recognized institutes in Meghalaya at the middle and senior basic level, from 693 schools to 1041 schools, showing a growth rate of about 50 percent. The corresponding fi gure at the national level are, 146636 schools and 206268 schools, respectively, recording an increase of about 41 percent. At the primary and junior basic stage however, the decadal variation in the number of recognized institutes in Meghalaya was just 12.54 percent, which is slightly lower than the variation of 14.39 percent at the all India level during the same period.
4.3.2 TEACHERS PER SCHOOL AND TEACHER PUPIL RATIO
The availability of schooling and its quality can be roughly gauged by looking at the number of teachers per school and teacher pupil ratio. In table 4.13, we have reported average number of teachers per school for different levels as well as pupil teacher ratio at three time points, 1987-88, 1994-95 and 2004-05.
Table 4.14 suggests that the average number of teachers per school has remained constant over the years for primary schools. We note a marginal decline in the average number of teachers at middle schools, higher secondary and college level in the ten year period of 1994-95 to 2004-05.
The relative stagnation that we observe in the average number of teachers per school and the rise in the school enrolment discussed earlier implies that pupil teacher ratio would increase. This is clear from the last three columns of table 4.13 where at all levels the pupil teacher ratio has increased in 2004-05 compared to 1987-88. For example, at the primary and junior basic level the number of teachers has remained constant at 2 per school for all the three years that we have taken into consideration with each teacher taking care of 21, 43 and 30 students respectively in each year. Similarly, at the middle and senior basic level the average number of teachers remained constant at 4. Each teacher on an average handled 15, 18 and 21 students respectively in the three years under consideration. However, the teacher pupil ratio on the whole appears to be favorable in the State compared to other states in India.
Table 4.13: Teachers per School and Pupil Teacher Ratio at Various Levels of Schooling in Meghalaya
Educational Standard/YearAverage Number of Teachers Pupil Teacher Ratio1987-88 1994-95 2004-05 1987-88 1994-95 2004-05
Primary and Junior Basic 2 2 2 21 43 30Middle and Senior Basic School 4 5 4 15 18 21High and Higher Secondary 9 12 9 6 21 15Teachers Training College 19 7 7 15 57 23Colleges 25 33 29 27 21 26University 145 189 209 4 7 7
Note: As in table 4.12.Source: Directorate of Public Instruction, Meghalaya
4.3.3 PROPORTION OF TRAINED TEACHERS
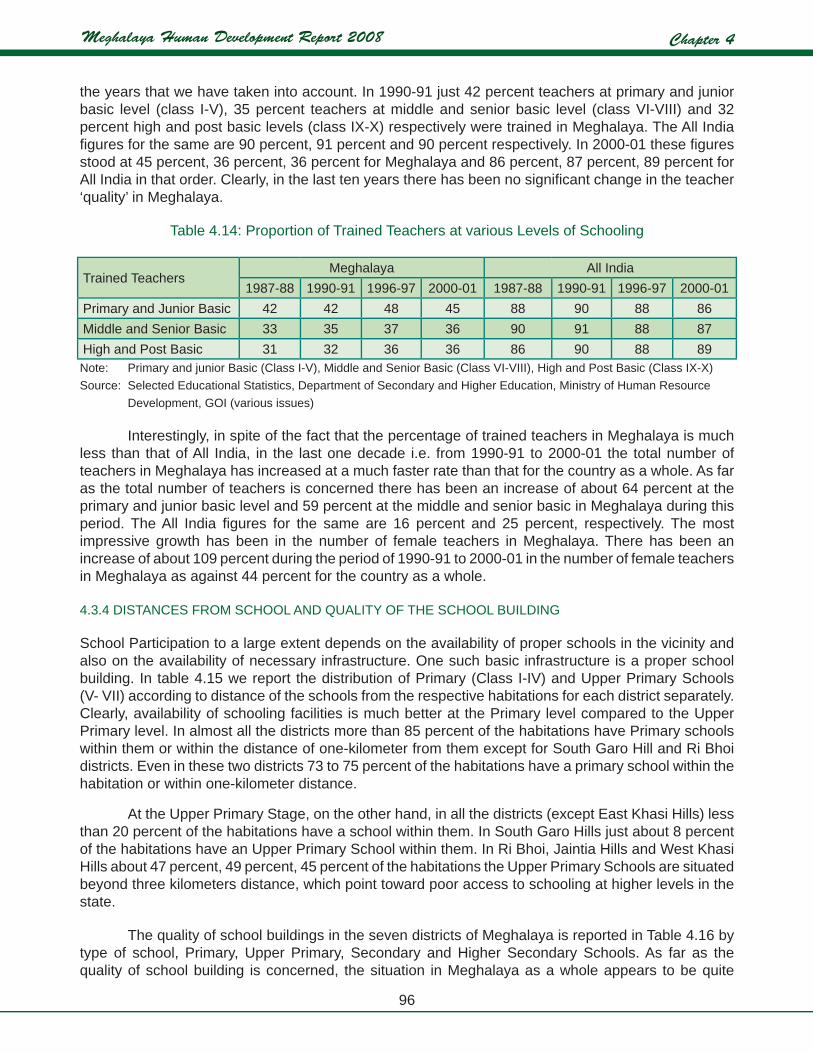
It is argued that teaching children at the elementary levels requires some special skills. It is prescribed that the teachers teaching the elementary schools must have gone through the specialized training. In table 4.14, we report the proportion of trained teachers for the state of Meghalaya as well for the country as a whole at four time points, 1987-88, 1990-91, 1996-97 and 2000-01.
The table suggests that the fi gures for Meghalaya are way behind the All India fi gures in all
95
Meghalaya Human Development Report 2008Meghgggg alayyyya Human Developmpp ent Repopp rt 2008 Chapter 4
the years that we have taken into account. In 1990-91 just 42 percent teachers at primary and junior basic level (class I-V), 35 percent teachers at middle and senior basic level (class VI-VIII) and 32 percent high and post basic levels (class IX-X) respectively were trained in Meghalaya. The All India fi gures for the same are 90 percent, 91 percent and 90 percent respectively. In 2000-01 these fi gures stood at 45 percent, 36 percent, 36 percent for Meghalaya and 86 percent, 87 percent, 89 percent for All India in that order. Clearly, in the last ten years there has been no signifi cant change in the teacher ‘quality’ in Meghalaya.
Table 4.14: Proportion of Trained Teachers at various Levels of Schooling
Trained TeachersMeghalaya All India
1987-88 1990-91 1996-97 2000-01 1987-88 1990-91 1996-97 2000-01Primary and Junior Basic 42 42 48 45 88 90 88 86Middle and Senior Basic 33 35 37 36 90 91 88 87High and Post Basic 31 32 36 36 86 90 88 89Note: Primary and junior Basic (Class I-V), Middle and Senior Basic (Class VI-VIII), High and Post Basic (Class IX-X)Source: Selected Educational Statistics, Department of Secondary and Higher Education, Ministry of Human Resource Development, GOI (various issues)
Interestingly, in spite of the fact that the percentage of trained teachers in Meghalaya is much less than that of All India, in the last one decade i.e. from 1990-91 to 2000-01 the total number of teachers in Meghalaya has increased at a much faster rate than that for the country as a whole. As far as the total number of teachers is concerned there has been an increase of about 64 percent at the primary and junior basic level and 59 percent at the middle and senior basic in Meghalaya during this period. The All India fi gures for the same are 16 percent and 25 percent, respectively. The most impressive growth has been in the number of female teachers in Meghalaya. There has been an increase of about 109 percent during the period of 1990-91 to 2000-01 in the number of female teachers in Meghalaya as against 44 percent for the country as a whole.
4.3.4 DISTANCES FROM SCHOOL AND QUALITY OF THE SCHOOL BUILDING
School Participation to a large extent depends on the availability of proper schools in the vicinity and also on the availability of necessary infrastructure. One such basic infrastructure is a proper school building. In table 4.15 we report the distribution of Primary (Class I-IV) and Upper Primary Schools (V- VII) according to distance of the schools from the respective habitations for each district separately. Clearly, availability of schooling facilities is much better at the Primary level compared to the Upper Primary level. In almost all the districts more than 85 percent of the habitations have Primary schools within them or within the distance of one-kilometer from them except for South Garo Hill and Ri Bhoi districts. Even in these two districts 73 to 75 percent of the habitations have a primary school within the habitation or within one-kilometer distance.
At the Upper Primary Stage, on the other hand, in all the districts (except East Khasi Hills) less than 20 percent of the habitations have a school within them. In South Garo Hills just about 8 percent of the habitations have an Upper Primary School within them. In Ri Bhoi, Jaintia Hills and West Khasi Hills about 47 percent, 49 percent, 45 percent of the habitations the Upper Primary Schools are situated beyond three kilometers distance, which point toward poor access to schooling at higher levels in the state.
The quality of school buildings in the seven districts of Meghalaya is reported in Table 4.16 by type of school, Primary, Upper Primary, Secondary and Higher Secondary Schools. As far as the quality of school building is concerned, the situation in Meghalaya as a whole appears to be quite
96

Meghalaya Human Development Report 2008Meghggggg alayyyyya Human Developmpppp ent Repopppp rt 2008Chapter 4
satisfactory at all stages, with more than 50 percent of the school at the primary and upper primary levels and 70 to 80 percent of the school at the secondary and higher secondary level having Permanent or Pucca Buildings.
Table 4.15: Distribution of Schools in Meghalaya by distance from the Habitations
Districts
Primary Stage Upper Primary stage
Within The habitation
Within one km but not within the habitation
Beyond one Km of
habitation
Within The habitation
Within one km but not within the habitation
Beyond one Km of
habitation
Jaintia Hills 75.30 11.48 13.22 18.56 32.84 48.60East Khasi Hills 69.55 19.96 10.49 21.45 43.45 35.10West Khasi Hills 77.47 12.50 10.03 15.97 38.19 45.83East Garo Hills 74.68 12.07 13.25 11.68 45.14 43.18West Garo Hills 70.29 17.17 12.54 15.57 49.85 34.58South Garo Hills 53.14 20.74 26.12 7.81 56.47 35.72
Ri Bhoi 52.38 22.92 24.70 14.43 38.99 46.58Meghalaya 69.09 16.37 14.54 15.34 44.13 40.54
Note: Primary refers to Class I-IV, Upper Primary refers to Class V- VII
Source: As in Table 4.12.
However, we do observe vast divergence across districts in so far as the quality of school buildings is concerned. We observe that districts like East Khasi Hills and West Garo Hills are doing fairly well in this aspect. However, Ri Bhoi and South Garo Hills are still lagging behind the other fi ve districts in terms of quality of the school building. In the Ri Bhoi District, school buildings of about 55 percent of the Primary schools, 45 percent of Upper Primary schools and 19 percent of the Secondary schools are still Kuccha, whereas in the neighbouring East Khasi Hills district just about 7 percent of Primary schools, 3 percent of Upper Primary schools and 1 percent of the Secondary schools have Kuccha buildings.
In some other districts like Jaintia Hills, West Khasi Hills, Ri Bhoi and South Garo Hills teaching and learning still takes place in tents and open space. But the percentage of such schools is negligible, less than 1 percent in most cases.
97

Meghalaya Human Development Report 2008Meghgggg alayyyya Human Developmpp ent Repopp rt 2008 Chapter 4
Table 4.16: Distribution according to type of school building in Meghalaya
DistrictsType of School Building
Primary SchoolsPucca Partly Pucca Kuccha Tent Open Space Total
Jaintia Hills 48.80 35.18 15.57 0.30 0.15 100East Khasi Hills 65.41 27.39 7.12 0.09 0.00 100West Khasi Hills 39.10 34.19 25.37 1.16 0.17 100East Garo Hills 47.03 19.97 32.87 0.13 0.00 100West Garo Hills 75.89 7.47 16.41 0.08 0.16 100South Garo Hills 25.99 46.04 27.72 0.25 0.00 100Ri Bhoi 24.86 18.79 54.62 1.45 0.29 100Meghalaya 52.71 25.06 21.70 0.43 0.10 100
Upper Primary SchoolsDistricts Pucca Partly Pucca Kuccha Tent Open Space Total
Jaintia Hills 59.68 31.45 8.87 0.00 0.00 100East Khasi Hills 73.12 24.11 2.77 0.00 0.00 100West Khasi Hills 50.00 33.64 15.91 0.45 0.00 100East Garo Hills 58.00 30.00 12.00 0.00 0.00 100West Garo Hills 58.20 22.13 19.26 0.00 0.41 100South Garo Hills 36.21 44.83 17.24 0.00 1.72 100Ri Bhoi 22.62 30.95 45.24 1.19 0.00 100Meghalaya 56.23 28.62 14.77 0.18 0.18 100
Secondary SchoolsDistricts Pucca Partly Pucca Kuccha Tent Open Space TotalJaintia Hills 68.00 22.00 10.00 0.00 0.00 100East Khasi Hills 84.03 14.58 1.39 0.00 0.00 100West Khasi Hills 69.41 23.53 7.06 0.00 0.00 100East Garo Hills 70.00 18.00 12.00 0.00 0.00 100West Garo Hills 66.93 18.11 14.96 0.00 0.00 100South Garo Hills 44.00 44.00 12.00 0.00 0.00 100Ri Bhoi 53.13 28.13 18.75 0.00 0.00 100Meghalaya 70.57 20.27 9.16 0.00 0.00 100
Higher Secondary SchoolsDistricts Pucca Partly Pucca Kuccha Tent Open Space TotalJaintia Hills 75.00 25.00 0.00 0.00 0.00 100East Khasi Hills 97.44 2.56 0.00 0.00 0.00 100West Khasi Hills 88.89 0.00 11.11 0.00 0.00 100East Garo Hills 66.67 33.33 0.00 0.00 0.00 100West Garo Hills 90.00 0.00 10.00 0.00 0.00 100South Garo Hills 50.00 50.00 0.00 0.00 0.00 100Ri Bhoi 60.00 40.00 0.00 0.00 0.00 100Meghalaya 86.75 10.84 2.41 0.00 0.00 100
Note: Primary refers to Class I-IV, Upper Primary (Class V- VII), Secondary (Class VIII- X), Higher Secondary (Class XI- XII).
Source: As in Table 4.13.98

Meghalaya Human Development Report 2008Meghggggg alayyyyya Human Developmpppp ent Repopppp rt 2008Chapter 4
This could possibly explain the low net enrolment in Meghalaya that we have discussed in earlier sections. Clearly, the lack of infrastructure not only adversely affects the attendance and enrolment rates but also disrupts the teaching and learning process as well as the quality of teaching.
Indicator of ‘quality school’ is much more than just construction of pucca building. Other infrastructural facilities such as drinking water facilities and proper toilet facilities including separate toilets for girls, etc. are very important to assess the quality of educational infrastructure.
Table 4.17 reveals that 18.3 percent of Lower Primary (LP) schools and 24 percent of Upper Primary (UP) schools do not have buildings of their own. 25 percent of LP schools and 20 percent of UP schools are in a dilapidated condition. 60 percent of LP schools and 91 percent of UP schools need additional classrooms. Only 22 percent of LP schools have drinking water facility. 57 percent of LP schools and 73 percent of UP schools are without toilet facilities and only 5 percent and 11 percent of LP and UP schools respectively have separate toilets for girls. Only about a quarter of the schools have playgrounds and 99 percent do not have kitchens for midday meals.
Table 4.17: Educational Infrastructure Gaps in Primary Schools of Meghalaya, 2005-06
Stage Total Schools
Schools without
Own Building
Schools in
dilapi-dated Condi-
tion
Schools requiring
Addi-tional Class-rooms
Schools without drinking water facility
Schools without Toilet
facilities
Schools with Girls’ Toilet
Schools with play-
ground
Schools without kitchen
for midday meals
NumberLP 5851 1070 1488 3532 1336 3363 298 1354 5820UP 1759 423 347 1599 NA 1286 190 492 1742
Total 7610 1493 1835 5131 1336 4649 488 1846 7562Percentage
LP 100 18.29 25.43 60.37 22.83 57.48 5.09 23.14 99.47UP 100 24.05 19.73 90.90 NA 73.11 10.80 27.97 99.03
Total 100 19.62 24.11 67.42 NA 61.09 6.41 24.26 99.37
Source: Directorate of Elementary and Mass Education, Government of Meghalaya, Shillong.
Thus there are educational infrastructure gaps in Meghalaya. Provision, extension and main-tenance of the school buildings along with basic facilities like drinking water and toilets should be given utmost importance and priority.
4.4 Factors determining School Attendance in Meghalaya
In the last three sections, we have analysed various aspects of school participation and enrolment and also schooling infrastructure in Meghalaya. Given that literacy rates are directly related to school participation of children and their attendance in the school, it is important to identify the factors that affect school attendance of the children in Meghalaya. To examine the likelihood of child attending school, we use a technique that has been extensively used for the purpose, namely, the limited dependent variable technique, especially probit analysis11.
99

Meghalaya Human Development Report 2008Meghgggg alayyyya Human Developmpp ent Repopp rt 2008 Chapter 4
The idea in probit analysis is very simple. Of the given number of children in the pre-specifi ed age group, the information whether the child is currently attending school or not is recorded. If the child is attending school, it is considered favourable and the variable takes value 1. For those who are not attending school the variable takes value 012. Then this variable is regressed on a set of independent variables to calculate the associated coeffi cients which are interpreted as affecting probability of school attendance.
One of the problems in such estimation is to fi nd appropriate variables that could be considered to be affecting the school attendance a priori. The available literature suggests that school attendance and completion rate is signifi cantly affected by factors including income, highest education achieved in the household, education of the adult female and of head of household, whether the child belongs to rural or urban areas, the social group, religion and sex of the child and access to basic infrastructure13.
In this section we have made an attempt to conduct probit analysis to examine the likelihood of children aged 6-11 years attending primary school in Meghalaya conditioned on of the factors mentioned above. In addition, in order to appraise the situation prevailing in Meghalaya we have tried to compare the same with the estimates at the All India level. We have used employment and unemployment data collected by the NSSO during its most recent round of surveys in 2004-05. From this data, we get about 79,558 observation including 1138 for Meghalaya.
The dependent variable is ‘Current attendance status of the child’ assuming value ‘1’ if the child is attending school primary school and ‘0’ otherwise.
The independent variables are:
age 7 = this is a binary variable assuming value 1 if the age of the child
is 7 years, zero otherwise.
age 8 = this is a binary variable assuming value 1 if the age of the child
is 8 years, zero otherwise.
age 9 = this is a binary variable assuming value 1 if the age of the child
is 9 years, zero otherwise.
age 10 = this is a binary variable assuming value 1 if the age of the child
is 10 years, zero otherwise.
age 11 = this is a binary variable assuming value 1 if the age of the child is 11 years, zero otherwise.
_________________________________________________11See for example Colnisk (1969), Deolalikar (1992), World Bank (2004) and several others. For the details on limited dependent variable technique and probit analysis, see Maddala (1987).
12When a dependent variable takes only two values, 0 and 1, these are also called dependent binary variable. For issues related to estimation of such models, see Maddala (1987), Gaiha (1988).
13These variables encompass several factors that are intrinsic to Indian society.
100

Meghalaya Human Development Report 2008Meghggggg alayyyyya Human Developmpppp ent Repopppp rt 2008Chapter 4
Fem hhd sch = years of Schooling of the head of household if the head is a female.
Sch head spouse = years of Schooling of the spouse of head of household.
Edu adult male = years of schooling of the highest educated male in the household.
Edu adult female = years of schooling of the highest educated female in the household.
Hhd fem = this variable is binary, 1 if head of household is female, 0 otherwise
Rural resident = this variable is binary, 1 if child belongs to the rural area, 0 otherwise.
self empl in non agri = in the rural areas, if the main source of the income is self employment in agriculture, this binary variable takes value 1, 0 otherwise
agricultural labour = in the rural areas if the main source of the income is by agricultural labour, this binary variable takes value 1, 0 otherwise
other labour = in the rural areas if the main source of the income is from other kind of labour income, this binary variable takes value 1, 0 otherwise
self empl in agri =in the rural areas if the main source of the income is from working her/his own farm, variable takes value 1, 0 otherwise
self emp =in the urban areas if the main source of income is from self employment, variable takes value 1, 0 otherwise.
Reg wage = in the urban areas if the main source of income is from regular wages or salary, variable takes value 1, 0 otherwise.
Casual labour = in the urban areas if the main source of income is from casual labour, variable takes value 1, 0 otherwise.
ST = this is binary variable, if household belongs to Scheduled Tribe, it is 1, 0 otherwise
SC = this is binary variable, if household belongs to Scheduled Caste, it is 1, 0 otherwise
OBC = this is binary variable, if household belongs to Other backward Classes, it is 1, 0 otherwise
muslims = this is binary variable, if household has religion denomination as-Muslim, it is 1, 0 otherwise
christian = this is binary variable, if household has religion denomination as-Christian, it is 1, 0 otherwise
other religion = this is binary variable, if household has religion denomination as-Sikh, Jain etc, it is 1, 0 otherwise
ST christian = this is binary variable, if household religion is Scheduled Tribe has religion denomination Christianity, it is 1, 0 otherwise
The control groups in the estimation are children aged 6 years for the children aged 6-11 years, Other Castes for caste, other (more than one source or diverse income sources) means of livelihood for means of livelihood, Hindu for religion variable. The estimated coeffi cients are reported
101

Meghalaya Human Development Report 2008Meghgggg alayyyya Human Developmpp ent Repopp rt 2008 Chapter 4
in table 4.18 for Meghalaya along with that of all India.
At the all India level, we fi nd that the probability of attending primary school increases with age upto 9 years of age. Put another way, children aged 7, 8 or 9 years have more probability of attending school than children aged 6 years. However children who are 10 or 11 years of age have lower probability of attending school.
It is often argued that the education of the adult members of the household infl uences the enrolment or education of the younger members of the household. With an intention to verify the same, in our analysis, we have used some variables like schooling level of the head of the household if it is headed by a female, highest education of the adult male and female in the household and also the education of the spouse of the head as a proxy for educational achievements of the adult members. The schooling of a child has negative association with the years of schooling of the household head if it is headed by a female. Perhaps, this has to do with the economic vulnerability of female – headed households. In other households, we fi nd that the schooling or enrolment of the child has a positive association with the schooling or education of the female adult member and the education of the spouse of the household head. However, controlling for other variables a child who is a rural resident has about 5 percent higher likelihood of attending primary school.
Next set of variables that are posited to affect school enrolment of children are the main source of income or livelihood of the household. From the data all the households have been classifi ed into fi ve groups by the NSSO. Using other means of livelihood (mixed income) as control group, we observe that children belonging households whose main source of income is agricultural labor or other types of labour have lower probability of attending school. However, the children belonging to households whose main source of income is self employment in agriculture or non-agriculture stand better chances of attending or being enrolled in primary school than those belonging to households with diverse source of income.
We also fi nd that children belonging to forward castes and the Hindus are more likely to attend primary school compared to the Muslim or Christian children and those belonging to the historically disadvantaged castes. However, if the child is an ST and is at the same time a Christian the probability that he/she attends primary school is about 25 percent higher than otherwise.
Meghalaya, on the other hand, exhibits a somewhat different picture than what we observe at the all India level. Children belonging to female-headed households have about 26 percent higher probability of attending school than those belonging to male headed households. Further, we fi nd that the schooling or enrolment of the child has a positive association with the schooling or education of the male adult member and the education of the spouse of the household head.
In addition, we note that in case of Meghalaya, the children belonging to households with agricultural labour and self-employment in agriculture or cultivator households have lower probability of attending school compared to households with mixed income. This refl ects the low productivity and general backwardness of agriculture in Meghalaya. Even households with casual labour as the main source of income have higher probability of attending primary school compared to those belonging to households with diverse source of income.
102

Meghalaya Human Development Report 2008Meghggggg alayyyyya Human Developmpppp ent Repopppp rt 2008Chapter 4
Table 4.18: Maximum Likelihood Probit Estimates of Primary School Attendance among Children aged 6-11 years, 2004-05
Meghalaya All IndiaIndependent Variables dy/dx z dy/dx zage_7* -0.0715 -17.77 0.0560 7.08age_8* 0.1305 36.27 0.2861 47.72age_9* 0.0403 4.48age_10* -0.6250 -100.68age_11* -0.8059 -129.75fem_hhd_sch -0.0133 -14.98hhd_fem* 0.2690 12.35 sch_head_spouse 0.0236 27.44 0.0067 6.36edu_adult_male 0.0124 21.04 -0.0133 -15.35edu_adult_female -0.0166 -21.39 0.0619 71.63rural_resident* 0.8561 55.01 0.5276 4.65ST* 0.0766 7.74 0.2637 28.74SC* -0.0432 -0.86 -0.2464 -31.14OBC* 0.2190 9.56 -0.3485 -59.56muslim -0.1710 -16.7 -0.0512 -6.48christian* 0.9574 -0.6900 -67.93other religion* -0.3095 -40.63 0.3101 47.31st christian* -0.8987 -382.32 0.2554 17.84self empl in non agri* 0.0456 6.58 0.1756 18.63agricultural labour* -0.0576 -6.39 -0.2379 -19.18other labour* 0.0040 0.4 -0.1468 -12.28self empl in agri* -0.0602 -9.99 0.3212 41.42self emp* 0.4210 45.04 0.1897 1.98reg wage* 0.5588 48.51 0.0979 0.95casual labour* 0.4035 56.8 -0.0902 -0.78Likelihood ratio -75778.4 -40858.7 Pseudo R2 0.0678 0.5605 Sample Size 1138 79558
Notes: a. Figures in bold indicate that the coeffi cients are statistically signifi cant at 5% or lower levels. b. dy/dx is the discrete change of dummy variable from 0 to 1. c. * denotes that the variables are binary Source: As in table 4.4
4.5 Summary and Conclusion
In this chapter we have tried to analyse the status of education in Meghalaya over the years and compared it with countrywide situation.
Our analysis suggests that over the years Meghalaya has made considerable progress as far as literacy and education is concerned. The literacy rate of Meghalaya in 2001 is slightly lower than
103

Meghalaya Human Development Report 2008Meghgggg alayyyya Human Developmpp ent Repopp rt 2008 Chapter 4
the national literacy rate. However, the total literacy rate in Meghalaya mainly is a refl ection of the situation prevailing in the rural areas. The urban literacy rate in Meghalaya is in fact about 7 percentage points higher than the national literacy rate. However, literates in Meghalaya are more evenly distributed across households in both rural and urban areas than all India. Further, though there are some indications of gender gap and rural-urban gap prevailing in the state it is much lower than that for the country as a whole. However there exists intra-state disparity in literacy rates and distribution of schooling facilities in Meghalaya. There is also a lack of access to schools beyond primary level and higher educational institutions especially in the rural areas that adversely affects school participation and literacy in the state.
A lot needs to be done to improve the access to basic infrastructure including increasing the number of teachers especially trained teachers thereby improving the quality of teaching. In addition, there is a need to construct more schools and higher educational institutions, evenly distributed across the state. This will contribute positively towards school attendance and enrolment. Moreover, as will be seen in chapter 6, the type of employment that is desired by most youth is in the government areas and the rate of unemployment is highest among general graduates. Therefore, there is a need to take a step forward in promoting vocational and technical education including professional courses in the state so that people have better scope and wider choices to exercise. This is an imperative since there is a serious shortage of skilled professionals amongst the people of Meghalaya working in different fi elds.
104


![Introducing an Islamic Human Development Index (I-HDI) to …iesjournal.org/english/Docs/049.pdf · 2019-11-04 · Quality of Life Index’ [PQLI]. This index was based on a country’s](https://img.pdfslide.us/doc/110x75/5ecda397f35dbe0cf10a13f1/introducing-an-islamic-human-development-index-i-hdi-to-2019-11-04-quality-of.jpg)