Embed Size (px)
Citation preview
Chapter 4: Data Analysis
A Study of Information Security Policies Page 76
CHAPTER 4
DATA ANALYSIS
4.1 INTRODUCTION:
For every researcher, Data analysis is the most important task during entire research
process. This is the next step after data collection. Data collected by the researcher
must be scientifically and systematically processed or analyzed so as to achieve
objectives of research study. Data processing involves editing, coding, classification
and tabulation of collected data so that it should be completely ready and capable
for analysis in all respects. Data analysis is referred to calculations and
computations of data based on certain parameters along with searching for pattern
of relationship that exists among data groups which is then tested with hypothesis of
the study through the support of statistical tools.
This Researcher has collected data from selected IT companies. Furthermore, this
data is classified into three groups namely software, BPO and Hardware. Then, this
data is segregated into all twelve domains of security policy and coding of data is
made with the help of MS Excel. Final master copy is made for consolidated data for
all IT companies in MS excel, which is further imported into SPSS [1]
. Data analysis
techniques such as frequency-distribution, chi-square test and cross tabulations are
carried out with SPSS in order to test the hypothesis.
4.2 TESTING OF HYPOTHESIS:
Hypothesis is the principal element in the research [2]
. The main function of
hypothesis is to suggest new principles, laws or observations. Hypothesis can be
defined as a simple assumption or some supposition to be proved and disproved.
4.2.1 Hypothesis Tests:
Researchers follow a formal process to determine whether to accept or reject a null
hypothesis, based on sample data. This process is called as hypothesis testing. This
involves stating the null and alternative hypotheses. The hypotheses are stated in
such a way that they are mutually exclusive. That is, if one is true, the other must be
Chapter 4: Data Analysis
A Study of Information Security Policies Page 77
false. The important concept in the context of hypothesis testing is the level of
significance. It is always some percentage which should be usually chosen
throughout.
The hypothesis may not be proved absolutely, but in practice, it is accepted if it has
withstood a critical testing. This Researcher has tried to prove the hypothesis by
considering various parameters associated with it. These parameters were
considered and selected from various domains of security policy which are
correlated with the hypothesis.
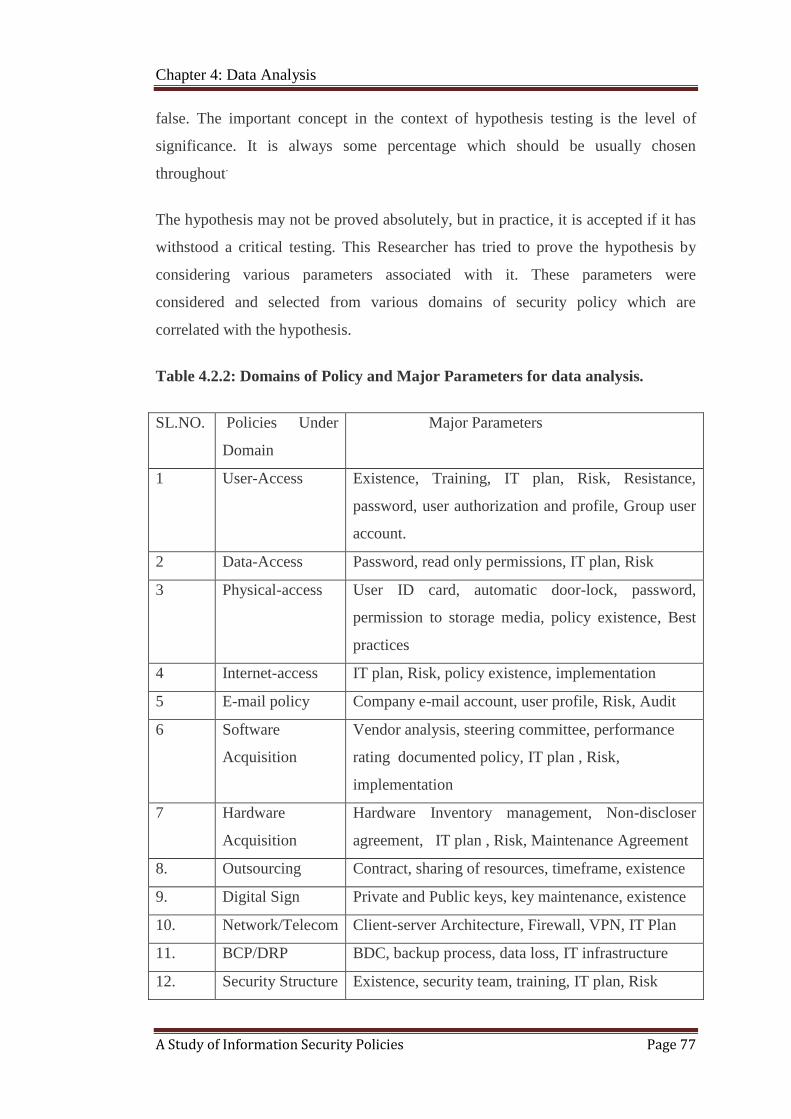
Table 4.2.2: Domains of Policy and Major Parameters for data analysis.
SL.NO. Policies Under
Domain
Major Parameters
1 User-Access Existence, Training, IT plan, Risk, Resistance,
password, user authorization and profile, Group user
account.
2 Data-Access Password, read only permissions, IT plan, Risk
3 Physical-access User ID card, automatic door-lock, password,
permission to storage media, policy existence, Best
practices
4 Internet-access IT plan, Risk, policy existence, implementation
5 E-mail policy Company e-mail account, user profile, Risk, Audit
6 Software
Acquisition
Vendor analysis, steering committee, performance
rating documented policy, IT plan , Risk,
implementation
7 Hardware
Acquisition
Hardware Inventory management, Non-discloser
agreement, IT plan , Risk, Maintenance Agreement
8. Outsourcing Contract, sharing of resources, timeframe, existence
9. Digital Sign Private and Public keys, key maintenance, existence
10. Network/Telecom Client-server Architecture, Firewall, VPN, IT Plan
11. BCP/DRP BDC, backup process, data loss, IT infrastructure
12. Security Structure Existence, security team, training, IT plan, Risk
Chapter 4: Data Analysis
A Study of Information Security Policies Page 78
4.3. ANALYSIS OF DOMAIN RELATED QUESTIONS:
The Researcher has first considered analysis for questions related to domains and
then subsequently for critical analysis of hypothesis related questions.
Domain 1: User Access Policy or Accepted usage Policy:
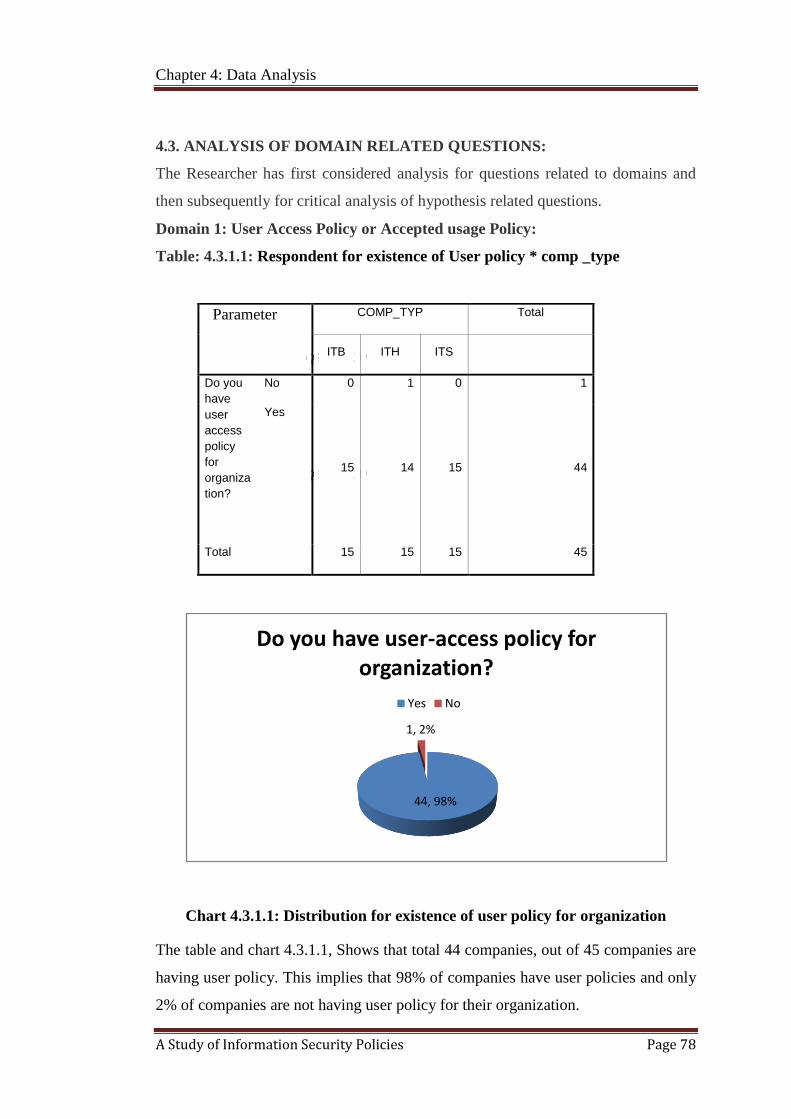
Table: 4.3.1.1: Respondent for existence of User policy * comp _type
Q2 by COMP_TYP
Q3 by COMP_TYP
Chart 4.3.1.1: Distribution for existence of user policy for organization
The table and chart 4.3.1.1, Shows that total 44 companies, out of 45 companies are
having user policy. This implies that 98% of companies have user policies and only
2% of companies are not having user policy for their organization.
44, 98%
1, 2%
Do you have user-access policy for organization?
Yes No
Parameter
COMP_TYP Total
ITB ITH ITS
Do you
have
user
access
policy
for
organiza
tion?
No 0 1 0 1
Yes
15 14 15 44
Total 15 15 15 45
Chapter 4: Data Analysis
A Study of Information Security Policies Page 79
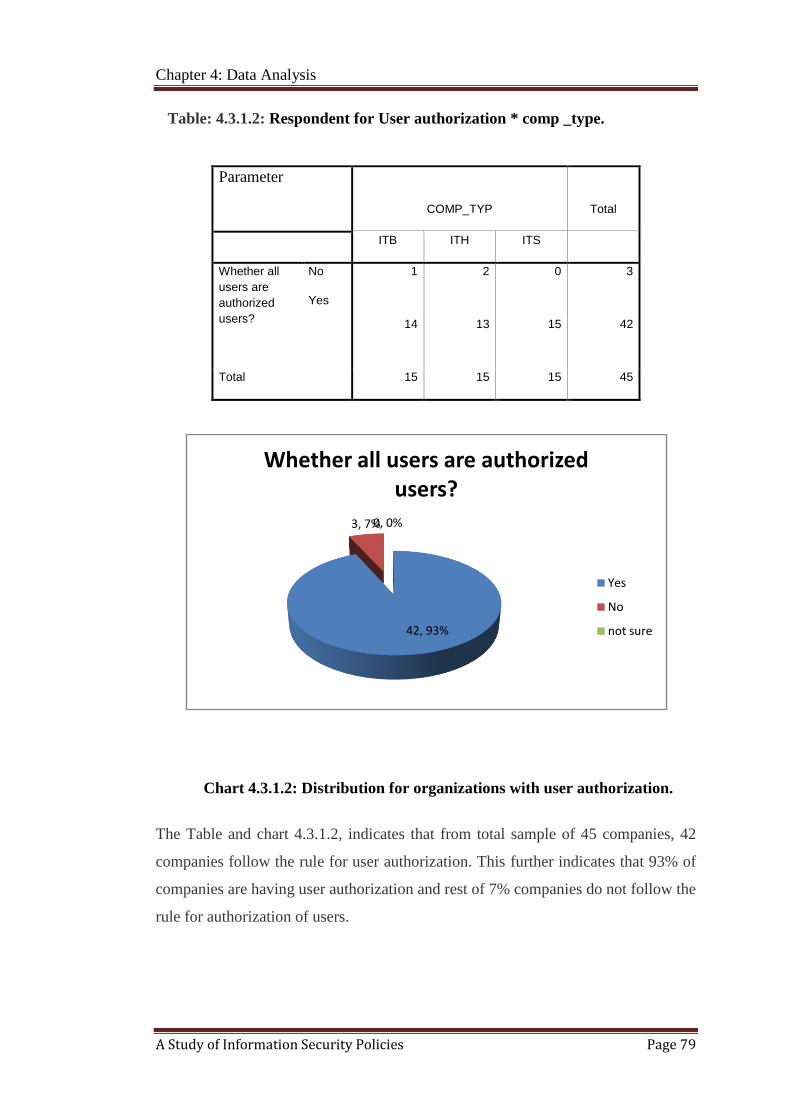
Table: 4.3.1.2: Respondent for User authorization * comp _type.
Chart 4.3.1.2: Distribution for organizations with user authorization.
The Table and chart 4.3.1.2, indicates that from total sample of 45 companies, 42
companies follow the rule for user authorization. This further indicates that 93% of
companies are having user authorization and rest of 7% companies do not follow the
rule for authorization of users.
42, 93%
3, 7%0, 0%
Whether all users are authorized users?
Yes
No
not sure
Parameter
COMP_TYP Total
ITB ITH ITS
Whether all
users are
authorized
users?
No 1 2 0 3
Yes
14 13 15 42
Total 15 15 15 45
Chapter 4: Data Analysis
A Study of Information Security Policies Page 80
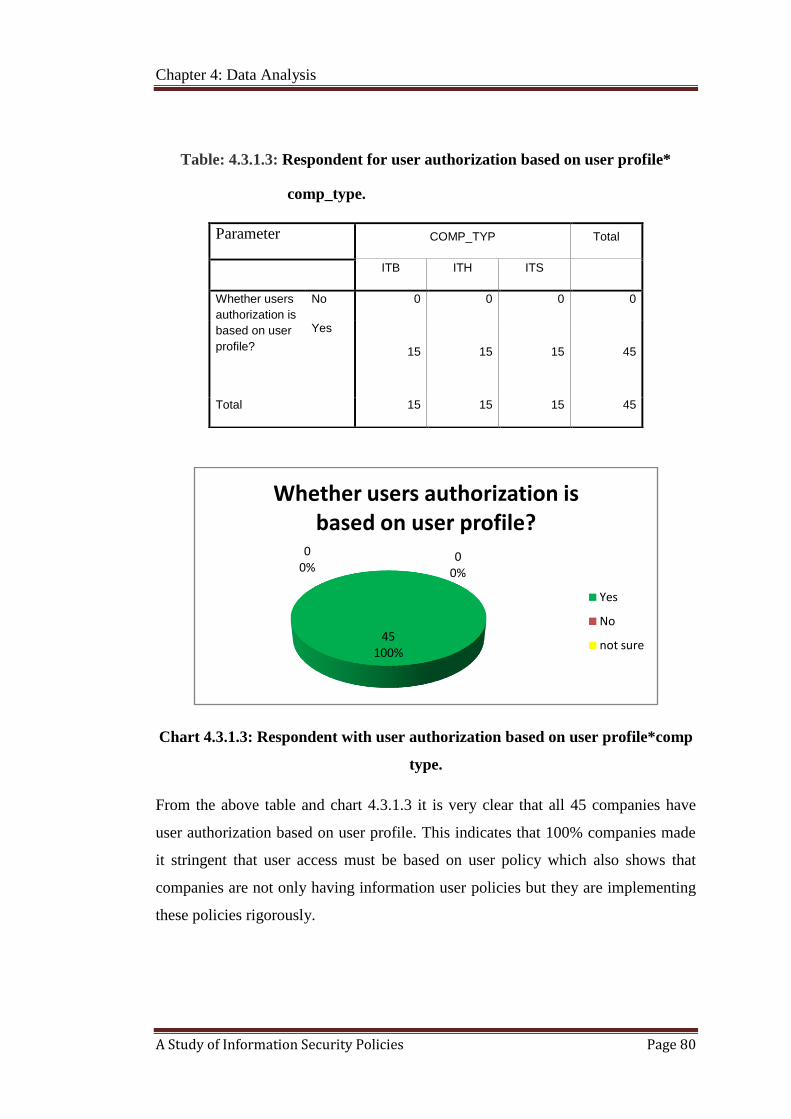
Table: 4.3.1.3: Respondent for user authorization based on user profile*
comp_type.
Chart 4.3.1.3: Respondent with user authorization based on user profile*comp
type.
From the above table and chart 4.3.1.3 it is very clear that all 45 companies have
user authorization based on user profile. This indicates that 100% companies made
it stringent that user access must be based on user policy which also shows that
companies are not only having information user policies but they are implementing
these policies rigorously.
45100%
00%
00%
Whether users authorization is based on user profile?
Yes
No
not sure
Parameter COMP_TYP Total
ITB ITH ITS
Whether users
authorization is
based on user
profile?
No 0 0 0 0
Yes
15 15 15 45
Total 15 15 15 45
Chapter 4: Data Analysis
A Study of Information Security Policies Page 81
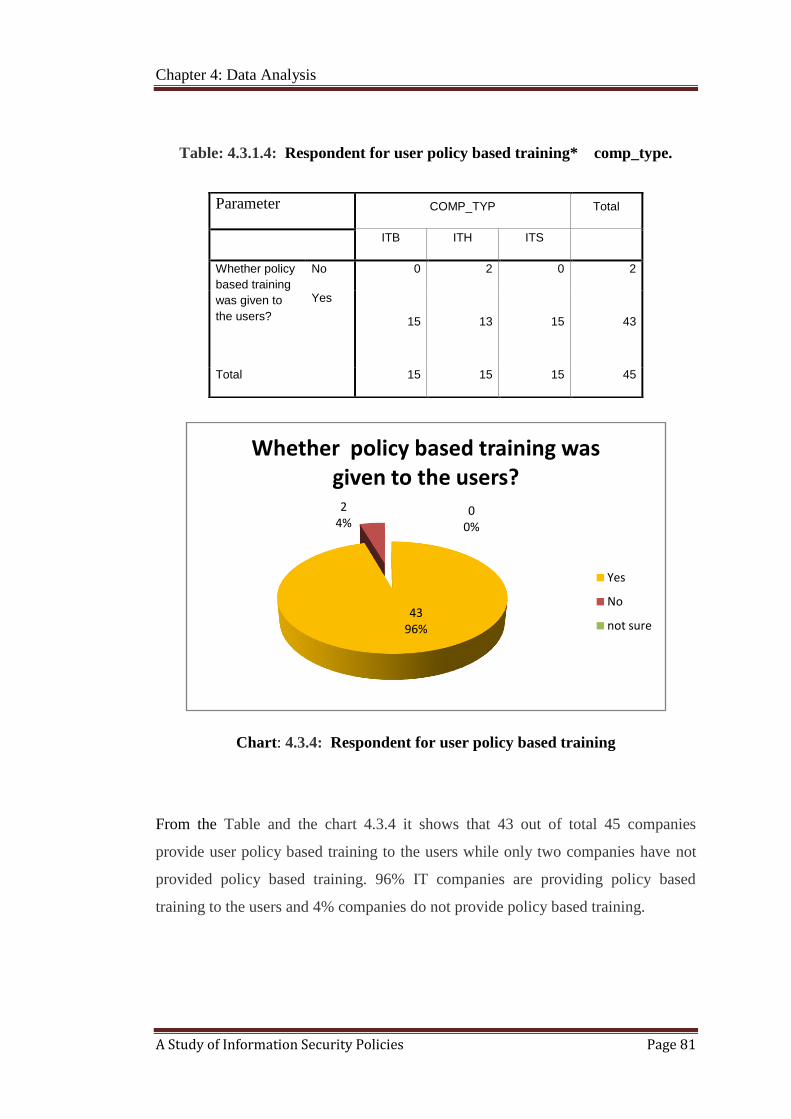
Table: 4.3.1.4: Respondent for user policy based training* comp_type.
Chart: 4.3.4: Respondent for user policy based training
From the Table and the chart 4.3.4 it shows that 43 out of total 45 companies
provide user policy based training to the users while only two companies have not
provided policy based training. 96% IT companies are providing policy based
training to the users and 4% companies do not provide policy based training.
4396%
24%
00%
Whether policy based training was given to the users?
Yes
No
not sure
Parameter COMP_TYP Total
ITB ITH ITS
Whether policy
based training
was given to
the users?
No 0 2 0 2
Yes
15 13 15 43
Total 15 15 15 45
Chapter 4: Data Analysis
A Study of Information Security Policies Page 82
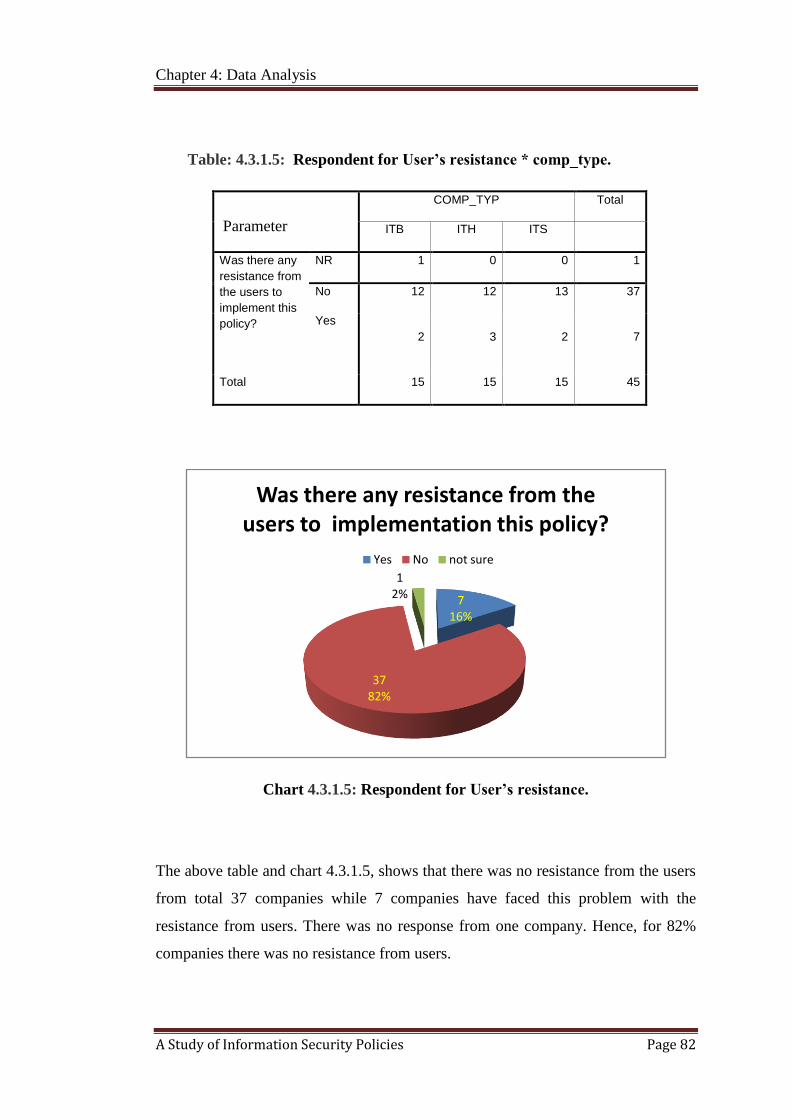
Table: 4.3.1.5: Respondent for User’s resistance * comp_type.
Parameter
COMP_TYP Total
ITB ITH ITS
Was there any
resistance from
the users to
implement this
policy?
NR 1 0 0 1
No 12 12 13 37
Yes
2 3 2 7
Total 15 15 15 45
Chart 4.3.1.5: Respondent for User’s resistance.
The above table and chart 4.3.1.5, shows that there was no resistance from the users
from total 37 companies while 7 companies have faced this problem with the
resistance from users. There was no response from one company. Hence, for 82%
companies there was no resistance from users.
716%
3782%
12%
Was there any resistance from the users to implementation this policy?
Yes No not sure
Chapter 4: Data Analysis
A Study of Information Security Policies Page 83
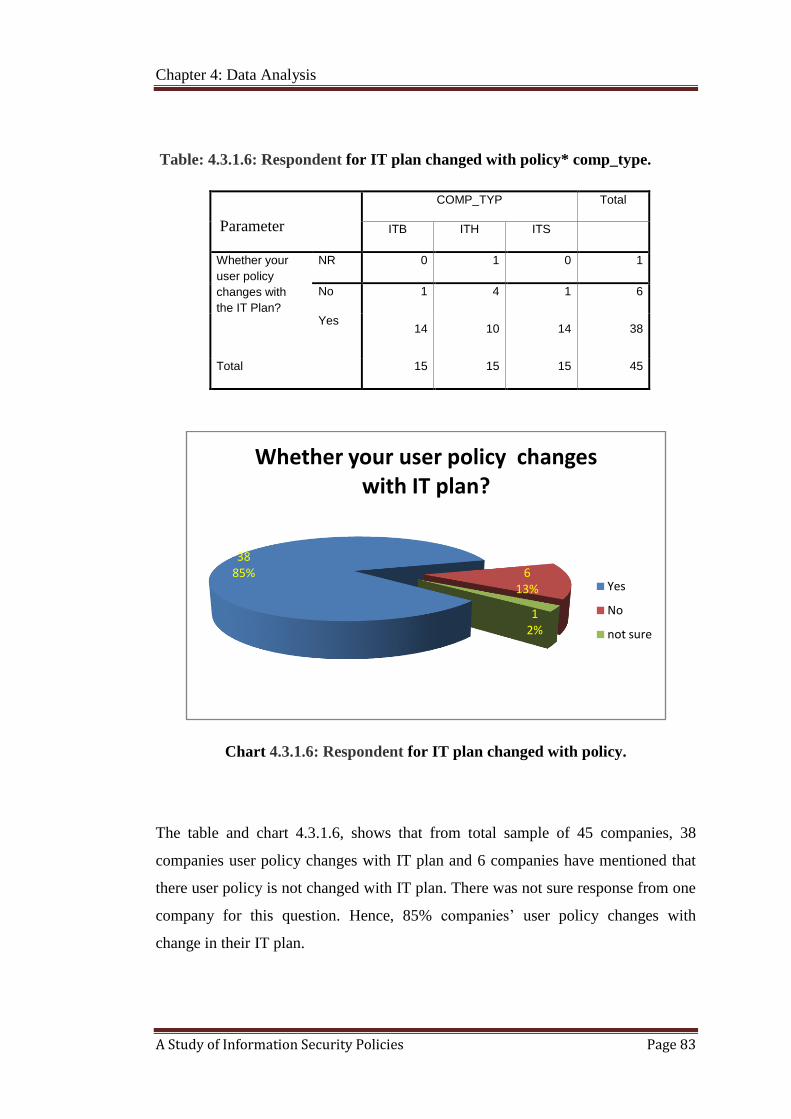
Table: 4.3.1.6: Respondent for IT plan changed with policy* comp_type.
Parameter
COMP_TYP Total
ITB ITH ITS
Whether your
user policy
changes with
the IT Plan?
NR 0 1 0 1
No 1 4 1 6
Yes 14 10 14 38
Total 15 15 15 45
Chart 4.3.1.6: Respondent for IT plan changed with policy.
The table and chart 4.3.1.6, shows that from total sample of 45 companies, 38
companies user policy changes with IT plan and 6 companies have mentioned that
there user policy is not changed with IT plan. There was not sure response from one
company for this question. Hence, 85% companies’ user policy changes with
change in their IT plan.
3885% 6
13%
12%
Whether your user policy changes with IT plan?
Yes
No
not sure
Chapter 4: Data Analysis
A Study of Information Security Policies Page 84
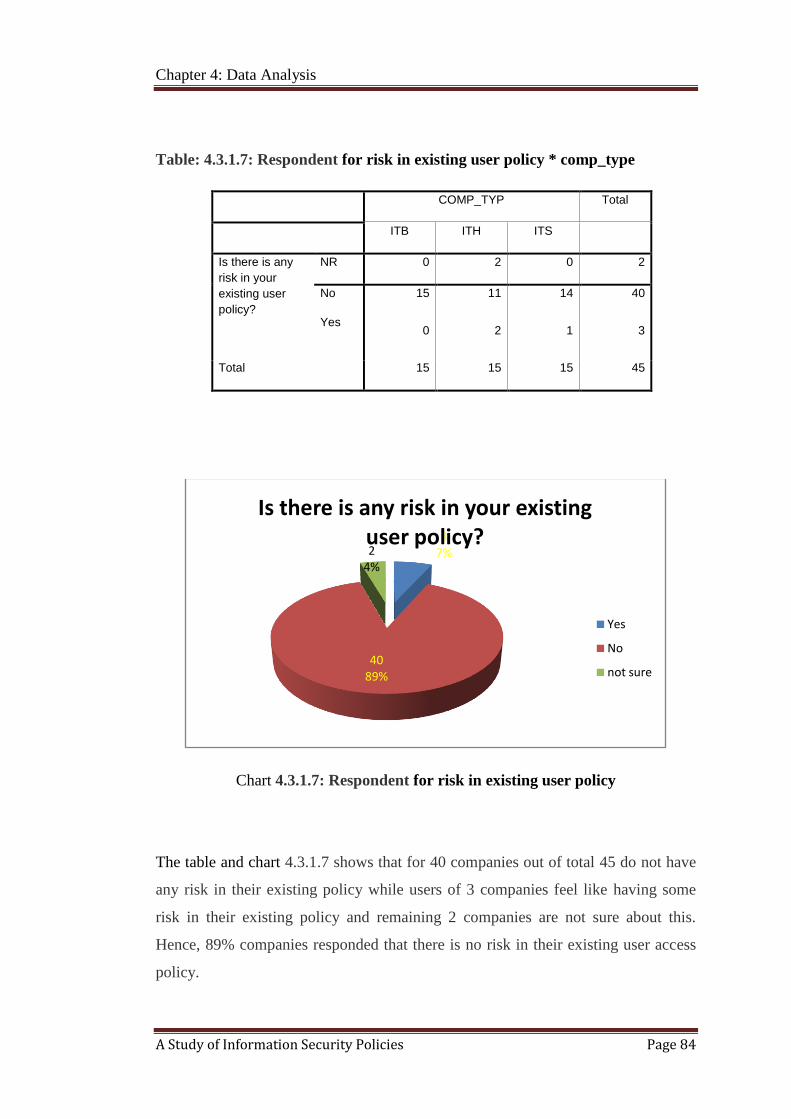
Table: 4.3.1.7: Respondent for risk in existing user policy * comp_type
COMP_TYP Total
ITB ITH ITS
Is there is any
risk in your
existing user
policy?
NR 0 2 0 2
No 15 11 14 40
Yes 0 2 1 3
Total 15 15 15 45
Chart 4.3.1.7: Respondent for risk in existing user policy
The table and chart 4.3.1.7 shows that for 40 companies out of total 45 do not have
any risk in their existing policy while users of 3 companies feel like having some
risk in their existing policy and remaining 2 companies are not sure about this.
Hence, 89% companies responded that there is no risk in their existing user access
policy.
37%
4089%
24%
Is there is any risk in your existing user policy?
Yes
No
not sure
Chapter 4: Data Analysis
A Study of Information Security Policies Page 85
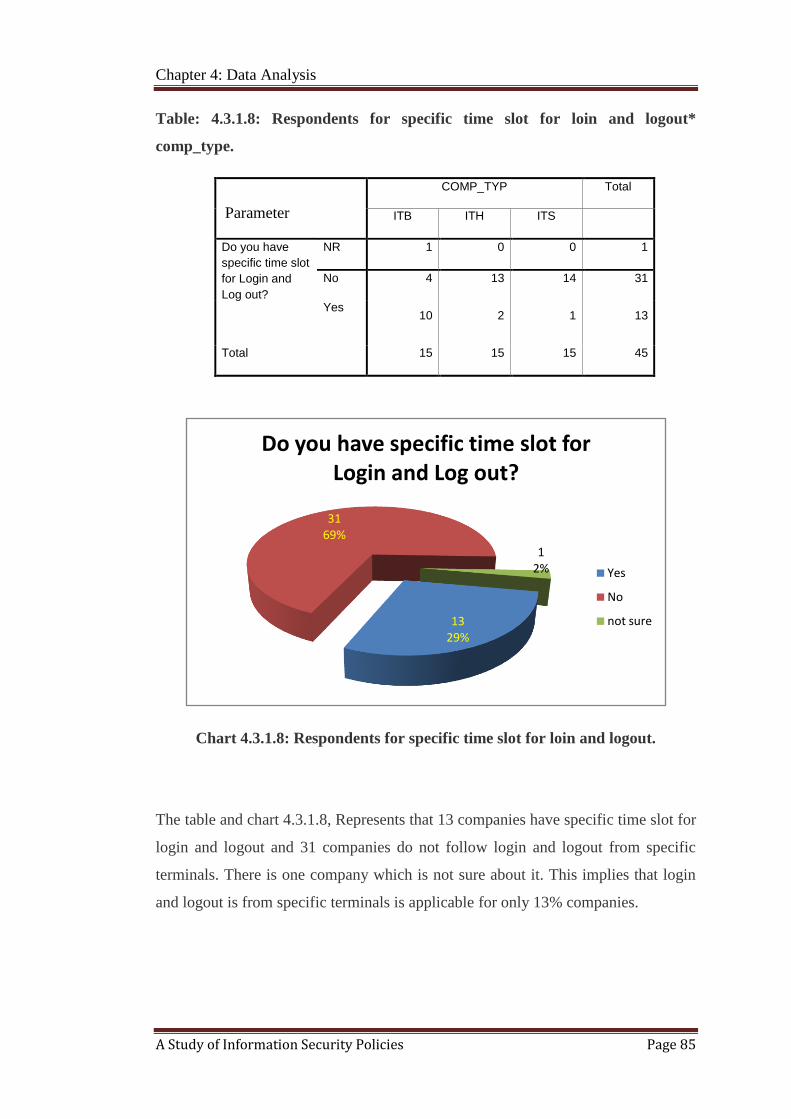
Table: 4.3.1.8: Respondents for specific time slot for loin and logout*
comp_type.
Parameter
COMP_TYP Total
ITB ITH ITS
Do you have
specific time slot
for Login and
Log out?
NR 1 0 0 1
No 4 13 14 31
Yes 10 2 1 13
Total 15 15 15 45
Chart 4.3.1.8: Respondents for specific time slot for loin and logout.
The table and chart 4.3.1.8, Represents that 13 companies have specific time slot for
login and logout and 31 companies do not follow login and logout from specific
terminals. There is one company which is not sure about it. This implies that login
and logout is from specific terminals is applicable for only 13% companies.
1329%
3169%
12%
Do you have specific time slot for Login and Log out?
Yes
No
not sure
Chapter 4: Data Analysis
A Study of Information Security Policies Page 86
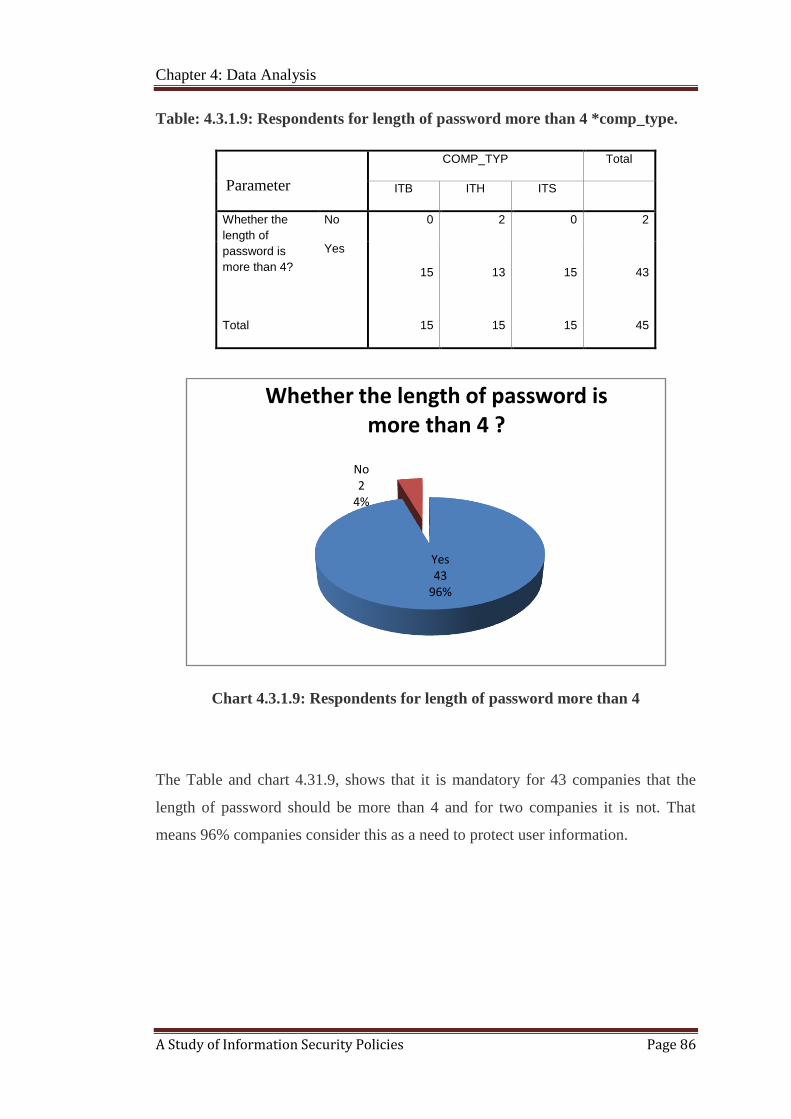
Table: 4.3.1.9: Respondents for length of password more than 4 *comp_type.
Parameter
COMP_TYP Total
ITB ITH ITS
Whether the
length of
password is
more than 4?
No 0 2 0 2
Yes
15 13 15 43
Total 15 15 15 45
Chart 4.3.1.9: Respondents for length of password more than 4
The Table and chart 4.31.9, shows that it is mandatory for 43 companies that the
length of password should be more than 4 and for two companies it is not. That
means 96% companies consider this as a need to protect user information.
Yes43
96%
No2
4%
Whether the length of password is more than 4 ?

Chapter 4: Data Analysis
A Study of Information Security Policies Page 87
Table: 4.3.1.10: Respondents for single user and group user
ccounts*comp_type.
Parameter
COMP_TYP Total
ITB ITH ITS
Do you have
single user
accounts and
group accounts
both?
NR 0 0 0 0
No 3 5 5 13
Yes
12 10 10 32
Total 15 15 15 45
Chart 4.3.1.10: Respondents for single user and group user accounts.
As per the table and chart 4.3.1.10, from the total sample of 45 IT Companies
depicted, which include 15 Software, 15 Hardware and 15 BPO companies, the
researcher has evaluated 32 IT companies in which users are having separate single
user and group user account. Hence 71% companies provide both single user and
group user account.
3271%
1329%
00%
Do you have single user accounts and group accounts both?
Yes No not sure

Chapter 4: Data Analysis
A Study of Information Security Policies Page 88
Table: 4.3.1.11: Respondents for disabling user account* Comp_Type
Parameter
COMP_TYP Total
ITB ITH ITS
Whether user
account can be
disabled if he or
she is not on the
task or duty?
No 3 6 3 12
Yes
12 9 12 33
Total 15 15 15 45
Chart 4.3.1.11: Respondents for disabling user account
From the Table and chart 4.3.1.11, 33 IT companies follow disabling user account if
the user is not on the task or duty while rest of twelve companies do not follow this.
This means that in 73% companies, user account can be disabled if he or she is not
on the task or duty, whereas for 27% companies, it is not applicable.
3373%
1227%
00%
Whether user account can be disabled if he or she is not on the
task or duty?
Yes No not sure
Chapter 4: Data Analysis
A Study of Information Security Policies Page 89
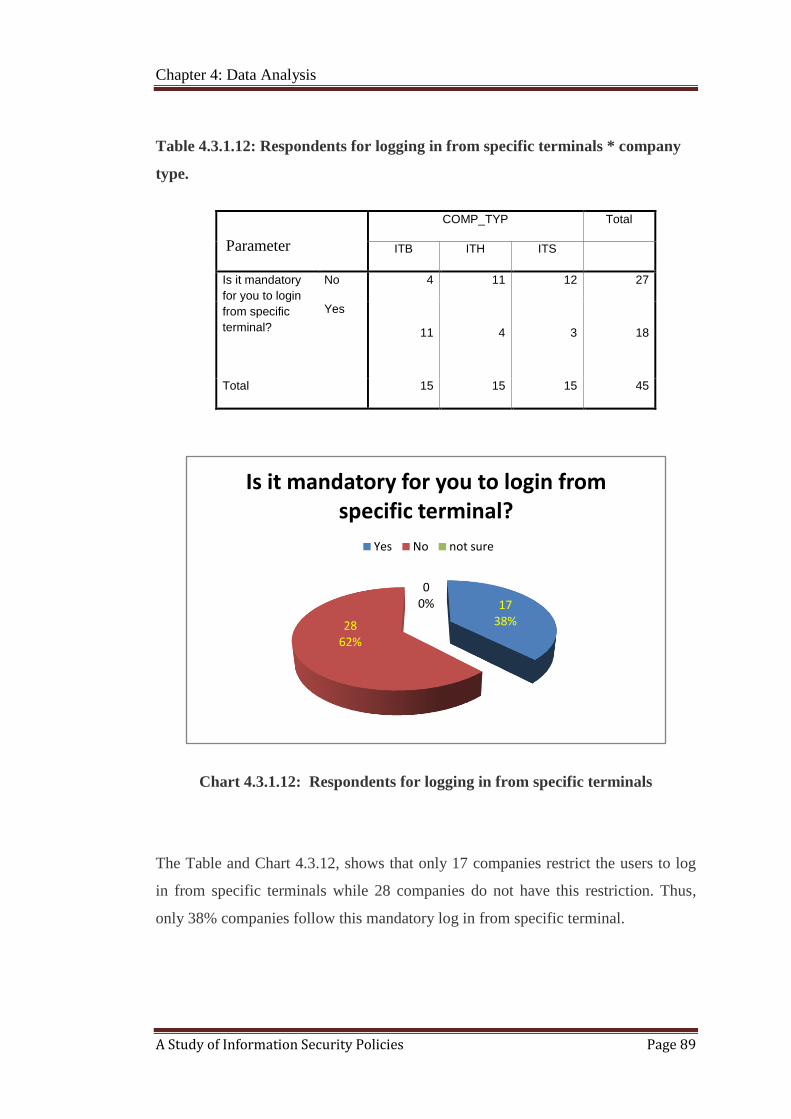
Table 4.3.1.12: Respondents for logging in from specific terminals * company
type.
Parameter
COMP_TYP Total
ITB ITH ITS
Is it mandatory
for you to login
from specific
terminal?
No 4 11 12 27
Yes
11 4 3 18
Total 15 15 15 45
Chart 4.3.1.12: Respondents for logging in from specific terminals
The Table and Chart 4.3.12, shows that only 17 companies restrict the users to log
in from specific terminals while 28 companies do not have this restriction. Thus,
only 38% companies follow this mandatory log in from specific terminal.
1738%28
62%
00%
Is it mandatory for you to login from specific terminal?
Yes No not sure
Chapter 4: Data Analysis
A Study of Information Security Policies Page 90
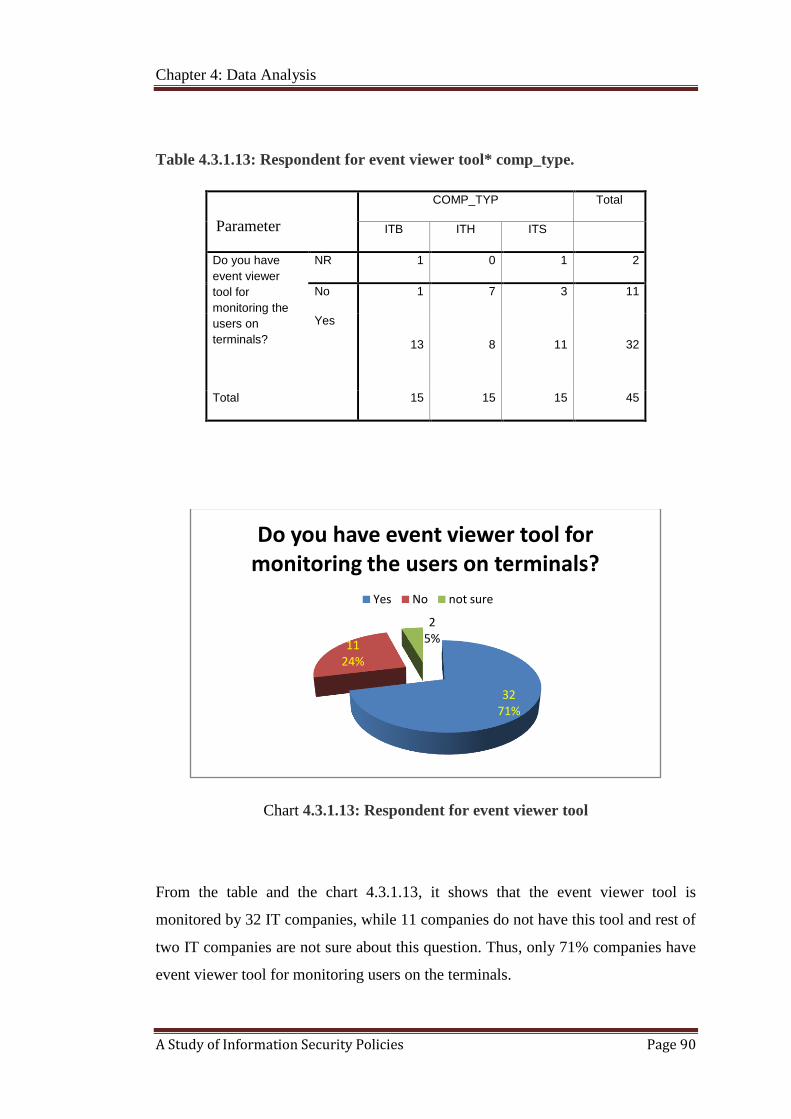
Table 4.3.1.13: Respondent for event viewer tool* comp_type.
Parameter
COMP_TYP Total
ITB ITH ITS
Do you have
event viewer
tool for
monitoring the
users on
terminals?
NR 1 0 1 2
No 1 7 3 11
Yes
13 8 11 32
Total 15 15 15 45
Chart 4.3.1.13: Respondent for event viewer tool
From the table and the chart 4.3.1.13, it shows that the event viewer tool is
monitored by 32 IT companies, while 11 companies do not have this tool and rest of
two IT companies are not sure about this question. Thus, only 71% companies have
event viewer tool for monitoring users on the terminals.
3271%
1124%
25%
Do you have event viewer tool for monitoring the users on terminals?
Yes No not sure
Chapter 4: Data Analysis
A Study of Information Security Policies Page 91
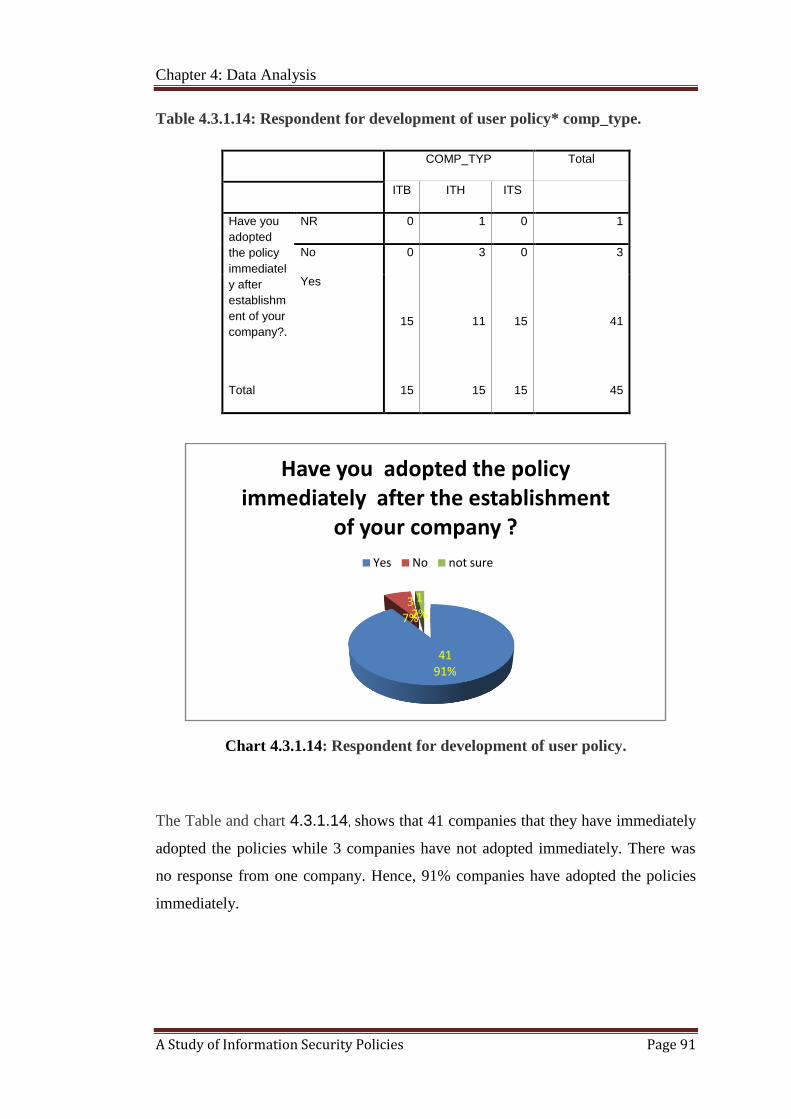
Table 4.3.1.14: Respondent for development of user policy* comp_type.
COMP_TYP Total
ITB ITH ITS
Have you
adopted
the policy
immediatel
y after
establishm
ent of your
company?.
NR 0 1 0 1
No 0 3 0 3
Yes
15 11 15 41
Total 15 15 15 45
Chart 4.3.1.14: Respondent for development of user policy.
The Table and chart 4.3.1.14, shows that 41 companies that they have immediately
adopted the policies while 3 companies have not adopted immediately. There was
no response from one company. Hence, 91% companies have adopted the policies
immediately.
4191%
37%
12%
Have you adopted the policy immediately after the establishment
of your company ?
Yes No not sure
Chapter 4: Data Analysis
A Study of Information Security Policies Page 92
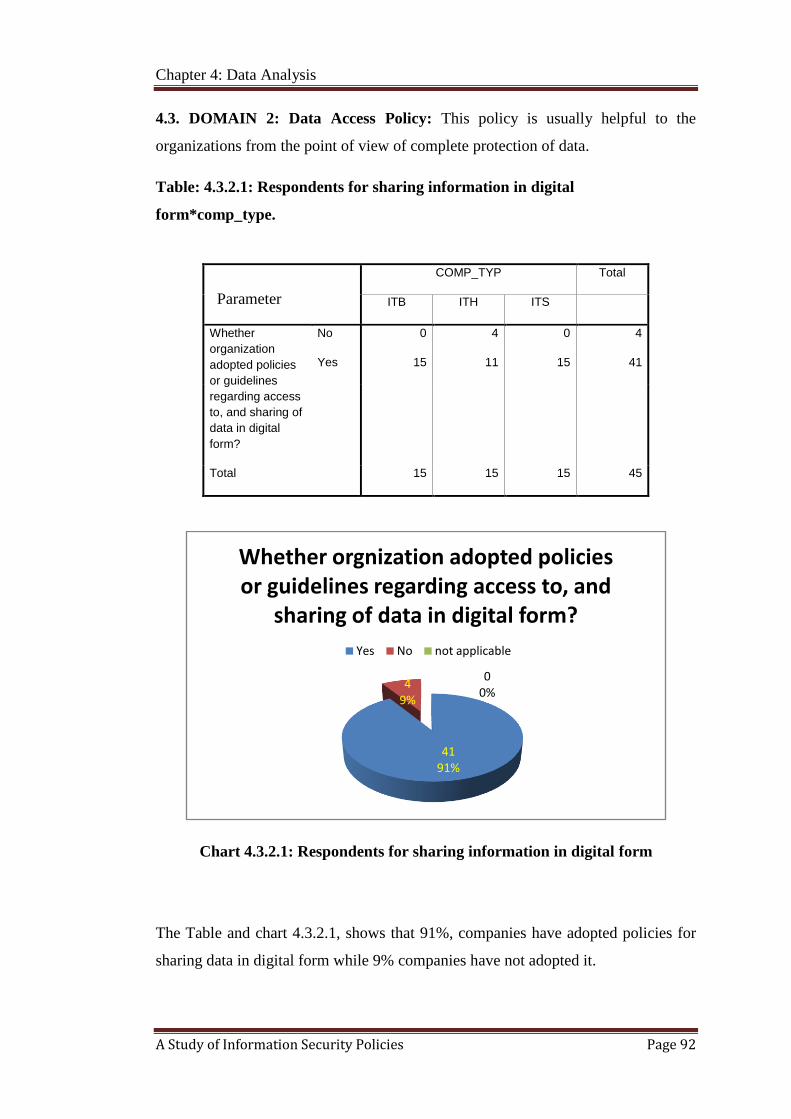
4.3. DOMAIN 2: Data Access Policy: This policy is usually helpful to the
organizations from the point of view of complete protection of data.
Table: 4.3.2.1: Respondents for sharing information in digital
form*comp_type.
Chart 4.3.2.1: Respondents for sharing information in digital form
The Table and chart 4.3.2.1, shows that 91%, companies have adopted policies for
sharing data in digital form while 9% companies have not adopted it.
4191%
49%
00%
Whether orgnization adopted policies or guidelines regarding access to, and
sharing of data in digital form?
Yes No not applicable
Parameter
COMP_TYP Total
ITB ITH ITS
Whether
organization
adopted policies
or guidelines
regarding access
to, and sharing of
data in digital
form?
No 0 4 0 4
Yes 15 11 15 41
Total 15 15 15 45
Chapter 4: Data Analysis
A Study of Information Security Policies Page 93
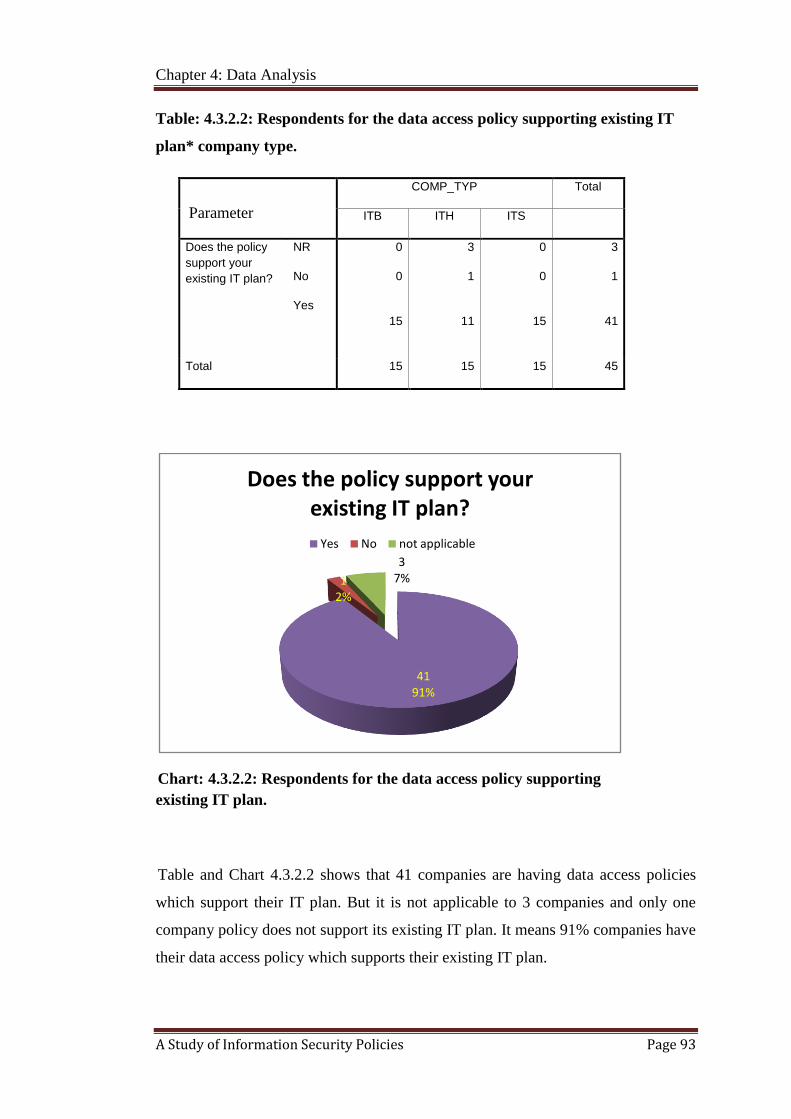
Table: 4.3.2.2: Respondents for the data access policy supporting existing IT
plan* company type.
Parameter
COMP_TYP Total
ITB ITH ITS
Does the policy
support your
existing IT plan?
NR 0 3 0 3
No 0 1 0 1
Yes
15 11 15 41
Total 15 15 15 45
Chart: 4.3.2.2: Respondents for the data access policy supporting
existing IT plan.
Table and Chart 4.3.2.2 shows that 41 companies are having data access policies
which support their IT plan. But it is not applicable to 3 companies and only one
company policy does not support its existing IT plan. It means 91% companies have
their data access policy which supports their existing IT plan.
4191%
12%
37%
Does the policy support your existing IT plan?
Yes No not applicable
Chapter 4: Data Analysis
A Study of Information Security Policies Page 94
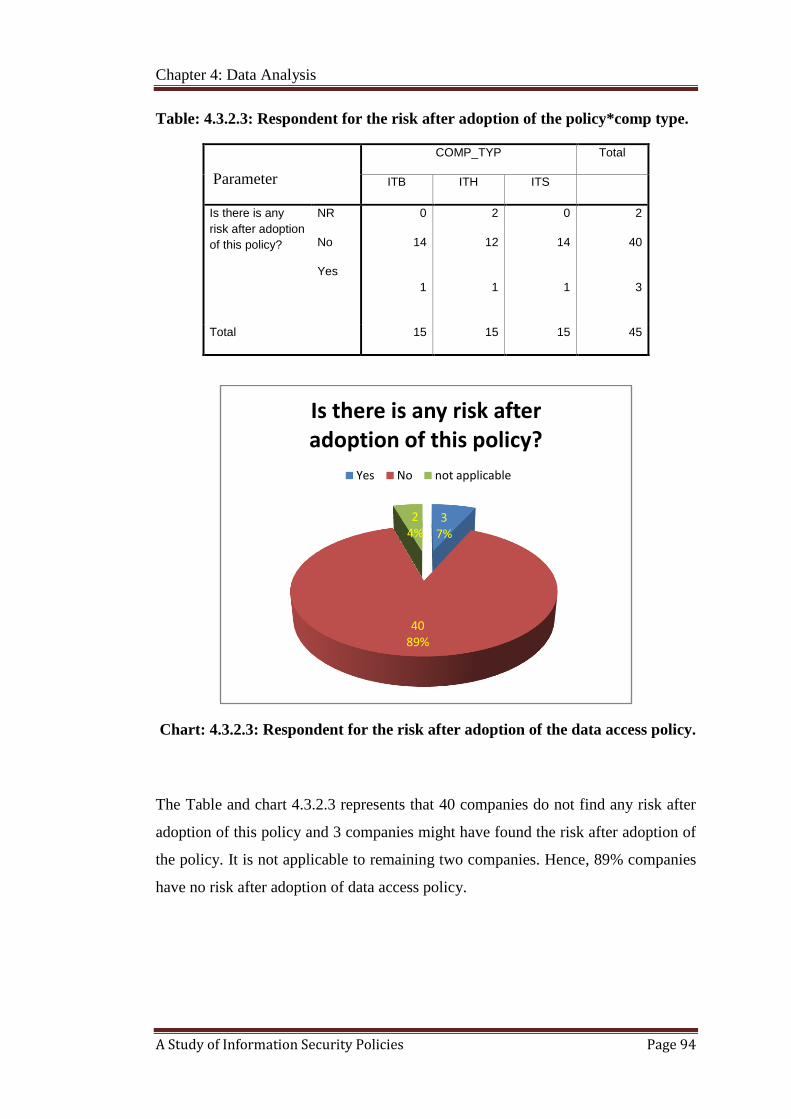
Table: 4.3.2.3: Respondent for the risk after adoption of the policy*comp type.
Parameter
COMP_TYP Total
ITB ITH ITS
Is there is any
risk after adoption
of this policy?
NR 0 2 0 2
No 14 12 14 40
Yes
1 1 1 3
Total 15 15 15 45
Chart: 4.3.2.3: Respondent for the risk after adoption of the data access policy.
The Table and chart 4.3.2.3 represents that 40 companies do not find any risk after
adoption of this policy and 3 companies might have found the risk after adoption of
the policy. It is not applicable to remaining two companies. Hence, 89% companies
have no risk after adoption of data access policy.
37%
4089%
24%
Is there is any risk after adoption of this policy?
Yes No not applicable
Chapter 4: Data Analysis
A Study of Information Security Policies Page 95
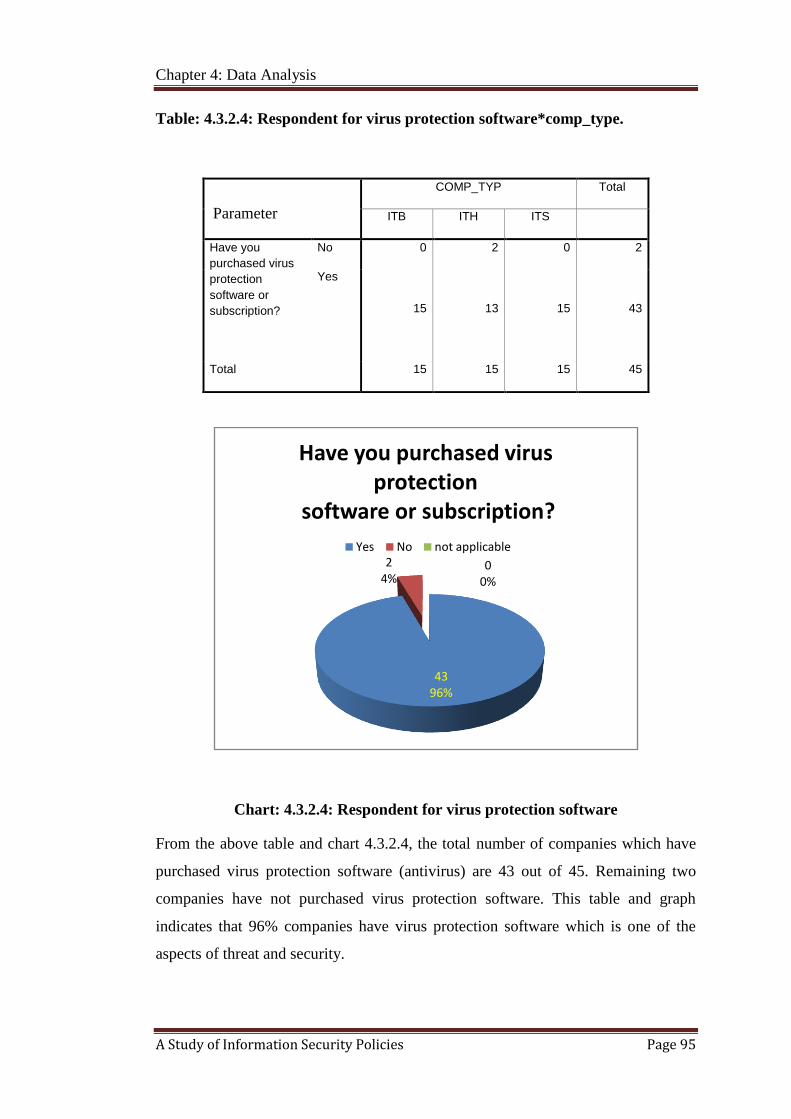
Table: 4.3.2.4: Respondent for virus protection software*comp_type.
Parameter
COMP_TYP Total
ITB ITH ITS
Have you
purchased virus
protection
software or
subscription?
No 0 2 0 2
Yes
15 13 15 43
Total 15 15 15 45
Chart: 4.3.2.4: Respondent for virus protection software
From the above table and chart 4.3.2.4, the total number of companies which have
purchased virus protection software (antivirus) are 43 out of 45. Remaining two
companies have not purchased virus protection software. This table and graph
indicates that 96% companies have virus protection software which is one of the
aspects of threat and security.
4396%
24%
00%
Have you purchased virus protection
software or subscription?
Yes No not applicable
Chapter 4: Data Analysis
A Study of Information Security Policies Page 96
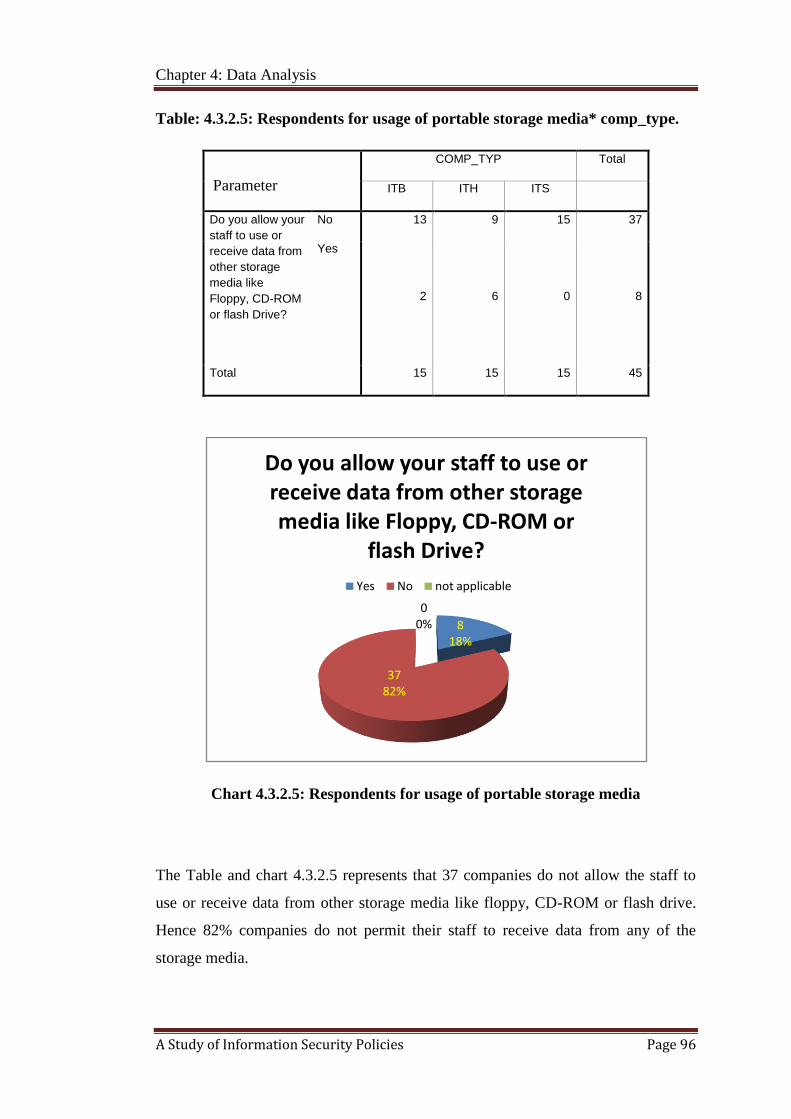
Table: 4.3.2.5: Respondents for usage of portable storage media* comp_type.
Parameter
COMP_TYP Total
ITB ITH ITS
Do you allow your
staff to use or
receive data from
other storage
media like
Floppy, CD-ROM
or flash Drive?
No 13 9 15 37
Yes
2 6 0 8
Total 15 15 15 45
Chart 4.3.2.5: Respondents for usage of portable storage media
The Table and chart 4.3.2.5 represents that 37 companies do not allow the staff to
use or receive data from other storage media like floppy, CD-ROM or flash drive.
Hence 82% companies do not permit their staff to receive data from any of the
storage media.
818%
3782%
00%
Do you allow your staff to use or receive data from other storage media like Floppy, CD-ROM or
flash Drive?
Yes No not applicable
Chapter 4: Data Analysis
A Study of Information Security Policies Page 97
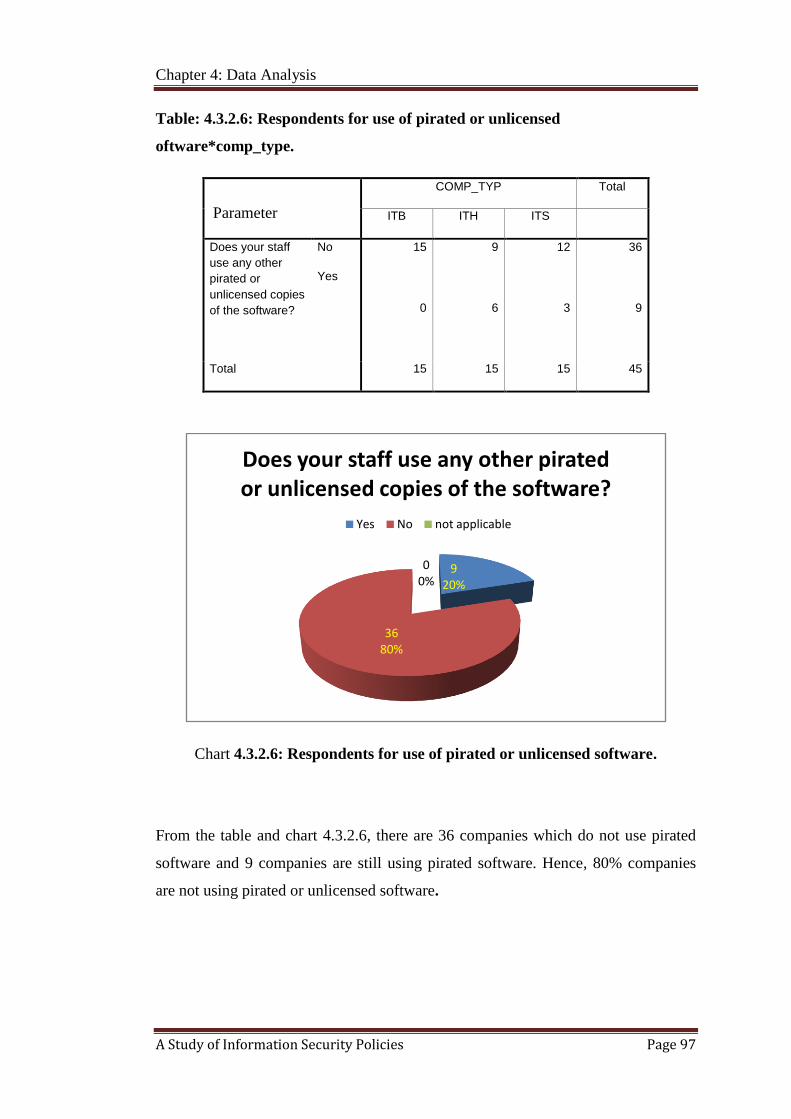
Table: 4.3.2.6: Respondents for use of pirated or unlicensed
oftware*comp_type.
Parameter
COMP_TYP Total
ITB ITH ITS
Does your staff
use any other
pirated or
unlicensed copies
of the software?
No 15 9 12 36
Yes
0 6 3 9
Total 15 15 15 45
Chart 4.3.2.6: Respondents for use of pirated or unlicensed software.
From the table and chart 4.3.2.6, there are 36 companies which do not use pirated
software and 9 companies are still using pirated software. Hence, 80% companies
are not using pirated or unlicensed software.
920%
3680%
00%
Does your staff use any other pirated or unlicensed copies of the software?
Yes No not applicable
Chapter 4: Data Analysis
A Study of Information Security Policies Page 98
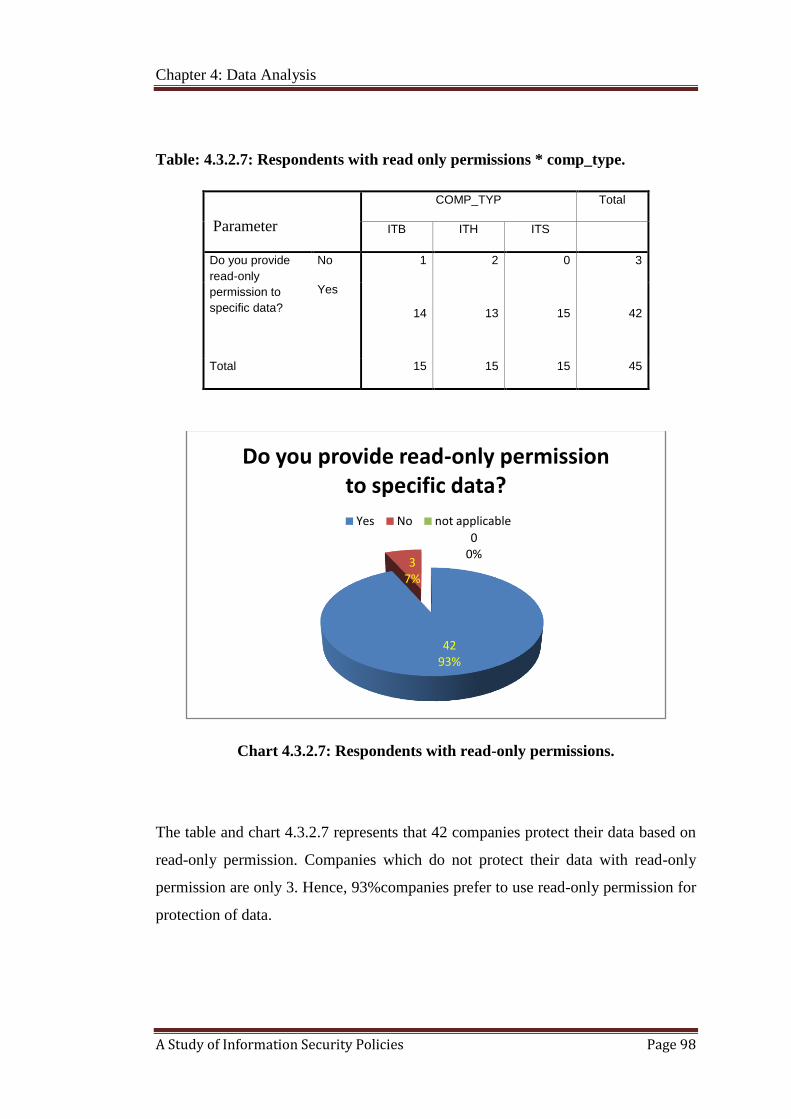
Table: 4.3.2.7: Respondents with read only permissions * comp_type.
Parameter
COMP_TYP Total
ITB ITH ITS
Do you provide
read-only
permission to
specific data?
No 1 2 0 3
Yes
14 13 15 42
Total 15 15 15 45
Chart 4.3.2.7: Respondents with read-only permissions.
The table and chart 4.3.2.7 represents that 42 companies protect their data based on
read-only permission. Companies which do not protect their data with read-only
permission are only 3. Hence, 93%companies prefer to use read-only permission for
protection of data.
4293%
37%
00%
Do you provide read-only permission to specific data?
Yes No not applicable
Chapter 4: Data Analysis
A Study of Information Security Policies Page 99
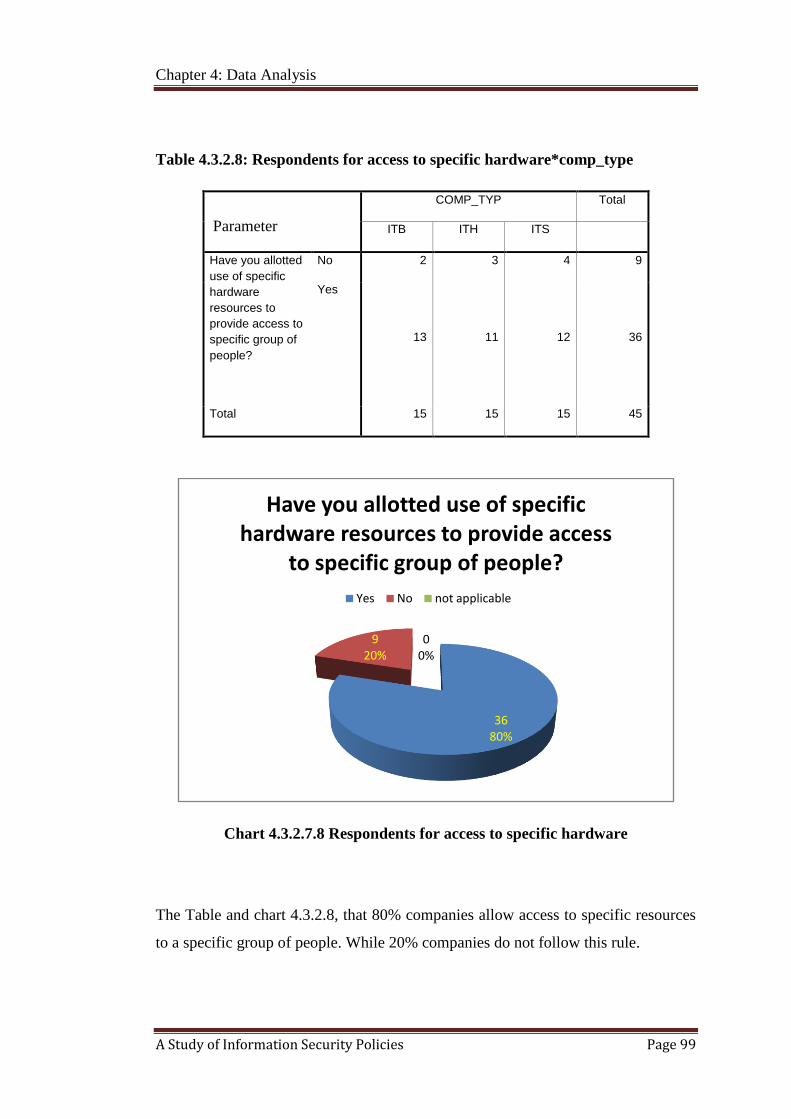
Table 4.3.2.8: Respondents for access to specific hardware*comp_type
Parameter
COMP_TYP Total
ITB ITH ITS
Have you allotted
use of specific
hardware
resources to
provide access to
specific group of
people?
No 2 3 4 9
Yes
13 11 12 36
Total 15 15 15 45
Chart 4.3.2.7.8 Respondents for access to specific hardware
The Table and chart 4.3.2.8, that 80% companies allow access to specific resources
to a specific group of people. While 20% companies do not follow this rule.
3680%
920%
00%
Have you allotted use of specific hardware resources to provide access
to specific group of people?
Yes No not applicable
Chapter 4: Data Analysis
A Study of Information Security Policies Page 100
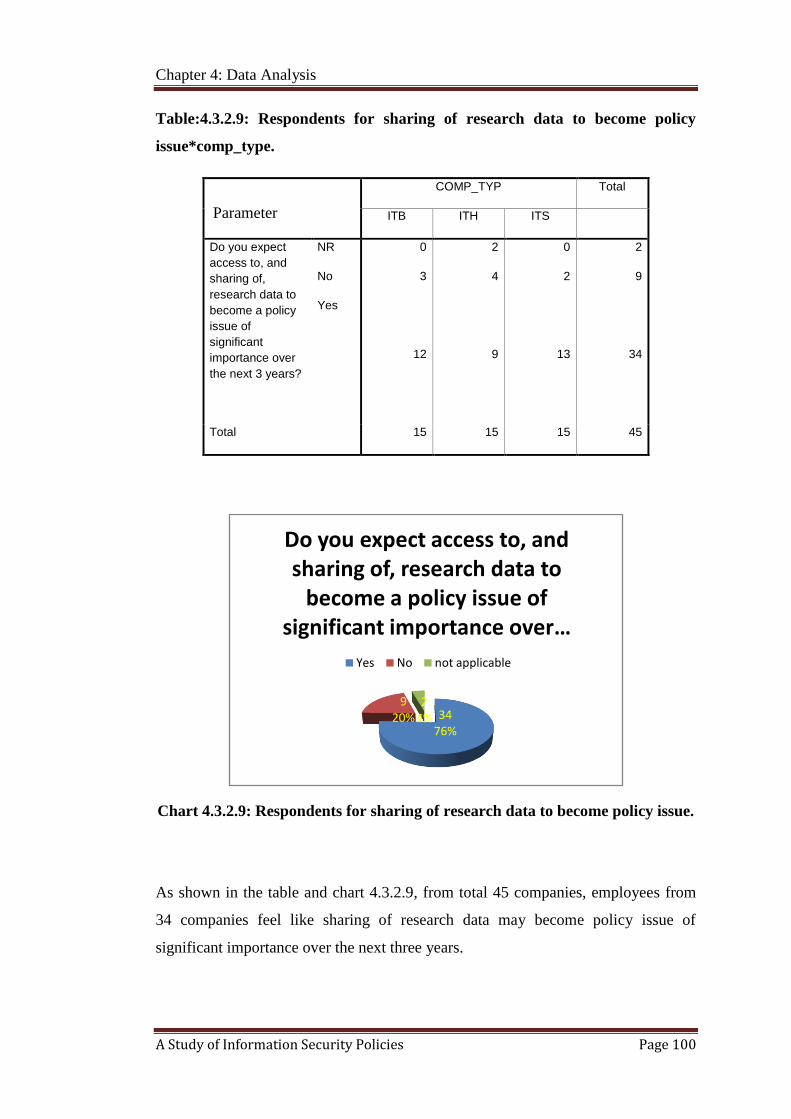
Table:4.3.2.9: Respondents for sharing of research data to become policy
issue*comp_type.
Parameter
COMP_TYP Total
ITB ITH ITS
Do you expect
access to, and
sharing of,
research data to
become a policy
issue of
significant
importance over
the next 3 years?
NR 0 2 0 2
No 3 4 2 9
Yes
12 9 13 34
Total 15 15 15 45
Chart 4.3.2.9: Respondents for sharing of research data to become policy issue.
As shown in the table and chart 4.3.2.9, from total 45 companies, employees from
34 companies feel like sharing of research data may become policy issue of
significant importance over the next three years.
3476%
920%
24%
Do you expect access to, and sharing of, research data to
become a policy issue of significant importance over …
Yes No not applicable
Chapter 4: Data Analysis
A Study of Information Security Policies Page 101
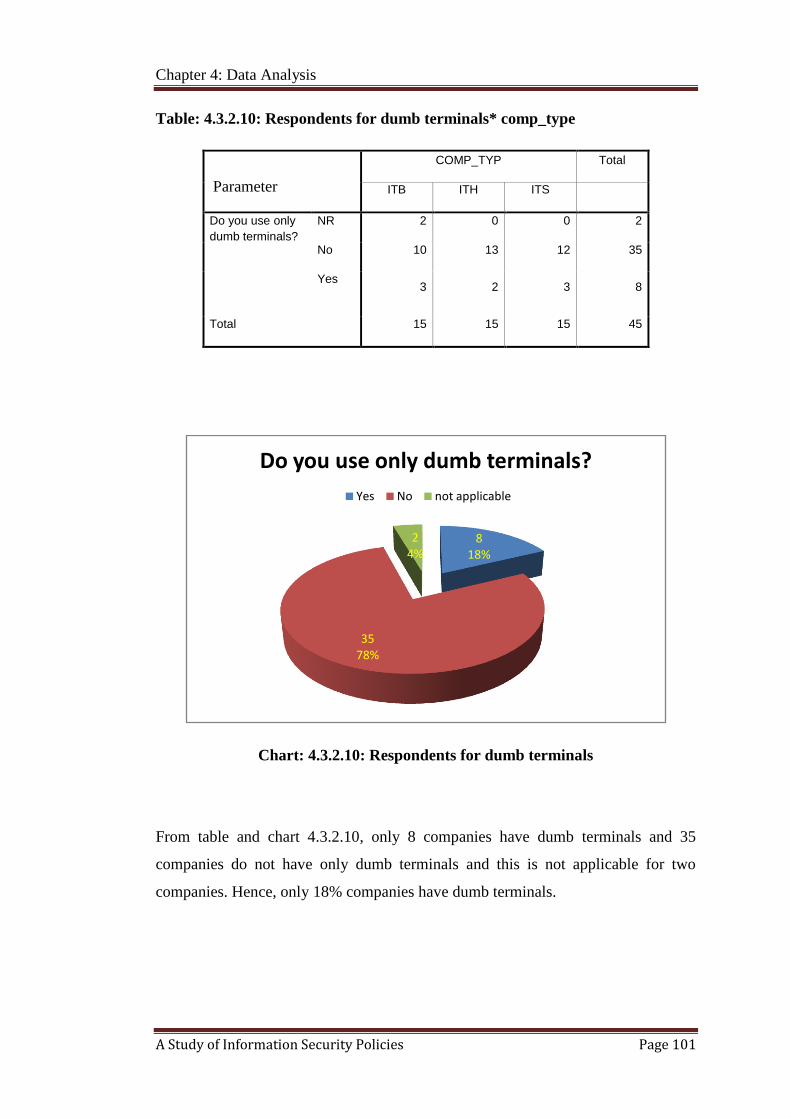
Table: 4.3.2.10: Respondents for dumb terminals* comp_type
Parameter
COMP_TYP Total
ITB ITH ITS
Do you use only
dumb terminals?
NR 2 0 0 2
No 10 13 12 35
Yes 3 2 3 8
Total 15 15 15 45
Chart: 4.3.2.10: Respondents for dumb terminals
From table and chart 4.3.2.10, only 8 companies have dumb terminals and 35
companies do not have only dumb terminals and this is not applicable for two
companies. Hence, only 18% companies have dumb terminals.
818%
3578%
24%
Do you use only dumb terminals?
Yes No not applicable
Chapter 4: Data Analysis
A Study of Information Security Policies Page 102
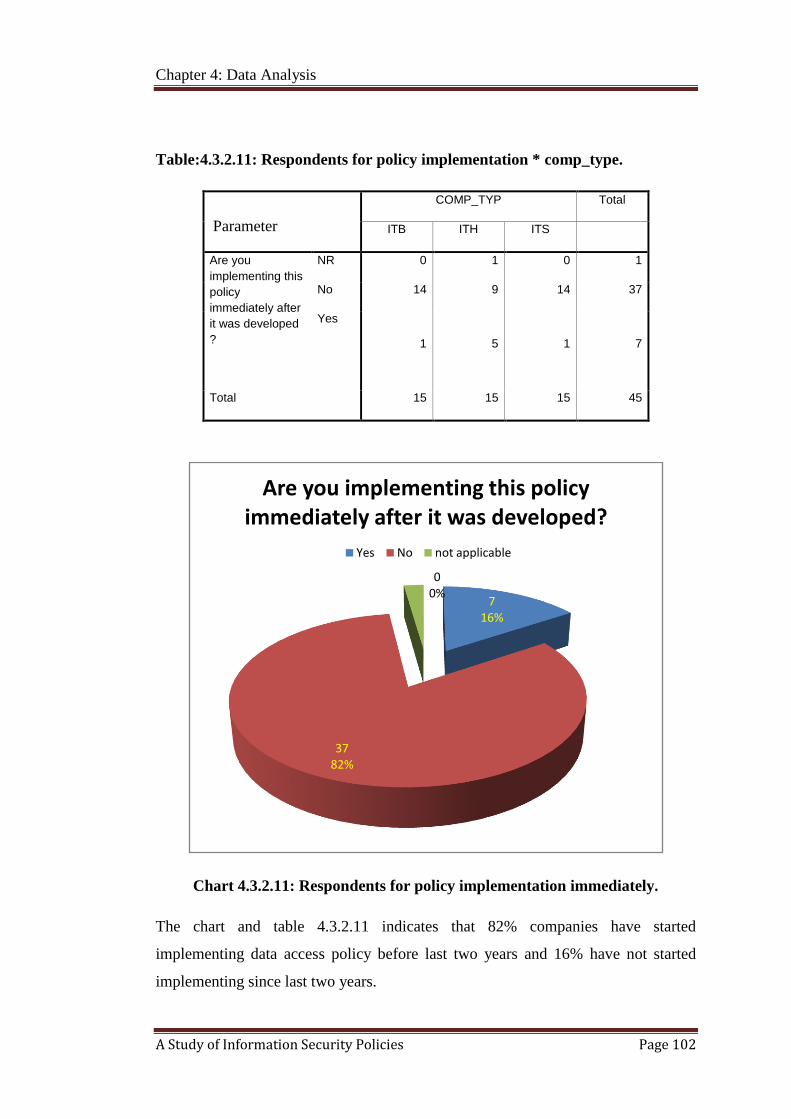
Table:4.3.2.11: Respondents for policy implementation * comp_type.
Parameter
COMP_TYP Total
ITB ITH ITS
Are you
implementing this
policy
immediately after
it was developed
?
NR 0 1 0 1
No 14 9 14 37
Yes
1 5 1 7
Total 15 15 15 45
Chart 4.3.2.11: Respondents for policy implementation immediately.
The chart and table 4.3.2.11 indicates that 82% companies have started
implementing data access policy before last two years and 16% have not started
implementing since last two years.
716%
3782%
00%
Are you implementing this policy immediately after it was developed?
Yes No not applicable
Chapter 4: Data Analysis
A Study of Information Security Policies Page 103
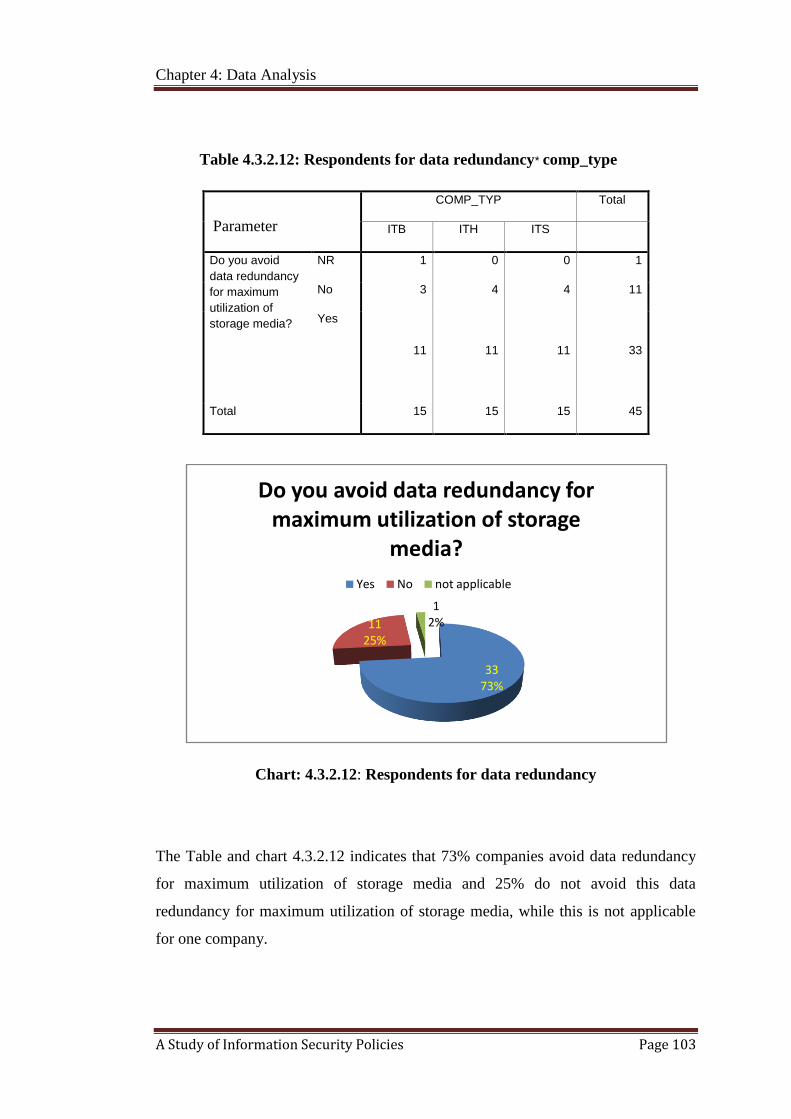
Table 4.3.2.12: Respondents for data redundancy* comp_type
Parameter
COMP_TYP Total
ITB ITH ITS
Do you avoid
data redundancy
for maximum
utilization of
storage media?
NR 1 0 0 1
No 3 4 4 11
Yes
11 11 11 33
Total 15 15 15 45
Chart: 4.3.2.12: Respondents for data redundancy
The Table and chart 4.3.2.12 indicates that 73% companies avoid data redundancy
for maximum utilization of storage media and 25% do not avoid this data
redundancy for maximum utilization of storage media, while this is not applicable
for one company.
3373%
1125%
12%
Do you avoid data redundancy for maximum utilization of storage
media?
Yes No not applicable
Chapter 4: Data Analysis
A Study of Information Security Policies Page 104
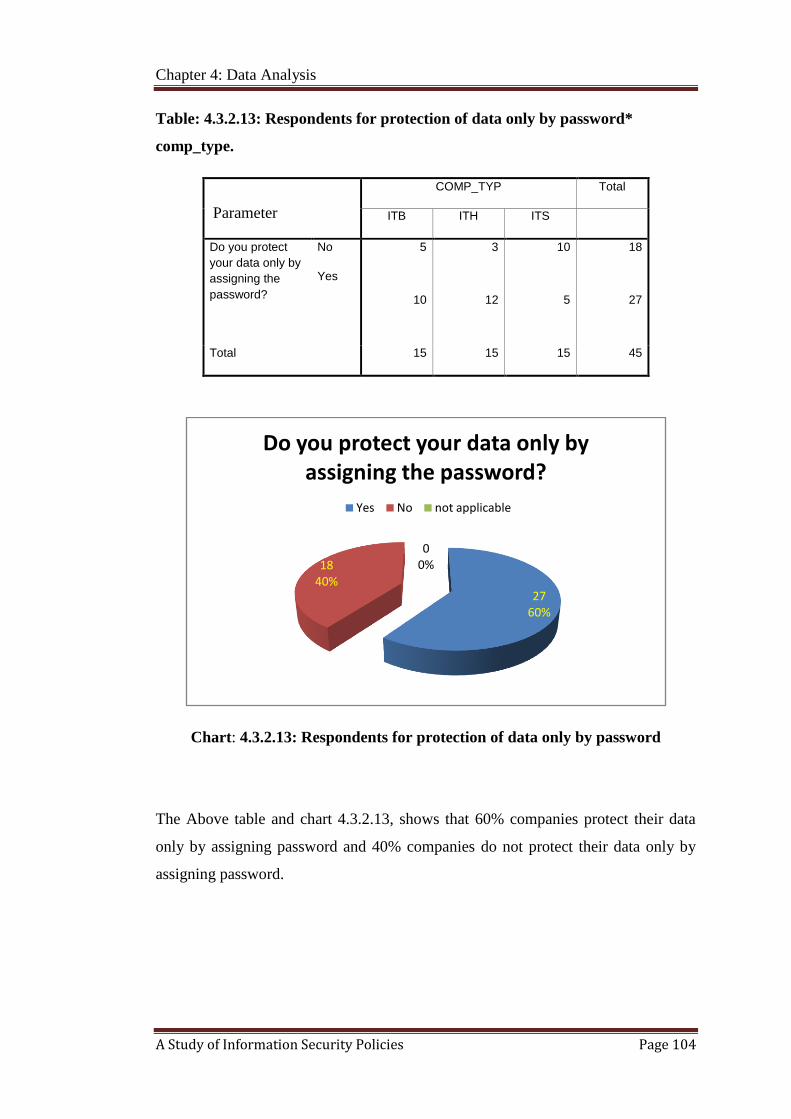
Table: 4.3.2.13: Respondents for protection of data only by password*
comp_type.
Parameter
COMP_TYP Total
ITB ITH ITS
Do you protect
your data only by
assigning the
password?
No 5 3 10 18
Yes
10 12 5 27
Total 15 15 15 45
Chart: 4.3.2.13: Respondents for protection of data only by password
The Above table and chart 4.3.2.13, shows that 60% companies protect their data
only by assigning password and 40% companies do not protect their data only by
assigning password.
2760%
1840%
00%
Do you protect your data only by assigning the password?
Yes No not applicable
Chapter 4: Data Analysis
A Study of Information Security Policies Page 105
4.3.3: DOMAIN 3: Physical Access Policy
This policy addresses physical protection of resources including employees,
hardware and supporting system elements with control of information in all states
including storage, processing and transmission.
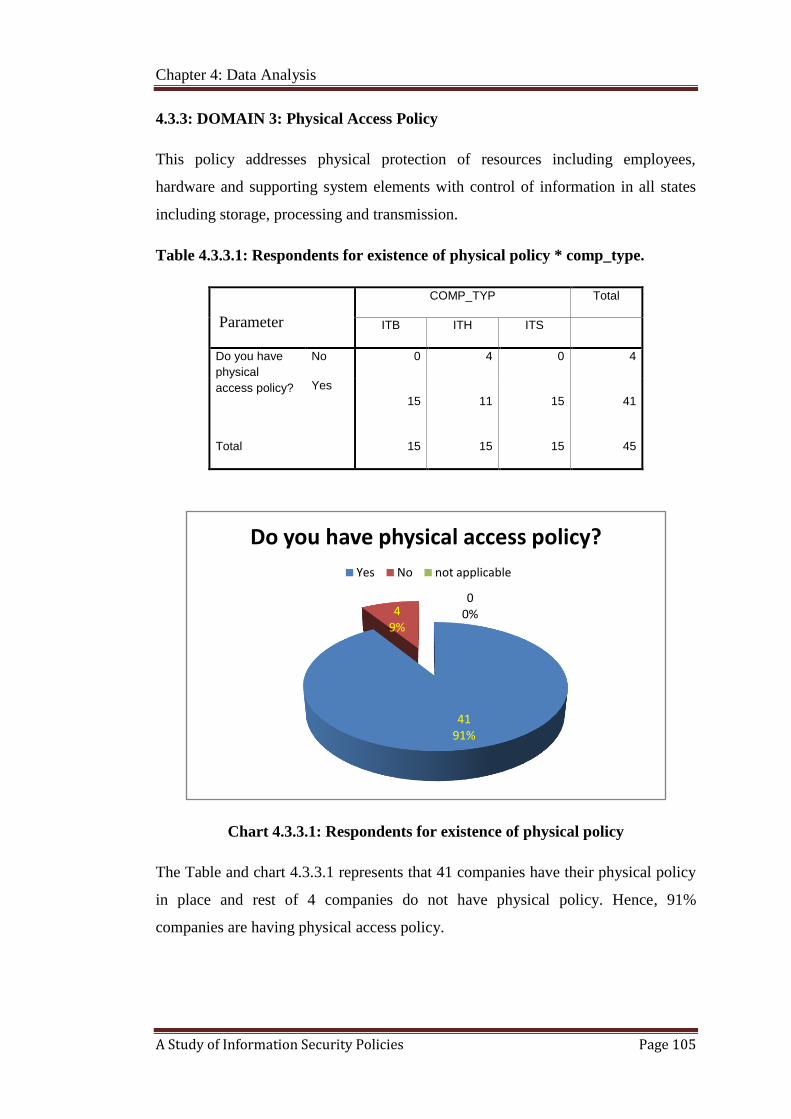
Table 4.3.3.1: Respondents for existence of physical policy * comp_type.
Parameter
COMP_TYP Total
ITB ITH ITS
Do you have
physical
access policy?
No 0 4 0 4
Yes
15 11 15 41
Total 15 15 15 45
Chart 4.3.3.1: Respondents for existence of physical policy
The Table and chart 4.3.3.1 represents that 41 companies have their physical policy
in place and rest of 4 companies do not have physical policy. Hence, 91%
companies are having physical access policy.
4191%
49%
00%
Do you have physical access policy?
Yes No not applicable

Chapter 4: Data Analysis
A Study of Information Security Policies Page 106
Table 4.3.3.2: Respondents for use of Identity card at the entry*comp_type.
Parameter
COMP_TYP Total
ITB ITH ITS
Do you use
identity card at
entry of the
gate or door?
No 0 4 0 4
Yes
15 11 15 41
Total 15 15 15 45
Chart 4.3.3.2: Respondents for use of Identity card at the entry.
From the table and chart 4.3.3.2 it shows that 41 companies follow the use of
identity card at the entrance and 4 companies do not follow this. This means that
91% companies uses identity card at the entry.
4191%
49%
00%
Do you use identity card at entry of the gate or door?
Yes No not applicable
Chapter 4: Data Analysis
A Study of Information Security Policies Page 107
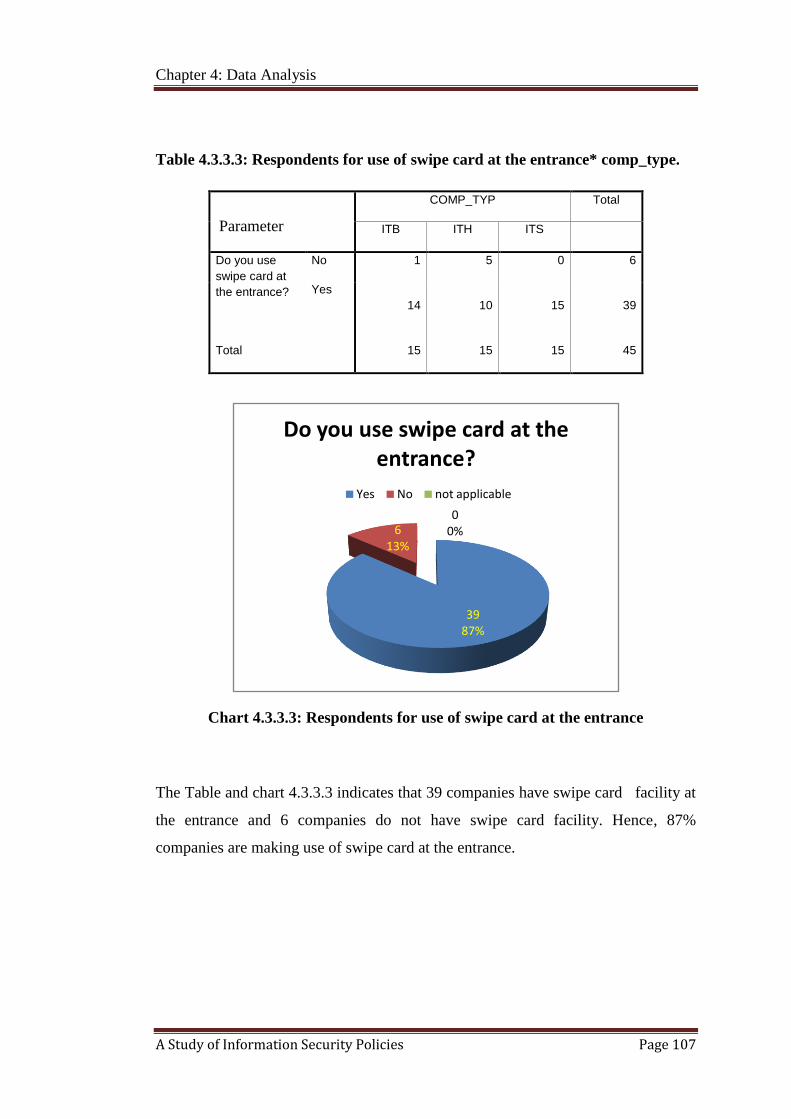
Table 4.3.3.3: Respondents for use of swipe card at the entrance* comp_type.
Parameter
COMP_TYP Total
ITB ITH ITS
Do you use
swipe card at
the entrance?
No 1 5 0 6
Yes
14 10 15 39
Total 15 15 15 45
Chart 4.3.3.3: Respondents for use of swipe card at the entrance
The Table and chart 4.3.3.3 indicates that 39 companies have swipe card facility at
the entrance and 6 companies do not have swipe card facility. Hence, 87%
companies are making use of swipe card at the entrance.
3987%
613%
00%
Do you use swipe card at the entrance?
Yes No not applicable
Chapter 4: Data Analysis
A Study of Information Security Policies Page 108
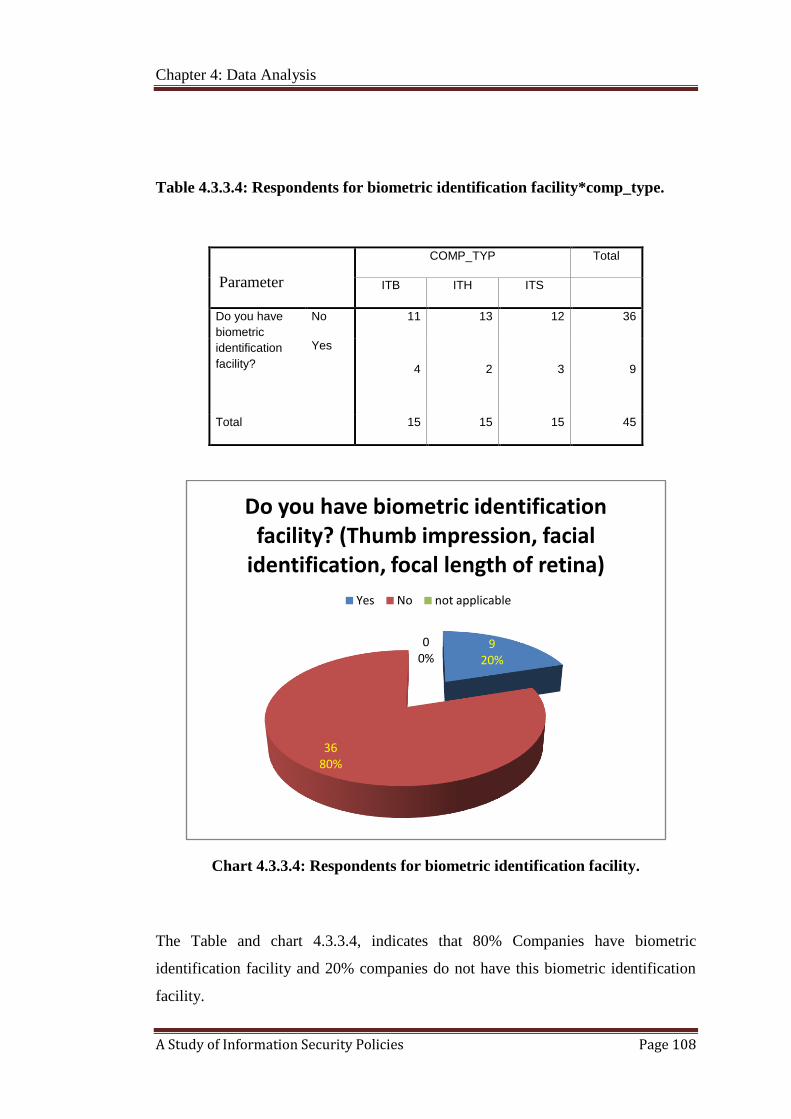
Table 4.3.3.4: Respondents for biometric identification facility*comp_type.
Parameter
COMP_TYP Total
ITB ITH ITS
Do you have
biometric
identification
facility?
No 11 13 12 36
Yes
4 2 3 9
Total 15 15 15 45
Chart 4.3.3.4: Respondents for biometric identification facility.
The Table and chart 4.3.3.4, indicates that 80% Companies have biometric
identification facility and 20% companies do not have this biometric identification
facility.
920%
3680%
00%
Do you have biometric identification facility? (Thumb impression, facial
identification, focal length of retina)
Yes No not applicable
Chapter 4: Data Analysis
A Study of Information Security Policies Page 109
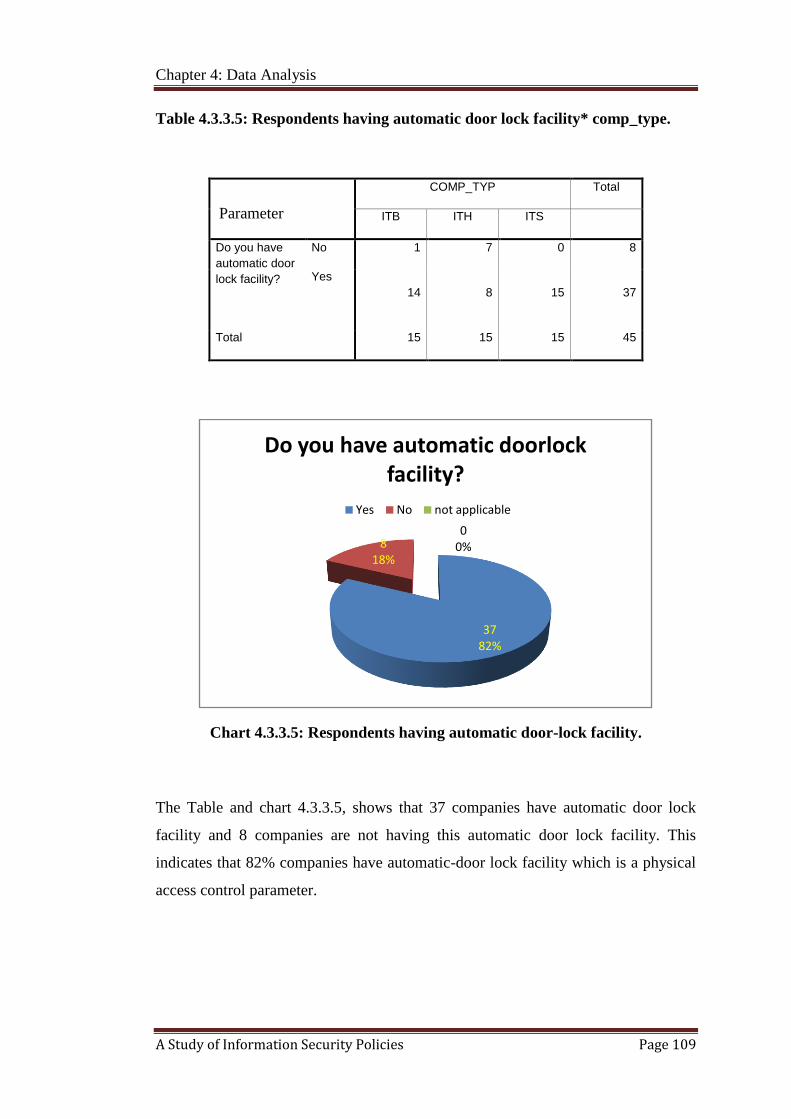
Table 4.3.3.5: Respondents having automatic door lock facility* comp_type.
Parameter
COMP_TYP Total
ITB ITH ITS
Do you have
automatic door
lock facility?
No 1 7 0 8
Yes
14 8 15 37
Total 15 15 15 45
Chart 4.3.3.5: Respondents having automatic door-lock facility.
The Table and chart 4.3.3.5, shows that 37 companies have automatic door lock
facility and 8 companies are not having this automatic door lock facility. This
indicates that 82% companies have automatic-door lock facility which is a physical
access control parameter.
3782%
818%
00%
Do you have automatic doorlock facility?
Yes No not applicable
Chapter 4: Data Analysis
A Study of Information Security Policies Page 110
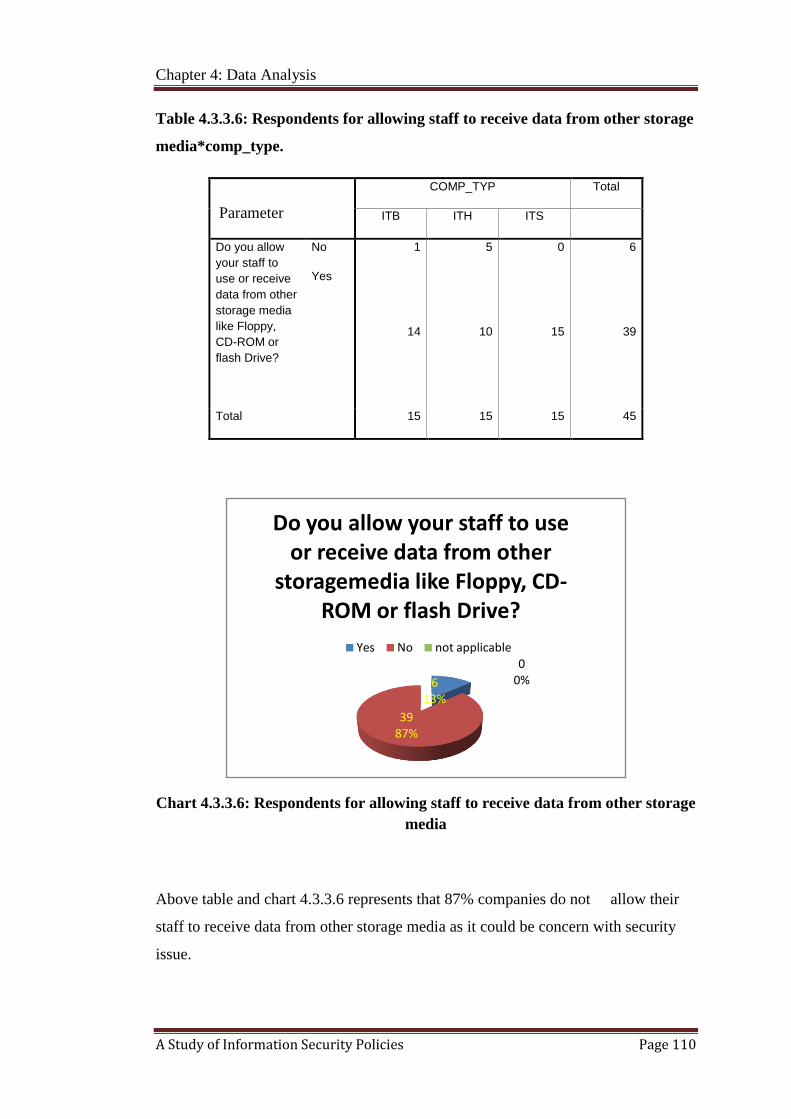
Table 4.3.3.6: Respondents for allowing staff to receive data from other storage
media*comp_type.
Parameter
COMP_TYP Total
ITB ITH ITS
Do you allow
your staff to
use or receive
data from other
storage media
like Floppy,
CD-ROM or
flash Drive?
No 1 5 0 6
Yes
14 10 15 39
Total 15 15 15 45
Chart 4.3.3.6: Respondents for allowing staff to receive data from other storage
media
Above table and chart 4.3.3.6 represents that 87% companies do not allow their
staff to receive data from other storage media as it could be concern with security
issue.
613%
3987%
00%
Do you allow your staff to use or receive data from other
storagemedia like Floppy, CD-ROM or flash Drive?
Yes No not applicable
Chapter 4: Data Analysis
A Study of Information Security Policies Page 111
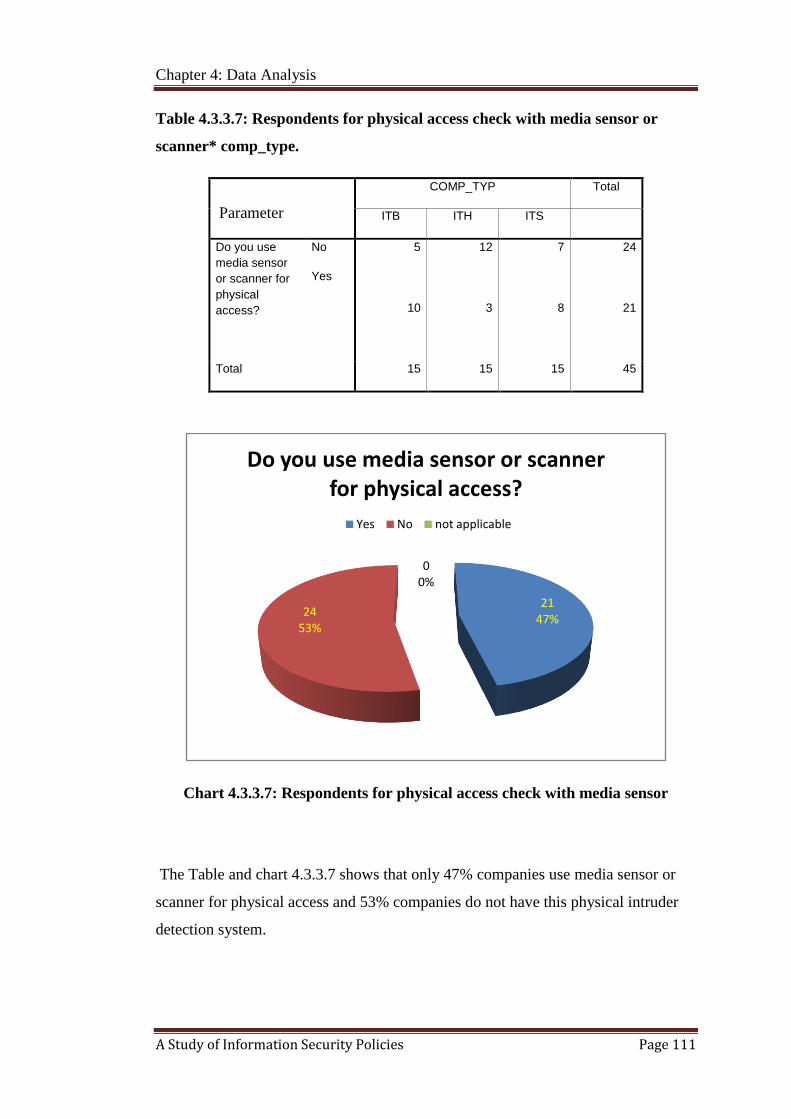
Table 4.3.3.7: Respondents for physical access check with media sensor or
scanner* comp_type.
Parameter
COMP_TYP Total
ITB ITH ITS
Do you use
media sensor
or scanner for
physical
access?
No 5 12 7 24
Yes
10 3 8 21
Total 15 15 15 45
Chart 4.3.3.7: Respondents for physical access check with media sensor
The Table and chart 4.3.3.7 shows that only 47% companies use media sensor or
scanner for physical access and 53% companies do not have this physical intruder
detection system.
2147%
2453%
00%
Do you use media sensor or scanner for physical access?
Yes No not applicable
Chapter 4: Data Analysis
A Study of Information Security Policies Page 112
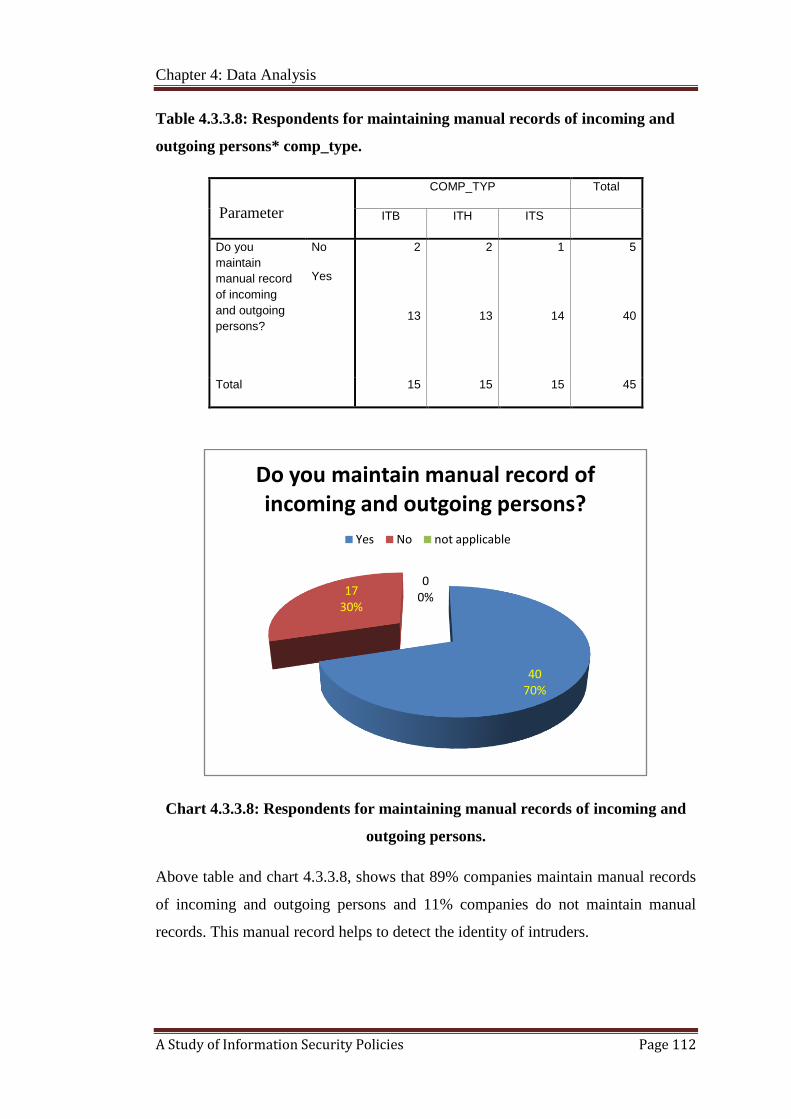
Table 4.3.3.8: Respondents for maintaining manual records of incoming and
outgoing persons* comp_type.
Parameter
COMP_TYP Total
ITB ITH ITS
Do you
maintain
manual record
of incoming
and outgoing
persons?
No 2 2 1 5
Yes
13 13 14 40
Total 15 15 15 45
Chart 4.3.3.8: Respondents for maintaining manual records of incoming and
outgoing persons.
Above table and chart 4.3.3.8, shows that 89% companies maintain manual records
of incoming and outgoing persons and 11% companies do not maintain manual
records. This manual record helps to detect the identity of intruders.
4070%
1730%
00%
Do you maintain manual record of incoming and outgoing persons?
Yes No not applicable

Chapter 4: Data Analysis
A Study of Information Security Policies Page 113
Table 4.3.3.9: Respondents showing resistance from their side * comp_type.
Parameter
COMP_TYP Total
ITB ITH ITS
Was there any
resistance from
the users?
NR 1 0 1 2
No 13 15 13 41
Yes
1 0 1 2
Total 15 15 15 45
Chart 4.3.3.9: Respondents showing resistance from their side.
The Table and chart 4.3.3.9 shows that 91% companies have not faced with any
resistance from employees side while implementing this policy and 5% companies
have faced resistance from the employee’s side and there was no response from
remaining 4% companies.
25%
4191%
24%
Was there any resistance from the users?
Yes No not applicable
Chapter 4: Data Analysis
A Study of Information Security Policies Page 114
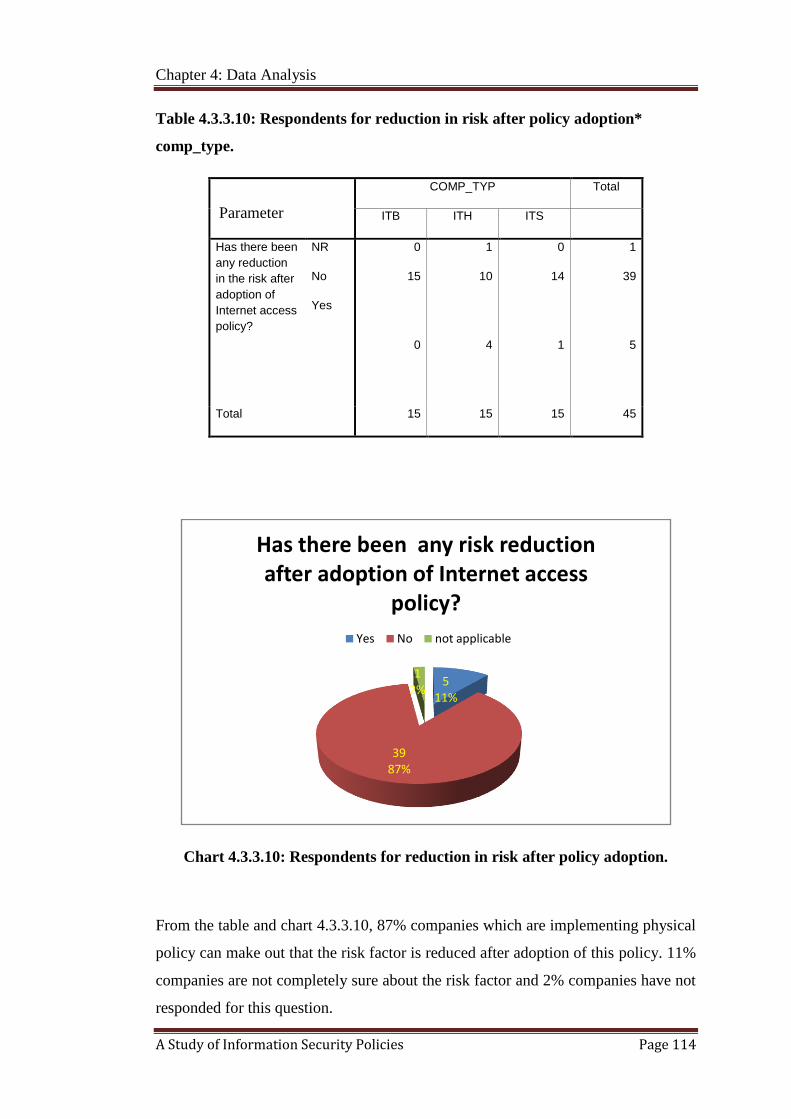
Table 4.3.3.10: Respondents for reduction in risk after policy adoption*
comp_type.
Parameter
COMP_TYP Total
ITB ITH ITS
Has there been
any reduction
in the risk after
adoption of
Internet access
policy?
NR 0 1 0 1
No 15 10 14 39
Yes
0 4 1 5
Total 15 15 15 45
Chart 4.3.3.10: Respondents for reduction in risk after policy adoption.
From the table and chart 4.3.3.10, 87% companies which are implementing physical
policy can make out that the risk factor is reduced after adoption of this policy. 11%
companies are not completely sure about the risk factor and 2% companies have not
responded for this question.
511%
3987%
12%
Has there been any risk reduction after adoption of Internet access
policy?
Yes No not applicable
Chapter 4: Data Analysis
A Study of Information Security Policies Page 115
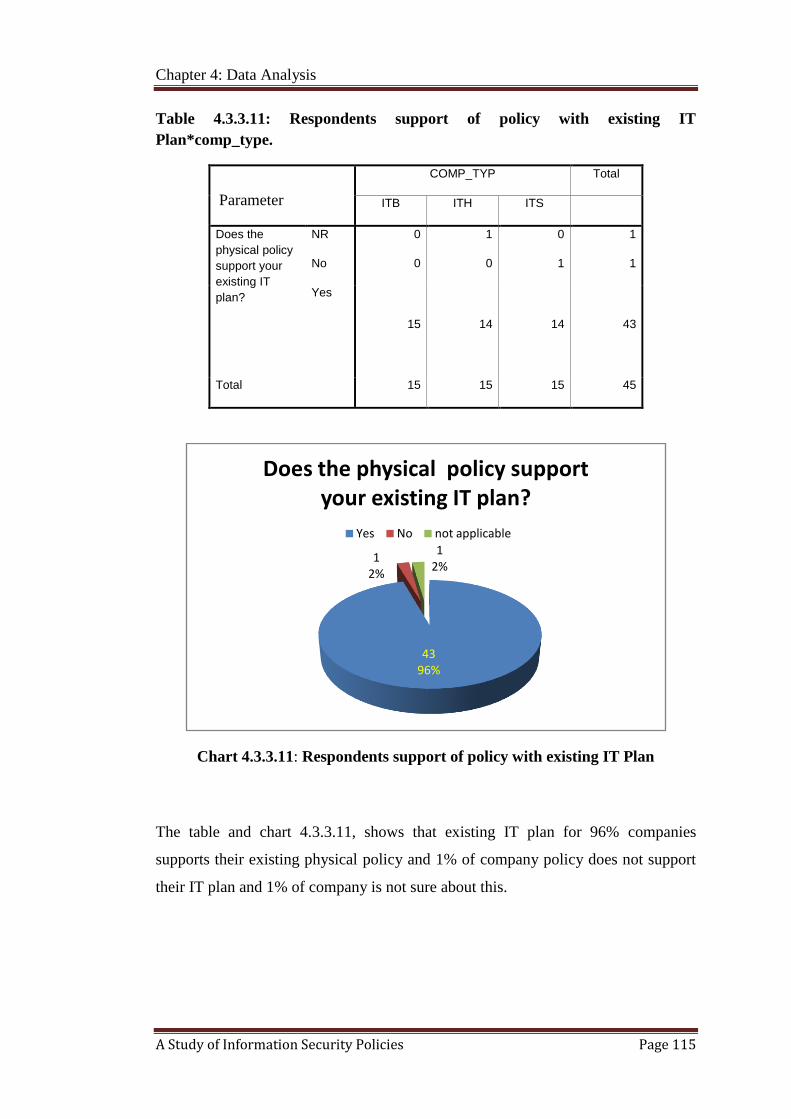
Table 4.3.3.11: Respondents support of policy with existing IT
Plan*comp_type.
Parameter
COMP_TYP Total
ITB ITH ITS
Does the
physical policy
support your
existing IT
plan?
NR 0 1 0 1
No 0 0 1 1
Yes
15 14 14 43
Total 15 15 15 45
Chart 4.3.3.11: Respondents support of policy with existing IT Plan
The table and chart 4.3.3.11, shows that existing IT plan for 96% companies
supports their existing physical policy and 1% of company policy does not support
their IT plan and 1% of company is not sure about this.
4396%
12%
12%
Does the physical policy support your existing IT plan?
Yes No not applicable
Chapter 4: Data Analysis
A Study of Information Security Policies Page 116
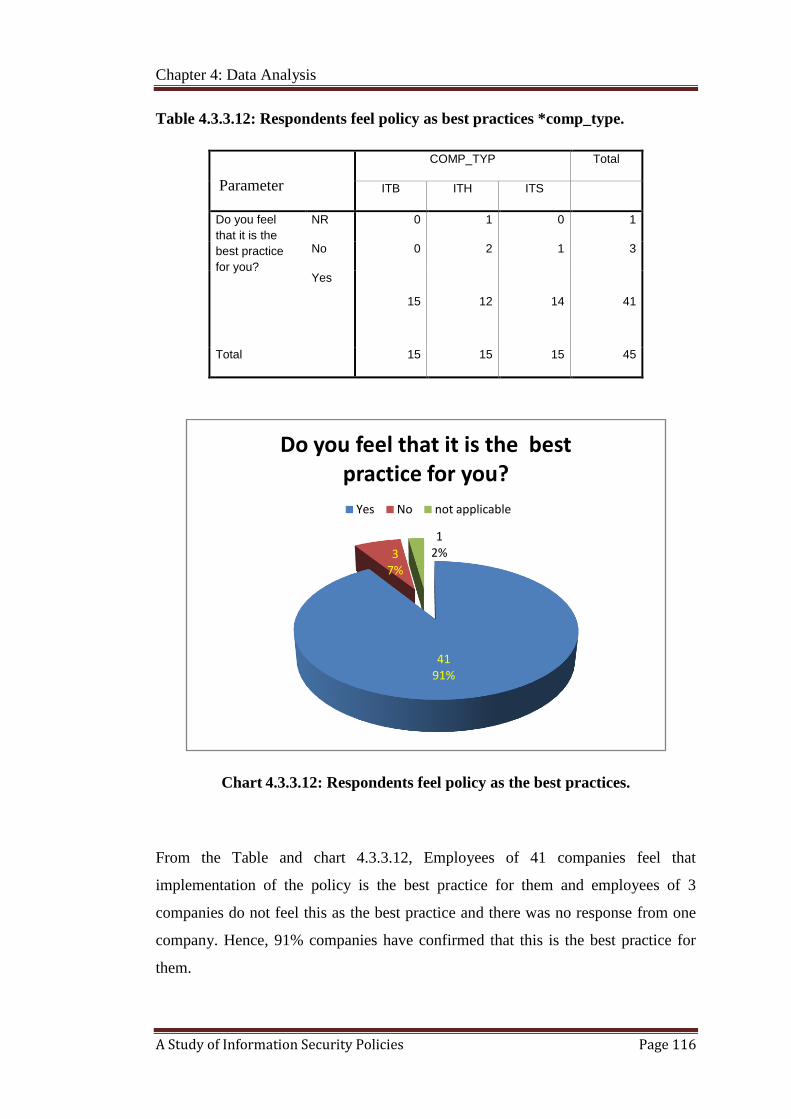
Table 4.3.3.12: Respondents feel policy as best practices *comp_type.
Parameter
COMP_TYP Total
ITB ITH ITS
Do you feel
that it is the
best practice
for you?
NR 0 1 0 1
No 0 2 1 3
Yes
15 12 14 41
Total 15 15 15 45
Chart 4.3.3.12: Respondents feel policy as the best practices.
From the Table and chart 4.3.3.12, Employees of 41 companies feel that
implementation of the policy is the best practice for them and employees of 3
companies do not feel this as the best practice and there was no response from one
company. Hence, 91% companies have confirmed that this is the best practice for
them.
4191%
37%
12%
Do you feel that it is the best practice for you?
Yes No not applicable
Chapter 4: Data Analysis
A Study of Information Security Policies Page 117
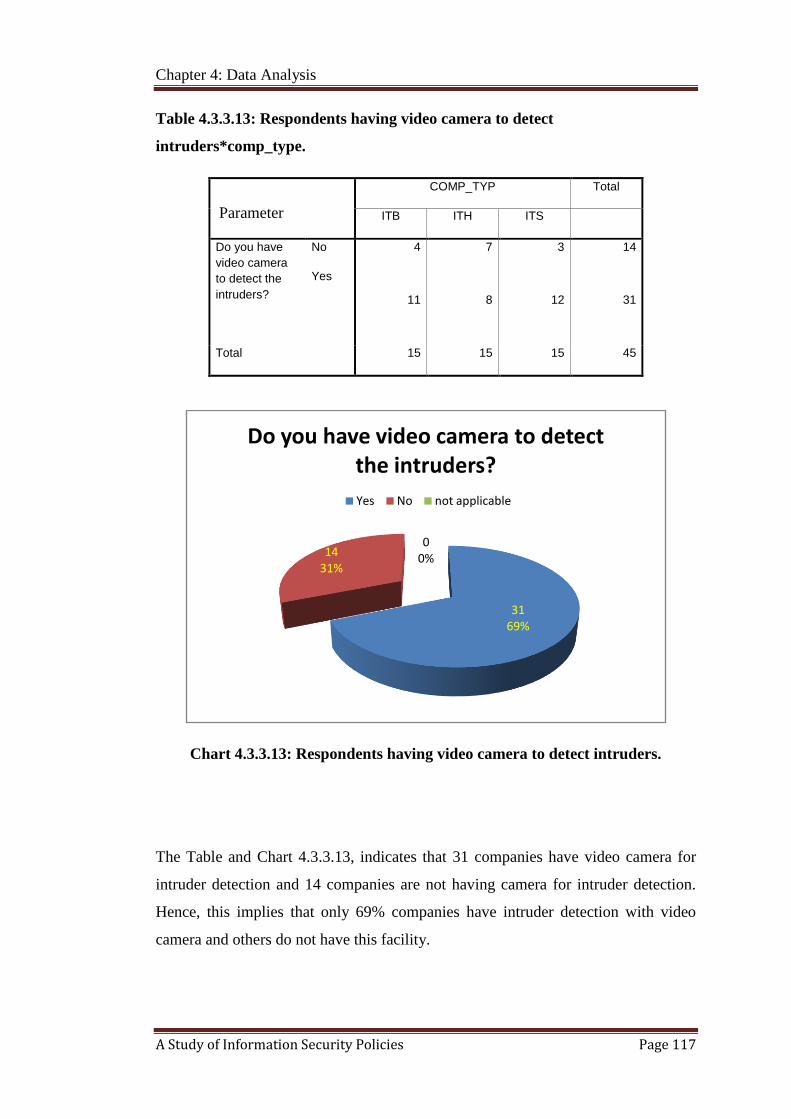
Table 4.3.3.13: Respondents having video camera to detect
intruders*comp_type.
Parameter
COMP_TYP Total
ITB ITH ITS
Do you have
video camera
to detect the
intruders?
No 4 7 3 14
Yes
11 8 12 31
Total 15 15 15 45
Chart 4.3.3.13: Respondents having video camera to detect intruders.
The Table and Chart 4.3.3.13, indicates that 31 companies have video camera for
intruder detection and 14 companies are not having camera for intruder detection.
Hence, this implies that only 69% companies have intruder detection with video
camera and others do not have this facility.
3169%
1431%
00%
Do you have video camera to detect the intruders?
Yes No not applicable
Chapter 4: Data Analysis
A Study of Information Security Policies Page 118
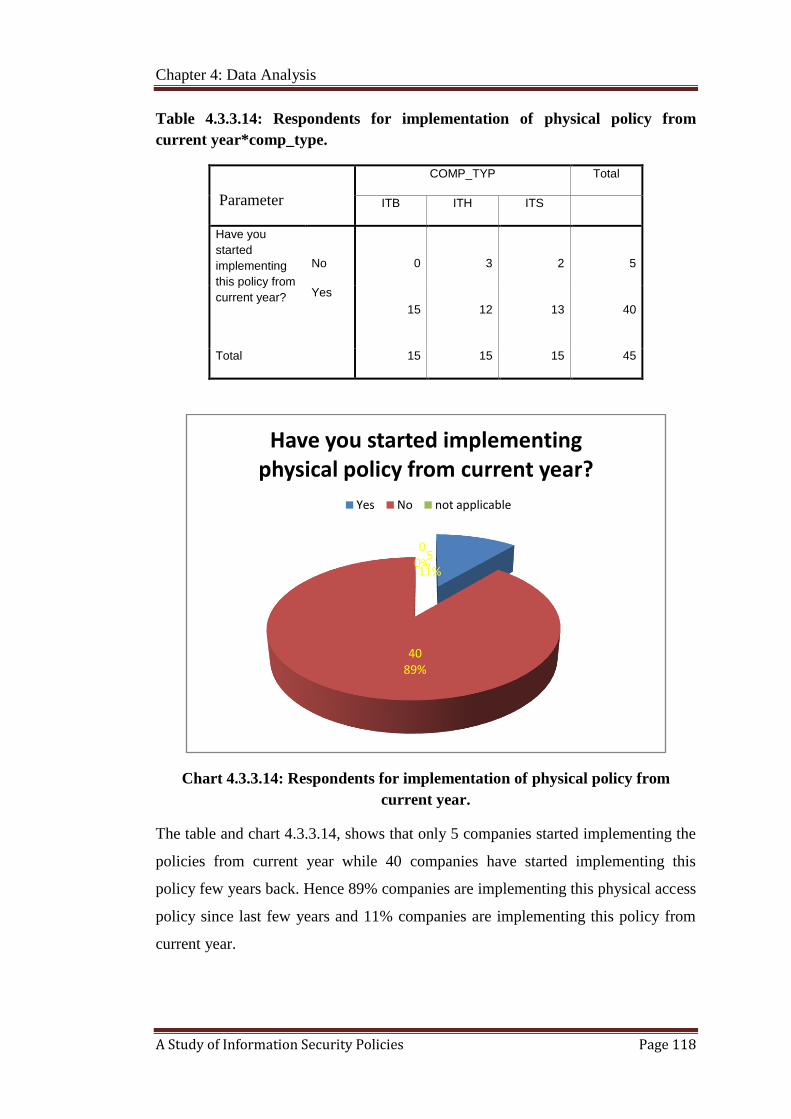
Table 4.3.3.14: Respondents for implementation of physical policy from
current year*comp_type.
Parameter
COMP_TYP Total
ITB ITH ITS
Have you
started
implementing
this policy from
current year?
No 0 3 2 5
Yes
15 12 13 40
Total 15 15 15 45
Chart 4.3.3.14: Respondents for implementation of physical policy from
current year.
The table and chart 4.3.3.14, shows that only 5 companies started implementing the
policies from current year while 40 companies have started implementing this
policy few years back. Hence 89% companies are implementing this physical access
policy since last few years and 11% companies are implementing this policy from
current year.
511%
4089%
00%
Have you started implementing physical policy from current year?
Yes No not applicable
Chapter 4: Data Analysis
A Study of Information Security Policies Page 119
4.3.4: DONAIN 4: INTERNET ACCESS POLICY
This Internet access policy covers the issues related to existence of policy, training,
implementation, and change in IT Plan, 24-hrs Internet access, subscription for
specific sites, and access to specific sites.
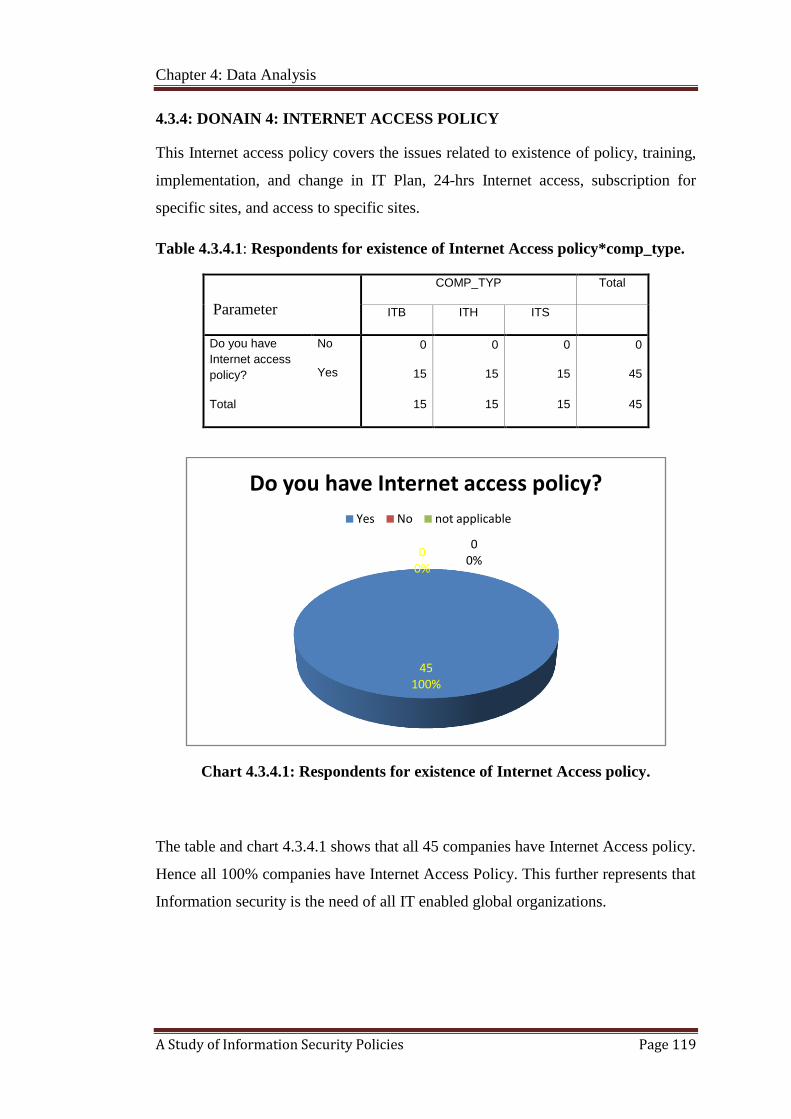
Table 4.3.4.1: Respondents for existence of Internet Access policy*comp_type.
Parameter
COMP_TYP Total
ITB ITH ITS
Do you have
Internet access
policy?
No
Yes
0
15
0
15
0
15
0
45
Total 15 15 15 45
Chart 4.3.4.1: Respondents for existence of Internet Access policy.
The table and chart 4.3.4.1 shows that all 45 companies have Internet Access policy.
Hence all 100% companies have Internet Access Policy. This further represents that
Information security is the need of all IT enabled global organizations.
45100%
00%
00%
Do you have Internet access policy?
Yes No not applicable
Chapter 4: Data Analysis
A Study of Information Security Policies Page 120
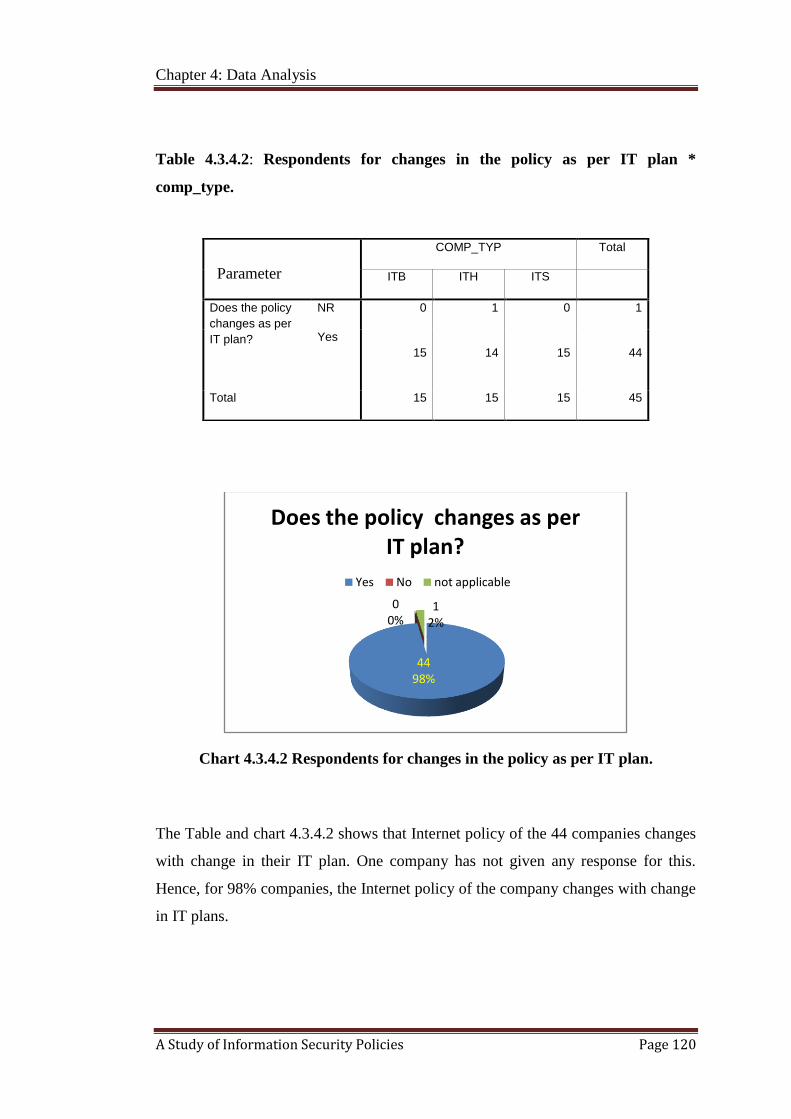
Table 4.3.4.2: Respondents for changes in the policy as per IT plan *
comp_type.
Chart 4.3.4.2 Respondents for changes in the policy as per IT plan.
The Table and chart 4.3.4.2 shows that Internet policy of the 44 companies changes
with change in their IT plan. One company has not given any response for this.
Hence, for 98% companies, the Internet policy of the company changes with change
in IT plans.
4498%
00%
12%
Does the policy changes as per IT plan?
Yes No not applicable
Parameter
COMP_TYP Total
ITB ITH ITS
Does the policy
changes as per
IT plan?
NR 0 1 0 1
Yes
15 14 15 44
Total 15 15 15 45
Chapter 4: Data Analysis
A Study of Information Security Policies Page 121
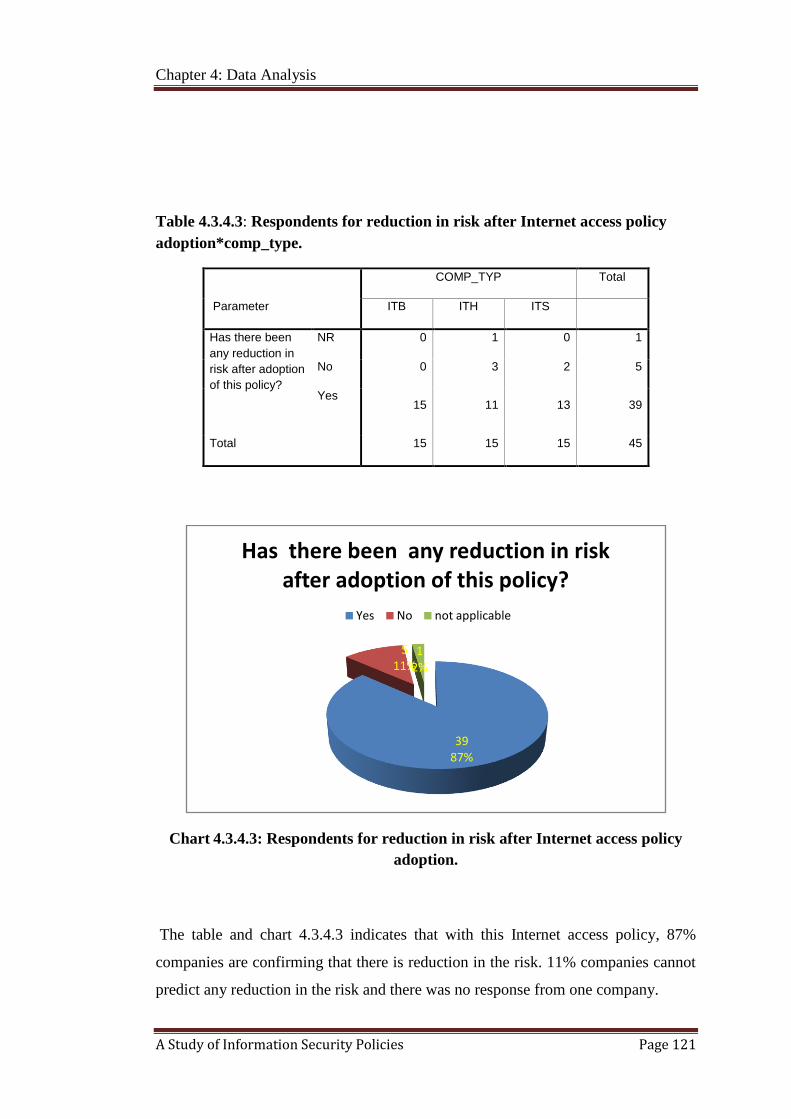
Table 4.3.4.3: Respondents for reduction in risk after Internet access policy
adoption*comp_type.
Parameter
COMP_TYP Total
ITB ITH ITS
Has there been
any reduction in
risk after adoption
of this policy?
NR 0 1 0 1
No 0 3 2 5
Yes 15 11 13 39
Total 15 15 15 45
Chart 4.3.4.3: Respondents for reduction in risk after Internet access policy
adoption.
The table and chart 4.3.4.3 indicates that with this Internet access policy, 87%
companies are confirming that there is reduction in the risk. 11% companies cannot
predict any reduction in the risk and there was no response from one company.
3987%
511%
12%
Has there been any reduction in risk after adoption of this policy?
Yes No not applicable
Chapter 4: Data Analysis
A Study of Information Security Policies Page 122
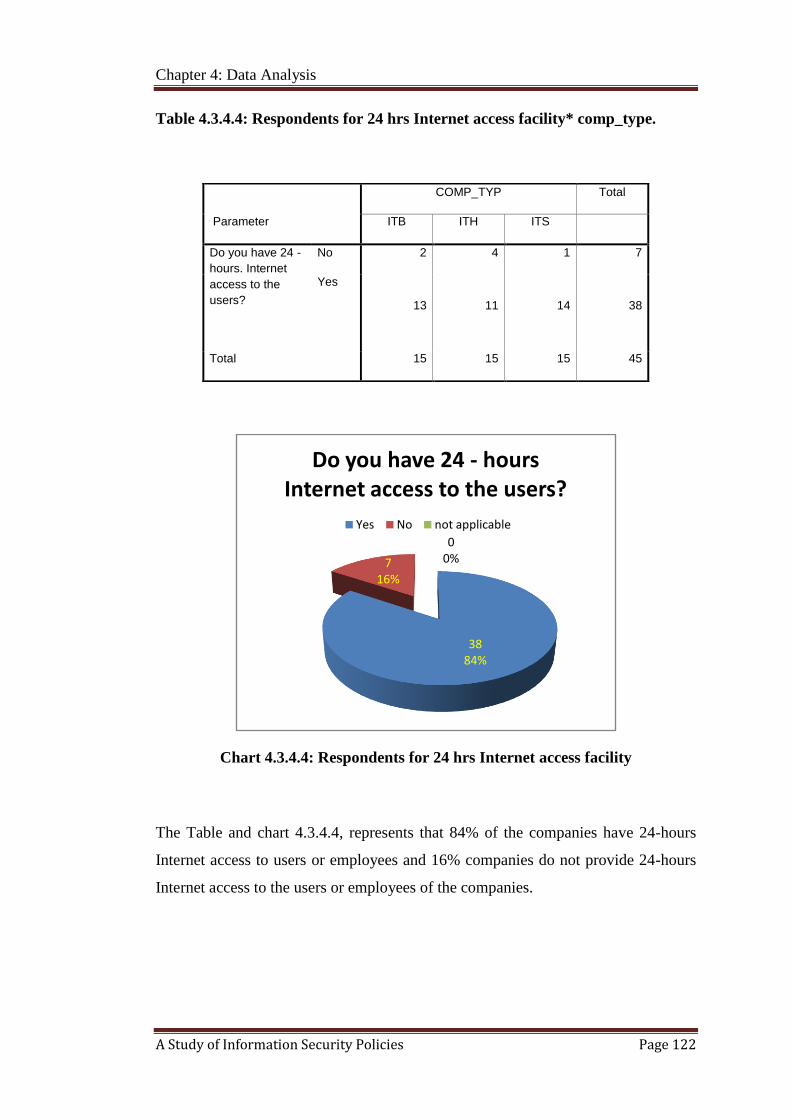
Table 4.3.4.4: Respondents for 24 hrs Internet access facility* comp_type.
Chart 4.3.4.4: Respondents for 24 hrs Internet access facility
The Table and chart 4.3.4.4, represents that 84% of the companies have 24-hours
Internet access to users or employees and 16% companies do not provide 24-hours
Internet access to the users or employees of the companies.
3884%
716%
00%
Do you have 24 - hours Internet access to the users?
Yes No not applicable
Parameter
COMP_TYP Total
ITB ITH ITS
Do you have 24 -
hours. Internet
access to the
users?
No 2 4 1 7
Yes
13 11 14 38
Total 15 15 15 45

Chapter 4: Data Analysis
A Study of Information Security Policies Page 123
Table 4.3.4.5: Respondents for access to specific sites* comp_type.
Parameter
COMP_TYP Total
ITB ITH ITS
Do you provide
access to the
specific sites?
No 0 5 1 6
Yes
15 10 14 39
Total 15 15 15 45
Chart 4.3.4.5: Respondents for access to specific sites.
The table and chart 4.3.4.5 shows that 87% companies provide access to specific
sites only and 13% companies have no restriction for access to specific sites. As the
access for the sites is restricted, it will help the companies to protect their
information.
3987%
613%
00%
Do you provide access to the specific sites?
Yes No not applicable
Chapter 4: Data Analysis
A Study of Information Security Policies Page 124
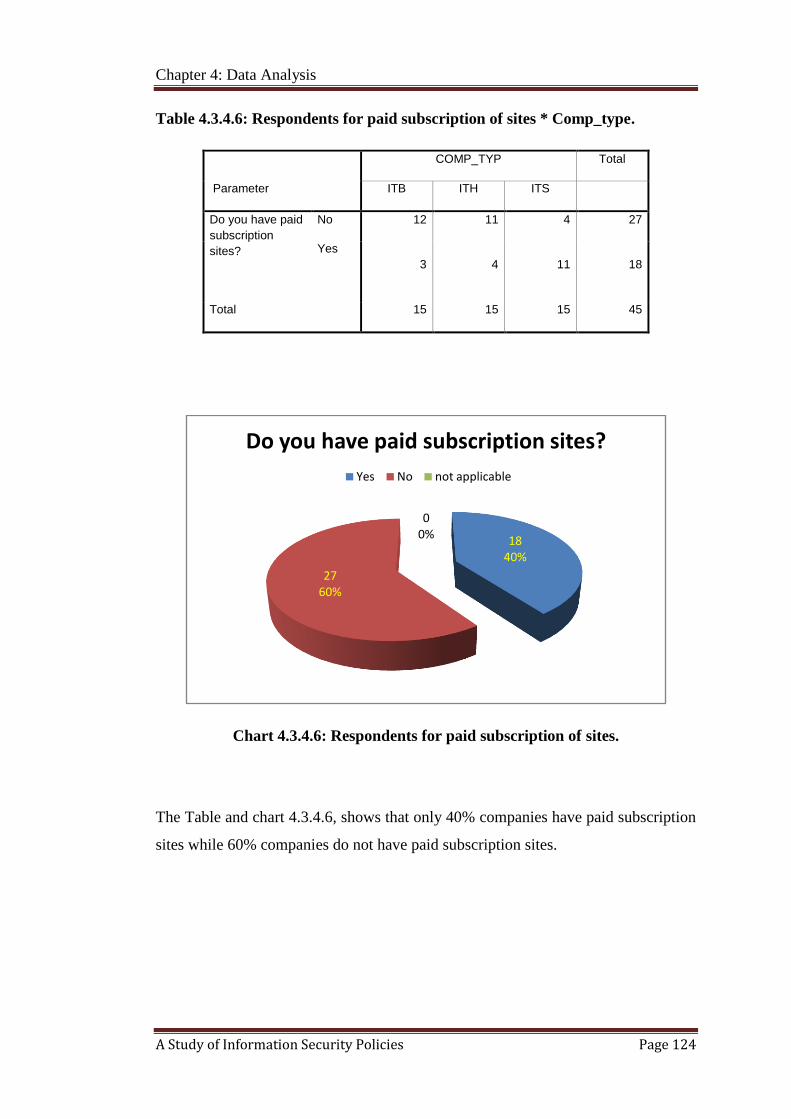
Table 4.3.4.6: Respondents for paid subscription of sites * Comp_type.
Parameter
COMP_TYP Total
ITB ITH ITS
Do you have paid
subscription
sites?
No 12 11 4 27
Yes
3 4 11 18
Total 15 15 15 45
Chart 4.3.4.6: Respondents for paid subscription of sites.
The Table and chart 4.3.4.6, shows that only 40% companies have paid subscription
sites while 60% companies do not have paid subscription sites.
1840%
2760%
00%
Do you have paid subscription sites?
Yes No not applicable

Chapter 4: Data Analysis
A Study of Information Security Policies Page 125
Table 4.3.4.7: Respondents using proxy server* comp_ type.
Parameter
COMP_TYP Total
ITB ITH ITS
Do you have a
proxy server
installed on your
network?
NR 0 1 1 2
No 4 6 1 11
Yes
11 8 13 32
Total 15 15 15 45
Chart 4.3.4.7: Respondents using a proxy server.
Table and Chart 4.3.3.7, shows that there are 32 companies which have installed a
proxy server and 11 companies do not have this proxy server installed on their
network. There is no. response from rest of the two companies. Hence 71%
companies have installed proxy server on their network.
3271%
1124%
25%
Do you have a proxy server installed on your network?
Yes No not applicable
Chapter 4: Data Analysis
A Study of Information Security Policies Page 126
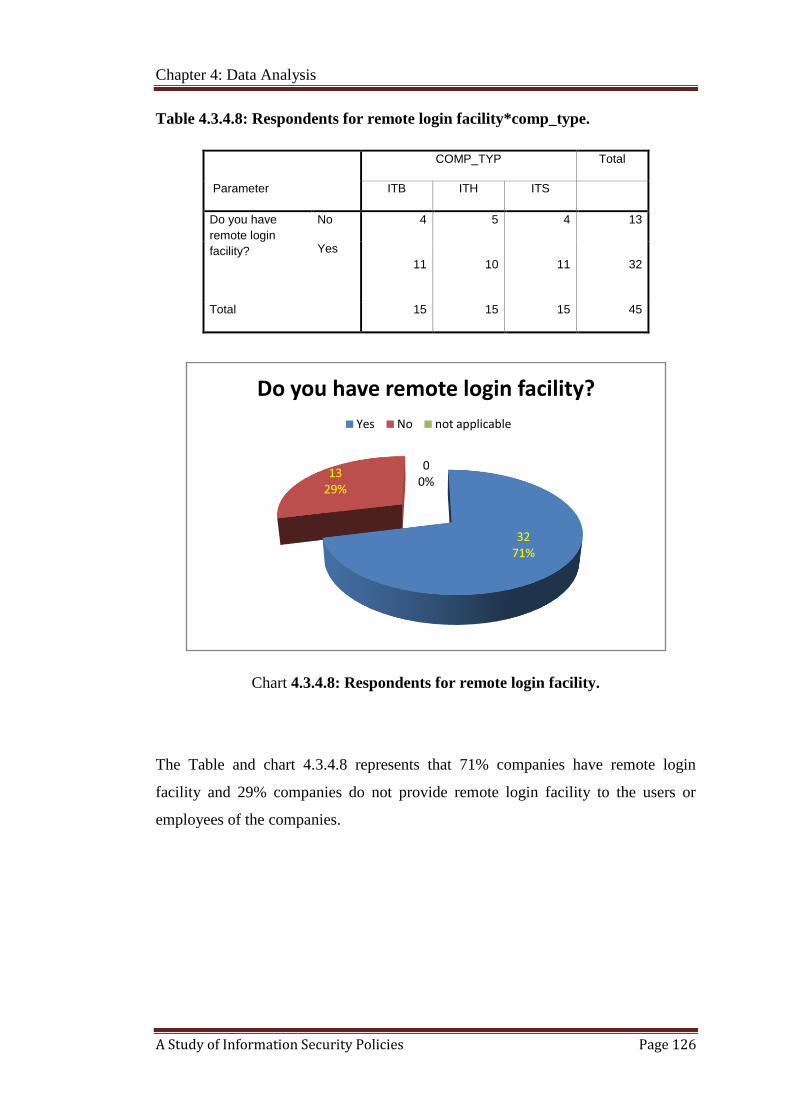
Table 4.3.4.8: Respondents for remote login facility*comp_type.
Parameter
COMP_TYP Total
ITB ITH ITS
Do you have
remote login
facility?
No 4 5 4 13
Yes
11 10 11 32
Total 15 15 15 45
Chart 4.3.4.8: Respondents for remote login facility.
The Table and chart 4.3.4.8 represents that 71% companies have remote login
facility and 29% companies do not provide remote login facility to the users or
employees of the companies.
3271%
1329%
00%
Do you have remote login facility?
Yes No not applicable
Chapter 4: Data Analysis
A Study of Information Security Policies Page 127
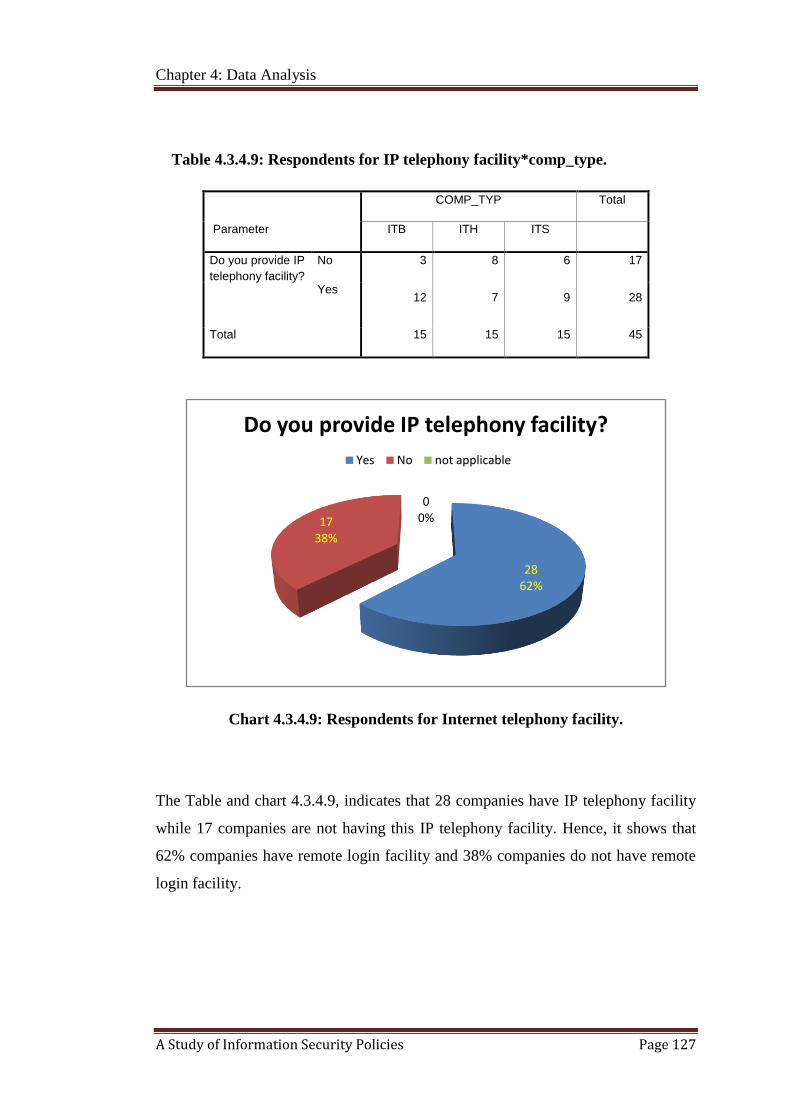
Table 4.3.4.9: Respondents for IP telephony facility*comp_type.
Parameter
COMP_TYP Total
ITB ITH ITS
Do you provide IP
telephony facility?
No 3 8 6 17
Yes 12 7 9 28
Total 15 15 15 45
Chart 4.3.4.9: Respondents for Internet telephony facility.
The Table and chart 4.3.4.9, indicates that 28 companies have IP telephony facility
while 17 companies are not having this IP telephony facility. Hence, it shows that
62% companies have remote login facility and 38% companies do not have remote
login facility.
2862%
1738%
00%
Do you provide IP telephony facility?
Yes No not applicable
Chapter 4: Data Analysis
A Study of Information Security Policies Page 128
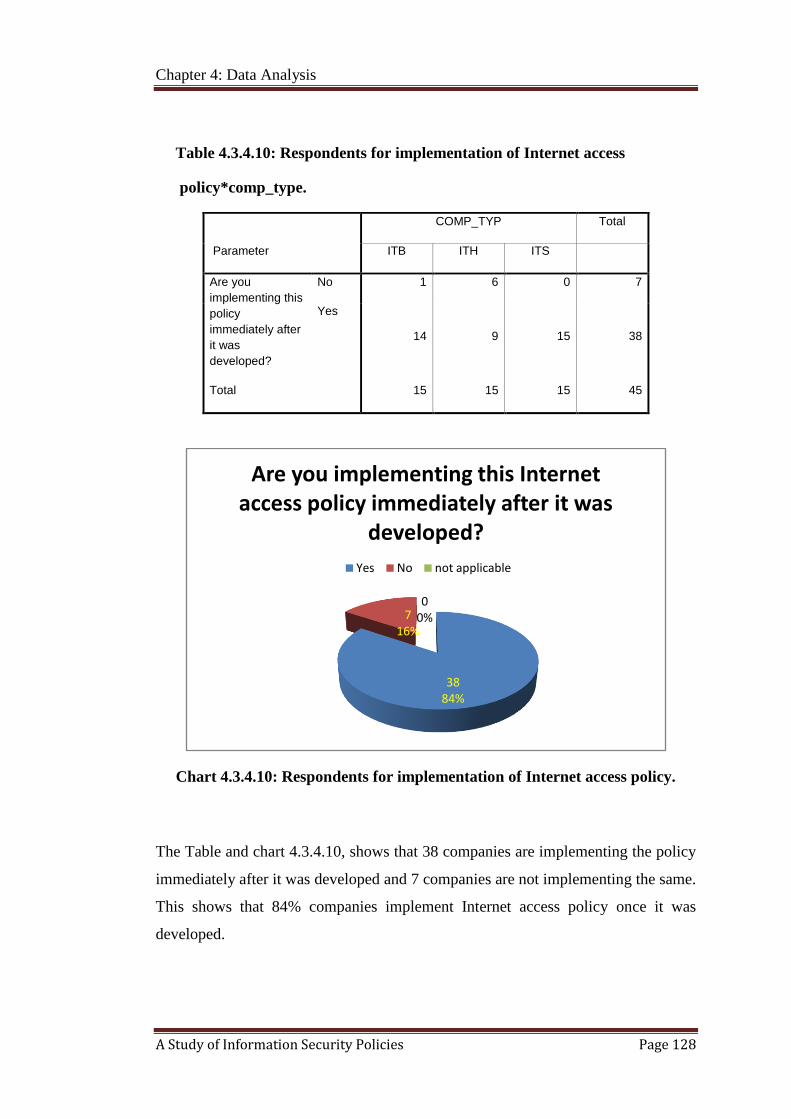
Table 4.3.4.10: Respondents for implementation of Internet access
policy*comp_type.
Parameter
COMP_TYP Total
ITB ITH ITS
Are you
implementing this
policy
immediately after
it was
developed?
No 1 6 0 7
Yes
14 9 15 38
Total 15 15 15 45
Chart 4.3.4.10: Respondents for implementation of Internet access policy.
The Table and chart 4.3.4.10, shows that 38 companies are implementing the policy
immediately after it was developed and 7 companies are not implementing the same.
This shows that 84% companies implement Internet access policy once it was
developed.
3884%
716%
00%
Are you implementing this Internet access policy immediately after it was
developed?
Yes No not applicable
Chapter 4: Data Analysis
A Study of Information Security Policies Page 129
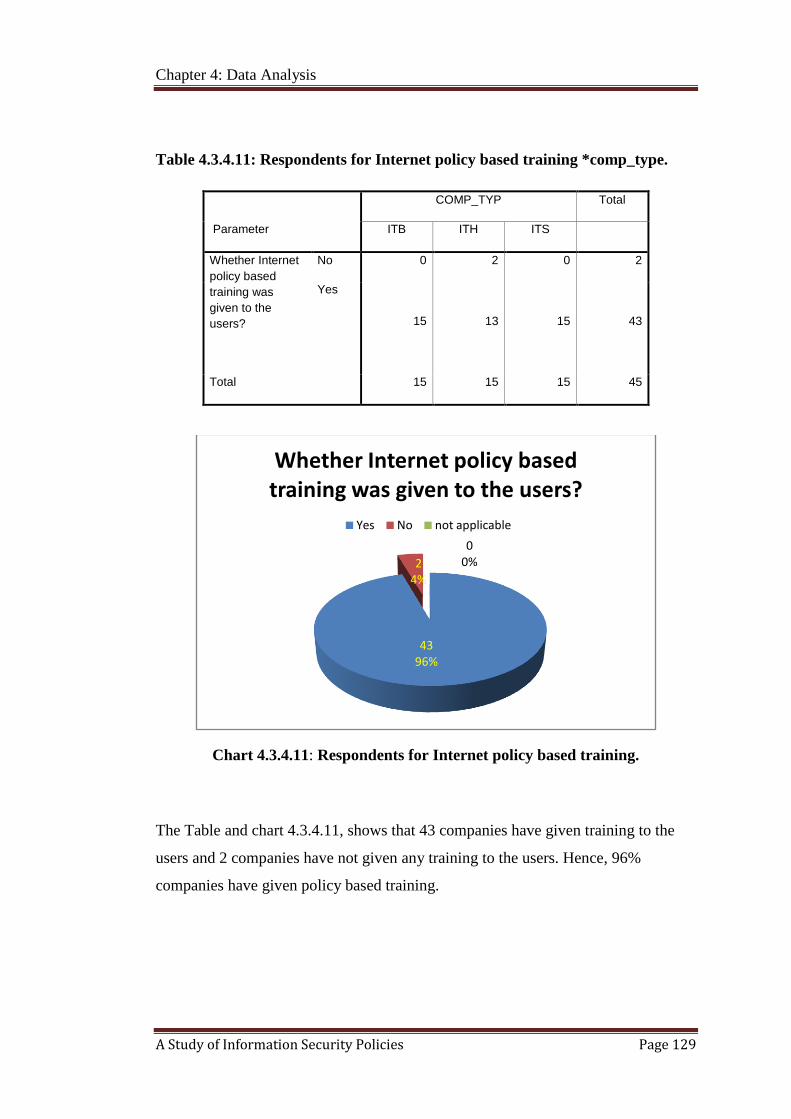
Table 4.3.4.11: Respondents for Internet policy based training *comp_type.
Parameter
COMP_TYP Total
ITB ITH ITS
Whether Internet
policy based
training was
given to the
users?
No 0 2 0 2
Yes
15 13 15 43
Total 15 15 15 45
Chart 4.3.4.11: Respondents for Internet policy based training.
The Table and chart 4.3.4.11, shows that 43 companies have given training to the
users and 2 companies have not given any training to the users. Hence, 96%
companies have given policy based training.
4396%
24%
00%
Whether Internet policy based training was given to the users?
Yes No not applicable
Chapter 4: Data Analysis
A Study of Information Security Policies Page 130
4.3.5: DOMAIN 5: E-mail Policy
This policy takes care of parameters such as organizational e-mail account, policy
training and implementation, disk usage quota, access to other e-mail servers,
change in policy with the IT plan, restricted use of email account and conduct of
Information system audit for e-mail utility.
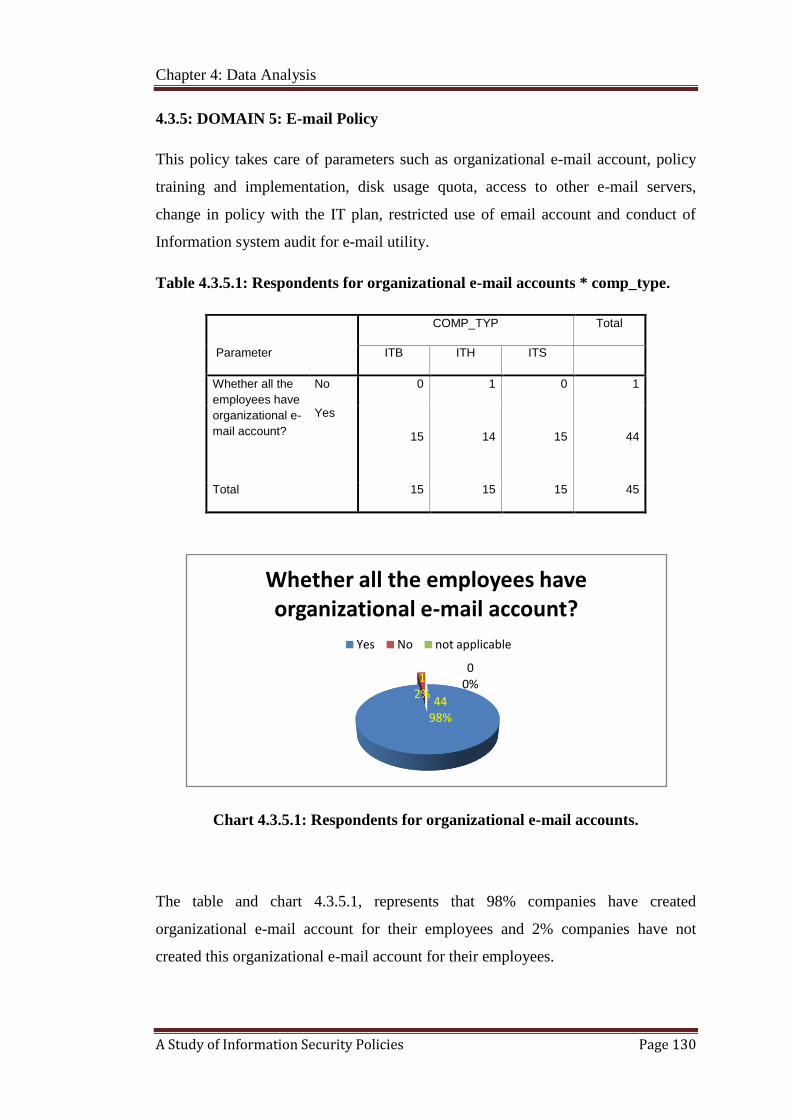
Table 4.3.5.1: Respondents for organizational e-mail accounts * comp_type.
Parameter
COMP_TYP Total
ITB ITH ITS
Whether all the
employees have
organizational e-
mail account?
No 0 1 0 1
Yes
15 14 15 44
Total 15 15 15 45
Chart 4.3.5.1: Respondents for organizational e-mail accounts.
The table and chart 4.3.5.1, represents that 98% companies have created
organizational e-mail account for their employees and 2% companies have not
created this organizational e-mail account for their employees.
4498%
12%
00%
Whether all the employees have organizational e-mail account?
Yes No not applicable
Chapter 4: Data Analysis
A Study of Information Security Policies Page 131
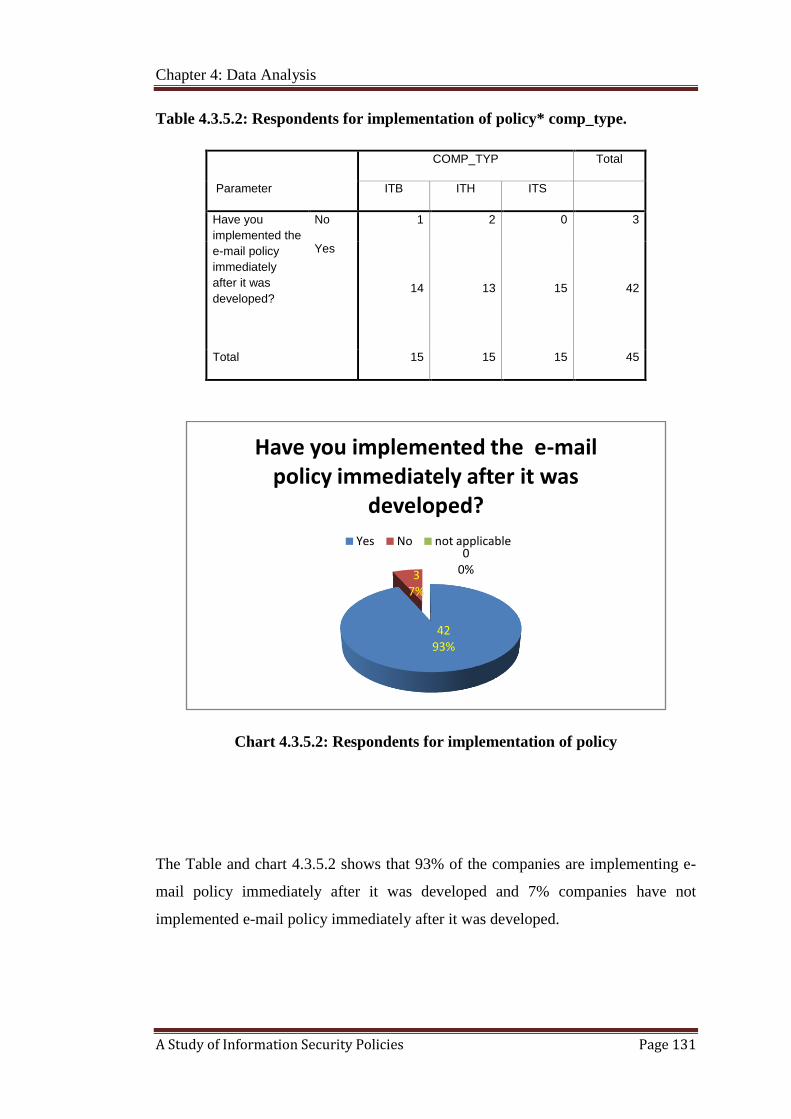
Table 4.3.5.2: Respondents for implementation of policy* comp_type.
Parameter
COMP_TYP Total
ITB ITH ITS
Have you
implemented the
e-mail policy
immediately
after it was
developed?
No 1 2 0 3
Yes
14 13 15 42
Total 15 15 15 45
Chart 4.3.5.2: Respondents for implementation of policy
The Table and chart 4.3.5.2 shows that 93% of the companies are implementing e-
mail policy immediately after it was developed and 7% companies have not
implemented e-mail policy immediately after it was developed.
4293%
37%
00%
Have you implemented the e-mail policy immediately after it was
developed?
Yes No not applicable

Chapter 4: Data Analysis
A Study of Information Security Policies Page 132
Table 4.3.5.3: Respondents for E-mail policy based training * comp_type.
Parameter
COMP_TYP Total
ITB ITH ITS
Whether the
training was
given to you
before the policy
was
implemented?
No 2 3 2 7
Yes
13 12 13 38
Total 15 15 15 45
Chart 4.3.5.3: Respondents for E-mail policy based training.
The table and chart 4.3.5.3 shows that 84% companies have been given training to
the employees before implementation of e-mail policy and 16% companies have not
given training to the employees before implementation of e-mail policy.
3884%
716%
00%
Whether the training was given to you before the policy was
implemented?
Yes No not applicable
Chapter 4: Data Analysis
A Study of Information Security Policies Page 133
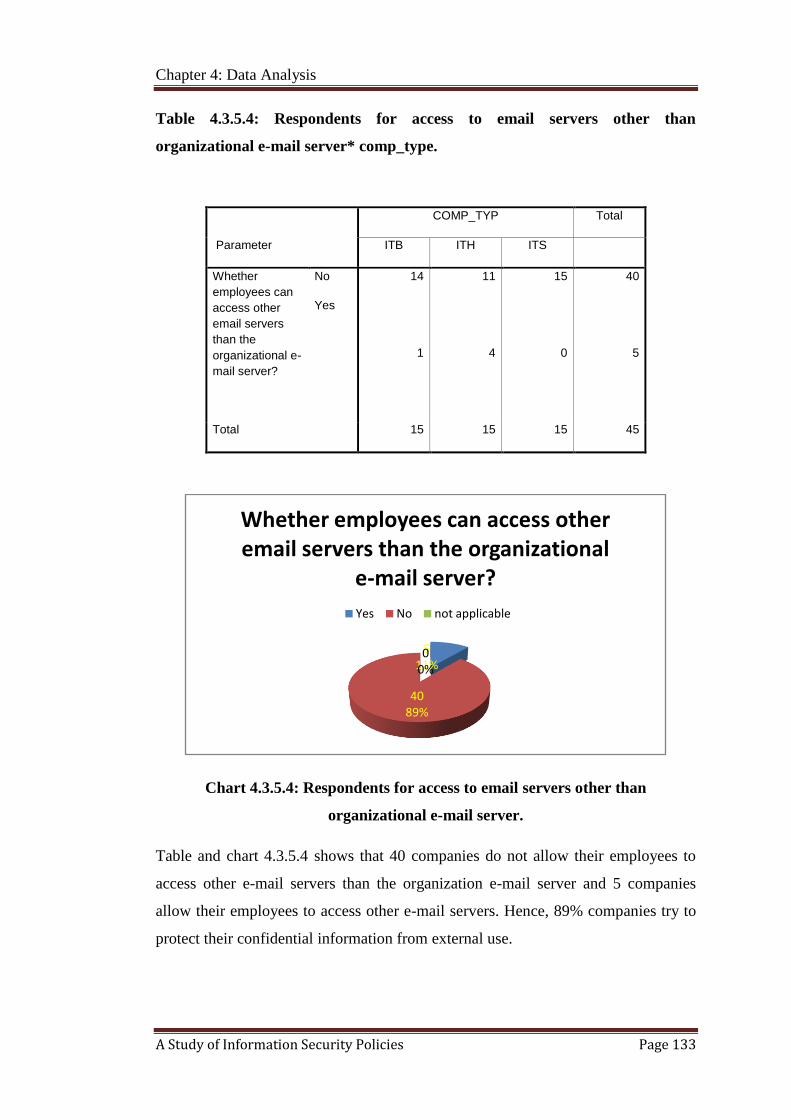
Table 4.3.5.4: Respondents for access to email servers other than
organizational e-mail server* comp_type.
Parameter
COMP_TYP Total
ITB ITH ITS
Whether
employees can
access other
email servers
than the
organizational e-
mail server?
No 14 11 15 40
Yes
1 4 0 5
Total 15 15 15 45
Chart 4.3.5.4: Respondents for access to email servers other than
organizational e-mail server.
Table and chart 4.3.5.4 shows that 40 companies do not allow their employees to
access other e-mail servers than the organization e-mail server and 5 companies
allow their employees to access other e-mail servers. Hence, 89% companies try to
protect their confidential information from external use.
511%
4089%
00%
Whether employees can access other email servers than the organizational
e-mail server?
Yes No not applicable

Chapter 4: Data Analysis
A Study of Information Security Policies Page 134
Table 4.3.5.5: Respondents for disk usage quota for e-mail facility*comp_type.
Parameter
COMP_TYP Total
ITB ITH ITS
Whether the
disk usage
quota is allotted
to the individual
user?
No 2 4 0 6
Yes
13 11 15 39
Total 15 15 15 45
Chart 4.3.5.5: Respondents for disk usage quota for e-mail facility.
The Table and chart 4.3.5.5, indicates that 39 companies have allotted disk usage
quota to the individual users and 6 companies have not allotted any disk usage
quota. Hence, 87% companies allow disk usage quota to the individual users.
3987%
613%
00%
Whether the disk usage quota is allotted to the individual user?
Yes No not applicable
Chapter 4: Data Analysis
A Study of Information Security Policies Page 135
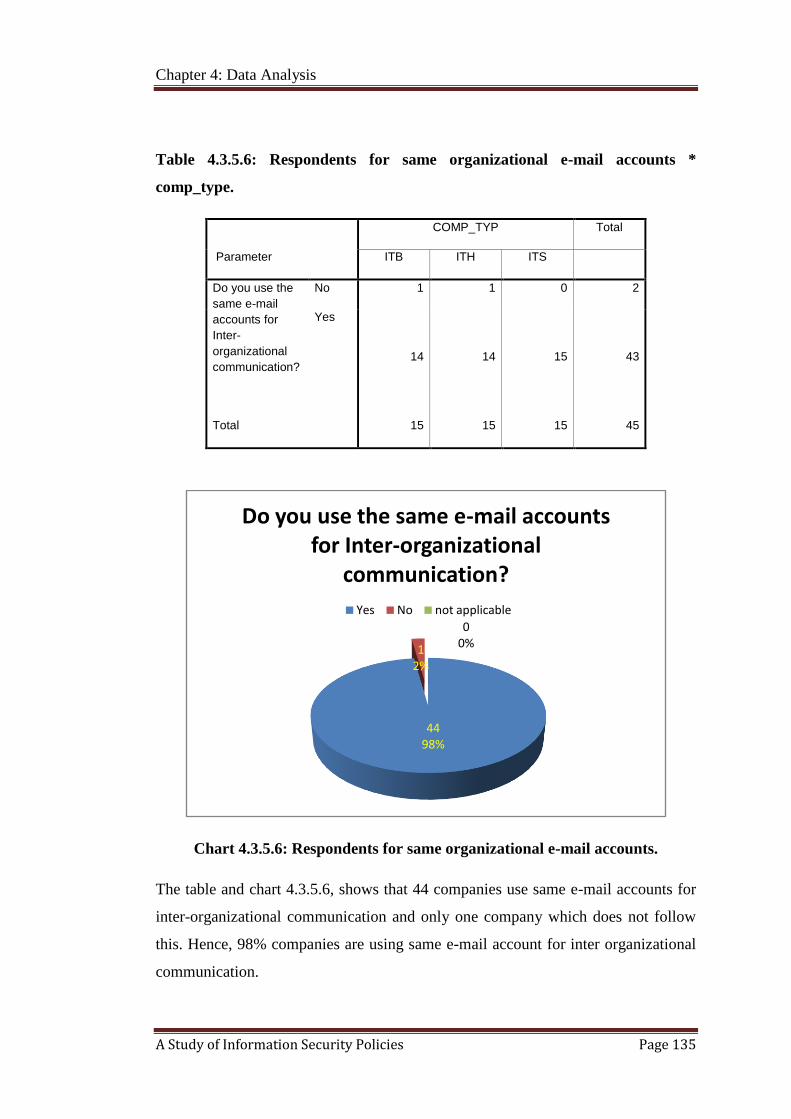
Table 4.3.5.6: Respondents for same organizational e-mail accounts *
comp_type.
Parameter
COMP_TYP Total
ITB ITH ITS
Do you use the
same e-mail
accounts for
Inter-
organizational
communication?
No 1 1 0 2
Yes
14 14 15 43
Total 15 15 15 45
Chart 4.3.5.6: Respondents for same organizational e-mail accounts.
The table and chart 4.3.5.6, shows that 44 companies use same e-mail accounts for
inter-organizational communication and only one company which does not follow
this. Hence, 98% companies are using same e-mail account for inter organizational
communication.
4498%
12%
00%
Do you use the same e-mail accounts for Inter-organizational
communication?
Yes No not applicable

Chapter 4: Data Analysis
A Study of Information Security Policies Page 136
Table 4.3.5.7: Respondents for e-mail policy which meet IT plan of
organization * comp_type.
Parameter
COMP_TYP Total
ITB ITH ITS
Does e-mail
policy meet IT
plan of your
organization?
NR 0 1 0 1
No 1 0 0 1
Yes
14 14 15 43
Total 15 15 15 45
Chart 4.3.5.7: Respondents for e-mail policy which meet IT plan of
organization.
The Table and chart 4.3.5.7, indicates that for 43 companies, the e-mail policy
meets IT plan of organization and one company does not meet this IT plan for e-
mail policy and there was no response from one company. Hence, it shows that 96%
companies e-mail policy meets IT plan of organization.
4396%
12%
12%
Does e-mail policy meet IT plan of your organization?
Yes No not applicable
Chapter 4: Data Analysis
A Study of Information Security Policies Page 137
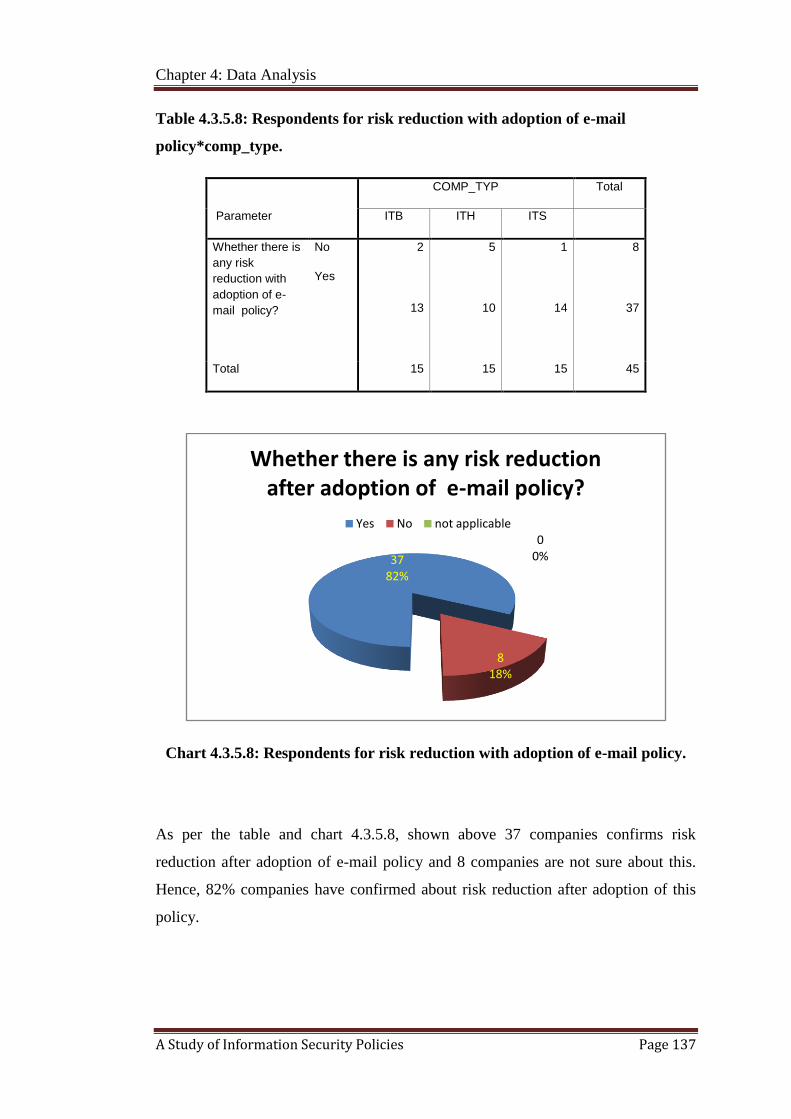
Table 4.3.5.8: Respondents for risk reduction with adoption of e-mail
policy*comp_type.
Parameter
COMP_TYP Total
ITB ITH ITS
Whether there is
any risk
reduction with
adoption of e-
mail policy?
No 2 5 1 8
Yes
13 10 14 37
Total 15 15 15 45
Chart 4.3.5.8: Respondents for risk reduction with adoption of e-mail policy.
As per the table and chart 4.3.5.8, shown above 37 companies confirms risk
reduction after adoption of e-mail policy and 8 companies are not sure about this.
Hence, 82% companies have confirmed about risk reduction after adoption of this
policy.
3782%
818%
00%
Whether there is any risk reduction after adoption of e-mail policy?
Yes No not applicable
Chapter 4: Data Analysis
A Study of Information Security Policies Page 138
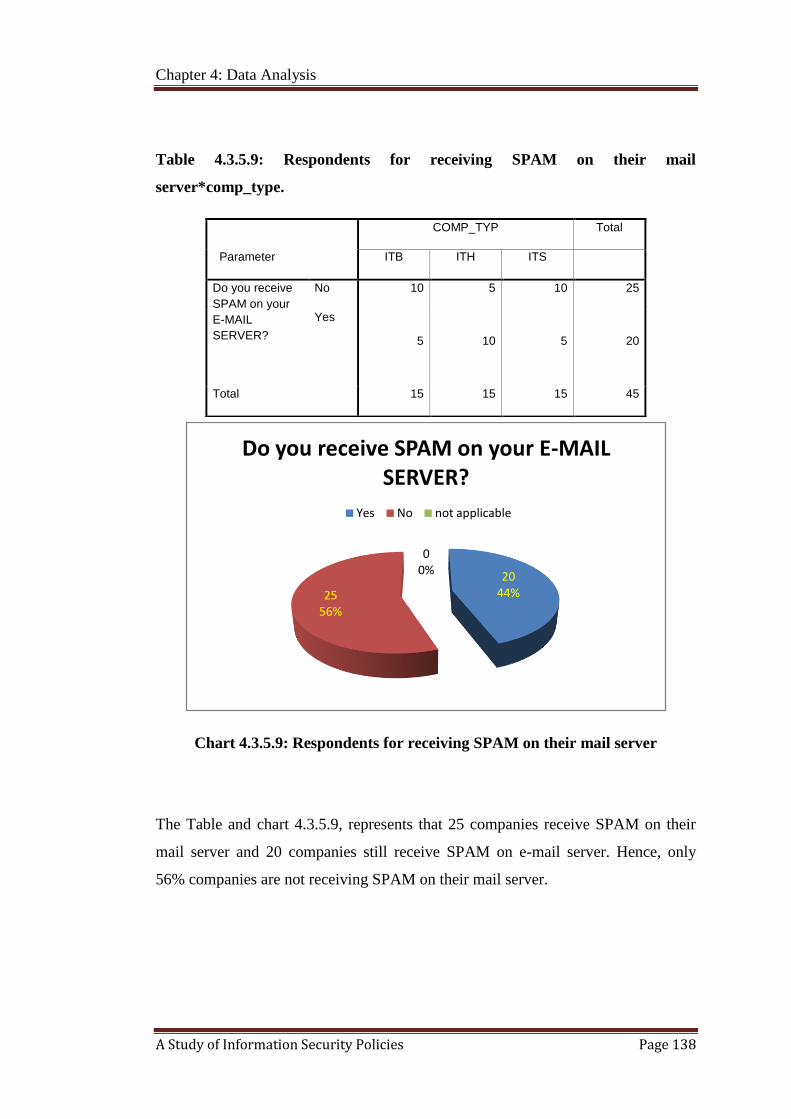
Table 4.3.5.9: Respondents for receiving SPAM on their mail
server*comp_type.
Chart 4.3.5.9: Respondents for receiving SPAM on their mail server
The Table and chart 4.3.5.9, represents that 25 companies receive SPAM on their
mail server and 20 companies still receive SPAM on e-mail server. Hence, only
56% companies are not receiving SPAM on their mail server.
2044%25
56%
00%
Do you receive SPAM on your E-MAIL SERVER?
Yes No not applicable
Parameter
COMP_TYP Total
ITB ITH ITS
Do you receive
SPAM on your
SERVER?
No 10 5 10 25
Yes
5 10 5 20
Total 15 15 15 45
Chapter 4: Data Analysis
A Study of Information Security Policies Page 139
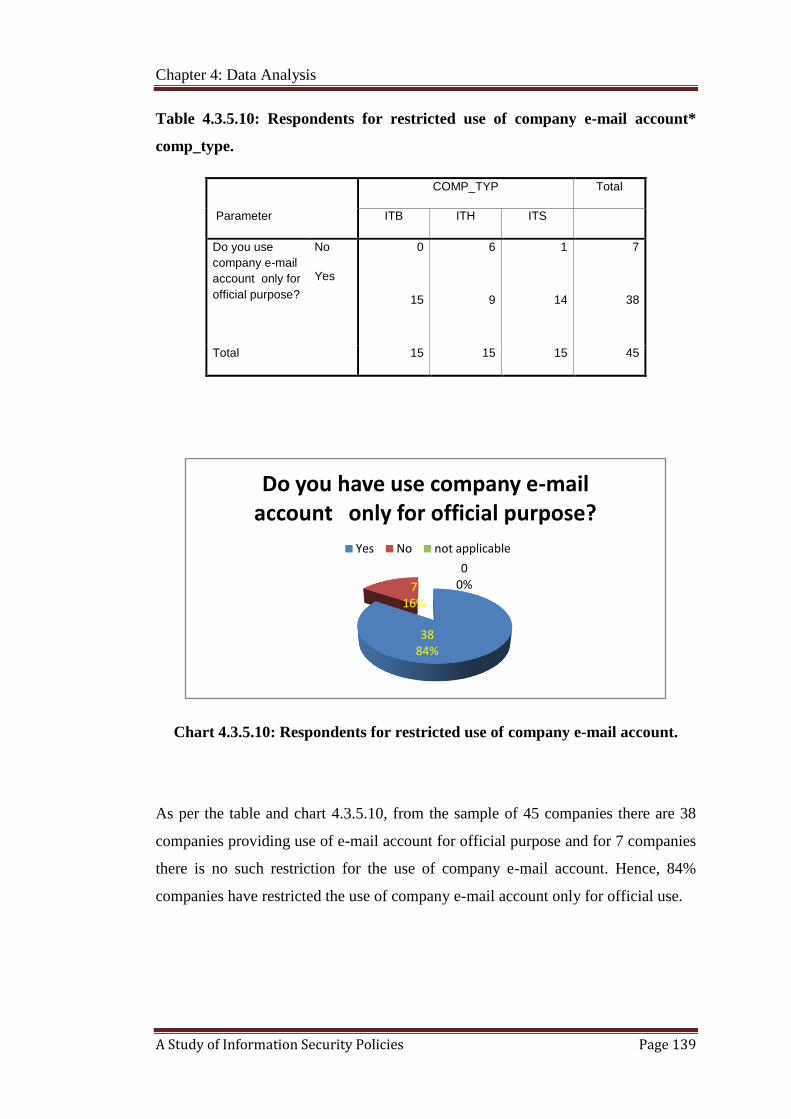
Table 4.3.5.10: Respondents for restricted use of company e-mail account*
comp_type.
Parameter
COMP_TYP Total
ITB ITH ITS
Do you use
company e-mail
account only for
official purpose?
No 0 6 1 7
Yes
15 9 14 38
Total 15 15 15 45
Chart 4.3.5.10: Respondents for restricted use of company e-mail account.
As per the table and chart 4.3.5.10, from the sample of 45 companies there are 38
companies providing use of e-mail account for official purpose and for 7 companies
there is no such restriction for the use of company e-mail account. Hence, 84%
companies have restricted the use of company e-mail account only for official use.
3884%
716%
00%
Do you have use company e-mail account only for official purpose?
Yes No not applicable
Chapter 4: Data Analysis
A Study of Information Security Policies Page 140
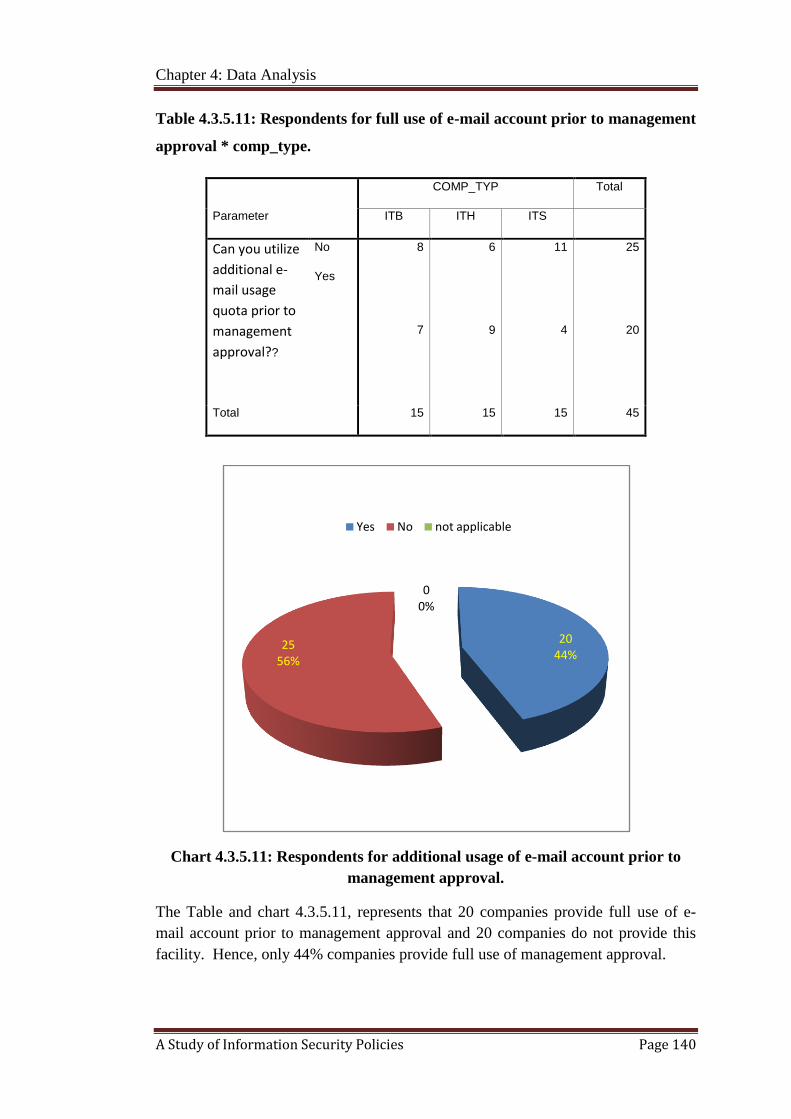
Table 4.3.5.11: Respondents for full use of e-mail account prior to management
approval * comp_type.
Parameter
COMP_TYP Total
ITB ITH ITS
Can you utilize
additional e-
mail usage
quota prior to
management
approval??
No 8 6 11 25
Yes
7 9 4 20
Total 15 15 15 45
Chart 4.3.5.11: Respondents for additional usage of e-mail account prior to
management approval.
The Table and chart 4.3.5.11, represents that 20 companies provide full use of e-
mail account prior to management approval and 20 companies do not provide this
facility. Hence, only 44% companies provide full use of management approval.
2044%
2556%
00%
Yes No not applicable
Chapter 4: Data Analysis
A Study of Information Security Policies Page 141
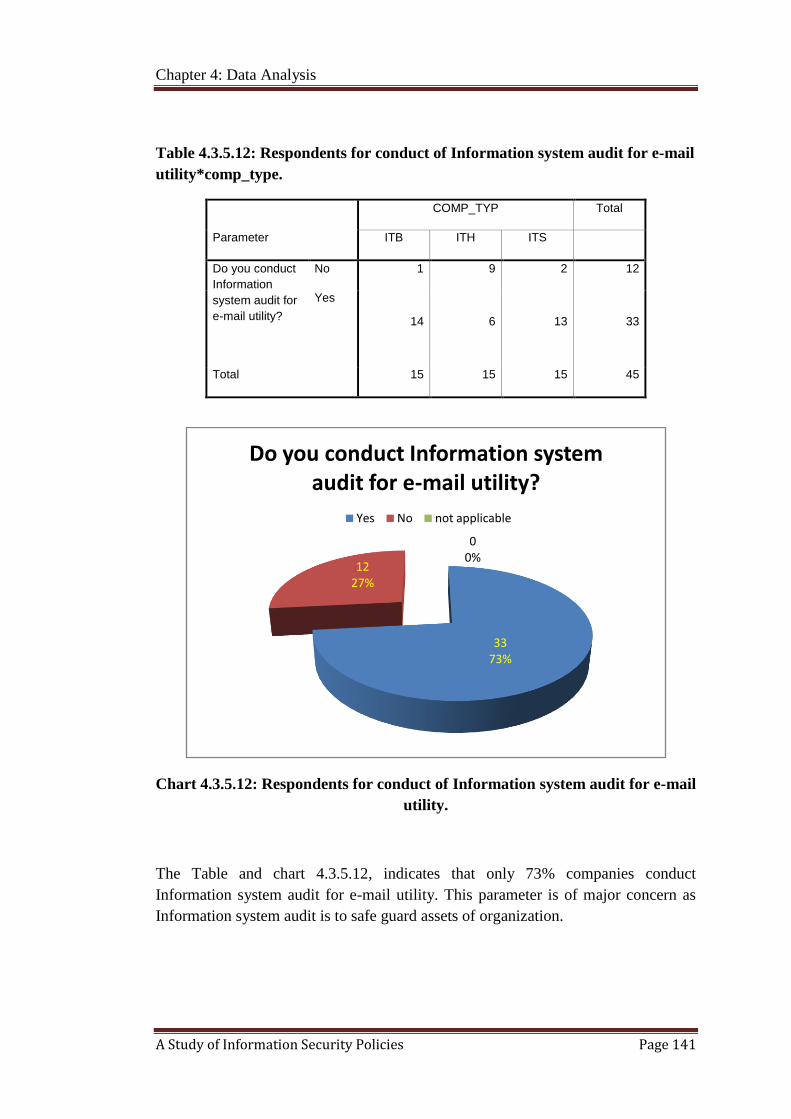
Table 4.3.5.12: Respondents for conduct of Information system audit for e-mail
utility*comp_type.
Parameter
COMP_TYP Total
ITB ITH ITS
Do you conduct
Information
system audit for
e-mail utility?
No 1 9 2 12
Yes
14 6 13 33
Total 15 15 15 45
Chart 4.3.5.12: Respondents for conduct of Information system audit for e-mail
utility.
The Table and chart 4.3.5.12, indicates that only 73% companies conduct
Information system audit for e-mail utility. This parameter is of major concern as
Information system audit is to safe guard assets of organization.
3373%
1227%
00%
Do you conduct Information system audit for e-mail utility?
Yes No not applicable
Chapter 4: Data Analysis
A Study of Information Security Policies Page 142
4.3.6: DOMAIN 6: Software acquisition policy.
This policy mainly addresses parameters about existence of written policy, support
for existing IT plan, formation of steering committee, time frame, comparative
analysis, performance ratings of vendors, source code availability, acceptance
testing, prototype, maintenance agreement and penalty schedule.
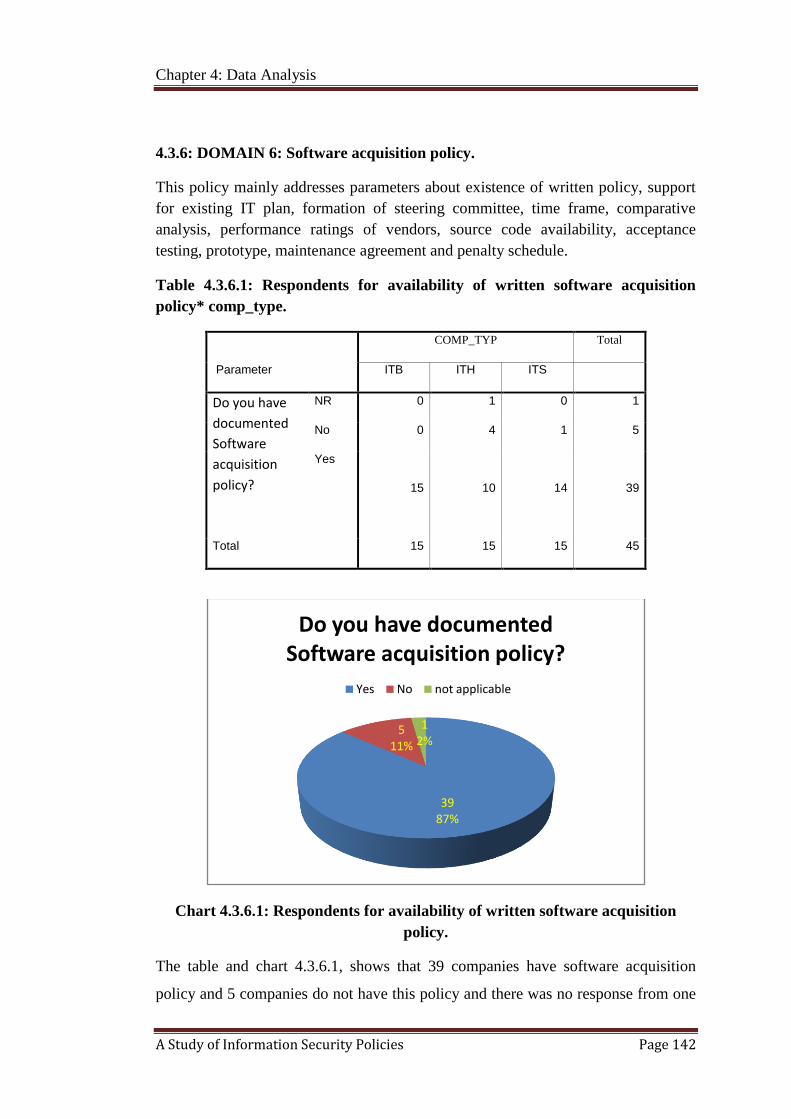
Table 4.3.6.1: Respondents for availability of written software acquisition
policy* comp_type.
Parameter
COMP_TYP Total
ITB ITH ITS
Do you have
documented
Software
acquisition
policy?
NR 0 1 0 1
No 0 4 1 5
Yes
15 10 14 39
Total 15 15 15 45
Chart 4.3.6.1: Respondents for availability of written software acquisition
policy.
The table and chart 4.3.6.1, shows that 39 companies have software acquisition
policy and 5 companies do not have this policy and there was no response from one
3987%
511%
12%
Do you have documented Software acquisition policy?
Yes No not applicable
Chapter 4: Data Analysis
A Study of Information Security Policies Page 143
company. Thus 87% companies have software acquisition policy.
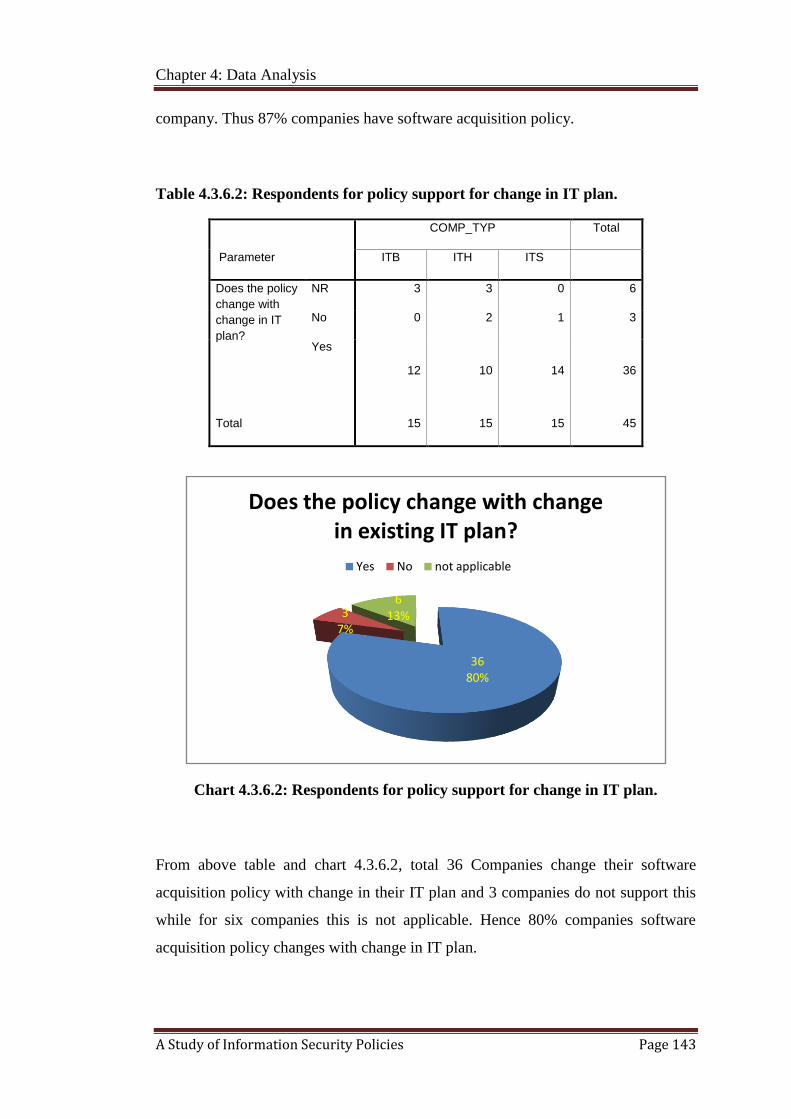
Table 4.3.6.2: Respondents for policy support for change in IT plan.
Parameter
COMP_TYP Total
ITB ITH ITS
Does the policy
change with
change in IT
plan?
NR 3 3 0 6
No 0 2 1 3
Yes
12 10 14 36
Total 15 15 15 45
Chart 4.3.6.2: Respondents for policy support for change in IT plan.
From above table and chart 4.3.6.2, total 36 Companies change their software
acquisition policy with change in their IT plan and 3 companies do not support this
while for six companies this is not applicable. Hence 80% companies software
acquisition policy changes with change in IT plan.
3680%
37%
613%
Does the policy change with change in existing IT plan?
Yes No not applicable
Chapter 4: Data Analysis
A Study of Information Security Policies Page 144
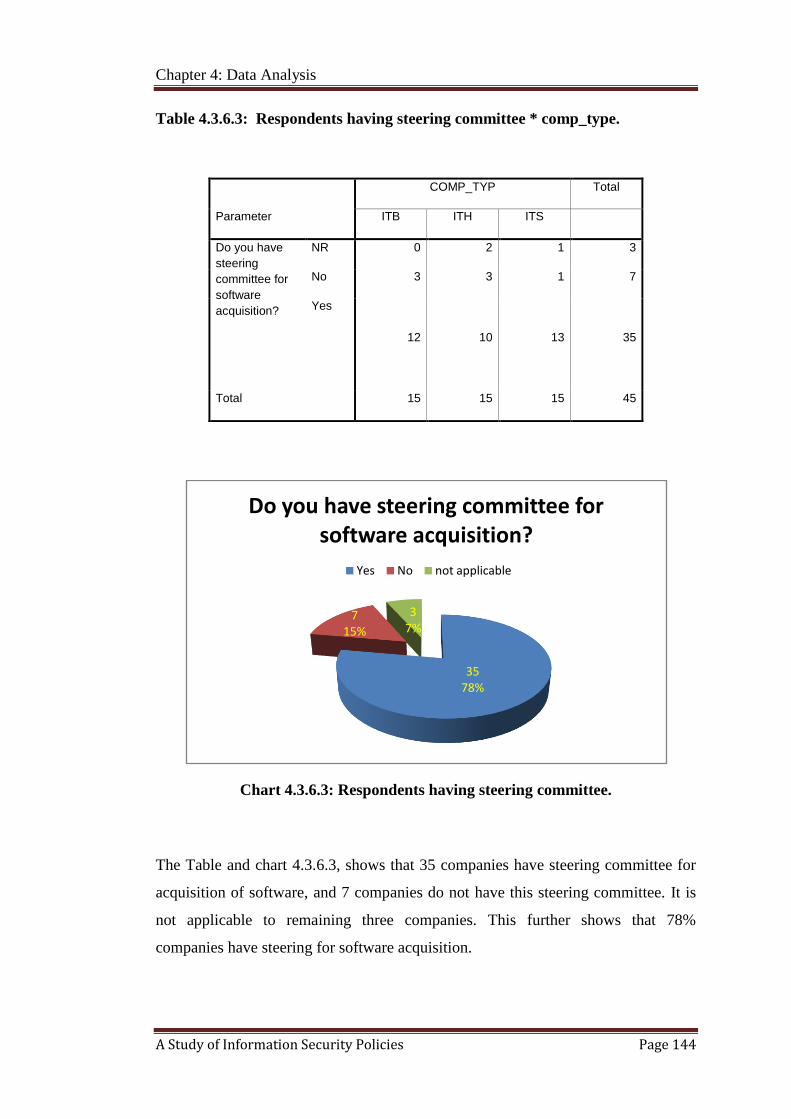
Table 4.3.6.3: Respondents having steering committee * comp_type.
Parameter
COMP_TYP Total
ITB ITH ITS
Do you have
steering
committee for
software
acquisition?
NR 0 2 1 3
No 3 3 1 7
Yes
12 10 13 35
Total 15 15 15 45
Chart 4.3.6.3: Respondents having steering committee.
The Table and chart 4.3.6.3, shows that 35 companies have steering committee for
acquisition of software, and 7 companies do not have this steering committee. It is
not applicable to remaining three companies. This further shows that 78%
companies have steering for software acquisition.
3578%
715%
37%
Do you have steering committee for software acquisition?
Yes No not applicable
Chapter 4: Data Analysis
A Study of Information Security Policies Page 145
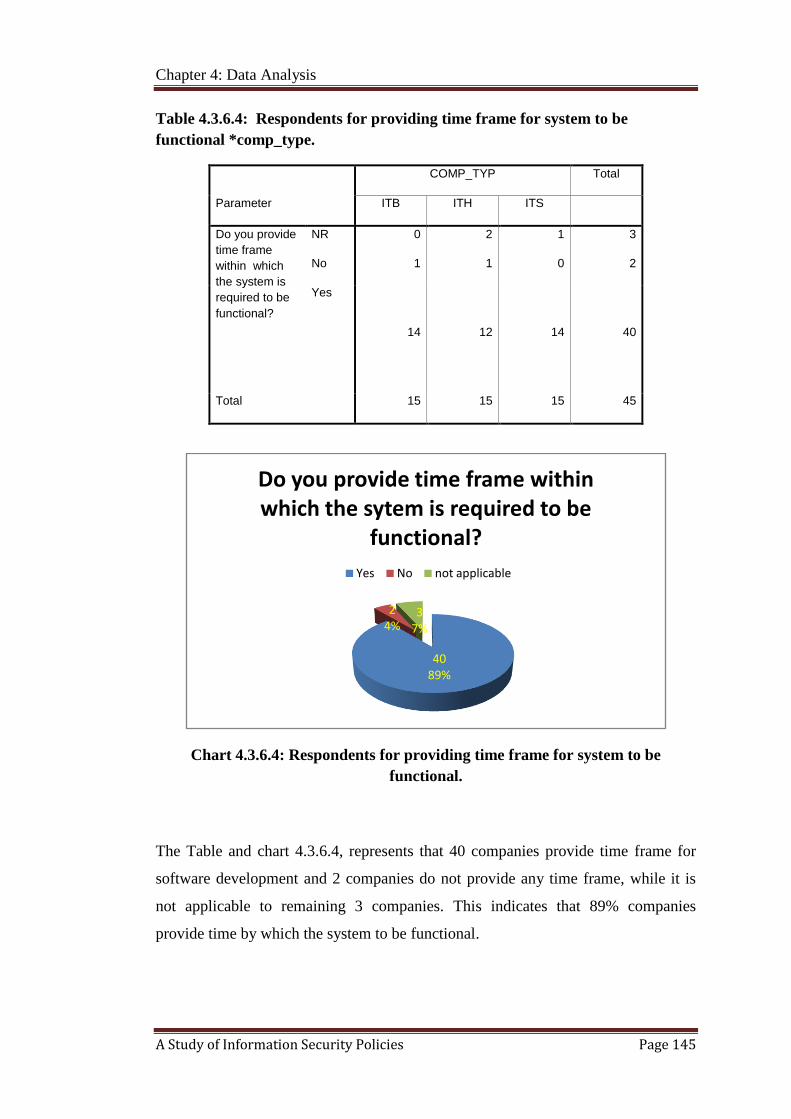
Table 4.3.6.4: Respondents for providing time frame for system to be
functional *comp_type.
Parameter
COMP_TYP Total
ITB ITH ITS
Do you provide
time frame
within which
the system is
required to be
functional?
NR 0 2 1 3
No 1 1 0 2
Yes
14 12 14 40
Total 15 15 15 45
Chart 4.3.6.4: Respondents for providing time frame for system to be
functional.
The Table and chart 4.3.6.4, represents that 40 companies provide time frame for
software development and 2 companies do not provide any time frame, while it is
not applicable to remaining 3 companies. This indicates that 89% companies
provide time by which the system to be functional.
4089%
24%
37%
Do you provide time frame within which the sytem is required to be
functional?
Yes No not applicable
Chapter 4: Data Analysis
A Study of Information Security Policies Page 146
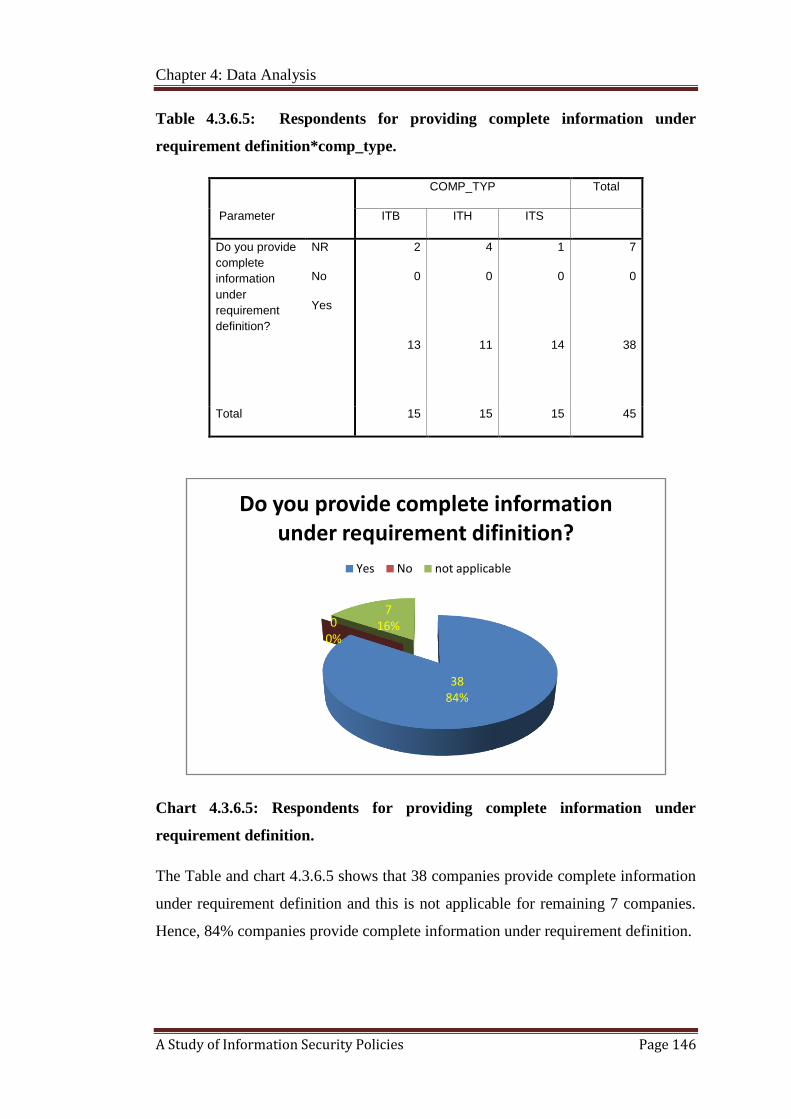
Table 4.3.6.5: Respondents for providing complete information under
requirement definition*comp_type.
Parameter
COMP_TYP Total
ITB ITH ITS
Do you provide
complete
information
under
requirement
definition?
NR 2 4 1 7
No 0 0 0 0
Yes
13 11 14 38
Total 15 15 15 45
Chart 4.3.6.5: Respondents for providing complete information under
requirement definition.
The Table and chart 4.3.6.5 shows that 38 companies provide complete information
under requirement definition and this is not applicable for remaining 7 companies.
Hence, 84% companies provide complete information under requirement definition.
3884%
00%
716%
Do you provide complete information under requirement difinition?
Yes No not applicable
Chapter 4: Data Analysis
A Study of Information Security Policies Page 147
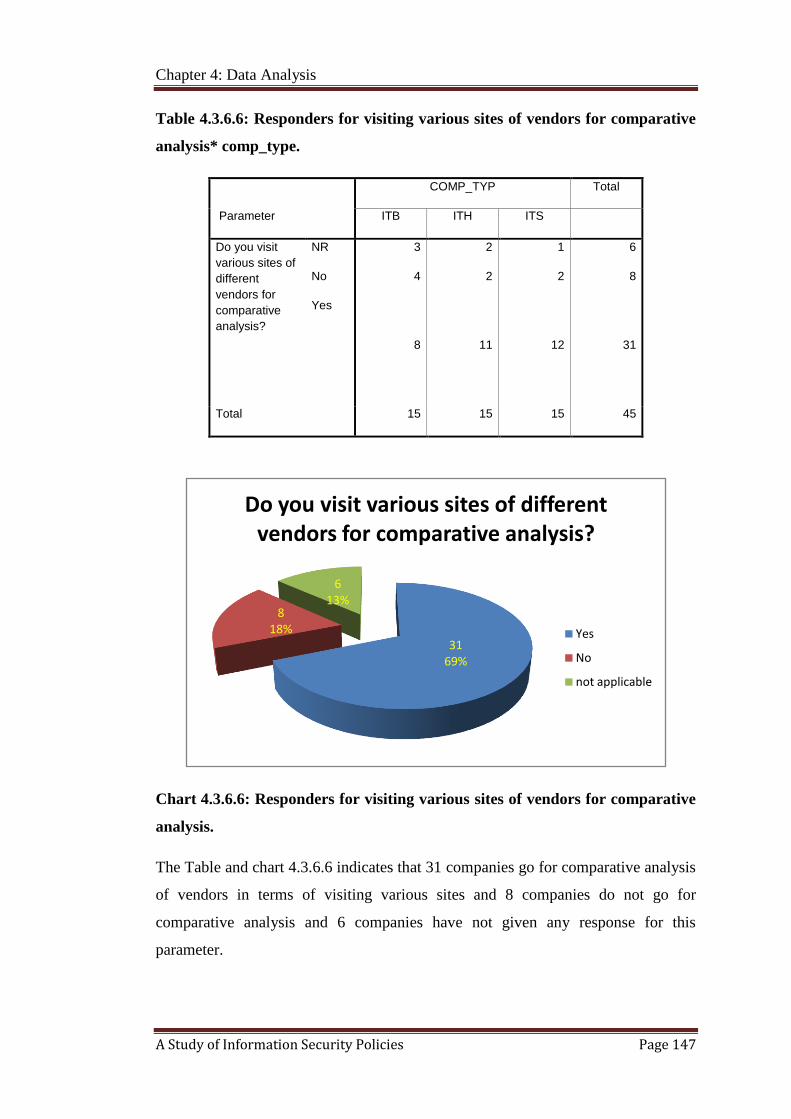
Table 4.3.6.6: Responders for visiting various sites of vendors for comparative
analysis* comp_type.
Parameter
COMP_TYP Total
ITB ITH ITS
Do you visit
various sites of
different
vendors for
comparative
analysis?
NR 3 2 1 6
No 4 2 2 8
Yes
8 11 12 31
Total 15 15 15 45
Chart 4.3.6.6: Responders for visiting various sites of vendors for comparative
analysis.
The Table and chart 4.3.6.6 indicates that 31 companies go for comparative analysis
of vendors in terms of visiting various sites and 8 companies do not go for
comparative analysis and 6 companies have not given any response for this
parameter.
3169%
818%
613%
Do you visit various sites of different vendors for comparative analysis?
Yes
No
not applicable
Chapter 4: Data Analysis
A Study of Information Security Policies Page 148
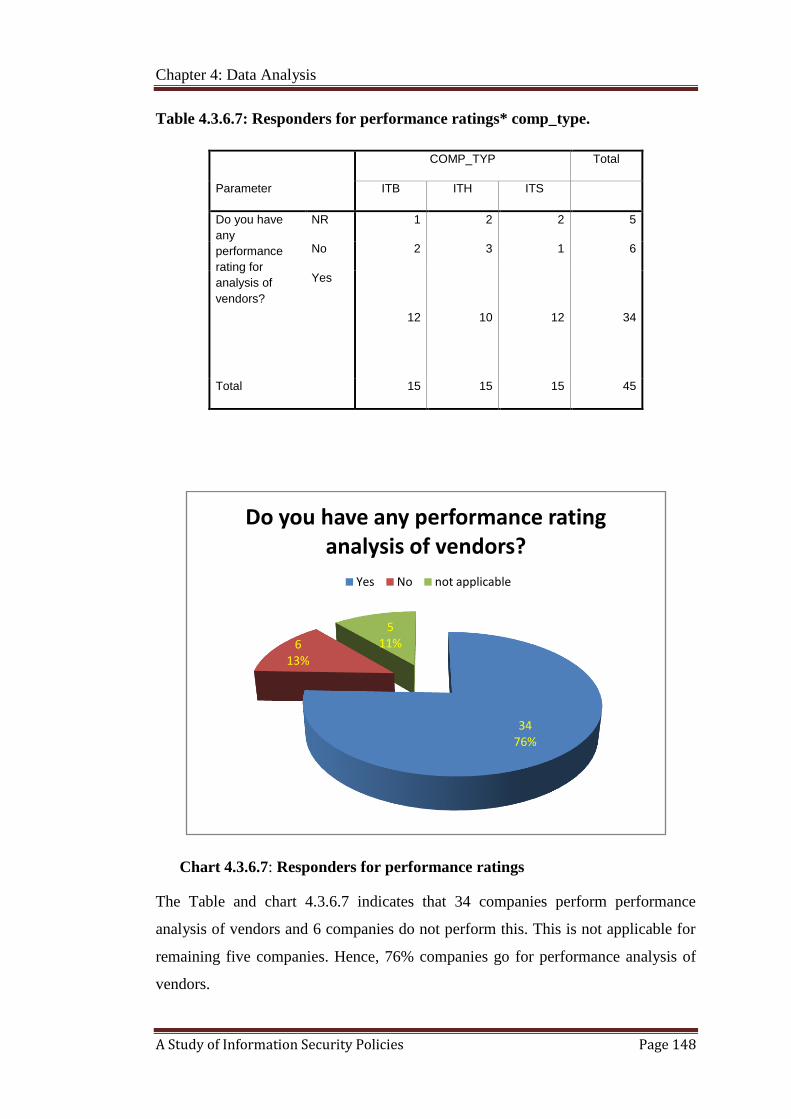
Table 4.3.6.7: Responders for performance ratings* comp_type.
Parameter
COMP_TYP Total
ITB ITH ITS
Do you have
any
performance
rating for
analysis of
vendors?
NR 1 2 2 5
No 2 3 1 6
Yes
12 10 12 34
Total 15 15 15 45
Chart 4.3.6.7: Responders for performance ratings
The Table and chart 4.3.6.7 indicates that 34 companies perform performance
analysis of vendors and 6 companies do not perform this. This is not applicable for
remaining five companies. Hence, 76% companies go for performance analysis of
vendors.
3476%
613%
511%
Do you have any performance rating analysis of vendors?
Yes No not applicable
Chapter 4: Data Analysis
A Study of Information Security Policies Page 149
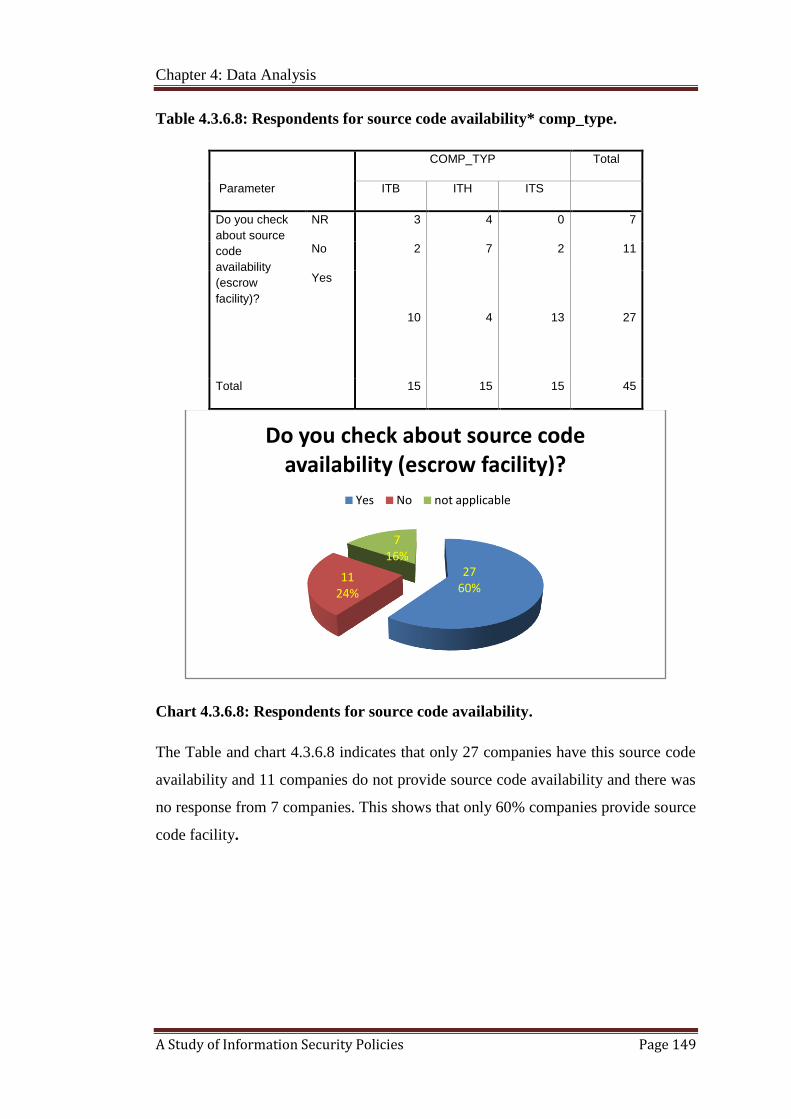
Table 4.3.6.8: Respondents for source code availability* comp_type.
Parameter
COMP_TYP Total
ITB ITH ITS
Do you check
about source
code
availability
(escrow
facility)?
NR 3 4 0 7
No 2 7 2 11
Yes
10 4 13 27
Total 15 15 15 45
Chart 4.3.6.8: Respondents for source code availability.
The Table and chart 4.3.6.8 indicates that only 27 companies have this source code
availability and 11 companies do not provide source code availability and there was
no response from 7 companies. This shows that only 60% companies provide source
code facility.
2760%
1124%
716%
Do you check about source code availability (escrow facility)?
Yes No not applicable
Chapter 4: Data Analysis
A Study of Information Security Policies Page 150
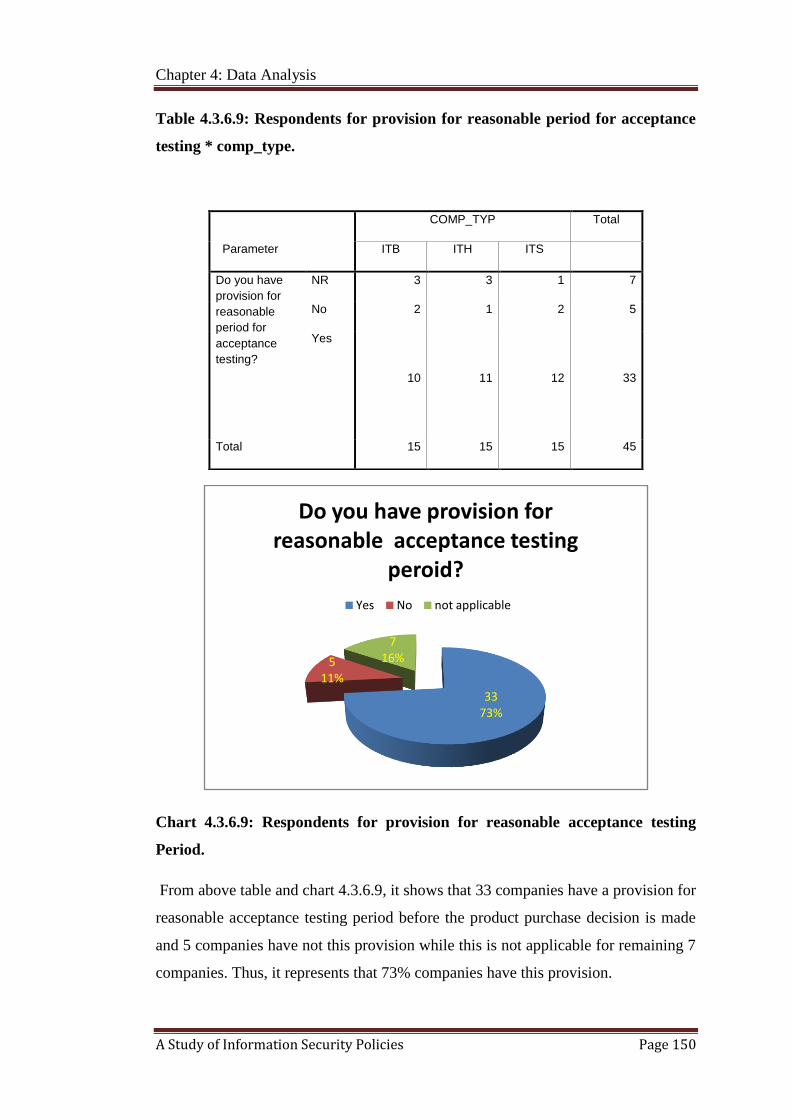
Table 4.3.6.9: Respondents for provision for reasonable period for acceptance
testing * comp_type.
Chart 4.3.6.9: Respondents for provision for reasonable acceptance testing
Period.
From above table and chart 4.3.6.9, it shows that 33 companies have a provision for
reasonable acceptance testing period before the product purchase decision is made
and 5 companies have not this provision while this is not applicable for remaining 7
companies. Thus, it represents that 73% companies have this provision.
3373%
511%
716%
Do you have provision for reasonable acceptance testing
peroid?
Yes No not applicable
Parameter
COMP_TYP Total
ITB ITH ITS
Do you have
provision for
reasonable
period for
acceptance
testing?
NR 3 3 1 7
No 2 1 2 5
Yes
10 11 12 33
Total 15 15 15 45
Chapter 4: Data Analysis
A Study of Information Security Policies Page 151
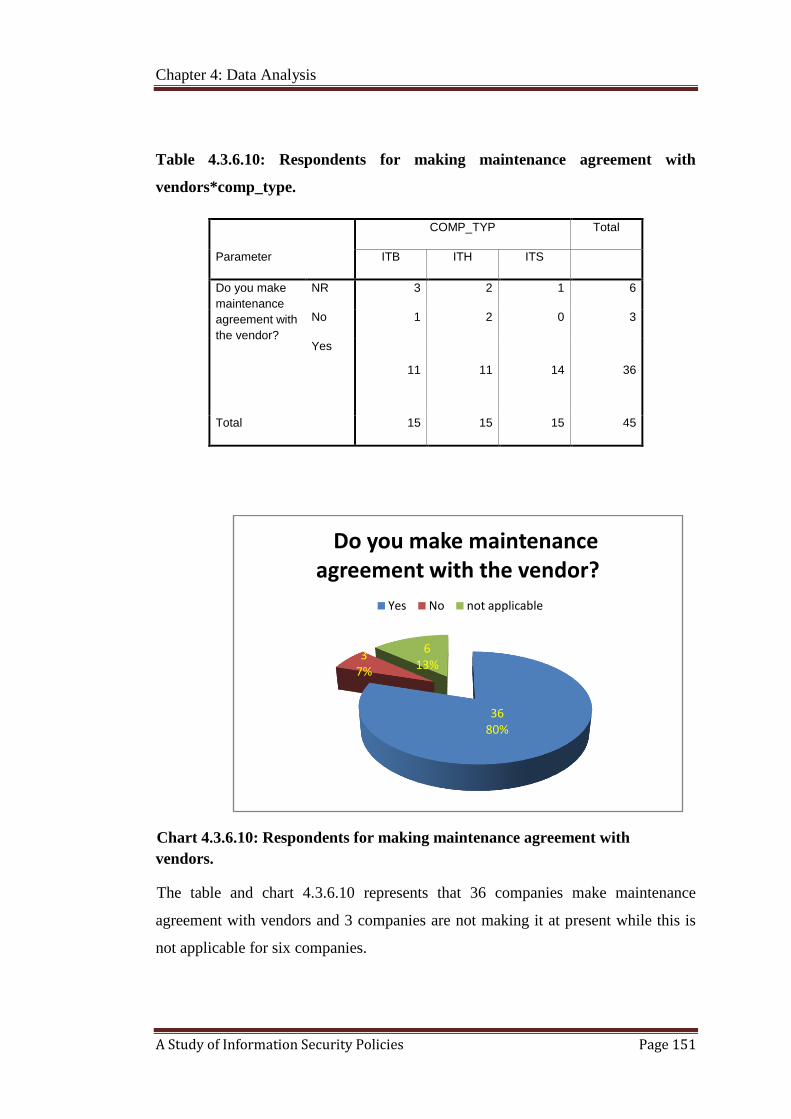
Table 4.3.6.10: Respondents for making maintenance agreement with
vendors*comp_type.
Parameter
COMP_TYP Total
ITB ITH ITS
Do you make
maintenance
agreement with
the vendor?
NR 3 2 1 6
No 1 2 0 3
Yes
11 11 14 36
Total 15 15 15 45
Chart 4.3.6.10: Respondents for making maintenance agreement with
vendors.
The table and chart 4.3.6.10 represents that 36 companies make maintenance
agreement with vendors and 3 companies are not making it at present while this is
not applicable for six companies.
3680%
37%
613%
Do you make maintenance agreement with the vendor?
Yes No not applicable
Chapter 4: Data Analysis
A Study of Information Security Policies Page 152
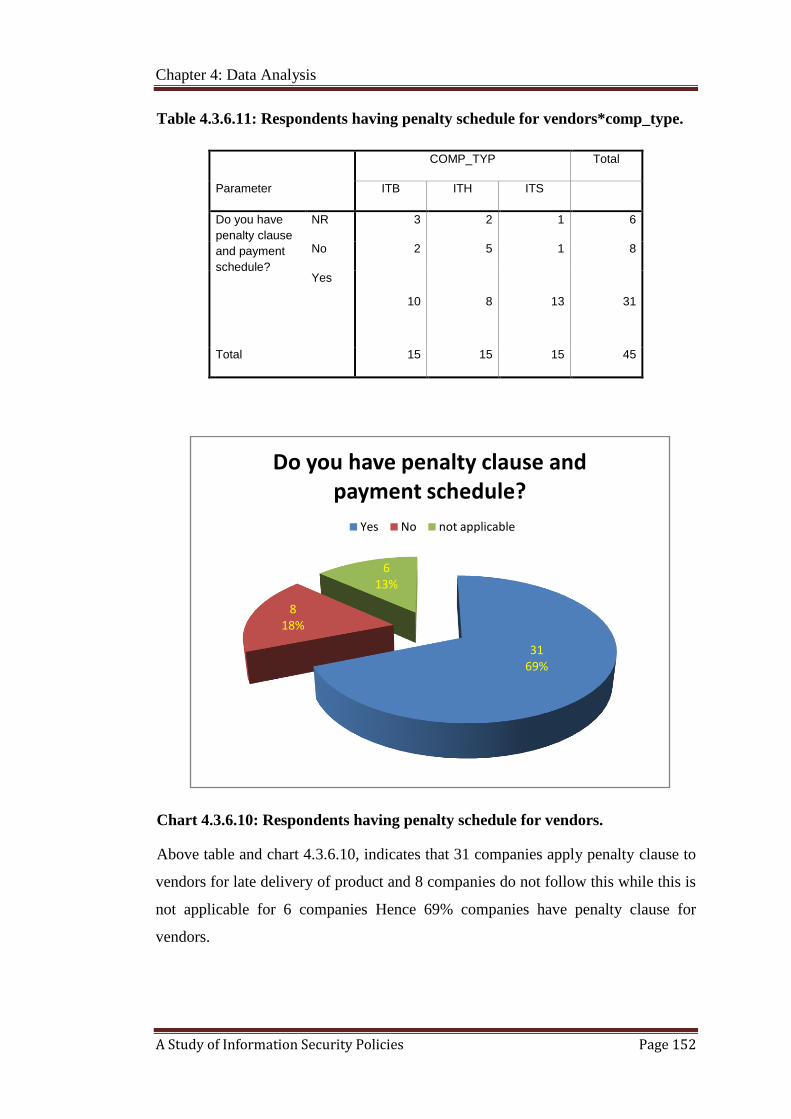
Table 4.3.6.11: Respondents having penalty schedule for vendors*comp_type.
Parameter
COMP_TYP Total
ITB ITH ITS
Do you have
penalty clause
and payment
schedule?
NR 3 2 1 6
No 2 5 1 8
Yes
10 8 13 31
Total 15 15 15 45
Chart 4.3.6.10: Respondents having penalty schedule for vendors.
Above table and chart 4.3.6.10, indicates that 31 companies apply penalty clause to
vendors for late delivery of product and 8 companies do not follow this while this is
not applicable for 6 companies Hence 69% companies have penalty clause for
vendors.
3169%
818%
613%
Do you have penalty clause and payment schedule?
Yes No not applicable
Chapter 4: Data Analysis
A Study of Information Security Policies Page 153
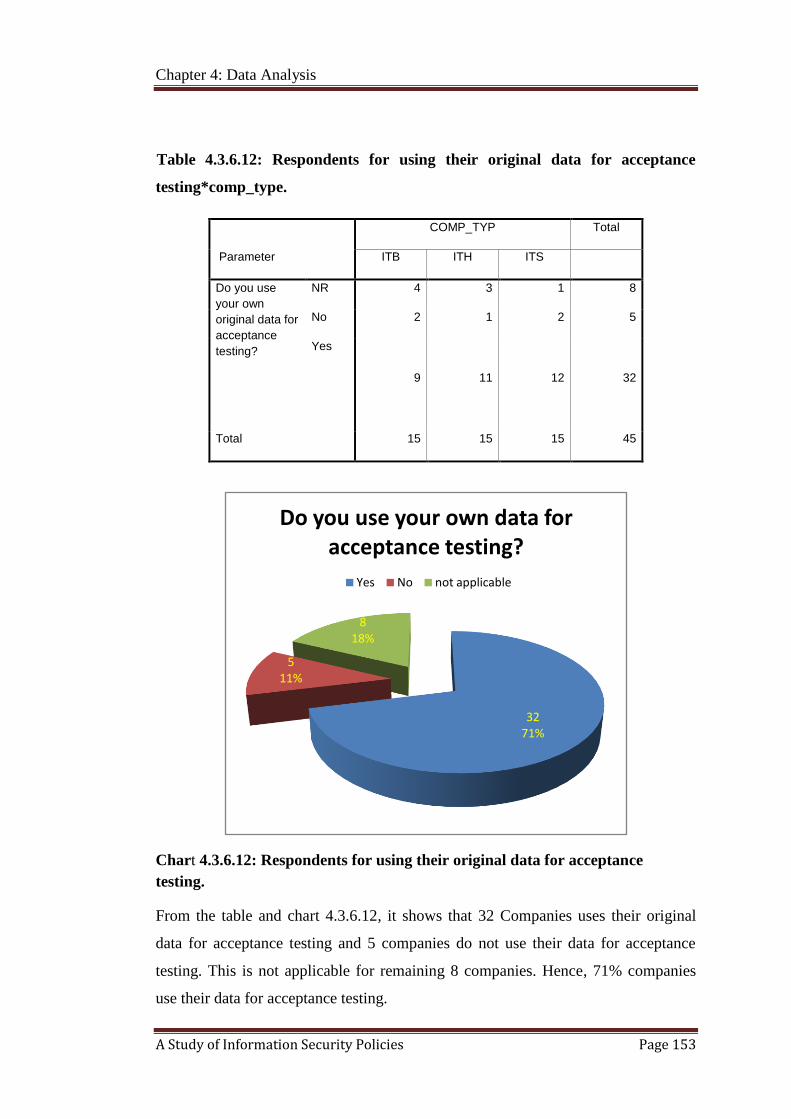
Table 4.3.6.12: Respondents for using their original data for acceptance
testing*comp_type.
Parameter
COMP_TYP Total
ITB ITH ITS
Do you use
your own
original data for
acceptance
testing?
NR 4 3 1 8
No 2 1 2 5
Yes
9 11 12 32
Total 15 15 15 45
Chart 4.3.6.12: Respondents for using their original data for acceptance
testing.
From the table and chart 4.3.6.12, it shows that 32 Companies uses their original
data for acceptance testing and 5 companies do not use their data for acceptance
testing. This is not applicable for remaining 8 companies. Hence, 71% companies
use their data for acceptance testing.
3271%
511%
818%
Do you use your own data for acceptance testing?
Yes No not applicable
Chapter 4: Data Analysis
A Study of Information Security Policies Page 154
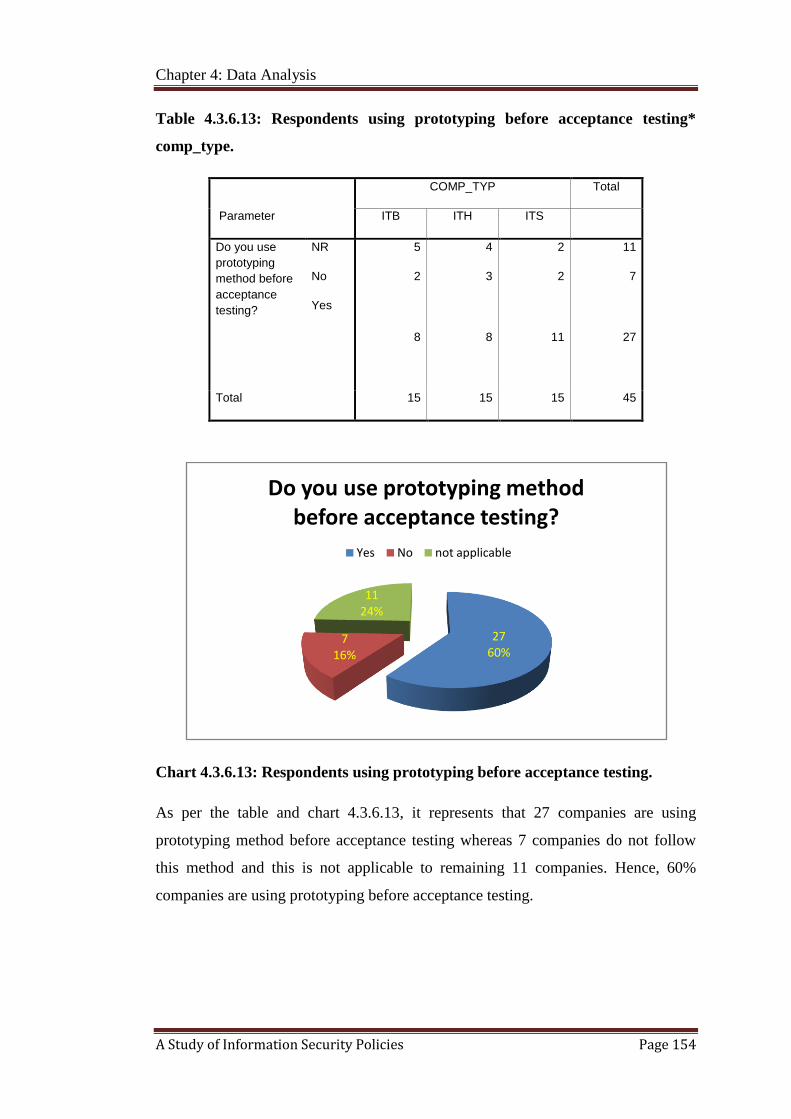
Table 4.3.6.13: Respondents using prototyping before acceptance testing*
comp_type.
Parameter
COMP_TYP Total
ITB ITH ITS
Do you use
prototyping
method before
acceptance
testing?
NR 5 4 2 11
No 2 3 2 7
Yes
8 8 11 27
Total 15 15 15 45
Chart 4.3.6.13: Respondents using prototyping before acceptance testing.
As per the table and chart 4.3.6.13, it represents that 27 companies are using
prototyping method before acceptance testing whereas 7 companies do not follow
this method and this is not applicable to remaining 11 companies. Hence, 60%
companies are using prototyping before acceptance testing.
2760%
716%
1124%
Do you use prototyping method before acceptance testing?
Yes No not applicable
Chapter 4: Data Analysis
A Study of Information Security Policies Page 155
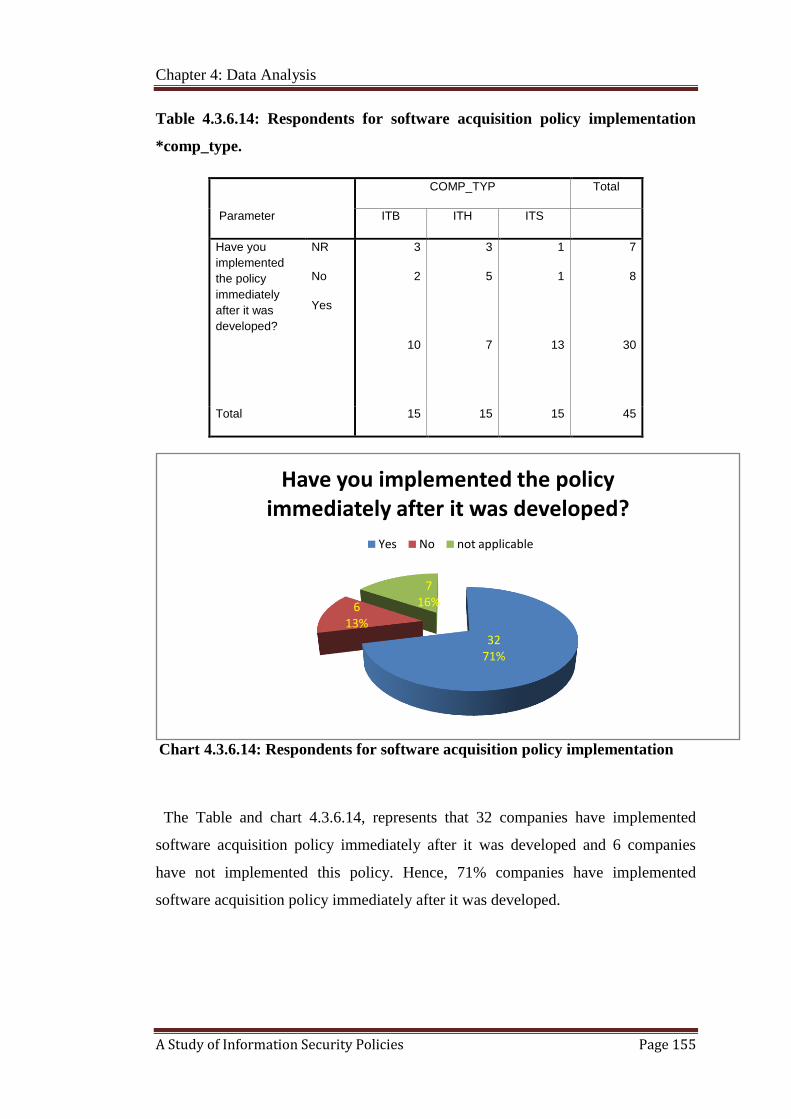
Table 4.3.6.14: Respondents for software acquisition policy implementation
*comp_type.
Parameter
COMP_TYP Total
ITB ITH ITS
Have you
implemented
the policy
immediately
after it was
developed?
NR 3 3 1 7
No 2 5 1 8
Yes
10 7 13 30
Total 15 15 15 45
Chart 4.3.6.14: Respondents for software acquisition policy implementation
The Table and chart 4.3.6.14, represents that 32 companies have implemented
software acquisition policy immediately after it was developed and 6 companies
have not implemented this policy. Hence, 71% companies have implemented
software acquisition policy immediately after it was developed.
3271%
613%
716%
Have you implemented the policy immediately after it was developed?
Yes No not applicable
Chapter 4: Data Analysis
A Study of Information Security Policies Page 156
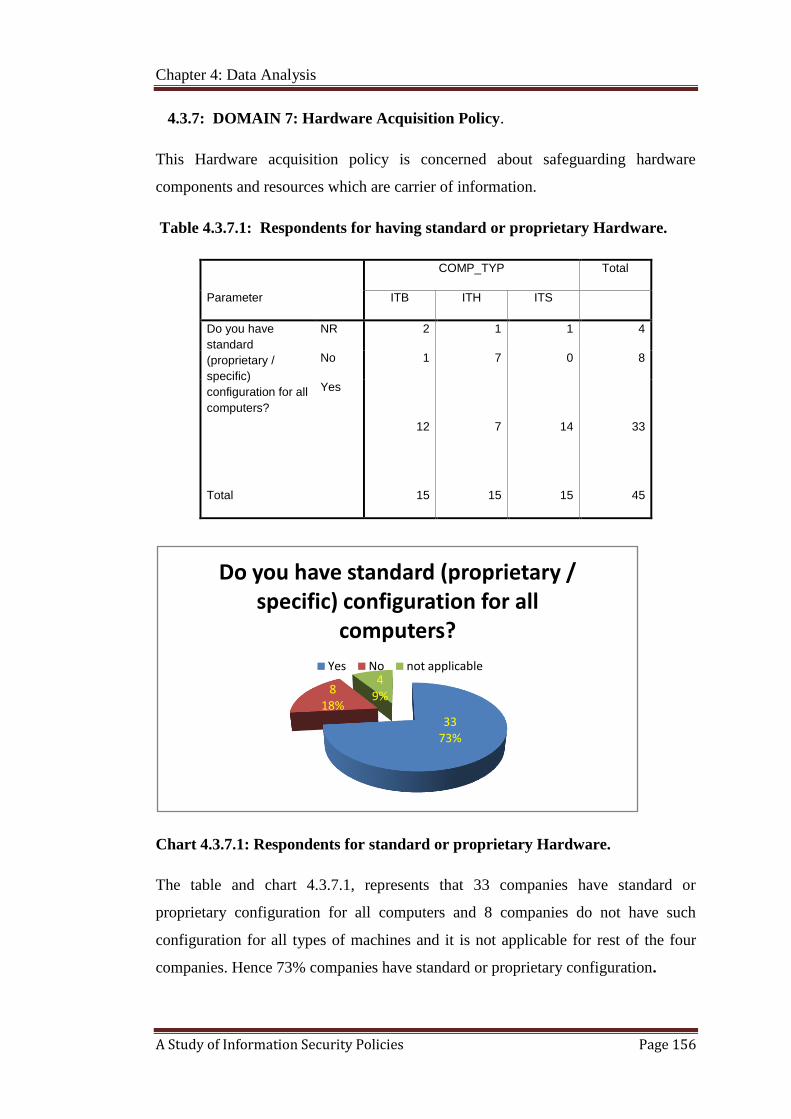
4.3.7: DOMAIN 7: Hardware Acquisition Policy.
This Hardware acquisition policy is concerned about safeguarding hardware
components and resources which are carrier of information.
Table 4.3.7.1: Respondents for having standard or proprietary Hardware.
Parameter
COMP_TYP Total
ITB ITH ITS
Do you have
standard
(proprietary /
specific)
configuration for all
computers?
NR 2 1 1 4
No 1 7 0 8
Yes
12 7 14 33
Total 15 15 15 45
Chart 4.3.7.1: Respondents for standard or proprietary Hardware.
The table and chart 4.3.7.1, represents that 33 companies have standard or
proprietary configuration for all computers and 8 companies do not have such
configuration for all types of machines and it is not applicable for rest of the four
companies. Hence 73% companies have standard or proprietary configuration.
3373%
818%
49%
Do you have standard (proprietary / specific) configuration for all
computers?
Yes No not applicable
Chapter 4: Data Analysis
A Study of Information Security Policies Page 157
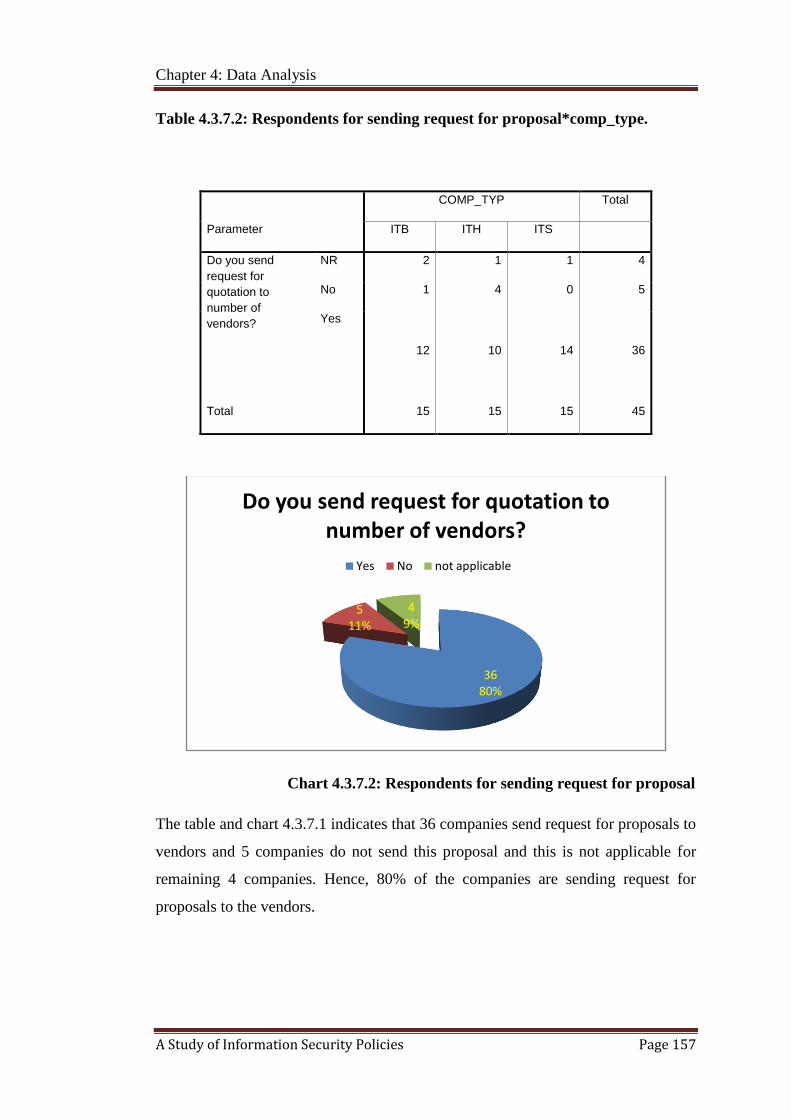
Table 4.3.7.2: Respondents for sending request for proposal*comp_type.
Parameter
COMP_TYP Total
ITB ITH ITS
Do you send
request for
quotation to
number of
vendors?
NR 2 1 1 4
No 1 4 0 5
Yes
12 10 14 36
Total 15 15 15 45
Chart 4.3.7.2: Respondents for sending request for proposal
The table and chart 4.3.7.1 indicates that 36 companies send request for proposals to
vendors and 5 companies do not send this proposal and this is not applicable for
remaining 4 companies. Hence, 80% of the companies are sending request for
proposals to the vendors.
3680%
511%
49%
Do you send request for quotation to number of vendors?
Yes No not applicable
Chapter 4: Data Analysis
A Study of Information Security Policies Page 158
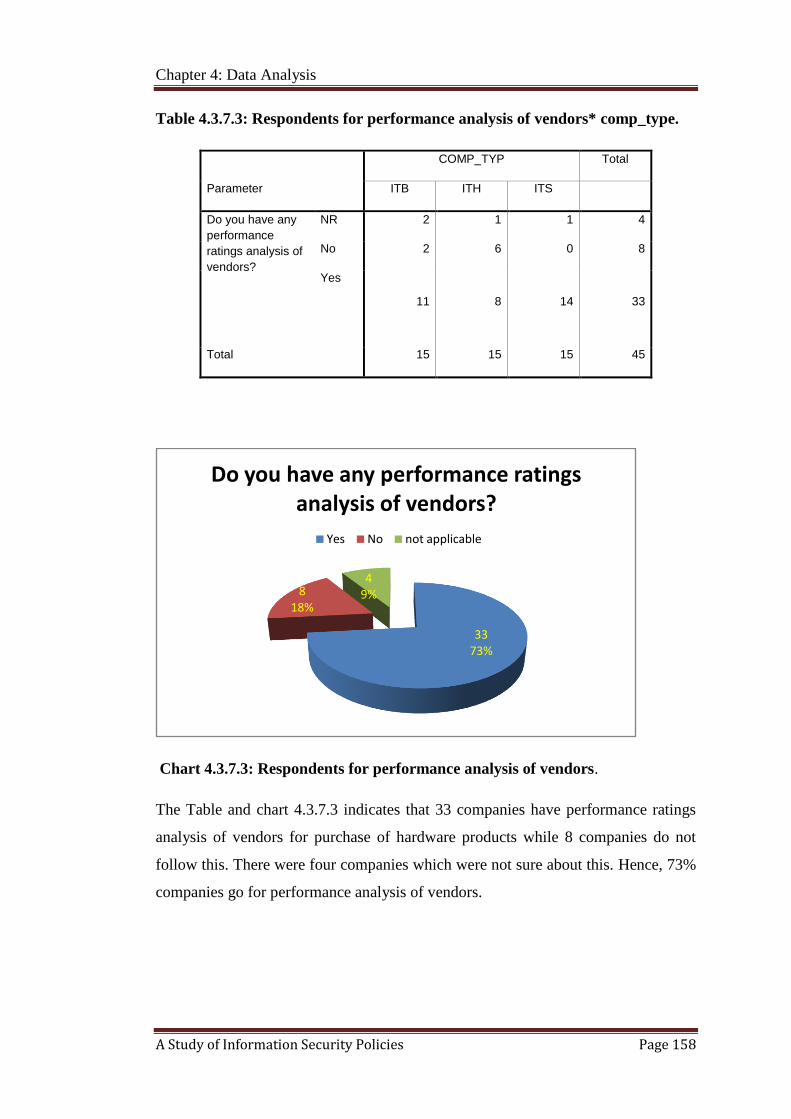
Table 4.3.7.3: Respondents for performance analysis of vendors* comp_type.
Parameter
COMP_TYP Total
ITB ITH ITS
Do you have any
performance
ratings analysis of
vendors?
NR 2 1 1 4
No 2 6 0 8
Yes
11 8 14 33
Total 15 15 15 45
Chart 4.3.7.3: Respondents for performance analysis of vendors.
The Table and chart 4.3.7.3 indicates that 33 companies have performance ratings
analysis of vendors for purchase of hardware products while 8 companies do not
follow this. There were four companies which were not sure about this. Hence, 73%
companies go for performance analysis of vendors.
3373%
818%
49%
Do you have any performance ratings analysis of vendors?
Yes No not applicable
Chapter 4: Data Analysis
A Study of Information Security Policies Page 159
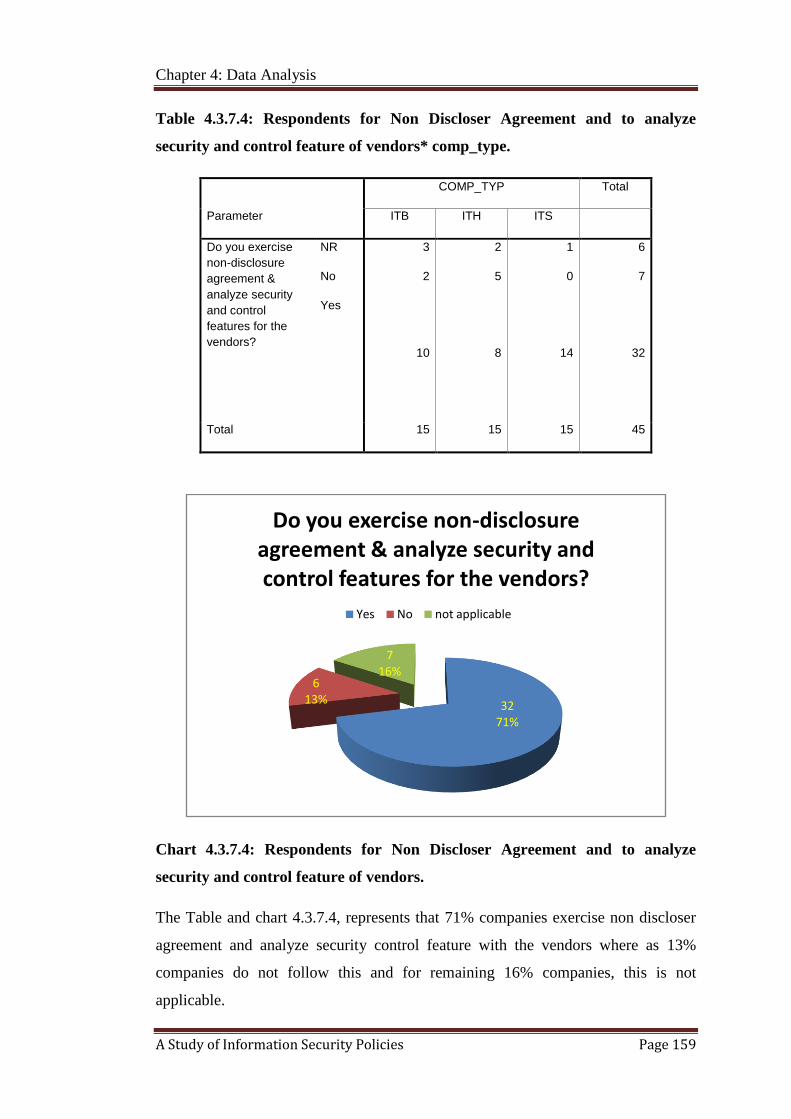
Table 4.3.7.4: Respondents for Non Discloser Agreement and to analyze
security and control feature of vendors* comp_type.
Parameter
COMP_TYP Total
ITB ITH ITS
Do you exercise
non-disclosure
agreement &
analyze security
and control
features for the
vendors?
NR 3 2 1 6
No 2 5 0 7
Yes
10 8 14 32
Total 15 15 15 45
Chart 4.3.7.4: Respondents for Non Discloser Agreement and to analyze
security and control feature of vendors.
The Table and chart 4.3.7.4, represents that 71% companies exercise non discloser
agreement and analyze security control feature with the vendors where as 13%
companies do not follow this and for remaining 16% companies, this is not
applicable.
3271%
613%
716%
Do you exercise non-disclosure agreement & analyze security and control features for the vendors?
Yes No not applicable
Chapter 4: Data Analysis
A Study of Information Security Policies Page 160
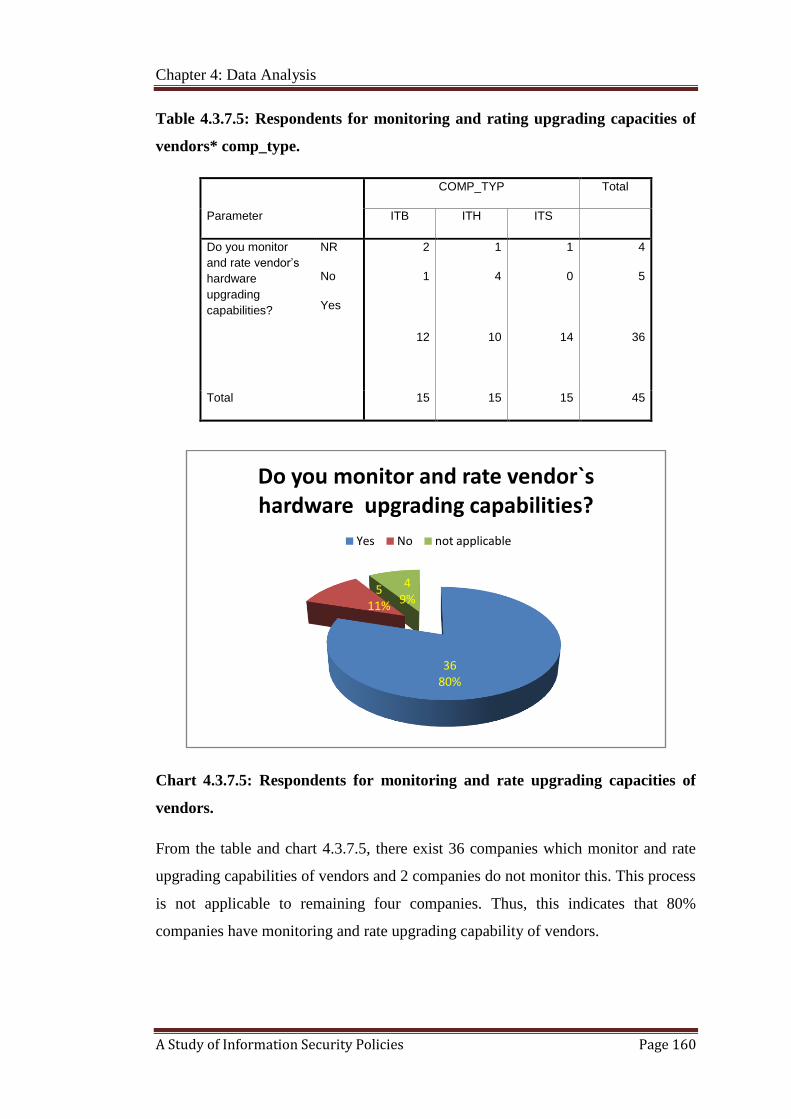
Table 4.3.7.5: Respondents for monitoring and rating upgrading capacities of
vendors* comp_type.
Parameter
COMP_TYP Total
ITB ITH ITS
Do you monitor
and rate vendor’s
hardware
upgrading
capabilities?
NR 2 1 1 4
No 1 4 0 5
Yes
12 10 14 36
Total 15 15 15 45
Chart 4.3.7.5: Respondents for monitoring and rate upgrading capacities of
vendors.
From the table and chart 4.3.7.5, there exist 36 companies which monitor and rate
upgrading capabilities of vendors and 2 companies do not monitor this. This process
is not applicable to remaining four companies. Thus, this indicates that 80%
companies have monitoring and rate upgrading capability of vendors.
3680%
511%
49%
Do you monitor and rate vendor`s hardware upgrading capabilities?
Yes No not applicable
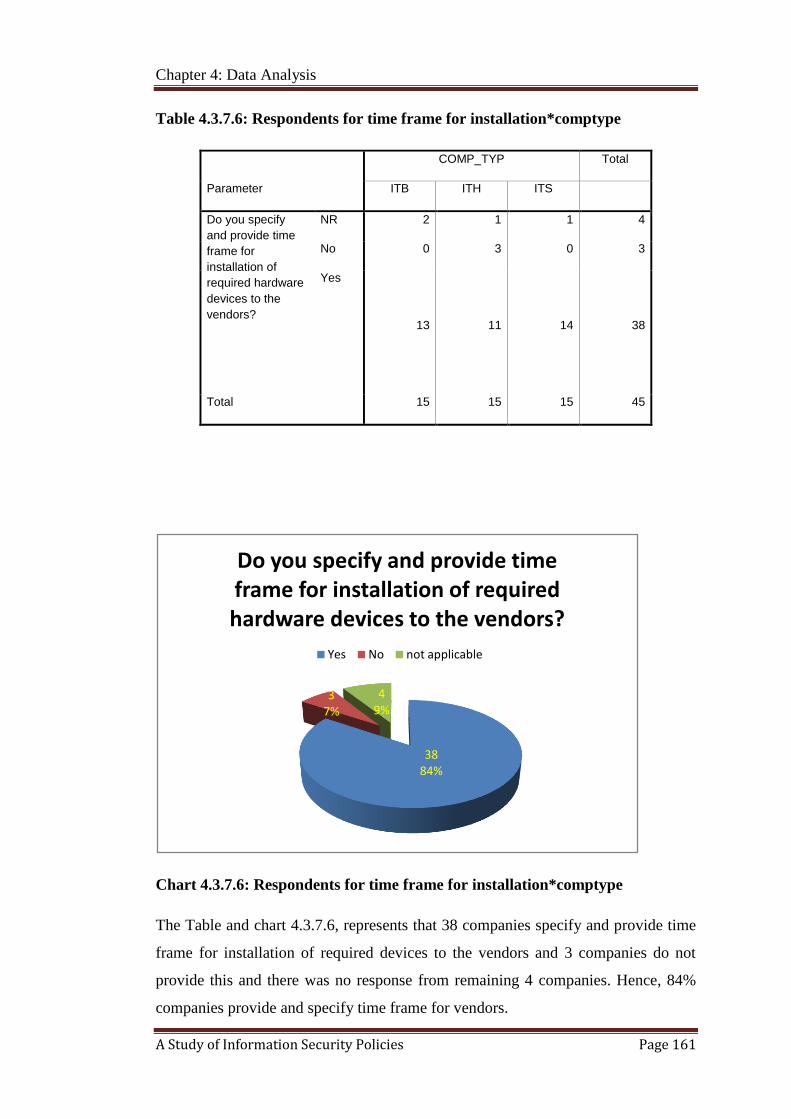
Chapter 4: Data Analysis
A Study of Information Security Policies Page 161
Table 4.3.7.6: Respondents for time frame for installation*comptype
Parameter
COMP_TYP Total
ITB ITH ITS
Do you specify
and provide time
frame for
installation of
required hardware
devices to the
vendors?
NR 2 1 1 4
No 0 3 0 3
Yes
13 11 14 38
Total 15 15 15 45
Chart 4.3.7.6: Respondents for time frame for installation*comptype
The Table and chart 4.3.7.6, represents that 38 companies specify and provide time
frame for installation of required devices to the vendors and 3 companies do not
provide this and there was no response from remaining 4 companies. Hence, 84%
companies provide and specify time frame for vendors.
3884%
37%
49%
Do you specify and provide time frame for installation of required hardware devices to the vendors?
Yes No not applicable
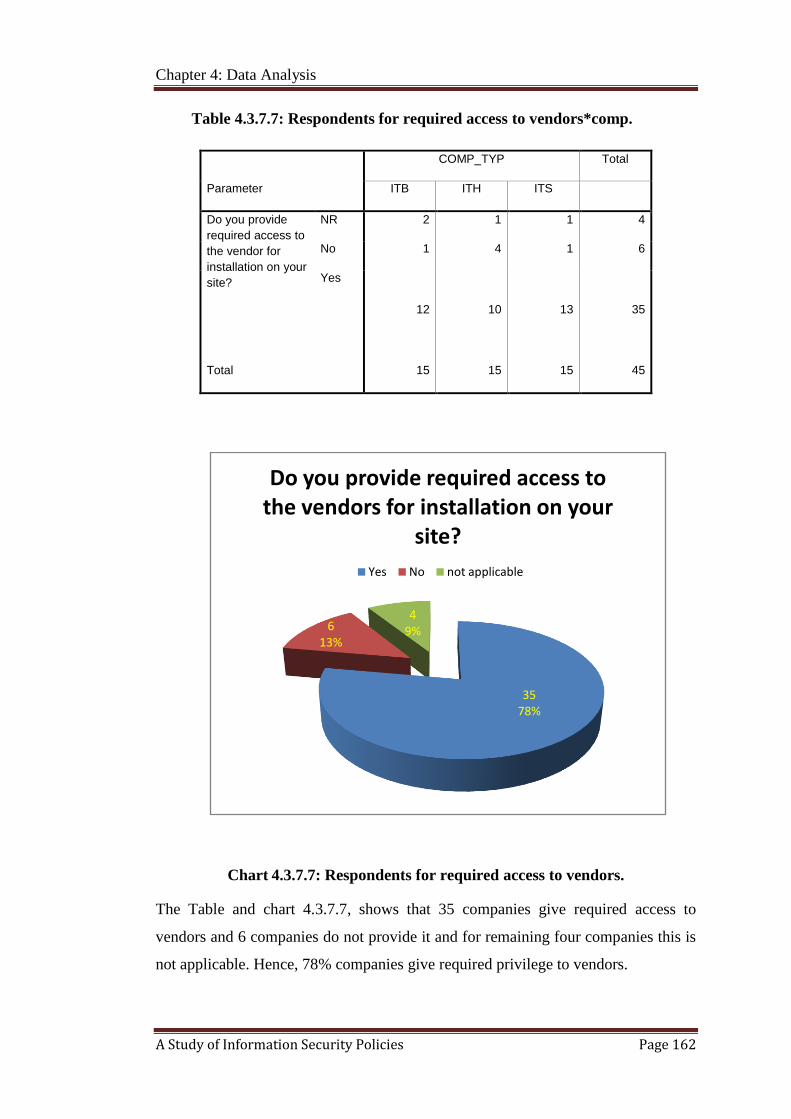
Chapter 4: Data Analysis
A Study of Information Security Policies Page 162
Table 4.3.7.7: Respondents for required access to vendors*comp.
Parameter
COMP_TYP Total
ITB ITH ITS
Do you provide
required access to
the vendor for
installation on your
site?
NR 2 1 1 4
No 1 4 1 6
Yes
12 10 13 35
Total 15 15 15 45
Chart 4.3.7.7: Respondents for required access to vendors.
The Table and chart 4.3.7.7, shows that 35 companies give required access to
vendors and 6 companies do not provide it and for remaining four companies this is
not applicable. Hence, 78% companies give required privilege to vendors.
3578%
613%
49%
Do you provide required access to the vendors for installation on your
site?
Yes No not applicable
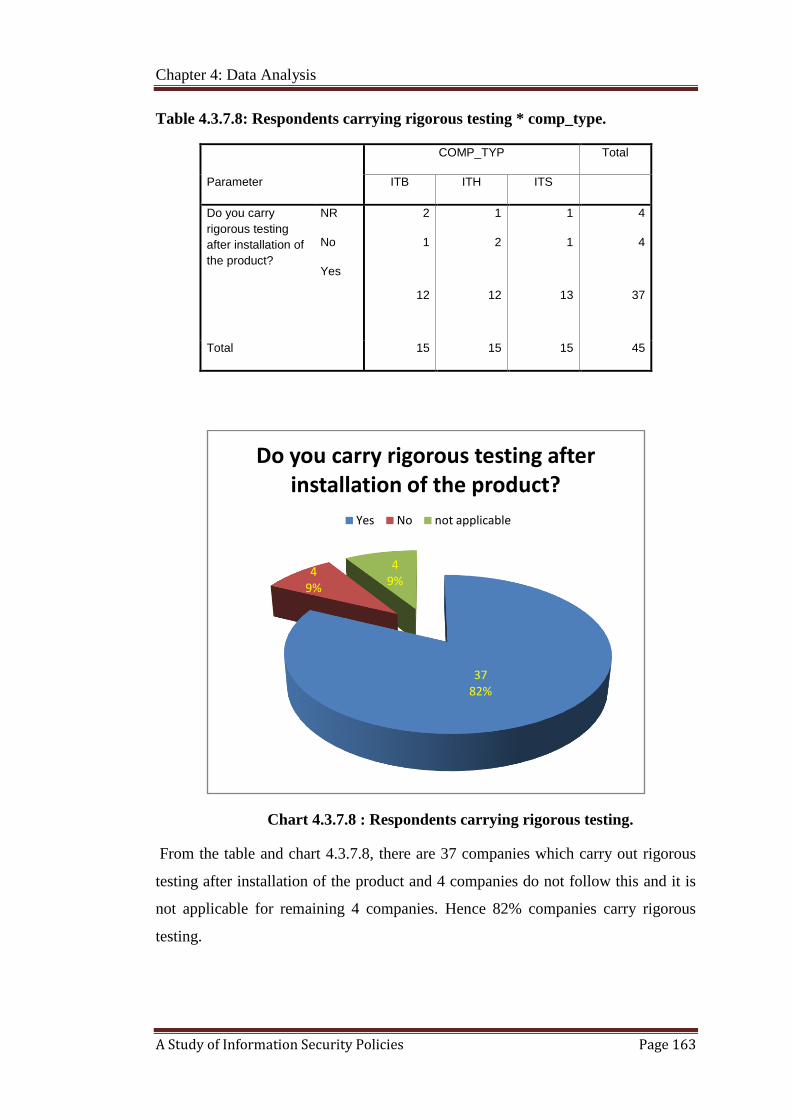
Chapter 4: Data Analysis
A Study of Information Security Policies Page 163
Table 4.3.7.8: Respondents carrying rigorous testing * comp_type.
Parameter
COMP_TYP Total
ITB ITH ITS
Do you carry
rigorous testing
after installation of
the product?
NR 2 1 1 4
No 1 2 1 4
Yes
12 12 13 37
Total 15 15 15 45
Chart 4.3.7.8 : Respondents carrying rigorous testing.
From the table and chart 4.3.7.8, there are 37 companies which carry out rigorous
testing after installation of the product and 4 companies do not follow this and it is
not applicable for remaining 4 companies. Hence 82% companies carry rigorous
testing.
3782%
49%
49%
Do you carry rigorous testing after installation of the product?
Yes No not applicable
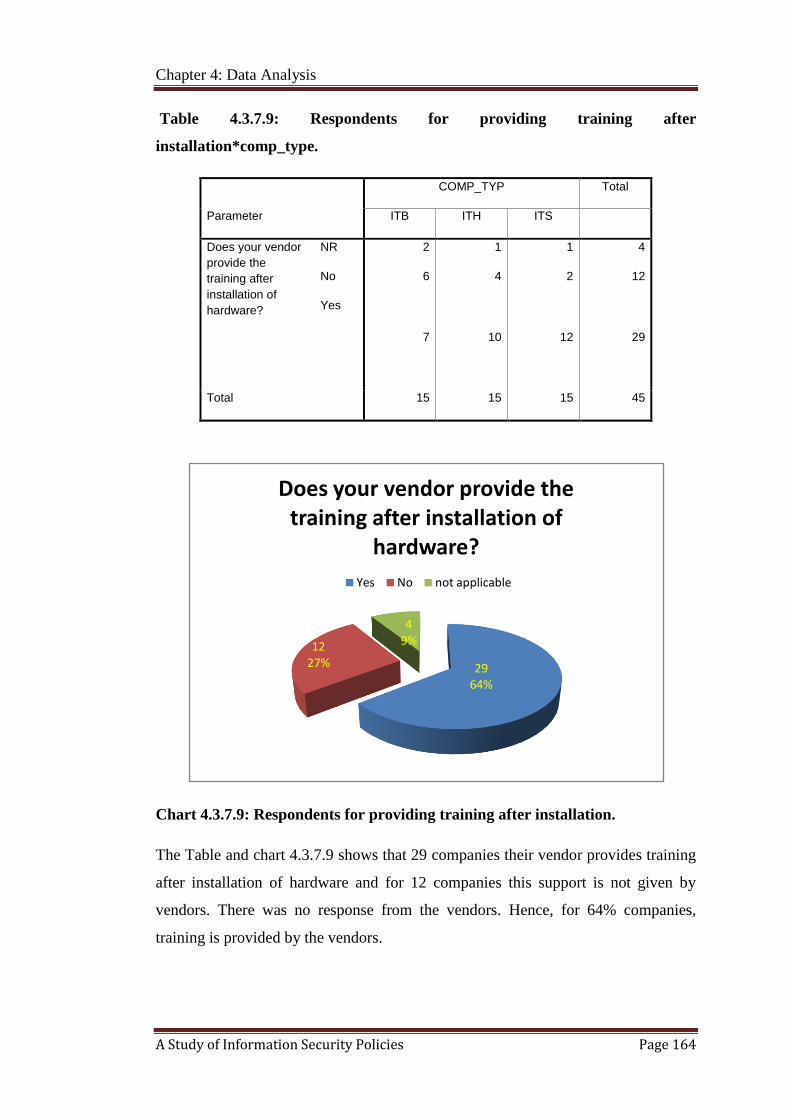
Chapter 4: Data Analysis
A Study of Information Security Policies Page 164
Table 4.3.7.9: Respondents for providing training after
installation*comp_type.
Parameter
COMP_TYP Total
ITB ITH ITS
Does your vendor
provide the
training after
installation of
hardware?
NR 2 1 1 4
No 6 4 2 12
Yes
7 10 12 29
Total 15 15 15 45
Chart 4.3.7.9: Respondents for providing training after installation.
The Table and chart 4.3.7.9 shows that 29 companies their vendor provides training
after installation of hardware and for 12 companies this support is not given by
vendors. There was no response from the vendors. Hence, for 64% companies,
training is provided by the vendors.
2964%
1227%
49%
Does your vendor provide the training after installation of
hardware?
Yes No not applicable
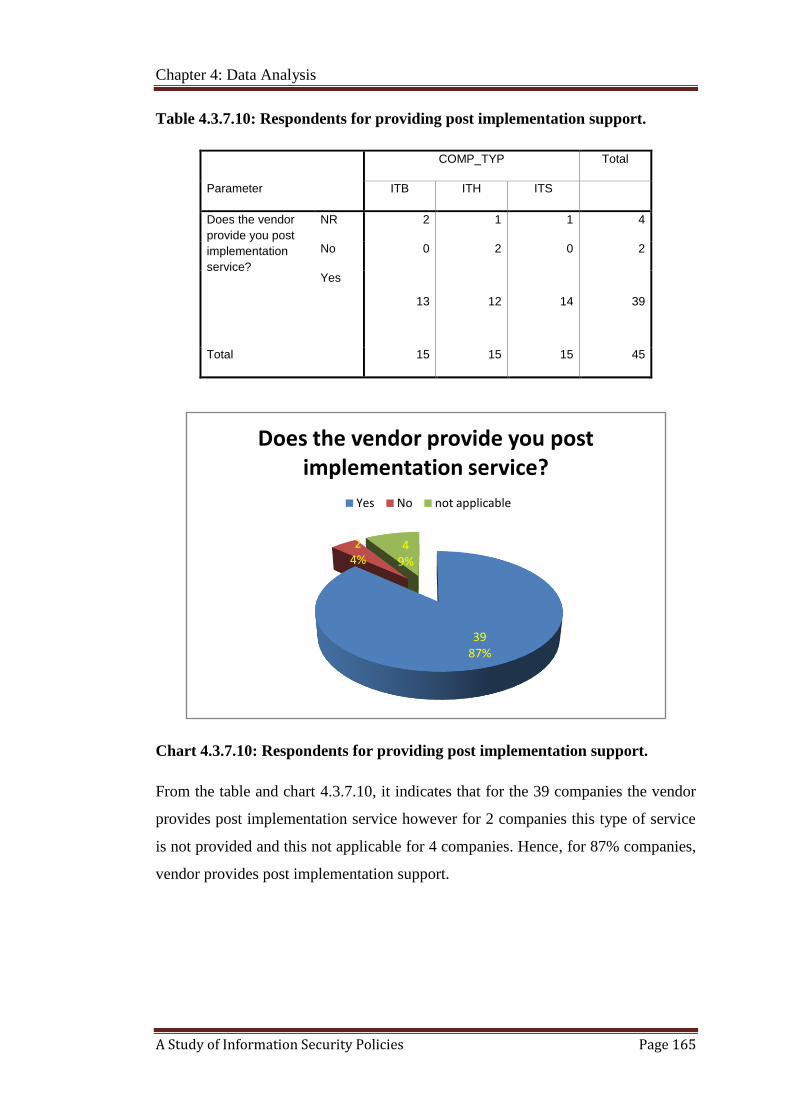
Chapter 4: Data Analysis
A Study of Information Security Policies Page 165
Table 4.3.7.10: Respondents for providing post implementation support.
Parameter
COMP_TYP Total
ITB ITH ITS
Does the vendor
provide you post
implementation
service?
NR 2 1 1 4
No 0 2 0 2
Yes
13 12 14 39
Total 15 15 15 45
Chart 4.3.7.10: Respondents for providing post implementation support.
From the table and chart 4.3.7.10, it indicates that for the 39 companies the vendor
provides post implementation service however for 2 companies this type of service
is not provided and this not applicable for 4 companies. Hence, for 87% companies,
vendor provides post implementation support.
3987%
24%
49%
Does the vendor provide you post implementation service?
Yes No not applicable
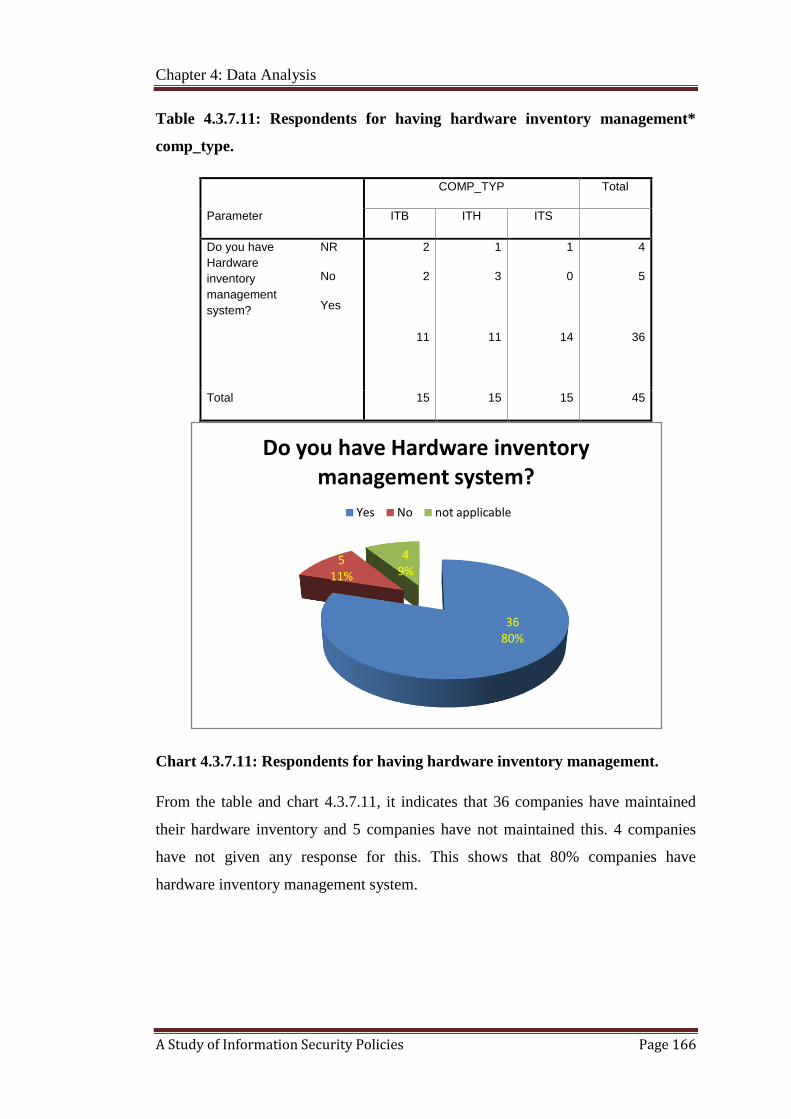
Chapter 4: Data Analysis
A Study of Information Security Policies Page 166
Table 4.3.7.11: Respondents for having hardware inventory management*
comp_type.
Parameter
COMP_TYP Total
ITB ITH ITS
Do you have
Hardware
inventory
management
system?
NR 2 1 1 4
No 2 3 0 5
Yes
11 11 14 36
Total 15 15 15 45
Chart 4.3.7.11: Respondents for having hardware inventory management.
From the table and chart 4.3.7.11, it indicates that 36 companies have maintained
their hardware inventory and 5 companies have not maintained this. 4 companies
have not given any response for this. This shows that 80% companies have
hardware inventory management system.
3680%
511%
49%
Do you have Hardware inventory management system?
Yes No not applicable
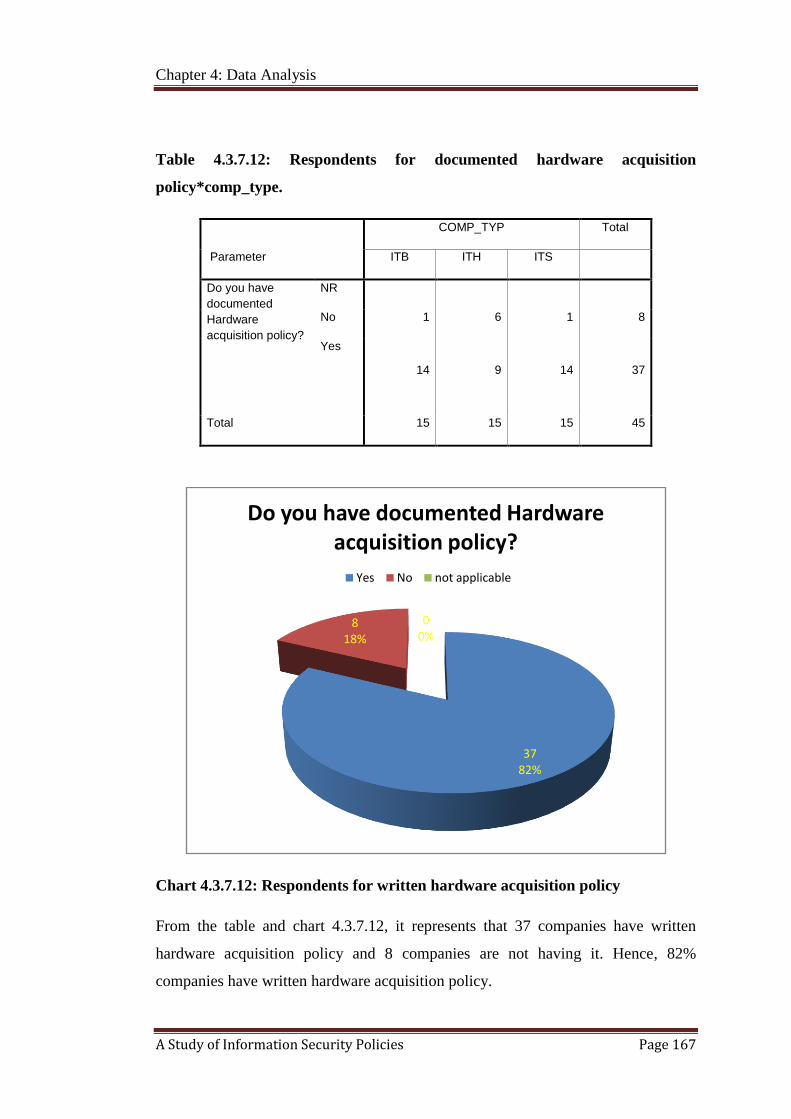
Chapter 4: Data Analysis
A Study of Information Security Policies Page 167
Table 4.3.7.12: Respondents for documented hardware acquisition
policy*comp_type.
Parameter
COMP_TYP Total
ITB ITH ITS
Do you have
documented
Hardware
acquisition policy?
NR
No 1 6 1 8
Yes
14 9 14 37
Total 15 15 15 45
Chart 4.3.7.12: Respondents for written hardware acquisition policy
From the table and chart 4.3.7.12, it represents that 37 companies have written
hardware acquisition policy and 8 companies are not having it. Hence, 82%
companies have written hardware acquisition policy.
3782%
818%
00%
Do you have documented Hardware acquisition policy?
Yes No not applicable
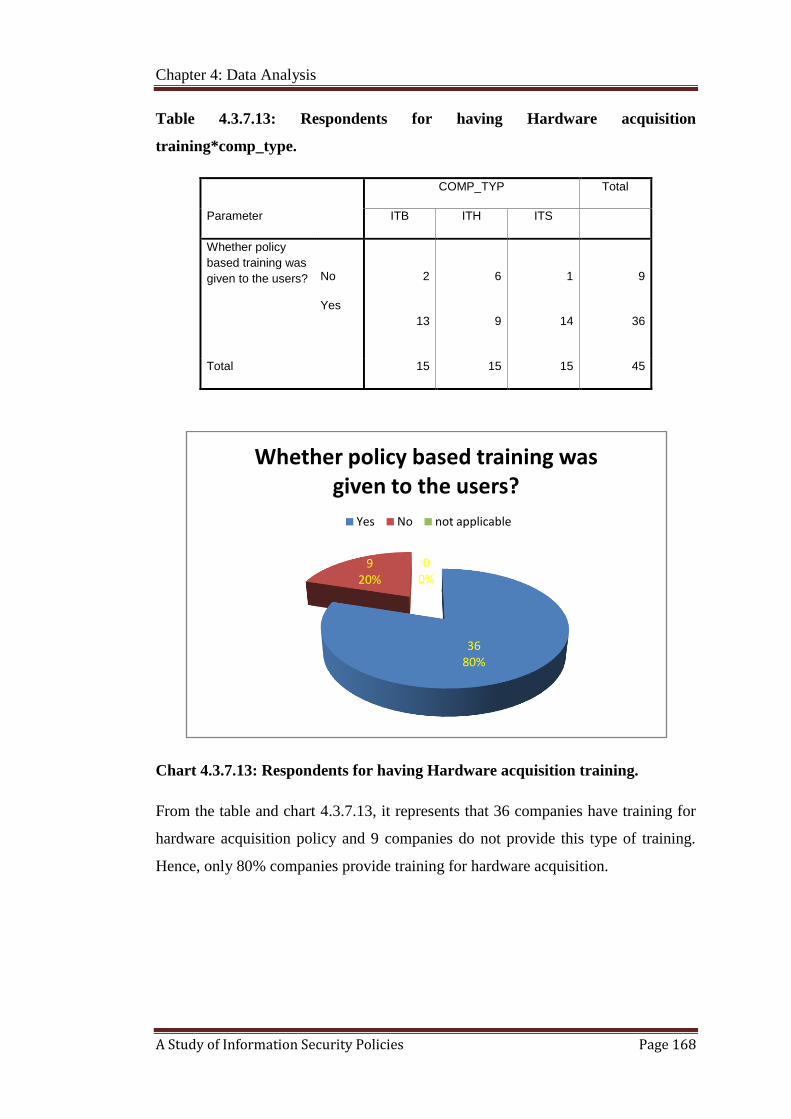
Chapter 4: Data Analysis
A Study of Information Security Policies Page 168
Table 4.3.7.13: Respondents for having Hardware acquisition
training*comp_type.
Parameter
COMP_TYP Total
ITB ITH ITS
Whether policy
based training was
given to the users?
No 2 6 1 9
Yes
13 9 14 36
Total 15 15 15 45
Chart 4.3.7.13: Respondents for having Hardware acquisition training.
From the table and chart 4.3.7.13, it represents that 36 companies have training for
hardware acquisition policy and 9 companies do not provide this type of training.
Hence, only 80% companies provide training for hardware acquisition.
3680%
920%
00%
Whether policy based training was given to the users?
Yes No not applicable
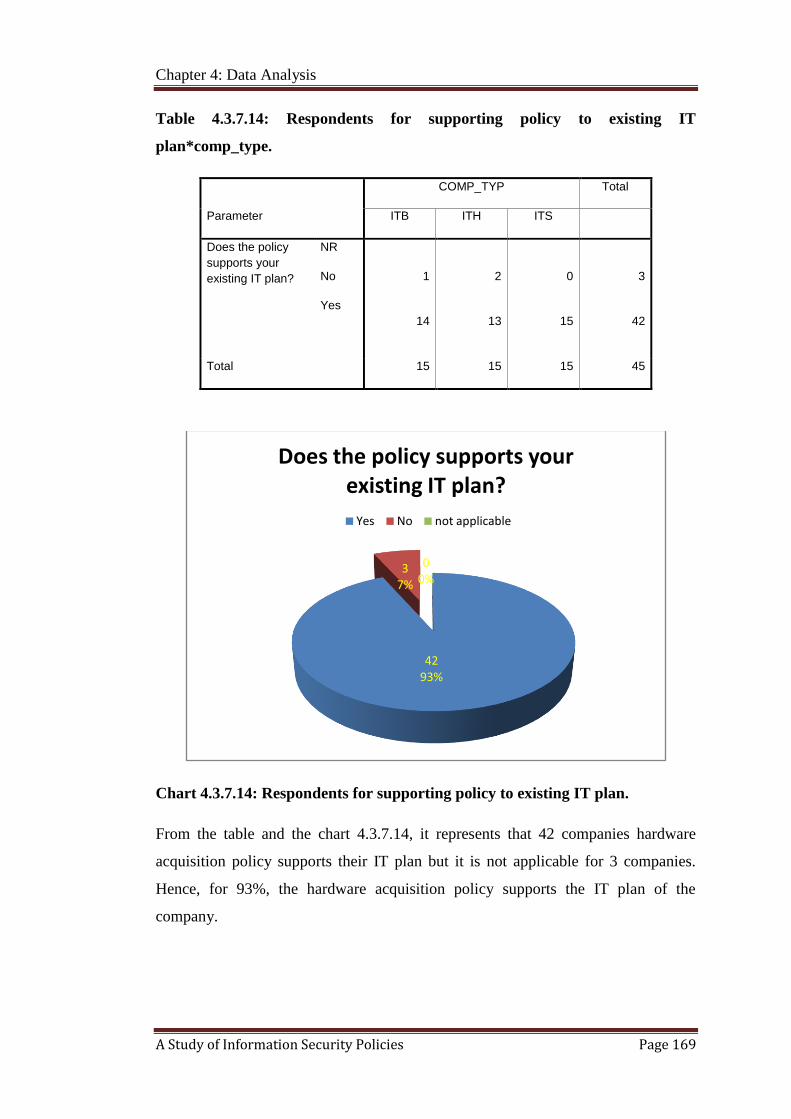
Chapter 4: Data Analysis
A Study of Information Security Policies Page 169
Table 4.3.7.14: Respondents for supporting policy to existing IT
plan*comp_type.
Parameter
COMP_TYP Total
ITB ITH ITS
Does the policy
supports your
existing IT plan?
NR
No 1 2 0 3
Yes
14 13 15 42
Total 15 15 15 45
Chart 4.3.7.14: Respondents for supporting policy to existing IT plan.
From the table and the chart 4.3.7.14, it represents that 42 companies hardware
acquisition policy supports their IT plan but it is not applicable for 3 companies.
Hence, for 93%, the hardware acquisition policy supports the IT plan of the
company.
4293%
37%
00%
Does the policy supports your existing IT plan?
Yes No not applicable
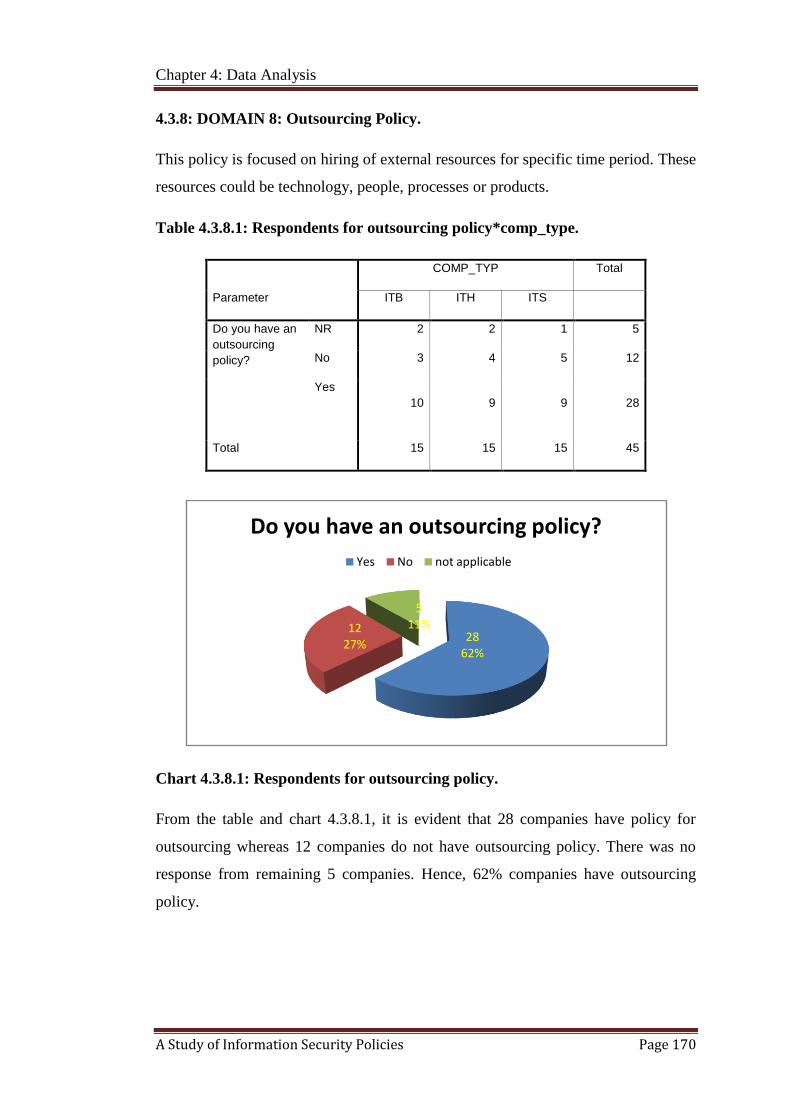
Chapter 4: Data Analysis
A Study of Information Security Policies Page 170
4.3.8: DOMAIN 8: Outsourcing Policy.
This policy is focused on hiring of external resources for specific time period. These
resources could be technology, people, processes or products.
Table 4.3.8.1: Respondents for outsourcing policy*comp_type.
Parameter
COMP_TYP Total
ITB ITH ITS
Do you have an
outsourcing
policy?
NR 2 2 1 5
No 3 4 5 12
Yes
10 9 9 28
Total 15 15 15 45
Chart 4.3.8.1: Respondents for outsourcing policy.
From the table and chart 4.3.8.1, it is evident that 28 companies have policy for
outsourcing whereas 12 companies do not have outsourcing policy. There was no
response from remaining 5 companies. Hence, 62% companies have outsourcing
policy.
2862%
1227%
511%
Do you have an outsourcing policy?
Yes No not applicable
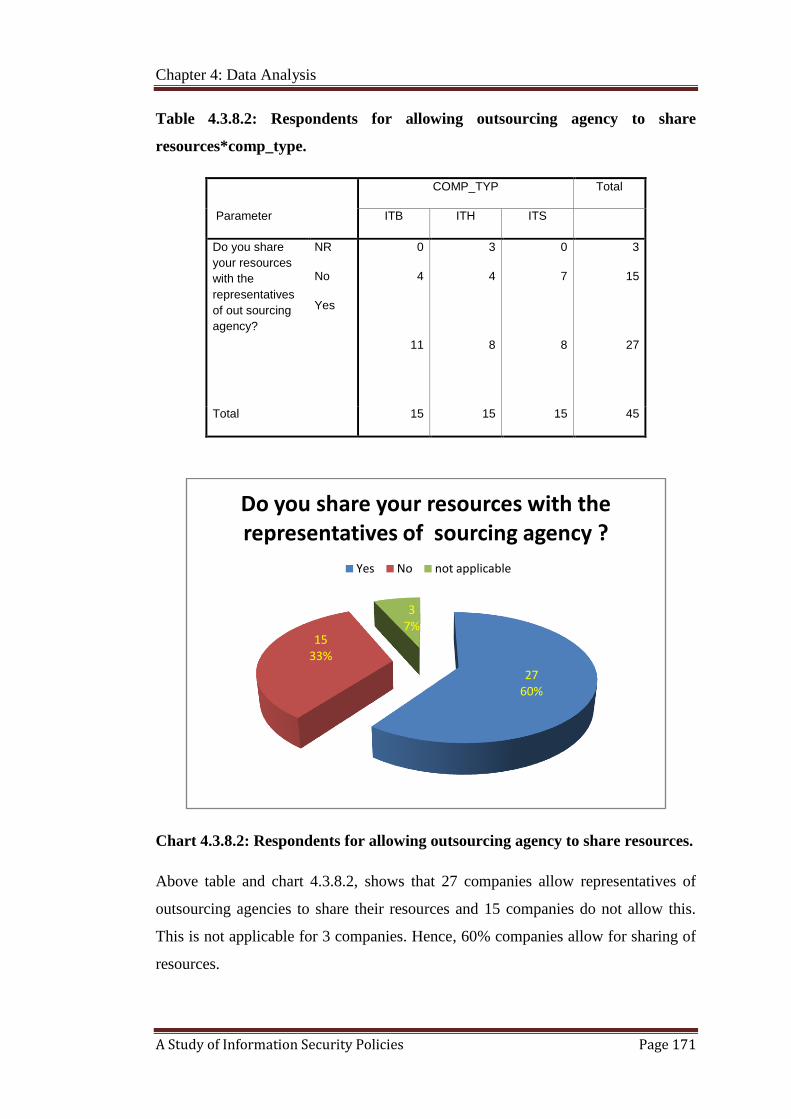
Chapter 4: Data Analysis
A Study of Information Security Policies Page 171
Table 4.3.8.2: Respondents for allowing outsourcing agency to share
resources*comp_type.
Parameter
COMP_TYP Total
ITB ITH ITS
Do you share
your resources
with the
representatives
of out sourcing
agency?
NR 0 3 0 3
No 4 4 7 15
Yes
11 8 8 27
Total 15 15 15 45
Chart 4.3.8.2: Respondents for allowing outsourcing agency to share resources.
Above table and chart 4.3.8.2, shows that 27 companies allow representatives of
outsourcing agencies to share their resources and 15 companies do not allow this.
This is not applicable for 3 companies. Hence, 60% companies allow for sharing of
resources.
2760%
1533%
37%
Do you share your resources with the representatives of sourcing agency ?
Yes No not applicable

Chapter 4: Data Analysis
A Study of Information Security Policies Page 172
Table 4.3.8.3: Respondents for outsourcing technology*comp-type.
Parameter
COMP_TYP Total
ITB ITH ITS
Do you
outsource
specific
technology as
per the
requirements
of projects?
NR 1 3 1 5
No 10 10 9 29
Yes
4 2 5 11
Total 15 15 15 45
Chart 4.3.8.3: Respondents for outsourcing technology.
The Table and chart 4.3.8.3, indicates that only 11 companies outsource technology
whereas 29 companies do not outsource technology and this is not applicable to
remaining 5 companies. Hence, 25% companies can only outsource technology for
required projects.
1125%
2964%
511%
Do you outsource specific technology for requirements of projects?
Yes No not applicable
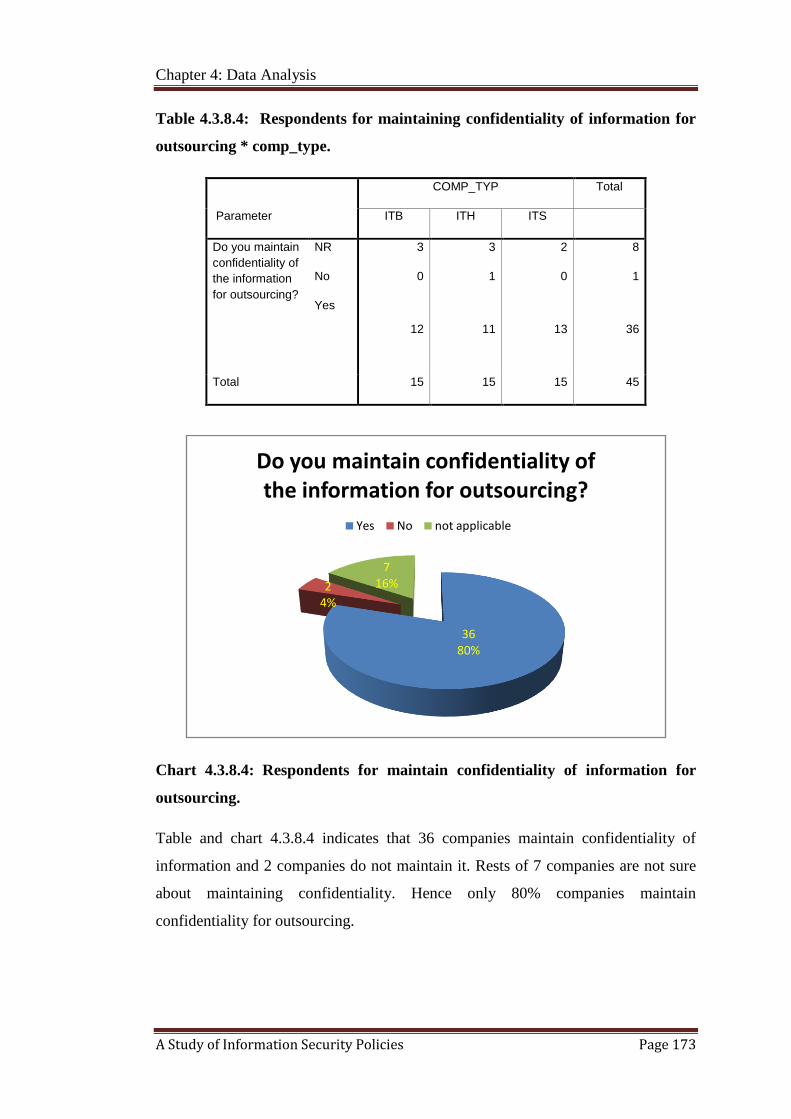
Chapter 4: Data Analysis
A Study of Information Security Policies Page 173
Table 4.3.8.4: Respondents for maintaining confidentiality of information for
outsourcing * comp_type.
Parameter
COMP_TYP Total
ITB ITH ITS
Do you maintain
confidentiality of
the information
for outsourcing?
NR 3 3 2 8
No 0 1 0 1
Yes
12 11 13 36
Total 15 15 15 45
Chart 4.3.8.4: Respondents for maintain confidentiality of information for
outsourcing.
Table and chart 4.3.8.4 indicates that 36 companies maintain confidentiality of
information and 2 companies do not maintain it. Rests of 7 companies are not sure
about maintaining confidentiality. Hence only 80% companies maintain
confidentiality for outsourcing.
3680%
24%
716%
Do you maintain confidentiality of the information for outsourcing?
Yes No not applicable
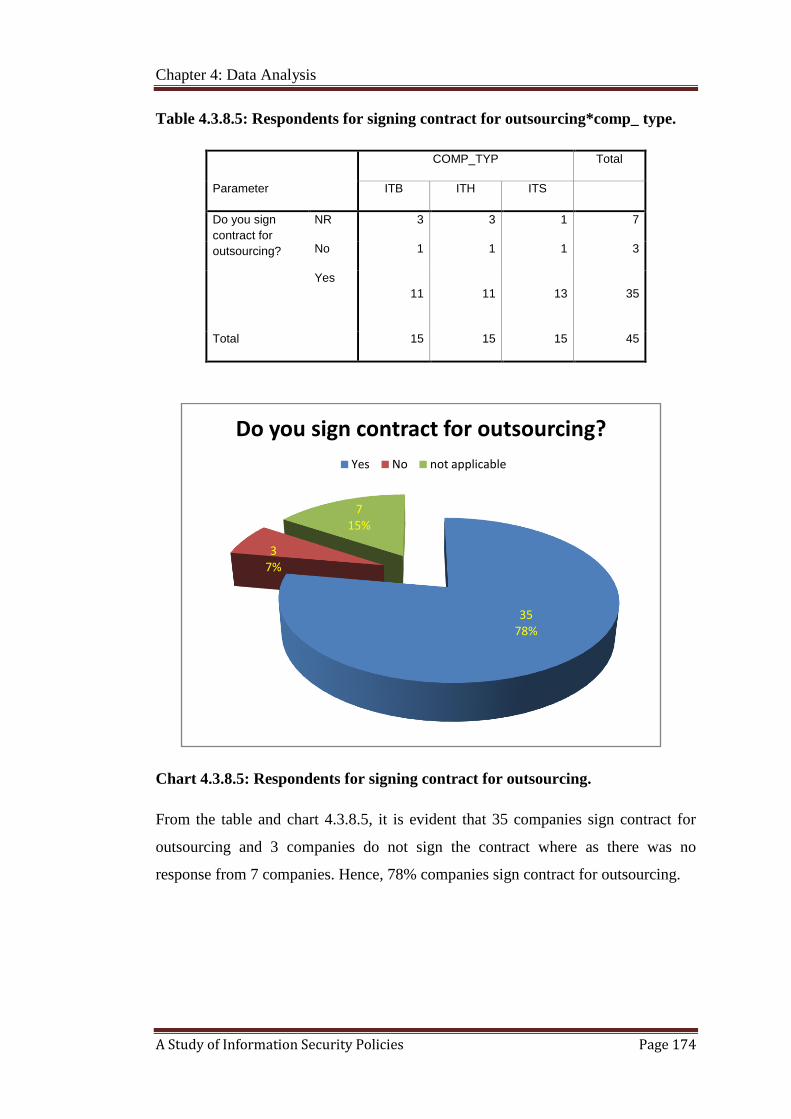
Chapter 4: Data Analysis
A Study of Information Security Policies Page 174
Table 4.3.8.5: Respondents for signing contract for outsourcing*comp_ type.
Parameter
COMP_TYP Total
ITB ITH ITS
Do you sign
contract for
outsourcing?
NR 3 3 1 7
No 1 1 1 3
Yes
11 11 13 35
Total 15 15 15 45
Chart 4.3.8.5: Respondents for signing contract for outsourcing.
From the table and chart 4.3.8.5, it is evident that 35 companies sign contract for
outsourcing and 3 companies do not sign the contract where as there was no
response from 7 companies. Hence, 78% companies sign contract for outsourcing.
3578%
37%
715%
Do you sign contract for outsourcing?
Yes No not applicable
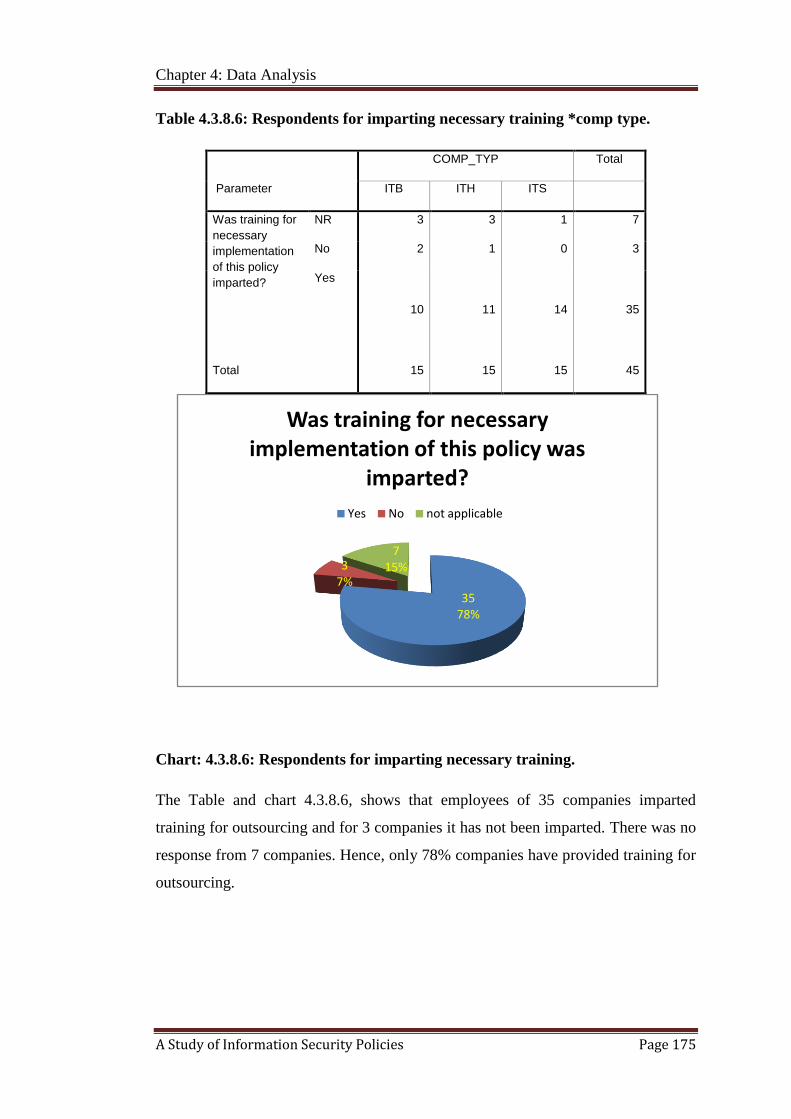
Chapter 4: Data Analysis
A Study of Information Security Policies Page 175
Table 4.3.8.6: Respondents for imparting necessary training *comp type.
Parameter
COMP_TYP Total
ITB ITH ITS
Was training for
necessary
implementation
of this policy
imparted?
NR 3 3 1 7
No 2 1 0 3
Yes
10 11 14 35
Total 15 15 15 45
Chart: 4.3.8.6: Respondents for imparting necessary training.
The Table and chart 4.3.8.6, shows that employees of 35 companies imparted
training for outsourcing and for 3 companies it has not been imparted. There was no
response from 7 companies. Hence, only 78% companies have provided training for
outsourcing.
3578%
37%
715%
Was training for necessary implementation of this policy was
imparted?
Yes No not applicable
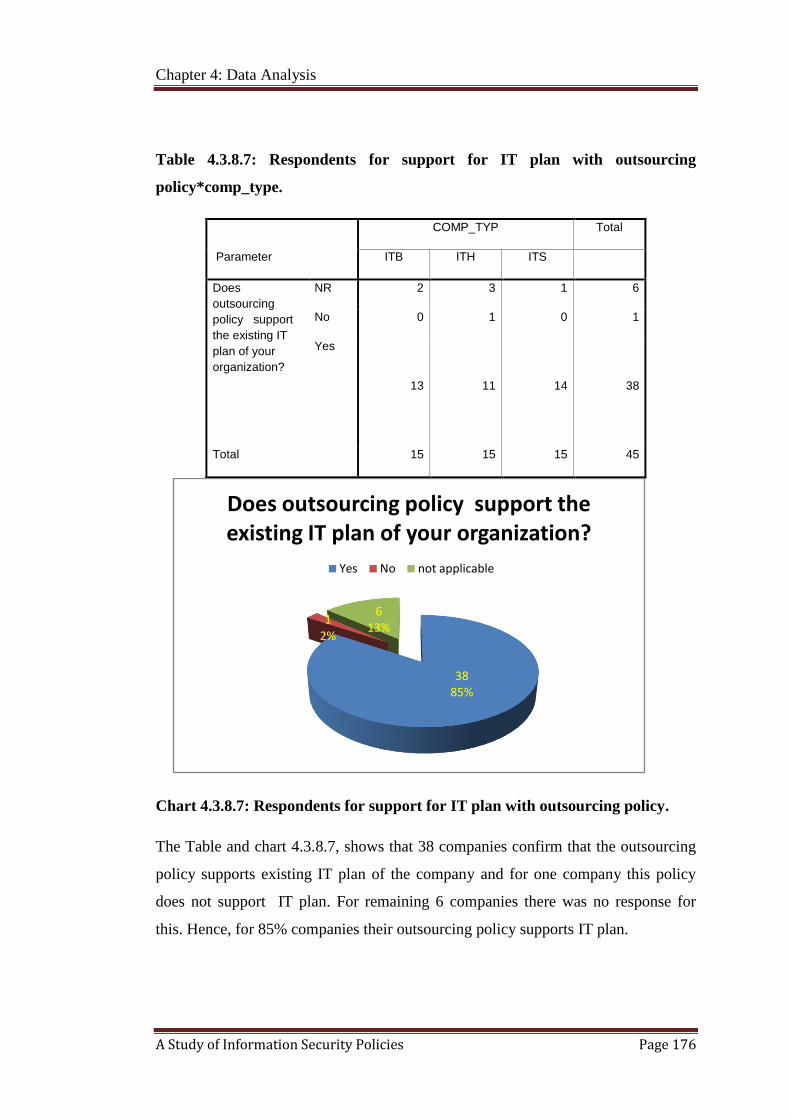
Chapter 4: Data Analysis
A Study of Information Security Policies Page 176
Table 4.3.8.7: Respondents for support for IT plan with outsourcing
policy*comp_type.
Parameter
COMP_TYP Total
ITB ITH ITS
Does
outsourcing
policy support
the existing IT
plan of your
organization?
NR 2 3 1 6
No 0 1 0 1
Yes
13 11 14 38
Total 15 15 15 45
Chart 4.3.8.7: Respondents for support for IT plan with outsourcing policy.
The Table and chart 4.3.8.7, shows that 38 companies confirm that the outsourcing
policy supports existing IT plan of the company and for one company this policy
does not support IT plan. For remaining 6 companies there was no response for
this. Hence, for 85% companies their outsourcing policy supports IT plan.
3885%
12%
613%
Does outsourcing policy support the existing IT plan of your organization?
Yes No not applicable
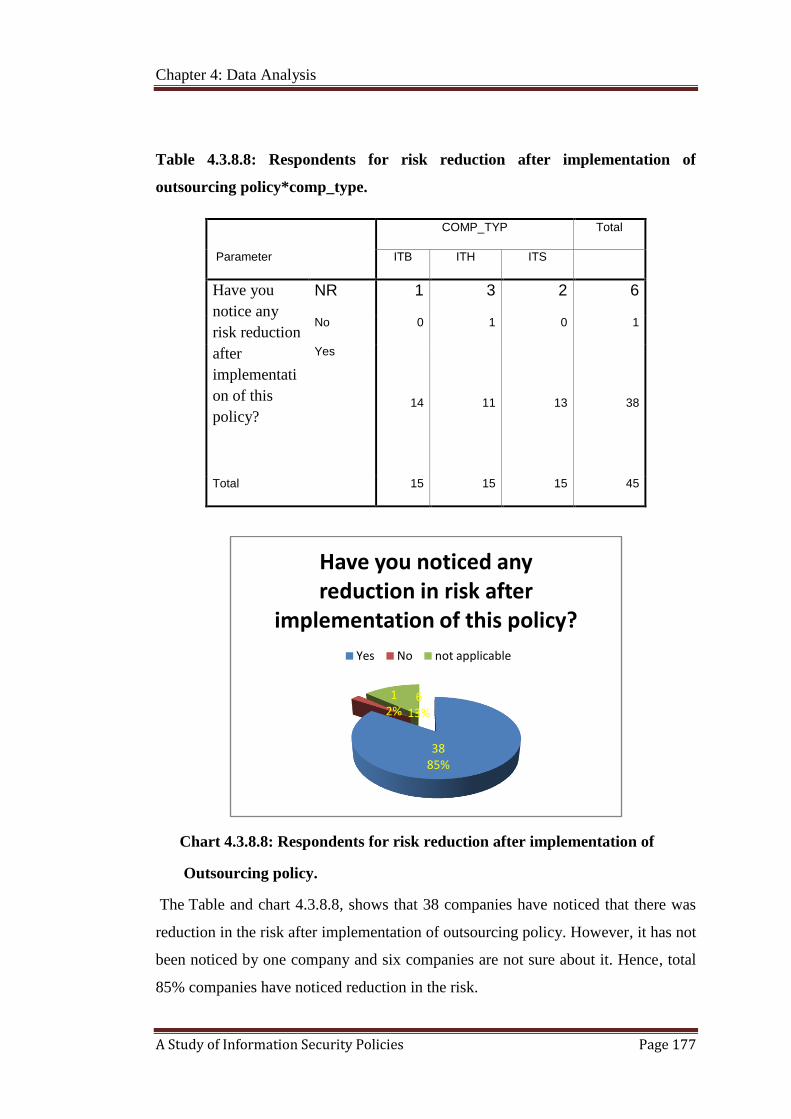
Chapter 4: Data Analysis
A Study of Information Security Policies Page 177
Table 4.3.8.8: Respondents for risk reduction after implementation of
outsourcing policy*comp_type.
Parameter
COMP_TYP Total
ITB ITH ITS
Have you
notice any
risk reduction
after
implementati
on of this
policy?
NR 1 3 2 6
No 0 1 0 1
Yes
14 11 13 38
Total 15 15 15 45
Chart 4.3.8.8: Respondents for risk reduction after implementation of
Outsourcing policy.
The Table and chart 4.3.8.8, shows that 38 companies have noticed that there was
reduction in the risk after implementation of outsourcing policy. However, it has not
been noticed by one company and six companies are not sure about it. Hence, total
85% companies have noticed reduction in the risk.
3885%
12%
613%
Have you noticed any reduction in risk after
implementation of this policy?
Yes No not applicable
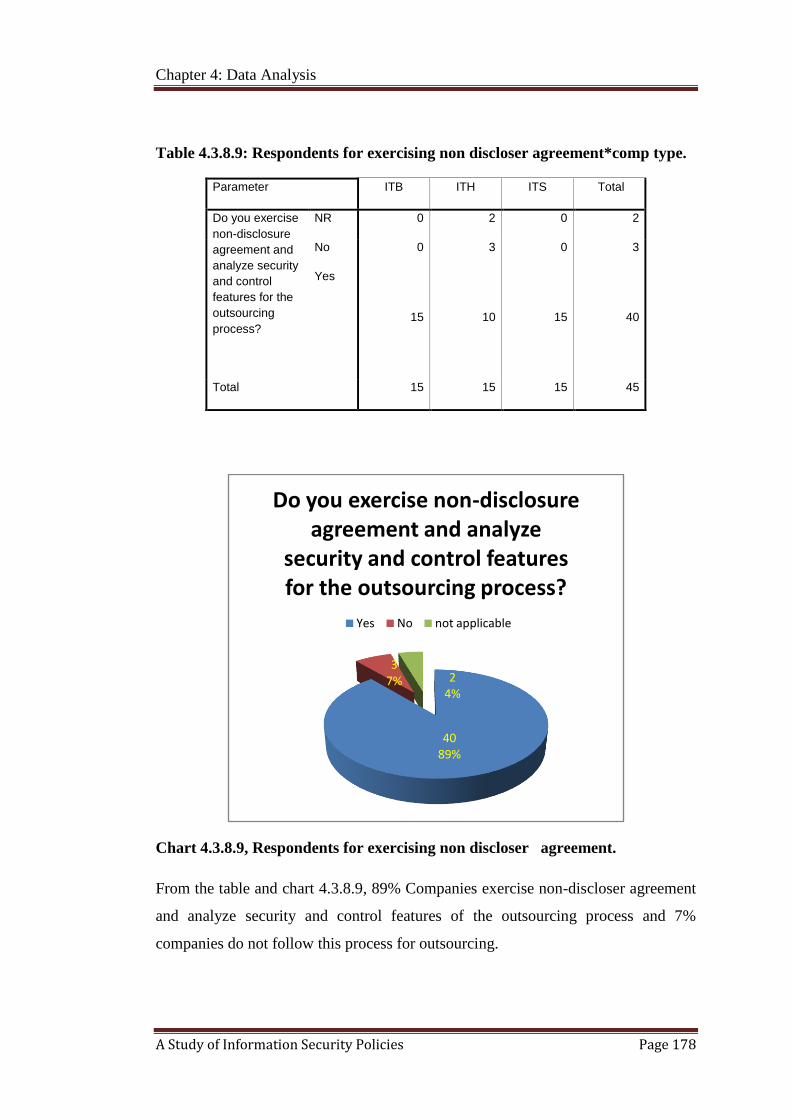
Chapter 4: Data Analysis
A Study of Information Security Policies Page 178
Table 4.3.8.9: Respondents for exercising non discloser agreement*comp type.
Parameter ITB ITH ITS Total
Do you exercise
non-disclosure
agreement and
analyze security
and control
features for the
outsourcing
process?
NR 0 2 0 2
No 0 3 0 3
Yes
15 10 15 40
Total 15 15 15 45
Chart 4.3.8.9, Respondents for exercising non discloser agreement.
From the table and chart 4.3.8.9, 89% Companies exercise non-discloser agreement
and analyze security and control features of the outsourcing process and 7%
companies do not follow this process for outsourcing.
4089%
37% 2
4%
Do you exercise non-disclosure agreement and analyze
security and control features for the outsourcing process?
Yes No not applicable
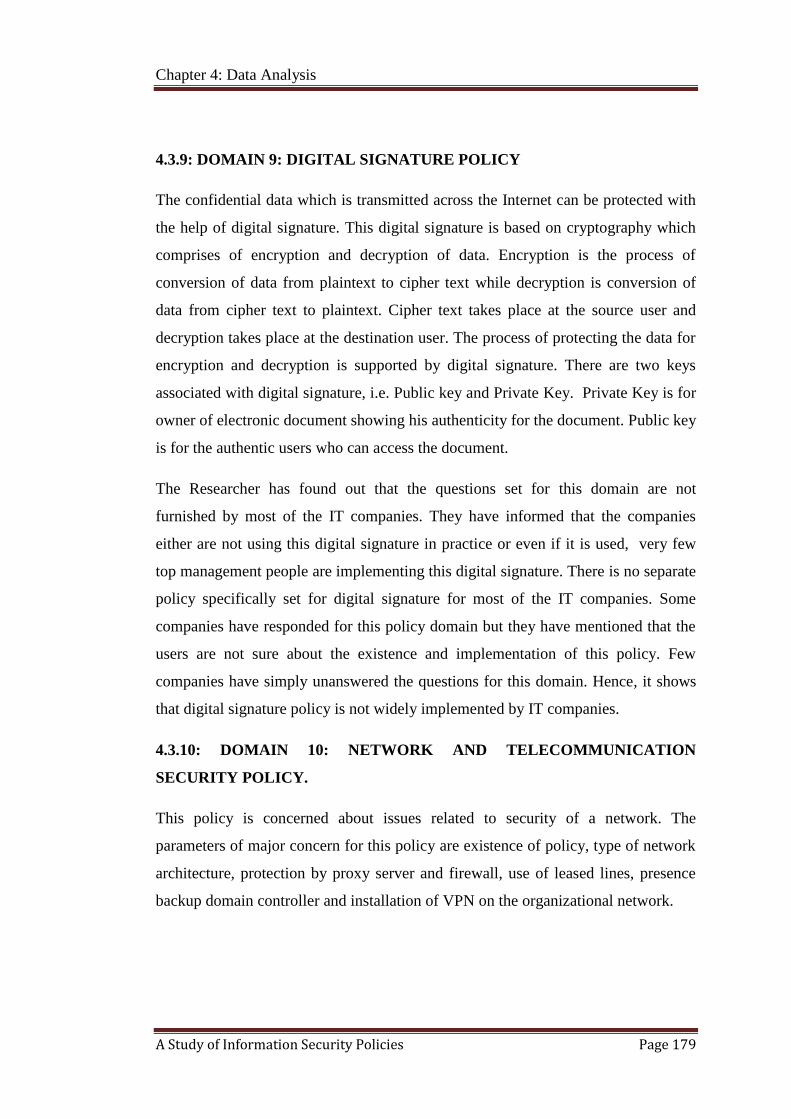
Chapter 4: Data Analysis
A Study of Information Security Policies Page 179
4.3.9: DOMAIN 9: DIGITAL SIGNATURE POLICY
The confidential data which is transmitted across the Internet can be protected with
the help of digital signature. This digital signature is based on cryptography which
comprises of encryption and decryption of data. Encryption is the process of
conversion of data from plaintext to cipher text while decryption is conversion of
data from cipher text to plaintext. Cipher text takes place at the source user and
decryption takes place at the destination user. The process of protecting the data for
encryption and decryption is supported by digital signature. There are two keys
associated with digital signature, i.e. Public key and Private Key. Private Key is for
owner of electronic document showing his authenticity for the document. Public key
is for the authentic users who can access the document.
The Researcher has found out that the questions set for this domain are not
furnished by most of the IT companies. They have informed that the companies
either are not using this digital signature in practice or even if it is used, very few
top management people are implementing this digital signature. There is no separate
policy specifically set for digital signature for most of the IT companies. Some
companies have responded for this policy domain but they have mentioned that the
users are not sure about the existence and implementation of this policy. Few
companies have simply unanswered the questions for this domain. Hence, it shows
that digital signature policy is not widely implemented by IT companies.
4.3.10: DOMAIN 10: NETWORK AND TELECOMMUNICATION
SECURITY POLICY.
This policy is concerned about issues related to security of a network. The
parameters of major concern for this policy are existence of policy, type of network
architecture, protection by proxy server and firewall, use of leased lines, presence
backup domain controller and installation of VPN on the organizational network.
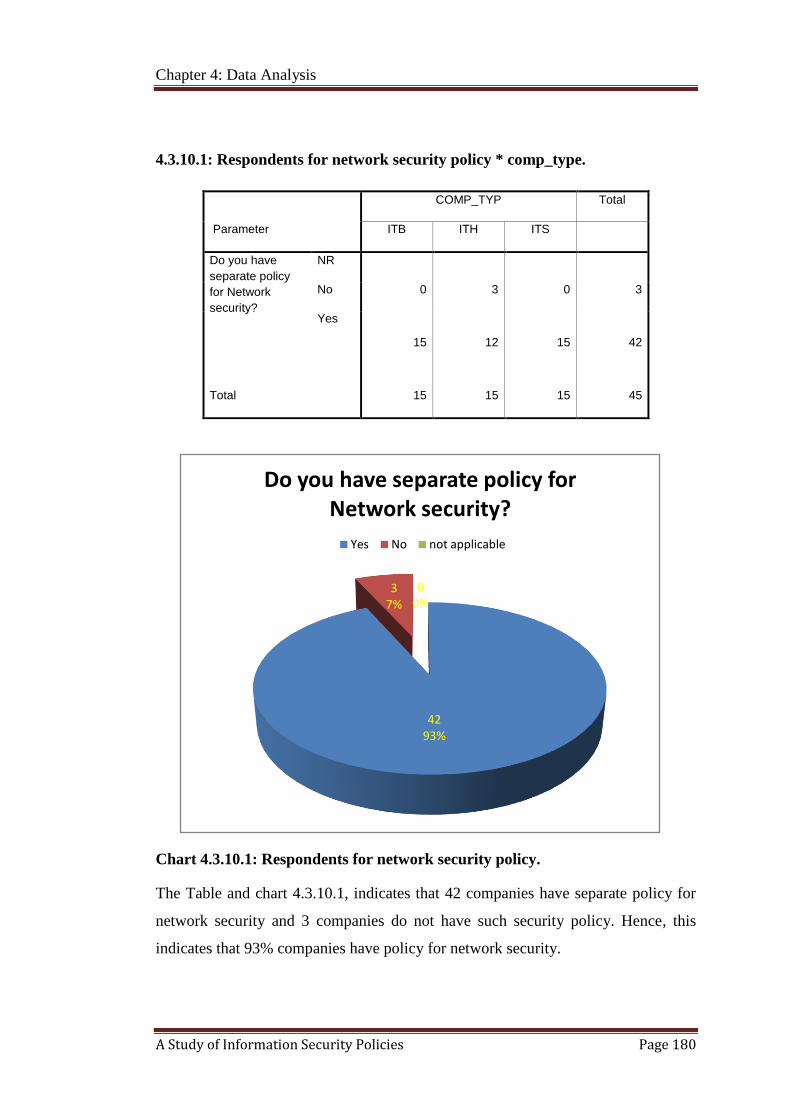
Chapter 4: Data Analysis
A Study of Information Security Policies Page 180
4.3.10.1: Respondents for network security policy * comp_type.
Parameter
COMP_TYP Total
ITB ITH ITS
Do you have
separate policy
for Network
security?
NR
No 0 3 0 3
Yes
15 12 15 42
Total 15 15 15 45
Chart 4.3.10.1: Respondents for network security policy.
The Table and chart 4.3.10.1, indicates that 42 companies have separate policy for
network security and 3 companies do not have such security policy. Hence, this
indicates that 93% companies have policy for network security.
4293%
37%
00%
Do you have separate policy for Network security?
Yes No not applicable
Chapter 4: Data Analysis
A Study of Information Security Policies Page 181
Table 4.3.10.2: Respondents for using client- server architecture* comp_type.
Parameter
COMP_TYP Total
ITB ITH ITS
Do you use client
server
architecture?
NR 3 1 0 4
No 0 2 0 2
Yes
12 12 15 39
Total 15 15 15 45
Chart 4.3.10.2: Respondents for using client- server architecture.
From above table and chart 4.3.10.2, it shows that 39 companies have client-server
architecture and 2 companies do not have this architecture. Remaining 4 companies
have not responded for this. Hence this indicates that 87% companies have client
server architecture.
3987%
24%
49%
Do you use client server architecture?
Yes No not applicable
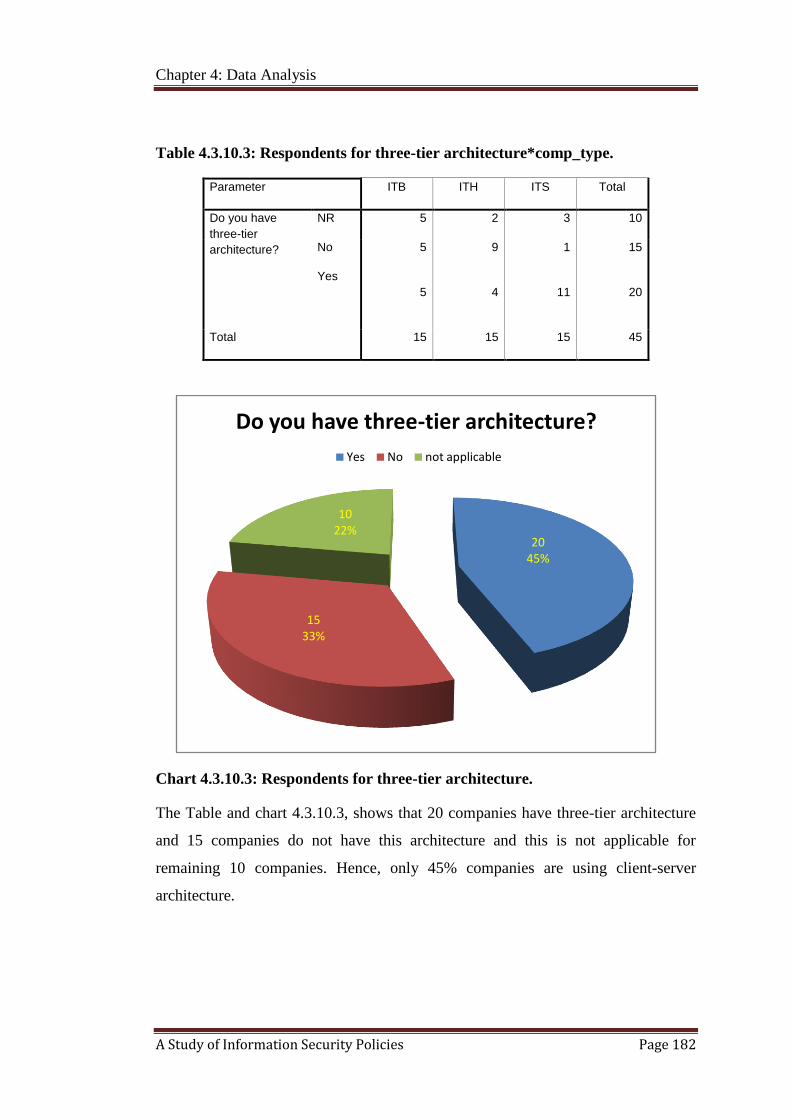
Chapter 4: Data Analysis
A Study of Information Security Policies Page 182
Table 4.3.10.3: Respondents for three-tier architecture*comp_type.
Parameter ITB ITH ITS Total
Do you have
three-tier
architecture?
NR 5 2 3 10
No 5 9 1 15
Yes
5 4 11 20
Total 15 15 15 45
Chart 4.3.10.3: Respondents for three-tier architecture.
The Table and chart 4.3.10.3, shows that 20 companies have three-tier architecture
and 15 companies do not have this architecture and this is not applicable for
remaining 10 companies. Hence, only 45% companies are using client-server
architecture.
2045%
1533%
1022%
Do you have three-tier architecture?
Yes No not applicable
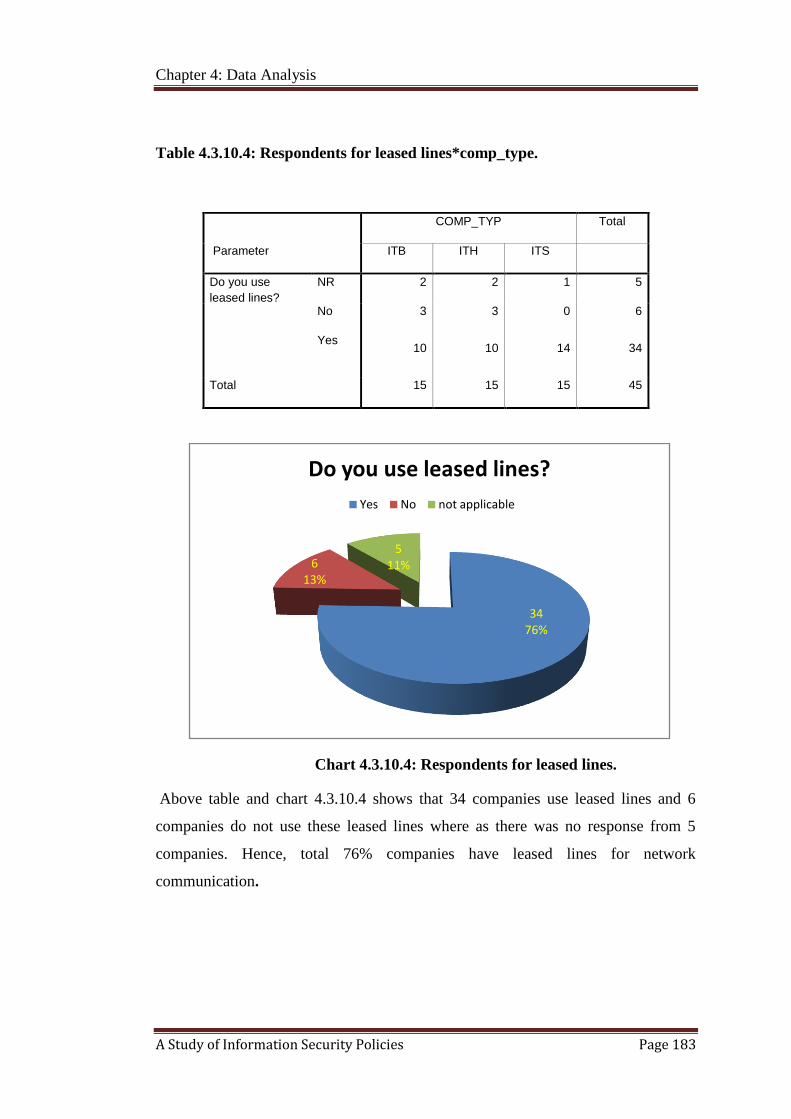
Chapter 4: Data Analysis
A Study of Information Security Policies Page 183
Table 4.3.10.4: Respondents for leased lines*comp_type.
Parameter
COMP_TYP Total
ITB ITH ITS
Do you use
leased lines?
NR 2 2 1 5
No 3 3 0 6
Yes 10 10 14 34
Total 15 15 15 45
Chart 4.3.10.4: Respondents for leased lines.
Above table and chart 4.3.10.4 shows that 34 companies use leased lines and 6
companies do not use these leased lines where as there was no response from 5
companies. Hence, total 76% companies have leased lines for network
communication.
3476%
613%
511%
Do you use leased lines?
Yes No not applicable
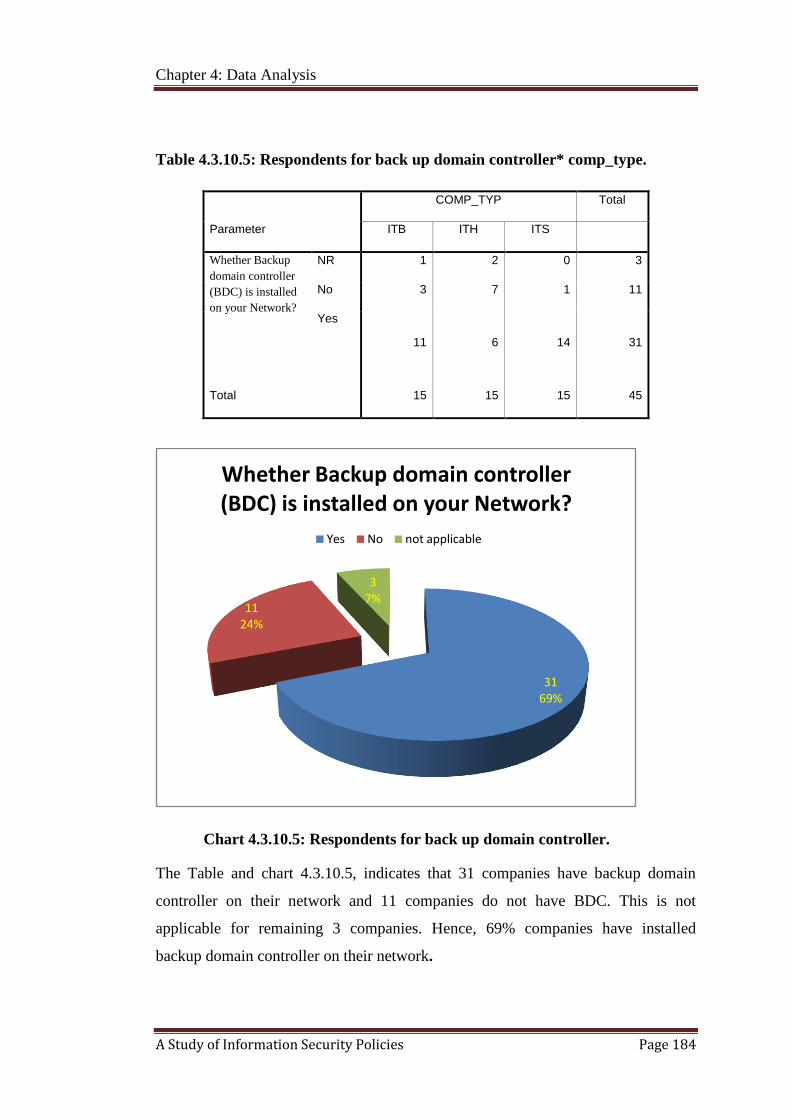
Chapter 4: Data Analysis
A Study of Information Security Policies Page 184
Table 4.3.10.5: Respondents for back up domain controller* comp_type.
Parameter
COMP_TYP Total
ITB ITH ITS
Whether Backup
domain controller
(BDC) is installed
on your Network?
NR 1 2 0 3
No 3 7 1 11
Yes
11 6 14 31
Total 15 15 15 45
Chart 4.3.10.5: Respondents for back up domain controller.
The Table and chart 4.3.10.5, indicates that 31 companies have backup domain
controller on their network and 11 companies do not have BDC. This is not
applicable for remaining 3 companies. Hence, 69% companies have installed
backup domain controller on their network.
3169%
1124%
37%
Whether Backup domain controller (BDC) is installed on your Network?
Yes No not applicable
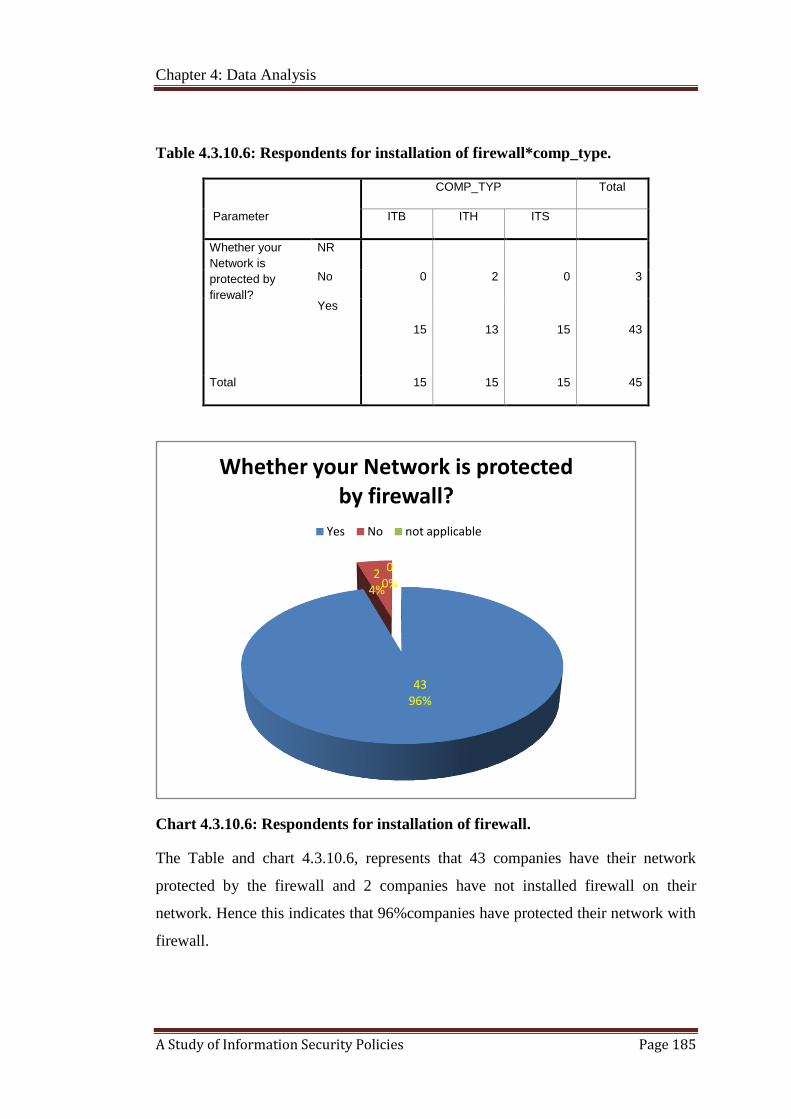
Chapter 4: Data Analysis
A Study of Information Security Policies Page 185
Table 4.3.10.6: Respondents for installation of firewall*comp_type.
Parameter
COMP_TYP Total
ITB ITH ITS
Whether your
Network is
protected by
firewall?
NR
No 0 2 0 3
Yes
15 13 15 43
Total 15 15 15 45
Chart 4.3.10.6: Respondents for installation of firewall.
The Table and chart 4.3.10.6, represents that 43 companies have their network
protected by the firewall and 2 companies have not installed firewall on their
network. Hence this indicates that 96%companies have protected their network with
firewall.
4396%
24%
00%
Whether your Network is protected by firewall?
Yes No not applicable
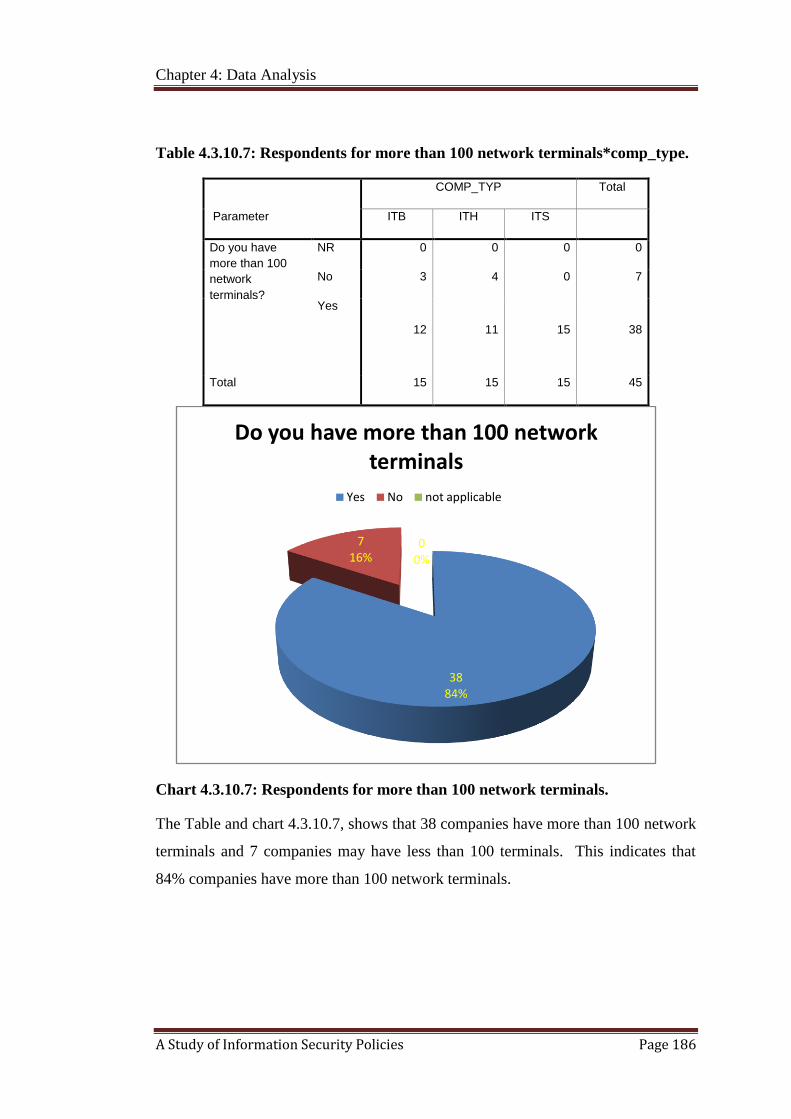
Chapter 4: Data Analysis
A Study of Information Security Policies Page 186
Table 4.3.10.7: Respondents for more than 100 network terminals*comp_type.
Parameter
COMP_TYP Total
ITB ITH ITS
Do you have
more than 100
network
terminals?
NR 0 0 0 0
No 3 4 0 7
Yes
12 11 15 38
Total 15 15 15 45
Chart 4.3.10.7: Respondents for more than 100 network terminals.
The Table and chart 4.3.10.7, shows that 38 companies have more than 100 network
terminals and 7 companies may have less than 100 terminals. This indicates that
84% companies have more than 100 network terminals.
3884%
716%
00%
Do you have more than 100 network terminals
Yes No not applicable

Chapter 4: Data Analysis
A Study of Information Security Policies Page 187
Table 4.3.10.8: Respondents with their own organizational VPN * comp_type.
Parameter
COMP_TYP Total
ITB ITH ITS
Do you have your
own VPN for
inter-
organizational
communication?
NR 1 0 0 1
No 1 4 2 7
Yes
13 11 13 37
Total 15 15 15 45
Chart: 4.3.10.8: Respondents with their own organizational VPN.
From the above Table and chart 4.3.10.8, it represents that 82% companies have
their own VPN for inter-organizational communication which is one of the more
secured way of transferring organizational data. There are 7 companies which do
not have VPN for inter-organizational communication and there was no reply from
one company.
3782%
716%
12%
Do you have your own VPN for inter-orginizational communication?
Yes No not applicable
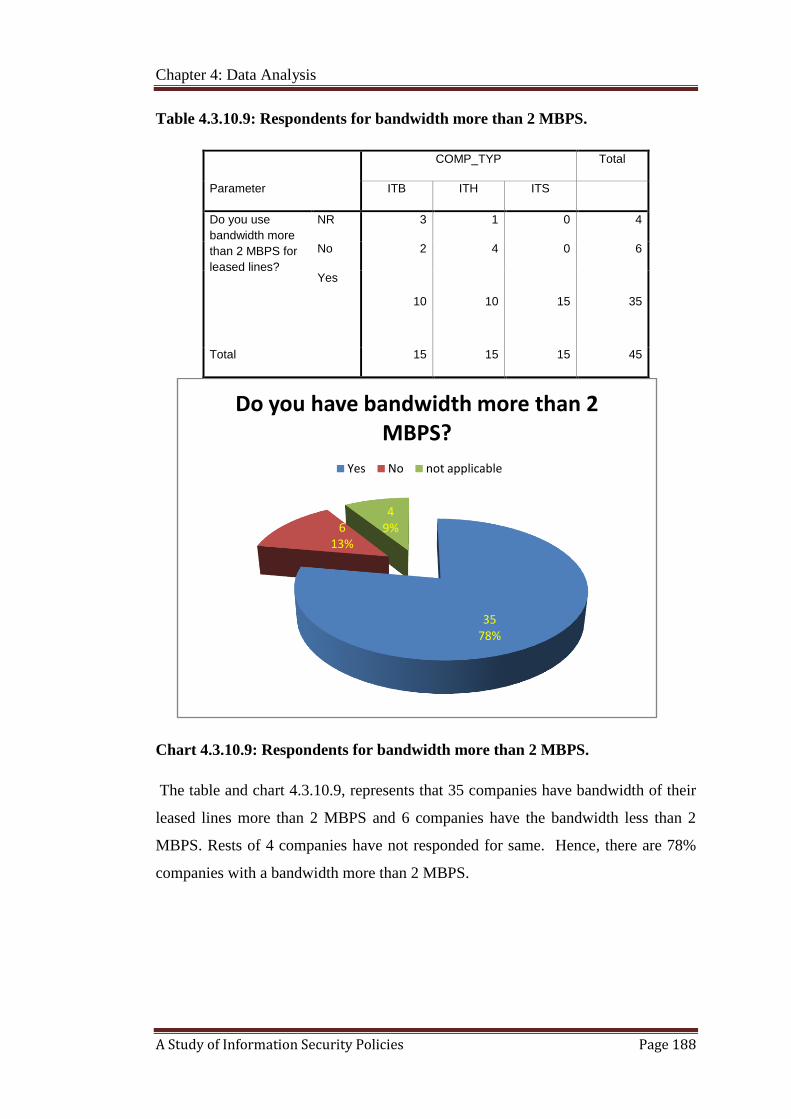
Chapter 4: Data Analysis
A Study of Information Security Policies Page 188
Table 4.3.10.9: Respondents for bandwidth more than 2 MBPS.
Parameter
COMP_TYP Total
ITB ITH ITS
Do you use
bandwidth more
than 2 MBPS for
leased lines?
NR 3 1 0 4
No 2 4 0 6
Yes
10 10 15 35
Total 15 15 15 45
Chart 4.3.10.9: Respondents for bandwidth more than 2 MBPS.
The table and chart 4.3.10.9, represents that 35 companies have bandwidth of their
leased lines more than 2 MBPS and 6 companies have the bandwidth less than 2
MBPS. Rests of 4 companies have not responded for same. Hence, there are 78%
companies with a bandwidth more than 2 MBPS.
3578%
613%
49%
Do you have bandwidth more than 2 MBPS?
Yes No not applicable
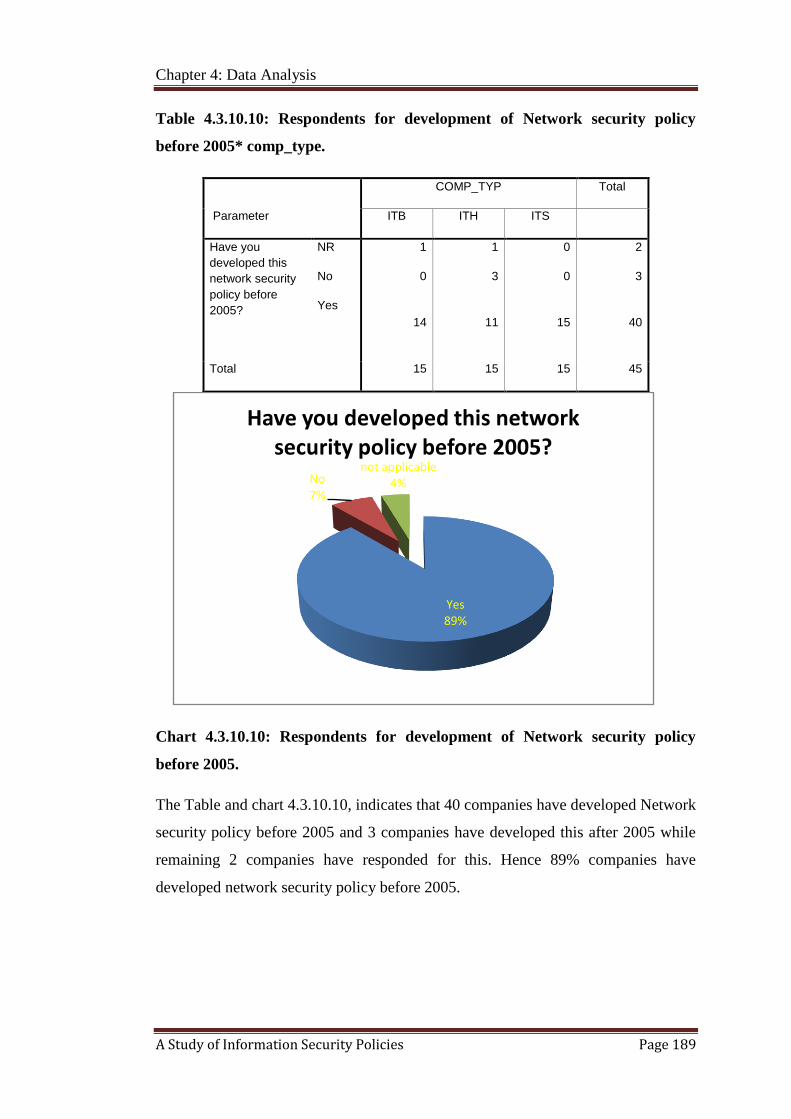
Chapter 4: Data Analysis
A Study of Information Security Policies Page 189
Table 4.3.10.10: Respondents for development of Network security policy
before 2005* comp_type.
Parameter
COMP_TYP Total
ITB ITH ITS
Have you
developed this
network security
policy before
2005?
NR 1 1 0 2
No 0 3 0 3
Yes
14 11 15 40
Total 15 15 15 45
Chart 4.3.10.10: Respondents for development of Network security policy
before 2005.
The Table and chart 4.3.10.10, indicates that 40 companies have developed Network
security policy before 2005 and 3 companies have developed this after 2005 while
remaining 2 companies have responded for this. Hence 89% companies have
developed network security policy before 2005.
Yes89%
No7%
not applicable4%
Have you developed this network security policy before 2005?
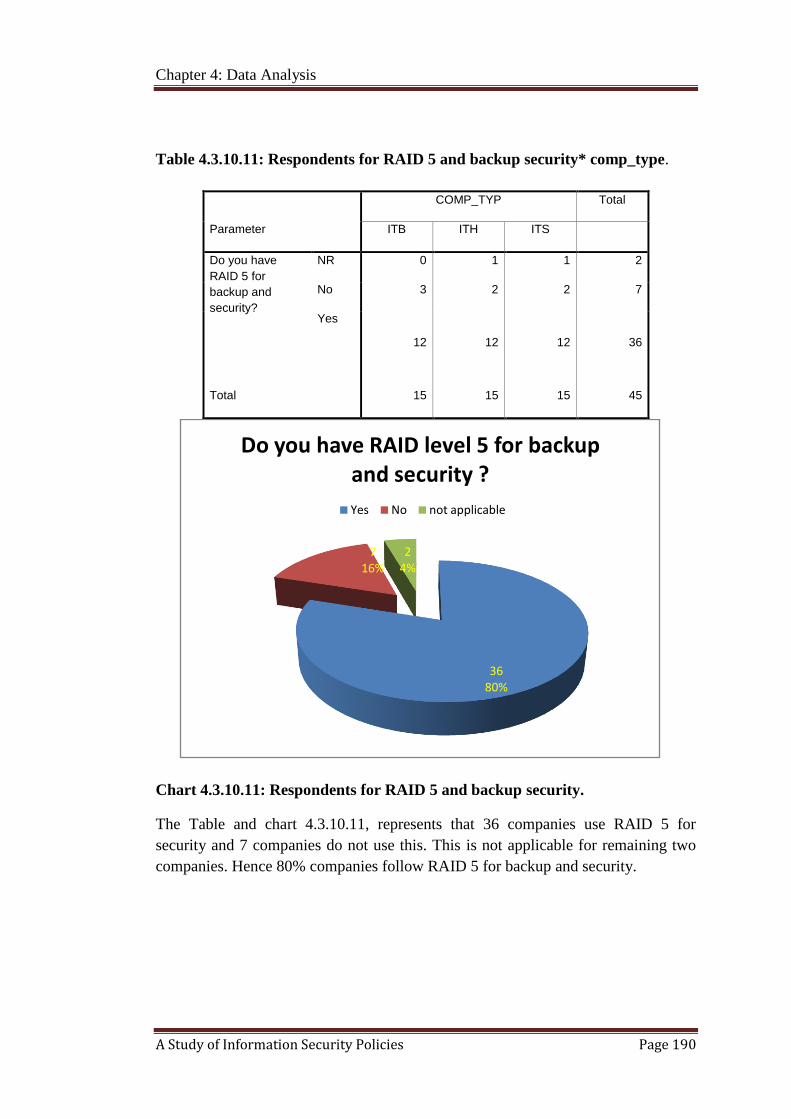
Chapter 4: Data Analysis
A Study of Information Security Policies Page 190
Table 4.3.10.11: Respondents for RAID 5 and backup security* comp_type.
Parameter
COMP_TYP Total
ITB ITH ITS
Do you have
RAID 5 for
backup and
security?
NR 0 1 1 2
No 3 2 2 7
Yes
12 12 12 36
Total 15 15 15 45
Chart 4.3.10.11: Respondents for RAID 5 and backup security.
The Table and chart 4.3.10.11, represents that 36 companies use RAID 5 for
security and 7 companies do not use this. This is not applicable for remaining two
companies. Hence 80% companies follow RAID 5 for backup and security.
3680%
716%
24%
Do you have RAID level 5 for backup and security ?
Yes No not applicable
Chapter 4: Data Analysis
A Study of Information Security Policies Page 191
4.3.11: DOMAIN 11: BCP and DRP
Business Continuity Planning (BCP) and Disaster Recovery Planning (DRP) play a
vital role in maintaining information security. BCP prepares an organization to
reestablish critical business operations during a disaster that affects operations
within the organization. If a disaster has rendered the current location unusable for
continued operations, there must be a plan to allow the business to continue to
function.
Disaster recovery planning means planning the preparation for and recovery from a
disaster, whether natural or man-made. DRP provides detailed guidance in the event
of a disaster. It also gives the information related to the roles and responsibilities of
various individuals involved in disaster recovery team.
BCP and DRP go hand in hand as disaster recovery works after the disaster occurs
and BCP helps DRP to overcome the disaster. As per the standards BS7799 and ISO
17799 the questionnaire for the domain for BCP and DRP is designed on similar
parameters by the researcher. The parameters under the study are; existence of BCP
policy and DRP , major disaster faced by organization in terms of data loss,
availability of training and awareness program, compatibility with IT infrastructure,
risk associated with the policy, backup facility and system fault tolerance level.
The parameters for the existence of BCP and DRP are viewed separately.
Remaining parameters are considered to be common for BCP and DRP both by the
researcher.
Cross Tabulations for related parameters along with respected charts are shown on
subsequent pages.

Chapter 4: Data Analysis
A Study of Information Security Policies Page 192
Table 4.3.11.1: Respondents for existence of BCP * comp_type.
Parameter
COMP_TYP Total
ITB ITH ITS
Do you have
BCP?
NR 0 1 0 1
No 0 4 0 4
Yes 15 10 15 40
Total 15 15 15 45
Chart 4.3.11.1: Respondents for existence of BCP .
The Table and chart 4.3.11.1, shows that 40 companies have BCP policy in place
and 4 companies do not have this policy. One company has not responded for this as
the company is not sure about this. Hence, this indicates that 89% companies have
BCP policy.
4089%
49%
12%
Do you have BCP?
Yes No not applicable
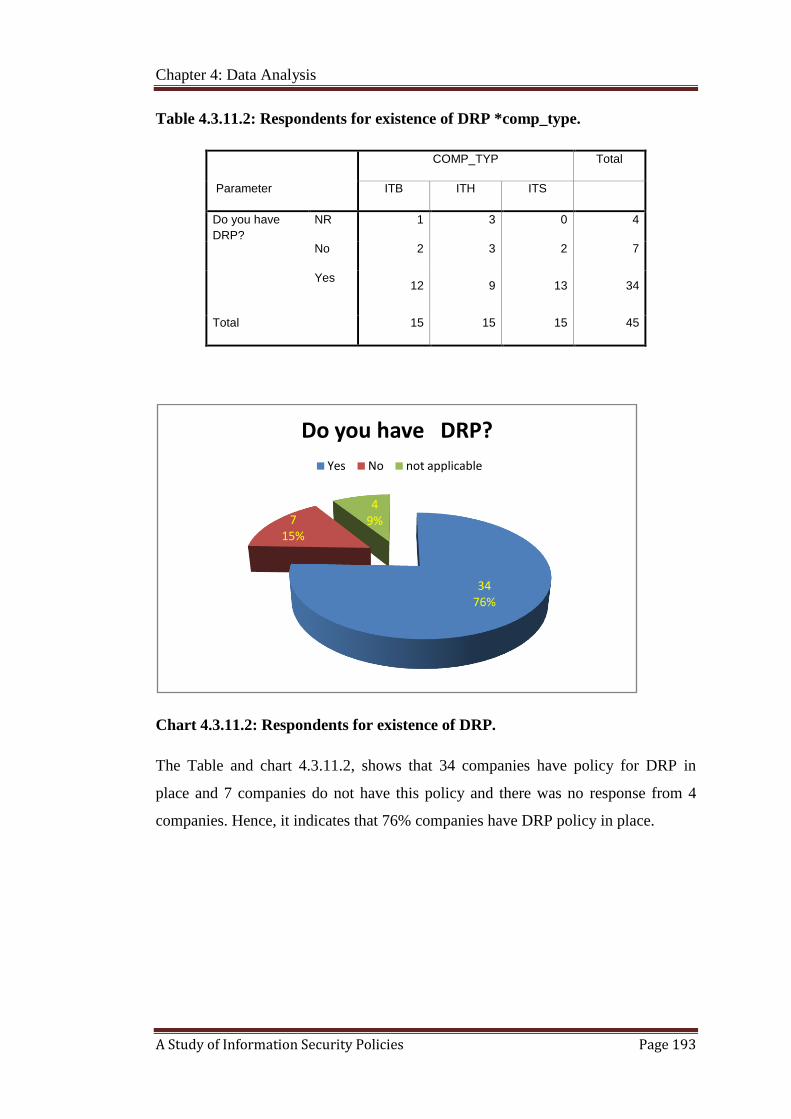
Chapter 4: Data Analysis
A Study of Information Security Policies Page 193
Table 4.3.11.2: Respondents for existence of DRP *comp_type.
Parameter
COMP_TYP Total
ITB ITH ITS
Do you have
DRP?
NR 1 3 0 4
No 2 3 2 7
Yes 12 9 13 34
Total 15 15 15 45
Chart 4.3.11.2: Respondents for existence of DRP.
The Table and chart 4.3.11.2, shows that 34 companies have policy for DRP in
place and 7 companies do not have this policy and there was no response from 4
companies. Hence, it indicates that 76% companies have DRP policy in place.
3476%
715%
49%
Do you have DRP?
Yes No not applicable
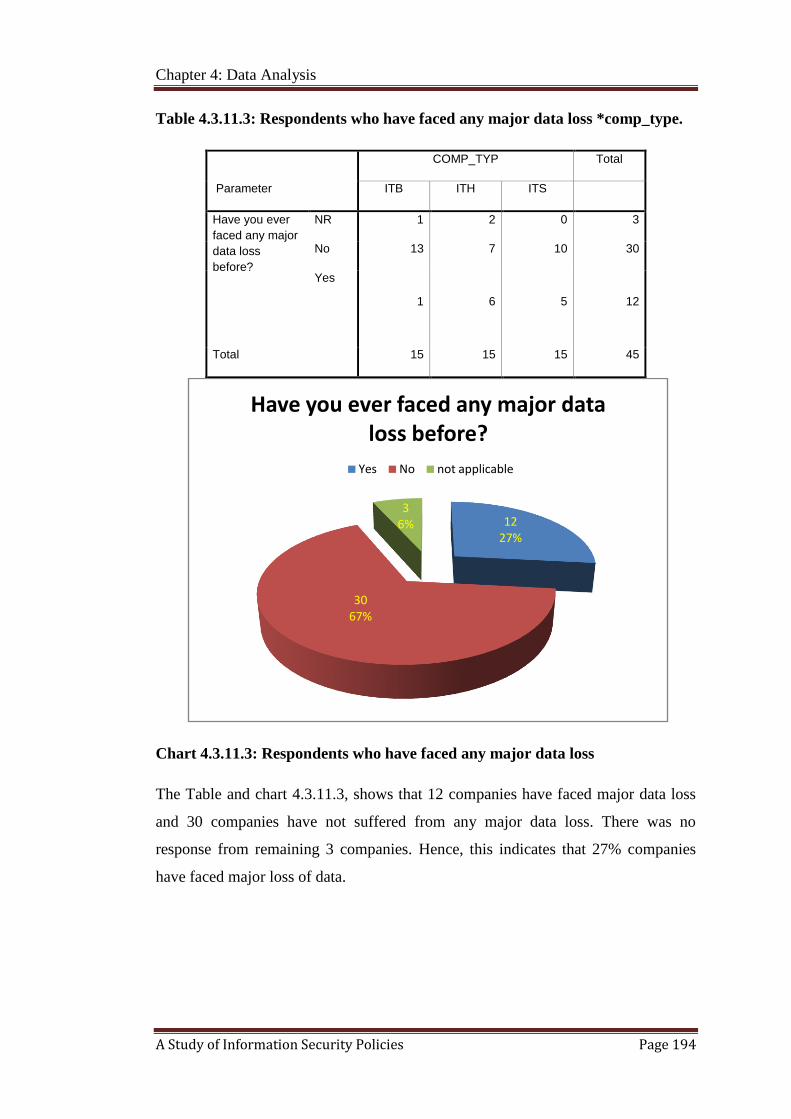
Chapter 4: Data Analysis
A Study of Information Security Policies Page 194
Table 4.3.11.3: Respondents who have faced any major data loss *comp_type.
Parameter
COMP_TYP Total
ITB ITH ITS
Have you ever
faced any major
data loss
before?
NR 1 2 0 3
No 13 7 10 30
Yes
1 6 5 12
Total 15 15 15 45
Chart 4.3.11.3: Respondents who have faced any major data loss
The Table and chart 4.3.11.3, shows that 12 companies have faced major data loss
and 30 companies have not suffered from any major data loss. There was no
response from remaining 3 companies. Hence, this indicates that 27% companies
have faced major loss of data.
1227%
3067%
36%
Have you ever faced any major data loss before?
Yes No not applicable
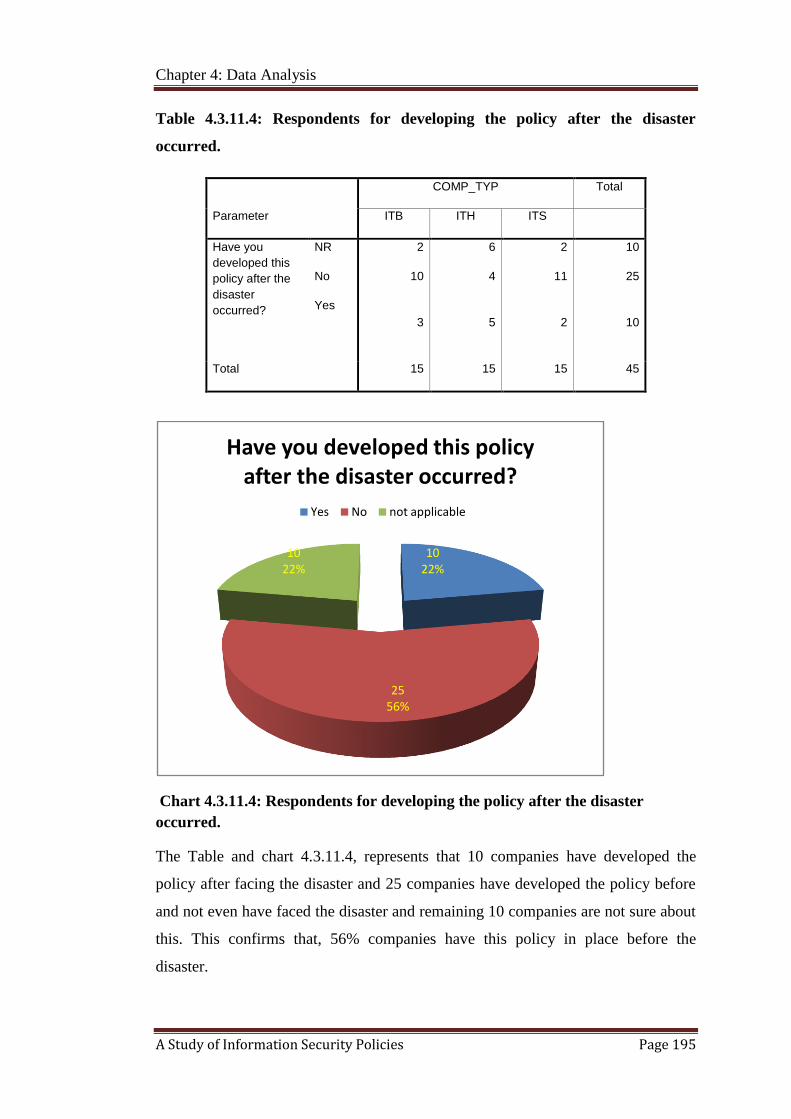
Chapter 4: Data Analysis
A Study of Information Security Policies Page 195
Table 4.3.11.4: Respondents for developing the policy after the disaster
occurred.
Parameter
COMP_TYP Total
ITB ITH ITS
Have you
developed this
policy after the
disaster
occurred?
NR 2 6 2 10
No 10 4 11 25
Yes
3 5 2 10
Total 15 15 15 45
Chart 4.3.11.4: Respondents for developing the policy after the disaster
occurred.
The Table and chart 4.3.11.4, represents that 10 companies have developed the
policy after facing the disaster and 25 companies have developed the policy before
and not even have faced the disaster and remaining 10 companies are not sure about
this. This confirms that, 56% companies have this policy in place before the
disaster.
1022%
2556%
1022%
Have you developed this policy after the disaster occurred?
Yes No not applicable
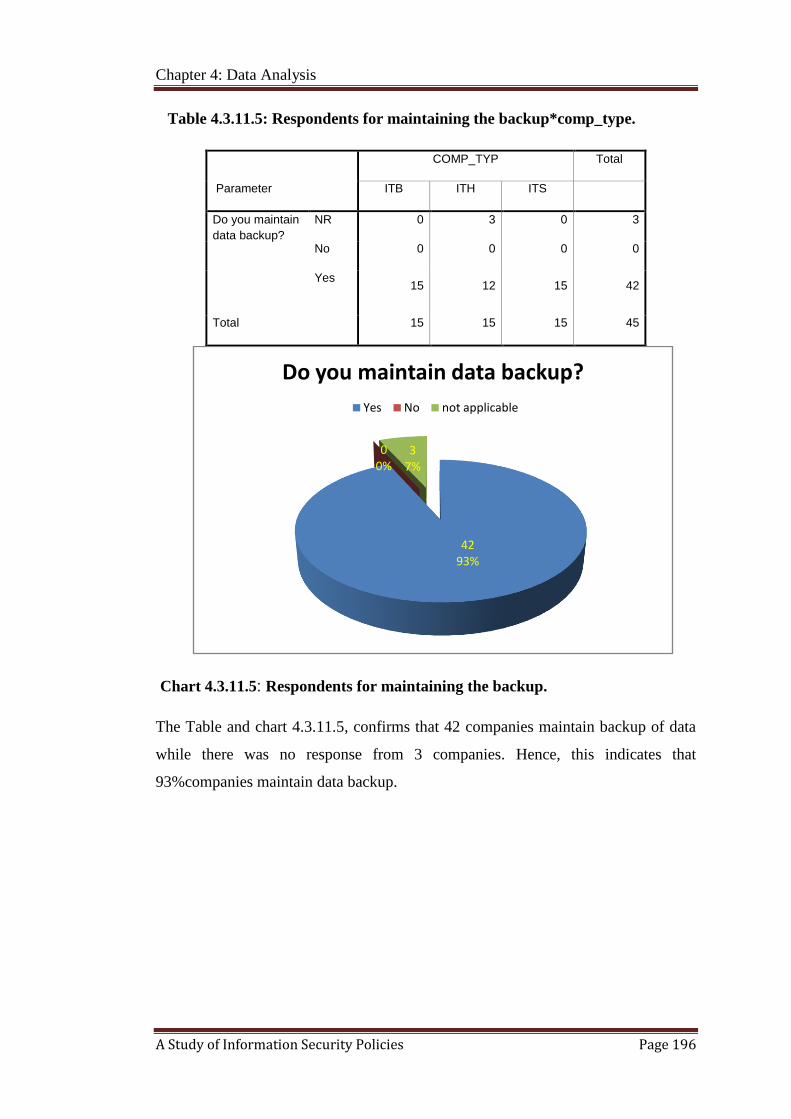
Chapter 4: Data Analysis
A Study of Information Security Policies Page 196
Table 4.3.11.5: Respondents for maintaining the backup*comp_type.
Parameter
COMP_TYP Total
ITB ITH ITS
Do you maintain
data backup?
NR 0 3 0 3
No 0 0 0 0
Yes 15 12 15 42
Total 15 15 15 45
Chart 4.3.11.5: Respondents for maintaining the backup.
The Table and chart 4.3.11.5, confirms that 42 companies maintain backup of data
while there was no response from 3 companies. Hence, this indicates that
93%companies maintain data backup.
4293%
00%
37%
Do you maintain data backup?
Yes No not applicable
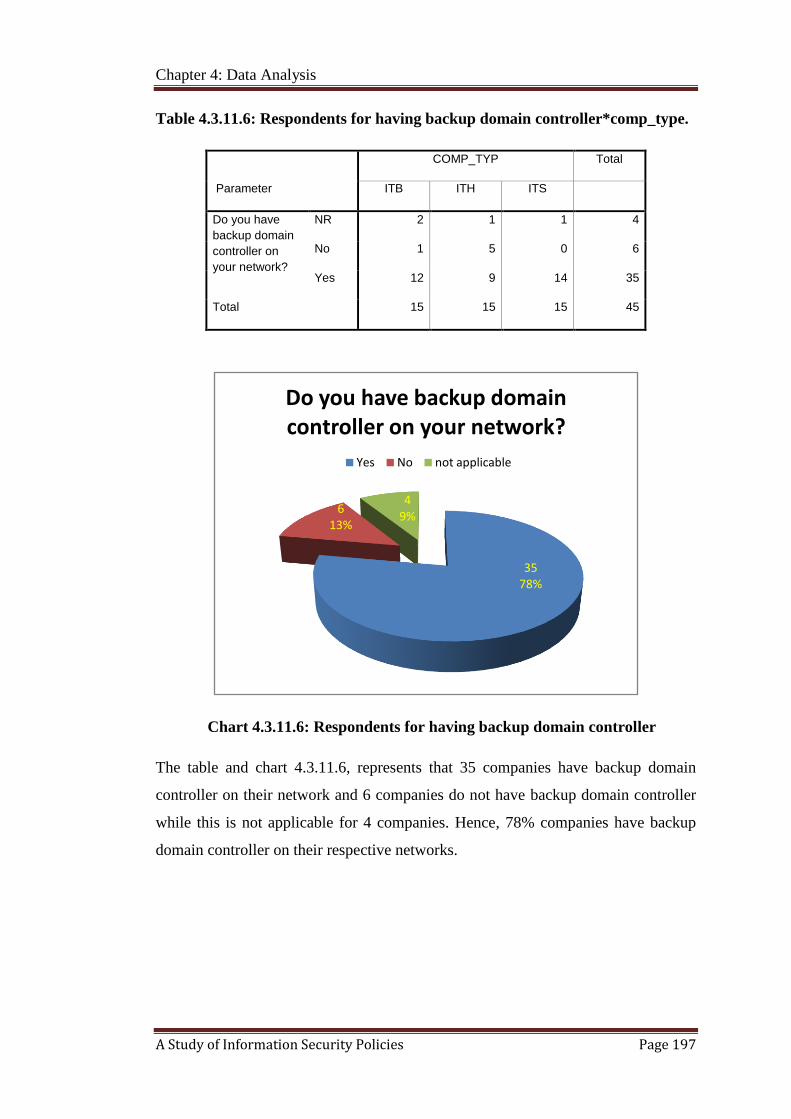
Chapter 4: Data Analysis
A Study of Information Security Policies Page 197
Table 4.3.11.6: Respondents for having backup domain controller*comp_type.
Parameter
COMP_TYP Total
ITB ITH ITS
Do you have
backup domain
controller on
your network?
NR 2 1 1 4
No 1 5 0 6
Yes 12 9 14 35
Total 15 15 15 45
Chart 4.3.11.6: Respondents for having backup domain controller
The table and chart 4.3.11.6, represents that 35 companies have backup domain
controller on their network and 6 companies do not have backup domain controller
while this is not applicable for 4 companies. Hence, 78% companies have backup
domain controller on their respective networks.
3578%
613%
49%
Do you have backup domain controller on your network?
Yes No not applicable
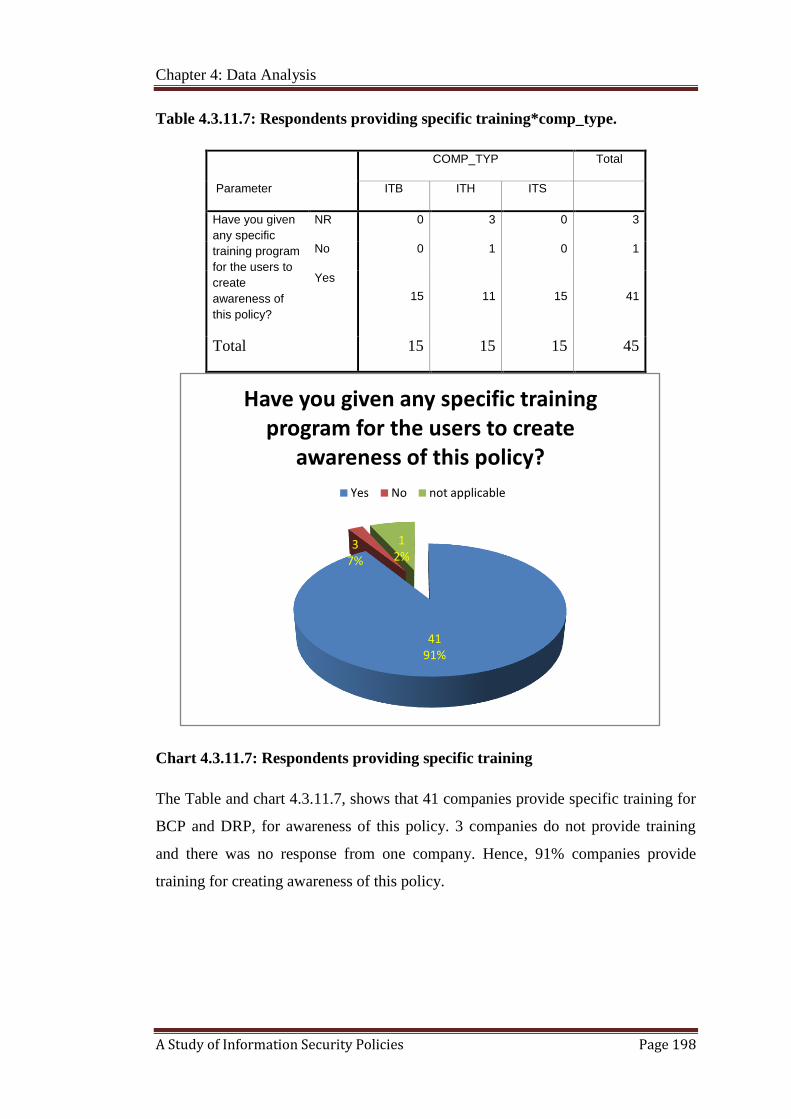
Chapter 4: Data Analysis
A Study of Information Security Policies Page 198
Table 4.3.11.7: Respondents providing specific training*comp_type.
Parameter
COMP_TYP Total
ITB ITH ITS
Have you given
any specific
training program
for the users to
create
awareness of
this policy?
NR 0 3 0 3
No 0 1 0 1
Yes
15 11 15 41
Total 15 15 15 45
Chart 4.3.11.7: Respondents providing specific training
The Table and chart 4.3.11.7, shows that 41 companies provide specific training for
BCP and DRP, for awareness of this policy. 3 companies do not provide training
and there was no response from one company. Hence, 91% companies provide
training for creating awareness of this policy.
4191%
12%
37%
Have you given any specific training program for the users to create
awareness of this policy?
Yes No not applicable
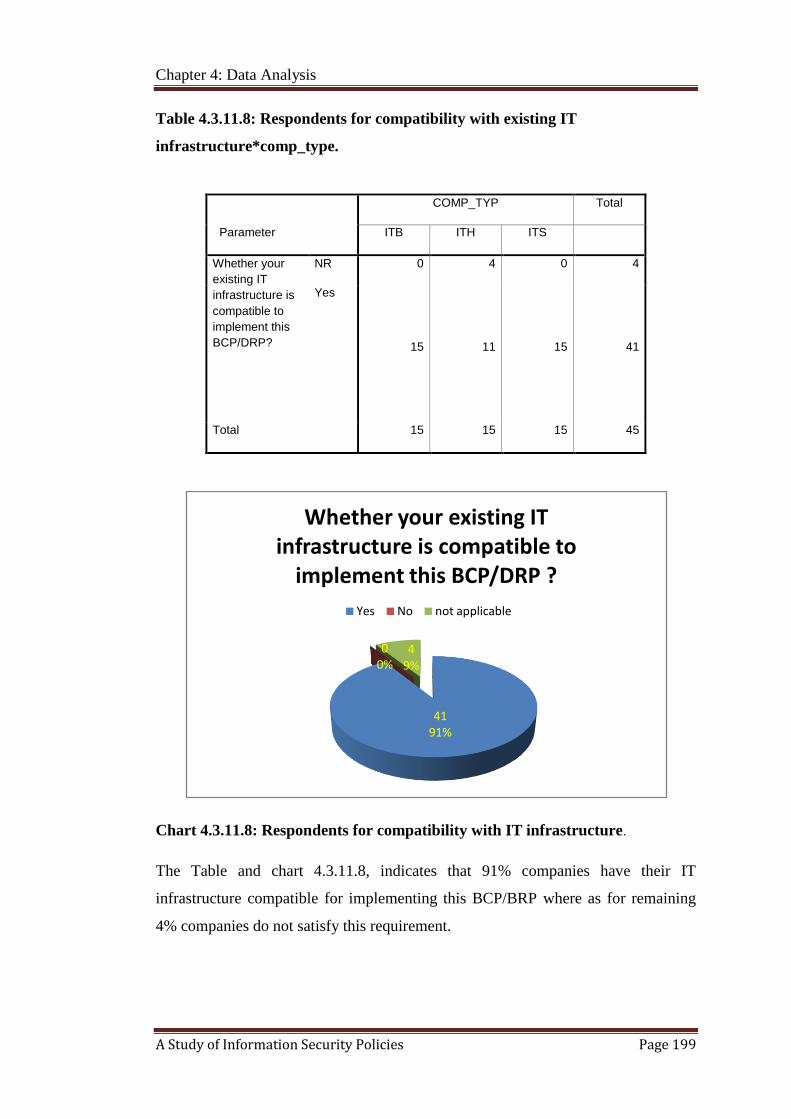
Chapter 4: Data Analysis
A Study of Information Security Policies Page 199
Table 4.3.11.8: Respondents for compatibility with existing IT
infrastructure*comp_type.
Chart 4.3.11.8: Respondents for compatibility with IT infrastructure.
The Table and chart 4.3.11.8, indicates that 91% companies have their IT
infrastructure compatible for implementing this BCP/BRP where as for remaining
4% companies do not satisfy this requirement.
4191%
00%
49%
Whether your existing IT infrastructure is compatible to
implement this BCP/DRP ?
Yes No not applicable
Parameter
COMP_TYP Total
ITB ITH ITS
Whether your
existing IT
infrastructure is
compatible to
implement this
BCP/DRP?
NR 0 4 0 4
Yes
15 11 15 41
Total 15 15 15 45

Chapter 4: Data Analysis
A Study of Information Security Policies Page 200
Table 4.3.11.9: Respondents for reduction in risk after implementation of the
BCP* comp_type.
Chart 4.3.11.9: Risk reduction after BCP Implementation.
The Table and chart 4.3.11.9, shows that 38 companies confirms that there is
reduction in the risk after implementation of this policy. 4 companies have shown
that there is no risk reduction and 3 companies have not responded for this. Hence,
84% companies confirmed that there is no risk after implementation of this policy.
3884%
49%
37%
Whether there is any risk reduction after
implementation of BCP ?
Yes No not applicable
Parameter
COMP_TYP Total
ITB ITH ITS
Whether there is
any risk
reduction after
implementation
of BCP?
NR 0 3 0 3
No 0 3 1 4
Yes
15 9 14 38
Total 15 15 15 45
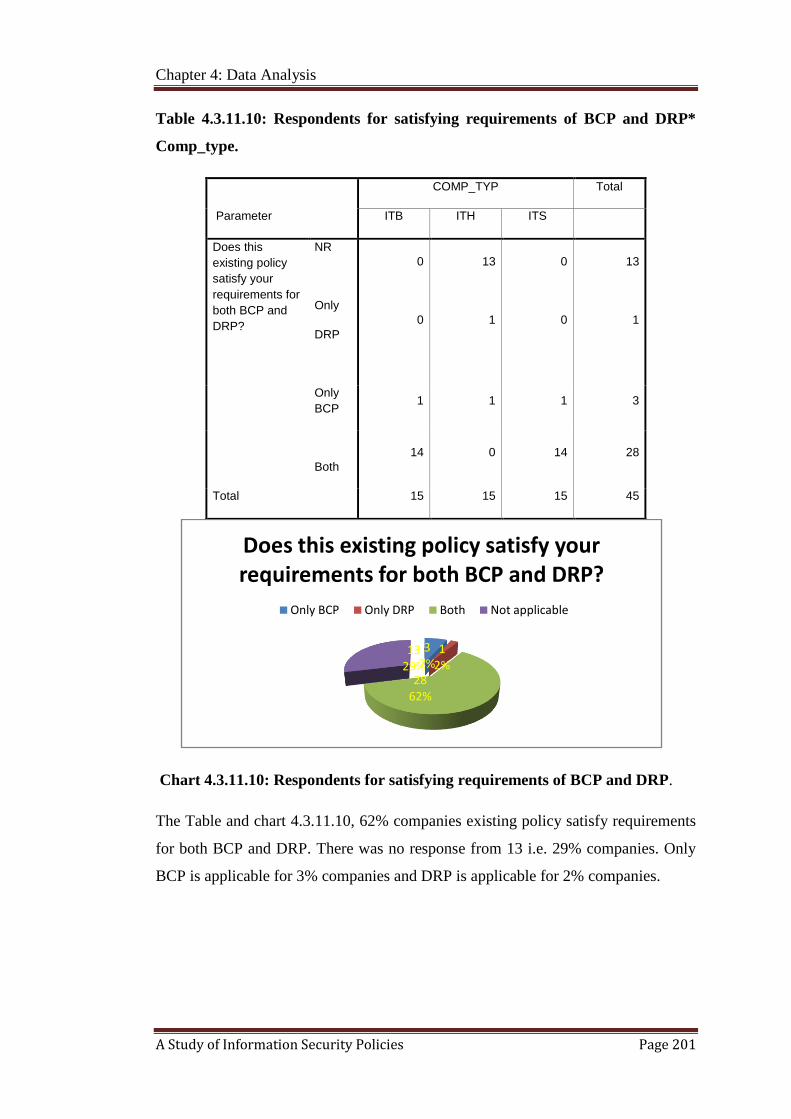
Chapter 4: Data Analysis
A Study of Information Security Policies Page 201
Table 4.3.11.10: Respondents for satisfying requirements of BCP and DRP*
Comp_type.
Parameter
COMP_TYP Total
ITB ITH ITS
Does this
existing policy
satisfy your
requirements for
both BCP and
DRP?
NR
Only
DRP
0
0
13
1
0
0
13
1
Only
BCP 1 1 1 3
Both
14 0 14 28
Total 15 15 15 45
Chart 4.3.11.10: Respondents for satisfying requirements of BCP and DRP.
The Table and chart 4.3.11.10, 62% companies existing policy satisfy requirements
for both BCP and DRP. There was no response from 13 i.e. 29% companies. Only
BCP is applicable for 3% companies and DRP is applicable for 2% companies.
37%
12%
2862%
1329%
Does this existing policy satisfy your requirements for both BCP and DRP?
Only BCP Only DRP Both Not applicable
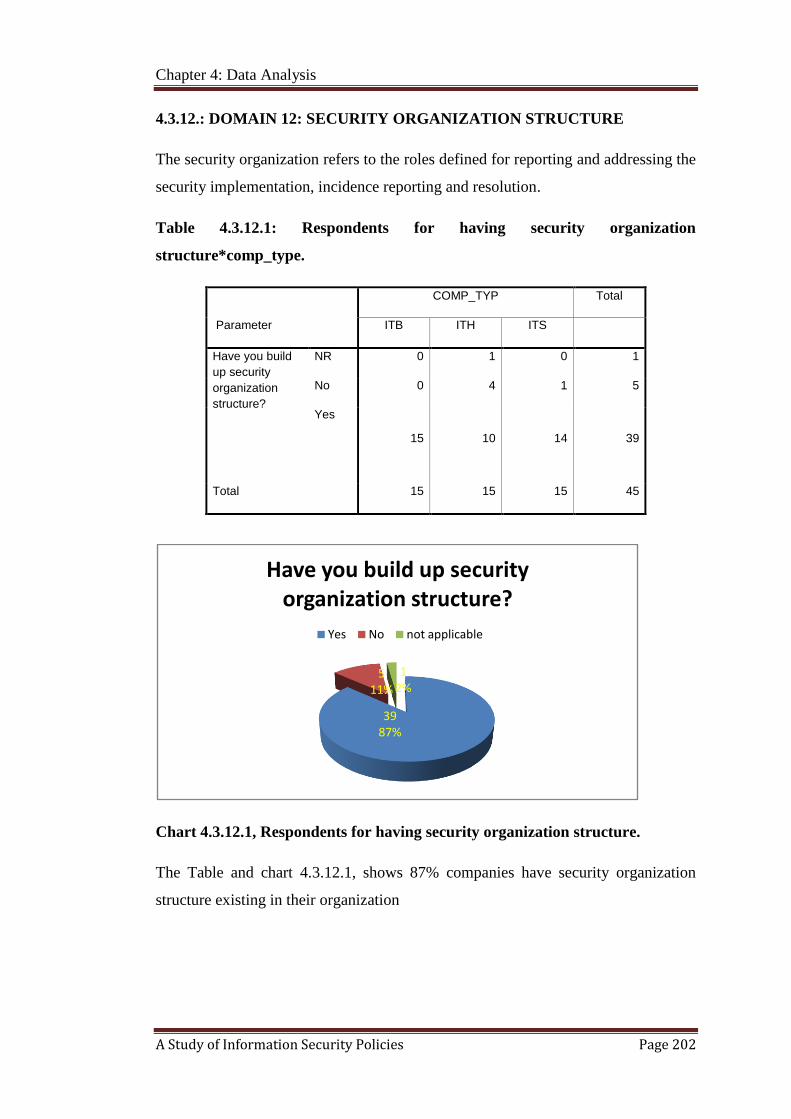
Chapter 4: Data Analysis
A Study of Information Security Policies Page 202
4.3.12.: DOMAIN 12: SECURITY ORGANIZATION STRUCTURE
The security organization refers to the roles defined for reporting and addressing the
security implementation, incidence reporting and resolution.
Table 4.3.12.1: Respondents for having security organization
structure*comp_type.
Parameter
COMP_TYP Total
ITB ITH ITS
Have you build
up security
organization
structure?
NR 0 1 0 1
No 0 4 1 5
Yes
15 10 14 39
Total 15 15 15 45
Chart 4.3.12.1, Respondents for having security organization structure.
The Table and chart 4.3.12.1, shows 87% companies have security organization
structure existing in their organization
3987%
511%
12%
Have you build up security organization structure?
Yes No not applicable
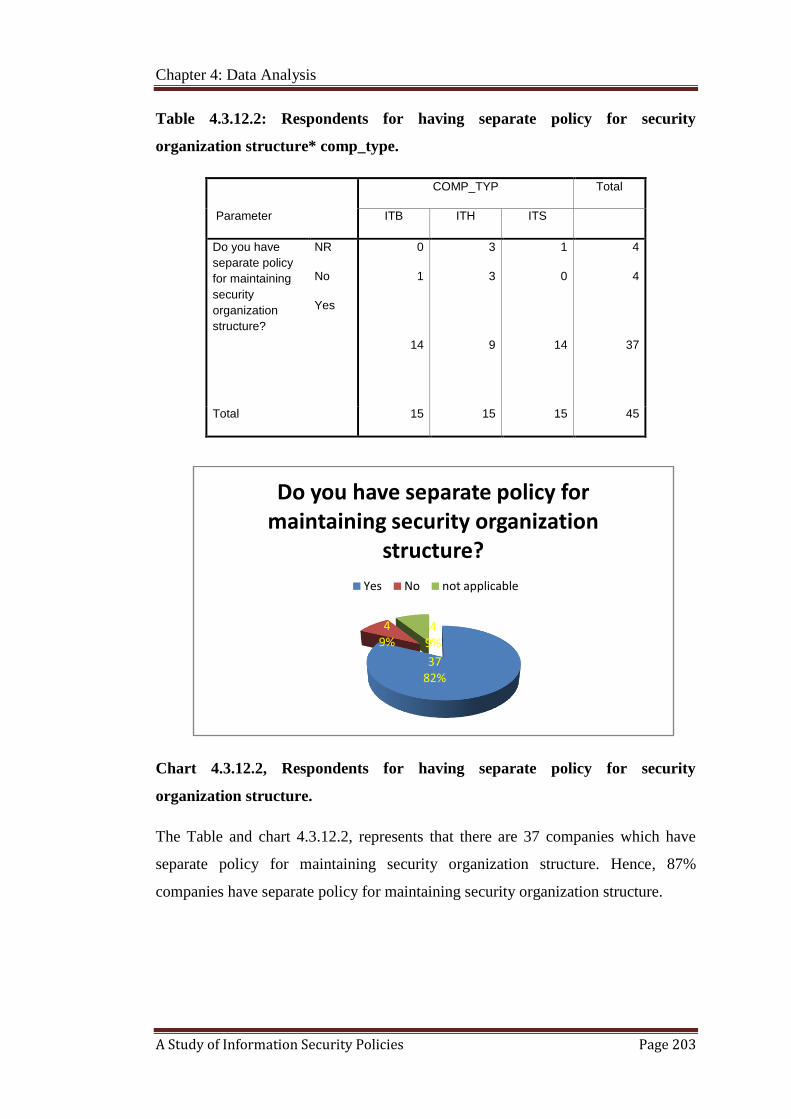
Chapter 4: Data Analysis
A Study of Information Security Policies Page 203
Table 4.3.12.2: Respondents for having separate policy for security
organization structure* comp_type.
Parameter
COMP_TYP Total
ITB ITH ITS
Do you have
separate policy
for maintaining
security
organization
structure?
NR 0 3 1 4
No 1 3 0 4
Yes
14 9 14 37
Total 15 15 15 45
Chart 4.3.12.2, Respondents for having separate policy for security
organization structure.
The Table and chart 4.3.12.2, represents that there are 37 companies which have
separate policy for maintaining security organization structure. Hence, 87%
companies have separate policy for maintaining security organization structure.
3782%
49%
49%
Do you have separate policy for maintaining security organization
structure?
Yes No not applicable
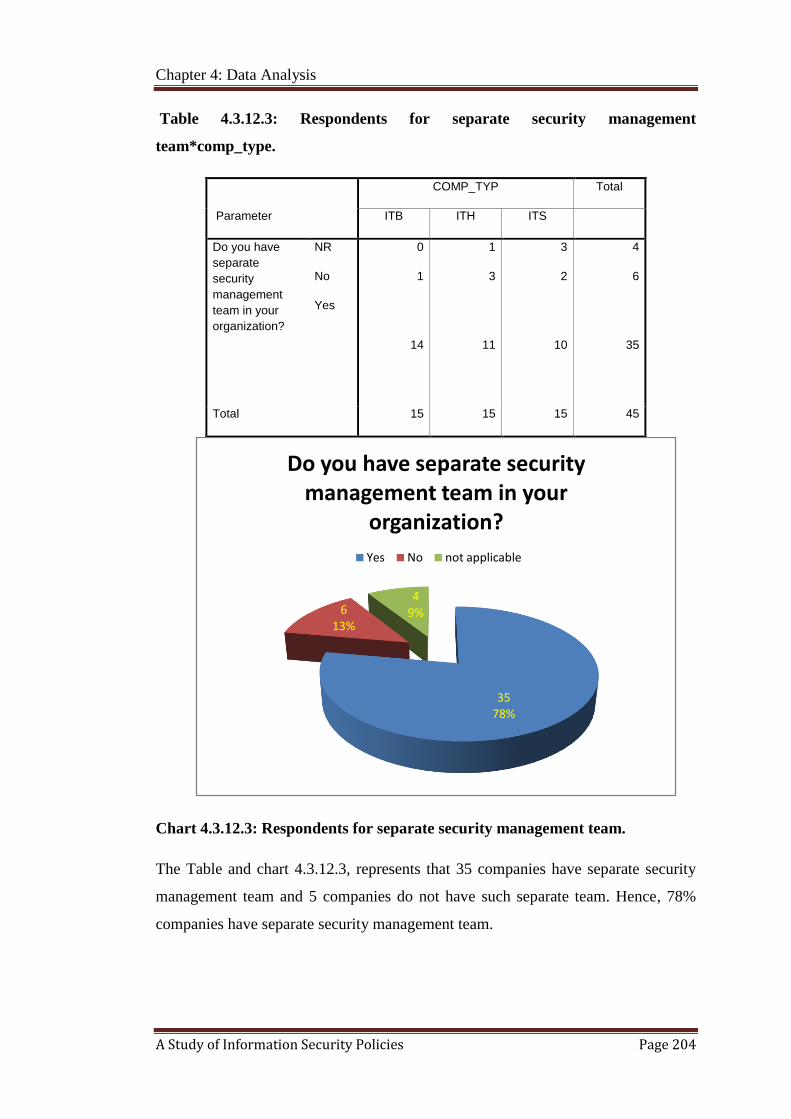
Chapter 4: Data Analysis
A Study of Information Security Policies Page 204
Table 4.3.12.3: Respondents for separate security management
team*comp_type.
Parameter
COMP_TYP Total
ITB ITH ITS
Do you have
separate
security
management
team in your
organization?
NR 0 1 3 4
No 1 3 2 6
Yes
14 11 10 35
Total 15 15 15 45
Chart 4.3.12.3: Respondents for separate security management team.
The Table and chart 4.3.12.3, represents that 35 companies have separate security
management team and 5 companies do not have such separate team. Hence, 78%
companies have separate security management team.
3578%
613%
49%
Do you have separate security management team in your
organization?
Yes No not applicable
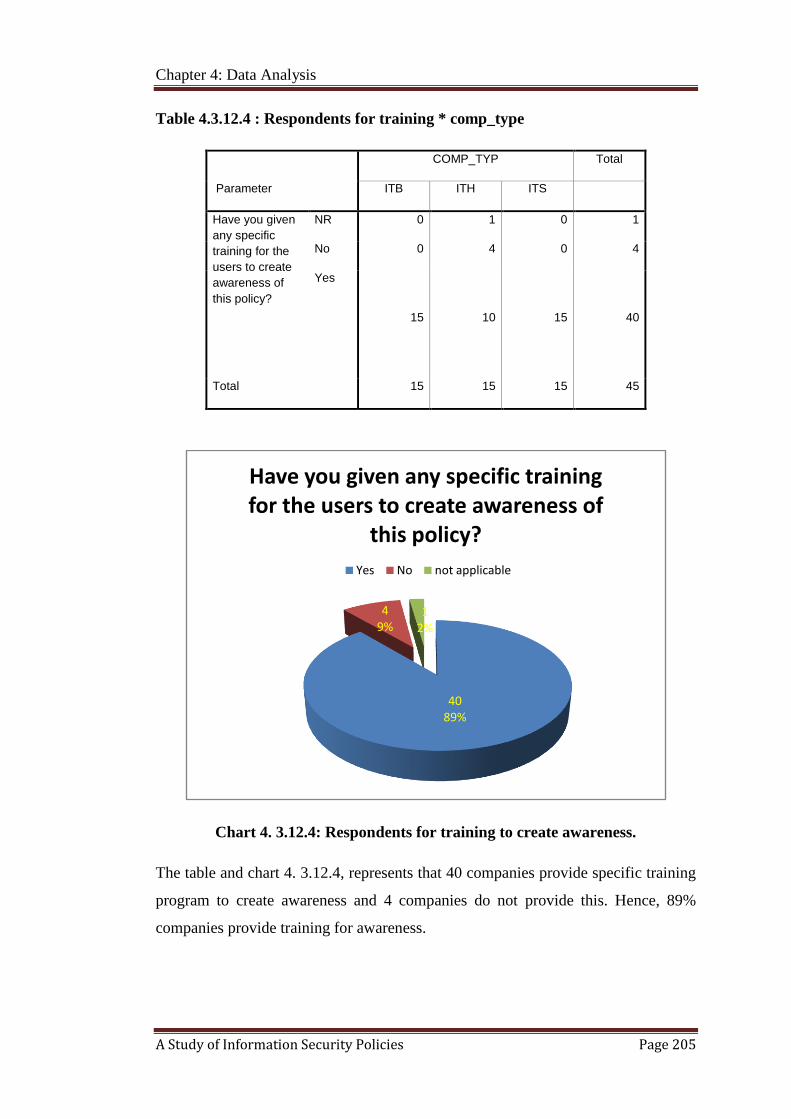
Chapter 4: Data Analysis
A Study of Information Security Policies Page 205
Table 4.3.12.4 : Respondents for training * comp_type
Parameter
COMP_TYP Total
ITB ITH ITS
Have you given
any specific
training for the
users to create
awareness of
this policy?
NR 0 1 0 1
No 0 4 0 4
Yes
15 10 15 40
Total 15 15 15 45
Chart 4. 3.12.4: Respondents for training to create awareness.
The table and chart 4. 3.12.4, represents that 40 companies provide specific training
program to create awareness and 4 companies do not provide this. Hence, 89%
companies provide training for awareness.
4089%
49%
12%
Have you given any specific training for the users to create awareness of
this policy?
Yes No not applicable
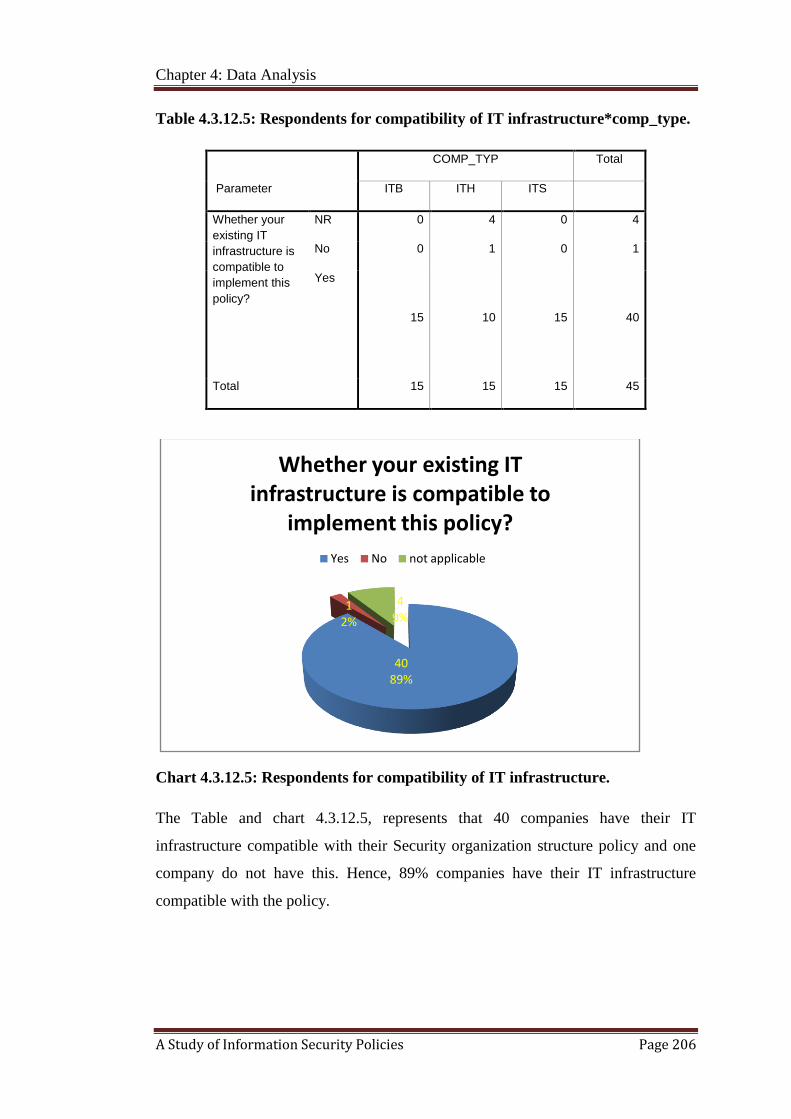
Chapter 4: Data Analysis
A Study of Information Security Policies Page 206
Table 4.3.12.5: Respondents for compatibility of IT infrastructure*comp_type.
Parameter
COMP_TYP Total
ITB ITH ITS
Whether your
existing IT
infrastructure is
compatible to
implement this
policy?
NR 0 4 0 4
No 0 1 0 1
Yes
15 10 15 40
Total 15 15 15 45
Chart 4.3.12.5: Respondents for compatibility of IT infrastructure.
The Table and chart 4.3.12.5, represents that 40 companies have their IT
infrastructure compatible with their Security organization structure policy and one
company do not have this. Hence, 89% companies have their IT infrastructure
compatible with the policy.
4089%
12%
49%
Whether your existing IT infrastructure is compatible to
implement this policy?
Yes No not applicable
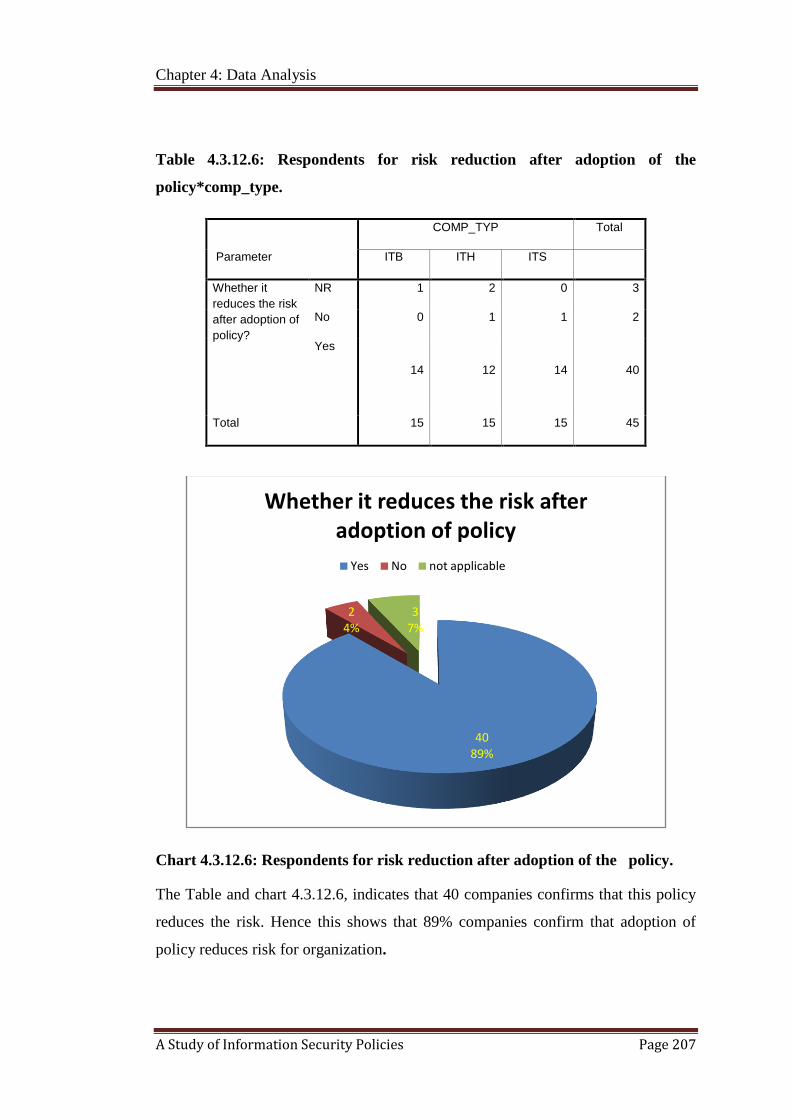
Chapter 4: Data Analysis
A Study of Information Security Policies Page 207
Table 4.3.12.6: Respondents for risk reduction after adoption of the
policy*comp_type.
Parameter
COMP_TYP Total
ITB ITH ITS
Whether it
reduces the risk
after adoption of
policy?
NR 1 2 0 3
No 0 1 1 2
Yes
14 12 14 40
Total 15 15 15 45
Chart 4.3.12.6: Respondents for risk reduction after adoption of the policy.
The Table and chart 4.3.12.6, indicates that 40 companies confirms that this policy
reduces the risk. Hence this shows that 89% companies confirm that adoption of
policy reduces risk for organization.
4089%
24%
37%
Whether it reduces the risk after adoption of policy
Yes No not applicable
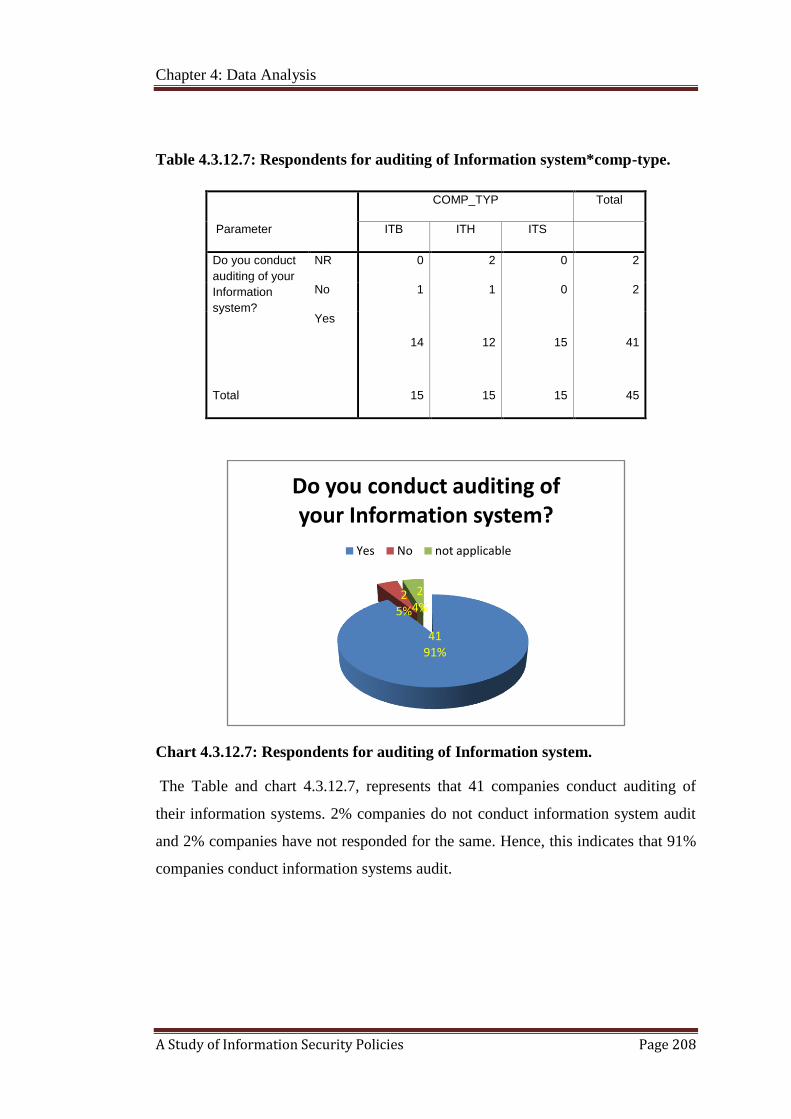
Chapter 4: Data Analysis
A Study of Information Security Policies Page 208
Table 4.3.12.7: Respondents for auditing of Information system*comp-type.
Parameter
COMP_TYP Total
ITB ITH ITS
Do you conduct
auditing of your
Information
system?
NR 0 2 0 2
No 1 1 0 2
Yes
14 12 15 41
Total 15 15 15 45
Chart 4.3.12.7: Respondents for auditing of Information system.
The Table and chart 4.3.12.7, represents that 41 companies conduct auditing of
their information systems. 2% companies do not conduct information system audit
and 2% companies have not responded for the same. Hence, this indicates that 91%
companies conduct information systems audit.
4191%
25%
24%
Do you conduct auditing of your Information system?
Yes No not applicable
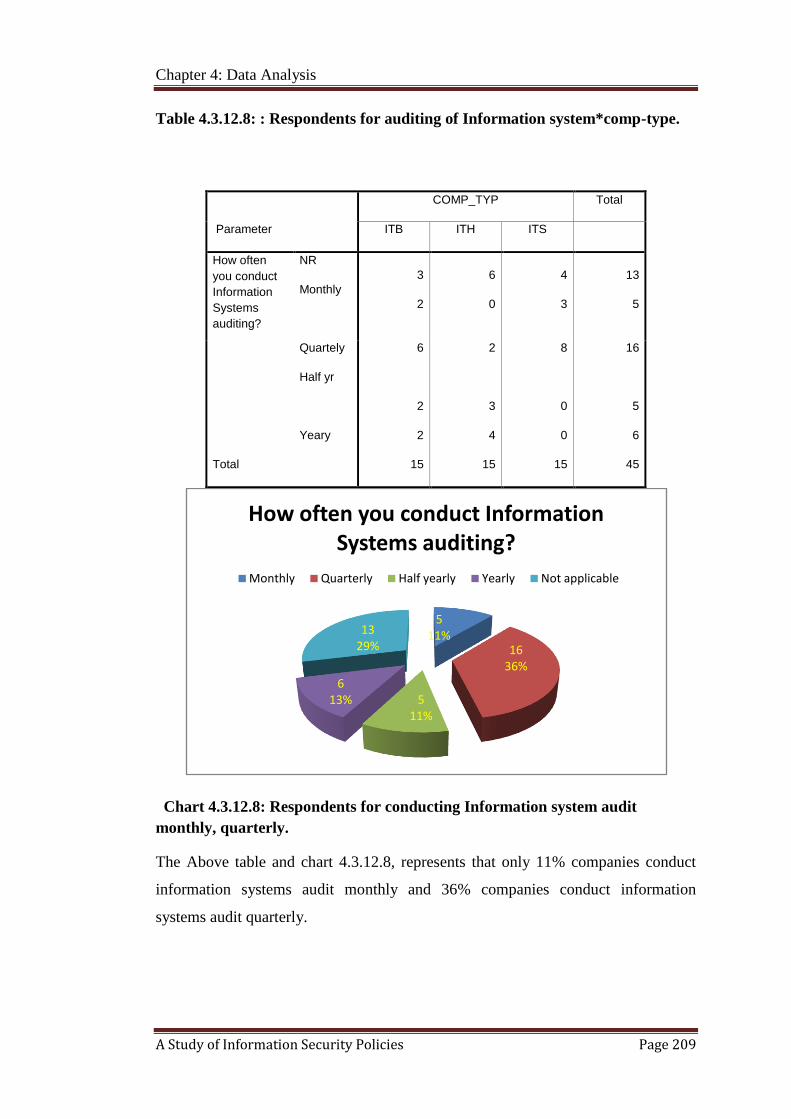
Chapter 4: Data Analysis
A Study of Information Security Policies Page 209
Table 4.3.12.8: : Respondents for auditing of Information system*comp-type.
Parameter
COMP_TYP Total
ITB ITH ITS
How often
you conduct
Information
Systems
auditing?
NR
Monthly
3
2
6
0
4
3
13
5
Quartely
Half yr
6
2
2
3
8
0
16
5
Yeary 2 4 0 6
Total 15 15 15 45
Chart 4.3.12.8: Respondents for conducting Information system audit
monthly, quarterly.
The Above table and chart 4.3.12.8, represents that only 11% companies conduct
information systems audit monthly and 36% companies conduct information
systems audit quarterly.
511%
1636%
511%
613%
1329%
How often you conduct Information Systems auditing?
Monthly Quarterly Half yearly Yearly Not applicable
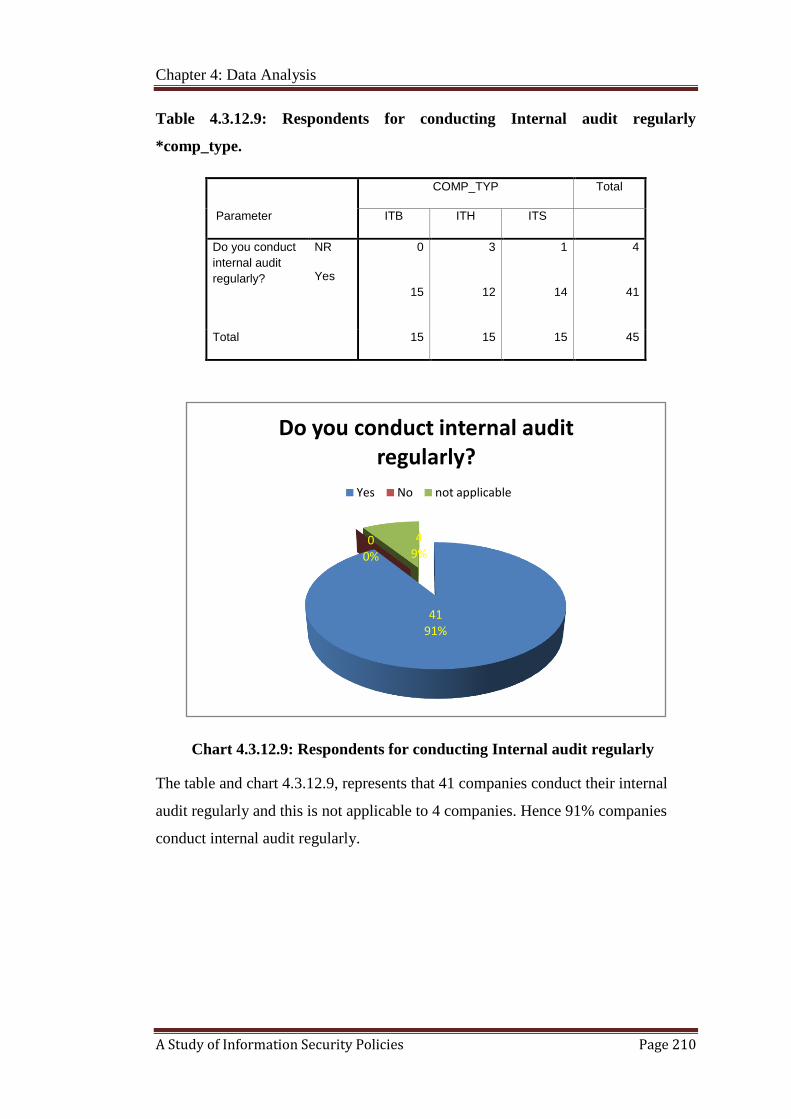
Chapter 4: Data Analysis
A Study of Information Security Policies Page 210
Table 4.3.12.9: Respondents for conducting Internal audit regularly
*comp_type.
Parameter
COMP_TYP Total
ITB ITH ITS
Do you conduct
internal audit
regularly?
NR 0 3 1 4
Yes
15 12 14 41
Total 15 15 15 45
Chart 4.3.12.9: Respondents for conducting Internal audit regularly
The table and chart 4.3.12.9, represents that 41 companies conduct their internal
audit regularly and this is not applicable to 4 companies. Hence 91% companies
conduct internal audit regularly.
4191%
00%
49%
Do you conduct internal audit regularly?
Yes No not applicable
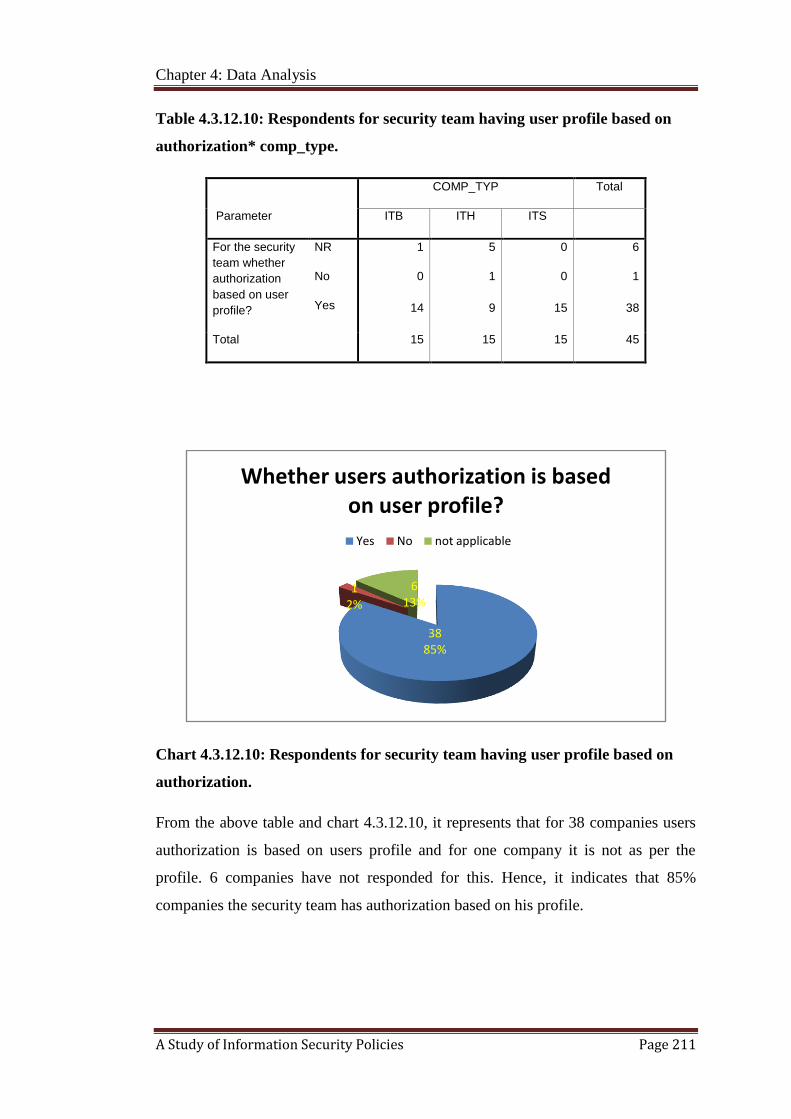
Chapter 4: Data Analysis
A Study of Information Security Policies Page 211
Table 4.3.12.10: Respondents for security team having user profile based on
authorization* comp_type.
Parameter
COMP_TYP Total
ITB ITH ITS
For the security
team whether
authorization
based on user
profile?
NR 1 5 0 6
No 0 1 0 1
Yes 14 9 15 38
Total 15 15 15 45
Chart 4.3.12.10: Respondents for security team having user profile based on
authorization.
From the above table and chart 4.3.12.10, it represents that for 38 companies users
authorization is based on users profile and for one company it is not as per the
profile. 6 companies have not responded for this. Hence, it indicates that 85%
companies the security team has authorization based on his profile.
3885%
12%
613%
Whether users authorization is based on user profile?
Yes No not applicable
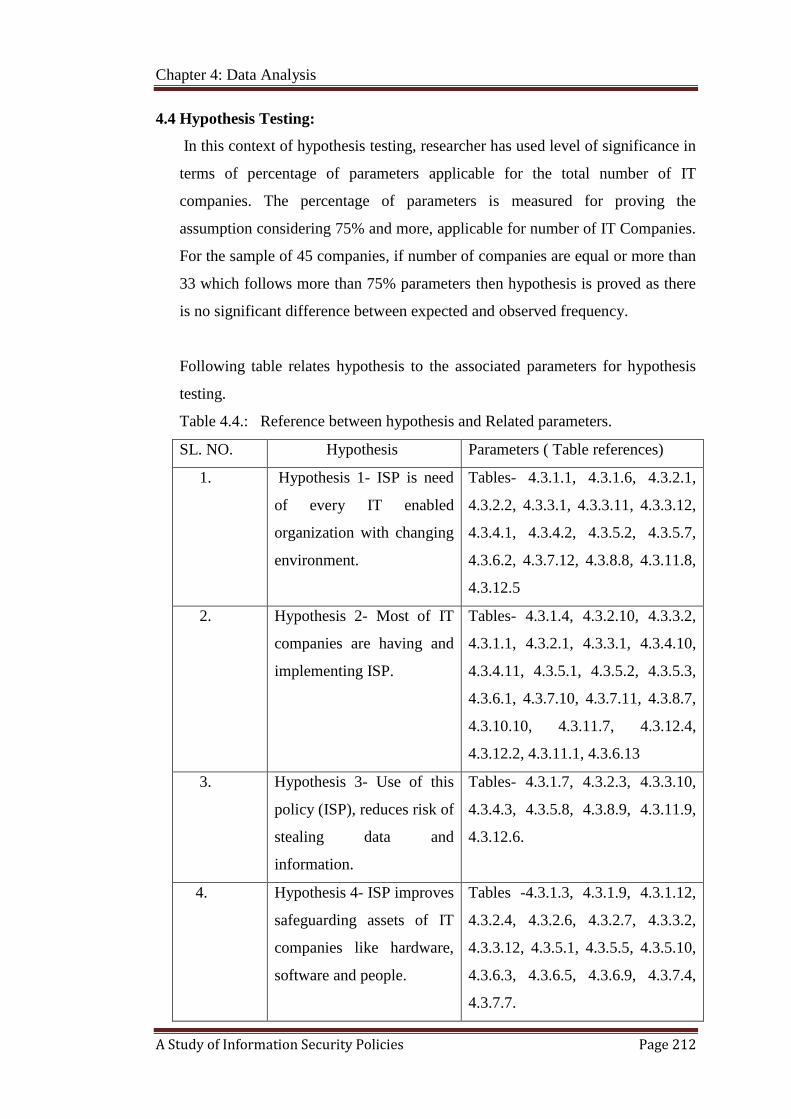
Chapter 4: Data Analysis
A Study of Information Security Policies Page 212
4.4 Hypothesis Testing:
In this context of hypothesis testing, researcher has used level of significance in
terms of percentage of parameters applicable for the total number of IT
companies. The percentage of parameters is measured for proving the
assumption considering 75% and more, applicable for number of IT Companies.
For the sample of 45 companies, if number of companies are equal or more than
33 which follows more than 75% parameters then hypothesis is proved as there
is no significant difference between expected and observed frequency.
Following table relates hypothesis to the associated parameters for hypothesis
testing.
Table 4.4.: Reference between hypothesis and Related parameters.
SL. NO. Hypothesis Parameters ( Table references)
1. Hypothesis 1- ISP is need
of every IT enabled
organization with changing
environment.
Tables- 4.3.1.1, 4.3.1.6, 4.3.2.1,
4.3.2.2, 4.3.3.1, 4.3.3.11, 4.3.3.12,
4.3.4.1, 4.3.4.2, 4.3.5.2, 4.3.5.7,
4.3.6.2, 4.3.7.12, 4.3.8.8, 4.3.11.8,
4.3.12.5
2. Hypothesis 2- Most of IT
companies are having and
implementing ISP.
Tables- 4.3.1.4, 4.3.2.10, 4.3.3.2,
4.3.1.1, 4.3.2.1, 4.3.3.1, 4.3.4.10,
4.3.4.11, 4.3.5.1, 4.3.5.2, 4.3.5.3,
4.3.6.1, 4.3.7.10, 4.3.7.11, 4.3.8.7,
4.3.10.10, 4.3.11.7, 4.3.12.4,
4.3.12.2, 4.3.11.1, 4.3.6.13
3. Hypothesis 3- Use of this
policy (ISP), reduces risk of
stealing data and
information.
Tables- 4.3.1.7, 4.3.2.3, 4.3.3.10,
4.3.4.3, 4.3.5.8, 4.3.8.9, 4.3.11.9,
4.3.12.6.
4. Hypothesis 4- ISP improves
safeguarding assets of IT
companies like hardware,
software and people.
Tables -4.3.1.3, 4.3.1.9, 4.3.1.12,
4.3.2.4, 4.3.2.6, 4.3.2.7, 4.3.3.2,
4.3.3.12, 4.3.5.1, 4.3.5.5, 4.3.5.10,
4.3.6.3, 4.3.6.5, 4.3.6.9, 4.3.7.4,
4.3.7.7.
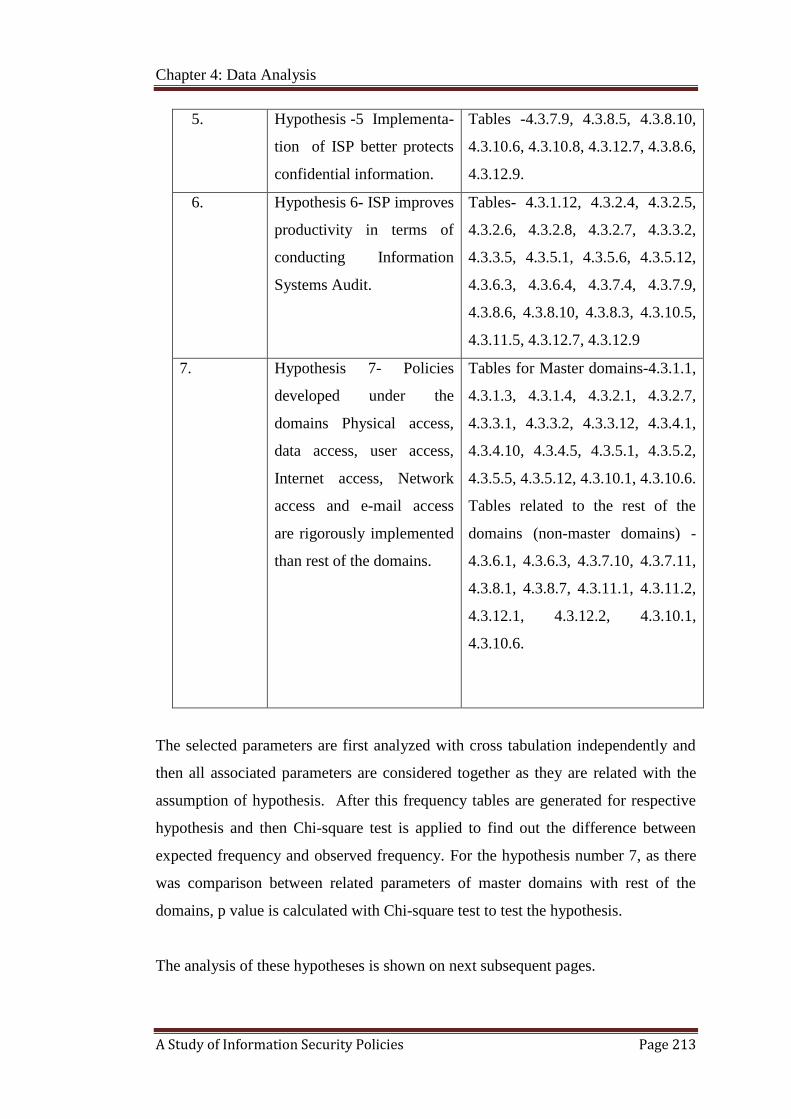
Chapter 4: Data Analysis
A Study of Information Security Policies Page 213
5. Hypothesis -5 Implementa-
tion of ISP better protects
confidential information.
Tables -4.3.7.9, 4.3.8.5, 4.3.8.10,
4.3.10.6, 4.3.10.8, 4.3.12.7, 4.3.8.6,
4.3.12.9.
6. Hypothesis 6- ISP improves
productivity in terms of
conducting Information
Systems Audit.
Tables- 4.3.1.12, 4.3.2.4, 4.3.2.5,
4.3.2.6, 4.3.2.8, 4.3.2.7, 4.3.3.2,
4.3.3.5, 4.3.5.1, 4.3.5.6, 4.3.5.12,
4.3.6.3, 4.3.6.4, 4.3.7.4, 4.3.7.9,
4.3.8.6, 4.3.8.10, 4.3.8.3, 4.3.10.5,
4.3.11.5, 4.3.12.7, 4.3.12.9
7. Hypothesis 7- Policies
developed under the
domains Physical access,
data access, user access,
Internet access, Network
access and e-mail access
are rigorously implemented
than rest of the domains.
Tables for Master domains-4.3.1.1,
4.3.1.3, 4.3.1.4, 4.3.2.1, 4.3.2.7,
4.3.3.1, 4.3.3.2, 4.3.3.12, 4.3.4.1,
4.3.4.10, 4.3.4.5, 4.3.5.1, 4.3.5.2,
4.3.5.5, 4.3.5.12, 4.3.10.1, 4.3.10.6.
Tables related to the rest of the
domains (non-master domains) -
4.3.6.1, 4.3.6.3, 4.3.7.10, 4.3.7.11,
4.3.8.1, 4.3.8.7, 4.3.11.1, 4.3.11.2,
4.3.12.1, 4.3.12.2, 4.3.10.1,
4.3.10.6.
The selected parameters are first analyzed with cross tabulation independently and
then all associated parameters are considered together as they are related with the
assumption of hypothesis. After this frequency tables are generated for respective
hypothesis and then Chi-square test is applied to find out the difference between
expected frequency and observed frequency. For the hypothesis number 7, as there
was comparison between related parameters of master domains with rest of the
domains, p value is calculated with Chi-square test to test the hypothesis.
The analysis of these hypotheses is shown on next subsequent pages.

Chapter 4: Data Analysis
A Study of Information Security Policies Page 214
4.4.1 Hypothesis 1:
Information Security Policy is need of every IT enabled organization in global
and changing environment.
Table 4.4.1.: parameters applicable for need of ISP * Number of IT Comp.
Chart 4.4.1.: parameters applicable and percentage of companies.
Chi square test applied to test the difference between observed number of 39 and
expected number of 34 in the category > 75%. The result shows that there is no
significant difference between observed and expected frequency i.e. hence
hypothesis is proved.
0
10
20
30
40
50
60
70
> 25 - 50 > 50 - 75 > 75 - 90 > 90%
2.2
11.1
22.2
64.4
Pe
rce
nta
ge o
f C
om
pa
nie
s
Percentage of factors
Percentage of Parameters
Number of IT
Companies
Percentage of IT
companies
> 25 – 50% 1 2.2 %
> 50 – 75% 5 11. 1%
> 75 – 90% 39 86.6 %
Total 45 100.0 %
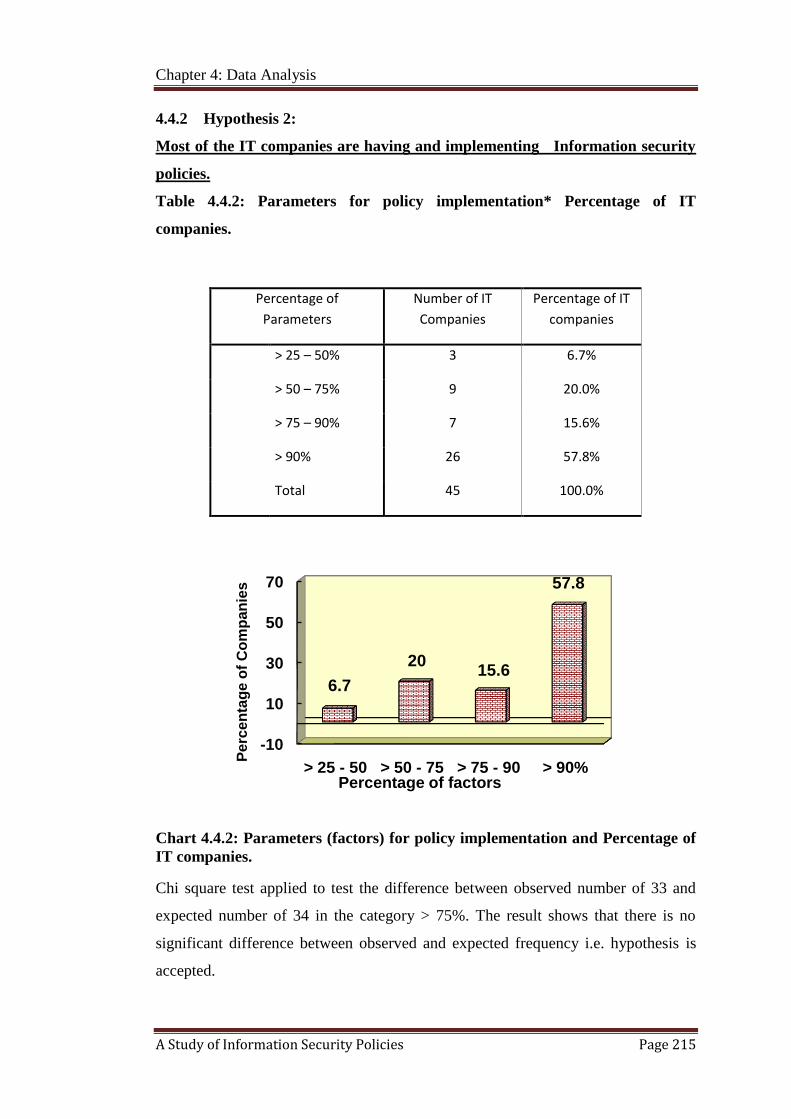
Chapter 4: Data Analysis
A Study of Information Security Policies Page 215
4.4.2 Hypothesis 2:
Most of the IT companies are having and implementing Information security
policies.
Table 4.4.2: Parameters for policy implementation* Percentage of IT
companies.
Percentage of
Parameters
Number of IT
Companies
Percentage of IT
companies
> 25 – 50% 3 6.7%
> 50 – 75% 9 20.0%
> 75 – 90% 7 15.6%
> 90% 26 57.8%
Total 45 100.0%
Chart 4.4.2: Parameters (factors) for policy implementation and Percentage of
IT companies.
Chi square test applied to test the difference between observed number of 33 and
expected number of 34 in the category > 75%. The result shows that there is no
significant difference between observed and expected frequency i.e. hypothesis is
accepted.
-10
10
30
50
70
> 25 - 50 > 50 - 75 > 75 - 90 > 90%
6.7
2015.6
57.8
Pe
rce
nta
ge
of
Co
mp
an
ies
Percentage of factors

Chapter 4: Data Analysis
A Study of Information Security Policies Page 216
4.4.3. Hypothesis 3:
Use of ISP reduces the risk of stealing data and information.
Table 4.4.3.: Parameters for risk reduction and percentage of IT companies.
Percentage of
Parameters
Number of IT
Companies
Percentage of IT
companies
<= 25 % 1 2.2%
> 25 – 50% 1 2.2%
> 50 – 75% 10 22.2%
> 75 – 90% 11 24.4%
> 90% 22 48.9%
Total 45 100.0%
Chart 4.4.3: Parameters for risk reduction and percentage of IT companies.
Chi square test applied to test the difference between observed number of 33 and
expected number of 34 in the category > 75%. The result shows that there is no
significant difference between observed and expected frequency i.e. hypothesis is
accepted.
0
10
20
30
40
50
60
70
<= 25 % > 25 -50
> 50 -75
> 75 -90
> 90%
2.2 2.2
22.2 24.4
48.9
Pe
rce
nta
ge o
f C
om
pa
nie
s
Percentage of factors
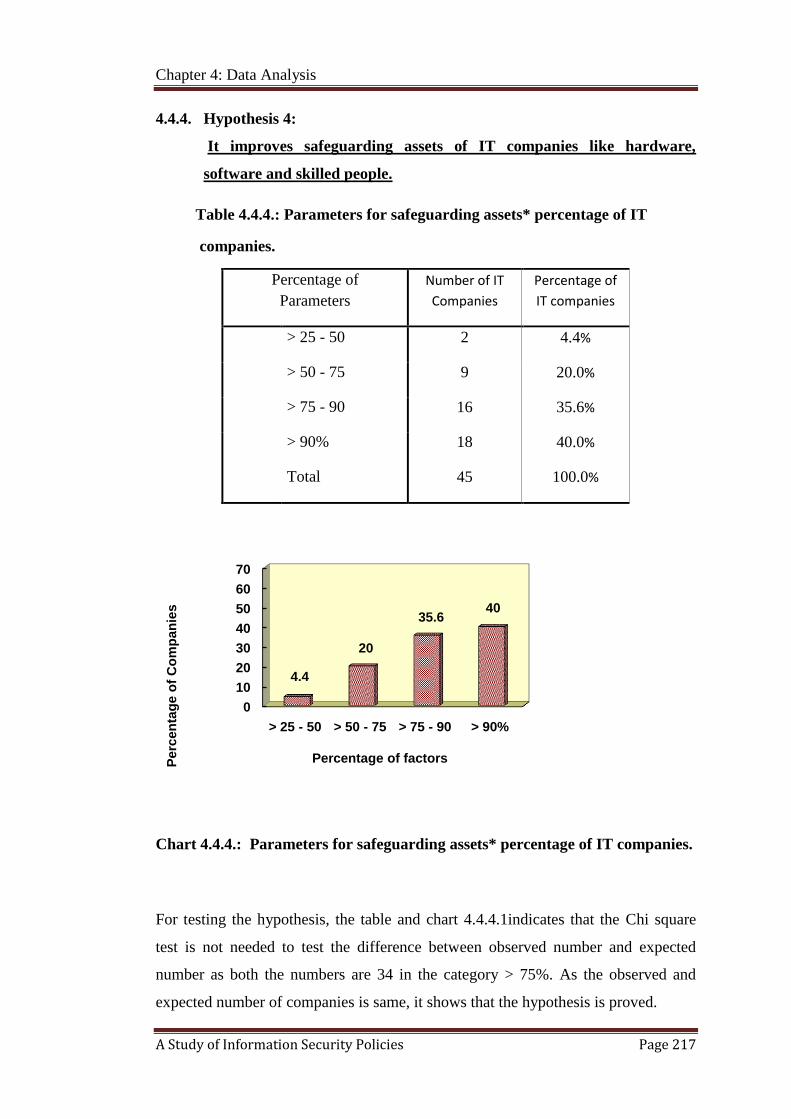
Chapter 4: Data Analysis
A Study of Information Security Policies Page 217
4.4.4. Hypothesis 4:
It improves safeguarding assets of IT companies like hardware,
software and skilled people.
Table 4.4.4.: Parameters for safeguarding assets* percentage of IT
companies.
Percentage of
Parameters
Number of IT
Companies
Percentage of
IT companies
> 25 - 50 2 4.4%
> 50 - 75 9 20.0%
> 75 - 90 16 35.6%
> 90% 18 40.0%
Total 45 100.0%
Chart 4.4.4.: Parameters for safeguarding assets* percentage of IT companies.
For testing the hypothesis, the table and chart 4.4.4.1indicates that the Chi square
test is not needed to test the difference between observed number and expected
number as both the numbers are 34 in the category > 75%. As the observed and
expected number of companies is same, it shows that the hypothesis is proved.
0
10
20
30
40
50
60
70
> 25 - 50 > 50 - 75 > 75 - 90 > 90%
4.4
20
35.640
Perc
en
tag
e o
f C
om
pan
ies
Percentage of factors
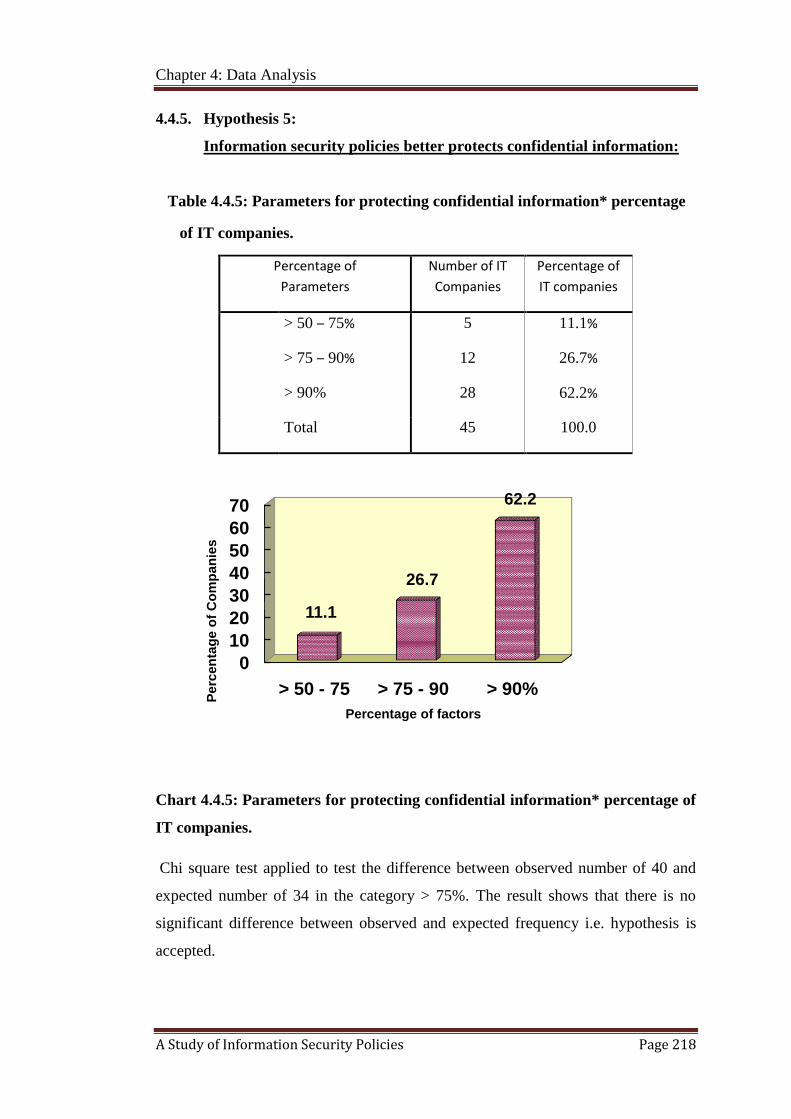
Chapter 4: Data Analysis
A Study of Information Security Policies Page 218
4.4.5. Hypothesis 5:
Information security policies better protects confidential information:
Table 4.4.5: Parameters for protecting confidential information* percentage
of IT companies.
Percentage of
Parameters
Number of IT
Companies
Percentage of
IT companies
> 50 – 75% 5 11.1%
> 75 – 90% 12 26.7%
> 90% 28 62.2%
Total 45 100.0
Chart 4.4.5: Parameters for protecting confidential information* percentage of
IT companies.
Chi square test applied to test the difference between observed number of 40 and
expected number of 34 in the category > 75%. The result shows that there is no
significant difference between observed and expected frequency i.e. hypothesis is
accepted.
0
10
20
30
40
50
60
70
> 50 - 75 > 75 - 90 > 90%
11.1
26.7
62.2
Perc
en
tag
e o
f C
om
pan
ies
Percentage of factors
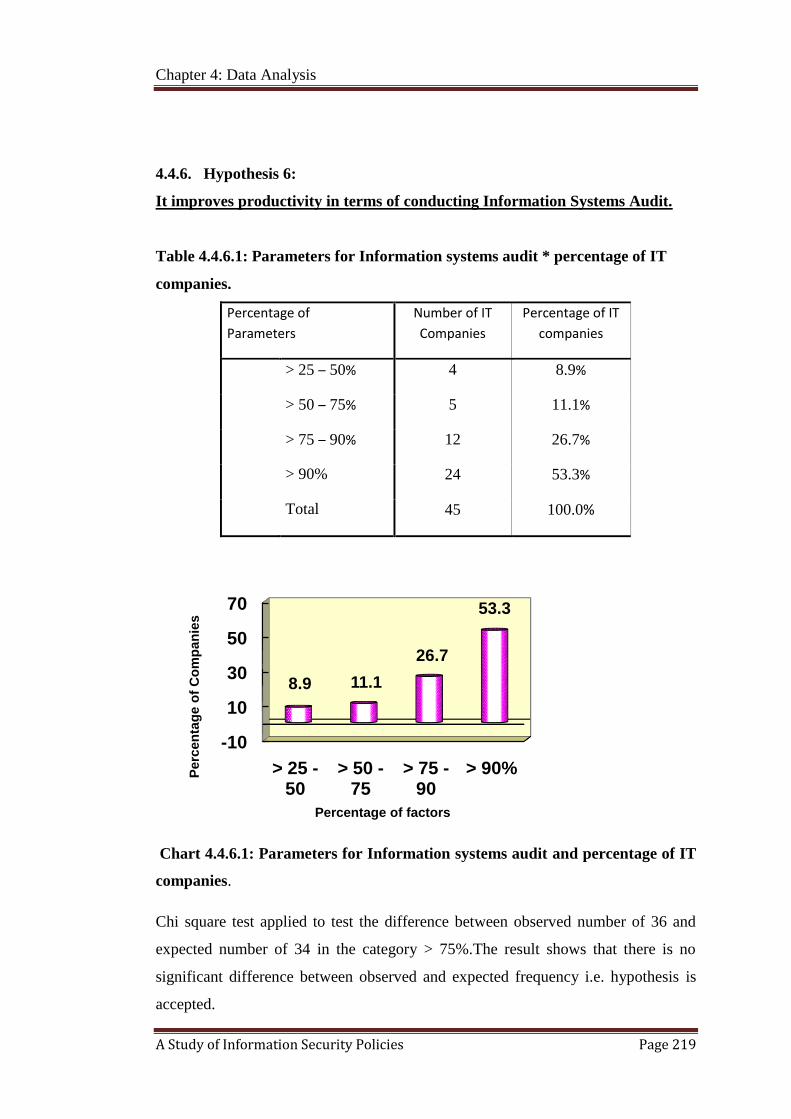
Chapter 4: Data Analysis
A Study of Information Security Policies Page 219
4.4.6. Hypothesis 6:
It improves productivity in terms of conducting Information Systems Audit.
Table 4.4.6.1: Parameters for Information systems audit * percentage of IT
companies.
Percentage of
Parameters
Number of IT
Companies
Percentage of IT
companies
> 25 – 50% 4 8.9%
> 50 – 75% 5 11.1%
> 75 – 90% 12 26.7%
> 90% 24 53.3%
Total 45 100.0%
Chart 4.4.6.1: Parameters for Information systems audit and percentage of IT
companies.
Chi square test applied to test the difference between observed number of 36 and
expected number of 34 in the category > 75%.The result shows that there is no
significant difference between observed and expected frequency i.e. hypothesis is
accepted.
-10
10
30
50
70
> 25 -50
> 50 -75
> 75 -90
> 90%
8.9 11.1
26.7
53.3
Perc
en
tag
e o
f C
om
pan
ies
Percentage of factors
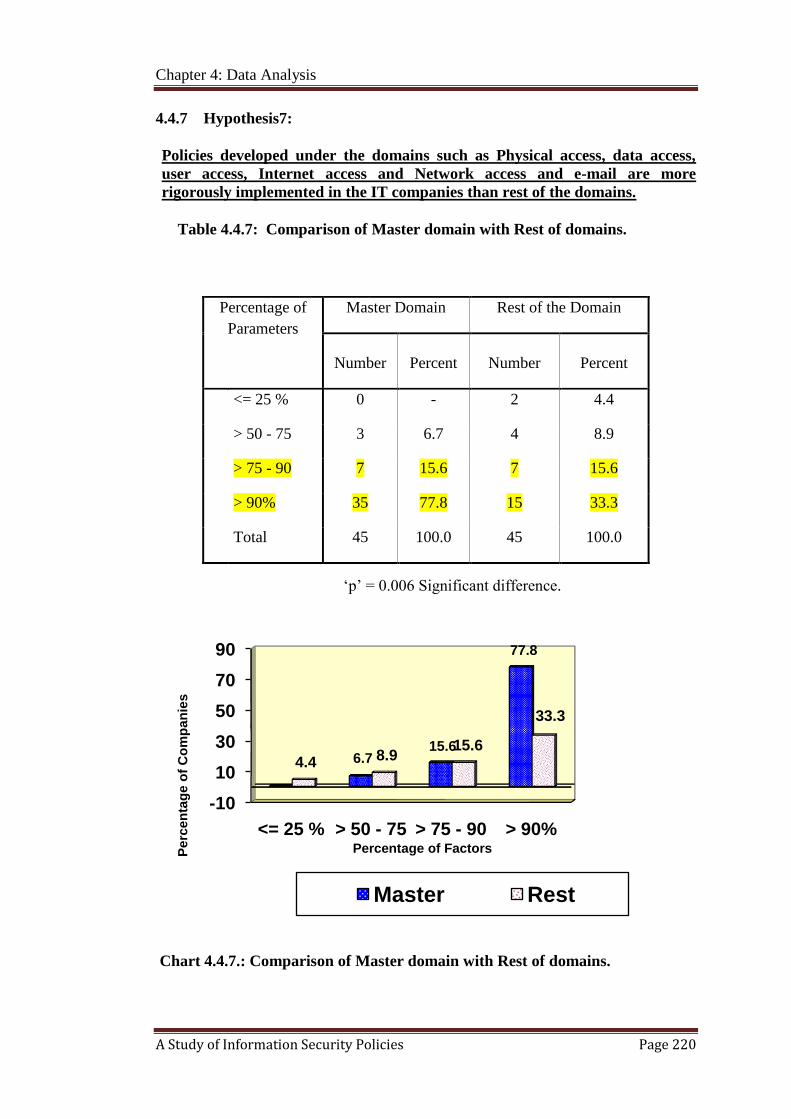
Chapter 4: Data Analysis
A Study of Information Security Policies Page 220
4.4.7 Hypothesis7:
Policies developed under the domains such as Physical access, data access,
user access, Internet access and Network access and e-mail are more
rigorously implemented in the IT companies than rest of the domains.
Table 4.4.7: Comparison of Master domain with Rest of domains.
‘p’ = 0.006 Significant difference.
Chart 4.4.7.: Comparison of Master domain with Rest of domains.
-10
10
30
50
70
90
<= 25 % > 50 - 75 > 75 - 90 > 90%
6.715.6
77.8
4.4 8.915.6
33.3
Perc
en
tag
e o
f C
om
pan
ies
Percentage of Factors
Master Rest
Percentage of
Parameters
Master Domain Rest of the Domain
Number Percent Number Percent
<= 25 % 0 - 2 4.4
> 50 - 75 3 6.7 4 8.9
> 75 - 90 7 15.6 7 15.6
> 90% 35 77.8 15 33.3
Total 45 100.0 45 100.0
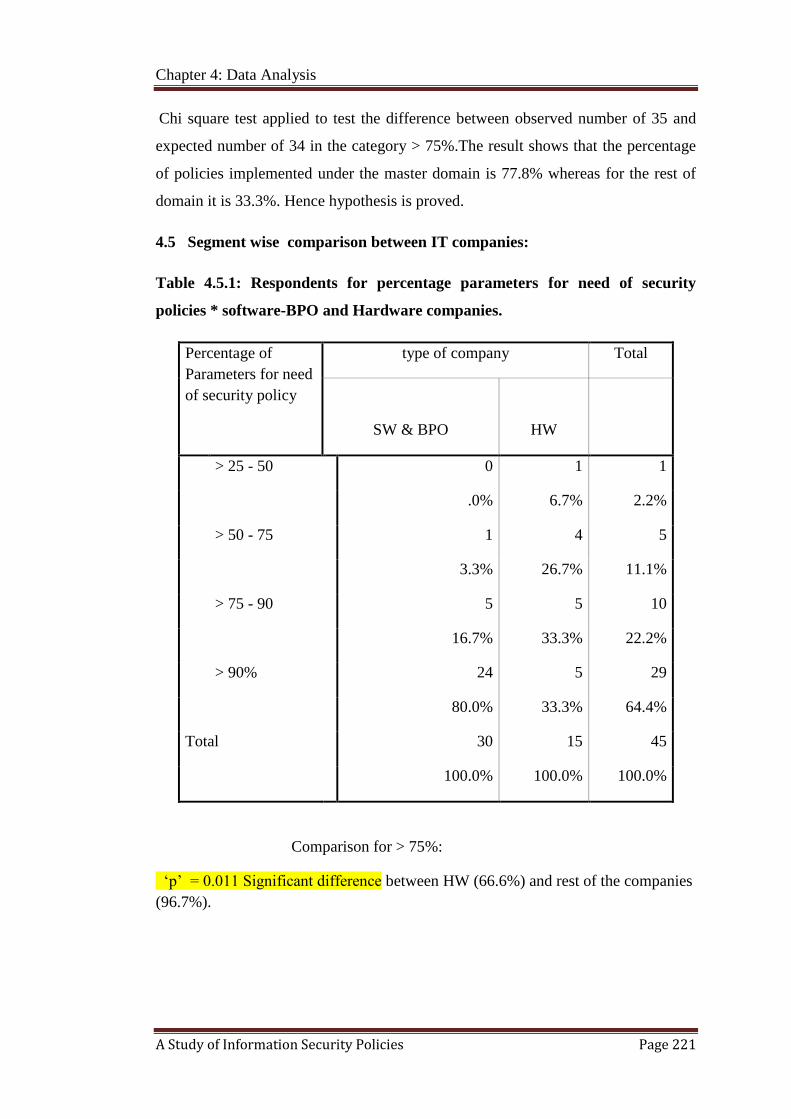
Chapter 4: Data Analysis
A Study of Information Security Policies Page 221
Chi square test applied to test the difference between observed number of 35 and
expected number of 34 in the category > 75%.The result shows that the percentage
of policies implemented under the master domain is 77.8% whereas for the rest of
domain it is 33.3%. Hence hypothesis is proved.
4.5 Segment wise comparison between IT companies:
Table 4.5.1: Respondents for percentage parameters for need of security
policies * software-BPO and Hardware companies.
Percentage of
Parameters for need
of security policy
type of company Total
SW & BPO HW
> 25 - 50 0 1 1
.0% 6.7% 2.2%
> 50 - 75 1 4 5
3.3% 26.7% 11.1%
> 75 - 90 5 5 10
16.7% 33.3% 22.2%
> 90% 24 5 29
80.0% 33.3% 64.4%
Total 30 15 45
100.0% 100.0% 100.0%
Comparison for > 75%:
‘p’ = 0.011 Significant difference between HW (66.6%) and rest of the companies
(96.7%).
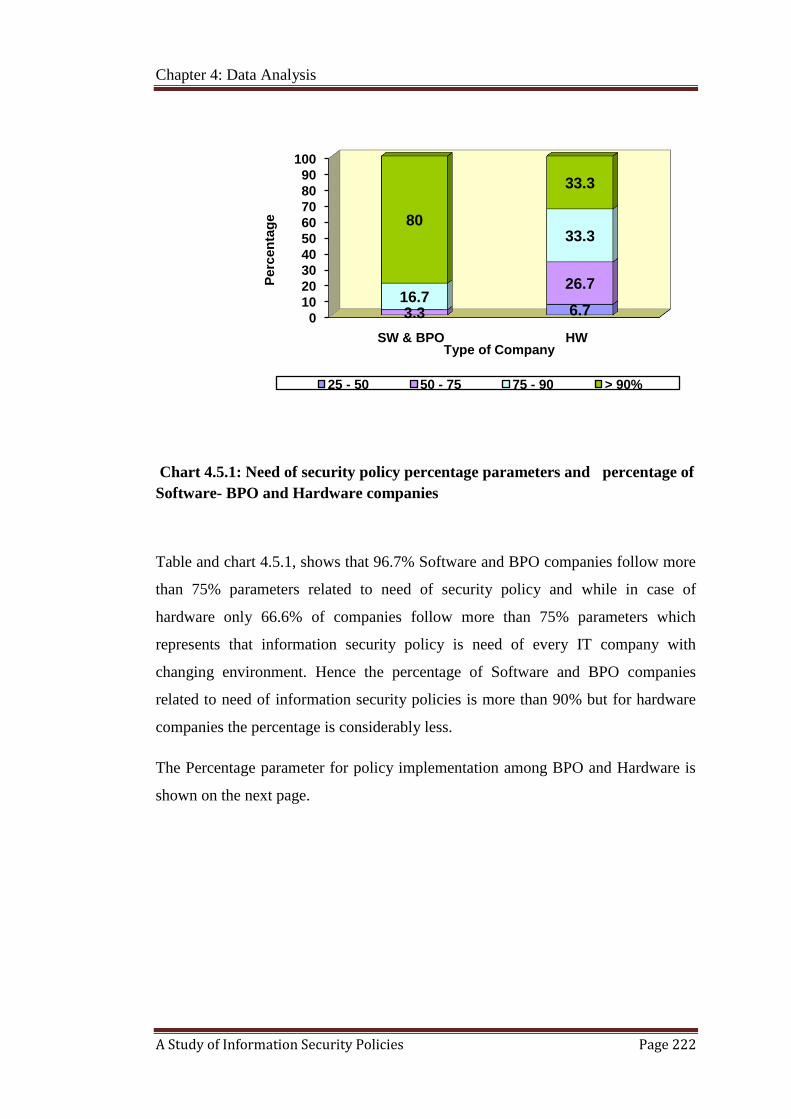
Chapter 4: Data Analysis
A Study of Information Security Policies Page 222
Chart 4.5.1: Need of security policy percentage parameters and percentage of
Software- BPO and Hardware companies
Table and chart 4.5.1, shows that 96.7% Software and BPO companies follow more
than 75% parameters related to need of security policy and while in case of
hardware only 66.6% of companies follow more than 75% parameters which
represents that information security policy is need of every IT company with
changing environment. Hence the percentage of Software and BPO companies
related to need of information security policies is more than 90% but for hardware
companies the percentage is considerably less.
The Percentage parameter for policy implementation among BPO and Hardware is
shown on the next page.
0
10
20
30
40
50
60
70
80
90
100
SW & BPO HW
6.73.3
26.716.7
33.380
33.3
Perc
en
tag
e
Type of Company
25 - 50 50 - 75 75 - 90 > 90%
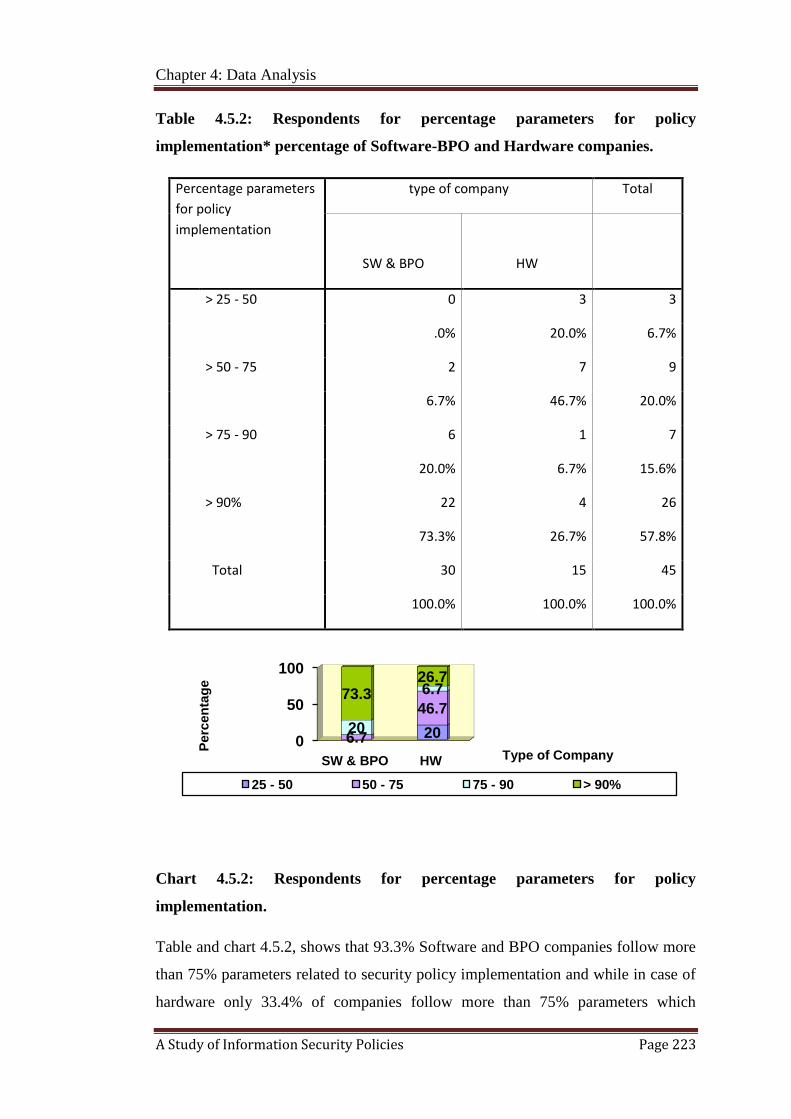
Chapter 4: Data Analysis
A Study of Information Security Policies Page 223
Table 4.5.2: Respondents for percentage parameters for policy
implementation* percentage of Software-BPO and Hardware companies.
Percentage parameters
for policy
implementation
type of company Total
SW & BPO HW
> 25 - 50 0 3 3
.0% 20.0% 6.7%
> 50 - 75 2 7 9
6.7% 46.7% 20.0%
> 75 - 90 6 1 7
20.0% 6.7% 15.6%
> 90% 22 4 26
73.3% 26.7% 57.8%
Total 30 15 45
100.0% 100.0% 100.0%
Chart 4.5.2: Respondents for percentage parameters for policy
implementation.
Table and chart 4.5.2, shows that 93.3% Software and BPO companies follow more
than 75% parameters related to security policy implementation and while in case of
hardware only 33.4% of companies follow more than 75% parameters which
0
50
100
SW & BPO HW
206.7
46.7
20
6.773.326.7
Perc
en
tag
e
Type of Company
25 - 50 50 - 75 75 - 90 > 90%
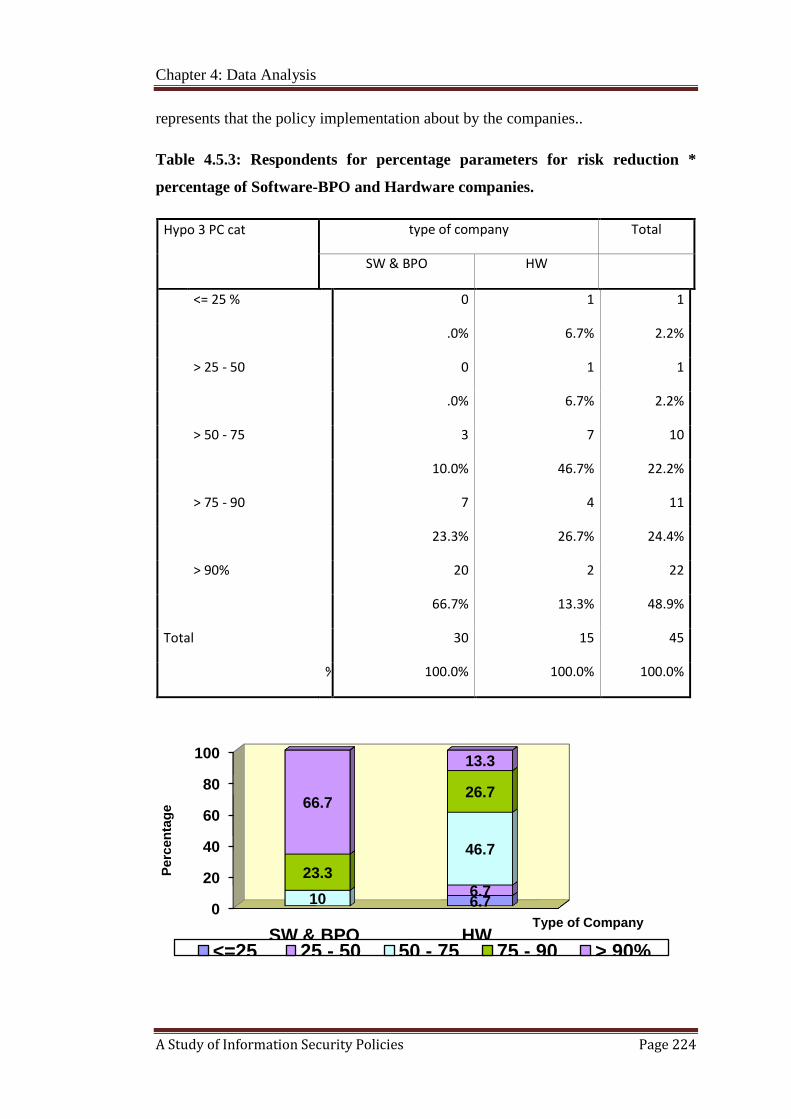
Chapter 4: Data Analysis
A Study of Information Security Policies Page 224
represents that the policy implementation about by the companies..
Table 4.5.3: Respondents for percentage parameters for risk reduction *
percentage of Software-BPO and Hardware companies.
Hypo 3 PC cat
type of company Total
SW & BPO HW
<= 25 % 0 1 1
.0% 6.7% 2.2%
> 25 - 50 0 1 1
.0% 6.7% 2.2%
> 50 - 75 3 7 10
10.0% 46.7% 22.2%
> 75 - 90 7 4 11
23.3% 26.7% 24.4%
> 90% 20 2 22
66.7% 13.3% 48.9%
Total 30 15 45
% 100.0% 100.0% 100.0%
0
20
40
60
80
100
SW & BPO HW
6.76.7
10
46.7
23.3
26.766.7
13.3
Perc
en
tag
e
Type of Company
<=25 25 - 50 50 - 75 75 - 90 > 90%
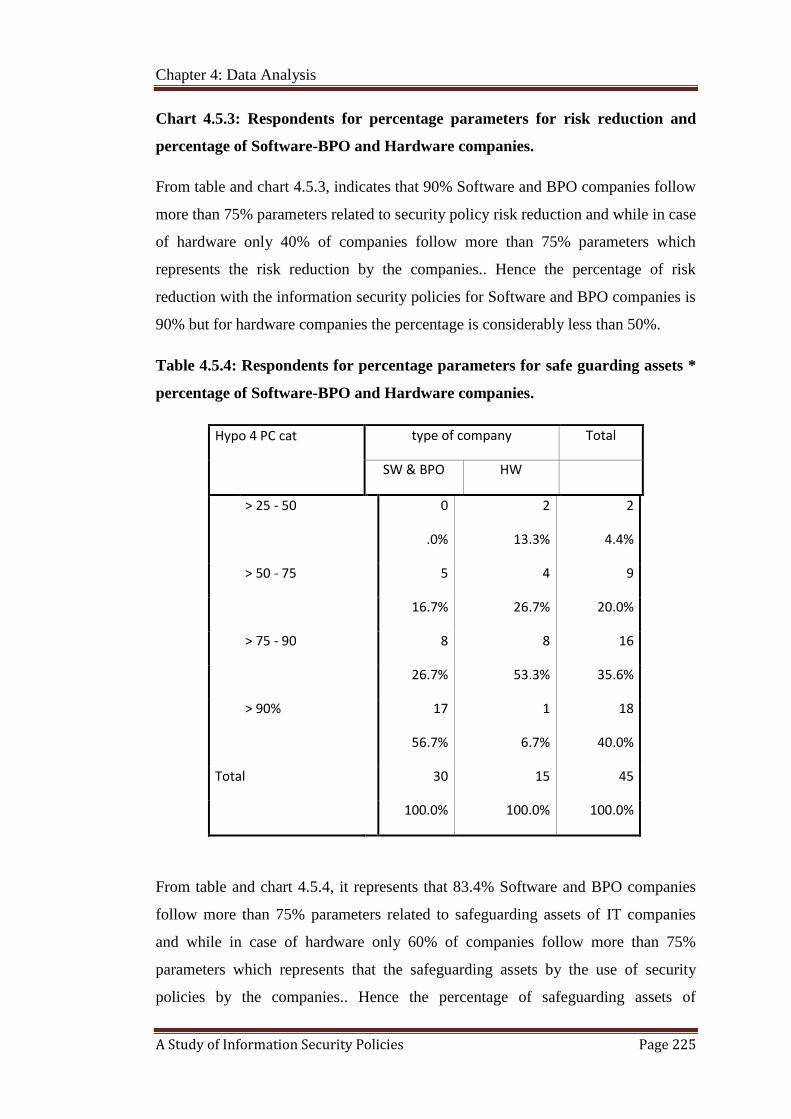
Chapter 4: Data Analysis
A Study of Information Security Policies Page 225
Chart 4.5.3: Respondents for percentage parameters for risk reduction and
percentage of Software-BPO and Hardware companies.
From table and chart 4.5.3, indicates that 90% Software and BPO companies follow
more than 75% parameters related to security policy risk reduction and while in case
of hardware only 40% of companies follow more than 75% parameters which
represents the risk reduction by the companies.. Hence the percentage of risk
reduction with the information security policies for Software and BPO companies is
90% but for hardware companies the percentage is considerably less than 50%.
Table 4.5.4: Respondents for percentage parameters for safe guarding assets *
percentage of Software-BPO and Hardware companies.
Hypo 4 PC cat
type of company Total
SW & BPO HW
> 25 - 50 0 2 2
.0% 13.3% 4.4%
> 50 - 75 5 4 9
16.7% 26.7% 20.0%
> 75 - 90 8 8 16
26.7% 53.3% 35.6%
> 90% 17 1 18
56.7% 6.7% 40.0%
Total 30 15 45
100.0% 100.0% 100.0%
From table and chart 4.5.4, it represents that 83.4% Software and BPO companies
follow more than 75% parameters related to safeguarding assets of IT companies
and while in case of hardware only 60% of companies follow more than 75%
parameters which represents that the safeguarding assets by the use of security
policies by the companies.. Hence the percentage of safeguarding assets of
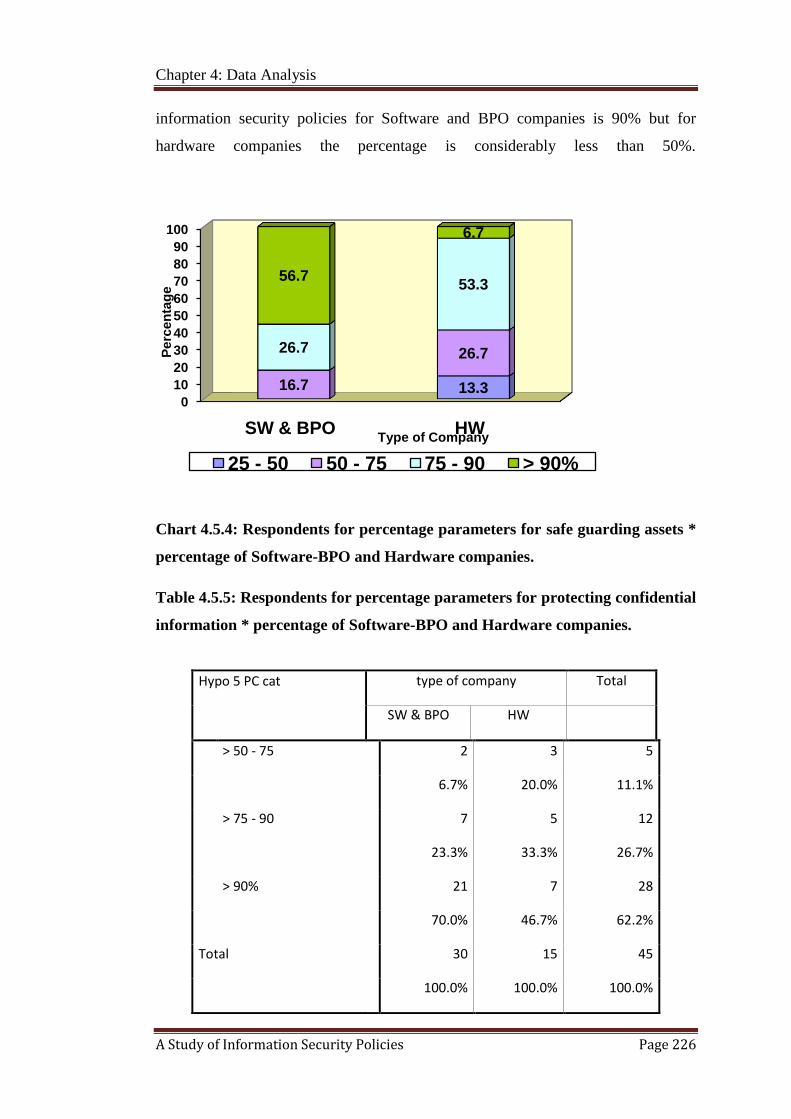
Chapter 4: Data Analysis
A Study of Information Security Policies Page 226
information security policies for Software and BPO companies is 90% but for
hardware companies the percentage is considerably less than 50%.
Chart 4.5.4: Respondents for percentage parameters for safe guarding assets *
percentage of Software-BPO and Hardware companies.
Table 4.5.5: Respondents for percentage parameters for protecting confidential
information * percentage of Software-BPO and Hardware companies.
0
10
20
30
40
50
60
70
80
90
100
SW & BPO HW
13.316.7
26.726.7
53.356.7
6.7
Perc
en
tag
e
Type of Company
25 - 50 50 - 75 75 - 90 > 90%
Hypo 5 PC cat
type of company Total
SW & BPO HW
> 50 - 75 2 3 5
6.7% 20.0% 11.1%
> 75 - 90 7 5 12
23.3% 33.3% 26.7%
> 90% 21 7 28
70.0% 46.7% 62.2%
Total 30 15 45
100.0% 100.0% 100.0%
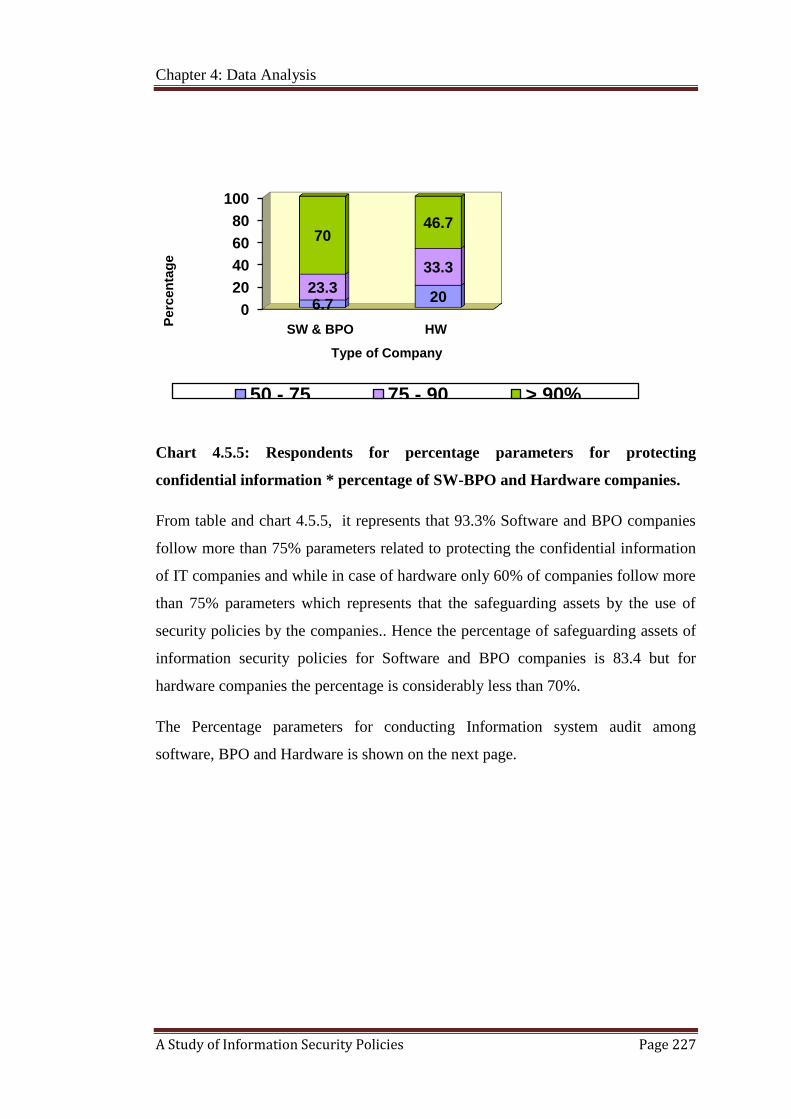
Chapter 4: Data Analysis
A Study of Information Security Policies Page 227
Chart 4.5.5: Respondents for percentage parameters for protecting
confidential information * percentage of SW-BPO and Hardware companies.
From table and chart 4.5.5, it represents that 93.3% Software and BPO companies
follow more than 75% parameters related to protecting the confidential information
of IT companies and while in case of hardware only 60% of companies follow more
than 75% parameters which represents that the safeguarding assets by the use of
security policies by the companies.. Hence the percentage of safeguarding assets of
information security policies for Software and BPO companies is 83.4 but for
hardware companies the percentage is considerably less than 70%.
The Percentage parameters for conducting Information system audit among
software, BPO and Hardware is shown on the next page.
0
20
40
60
80
100
SW & BPO HW
6.720
23.3
33.3
7046.7
Perc
en
tag
e
Type of Company
50 - 75 75 - 90 > 90%
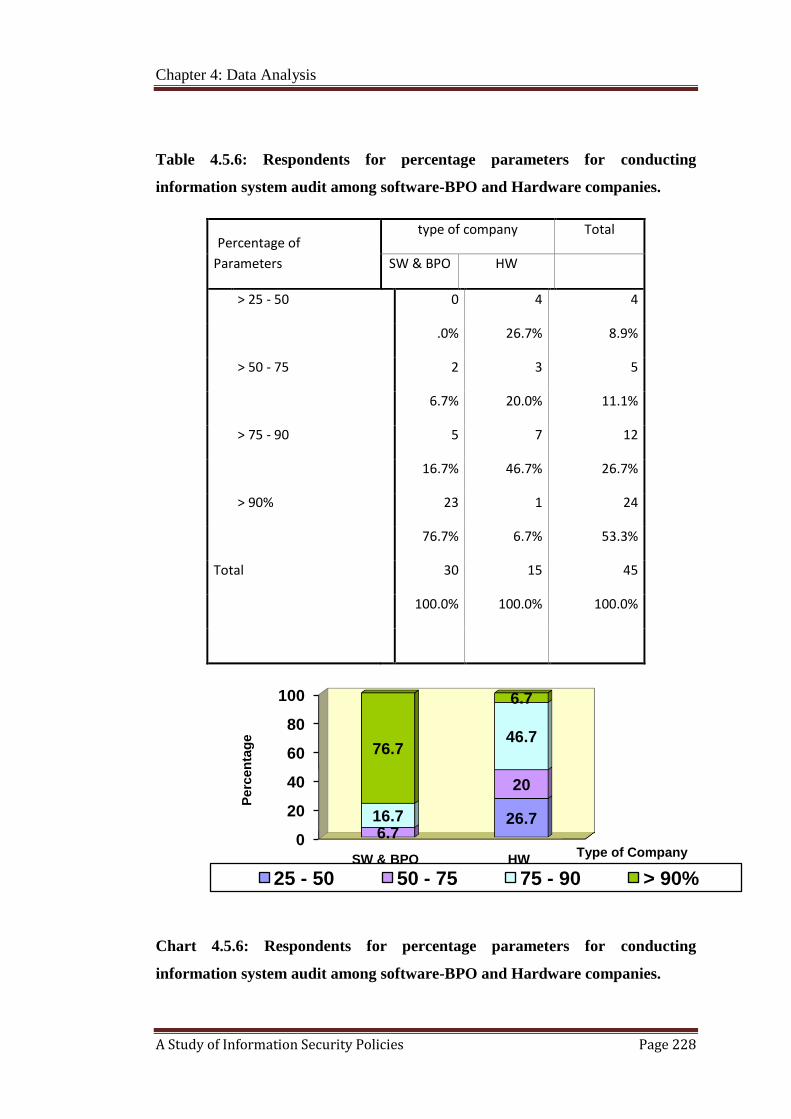
Chapter 4: Data Analysis
A Study of Information Security Policies Page 228
Table 4.5.6: Respondents for percentage parameters for conducting
information system audit among software-BPO and Hardware companies.
Percentage of
Parameters
type of company Total
SW & BPO HW
> 25 - 50 0 4 4
.0% 26.7% 8.9%
> 50 - 75 2 3 5
6.7% 20.0% 11.1%
> 75 - 90 5 7 12
16.7% 46.7% 26.7%
> 90% 23 1 24
76.7% 6.7% 53.3%
Total 30 15 45
100.0% 100.0% 100.0%
Chart 4.5.6: Respondents for percentage parameters for conducting
information system audit among software-BPO and Hardware companies.
0
20
40
60
80
100
SW & BPO HW
26.76.7
20
16.7
46.776.7
6.7
Perc
en
tag
e
Type of Company
25 - 50 50 - 75 75 - 90 > 90%
Chapter 4: Data Analysis
A Study of Information Security Policies Page 229
From table and chart 4.5.6, it represents that 93.4% Software and BPO companies
follow more than 75% parameters related to conducting information system audit of
IT companies and while in case of hardware only 53.4% of companies follow more
than 75% parameters which represents that the safeguarding assets by the use of
security policies by the companies.. Hence the percentage of conducting
Information systems audit of Software and BPO companies is 93.4% but for
hardware companies the percentage is considerably less than 60%.
Chapter 4: Data Analysis
A Study of Information Security Policies Page 230
4.6 References:
1. Ajai Gaur,sanjaya Gaur,Stastictial Methods for Practice and Research,
A guide to data analysis using SPSS, SAGE Publications [2006]
2. C.R. Kothari , Research Methodology , Methods and techniques, New
age, International (p) Ltd, Second Edition [2004], Pg.180.
3. Amir D. Aczel, Jayavel Sounderpandian, Complete Business Statistics,
McGraw Hill Companies, Sixth Edition [2007]