Embed Size (px)
Citation preview
C H A P T E R T H R E E
A
IS
*{
{
}
dvance
SN 0
* The{ MV{ MV} MV} MV# MDk MV* MV{ MV{ Mil} MV
The African Green Revolution:
Results from the Millennium
Villages Project
Generose Nziguheba,* Cheryl A. Palm,* Tadesse Berhe,†
Glenn Denning,* Ahmed Dicko,‡ Omar Diouf,§ Willy Diru,}
Rafael Flor,# Fred Frimpong,k Rebbie Harawa,** Bocary Kaya,‡
Elikana Manumbu,†† John McArthur,*,‡‡ Patrick Mutuo,}
Mbaye Ndiaye,§ Amadou Niang,# Phelire Nkhoma,**
Gerson Nyadzi,†† Jeffrey Sachs,* Clare Sullivan,*
Gebrekidan Teklu,† Lekan Tobe,§§ and Pedro A. Sanchez*
Contents
1. In
s in
065
EaP KP TP PP SG CP BP MP MlennP P
troduction
Agronomy, Volume 109 # 2010
-2113, DOI: 10.1016/S0065-2113(10)09003-6 All rig
rth Institute, Columbia University, New Yorkoraro cluster, Center for National Health Development, Addis Ababa, Ethiopiaiby Cluster, Segou, Maliotou cluster, Louga, Senegalauri cluster, Kisumu, Kenyaenter for West and Central Africa, Bamako, Malionsaaso Cluster, Manso-Nkwata, Ashanti, Ghanawandama Cluster, Zomba, Malawibola Cluster, Tabora, Tanzaniaium Promise, New York, USAampaida Cluster, Zaria, Kaduna State, Nigeria
Else
hts
76
2. D
escription of the Village Clusters 792
.1. G eography, ecology, climate, and soils 792
.2. F arming systems and crops 832
.3. F arming households 833. M
ethodology 843
.1. D ecision-making 843
.2. A gricultural interventions 843
.3. D ata collection and analysis 904. R
esults 924
.1. C rop yields 924
.2. V alue-to-cost ratios 964
.3. C rop and enterprise diversification 102vier Inc.
reserved.
75
76 Generose Nziguheba et al.
5. D
iscussion and Way Forward 1035
.1. C rop production 1035
.2. O rganic inputs and soil management practices 1055
.3. Im proved nutrition 1075
.4. D iversification, primarily with irrigation 1085
.5. S ubsidies and the transition to credit 1085
.6. S afety nets 1095
.7. A daptation to climate change 1106. C
onclusions 111Ackn
owledgments 112Refe
rences 112Abstract
The Millennium Villages Project (MVP) was initiated in 2005 to implement the
recommendations of the UN Millennium Project for achieving the Millennium
Development Goals (MDGs). The project is carried out in 14 sites in hunger and
poverty hotspots in diverse agroecological zones in sub-Saharan Africa (SSA).
The interventions and results for increasing staple crop yields are presented for
eight MV sites and cover 52,000 farming households or 310,000 people. By
supporting farmers with fertilizers, improved crop germplasm, and intensive
training on appropriate agronomic practices, average yields of 3 t ha� 1 were
exceeded in all sites where maize is the major crop. Teff yields doubled in the
Ethiopian site. In contrast, there was little improvement in millet and groundnut
yields in the semiarid and arid sites in West Africa. Over 75% of the farms had
maize yields of 3 t ha� 1 and less than 10% of the households had yields lower
than 2 t ha� 1. Households produced enough maize to meet basic caloric
requirements, with the exception of farms smaller than 0.2 ha in Sauri, Kenya.
Value-to-cost ratios of 2 and above show that the investment in seed and
fertilizer is profitable, provided surplus harvests were stored and sold at peak
prices. Increased crop yields are the first step in the African Green Revolution,
and must be followed by crop diversification for improving nutrition and gen-
erating income and a transition to market-based agriculture. A multisector
approach that exploits the synergies among improved crop production, nutri-
tion, health, and education is essential to achieving the MDGs.
1. Introduction
In most parts of the developing world, per capita staple food cropproduction has increased steadily over the past four decades. This increase islargely the result of Green Revolution technologies, including high-yield-ing crop cultivars, irrigation, fertilizers, mechanization, and pest and diseasecontrol, supported by enabling government policies (Hazell and Wood,2008). Sub-Saharan Africa (SSA) is the only region where per capita
Crop Yields in Millennium Villages 77
production has barely changed (Hazell and Wood, 2008; Jaeger, 1992).While populations continue to grow, yields of major crops remain very lowin SSA with average cereal yields of less than 1 t ha�1 compared to averagesof 3 t ha�1 Latin America and South Asia (Hazell and Wood, 2008).
The absence of the Green Revolution in Africa has been attributed tothe lack of adoption of improved crop germplasm or even the absence ofappropriate varieties for the continent (Sanchez, 2002) but perhaps morepervasive has been the gradual depletion of soil fertility through decades ofremoving nutrients with crop harvests but not replenishing them throughthe addition of sufficient amounts of fertilizer, mineral, or organic (Drechselet al., 2001; Sanchez, 2002; Stoorvogel et al., 1993). The removal ofsubsidies for fertilizers in Africa in the 1980s by the “Washington Consen-sus” structural adjustment programs led to the decline of fertilizer use(World Bank, 2008). Limited physical access to fertilizers has also beenidentified as a major constraint to the use of fertilizers in many countries inAfrica (Larson and Frisvold, 1996). At the Africa Fertilizer summit, a call forincreasing the use of fertilizers from the current average of 8 kg ha�1 wasmade to raise agricultural production (IFDC, 2006). If SSA is to feed itspopulation, a major transformation in agriculture production needs tohappen.
At the Millennium Summit in 2000, world leaders set forth the Millen-nium Development Goals (MDGs), quantified and time-bound goals to cutextreme poverty and hunger, reduce disease burden, improve education,gender equality, and reverse land degradation. Although the MDGs havebeen generally accepted, questions arose regarding how to implement them.In 2002, the United Nations (UN) Millennium Project was commissionedby the UN Secretary General to develop a concrete action plan for theworld to achieve the MDGs; task forces were convened to provide recom-mendations for each of the MDGs. Recommendations from each of the taskforces were published in separate reports and summarized in the Investing inDevelopment report (UN Millennium Project, 2005a).
Currently, Africa is the only continent severely off-tract to reach thegoals (MDG Africa Steering Group, 2008). Several biophysical and policyconstraints limit the ability of most African countries to escape from hunger,extreme poverty, and disease; extremely low food production being at thetop ( Jayne et al., 2003; Larson and Frisvold, 1996; Sachs et al., 2004).
Drawing on the work of the UN Millennium Project Hunger TaskForce (Sanchez and Swaminathan, 2005; UN Millennium Project, 2005b),the then Secretary General of the UN, Kofi Annan, made a call for auniquely African Green Revolution that provided the framework forAfrica to achieve the MDG 1, the eradication of extreme poverty andhunger (MDG Center of East and Southern Africa, 2004). The HungerTask force made seven major recommendations toward the hunger eradi-cation goal:
78 Generose Nziguheba et al.
� Moving from political commitment to action.� Reforming policies and creating an enabling environment.� Increasing the agricultural productivity of food-insecure farmers, focus-ing first on soils and water.
� Improving nutrition for chronically hungry and vulnerable groups.� Reducing the vulnerability of the acutely hungry through productivesafety nets.
� Increasing incomes and making markets work for the poor.� Restoring and conserving the natural resources essential for food security.
The Millennium Villages Project (MVP) was initiated in 2005 as proofof the concept that, by applying the recommendations from all the UNMillennium Project Task Forces in impoverished rural communities inAfrica, they can achieve the MDGs at a local scale by 2015 (Sanchez et al.,2007). The sites were chosen from among hunger hotspots (defined as morethan 20% of children under the age of five as underweight for age) that wereidentified by the UN Millennium Project Hunger Task Force to representthe diverse agroecological zones and farming systems in Africa, as defined byDixon et al. (2001).
The MVP is community-based and applies science- and evidence-basedinterventions in health, education, agriculture, road and electricity infrastruc-ture, information technology, water and sanitation, and the environment.The community-based approach used in the MVP follows well-establishedprinciples of participation, social and gender inclusion, equity, and localstakeholders’ ownership of the decision-making and development processes.Communities are involved in all steps of the project, including assessmentsand priority setting, planning, implementation, monitoring, and evaluation ofproject activities. Before implementation, communities went through a self-analysis process in which they determined the resources available withinand outside the community, and identified their main priorities. Project staff(all nationals of the countries) work with the communities to assess potentialinterventions for the local situations, taking into account short- and long-termobjectives, and cost effectiveness. Subsequent steps consisted of developingcommunity action plans to address these priorities and the steps needed toachieve the MDGs by 2015.
Community-based institutions or leaders were identified and they playimportant roles in the implementation of interventions. They includedtraditional chiefs and elders, local government officials, agricultural exten-sion officers, common interest entrepreneurial groups, farmer associations,women groups, youth groups, self-help groups, and Non GovernmentalOrganizations (NGOs) already working in the villages. Local capacitybuilding plays a major role in achieving community ownership.
Before the MVP started, the communities involved typically experi-enced food shortages for several months in a year, which also had a negative
Crop Yields in Millennium Villages 79
impact on other MDGs, such as health and school attendance, and often ledto migration from rural to urban areas, particularly of men and youth.Therefore, increasing agricultural production and achieving basic foodneeds was one of top priorities identified by communities, followed byimproved health care services (Sanchez et al., 2007).
In this review, we focus on the MDG Goal 1 target of halving hunger,the agriculture-related activities carried out to increase food availability,access, and utilization. We summarize the processes, activities, and results of3–4 years of interventions in several Millennium Village clusters, followedby a discussion of the next steps in the transition from subsistence agricultureto market-based agriculture.
2. Description of the Village Clusters
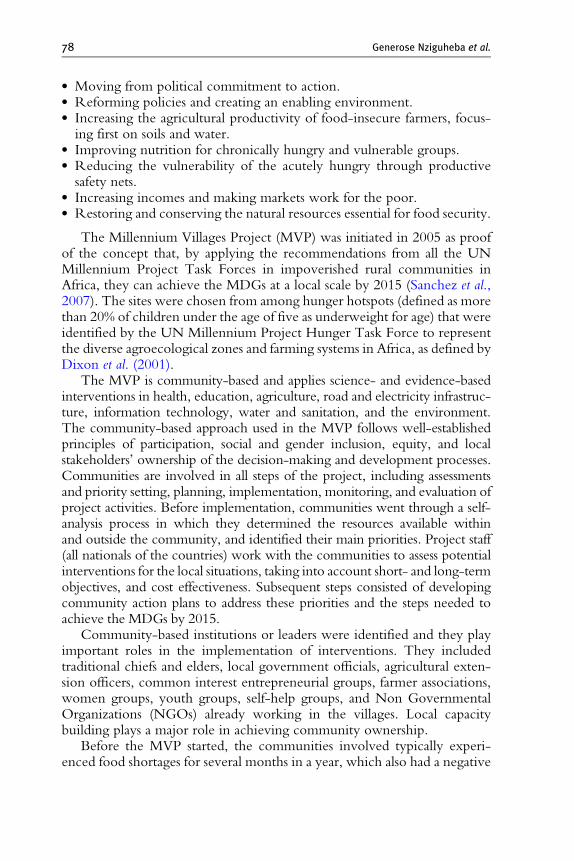
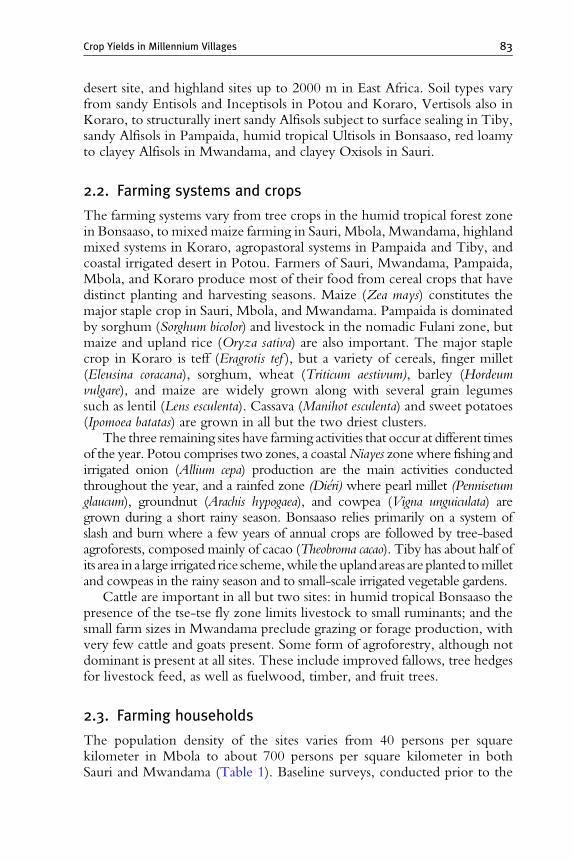
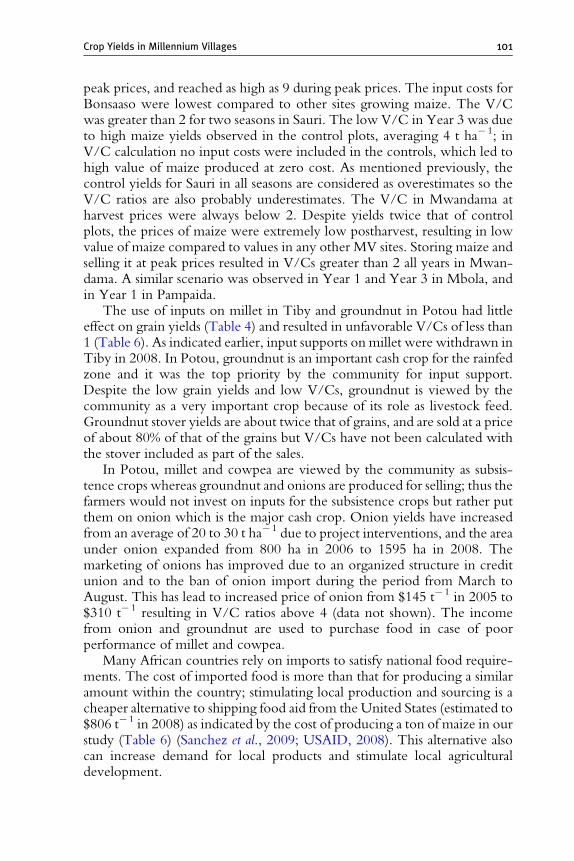
The MVP operates in 80 villages organized in 14 clusters in Kenya,Ethiopia, Ghana, Malawi, Mali, Nigeria, Senegal, Rwanda, Tanzania, andUganda (Fig. 1). These villages were selected to represent the principalagroecological zones and farming systems of Africa that are hunger hotspots.Eight clusters (Sauri, Kenya; Bonsaaso, Ghana; Mwandama, Malawi;Pampaida, Nigeria; Mbola, Tanzania; Tiby, Mali; Koraro, Ethiopia; andPotou, Senegal) were selected to illustrate the site-specific activitiesand achievements in increasing basic food production and other relatedinterventions. Together they constitute 55 out of the 80MillenniumVillages,with approximately 52,000 farming households and 310,000 people.
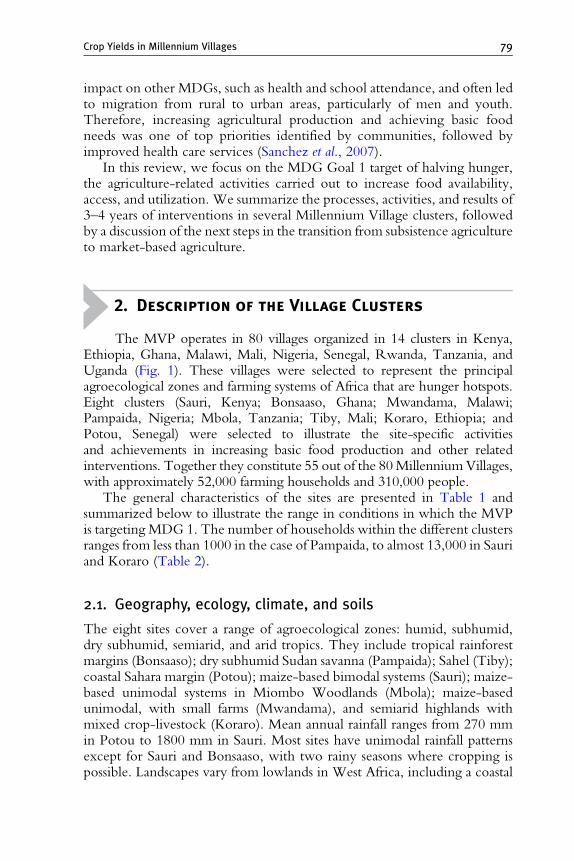
The general characteristics of the sites are presented in Table 1 andsummarized below to illustrate the range in conditions in which the MVPis targeting MDG 1. The number of households within the different clustersranges from less than 1000 in the case of Pampaida, to almost 13,000 in Sauriand Koraro (Table 2).
2.1. Geography, ecology, climate, and soils
The eight sites cover a range of agroecological zones: humid, subhumid,dry subhumid, semiarid, and arid tropics. They include tropical rainforestmargins (Bonsaaso); dry subhumid Sudan savanna (Pampaida); Sahel (Tiby);coastal Sahara margin (Potou); maize-based bimodal systems (Sauri); maize-based unimodal systems in Miombo Woodlands (Mbola); maize-basedunimodal, with small farms (Mwandama), and semiarid highlands withmixed crop-livestock (Koraro). Mean annual rainfall ranges from 270 mmin Potou to 1800 mm in Sauri. Most sites have unimodal rainfall patternsexcept for Sauri and Bonsaaso, with two rainy seasons where cropping ispossible. Landscapes vary from lowlands in West Africa, including a coastal
Bonsaaso, Ghana
Ikaram, Nigeria
Pampaida, Nigeria
Tiby, Mali
Koraro, Ethiopia
Dertu, Kenya
Mwandama, Malawi
Ruhiira, Uganda
Mayange, Rwanda
Sauri, Kenya
Potou, Senegal
Maize mixed
Highland mixed
Highland perennial
Pastoral
Agrosilvopastoral
Cereal-root crops mixed: (Sudan savanna) (Southern Miombo)
Root crops: (Guinea savanna) (Miombo)
Tree crops
Coastal artisanal fishing
Large commercial and small holder
Forest based
Agro-ecological zones
Paddy rice
Irrigated
Sparse
Toya, Mali
Mbola, Tanzania
Gumulira, Malawi
No research villages
Adapted from Dixon et al. 2001. Farming Systems and Poverty. FAOOther millennium village sites
Millennium village sites featured in this chapter
Millennium villages
Figure 1 Location of Millennium Villages in sub-Saharan Africa. Adapted from Dixon et al. (2001).
Table 1 Site characteristics, arranged in decreasing order of annual rainfall
Village cluster,
location
Farming
system and
AEZa
Elevation
(m)
Rainfall pattern
and annual
average (mm)
Length of major
rainy season
Dominant
soils
Population
density
(people
per
square
kilometer) Major cropsb
Sauri, Nyanza
Province, Kenya
Maize mixed,
Subhumid
tropical
1400 Bimodal 1800 March–August Rhodic
Hapludox,
clayey
690 Maize, beans
Bonsaaso, Ashanti
Region, Ghana
Tree crops, humid
tropical forest
210 Bimodal, 1333 April–July Hapludult, sandy
loam
63 Cocoa, plantain,
maize
Mwandama,
Southern region,
Malawi
Cereal root-crops
mixed, subhumid
tropical
900–1200 Unimodal, 1139 November –April Rhodustalfs,
loamy to
clayey
724 Maize
Pampaida, Kaduna
State, Nigeria
Agrosilvopastoral,
dry subhumid
615 Unimodal, 1050 June–November Haplustalfs,
sandy to loamy
138 Sorghum, maize
Mbola, Tabora
region, Tanzania
Maize mixed, dry
subhumid
1050 Unimodal, 928 November–April Haplustalfs,
sandy
40 Maize
Tiby, Segou region,
Mali
Cereal root-crops
mixed, semiarid
275 Unimodal, 543 July–September structurally inert
sandy Ustalfs
98 Millet, cowpea,
flooded rice
Koraro, Tigray
region, Ethiopia
Highland mixed,
semiarid
1550–2000 Unimodal, 500 June–August Calciustepts,
sandy
63 Teff, sorghum,
maize
Potou, Louga
region, Senegal
Arid (pre-Saharan),
coastal artesian
fishing
1–30 Unimodal, 270 July–October Torripsamments
(Niayes zone),
sandy
Haplustalfs
(Dieri zone)
122 Onion, millet,
groundnut
a Agrocolological zone (Dixon et al., 2001).b Grown by at least 50% of the households.
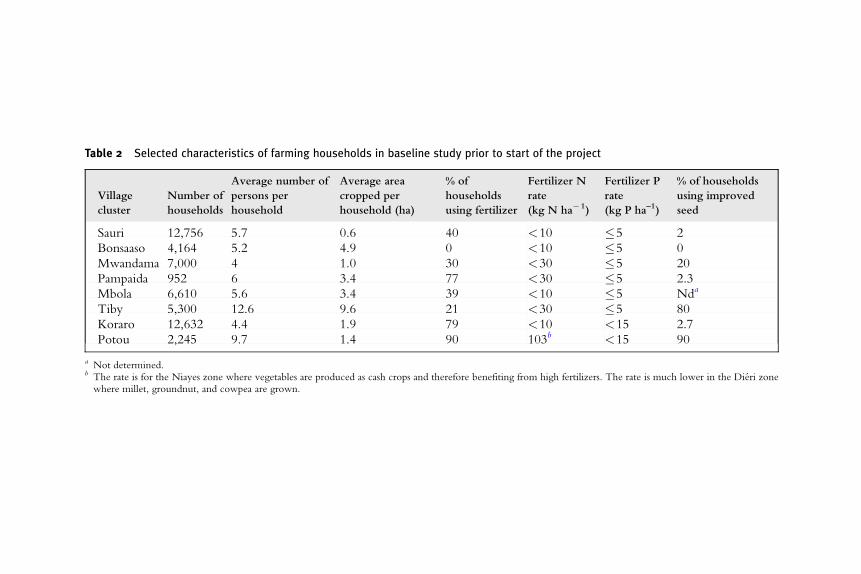
Table 2 Selected characteristics of farming households in baseline study prior to start of the project
Village
cluster
Number of
households
Average number of
persons per
household
Average area
cropped per
household (ha)
% of
households
using fertilizer
Fertilizer N
rate
(kg N ha�1)
Fertilizer P
rate
(kg P ha–1)
% of households
using improved
seed
Sauri 12,756 5.7 0.6 40 <10 �5 2
Bonsaaso 4,164 5.2 4.9 0 <10 �5 0
Mwandama 7,000 4 1.0 30 <30 �5 20
Pampaida 952 6 3.4 77 <30 �5 2.3
Mbola 6,610 5.6 3.4 39 <10 �5 Nda
Tiby 5,300 12.6 9.6 21 <30 �5 80
Koraro 12,632 4.4 1.9 79 <10 <15 2.7
Potou 2,245 9.7 1.4 90 103b <15 90
a Not determined.b The rate is for the Niayes zone where vegetables are produced as cash crops and therefore benefiting from high fertilizers. The rate is much lower in the Dieri zonewhere millet, groundnut, and cowpea are grown.
Crop Yields in Millennium Villages 83
desert site, and highland sites up to 2000 m in East Africa. Soil types varyfrom sandy Entisols and Inceptisols in Potou and Koraro, Vertisols also inKoraro, to structurally inert sandy Alfisols subject to surface sealing in Tiby,sandy Alfisols in Pampaida, humid tropical Ultisols in Bonsaaso, red loamyto clayey Alfisols in Mwandama, and clayey Oxisols in Sauri.
2.2. Farming systems and crops
The farming systems vary from tree crops in the humid tropical forest zonein Bonsaaso, to mixed maize farming in Sauri, Mbola, Mwandama, highlandmixed systems in Koraro, agropastoral systems in Pampaida and Tiby, andcoastal irrigated desert in Potou. Farmers of Sauri, Mwandama, Pampaida,Mbola, and Koraro produce most of their food from cereal crops that havedistinct planting and harvesting seasons. Maize (Zea mays) constitutes themajor staple crop in Sauri, Mbola, and Mwandama. Pampaida is dominatedby sorghum (Sorghum bicolor) and livestock in the nomadic Fulani zone, butmaize and upland rice (Oryza sativa) are also important. The major staplecrop in Koraro is teff (Eragrotis tef ), but a variety of cereals, finger millet(Eleusina coracana), sorghum, wheat (Triticum aestivum), barley (Hordeumvulgare), and maize are widely grown along with several grain legumessuch as lentil (Lens esculenta). Cassava (Manihot esculenta) and sweet potatoes(Ipomoea batatas) are grown in all but the two driest clusters.
The three remaining sites have farming activities that occur at different timesof the year. Potou comprises two zones, a coastalNiayes zone where fishing andirrigated onion (Allium cepa) production are the main activities conductedthroughout the year, and a rainfed zone (Dieri) where pearl millet (Pennisetumglaucum), groundnut (Arachis hypogaea), and cowpea (Vigna unguiculata) aregrown during a short rainy season. Bonsaaso relies primarily on a system ofslash and burn where a few years of annual crops are followed by tree-basedagroforests, composed mainly of cacao (Theobroma cacao). Tiby has about half ofits area in a large irrigated rice scheme,while theupland areas areplanted tomilletand cowpeas in the rainy season and to small-scale irrigated vegetable gardens.
Cattle are important in all but two sites: in humid tropical Bonsaaso thepresence of the tse-tse fly zone limits livestock to small ruminants; and thesmall farm sizes in Mwandama preclude grazing or forage production, withvery few cattle and goats present. Some form of agroforestry, although notdominant is present at all sites. These include improved fallows, tree hedgesfor livestock feed, as well as fuelwood, timber, and fruit trees.
2.3. Farming households
The population density of the sites varies from 40 persons per squarekilometer in Mbola to about 700 persons per square kilometer in bothSauri and Mwandama (Table 1). Baseline surveys, conducted prior to the
84 Generose Nziguheba et al.
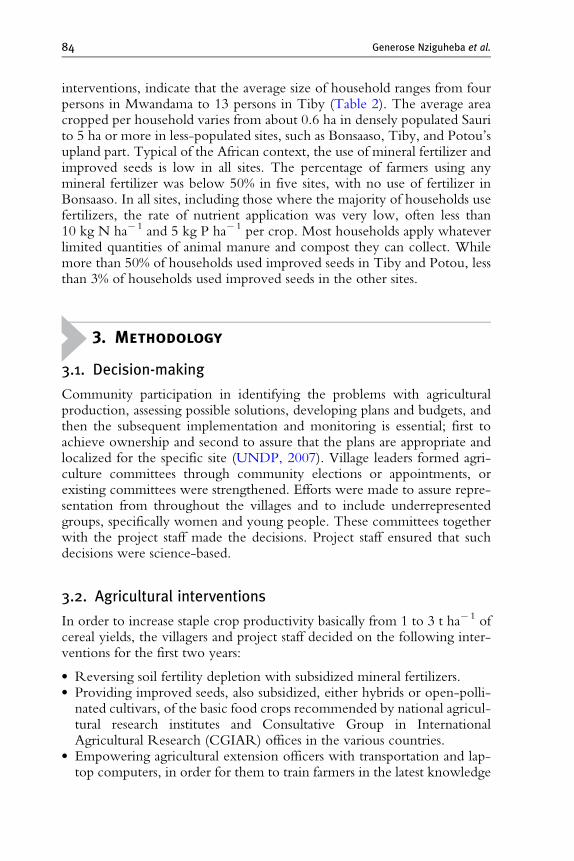
interventions, indicate that the average size of household ranges from fourpersons in Mwandama to 13 persons in Tiby (Table 2). The average areacropped per household varies from about 0.6 ha in densely populated Saurito 5 ha or more in less-populated sites, such as Bonsaaso, Tiby, and Potou’supland part. Typical of the African context, the use of mineral fertilizer andimproved seeds is low in all sites. The percentage of farmers using anymineral fertilizer was below 50% in five sites, with no use of fertilizer inBonsaaso. In all sites, including those where the majority of households usefertilizers, the rate of nutrient application was very low, often less than10 kg N ha�1 and 5 kg P ha�1 per crop. Most households apply whateverlimited quantities of animal manure and compost they can collect. Whilemore than 50% of households used improved seeds in Tiby and Potou, lessthan 3% of households used improved seeds in the other sites.
3. Methodology
3.1. Decision-making
Community participation in identifying the problems with agriculturalproduction, assessing possible solutions, developing plans and budgets, andthen the subsequent implementation and monitoring is essential; first toachieve ownership and second to assure that the plans are appropriate andlocalized for the specific site (UNDP, 2007). Village leaders formed agri-culture committees through community elections or appointments, orexisting committees were strengthened. Efforts were made to assure repre-sentation from throughout the villages and to include underrepresentedgroups, specifically women and young people. These committees togetherwith the project staff made the decisions. Project staff ensured that suchdecisions were science-based.
3.2. Agricultural interventions
In order to increase staple crop productivity basically from 1 to 3 t ha�1 ofcereal yields, the villagers and project staff decided on the following inter-ventions for the first two years:
� Reversing soil fertility depletion with subsidized mineral fertilizers.� Providing improved seeds, also subsidized, either hybrids or open-polli-nated cultivars, of the basic food crops recommended by national agricul-tural research institutes and Consultative Group in InternationalAgricultural Research (CGIAR) offices in the various countries.
� Empowering agricultural extension officers with transportation and lap-top computers, in order for them to train farmers in the latest knowledge
Crop Yields in Millennium Villages 85
of good agronomic practices, including early planting, spacing, seed andfertilizer placement, harvest and storage methods, small-scale water man-agement, and others.
� Farmers agreeing to contribute part of their harvest to the village schoolfeeding programs.
� Constructing grain storage facilities to minimize postharvest losses as wellas to store crop surpluses in order to sell later at higher prices, rather thanimmediately after harvest when prices are lowest.
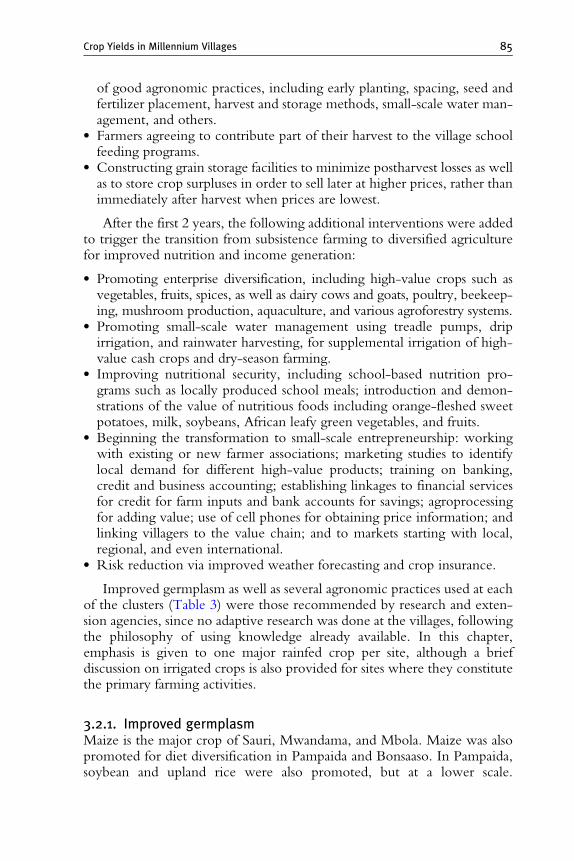
After the first 2 years, the following additional interventions were addedto trigger the transition from subsistence farming to diversified agriculturefor improved nutrition and income generation:
� Promoting enterprise diversification, including high-value crops such asvegetables, fruits, spices, as well as dairy cows and goats, poultry, beekeep-ing, mushroom production, aquaculture, and various agroforestry systems.
� Promoting small-scale water management using treadle pumps, dripirrigation, and rainwater harvesting, for supplemental irrigation of high-value cash crops and dry-season farming.
� Improving nutritional security, including school-based nutrition pro-grams such as locally produced school meals; introduction and demon-strations of the value of nutritious foods including orange-fleshed sweetpotatoes, milk, soybeans, African leafy green vegetables, and fruits.
� Beginning the transformation to small-scale entrepreneurship: workingwith existing or new farmer associations; marketing studies to identifylocal demand for different high-value products; training on banking,credit and business accounting; establishing linkages to financial servicesfor credit for farm inputs and bank accounts for savings; agroprocessingfor adding value; use of cell phones for obtaining price information; andlinking villagers to the value chain; and to markets starting with local,regional, and even international.
� Risk reduction via improved weather forecasting and crop insurance.
Improved germplasm as well as several agronomic practices used at eachof the clusters (Table 3) were those recommended by research and exten-sion agencies, since no adaptive research was done at the villages, followingthe philosophy of using knowledge already available. In this chapter,emphasis is given to one major rainfed crop per site, although a briefdiscussion on irrigated crops is also provided for sites where they constitutethe primary farming activities.
3.2.1. Improved germplasmMaize is the major crop of Sauri, Mwandama, and Mbola. Maize was alsopromoted for diet diversification in Pampaida and Bonsaaso. In Pampaida,soybean and upland rice were also promoted, but at a lower scale.
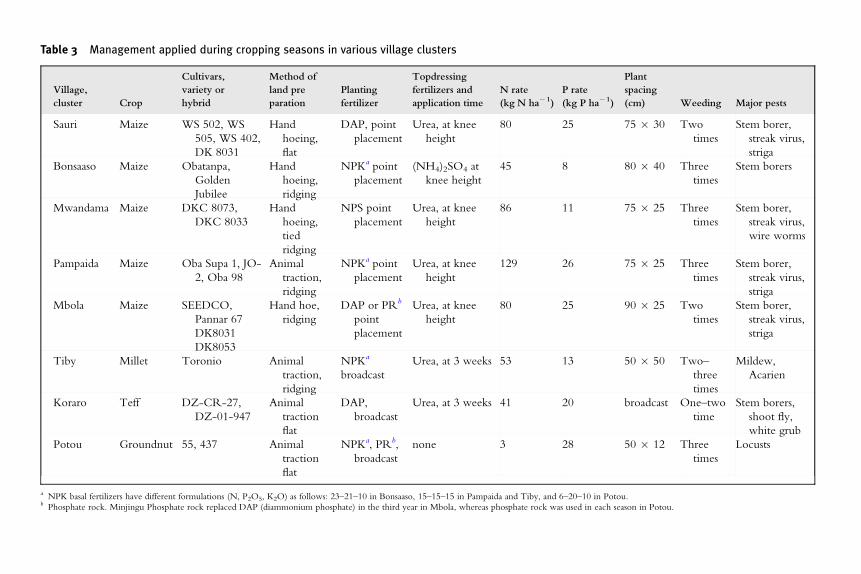
Table 3 Management applied during cropping seasons in various village clusters
Village,
cluster Crop
Cultivars,
variety or
hybrid
Method of
land pre
paration
Planting
fertilizer
Topdressing
fertilizers and
application time
N rate
(kg N ha�1)
P rate
(kg P ha�1)
Plant
spacing
(cm) Weeding Major pests
Sauri Maize WS 502, WS
505, WS 402,
DK 8031
Hand
hoeing,
flat
DAP, point
placement
Urea, at knee
height
80 25 75 � 30 Two
times
Stem borer,
streak virus,
striga
Bonsaaso Maize Obatanpa,
Golden
Jubilee
Hand
hoeing,
ridging
NPKa point
placement
(NH4)2SO4 at
knee height
45 8 80 � 40 Three
times
Stem borers
Mwandama Maize DKC 8073,
DKC 8033
Hand
hoeing,
tied
ridging
NPS point
placement
Urea, at knee
height
86 11 75 � 25 Three
times
Stem borer,
streak virus,
wire worms
Pampaida Maize Oba Supa 1, JO-
2, Oba 98
Animal
traction,
ridging
NPKa point
placement
Urea, at knee
height
129 26 75 � 25 Three
times
Stem borer,
streak virus,
striga
Mbola Maize SEEDCO,
Pannar 67
DK8031
DK8053
Hand hoe,
ridging
DAP or PRb
point
placement
Urea, at knee
height
80 25 90 � 25 Two
times
Stem borer,
streak virus,
striga
Tiby Millet Toronio Animal
traction,
ridging
NPKa
broadcast
Urea, at 3 weeks 53 13 50 � 50 Two–
three
times
Mildew,
Acarien
Koraro Teff DZ-CR-27,
DZ-01-947
Animal
traction
flat
DAP,
broadcast
Urea, at 3 weeks 41 20 broadcast One–two
time
Stem borers,
shoot fly,
white grub
Potou Groundnut 55, 437 Animal
traction
flat
NPKa, PRb,
broadcast
none 3 28 50 � 12 Three
times
Locusts
a NPK basal fertilizers have different formulations (N, P2O5, K2O) as follows: 23–21–10 in Bonsaaso, 15–15–15 in Pampaida and Tiby, and 6–20–10 in Potou.b Phosphate rock. Minjingu Phosphate rock replaced DAP (diammonium phosphate) in the third year in Mbola, whereas phosphate rock was used in each season in Potou.
Crop Yields in Millennium Villages 87
In Bonsaaso, cowpea was introduced because the prevailing farming systemincluded few protein sources. Interventions on cacao in Bonsaaso focusedon improving the current agronomic practices to increase production andreduce pest and diseases. In Tiby, millet and flooded rice were the two cropstargeted. In Koraro, interventions targeted various cereals, whereas pulsecrops such as chickpea (Cicer arietinum) were introduced. For the drier,rainfed zone of Potou, the project focused initially on improved seeds ofmillet but switched to groundnut and cowpea in subsequent years.
Most of the maize germplasm used were hybrids, except for GoldenJubilee and Obatanpa in Bonsaaso (Table 3). Germplasm of the other cropswere all improved varieties.
3.2.2. Land preparationLand preparation followed the traditional practice of hand hoeing in mostclusters in humid and subhumid zones. In drier zones (Tiby, Potou,Pampaida, and Koraro), animal traction is practiced (Table 3). In Bonsaaso,Mwandama, Pampaida, and Mbola crops were grown on ridges, whereas flatplanting was practiced in Sauri, and Potou. Spacing between ridges wasreduced. There was no mechanization and reduced tillage was not practiced.
3.2.3. Plant spacingThe spacing of 75 cm � 25 cm and with one plant per hole was practiced inPampaida and Mwandama because it is promoted by Sasakawa Global 2000in those countries (Table 3). This is in contrast with the traditional plantspacing of 90 cm � 90 cm with four seeds planted per hole in Mwandama,which is considered too wide. Within a cluster, various spacing recommen-dations prevailed depending on whether the crop was grown in monocul-ture or intercropped with other crops like groundnuts, common beans(Phaseolus vulgaris), cowpeas, pigeon pea (Cajanus cajan), or cassava. Alsoit depended on rainfall pattern; for example, maize in Sauri is planted at75 cm � 30 cm spacing for monocrop in the wetter areas but90 cm �30 cm is recommended for drier parts of the cluster.
3.2.4. Fertilizer useThe sources of mineral fertilizers, their placement, and rates of applicationalso varied among clusters, depending on their availability and the recom-mendations from the national research and extension services (Table 3).Diammonium phosphate (DAP) is used as the source of nitrogen andphosphorus for basal applications, and urea for top-dressing in most EastAfrican sites. The exception is Malawi, where the planting fertilizers is aunique blend (23 N-21 P2O5-0 K and 4 S) especially imported by thegovernment. Compound NPK fertilizers are used in the most West Africansites for basal application, and either urea or ammonium sulfate is used fortop-dressing.
88 Generose Nziguheba et al.
The placement of the basal fertilizer applications is Africa’s version ofprecision farming. Farmers dig a planting hole at the recommended spacing,calibrate the applied fertilizer with soda bottle caps, cover it, and plant theseeds. The exceptions are in the three driest sites, Tiby, Koraro, and Potou,where basal fertilizer applications were broadcast and incorporated at tillage.
Rates of nitrogen application for maize ranged from 45 to 129 kg N ha�1
per crop, while that of phosphorus was 11 to 28 kg P ha�1. The rates ofnitrogen applied, except for the highest rate applied in Pampaida, Nigeria, arebelow those recommended to obtaining maximum yields.
3.2.5. Pest managementNo herbicides were used. Two weedings were done for the staple crops inall sites, except for Koraro. The major pest for maize at all sites was the stemborer (Busseola fusca) and maize streak virus was the major disease (Table 3).Striga (Striga hermonthica) infestations occurred in Sauri, Pampaida, andMbola. No insecticides for controlling stem borers were used, except in afew cases in Mbola. The pests and disease attacks did not result in cropfailure in any site except for the locust invasion in Potou during the firstseason.
3.2.6. Irrigated cropsIn addition to rainfed crops, rice and onions are major irrigated crops inTiby and Potou, respectively. In Tiby, irrigated rice is grown on half of thecluster’s cropland, and has been supported by the project with inputs.However, the current irrigation scheme requires much improvement inirrigation water control, and land leveling.
In Potou, onion is produced in the coastal zone. The MVP providedimproved seeds and a change in irrigation practice. Previously, most of theonion fields were irrigated with buckets from the site’s numerous concrete-lined, shallow wells. The watering rate was 10 l m�2 day�1 done in themiddle of the day, when irrigation is least efficient. Consequently, theshallow water table was dropping at an alarming rate of 20 cm year�1,resulting in a high risk of salt intrusion from the Atlantic Ocean. Thischanged to drip irrigation with a diesel pump using the same wells. Onepump can irrigate 0.5 ha day�1, in 12–36 min with drip irrigation.
3.2.7. Grain banks and storage facilitiesWith the anticipated increases in crop yields, storage facilities wereorganized in advance of surplus harvests. These facilities helped to reducepostharvest losses and also provide an option for farmers so that they do nothave to sell their surplus immediately after harvest when prices are generallylow. Community-owned storage facilities were constructed or improved inthe second year of the project. The community contributed to the con-struction by making bricks, bringing stones, sand, poles, and labor for
Crop Yields in Millennium Villages 89
building the facility, whereas the project contributed cement, roofingmaterials, metal doors and windows, and skilled masons.
3.2.8. Subsidy and distribution of fertilizers and improved seedThe entry point for improving crop production was to provide support ofsubsidized improved seeds and mineral fertilizers at recommended rates tofarmers. Seeds, once they were identified, were purchased from local seedcompanies operating in the country or region. In some cases, they weredonated by international seed companies, but only if they were the recom-mended varieties. Fertilizers were also purchased from dealers in the region,or received as donations from partners or through government input sup-port programs in the case of Mwandama and Potou.
The subsidy rates and how they were implemented also varied amongsites; subsidies were initially high ranging from 50 to 100% of the marketcosts and then gradually decreased in the next 2–3 years with the expecta-tion that farmers would eventually be able to purchase the inputs fromcredit, based on sales of their increased crop production. The MVP madecontracts or distributed vouchers to each farmer stating the conditions of thesubsidy. In most sites, farmers were required to pay back a percentage oftheir harvest in grain to the school meals program; in other sites, harvestpayments went into community-run grain banks, where the crop was soldeither to support the school meals program or to generate a revolving fundfor purchasing seeds and fertilizers in subsequent years.
All farming households were eligible to receive the subsidized inputs.The agricultural committees distributed the inputs to all farmers withoversight from agriculture extension officers and village facilitators. Eachfarmer signed a contract acknowledging the receipt of inputs, certifying thatthe inputs would be used on their fields, and committing to the partial in-kind repayment, generally 100–300 kg of grain per household. The agricul-ture committees were also responsible for collecting the repayments.
3.2.9. TrainingFarmers were introduced to and trained in improved inputs and agronomicpractices through a variety of methods throughout the cropping season. As afirst step, discussions were held with agriculture extension officers to assess ifthey were up-to-date on information and recommendations on improvedcultivars, fertilizer use, integrated soil fertility management, and otheragricultural techniques; they were provided with refresher training andinformation sessions as needed. Farmer training sessions were initiatedprior to the beginning of key activities. In these sessions, agriculturalextension agents and MVP agriculture facilitators taught groups of about100 farmers. The first sessions focused on land preparation, fertilizer place-ment, plant spacing, and specifics regarding improved seeds including theiradvantages over local seeds. Although the use of improved seeds was
90 Generose Nziguheba et al.
promoted, farmers were still encouraged to keep plots of their traditionalseeds. Subsequent training sessions were conducted just before the start ofmajor activities such as application of top-dressing fertilizers, harvesting, andpostharvest management. Each of the training sessions consisted of a shortlecture session, followed by practical activities that included land prepara-tion and planting, visits to demonstration plots for best practices, farmer fieldschools, exchange visits between villages, and visits outside the project areato learn from successful interventions.
3.3. Data collection and analysis
3.3.1. Crop yieldsAt the end of each growing season, yields were measured in a minimum of30 households per village cluster in plots where improved germplasm andfertilizers were applied. The households were selected randomly fromhouseholds that had been surveyed for the broader socioeconomic surveys(Sanchez et al., 2007) and represented the geographic and socioeconomicrange of households for the sites. Yield estimations were made in 3–6quadrants placed randomly in each plot, at least 3 m away from the borders.The quadrants size ranged from 9 to 25 m2, depending on the site. All plantsin each of the quadrants were harvested, the fresh weights measured andsubsamples of grain taken for dry weight measurements. Grain yields areexpressed at 14% moisture content. A team of enumerators, members of theagriculture committee, and farmers participated in measuring the yields.
Efforts were also made to collect yield data in randomly selected nonin-tervention plots to serve as controls. Ideally these controls would be located invillages neighboring the cluster, but this type of sampling was possible only inMwandama and Koraro. In other clusters, it was difficult to obtain permissionfrom farmers outside theMVP area to take yield estimates. In these sites, yieldestimates for controls were taken from plots within the MVP area but whereinputs were not applied. This type of sampling may underestimate or overes-timate actual nonintervention controls. Underestimates of control yieldswould result if farmers selectively chose their better fields to apply theimproved seed and fertilizer inputs and the plots where control yields wereestimates were on poorer quality soils. Control yields would be overestimatedwithin the MVP area because farmers had been exposed to training onimproved agronomic practices and may have applied these practices tothese plots, and therefore such controls do not accurately represent whatfarmers would have done if they were not participating in the project.
Analyses of data were performed using Stata 10 (Hamilton, 2009). Yielddata were analyzed by grouping them into four yield quartile groups.Quartiles refer to the 25th, 50th, or 75th percentiles of a frequency distri-bution divided into four parts, each containing a quarter of the sampledhouseholds. Quartile 1 represents the group with the lowest yields, and
Crop Yields in Millennium Villages 91
quartile 4 the highest yields, whereas quartile 2 and quartile 3 represent themiddle groups between the 25th and 75th percentiles. For sites withbimodal rainfall pattern, only yields during the major season are reported.
3.3.2. Daily caloric requirementsMinimum per person grain yields needed to meet basic caloric requirementswere estimated by the amount of grain needed to provide 2100 calories perday per person (Latham, 1997). These requirements are equivalent to219 kg of maize per person per year and 209 kg of teff per person for thecase of Koraro. The annual crop production for a household to produce thetargeted amount of grain was estimated based on the average number ofpeople per household for each site (Table 2). The area required per house-hold to produce that minimum amount of grain was then calculated basedon the yields obtained in each quartile.
3.3.3. Value-to-cost ratiosIncreasing crop production in itself is important for addressing hunger;however, the ability of farmers to continue achieving such yields dependson the profitability of the crop and the farmers’ ability to save and reinvest inagricultural inputs or other income generating activities. In order toassess this potential, the value-to-cost ratios were calculated for the staplecrops for each season and cluster. To make these calculations, prices werecollected for:
� Costs of fertilizers and seeds for each cropping season at actual, notsubsidized, local market prices.
� Farm gate crop prices at harvest time, when prices are generally lowest.� Peak prices occurring later in the year, when the surplus crop was actuallysold.
Prices were collected in local currencies and converted to US dollars atthe prevailing exchange rates. The unsubsidized input costs and the croppeak prices were used to calculate the value-to-cost ratio as a first indicatorof acceptability of investment, using the following formula:
V=C ¼ Y � Ycð ÞX
where Y ($) is the value of the crop in intervention plots, Yc ($) is the valueof the crop harvested in control plots, and X ($) is the cost of inputs (seedsand fertilizers).
The cost of producing each extra ton of maize above that produced inthe control was also calculated.
92 Generose Nziguheba et al.
4. Results
4.1. Crop yields
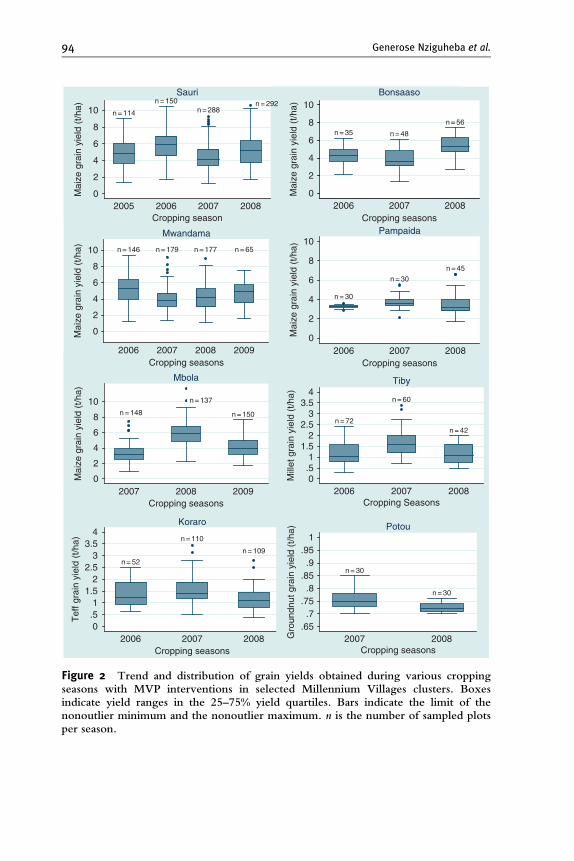
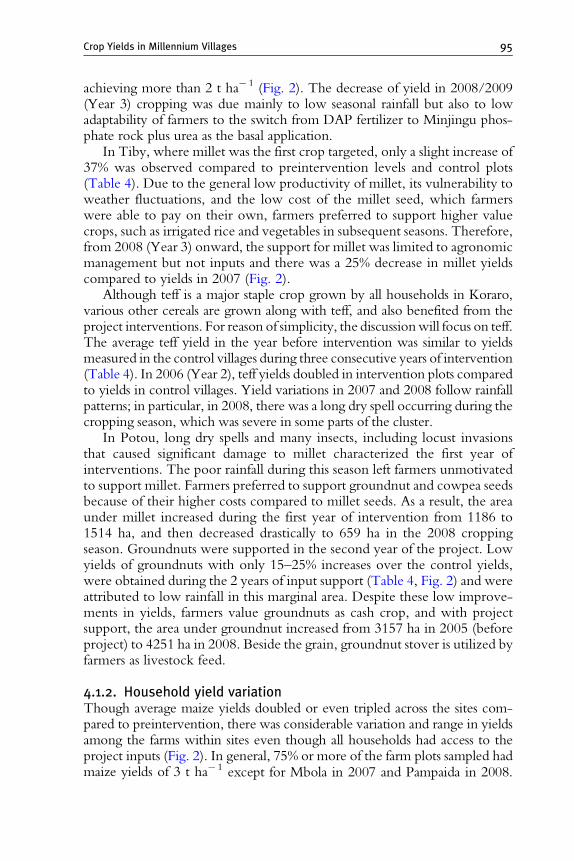
For all the Millennium Village clusters growing maize (Sauri, Bonsaaso,Mwandama, Pampaida, and Mbola), average maize yields overall were4.4 t ha�1 ranging from 5.1 t ha�1 in Sauri to 3.5 t ha�1 in Pampaida(Table 4). Seasonal average maize yields per village cluster were at least3.2 t ha�1. The initial MVP package of agricultural interventions resulted inat least a doubling of maize yields in Sauri, Mwandama, Mbola, andPampaida, and teff yields in Koraro, when compared to preinterventionyields. Maize yields in Bonsaaso, Ghana were not as responsive but thepreintervention and control yields were relatively high. Yields compared tocontrols were not doubled in Sauri and Pampaida; for the case of Sauri,there are questions about the high control yields obtained based on otherdata on crop yields with low inputs from the area ( Jama and Kiwia, 2009;Nziguheba et al., 2002a) but for Pampaida, the reasons for relatively lowmaize yields are unclear.
In contrast to the success in doubling yields for maize and teff, there waslittle improvement in millet yields in Tiby and Potou, and groundnut yieldsin Potou. Both of these village clusters are in the semiarid to arid zoneswhere rainfall amounts and patterns often result in crop failures.
4.1.1. Interannual yield variationThere were slight variations in yields between seasons within a cluster(Table 4, Fig. 2). The yield variations were due to a variety of climatic,cultural, and socioeconomic factors. In Sauri, the variations in maize yields in2005 (Year 1), 2006, and 2008 are correlated with seasonal rainfall totals. Butthe lowest yields observed in 2007, the year with the highest seasonal rainfall,are perhaps due to a shift in the management of inputs distribution from theMVP to a local NGO and agro dealers. Some farmers could not readily accessthe inputs. Nevertheless, a village average of 4.4 t ha�1 is still above the targetof 3 t ha�1. In Mbola, the lowest yields observed in the 2006/2007 (year 1)cropping season were linked to low quality of maize seeds used that seasonand replanting was required in most fields; but also in this first year of theMVP, farmers were reticent to adopt the improved agronomic practices.Many farmers refused to increase the plant density from their normal practiceswith a result that the population density was low, about half of the 45,000plants ha�1 that was recommended. Farmers did realize that those whofollowed the recommendation had very good harvests and in the followingseason, 2007/2008 (Year 2), the majority of farmers followed the recom-mended practices. Coupled with good rainfall, this resulted in a bumperharvest, averaging the highest yields of all, 5.9 t ha�1 with all farmers
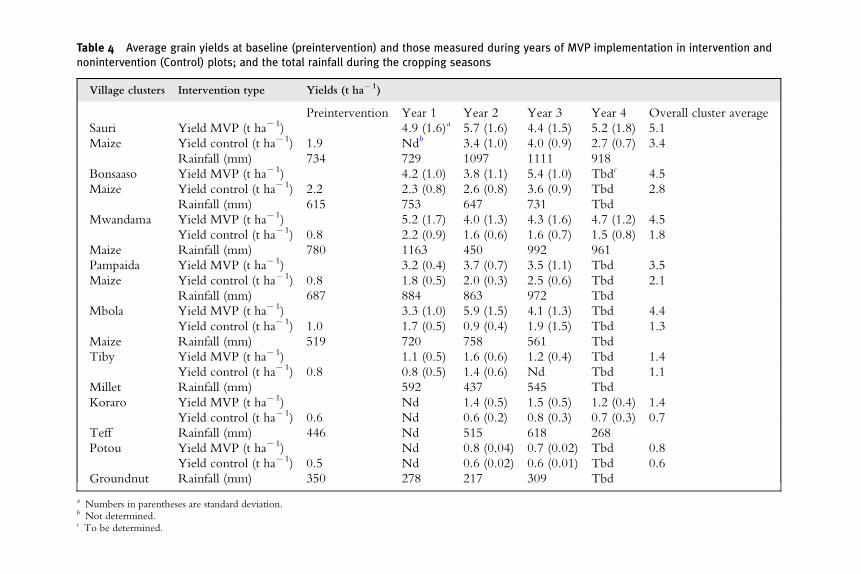
Table 4 Average grain yields at baseline (preintervention) and those measured during years of MVP implementation in intervention andnonintervention (Control) plots; and the total rainfall during the cropping seasons
Village clusters Intervention type Yields (t ha�1)
Preintervention Year 1 Year 2 Year 3 Year 4 Overall cluster average
Sauri Yield MVP (t ha�1) 4.9 (1.6)a 5.7 (1.6) 4.4 (1.5) 5.2 (1.8) 5.1
Maize Yield control (t ha�1) 1.9 Ndb 3.4 (1.0) 4.0 (0.9) 2.7 (0.7) 3.4
Rainfall (mm) 734 729 1097 1111 918
Bonsaaso Yield MVP (t ha�1) 4.2 (1.0) 3.8 (1.1) 5.4 (1.0) Tbdc 4.5
Maize Yield control (t ha�1) 2.2 2.3 (0.8) 2.6 (0.8) 3.6 (0.9) Tbd 2.8
Rainfall (mm) 615 753 647 731 Tbd
Mwandama Yield MVP (t ha�1) 5.2 (1.7) 4.0 (1.3) 4.3 (1.6) 4.7 (1.2) 4.5
Yield control (t ha�1) 0.8 2.2 (0.9) 1.6 (0.6) 1.6 (0.7) 1.5 (0.8) 1.8
Maize Rainfall (mm) 780 1163 450 992 961
Pampaida Yield MVP (t ha�1) 3.2 (0.4) 3.7 (0.7) 3.5 (1.1) Tbd 3.5
Maize Yield control (t ha�1) 0.8 1.8 (0.5) 2.0 (0.3) 2.5 (0.6) Tbd 2.1
Rainfall (mm) 687 884 863 972 Tbd
Mbola Yield MVP (t ha�1) 3.3 (1.0) 5.9 (1.5) 4.1 (1.3) Tbd 4.4
Yield control (t ha�1) 1.0 1.7 (0.5) 0.9 (0.4) 1.9 (1.5) Tbd 1.3
Maize Rainfall (mm) 519 720 758 561 Tbd
Tiby Yield MVP (t ha�1) 1.1 (0.5) 1.6 (0.6) 1.2 (0.4) Tbd 1.4
Yield control (t ha�1) 0.8 0.8 (0.5) 1.4 (0.6) Nd Tbd 1.1
Millet Rainfall (mm) 592 437 545 Tbd
Koraro Yield MVP (t ha�1) Nd 1.4 (0.5) 1.5 (0.5) 1.2 (0.4) 1.4
Yield control (t ha�1) 0.6 Nd 0.6 (0.2) 0.8 (0.3) 0.7 (0.3) 0.7
Teff Rainfall (mm) 446 Nd 515 618 268
Potou Yield MVP (t ha�1) Nd 0.8 (0.04) 0.7 (0.02) Tbd 0.8
Yield control (t ha�1) 0.5 Nd 0.6 (0.02) 0.6 (0.01) Tbd 0.6
Groundnut Rainfall (mm) 350 278 217 309 Tbd
a Numbers in parentheses are standard deviation.b Not determined.c To be determined.
n = 114
n = 150n = 288
n = 292
0
2
4
6
8
10
Mai
ze g
rain
yie
ld (
t/ha)
2005 2006 2007 2008
Sauri
n = 146 n = 65n = 179 n = 177
0
2
4
6
8
10
Mai
ze g
rain
yie
ld (
t/ha)
2006 2007 2008 2009
Mwandama
n = 148
n = 137
n = 150
0
2
4
6
8
10
Mai
ze g
rain
yie
ld (
t/ha)
2007 2008 2009
Mbola
n = 52
n = 110
n = 109
0.51
1.52
2.53
3.54
Tef
f gra
in y
ield
(t/h
a)
2006 2007 2008Cropping seasons
Koraro
n = 35 n = 48
n = 56
0
2
4
6
8
10
Mai
ze g
rain
yie
ld (
t/ha)
2006 2007 2008
Bonsaaso
n = 30
n = 45
0
2
4
6
8
10
Mai
ze g
rain
yie
ld (
t/ha)
2006 2007 2008
Pampaida
n = 30
n = 72
n = 60
n = 42
0.51
1.52
2.53
3.54
Mill
et g
rain
yie
ld (
t/ha)
2006 2007 2008
Tiby
n = 30
n = 30
.65.7
.75.8
.85.9
.951
Gro
undn
ut g
rain
yie
ld (
t/ha)
2007 2008Cropping seasons
Potou
Cropping season Cropping seasons
Cropping seasons Cropping Seasons
Cropping seasons Cropping seasons
Figure 2 Trend and distribution of grain yields obtained during various croppingseasons with MVP interventions in selected Millennium Villages clusters. Boxesindicate yield ranges in the 25–75% yield quartiles. Bars indicate the limit of thenonoutlier minimum and the nonoutlier maximum. n is the number of sampled plotsper season.
94 Generose Nziguheba et al.
Crop Yields in Millennium Villages 95
achieving more than 2 t ha�1 (Fig. 2). The decrease of yield in 2008/2009(Year 3) cropping was due mainly to low seasonal rainfall but also to lowadaptability of farmers to the switch from DAP fertilizer to Minjingu phos-phate rock plus urea as the basal application.
In Tiby, where millet was the first crop targeted, only a slight increase of37% was observed compared to preintervention levels and control plots(Table 4). Due to the general low productivity of millet, its vulnerability toweather fluctuations, and the low cost of the millet seed, which farmerswere able to pay on their own, farmers preferred to support higher valuecrops, such as irrigated rice and vegetables in subsequent seasons. Therefore,from 2008 (Year 3) onward, the support for millet was limited to agronomicmanagement but not inputs and there was a 25% decrease in millet yieldscompared to yields in 2007 (Fig. 2).
Although teff is a major staple crop grown by all households in Koraro,various other cereals are grown along with teff, and also benefited from theproject interventions. For reason of simplicity, the discussionwill focus on teff.The average teff yield in the year before intervention was similar to yieldsmeasured in the control villages during three consecutive years of intervention(Table 4). In 2006 (Year 2), teff yields doubled in intervention plots comparedto yields in control villages. Yield variations in 2007 and 2008 follow rainfallpatterns; in particular, in 2008, there was a long dry spell occurring during thecropping season, which was severe in some parts of the cluster.
In Potou, long dry spells and many insects, including locust invasionsthat caused significant damage to millet characterized the first year ofinterventions. The poor rainfall during this season left farmers unmotivatedto support millet. Farmers preferred to support groundnut and cowpea seedsbecause of their higher costs compared to millet seeds. As a result, the areaunder millet increased during the first year of intervention from 1186 to1514 ha, and then decreased drastically to 659 ha in the 2008 croppingseason. Groundnuts were supported in the second year of the project. Lowyields of groundnuts with only 15–25% increases over the control yields,were obtained during the 2 years of input support (Table 4, Fig. 2) and wereattributed to low rainfall in this marginal area. Despite these low improve-ments in yields, farmers value groundnuts as cash crop, and with projectsupport, the area under groundnut increased from 3157 ha in 2005 (beforeproject) to 4251 ha in 2008. Beside the grain, groundnut stover is utilized byfarmers as livestock feed.
4.1.2. Household yield variationThough average maize yields doubled or even tripled across the sites com-pared to preintervention, there was considerable variation and range in yieldsamong the farms within sites even though all households had access to theproject inputs (Fig. 2). In general, 75% or more of the farm plots sampled hadmaize yields of 3 t ha�1 except for Mbola in 2007 and Pampaida in 2008.
96 Generose Nziguheba et al.
Most sites, however, also had a few households with yields below 2 t ha�1 inmost seasons; such yields are similar to or even below the average yield fromthe control plots in those sites. Usually, less than 10% of the households hadyields less than 2 t ha�1.
On the other extreme, in all village clusters and all seasons, households inthe highest quartile reached yields of 6 t ha�1, with the exception of Mbola in2007 and Pampaida in any season. Yields in Pampaida never reached 6 t ha�1.
There was also a large variation in teff yields range between seasons inKoraro. In 2006, 32% of sampled households had yields below 1 t ha�1. Thevalue reduced to 17% in 2007 when yields in the second quartile wereabove 1 t ha�1, while they increased to 42% in 2008. The distribution ofyields in quartiles 2 and 3 was wide in 2006 whereas it narrowed in 2008when all yields in these quartiles were below 1.5 t ha�1 (Fig. 2).
4.1.3. Meeting caloric requirementsFor all maize growing sites, the annual quantity of maize required for a house-hold to satisfy its caloric needs ranged between 0.9 and 1.3 t (Table 5). Anindicator for measuring progress toward the hunger MDG is the percentage ofthe population below the minimum dietary energy intake level (Palma et al.,2009). Producing the basic caloric requirements for households was essentiallynot possible on the small farm sizes in Mwandama and Sauri (1.0 and 0.6 ha,respectively) at baseline yields (Table 2, Table 5). The farm size is big enough inthe other sites growing maize, but in sites requiring more than 1 ha to producethe basic amount of maize, labor may become a constraint to production. Theincreased yieldswith project interventions reduced the area required to producethe basic caloric requirement to only 20–40% of that required at baseline yieldlevels. Even for farmers in the lowest quartile of yield production, average farmsizes were sufficient (Table 2, Table 5). The only situation forwhich insufficientmaizewould be producedwith seed and fertilizer tomeet this basic requirementis in the lowest farm size quartile in Sauri, which averaged only 0.14 ha.Households with such small farm size cannot meet the caloric needs even ifthey are able to produce the yields of the highest quartile. Such households,often headed by elderly widows have to depend on social safety nets.
In Koraro, the amount of teff required for a household to satisfy its basiccaloric needs was estimated to be 0.92 t. This would require an area of1.5 ha. While the average farm size, 1.9 ha is sufficient to meet thisrequirement, many other crops are grown in Koraro. Project interventionsreduced the required area to less than half using the average yields attained.
4.2. Value-to-cost ratios
The investment in inputs proved to be profitable, provided the surplus yieldswere stored and soldwhen the value of the cropwas at peak prices. Profitabilityis defined when the value-to-cost ratios are 2 or higher (Morris et al., 2007).
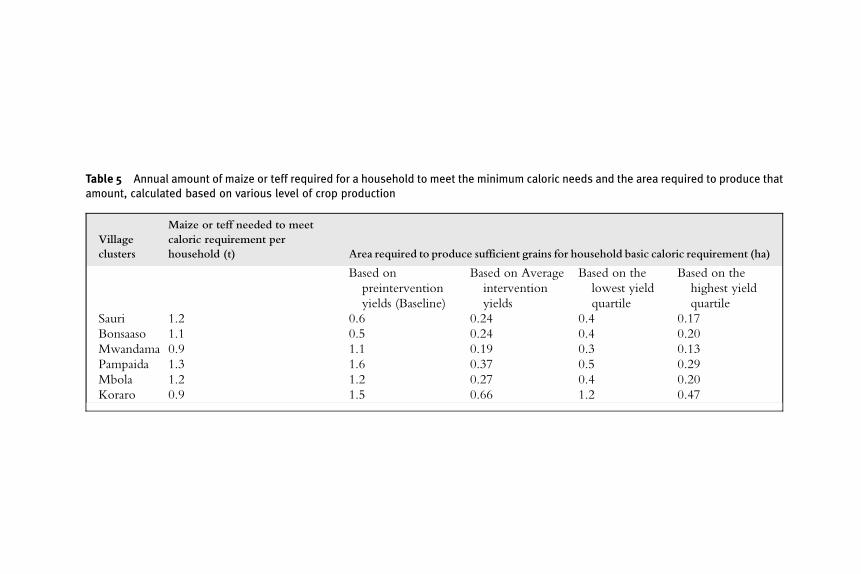
able 5 Annual amount of maize or teff required for a household to meet the minimu caloric needs and the area required to produce thatmount, calculated based on various level of crop production
Village
clusters
Maize or teff needed to meet
caloric requirement per
household (t) Area required to produce sufficie t grains for household basic caloric requirement (ha)
Based on
preintervention
yields (Baseline)
Based o Average
interv ntion
yields
Based on the
lowest yield
quartile
Based on the
highest yield
quartile
Sauri 1.2 0.6 0.24 0.4 0.17
Bonsaaso 1.1 0.5 0.24 0.4 0.20
Mwandama 0.9 1.1 0.19 0.3 0.13
Pampaida 1.3 1.6 0.37 0.5 0.29
Mbola 1.2 1.2 0.27 0.4 0.20
Koraro 0.9 1.5 0.66 1.2 0.47
Ta
m
n
n
e
98 Generose Nziguheba et al.
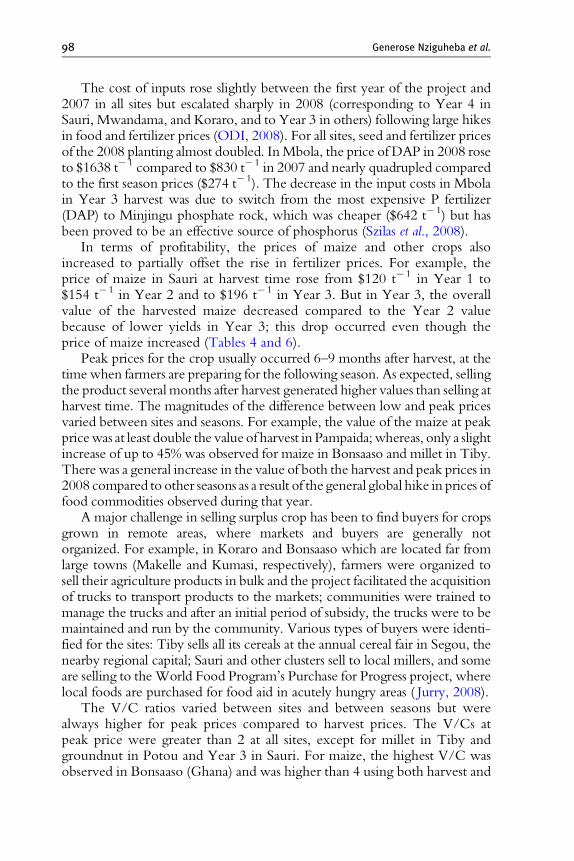
The cost of inputs rose slightly between the first year of the project and2007 in all sites but escalated sharply in 2008 (corresponding to Year 4 inSauri, Mwandama, and Koraro, and to Year 3 in others) following large hikesin food and fertilizer prices (ODI, 2008). For all sites, seed and fertilizer pricesof the 2008 planting almost doubled. InMbola, the price of DAP in 2008 roseto $1638 t�1 compared to $830 t�1 in 2007 and nearly quadrupled comparedto the first season prices ($274 t�1). The decrease in the input costs in Mbolain Year 3 harvest was due to switch from the most expensive P fertilizer(DAP) to Minjingu phosphate rock, which was cheaper ($642 t�1) but hasbeen proved to be an effective source of phosphorus (Szilas et al., 2008).
In terms of profitability, the prices of maize and other crops alsoincreased to partially offset the rise in fertilizer prices. For example, theprice of maize in Sauri at harvest time rose from $120 t�1 in Year 1 to$154 t�1 in Year 2 and to $196 t�1 in Year 3. But in Year 3, the overallvalue of the harvested maize decreased compared to the Year 2 valuebecause of lower yields in Year 3; this drop occurred even though theprice of maize increased (Tables 4 and 6).
Peak prices for the crop usually occurred 6–9 months after harvest, at thetime when farmers are preparing for the following season. As expected, sellingthe product several months after harvest generated higher values than selling atharvest time. The magnitudes of the difference between low and peak pricesvaried between sites and seasons. For example, the value of the maize at peakpricewas at least double the value of harvest in Pampaida;whereas, only a slightincrease of up to 45% was observed for maize in Bonsaaso and millet in Tiby.There was a general increase in the value of both the harvest and peak prices in2008 compared to other seasons as a result of the general global hike in prices offood commodities observed during that year.
A major challenge in selling surplus crop has been to find buyers for cropsgrown in remote areas, where markets and buyers are generally notorganized. For example, in Koraro and Bonsaaso which are located far fromlarge towns (Makelle and Kumasi, respectively), farmers were organized tosell their agriculture products in bulk and the project facilitated the acquisitionof trucks to transport products to the markets; communities were trained tomanage the trucks and after an initial period of subsidy, the trucks were to bemaintained and run by the community. Various types of buyers were identi-fied for the sites: Tiby sells all its cereals at the annual cereal fair in Segou, thenearby regional capital; Sauri and other clusters sell to local millers, and someare selling to theWorld Food Program’s Purchase for Progress project, wherelocal foods are purchased for food aid in acutely hungry areas ( Jurry, 2008).
The V/C ratios varied between sites and between seasons but werealways higher for peak prices compared to harvest prices. The V/Cs atpeak price were greater than 2 at all sites, except for millet in Tiby andgroundnut in Potou and Year 3 in Sauri. For maize, the highest V/C wasobserved in Bonsaaso (Ghana) and was higher than 4 using both harvest and
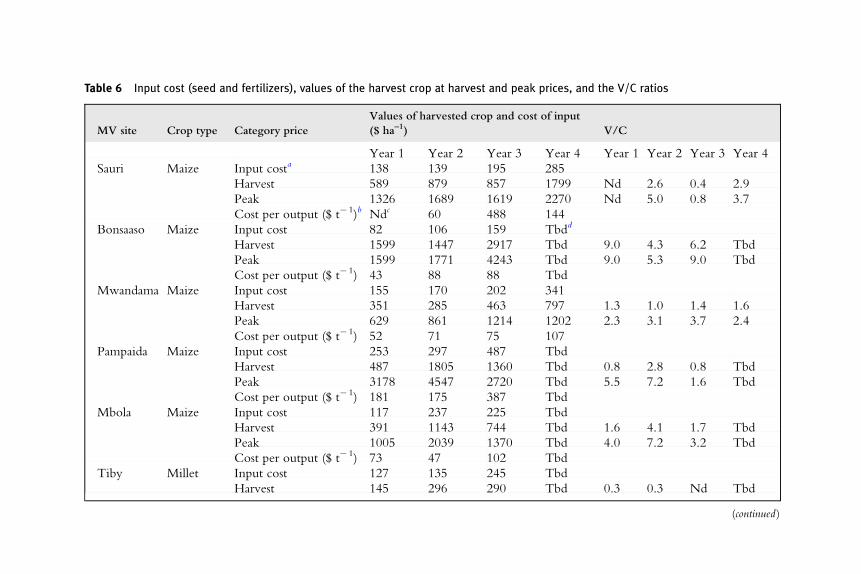
Table 6 Input cost (seed and fertilizers), values of the harvest crop at harvest and peak prices, and the V/C ratios
MV site Crop type Category price
Values of harvested crop and cost of input
($ ha–1) V/C
Year 1 Year 2 Year 3 Year 4 Year 1 Year 2 Year 3 Year 4
Sauri Maize Input costa 138 139 195 285
Harvest 589 879 857 1799 Nd 2.6 0.4 2.9
Peak 1326 1689 1619 2270 Nd 5.0 0.8 3.7
Cost per output ($ t�1)b Ndc 60 488 144
Bonsaaso Maize Input cost 82 106 159 Tbdd
Harvest 1599 1447 2917 Tbd 9.0 4.3 6.2 Tbd
Peak 1599 1771 4243 Tbd 9.0 5.3 9.0 Tbd
Cost per output ($ t�1) 43 88 88 Tbd
Mwandama Maize Input cost 155 170 202 341
Harvest 351 285 463 797 1.3 1.0 1.4 1.6
Peak 629 861 1214 1202 2.3 3.1 3.7 2.4
Cost per output ($ t�1) 52 71 75 107
Pampaida Maize Input cost 253 297 487 Tbd
Harvest 487 1805 1360 Tbd 0.8 2.8 0.8 Tbd
Peak 3178 4547 2720 Tbd 5.5 7.2 1.6 Tbd
Cost per output ($ t�1) 181 175 387 Tbd
Mbola Maize Input cost 117 237 225 Tbd
Harvest 391 1143 744 Tbd 1.6 4.1 1.7 Tbd
Peak 1005 2039 1370 Tbd 4.0 7.2 3.2 Tbd
Cost per output ($ t�1) 73 47 102 Tbd
Tiby Millet Input cost 127 135 245 Tbd
Harvest 145 296 290 Tbd 0.3 0.3 Nd Tbd
(continued)
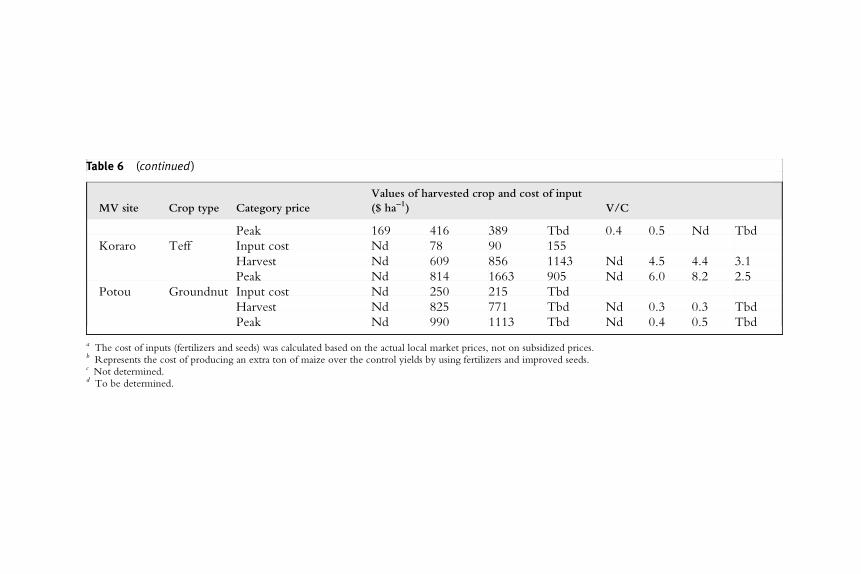
Table 6 (continued)
MV site Crop type Category price
Values of harvested crop and cost of input
($ ha–1) V/C
Peak 169 416 389 Tbd 0.4 0.5 Nd Tbd
Koraro Teff Input cost Nd 78 90 155
Harvest Nd 609 856 1143 Nd 4.5 4.4 3.1
Peak Nd 814 1663 905 Nd 6.0 8.2 2.5
Potou Groundnut Input cost Nd 250 215 Tbd
Harvest Nd 825 771 Tbd Nd 0.3 0.3 Tbd
Peak Nd 990 1113 Tbd Nd 0.4 0.5 Tbd
a The cost of inputs (fertilizers and seeds) was calculated based on the actual local market prices, not on subsidized prices.b Represents the cost of producing an extra ton of maize over the control yields by using fertilizers and improved seeds.c Not determined.d To be determined.
Crop Yields in Millennium Villages 101
peak prices, and reached as high as 9 during peak prices. The input costs forBonsaaso were lowest compared to other sites growing maize. The V/Cwas greater than 2 for two seasons in Sauri. The low V/C in Year 3 was dueto high maize yields observed in the control plots, averaging 4 t ha�1; inV/C calculation no input costs were included in the controls, which led tohigh value of maize produced at zero cost. As mentioned previously, thecontrol yields for Sauri in all seasons are considered as overestimates so theV/C ratios are also probably underestimates. The V/C in Mwandama atharvest prices were always below 2. Despite yields twice that of controlplots, the prices of maize were extremely low postharvest, resulting in lowvalue of maize compared to values in any other MV sites. Storing maize andselling it at peak prices resulted in V/Cs greater than 2 all years in Mwan-dama. A similar scenario was observed in Year 1 and Year 3 in Mbola, andin Year 1 in Pampaida.
The use of inputs on millet in Tiby and groundnut in Potou had littleeffect on grain yields (Table 4) and resulted in unfavorable V/Cs of less than1 (Table 6). As indicated earlier, input supports on millet were withdrawn inTiby in 2008. In Potou, groundnut is an important cash crop for the rainfedzone and it was the top priority by the community for input support.Despite the low grain yields and low V/Cs, groundnut is viewed by thecommunity as a very important crop because of its role as livestock feed.Groundnut stover yields are about twice that of grains, and are sold at a priceof about 80% of that of the grains but V/Cs have not been calculated withthe stover included as part of the sales.
In Potou, millet and cowpea are viewed by the community as subsis-tence crops whereas groundnut and onions are produced for selling; thus thefarmers would not invest on inputs for the subsistence crops but rather putthem on onion which is the major cash crop. Onion yields have increasedfrom an average of 20 to 30 t ha�1 due to project interventions, and the areaunder onion expanded from 800 ha in 2006 to 1595 ha in 2008. Themarketing of onions has improved due to an organized structure in creditunion and to the ban of onion import during the period from March toAugust. This has lead to increased price of onion from $145 t�1 in 2005 to$310 t�1 resulting in V/C ratios above 4 (data not shown). The incomefrom onion and groundnut are used to purchase food in case of poorperformance of millet and cowpea.
Many African countries rely on imports to satisfy national food require-ments. The cost of imported food is more than that for producing a similaramount within the country; stimulating local production and sourcing is acheaper alternative to shipping food aid from the United States (estimated to$806 t�1 in 2008) as indicated by the cost of producing a ton of maize in ourstudy (Table 6) (Sanchez et al., 2009; USAID, 2008). This alternative alsocan increase demand for local products and stimulate local agriculturaldevelopment.
102 Generose Nziguheba et al.
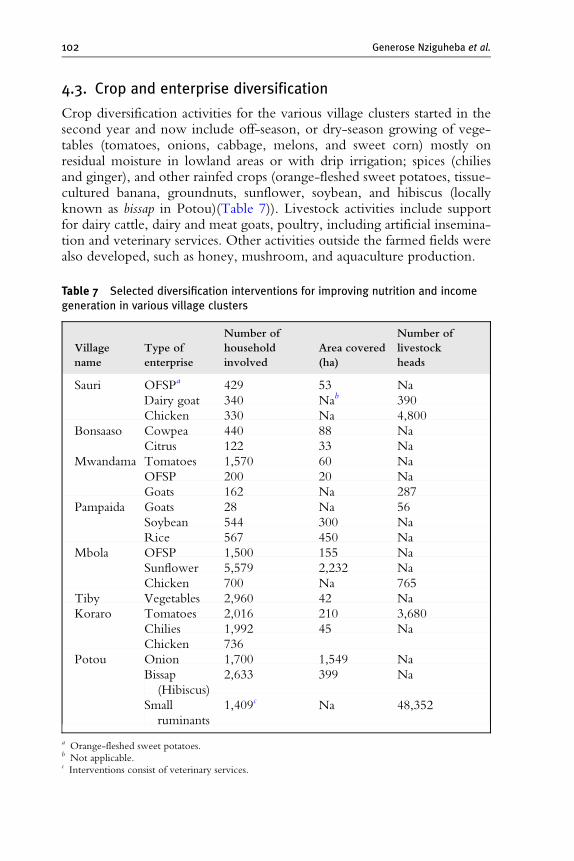
4.3. Crop and enterprise diversification
Crop diversification activities for the various village clusters started in thesecond year and now include off-season, or dry-season growing of vege-tables (tomatoes, onions, cabbage, melons, and sweet corn) mostly onresidual moisture in lowland areas or with drip irrigation; spices (chiliesand ginger), and other rainfed crops (orange-fleshed sweet potatoes, tissue-cultured banana, groundnuts, sunflower, soybean, and hibiscus (locallyknown as bissap in Potou)(Table 7)). Livestock activities include supportfor dairy cattle, dairy and meat goats, poultry, including artificial insemina-tion and veterinary services. Other activities outside the farmed fields werealso developed, such as honey, mushroom, and aquaculture production.
Table 7 Selected diversification interventions for improving nutrition and incomegeneration in various village clusters
Village
name
Type of
enterprise
Number of
household
involved
Area covered
(ha)
Number of
livestock
heads
Sauri OFSPa 429 53 Na
Dairy goat 340 Nab 390
Chicken 330 Na 4,800
Bonsaaso Cowpea 440 88 Na
Citrus 122 33 Na
Mwandama Tomatoes 1,570 60 Na
OFSP 200 20 Na
Goats 162 Na 287
Pampaida Goats 28 Na 56
Soybean 544 300 Na
Rice 567 450 Na
Mbola OFSP 1,500 155 Na
Sunflower 5,579 2,232 Na
Chicken 700 Na 765
Tiby Vegetables 2,960 42 Na
Koraro Tomatoes 2,016 210 3,680
Chilies 1,992 45 Na
Chicken 736
Potou Onion 1,700 1,549 Na
Bissap
(Hibiscus)
2,633 399 Na
Small
ruminants
1,409c Na 48,352
a Orange-fleshed sweet potatoes.b Not applicable.c Interventions consist of veterinary services.
Crop Yields in Millennium Villages 103
5. Discussion and Way Forward
The results presented constitute evidence-based information on how toget Africa out of its 1 t ha�1 yield trap andmove theAfricanGreenRevolutionforward.We discuss the implications in terms of crop production, incorporat-ing organic nutrient inputs, improved human nutrition, crop and enterprisediversification, subsidies and credit, climate risk and management, irrigation,safety nets, and the value of the integrated multisectorial approach.
5.1. Crop production
The initial successes of doublingmaize yields and exceeding the overall “greenrevolution” yield target of 3 t ha�1 in the Millennium Villages confirm theimportance of the four key simultaneous interventions; improved germplasm,subsidizedmineral fertilizers, intensive training at the community level, whichwere recommended by the UN Millennium Project Hunger Task Force(UNMillennium Project, 2005b). In addition, planning ahead for the storageof bumper harvests, in order to sell the crop surpluses at peak prices was thecrucial fourth point. The results are quick, evidentwith the first harvest, highlyvisible, and get communities involved in the project.
5.1.1. FertilizersCurrently, Africa has the lowest fertilizer use among all regions with anaverage of 8 kg ha�1 of nutrients despite a high prevalence of soils with poorsoil fertility (Heisey et al., 2007; Thomson, 2008). Fertilizer application ratesfor cereals in the Millennium Villages shown in Table 3 averaged73 kg N ha�1 and 18 kg P ha�1, respectively, resulted in profitable value-to-cost ratios, even when the market price of unsubsidized fertilizers andseeds was used and in spite of the sharp increase in prices experienced in2008. The fundamental reason for that is that the nitrogen use efficiencies inAfrica are in the order of 12–16 kg of maize per kilogram of nitrogenfertilizer applied (MDG Africa Steering Group, 2008).
Some of the sources and rates of fertilizers used need to be revised after abetter understanding of soil constraints at the different sites. For example,urea is currently used for top-dressing inKoraro, Ethiopia; but the topsoil pHis around 8.2 in some areas. In such circumstances, the urea would volatizeand most of the nitrogen applied would be lost. Considering also the visualsulfur deficiency symptoms in maize (Ray Weil, personal communication)we have recommended that the Ethiopian Ministry of Agriculture shift itsfertilizer imports from urea to ammonium sulfate for those extensive highpH areas. In Malawi, the standard recommendation is to apply NPS basalfertilizer but crop production is probably not limited by phosphorus in most
104 Generose Nziguheba et al.
of Malawi (Benson, 1999; Snapp, 1998). Others have found some soils to beless responsive to fertilizers than others (Vanlauwe et al., 2010) eitherbecause the sites are already fairly productive without fertilizer applications(as was the case here for Bonsaaso) or because some low productivity sitesdo not respond to fertilizer application, because of other overriding limitingfactors such as compacted topsoils. The production of a digital map of soilproperties currently undergoing in Africa at 90-m resolution will improvethe effectiveness of fertilizer applications (Sanchez et al., 2009).
5.1.2. Improved germplasmIncreasing fertilizer application rates alone is not sufficient for increasing yieldsand will not work unless high-yielding cultivars are used. Many improvedhigh-yielding crop cultivars are available in Africa (Gabre-Madhin andHaggblade, 2004). However, adoption rates are much lower than othercontinents (Evenson and Gollin, 2001). Local seed companies are emergingin countries like Kenya where investments in the private sector have beenencouraged (Ejeta, 2010). The Africa Seed Investment Fund initiated by theAlliance for the GreenRevolution in Africa (AGRA) and African AgricultureCapital will invest in small to medium size seed companies in East andSouthern Africa (www.agra-alliance.org). Once those seeds are available, thereis need for distribution at local levels, again AGRA has a program directedtoward strengthening the capacity of local agrodealers to deliver quality seedand fertilizer as well as technical information to farmers.
5.1.3. Extension servicesIn order to be successful, access to fertilizers and seeds must be accompaniedby proper agronomic practices. The role of extension services is thereforeimportant in training farmers on improved agronomic practices such as earlyplanting, correct sources, rates, placement, and timely application of ferti-lizers, appropriate plant spacing, weeding, integrated soil fertility manage-ment, harvest, and postharvest management. In the Millennium Villages,farmers were trained in groups of 100 or fewer by government agriculturalextension officers, project agricultural facilitators, and master farmers. Suchpenetration is important for the wide-scale adoption of specific practices andthus increases in yields. Older farmers often commented that they used toknow many of those practices, but forgot them due to the absence on suchtraining for years. In much of Africa, government extension services havereceived little support, and their presence on the ground is either weak ornonexistent due to insufficient staff or lack of operational funds. The MVPempowered local extension agents with transport and new information, andmany of them said they were proud to have the resources to practice theirprofession. The success in Malawi in the 1980s is attributed to the availabil-ity of subsidized inputs to farmers coupled with well-supported extensionservice active at community level (Sofranko and Fliegel, 1989); the same is
Crop Yields in Millennium Villages 105
true nowadays as Malawi became the first African Green Revolutioncountry (Denning et al., 2009).
5.1.4. Planning ahead and selling at peak pricesThe Sasakawa Global 2000 experience in Ethiopia during the mid 1990s,where successes in using fertilizers, improved seed and extension producedsimilar yield increases to ours (Quinones et al., 1997), but collapsed when nomarkets were found to sell the surpluses at an adequate price. Learning fromthis lesson, the Millennium Villages planned ahead for storage and sale of theexpected crop surpluses when crop prices reached their peak value. Marketprices are very low at harvest, when small-scale merchants offer to buy grainat minimum prices when farmers need money the most. The grain banks thatwere established, some using warehouse receipts, provided cash advances tothe farmers and sold the surplus at peak prices usually 4–7 months afterharvest. The data in Table 6 represent an average of 66% increase in priceswhen the surplus was sold at peak prices. Not only did farmers double ortriple their grain yields but also sold their surplus at much higher prices.
This picture, however, was not uniformly rosy. Yield increases in thedrier sites of West Africa were small; millet in Tiby and Potou, and to alesser extent groundnuts in Potou, a crop not adapted to the limited rainfall,all show unprofitable value-to-cost ratios. There have been no significantbreakthroughs on millet yields in West Africa for decades and our experi-ence sadly confirms this.
5.2. Organic inputs and soil management practices
Readers must be wondering why we started with a mineral fertilizerstrategy, while many of us have advocated the combined use of mineraland organic sources of nutrients (Nziguheba et al., 2002b; Palm et al., 1997;Sanchez, 2002; Sanchez et al., 1997; UN Millennium Project, 2005b). Theprimary main reason was the need to quickly reverse decades of soil nutrientdepletion and have a quick impact. Second, the quality and amounts oforganic inputs in many of the Millennium villages situations are insufficientas the sole sources of nutrients. Suggestions to begin with improved legumetree fallows were met with advice of the Sauri Agricultural Committee inearly 2005 that improved fallows would take a year to develop, thusdelaying a significant increase in yields for at least a year.
Getting organics into these degraded farmlands is a challenge. Of thevarious types of organic resources produced under subsistence farming,crops residues, manure, and compost, none are produced in sufficient quan-tity and adequate quality to provide nutrients required for crop production(Palm et al., 1997; Palm et al., 2001). In addition, crop residues have oftenmultiple uses (livestock feed, fuel for cooking, and fencing materials) thatlimit their use as soil amendments. With the doubling of crop yields,
106 Generose Nziguheba et al.
however, crop residue production also doubles, enabling farmers to use cropresidues for soil management either directly or through compost and manure.The amounts and quality of animal manure is usually limiting, so it is likely tobe a supplement, and a good one, particularly when point-placed.
No sustainable farming relies solely on mineral fertilizers. Now that yieldshave increased and remain high, the current thrust is to bring the organics inwith a priority to use nitrogen fixing trees or herbaceous legumes in situ,interplanting them into the maize crop and allowing it to grow during the dryseason. This is to avoid the large transport cost of organic sources producedoutside the field, which limits their use a supplement. Improved leguminousfallows are a well-documented practice, and can fix 50–100 kg N ha�1 peryear, recycle nutrients leached to the subsoil particularly potassium, as well ascarbon, control weeds, and in the case of trees provide firewood. But afterinitial adoption most farmers abandon the practice (Franzel et al., 2002), whilea small proportion—the best farmers—thrive on it. We feel the main reasonfor abandonment is the opportunity cost incurred when land is not used forgrowing a short rains crop in bimodal systems, or even sacrificing a full rainyseason crop in unimodal systems to allow the trees to grow. Financialincentives just like fertilizer subsidies are needed; we intend to develop suchincentives for the village clusters that are not in the semiarid or arid tropics.Grain legumes are also being promoted and financed, as sound crop rotation.But beans, soybeans, and groundnuts take most of their fixed nitrogen awayin the grain, leaving little for the subsequent maize crop. Grain legumes inMalawi are estimated to add about 30 kg N ha�1 to the subsequent crop(MDG Africa Steering Group, 2008), a very desirable amount, but notsufficient to replace mineral nitrogen applications.
Organic inputs are important for building soil organic matter andimproving physical and biochemical properties of soil leading to improvedfertilizer use efficiency, soil quality, and to sustainable crop production butthey can be also a valuable source of nutrients, particularly N, thus reducingthe quantity of fertilizers requirement (Alley and Vanlauwe, 2009; Placeet al., 2003). N fixing trees for improved fallows or cover crops are particu-larly important sources of N to complement fertilizers and they also producelarge quantity of biomass for soil organic matter building. Yields obtainedthrough improve fallows or cover crops are 60–80% higher than yieldswithout fertilizers but are significantly lower than those obtained withmineral fertilizers (Sileshi et al., 2008). As fertilizer subsidies are reducedor removed and fertilizer prices remain high, farmers have been trained inand supported in different practices to increase the use of these high qualityorganic inputs. Despite the promising yields and money saved in thereduced amount of N fertilizers that are required, adoption by farmers inthe Millenniun Villages have been fairly low both in the number of farmersand the size of land they put under these soil management practices. Smallland sizes, labor requirements, and the time and land need to produce
Crop Yields in Millennium Villages 107
improved tree fallows have been cited as factors hindering adoption (Keilet al., 2005; Kiptot et al., 2007). Evaluations of the process of adoption andfactors that may influence increased adoption are underway in the MV siteswhere these practices are being promoted.
We have also not included yet minimum tillage practices, due toinsufficient research evidence (Giller et al., 2009). We know this is notpossible in structurally insert sandy Alfisols of West Africa like those of Tiby,but there is potential in other village clusters with loamy to clayey Alfisolsand Oxisols.
5.3. Improved nutrition
An indicator for measuring progress toward the MDG of halving thepercentage of people suffering from hunger is the percentage of the popu-lation below the minimum dietary energy intake (Palma et al., 2009). Whenmaize yields surpassed the 3 t ha�1 mark (or equivalent in other crops) in78% of the village households, the minimum annual energy requirementswere achieved and usually exceeded.
But meeting household minimum caloric requirements is insufficient initself to reduce malnutrition (Barrett, 2010). It is the first step in theintegrated approach to alleviate hunger and malnutrition in the MillenniumVillages. Our nutrition strategy includes an emphasis on food-based modelsthat enhance the security and quality of the diet through local production,processing and storage of foods, the promotion of agricultural biodiversity,complemented by community education and development. Such strategyoften falls outside the traditional scope of clinical nutrition intervention likenutritional supplementation (Fanzo et al., 2010). Diets in many rural areas ofAfrica are limited not only by the amounts consumed but are often based ona staple cereal or root crop with high energy content but low nutritionalquality. A major emphasis in the Millennium Villages sites is to supportagricultural diversity to include nutritious crops; such as the many Africanleafy green vegetables, which have been disappearing from farms and diets(National Research Council, 2006), and other nutritious crops such asorange-fleshed sweet potato, fruits, and livestock both at home and in theschool feeding school programs (Table 7). Improving nutrition also is acultural matter and involves changes in food habits particularly if the cropspromoted are new to the communities. Educational materials and trainingsessions with farmers, particularly women, on the importance of nutrition,the nutritious value of various foods, and means of preparing foods are keycomponents of the agricultural diversification and nutrition strategy. Pre-liminary results from Sauri after just 3 years of the integrated nutritionstrategy already show a reduction in chronic malnutrition, measured asunderweight (low weight for age) children under 2 years of age from 19%to 6% and stunting (low height for age) from 73% to 35% after 3 years of
108 Generose Nziguheba et al.
interventions (Fanzo et al., 2010). One supplement that is absolutely neces-sary is iodized salt to combat iodine deficiency, which is unfortunatelyprevalent in areas away from the oceans.
5.4. Diversification, primarily with irrigation
Nobody is likely to escape the one-dollar-per-day absolute poverty trap bygrowing maize on half or one hectare no matter how high the yield.The way forward is crop and enterprise diversification. Diversification tohigh-value crops depends first on the markets, determined through a marketsurvey and analysis. Efforts to expand the scale and efficiency of theseactivities involve capacity development in aspects of market access such asprice variations, produce quality, group selling, and record keeping; andlinking farmers to microfinance institutions for saving and microcreditaccess such as Equity Bank in Sauri, Opportunity International mobilebanks in Mwandama, and the Mutuelle d’Epargne et de Credit in Potou.Each of these institutions provides basic services like credit and savingaccounts to villagers.
Most of the high-value crops being promoted in the villages requiresome form of irrigation. In most sites, farmers were using water from wellsor streams and irrigating with buckets. The project has promoted expansionof water sources through rainwater harvesting in small farm ponds, small-scale dams and water diversion in small channels. Pumps and drip irrigationsystems have been introduced. The location of Potou in the coastal zone,and of Tiby on the Niger River has enabled the production of high-valueirrigated vegetable crops that play a major role in providing a safety net inthe event of food shortages due to crop reductions and failures.
In addition to water for irrigation of cash crops, there is a need to findways to provide water to get staple crops through critical dry spells andavoid crop failures. Water harvesting at the landscape level, which rechargesground water and shallow wells, is also used to fill mini dams and storageponds in Koraro. This practice should be extended to other village clustersthat are likely to experience severe dry spells.
5.5. Subsidies and the transition to credit
Subsidies programs have been used in Africa with mixed results. A primaryconcern has been the disproportionate benefits received by the larger andrelatively better-off farmers, even when the target was for poor farmers(Akinola, 1987; Minde et al., 2008). Implementation procedures and theability to manage subsidies are critical for the success and impact of subsidyprograms (Minde et al., 2008). Recently, the concept of smart subsidies hasemerged to try and overcome some of the problems. Minde and Ndlovu,(2007) describe “smart” subsidies as those that target farmers who would not
Crop Yields in Millennium Villages 109
normally use purchased inputs, or target areas where fertilizer would havelarger impacts on yields; in addition those programs should be resultsoriented and have a time frame of implementation.
The Millennium Villages subsidy program followed most of the condi-tions set forth above as follows: (i) targeted poor communities who wereusing little or no fertilizers and improved seed; (ii) took place in areas withdepleted soils where response to inputs is generally high; (iii) includedmostly small farm areas, generally up to 1 acre (0.4 ha), which would notattract large-scale farmers; (iv) involved village agriculture committees inthe distribution of inputs to limit the leakage to those not targeted; (v)increased production of major crops, with the first goal of reducing hunger;and (vi) progressively reduced the subsidy during the 5 years of the project.The subsidy program was not without leakage and selling to farmers outsidethe intervention area, some elite capture or preference to male farmers, butoverall increase in yields throughout the clusters indicated that most farmerswere receiving the inputs and using them on their staple crops.
Eventually, the aim is to have national subsidy programs operating inAfrica to provide small holder farmers with access to inputs; most notably isthe national input support program of Malawi (Denning et al., 2009) butcurrently only a few countries included in this review have input subsidyprograms. As a consequence, alternative solutions were developed to pro-vide continued access to inputs; these alternatives ranges from loans throughfinancial institutions to revolving funds set up through community-runcereal banks.
Farmers paid back loans or subsidies in cash, in-kind with grain, or acombination, again varying from site to site. The major challenges for thetransition from input subsidies were: (i) the lack of financial institutionswilling to administer credit to poor farmers; (ii) the lack of sufficientcapacity or financial capital of local microfinance institutions to provide ormanage loans and collect repayment; and (iii) the existence of vulnerablegroups that cannot or will not take out loans.
5.6. Safety nets
For the vulnerable groups mentioned above, comprising perhaps 10–20% ofthe households, there is need to identify them, the characteristics that makethem vulnerable, and provide means of supporting them. For those that arestill capable of farming, direct subsidies could be targeted for agriculturalpractices appropriate for these groups. For example, in Sauri, widowsfarming extremely small plots of land have requested support for startingpoultry production. Cash transfers or permanent subsidies are likely to beneeded for the poorest and most vulnerable in the communities. Food forWork is an example of such support programs. The Koraro village cluster inEthiopia participates in the MERET program of the World Food Program
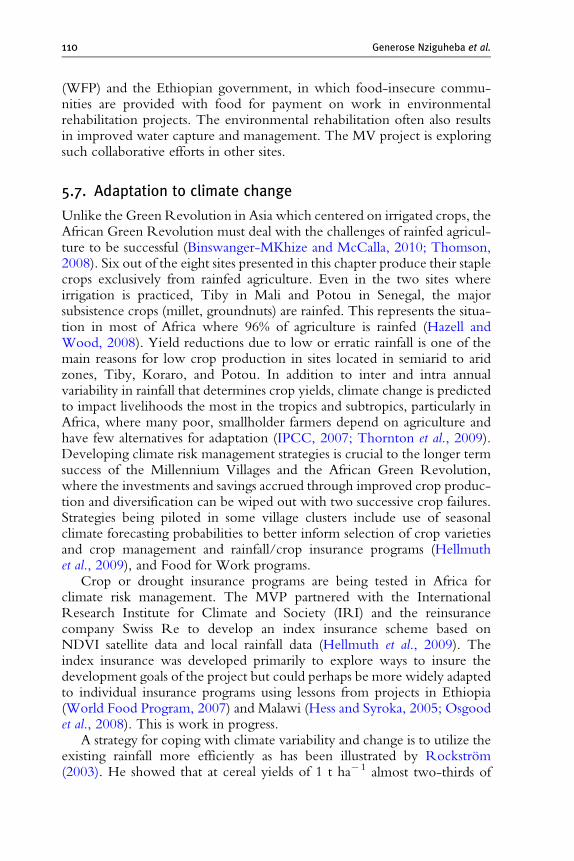
110 Generose Nziguheba et al.
(WFP) and the Ethiopian government, in which food-insecure commu-nities are provided with food for payment on work in environmentalrehabilitation projects. The environmental rehabilitation often also resultsin improved water capture and management. The MV project is exploringsuch collaborative efforts in other sites.
5.7. Adaptation to climate change
Unlike the Green Revolution in Asia which centered on irrigated crops, theAfrican Green Revolution must deal with the challenges of rainfed agricul-ture to be successful (Binswanger-MKhize and McCalla, 2010; Thomson,2008). Six out of the eight sites presented in this chapter produce their staplecrops exclusively from rainfed agriculture. Even in the two sites whereirrigation is practiced, Tiby in Mali and Potou in Senegal, the majorsubsistence crops (millet, groundnuts) are rainfed. This represents the situa-tion in most of Africa where 96% of agriculture is rainfed (Hazell andWood, 2008). Yield reductions due to low or erratic rainfall is one of themain reasons for low crop production in sites located in semiarid to aridzones, Tiby, Koraro, and Potou. In addition to inter and intra annualvariability in rainfall that determines crop yields, climate change is predictedto impact livelihoods the most in the tropics and subtropics, particularly inAfrica, where many poor, smallholder farmers depend on agriculture andhave few alternatives for adaptation (IPCC, 2007; Thornton et al., 2009).Developing climate risk management strategies is crucial to the longer termsuccess of the Millennium Villages and the African Green Revolution,where the investments and savings accrued through improved crop produc-tion and diversification can be wiped out with two successive crop failures.Strategies being piloted in some village clusters include use of seasonalclimate forecasting probabilities to better inform selection of crop varietiesand crop management and rainfall/crop insurance programs (Hellmuthet al., 2009), and Food for Work programs.
Crop or drought insurance programs are being tested in Africa forclimate risk management. The MVP partnered with the InternationalResearch Institute for Climate and Society (IRI) and the reinsurancecompany Swiss Re to develop an index insurance scheme based onNDVI satellite data and local rainfall data (Hellmuth et al., 2009). Theindex insurance was developed primarily to explore ways to insure thedevelopment goals of the project but could perhaps be more widely adaptedto individual insurance programs using lessons from projects in Ethiopia(World Food Program, 2007) and Malawi (Hess and Syroka, 2005; Osgoodet al., 2008). This is work in progress.
A strategy for coping with climate variability and change is to utilize theexisting rainfall more efficiently as has been illustrated by Rockstrom(2003). He showed that at cereal yields of 1 t ha�1 almost two-thirds of
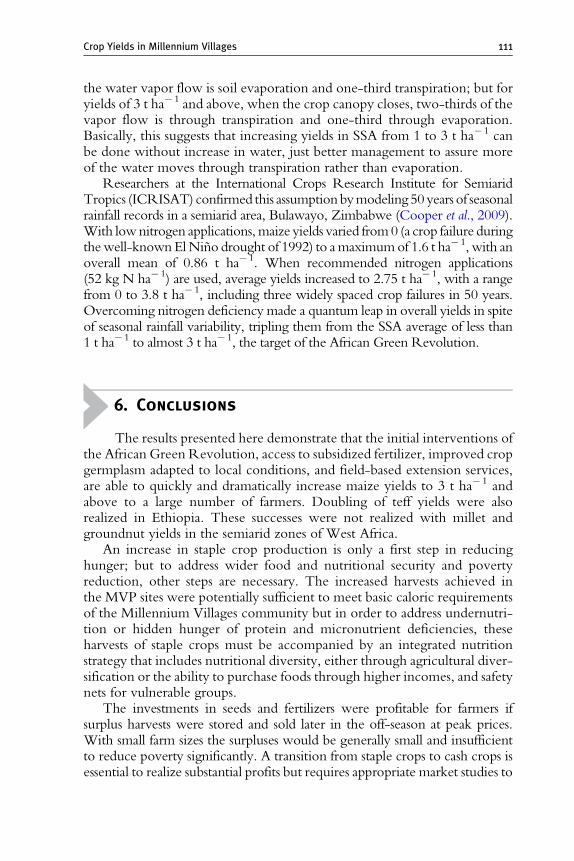
Crop Yields in Millennium Villages 111
the water vapor flow is soil evaporation and one-third transpiration; but foryields of 3 t ha�1 and above, when the crop canopy closes, two-thirds of thevapor flow is through transpiration and one-third through evaporation.Basically, this suggests that increasing yields in SSA from 1 to 3 t ha�1 canbe done without increase in water, just better management to assure moreof the water moves through transpiration rather than evaporation.
Researchers at the International Crops Research Institute for SemiaridTropics (ICRISAT) confirmed this assumptionbymodeling 50 years of seasonalrainfall records in a semiarid area, Bulawayo, Zimbabwe (Cooper et al., 2009).With lownitrogen applications,maize yields varied from0 (a crop failure duringthewell-knownElNino drought of 1992) to amaximumof 1.6 t ha�1, with anoverall mean of 0.86 t ha�1. When recommended nitrogen applications(52 kg N ha�1) are used, average yields increased to 2.75 t ha�1, with a rangefrom 0 to 3.8 t ha�1, including three widely spaced crop failures in 50 years.Overcoming nitrogen deficiency made a quantum leap in overall yields in spiteof seasonal rainfall variability, tripling them from the SSA average of less than1 t ha�1 to almost 3 t ha�1, the target of the African Green Revolution.
6. Conclusions
The results presented here demonstrate that the initial interventions ofthe African Green Revolution, access to subsidized fertilizer, improved cropgermplasm adapted to local conditions, and field-based extension services,are able to quickly and dramatically increase maize yields to 3 t ha�1 andabove to a large number of farmers. Doubling of teff yields were alsorealized in Ethiopia. These successes were not realized with millet andgroundnut yields in the semiarid zones of West Africa.
An increase in staple crop production is only a first step in reducinghunger; but to address wider food and nutritional security and povertyreduction, other steps are necessary. The increased harvests achieved inthe MVP sites were potentially sufficient to meet basic caloric requirementsof the Millennium Villages community but in order to address undernutri-tion or hidden hunger of protein and micronutrient deficiencies, theseharvests of staple crops must be accompanied by an integrated nutritionstrategy that includes nutritional diversity, either through agricultural diver-sification or the ability to purchase foods through higher incomes, and safetynets for vulnerable groups.
The investments in seeds and fertilizers were profitable for farmers ifsurplus harvests were stored and sold later in the off-season at peak prices.With small farm sizes the surpluses would be generally small and insufficientto reduce poverty significantly. A transition from staple crops to cash crops isessential to realize substantial profits but requires appropriate market studies to
112 Generose Nziguheba et al.
identify the better options for farmers. Farmers must also be trained in thenew crop technologies with an additional focus on product quality and theymust often be organized into producers groups that can negotiate higherprices and linkages to buyers. Investments in small-scale water managementand irrigation become important for production of high-value crops butfinancial institutions that provide loans and savings for agricultural invest-ments are an essential element that is currently lacking throughout most ofrural SSA as is a reliable network of certified agro input dealers.
In the end, improving agriculture in itself is unlikely to get rural commu-nities in SSA out of poverty. The ability to produce sufficient food isdiminished if people are suffering from malaria, HIV/AIDS, or neglectedtropical diseases. The ability to enter market-based economies is hampered bylack of education. The synergies between reducing hunger and controllingdiseases, between school meals provided from surplus harvests and increasedlearning, are all too evident. The challenge remains to overcome our sectorbarriers and to think and act in a multisectorial way if the overall goals of theAfrican Green Revolution and the MDGs are to be attained.
ACKNOWLEDGMENTS
The authors gratefully acknowledge the financial and in-kind support provided for the actualwork by the Millennium Villages Project, Open Society Institute, Governments of countriesin which the MVs are located, Government of Ireland, Lenfest Foundation, Sara McCune,Yara Foundation, the Bill and Melinda Gates Foundation, the Government of Japan throughthe United Nations Develoment Programme’s Human Security Trust Fund, MillenniumPromise Alliance, United Nations Development Program, and the Earth Institute at Colum-bia University. Partnerships, enthusiasm, and contributions of farmers, agriculture commit-tees, and extension agents are what makes this happen in the end.
REFERENCES
Akinola, A. A. (1987). An alternative procedure for granting farm input subsidies in Africa.Food Policy 12, 77–81.
Alley, M., and Vanlauwe, B. (2009). The Role of Fertilizers in Integrated Plant NutrientManagement. IFA 59.
Barrett, C. B. (2010). Measuring food insecurity. Science 327, 825–828.Benson, T. (1999). Validating and Strengthening the Area-specific Fertilizer Recommenda-
tions for Hybrid Maize Grown by Malawian Smallholders. Action Group I MaizeProductivity Task Force.
Binswanger-MKhize, H., and McCalla, A. F. (2010). The changing context and prospectsfor agricultural and rural development in Africa. Handbook of Agricultural EconomicsVol. 4, pp. 3571–3712, Elsevier.
Cooper, P., Rao, K. P. C., Singh, P., Dines, J., Traore, P. S., Dixit, P., and Twomlow, S. M.(2009). Farming with current and future climate-risk: advancing a “hypothesis of hope”for rainfed agriculture in the semi-arid tropics. J. SAT Agric. Res. 7, 1–19.
Crop Yields in Millennium Villages 113
Denning, G., Kabambe, P., Sanchez, P., Malik, A., Flor, R., Harawa, R., Nkhoma, P.,Zamba, C., Banda, C., Magombo, C., Keating, M., Wangila, J., and Sachs, J. (2009).Input subsidies to improve smallholder maize productivity in Malawi: Toward an Africangreen revolution. PLoS Biol. 7, 2–10.
Dixon, J., Gulliver, A., Gibbon, D., and Hall, M. (2001). Farming Systems and Poverty:Improving Farmers’ Livelihoods in a ChangingWorld. FAO andWorld Bank Rome andWashington, D.C.
Drechsel, P., Gyiele, L., Kunze, D., and Cofie, O. (2001). Population density, soil nutrientdepletion, and economic growth in sub-Saharan Africa. Ecol. Econ. 38, 251–258.
Ejeta, G. (2010). African Green Revolution need n’t be a mirage. Sci. Total Environ. 327,831–832.
Evenson, R., and Gollin, D. (2001). The Green Revolution at the End of the TwentiethCentury. Consultative Group on International Agricultural Research (CGIAR).
Fanzo, F., Remans, R., Pronyk, P., Negin, J., Wariero, J., Mutuo, P., Masira, J., Diru, W.,Lelerai, E., Kim, D., Nemser, B., Muniz, M. et al. (2010). A 3 Year Cohort Study toAssess the Impact of an Integrated Food- and Livelihood-based Model on Undernutri-tion in Rural Western Kenya. FAO (in press).
Franzel, S., Phiri, D., and Kwesiga, F. (2002). Assessing the adoption potential of improvedfallows in Eastern Zambia. In “Trees on the Farm: Assessing the Adoption Potential ofAgroforestry Practices in Africa” (S. Franzel and S. J. Scherr, Eds.), pp. 37–64. CABI.
Gabre-Madhin, E. Z., and Haggblade, S. (2004). Successes in African agriculture: Results ofan expert survey. World Dev. 32, 745–766.
Giller, K. E., Witter, E., Corbeels, M., and Tittonell, P. (2009). Conservation agricultureand smallholder farming in Africa: The heretics’ view. Field Crops Res. 114, 23–34.
Hamilton, L. C. (2009). Statistics with Stata. Updated fro version 10. pp. 491. Brooks/Cole,Cengage Learning.
Hazell, P., and Wood, S. (2008). Drivers of change in global agriculture. Philos. Trans. R.Soc. Lond., B, Biol. Sci. 363, 495–515.
Hess, U., and Syroka, J. (2005). Weather-based insurance in Southern Africa: The case ofMalawi. Washington, DC, Agriculture and Rural Development Discussion Paper 13.World Bank, Washington, DC.
Heisey, P. W., Norton, G. W., Evenson, R., and Pingali, P. (2007). Fertilizers and other farmchemicals. In “Handbook of Agricultural Economics”, Vol. 3, pp. 2741–2777. Elsevier.
Hellmuth, M. E., Osgood, D. E., Hess, U., Moorhead, A., and Bhojwani, H., eds. (2009).“Index insurance and climate risk: prospects for development and disaster management.”Climate Society 2, IRI, Columbia University, New York, USA.
IFDC (2006). Africa Fertilizer Summit Proceedings, Abuja, Nigeria June 9–13 2006. IFDC,Florence, Alabama.
IPCC (2007). Climate Change 2007: Impacts, Adaptation and Vulnerability. Summary forpolicy makers. Online at http://www.ipcc.cg/SPM13apr07.pdf.
Jaeger, W. K. (1992). The causes of Africa’s food crisis. World Dev. 20, 1631–1645.Jama, B., and Kiwia, A. (2009). Agronomic and financial benefits of phosphorus and
nitrogen sources in western Kenya. Exp. Agric. 45, 241–260.Jayne, T. S., Govereh, J., Wanzala, M., and Demeke, M. (2003). Fertilizer market develop-
ment: A comparative analysis of Ethiopia, Kenya, and Zambia. Food Policy 28, 293–316.Jurry, A. (2008). New Roles for Food Assistance: How Can Food Aid Support Agricultural
Growth and Productive Safety Nets in Africa? Presentation at World Food prize Sym-posium 22 October 2008, World Food Programme.
Keil, et al. (2005). Improved tree fallows in smallholder maize production in Zambia: Doinitial testers adopt the technology? Agroforest. Syst. 64, 225–236.
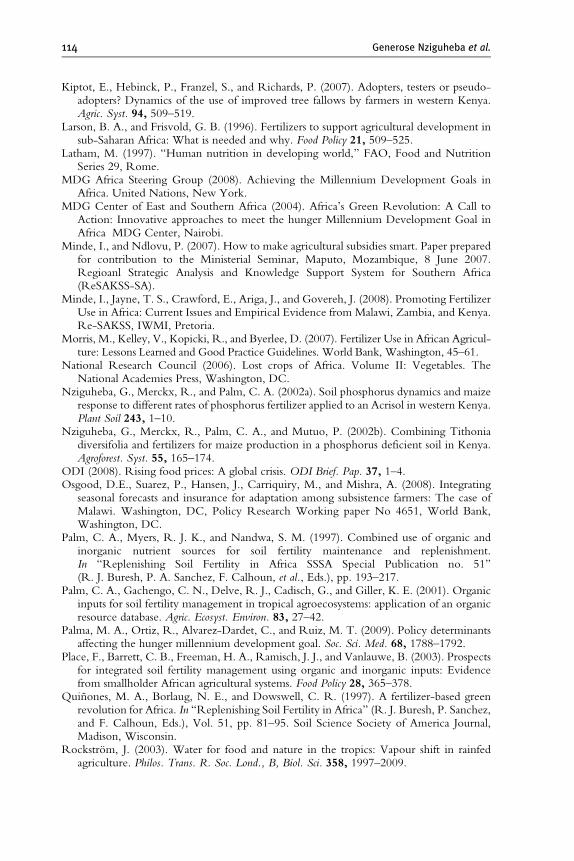
114 Generose Nziguheba et al.
Kiptot, E., Hebinck, P., Franzel, S., and Richards, P. (2007). Adopters, testers or pseudo-adopters? Dynamics of the use of improved tree fallows by farmers in western Kenya.Agric. Syst. 94, 509–519.
Larson, B. A., and Frisvold, G. B. (1996). Fertilizers to support agricultural development insub-Saharan Africa: What is needed and why. Food Policy 21, 509–525.
Latham, M. (1997). “Human nutrition in developing world,” FAO, Food and NutritionSeries 29, Rome.
MDG Africa Steering Group (2008). Achieving the Millennium Development Goals inAfrica. United Nations, New York.
MDG Center of East and Southern Africa (2004). Africa’s Green Revolution: A Call toAction: Innovative approaches to meet the hunger Millennium Development Goal inAfrica MDG Center, Nairobi.
Minde, I., and Ndlovu, P. (2007). How to make agricultural subsidies smart. Paper preparedfor contribution to the Ministerial Seminar, Maputo, Mozambique, 8 June 2007.Regioanl Strategic Analysis and Knowledge Support System for Southern Africa(ReSAKSS-SA).
Minde, I., Jayne, T. S., Crawford, E., Ariga, J., and Govereh, J. (2008). Promoting FertilizerUse in Africa: Current Issues and Empirical Evidence from Malawi, Zambia, and Kenya.Re-SAKSS, IWMI, Pretoria.
Morris, M., Kelley, V., Kopicki, R., and Byerlee, D. (2007). Fertilizer Use in African Agricul-ture: Lessons Learned and Good Practice Guidelines. World Bank, Washington, 45–61.
National Research Council (2006). Lost crops of Africa. Volume II: Vegetables. TheNational Academies Press, Washington, DC.
Nziguheba, G., Merckx, R., and Palm, C. A. (2002a). Soil phosphorus dynamics and maizeresponse to different rates of phosphorus fertilizer applied to an Acrisol in western Kenya.Plant Soil 243, 1–10.
Nziguheba, G., Merckx, R., Palm, C. A., and Mutuo, P. (2002b). Combining Tithoniadiversifolia and fertilizers for maize production in a phosphorus deficient soil in Kenya.Agroforest. Syst. 55, 165–174.
ODI (2008). Rising food prices: A global crisis. ODI Brief. Pap. 37, 1–4.Osgood, D.E., Suarez, P., Hansen, J., Carriquiry, M., and Mishra, A. (2008). Integrating
seasonal forecasts and insurance for adaptation among subsistence farmers: The case ofMalawi. Washington, DC, Policy Research Working paper No 4651, World Bank,Washington, DC.
Palm, C. A., Myers, R. J. K., and Nandwa, S. M. (1997). Combined use of organic andinorganic nutrient sources for soil fertility maintenance and replenishment.In “Replenishing Soil Fertility in Africa SSSA Special Publication no. 51”(R. J. Buresh, P. A. Sanchez, F. Calhoun, et al., Eds.), pp. 193–217.
Palm, C. A., Gachengo, C. N., Delve, R. J., Cadisch, G., and Giller, K. E. (2001). Organicinputs for soil fertility management in tropical agroecosystems: application of an organicresource database. Agric. Ecosyst. Environ. 83, 27–42.
Palma, M. A., Ortiz, R., Alvarez-Dardet, C., and Ruiz, M. T. (2009). Policy determinantsaffecting the hunger millennium development goal. Soc. Sci. Med. 68, 1788–1792.
Place, F., Barrett, C. B., Freeman, H. A., Ramisch, J. J., and Vanlauwe, B. (2003). Prospectsfor integrated soil fertility management using organic and inorganic inputs: Evidencefrom smallholder African agricultural systems. Food Policy 28, 365–378.
Quinones, M. A., Borlaug, N. E., and Dowswell, C. R. (1997). A fertilizer-based greenrevolution for Africa. In “Replenishing Soil Fertility in Africa” (R. J. Buresh, P. Sanchez,and F. Calhoun, Eds.), Vol. 51, pp. 81–95. Soil Science Society of America Journal,Madison, Wisconsin.
Rockstrom, J. (2003). Water for food and nature in the tropics: Vapour shift in rainfedagriculture. Philos. Trans. R. Soc. Lond., B, Biol. Sci. 358, 1997–2009.
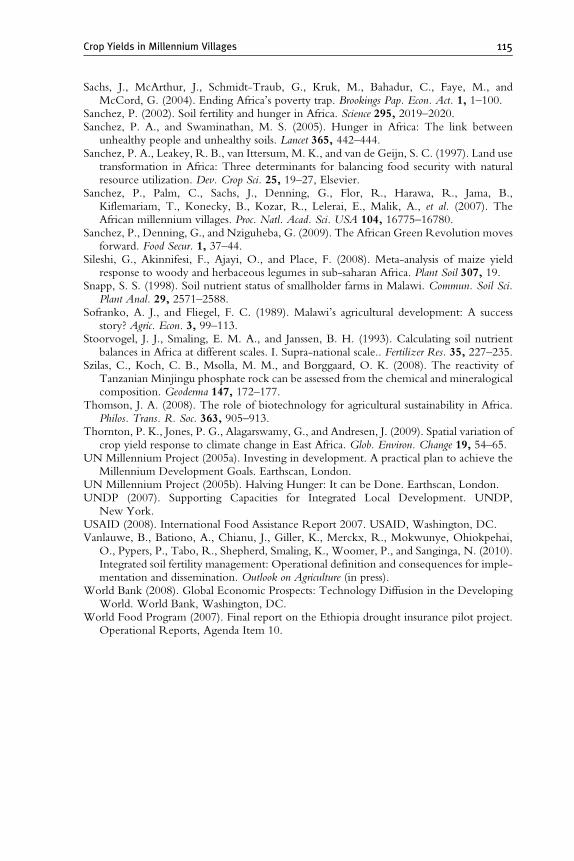
Crop Yields in Millennium Villages 115
Sachs, J., McArthur, J., Schmidt-Traub, G., Kruk, M., Bahadur, C., Faye, M., andMcCord, G. (2004). Ending Africa’s poverty trap. Brookings Pap. Econ. Act. 1, 1–100.
Sanchez, P. (2002). Soil fertility and hunger in Africa. Science 295, 2019–2020.Sanchez, P. A., and Swaminathan, M. S. (2005). Hunger in Africa: The link between
unhealthy people and unhealthy soils. Lancet 365, 442–444.Sanchez, P. A., Leakey, R. B., van Ittersum, M. K., and van de Geijn, S. C. (1997). Land use
transformation in Africa: Three determinants for balancing food security with naturalresource utilization. Dev. Crop Sci. 25, 19–27, Elsevier.
Sanchez, P., Palm, C., Sachs, J., Denning, G., Flor, R., Harawa, R., Jama, B.,Kiflemariam, T., Konecky, B., Kozar, R., Lelerai, E., Malik, A., et al. (2007). TheAfrican millennium villages. Proc. Natl. Acad. Sci. USA 104, 16775–16780.
Sanchez, P., Denning, G., and Nziguheba, G. (2009). The African Green Revolution movesforward. Food Secur. 1, 37–44.
Sileshi, G., Akinnifesi, F., Ajayi, O., and Place, F. (2008). Meta-analysis of maize yieldresponse to woody and herbaceous legumes in sub-saharan Africa. Plant Soil 307, 19.
Snapp, S. S. (1998). Soil nutrient status of smallholder farms in Malawi. Commun. Soil Sci.Plant Anal. 29, 2571–2588.
Sofranko, A. J., and Fliegel, F. C. (1989). Malawi’s agricultural development: A successstory? Agric. Econ. 3, 99–113.
Stoorvogel, J. J., Smaling, E. M. A., and Janssen, B. H. (1993). Calculating soil nutrientbalances in Africa at different scales. I. Supra-national scale.. Fertilizer Res. 35, 227–235.
Szilas, C., Koch, C. B., Msolla, M. M., and Borggaard, O. K. (2008). The reactivity ofTanzanian Minjingu phosphate rock can be assessed from the chemical and mineralogicalcomposition. Geoderma 147, 172–177.
Thomson, J. A. (2008). The role of biotechnology for agricultural sustainability in Africa.Philos. Trans. R. Soc. 363, 905–913.
Thornton, P. K., Jones, P. G., Alagarswamy, G., and Andresen, J. (2009). Spatial variation ofcrop yield response to climate change in East Africa. Glob. Environ. Change 19, 54–65.
UN Millennium Project (2005a). Investing in development. A practical plan to achieve theMillennium Development Goals. Earthscan, London.
UN Millennium Project (2005b). Halving Hunger: It can be Done. Earthscan, London.UNDP (2007). Supporting Capacities for Integrated Local Development. UNDP,
New York.USAID (2008). International Food Assistance Report 2007. USAID, Washington, DC.Vanlauwe, B., Bationo, A., Chianu, J., Giller, K., Merckx, R., Mokwunye, Ohiokpehai,
O., Pypers, P., Tabo, R., Shepherd, Smaling, K., Woomer, P., and Sanginga, N. (2010).Integrated soil fertility management: Operational definition and consequences for imple-mentation and dissemination. Outlook on Agriculture (in press).
World Bank (2008). Global Economic Prospects: Technology Diffusion in the DevelopingWorld. World Bank, Washington, DC.
World Food Program (2007). Final report on the Ethiopia drought insurance pilot project.Operational Reports, Agenda Item 10.