Embed Size (px)
Citation preview

109
Chapter 3
Research Methodology
3.1 Introduction
This chapter will outline the research methodology that was used for the study. First
this chapter will describe the research design, population, instrumentation that were
chosen to address the problem and fulfill the objectives of the study. Second, it will
describe how the selected research design and instrumentation were used to collect the
population data. Finally, this chapter will explain the results of measurement model,
reliability and validity issues.

110
3.2 Research Design
To get the most reliable findings, quantitative method has been used for this research.
Malhotra (2007) defined quantitative research method as “a research methodology that
seeks to quantify the data, and typically, applies some form of statistical analysis”. In
this regard, Cavana, Robert and Sekaran (2001) argued that to obtain the valid finding
about the relationship between variables; researchers should develop planned procedure
for gathering and interpreting data. Furthermore, Malhotra (2007) suggested that
research planned procedures represented a quantitative research. The ideal quantitative
research design is to identify the research hypothesis (the expected solution to the
problem or challenge) (Cavana et al., 2001). In addition, quantitative research analysis,
also known as fixed design, is a deductive approach that used standardized method for
collecting data (Meadows, 2003)
3.2.1 Deductive Reasoning
Quantitative methods tend to be based on deductive reasoning. Cavana et al., (2001)
argued that qualitative research conclusion can be further confirmed by using more
quantitative approach.
3.1 Deductive Reasoning
Develop Theory
Accept / Reject Hypothesis
Formulate Hypotheses
Collect and Analyses Data
(Figure 3.1)

111
3.2.2 Epistemology of the Research
The philosophy behind this research is to build strong training transfer theory. With
reference to epistemological background, the positivist supports this research.
According to the positivist (Willmott, 1995) the aim of the research in the field of
management is to “generate laws, which govern the ways in which organizations
operate”. The generation of these causal relationship or laws will enable management
to become more scientific and managers to become better able to predict and control
their environment.
This research have highlighted different relationships between variables, which would
be better able to predict the effectiveness of training. The manager and the trainers
would be able to follow this theory and can better manage their training programs.
These training programs results the changing in behavior among all employees.
Donaldson and Hilmer (1998) argued that “a fully positivist approach would not
presume to call the approach strategic management but would rather call it corporate
development”. Therefore, this study is based on the corporate development rather than
strategic management. Effectiveness of training provides the bases to the corporate
industry to develop their strong foundation and effectively manage their training
programs. Furthermore, building strong training transfer theory may be difficult
without focusing on positivism approach.
Positivist claims that the aim of management research should be to identify casual
explanation and fundamental laws that explain regularities in human social behavior. In
other words, I can say that the aim of the positivist researchers is to generation of
causal laws.
112
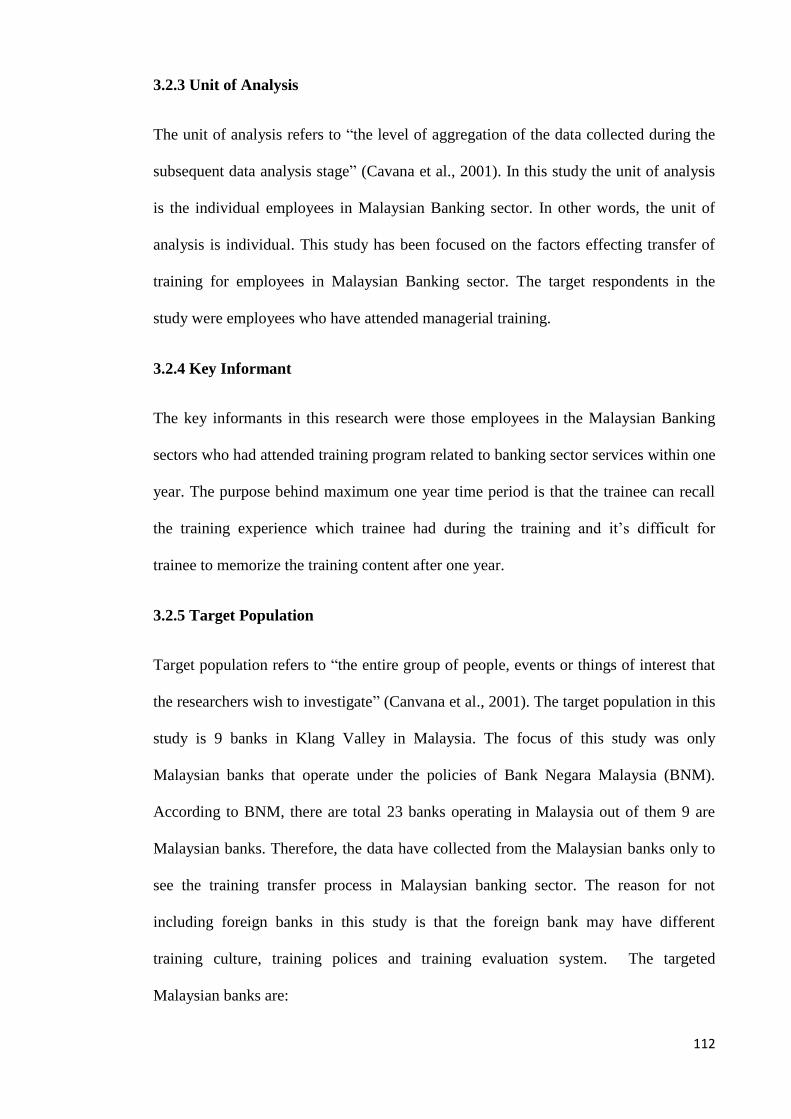
3.2.3 Unit of Analysis
The unit of analysis refers to “the level of aggregation of the data collected during the
subsequent data analysis stage” (Cavana et al., 2001). In this study the unit of analysis
is the individual employees in Malaysian Banking sector. In other words, the unit of
analysis is individual. This study has been focused on the factors effecting transfer of
training for employees in Malaysian Banking sector. The target respondents in the
study were employees who have attended managerial training.
3.2.4 Key Informant
The key informants in this research were those employees in the Malaysian Banking
sectors who had attended training program related to banking sector services within one
year. The purpose behind maximum one year time period is that the trainee can recall
the training experience which trainee had during the training and it‟s difficult for
trainee to memorize the training content after one year.
3.2.5 Target Population
Target population refers to “the entire group of people, events or things of interest that
the researchers wish to investigate” (Canvana et al., 2001). The target population in this
study is 9 banks in Klang Valley in Malaysia. The focus of this study was only
Malaysian banks that operate under the policies of Bank Negara Malaysia (BNM).
According to BNM, there are total 23 banks operating in Malaysia out of them 9 are
Malaysian banks. Therefore, the data have collected from the Malaysian banks only to
see the training transfer process in Malaysian banking sector. The reason for not
including foreign banks in this study is that the foreign bank may have different
training culture, training polices and training evaluation system. The targeted
Malaysian banks are:

113
1- RHB Bank Berhad
2- Public Bank Berhad
3- Malayan Banking Berhad
4- Hong Leong Bank Berhad
5- EON Bank Berhad
6- CIMB Bank Berhad
7- AmBank (M) Berhad
8- Alliance Bank Malaysia Berhad
9- Affin Bank Berhad
3.2.6 Sampling Method and Subject for the Study
“A sample is a subset of the population. It comprises some members selected from the
population and a subject is a single member of the sample, just as an element is a single
member of the population” (Cavana et al., 2001). The researcher has been randomly
selected every 5th
branch out of 120 bank branches in the Klang valley. To select the
bank branches, researcher used the list of bank branches available at Bank Negara
Malaysia (BNM) website. Therefore, 24 bank branches have been selected as sample
and each employee represents a subject for this study.
3.2.7 Positivist epistemology behind sampling Method
According to (Johnson and Duberley, 2000) The attempt to get to the truth involves the
development of sophisticated, replicable data collection techniques and careful
attention to sampling to ensure that we can develop generalized propositions that give
insight or have predictive powers.

114
For better understanding of the methodological issues the organizations should consider
the comparative studies for the purpose of differentiating the problem from specific to
particular organizations and need to generalize the methodology. Meaningful
comparisons require common standards for measurement. According to Johnson and
Duberley (2000) “the nature of an organization will be influenced by its objectives and
environments so these must be taken into account. Study of the work behavior of
individuals or groups should be related to the study of the characteristics of
organizations in which the behavior occurs”.
3.3 Instrumentation
To collect the quantitative data for this study the survey method was used as
instrumentation. Malhotra (2007) argued that survey research is a systematic,
standardized and common approach for collecting information from individual who
represent the study population. The reason for selecting survey method is that the
survey method is cost effective, suitable for this study, the type of data needed for this
study, population characteristics and available resource.
The researcher administered the survey instrument because of providing representative
information timely, cost effective and confidentially. The researchers also consider the
disadvantages of survey instrument like low response rate, difficulty in reading
questionnaire and difficulty for researcher to understand the response. Therefore, to
deal with the disadvantages of the survey instrument, researchers personally visit many
of the bank branches to get the appropriate response rate. For clear understanding about
the survey instrument, researcher conducted pilot testing and got the feedback from the
respondent about the clarity of the statement and their understanding about the
statement.

115
For the survey instrument, the researchers used 40 statements that represented the all
variables and 5 statements about the demographic information of the respondents. The
researcher grouped the variables into four categories (1) Trainee or individual factors
which includes learner readiness, performance self-efficacy, Training retention and
transfer motivation (2) work environment factors which includes supervisor support
and peer support (3) Training design factors which includes perceived content validity,
transfer design (4) Situational factors which includes Instrumentality (Intrinsic
rewards). Furthermore, the researcher divided the questionnaire into three sections.
First section related with feedback of trainee about specific training program and
Second section related with feedback of trainee about general training program. Finally,
third section is consisted on the trainee demographic information.
The trainee respond to the survey questions on 5 point likert scale with “1” indicated
strongly disagree to “5” strongly agree. The trainee demographic section included
gender (male, female), Ethnicity (Malay, Chinese, Indians and others), Trainee age,
Trainee highest level of education and most recent training.
3.4 Details of the Instrument
All measurement scale in this study is adopted from the previous research. The details
of the scales are as follow:
3.4.1 Transfer Design (Training design factor)
Transfer design defined as “the degree to which (1) training has been designed and
delivered to give trainees the ability to transfer learning to the job, and (2) training
instruction match job requirements” (Holton et al., 2000).

116
3.4.1.1 Scale Description
“The extent to which the training program is designed to clearly link learning with on-
the-job performance through the use of clear examples, methods similar to the work
environment, and activities and exercise that clearly demonstrate how to apply new
knowledge and skills”.
3.4.1.2 Items to Measure Transfer Design (Training Design factor):
Transfer design scale developed by Holton et al., (2000) and measured with 5 point
likert scale. The Alpha reliability of the scale is (0.788). The scale includes the
following items;
1- It is clear to me that people conducting the training understand how I will
use what I learn.
2- The trainer(s) used lots of examples that showed me how I could use my
learning on the job.
3- The way the trainer taught the material made me feel more confident, I
could apply it.
3.4.2 Perceived Content Validity (Training design factor)
Holton et al., (2000) define Perceived content validity as “the extent to which
the trainees judge the training content to accurately reflect job
requirements”.
3.4.2.1 Description of the Scale
“This factor addresses the degree to which skills and knowledge taught are
similar to performance expectations as well as what the individual needed to
perform more effectively. It also addresses the extent to which instructional

117
methods, aids, and equipment used in training are similar to those used in an
individual‟s work environment”.
3.4.2.2 Items to Measure Perceived Content Validity (Training design
factor):
Perceived content validity scale developed by Holton et al., (2000) and
measured with 5 point likert scale. The Alpha reliability of the scale is (0.807).
The scale includes the following items;
1- “The instructional aides (equipment, illustrations etc.) used in training
are very similar to real things I use on the job”.
2- “The methods used in training are very similar to how we do it on the
job”.
3- “I like the way training seems so much like my job”.
3.4.3 Performance Self-efficacy (an individual factor)
Holton et al., (2000) define performance self-efficacy as “An individual‟s general belief
that he is able to change his performance when he wants to”
3.4.3.1 Description of the Scale
“The extent to which individuals feel confident and self-assured about applying
new abilities in their jobs, and can overcome obstacles that hinder the use of
new knowledge and skills”.

118
3.4.3.2 Items to Measure Performance Self-Efficacy (an individual factor):
Performance Self-efficacy scale developed by Holton et al., (2000) and
measured with 5 point likert scale. The Alpha reliability of the scale is (0.798).
The scale includes the following items;
1- “I never doubt my abilities to use newly learned skills on the job”.
2- “I am sure I can overcome obstacles on the job that hinder my use of new
skills or knowledge”.
3- “At work, I feel very confident using what I learned in training even in the
face of difficult or taxing situation”.
4- “I am confident in my ability to use new skills at work”.
3.4.4 Definition of Learner readiness (an individual factor):
Holton et al, (2000) defined the “learner readiness as the extent to which individuals are
prepared to enter and participate in training”.
3.4.4.1 Scale Description
“This factor addresses the degree to which the individual had the opportunity to
provide input prior to the training, knew what to expect during the training, and
understood how training was related to job-related development and work
performance”.
3.4.4.2 Items to Measure the Learner Readiness (an individual factor):
Learner readiness scale developed by Holton et al., (2000) and measured with 5
point likert scale. The Alpha reliability of the scale is (0.787). The scale
includes the following items;

119
1- “Prior to the training, I knew how the program was supposed to affect my
performance”.
2- “Before the training, I had a good understanding of how it would fit my job
related development”.
3- “I know what to expect from the training before it begin”.
4- “Before the training, I had basic skills to perform different task during
training”.
5- “Prior to the training, I had basic knowledge about training activities, which
supposed to perform during the training”.
3.4.5 Definition of Peer Support (an environmental factor)
Holton et al, (2000) defined peer support as “The extent to which peers
reinforce and support the use of learning on the job”.
3.4.5.1 Scale Description
“This includes the degree to which peers mutually identify and implement
Opportunities to apply skills and knowledge learned in training, encourage the
Use of or expect the application of new skills, display patience with difficulties
associated with applying new skills, or demonstrate appreciation for the use of new
skills”.
3.4.5.2 Items to Measure Peers Support (an environmental factor):
Peer support scale developed by Holton et al., (2000) and measured with 5 point
likert scale. The Alpha reliability of the scale is (0.806). The scale includes the
following items;

120
1- “My colleagues appreciate my using new skills I have learned in training”.
2- “My colleagues encourage me to use the skills I have learned in training”.
3- “At work, my colleagues expect me to use what I learn in training”.
3.4.6 Definition of Supervisor Support (an environmental factor)
Holton et al., (2000) define supervisor support as “The extent to which managers
support and reinforce the use of learning on-the-job.”
3.4.6.1 Description of the Scale
“This includes manager‟s involvement in clarifying performance expectations
after training, identifying opportunities to apply new skills and knowledge,
setting realistic goals based on training, working with individual on
problems encountered while applying new skills, and providing
feedback when individuals successfully apply new abilities”.
3.4.6.2 Items to Measure Supervisor Support (an environmental factor):
Supervisor scale developed by Holton et al., (2000) and measured with 5 point likert
scale. The Alpha reliability of the scale is (0.779). The scale includes the following
items;
1- “My supervisor meets with me regularly to work on problems I may be having
in trying to use my training”.
2- “My supervisor meets with me to discuss ways to apply training on the job”.
3- “My supervisor set goals for me, which encourage me to apply my training on
the job”.

121
3.4.7 Definition of Instrumentality or Intrinsic rewards (situational factor)
Guerrero and Sire (2001) defined “instrumentality as individuals‟ perceptions that their
efforts in training will enable them to gain rewards at work”.
3.4.7.1 Description of the Scale
“The concept of instrumentality explain that trainee perceive that participation in
training activities will leads to some rewards in terms of intrinsic or extrinsic reward.
Intrinsic rewards includes personal satisfaction, personal development and extrinsic
rewards includes salary increment, career development or promotion”.
3.4.7.2 Items to Measure Intrinsic rewards (situational factor):
Instrumentality (Intrinsic rewards) scale developed by Guerrero and Sire (2001) and
measured with 5 point likert scale. The Alpha reliability of the scale is (0.791). The
scale includes the following items;
1- “I do participate in training for personal satisfaction”.
2- “Training increases my autonomy at work”.
3- “Participation in training enhances my personal knowledge”.
4- “Training helps me to acquire more skills”.
5- “Training enhances my level of self-confidence at work”.
6- “Training improves my efficacy at work”.
7- “The skills, I learn from training leads to increase adaptation at work”.
122
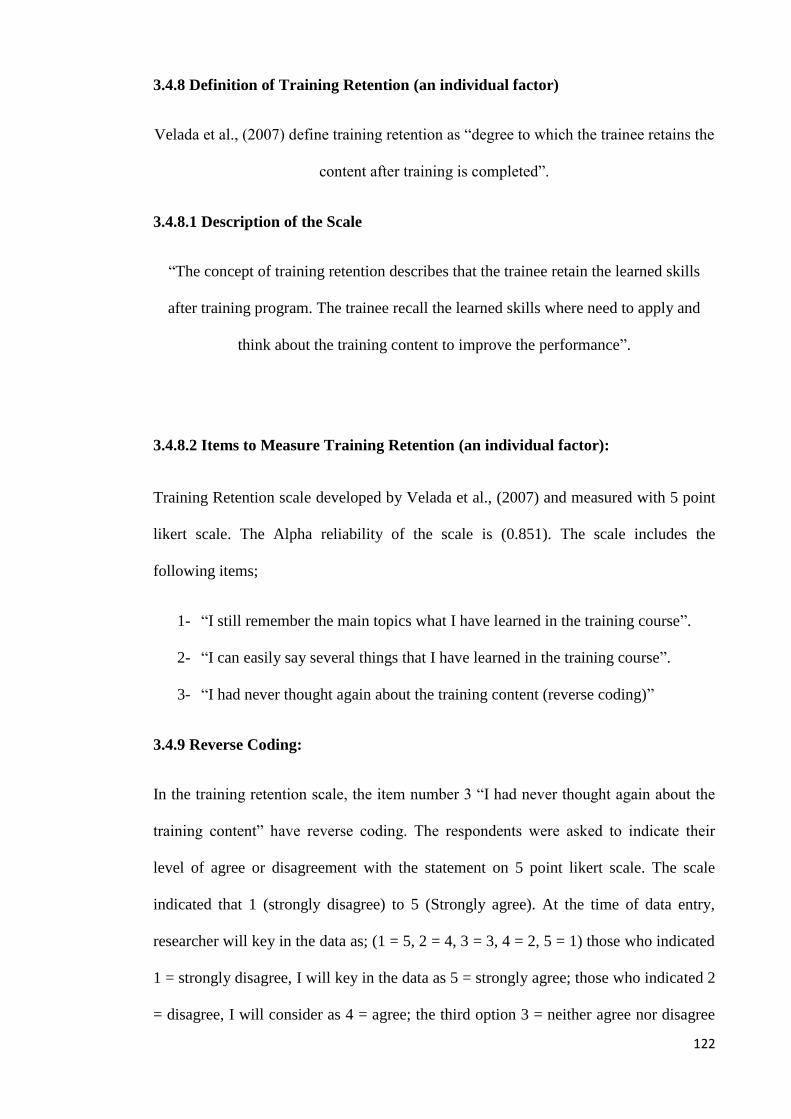
3.4.8 Definition of Training Retention (an individual factor)
Velada et al., (2007) define training retention as “degree to which the trainee retains the
content after training is completed”.
3.4.8.1 Description of the Scale
“The concept of training retention describes that the trainee retain the learned skills
after training program. The trainee recall the learned skills where need to apply and
think about the training content to improve the performance”.
3.4.8.2 Items to Measure Training Retention (an individual factor):
Training Retention scale developed by Velada et al., (2007) and measured with 5 point
likert scale. The Alpha reliability of the scale is (0.851). The scale includes the
following items;
1- “I still remember the main topics what I have learned in the training course”.
2- “I can easily say several things that I have learned in the training course”.
3- “I had never thought again about the training content (reverse coding)”
3.4.9 Reverse Coding:
In the training retention scale, the item number 3 “I had never thought again about the
training content” have reverse coding. The respondents were asked to indicate their
level of agree or disagreement with the statement on 5 point likert scale. The scale
indicated that 1 (strongly disagree) to 5 (Strongly agree). At the time of data entry,
researcher will key in the data as; (1 = 5, 2 = 4, 3 = 3, 4 = 2, 5 = 1) those who indicated
1 = strongly disagree, I will key in the data as 5 = strongly agree; those who indicated 2
= disagree, I will consider as 4 = agree; the third option 3 = neither agree nor disagree

123
will remain the same, those who indicated 4 = agree, I will key in data as 2 = disagree
and finally those who marked 5 = strongly agree, I will consider as 1 = strongly
disagree.
3.4.10 Definition of Transfer Motivation
Holton et al (2000) defined transfer motivation as the “direction, intensity and
persistence of effort towards utilizing in a work setting skills and knowledge learned”.
3.4.10.1 Description of the Scale
“It is the extent to which individual are motivated to utilize learning in their work.
This includes the degree to which individual feel better able to perform, plan
to use new skills and knowledge, and believe new skills will help them to more
effectively perform on-the-job”.
3.4.10.2 Items to Measure Transfer Motivation:
Transfer Motivation scale developed by Holton et al (2000) and measured with 5 point
likert scale. The Alpha reliability of the scale is (0.796). The scale includes the
following items;
1- “Training will increase my personal productivity.”
2- “When I leave training, I can‟t wait to get back to work to try what I learned.”
3- “I believe the training will help me do my current job better.”

124
3.4.11 Definition of affective reaction
Reaction refers to “the trainee‟s perception of the job relatedness to the training
program” (Seyler et al., 1998).
3.4.11.1 Description of the Scale
“Affective reaction indicates that when trainee sees the contents of the training
are similar with actual job, trainee will react positively. Furthermore, when
trainee perceives training contents are similar with the actual job he/she would be more
satisfied with the training program”.
3.4.11.2 Items to Measure Affective Reaction:
Reaction scale developed by Smith et al., (2008) and measured with 5 point likert scale.
The Alpha reliability of the scale is (0.814). The scale includes the following items;
1- “I am pleased I attended this training”.
2- “I found this training program to be enjoyable”.
3- “I found the information presented in this training program interesting”.
3.4.12 Definition of Training Transfer
Tesluk et al., (1995) define “transfer of training as the extent to which individual
transfer the knowledge and skills presented in training session to their core jobs”.
3.4.12.1 Description of the Scale
“The concept of training transfer explains that the trainee transfer the learned skills to
the work place. The trainee puts all efforts to transfer the training to the workplace
because trainee believe that if he/she incorporate the learned skills into daily work
activities, it would be helpful to improve the job performance.”

125
3.4.12.2 Items measure Training Transfer:
Training Transfer scale developed by Tesluk et al. (1995) and measured with 5 point
likert scale. The Alpha reliability of the scale is (0.783). The scale includes the
following items;
1- “I have been using the skills presented in the training course to help improve my
performance”.
2- “The training will help me to improve my job performance.”
3- “I have been incorporating learned skills into daily work activities”.
3.5 Ethical Issues
It is to ensure that the research does not pose any ethical issue. The subjects were
informed that:
1- Participation in this research is voluntary.
2- The data collected would be presented in an aggregate format.
3- Participation or non-participation would not affect their employment status.
4- They should not fill any information on any survey form which they feel
uncomfortable.
5- The survey instrument does not require the participant name, and other data
would be store at secure location.
3.6 Data Collection Method
To collect the data, the researcher administered the survey questionnaire. The
following steps describe how the data for study was collected:
1- The researcher sent the survey instrument directly to the Bank manager
including the cover letter, stating the importance and purpose of the study

126
and explained how this study is important for Malaysian Banking sector.
The response rate required for this study was 500 respondents. (Hair,
William, Barry, and Rolph, 2007) guideline have used for this study.
According to (Hair et al., 2007) the required response rate for SEM should
be: (Sample size = Parameters X 10). The number of parameters in this
research was 50. Therefore, in this research the required sample size was (50
X 10 = 500).
2- In the cover letter which was attached with the survey instrument, the
managers were asked to distribute survey instrument to the employees and
explain them about the importance of this study and how this study would
be helpful for employees and organization to improve their performance.
3- The survey instrument was sent to each bank branch through postal services
with another envelope which they can use to send back the filled survey
instrument.
4- The respondents were asked to fill up the survey instrument and sent back in
four weeks. After two weeks, a telephonic reminder sent to each bank
branch manager.
5- After four weeks, only 230 survey instruments were received out of 1000
survey instrument which was very low respond rate for this study. After 6
weeks, the researcher decided to visit few bank branches personally or send
one more telephonic reminder and explain the importance of this study to
bank managers.
6- The total targeted numbers of bank branches were 24. The researcher
personally visited 18 bank branches and sent telephonic reminder to the
other branches. The personal visit and second telephonic reminder helped
127
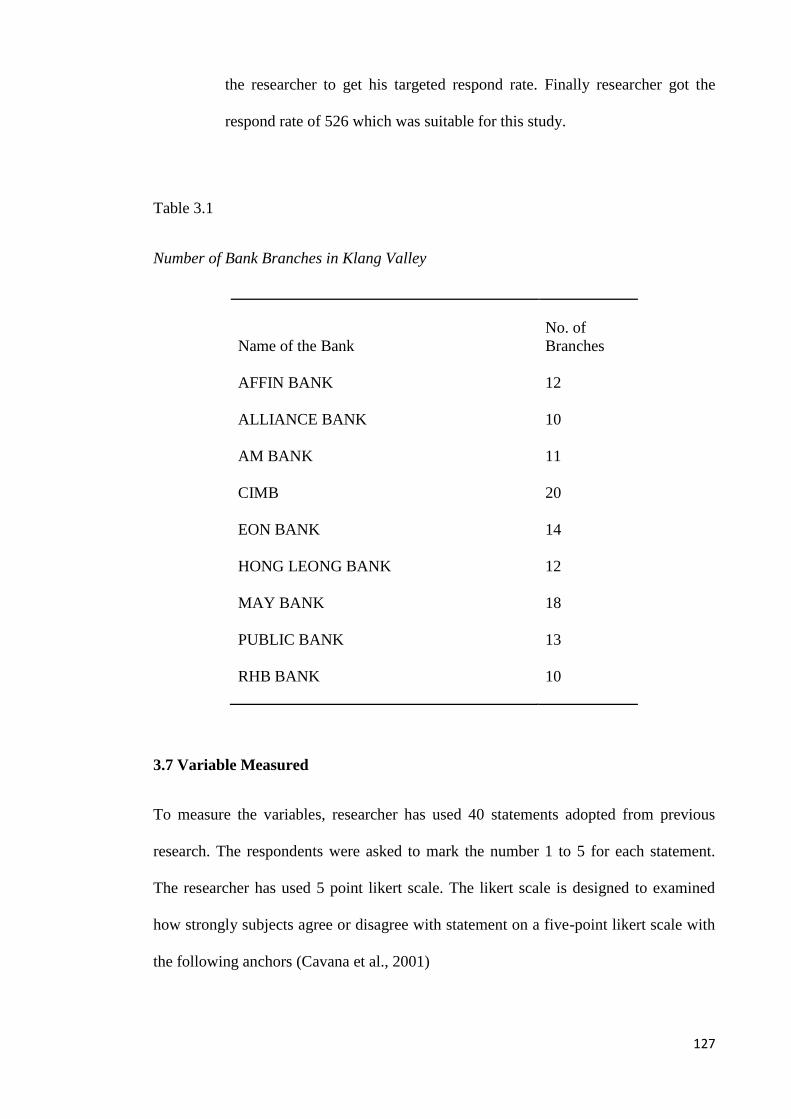
the researcher to get his targeted respond rate. Finally researcher got the
respond rate of 526 which was suitable for this study.
Table 3.1
Number of Bank Branches in Klang Valley
Name of the Bank
No. of
Branches
AFFIN BANK 12
ALLIANCE BANK 10
AM BANK 11
CIMB 20
EON BANK 14
HONG LEONG BANK 12
MAY BANK 18
PUBLIC BANK 13
RHB BANK 10
3.7 Variable Measured
To measure the variables, researcher has used 40 statements adopted from previous
research. The respondents were asked to mark the number 1 to 5 for each statement.
The researcher has used 5 point likert scale. The likert scale is designed to examined
how strongly subjects agree or disagree with statement on a five-point likert scale with
the following anchors (Cavana et al., 2001)
128
3.8 Five-Point Likert Scale
1 2 3 4 5
Strongly Disagree Disagree Neither agree Agree Strongly Agree
Nor Disagree
Likert scale is standard of measurement that is frequently used in survey questionnaire
(Wynne, Johnson, and Schwarz, 2008). This scale was developed for the measurement
of a person‟s attitude (Likert, 1932). It consists of declarative statements to which
people are required to say the extent to which they agree with these statements
(Peterson, 1994). Most times these options are numbered, consecutively, from one to a
maximum of nine (Flamer, 1983), Still, there are studies that have numbered this scale
up to 11 (Russell and Bobko, 1992), but the rating options numbered 1 to 5 and 1 to 7
are the most common types (Beal and Dawson, 2007). It is these numbers that are used
to provide a quantifiable measure for the statistical analysis of the scale (Wynne et al.,
2008).
Total 11 variables was measured in this study including learner readiness, performance
self-efficacy, transfer design, transfer motivation, Affective reaction, Training transfer,
Instrumentality (Intrinsic rewards), training retention, supervisor support, peer support
and perceived content validity. All these variables were representing the metric data.
3.9 Data Screening and Checking
After data collection, the researcher key in the data and checked the missing values,
detected the outlier and coded the data.

129
3.9.1 Detection of Missing values:
To know about the missing values in the data, researcher run frequency
distribution and found some values were missing in the data. It was a bit difficult to
contact the respondent again to fill up the missing values. Therefore, the researcher just
decided to insert “missing value” by using SPSS.
3.9.2 Detection of Outlier:
After checking the missing value, the researcher checked the outlier and
discarded 23 survey forms. The reason for discarding the 23 survey forms was the
response of the respondents. Mostly respondent marked only 1 point in the whole
survey forms. Out of 23 discarded survey forms, 15 respondents were marked 5
(strongly agree) on the whole survey forms and 5 respondents were marked 3 (neither
agree nor disagree) on the whole survey form. In the last 3 respondent marked 1
(Strongly disagree) on the whole survey forms. Therefore, all these 23 survey forms
have been discarded because of outlier and as a result, only 503 questionnaires were
included for analysis purposes.
3.9.3 Data Coding:
After the detection of missing values and detection of outlier, the data were
coded. Following is the table-3 which shows the different codes for the all survey
statements.

130
Table 3.2
Coding List
Factor Statement Number on
Survey
Coding
Specific Training Program Scales
Learner Readiness 1, 5, 6, 27, 24 A1, a5, a6, a27, a24
Motivation to Transfer Learning 2, 3, 4, A2, a3, a4
Peer Support 7, 8, 9 A7, a8, a9
Supervisor/Manager Support 10, 11, 12 A10, a11, a12
Training retention 19, 20, 21 A19, a20, a21
Perceived Content Validity 13, 14, 15 A13, a14, a15
Transfer Design 16, 17, 18 A16, a17, a18
Affective reaction 22, 23, 28 A22, a23, a28
Training transfer 25, 26, 29 A25, a26, a29
Training in General Scales
Instrumentality (Intrinsic rewards) 33 to 39 A33 to A 39
Performance Self-Efficacy 30, 31, 32, 40 A30, a31, a32, a40
Demographic Profile
Gender 41 A41
Ethnicity 42 A42

131
Age 43 A43
Education 44 A44
Last Training 47 A 45
3.10 Data Collection Procedure
The researcher sent the survey instrument with instruction for completing the form and
self addressed envelope to subjects. A cover letter was also included with the
document. In the cover letter the researcher emphasized the importance of the study and
confidentially of the participants. The survey was sent directly to branch manager
through courier. The respondent had 4 weeks to review, complete and returns the
requested survey material to a designated mailbox. The researcher mailed reminder
letter to the each branch manager 2 weeks after initial mailing. The reminder letter
specified the importance and voluntary nature of the subject participations. After 4
weeks only 230 out of 1000 survey forms received from the respondents. After 6
weeks, the researcher decided to visit few bank branches personally or send one more
telephonic reminder and explain the importance of this study to bank managers.
The total selected numbers of bank branches were 24. The researcher personally visited
18 bank branches and sent telephonic reminder to the other branches. The personal visit
and second telephonic reminder helped researcher to get his targeted respond rate.
Finally researcher got the respond rate of 526 which was suitable for this study and 23
questionnaires were discarded due to outlier effect.
132
3.11 Data Processing procedure
The researcher processed the data collected from the 503 (Total 526 surveys less 23
discarded, 526-23=503) surveys by using SPSS. The columns represented the statement
from the three of the survey instruments as follow: Section I: specific training program
(27 statements), Section II: General training program (13 statements) and section III:
Demographic (5 statements). The researcher coded the responses for section I to III
with consecutive integers from 1 to 5 (1= strongly disagree, 2 = disagree, 3 = neither
agree nor disagree, 4 = agree, 5 = strongly agree).
3.12 Statistical Analysis
For this quantitative research study, the researcher performed descriptive statistics and
frequency distribution analysis to report the attribute variables and numeric variables
associated with demographic data. Structural Equation Modeling (SEM) with A-moss
16 has been used. CFA defines the relationship between the latent and their indicator
variables. Normally CFA used to specify the indicators for each construct by assessing
the extent to which the observed variables are measuring the hypothesized latent
construct as well as measuring something other than the latent construct, and
determining the best indicators for a particular construct. The relationships between
observed and latent variables are expressed by factor loadings that inform researchers
about the extent to which a given indicator is able to measure the variable or functions
as validity coefficients. In addition, CFA compares the solution found against a
hypothetical one Bryman and Cramer (2001). Confirmatory factor analysis in structural
equation modeling (SEM) is refine and validate the measurement model (Garver and
Williams, 2009) In addition, George (2008) proposed that confirmatory factor analysis

133
(CFA) examine the uniqueness of the construct and test the hypotheses in more
appropriate way.
3.13 Demographic Profile of the Respondent
Table 3.3
Gender
Table 9 shows that out of 503 respondents, female respondents are more than man.
Female respondents are 311 with (61.8 percent) and male respondents are 192 (38.2
percent). One possible reason behind higher female respondent is the higher ratio of
female in Malaysian population.
Table 3.4
Race
Frequency Percent
Valid Male 192 38.2
Female 311 61.8
Total 503 100.0
Frequency Percent
Valid Malay 277 55.1
Chinese 123 24.5
Indians and Others 103 20.5
Total 503 100.0
134
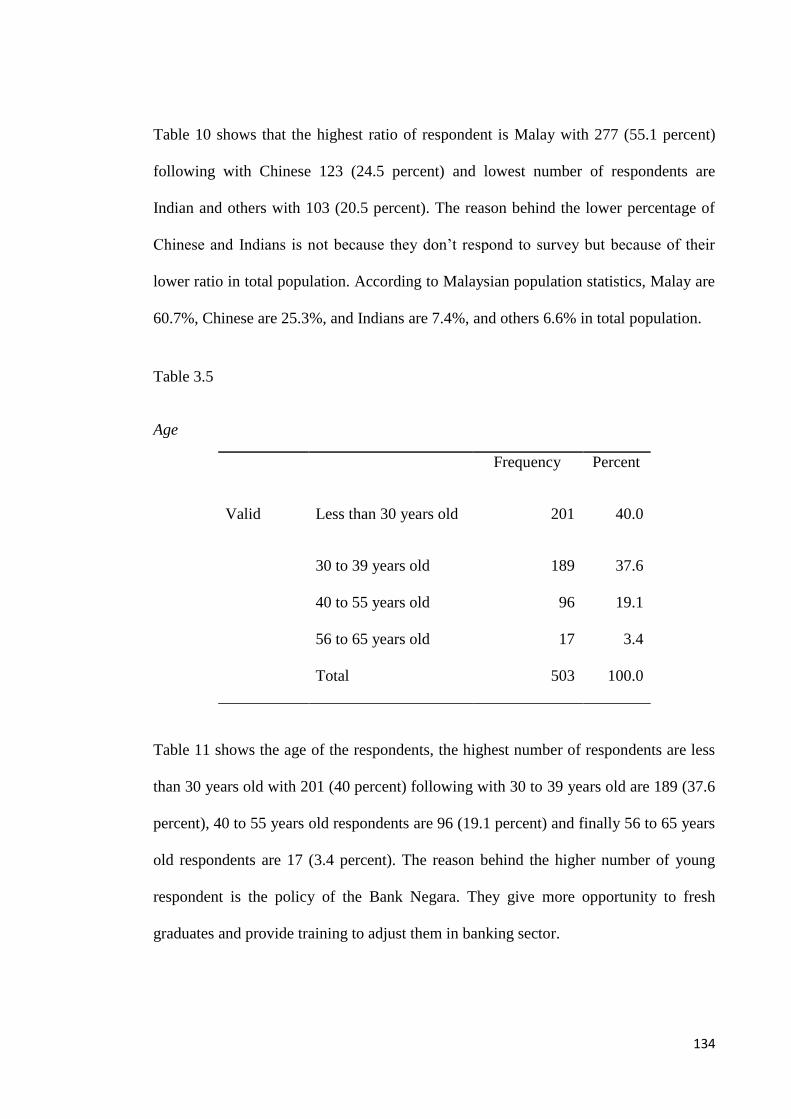
Table 10 shows that the highest ratio of respondent is Malay with 277 (55.1 percent)
following with Chinese 123 (24.5 percent) and lowest number of respondents are
Indian and others with 103 (20.5 percent). The reason behind the lower percentage of
Chinese and Indians is not because they don‟t respond to survey but because of their
lower ratio in total population. According to Malaysian population statistics, Malay are
60.7%, Chinese are 25.3%, and Indians are 7.4%, and others 6.6% in total population.
Table 3.5
Age
Table 11 shows the age of the respondents, the highest number of respondents are less
than 30 years old with 201 (40 percent) following with 30 to 39 years old are 189 (37.6
percent), 40 to 55 years old respondents are 96 (19.1 percent) and finally 56 to 65 years
old respondents are 17 (3.4 percent). The reason behind the higher number of young
respondent is the policy of the Bank Negara. They give more opportunity to fresh
graduates and provide training to adjust them in banking sector.
Frequency Percent
Valid Less than 30 years old 201 40.0
30 to 39 years old 189 37.6
40 to 55 years old 96 19.1
56 to 65 years old 17 3.4
Total 503 100.0

135
Table 3.6
Education
Table 12 shows that the higher number of respondents have diploma 143 (28.4 percent)
and undergraduate degree 190 (37.8 percent) following with Masters Degree 57 (11.3
percent). But the respondents with primary, secondary and certificate have lower ratio.
The educational criteria for selection of candidate in banking sector are minimum
diploma. Those respondents who have education till primary, secondary and certificate
are older employees.
Table 3.7
Training Period
Frequency Percent
Valid 3 month before 268 53.3
6 month before 139 27.6
Frequency Percent
Valid Primary School 8 1.6
Secondary School 58 11.5
Certificate 47 9.3
Diploma 143 28.4
Undergraduate
Degree
190 37.8
Masters 57 11.3
Total 503 100.0

136
9 month before 40 8.0
12 month before 55 10.9
More than 1
year before
1 .2
Total 503 100.0
Table 13 shows that the higher number of respondent get the training 3 month before
with 268 (53.3 percent) because Malaysian banking sector offers different training
programs frequently.
Table 3.8
Normality Test
Variables Mean S.D Skewness Kurtosis
Learner
Readiness
20.38
2.76
- 0.710
0.261
Transfer
Motivation
12.95
1.62
- 0.675
0.346
Peer support 12.35 1.75 - 0.635 0.476
Supervisor
support
12.25
1.87
-1.058
2.252
Training
retention
10.86
1.39
0.577
0.579
Perceived
content validity
12.37
1.78
-0.949
1.222
Transfer Design 12.67 1.81 -0.634 -0.088
Reaction 12.42 1.60 -0.469 -.119

137
Training
Transfer
12.70
1.51
-0.545
0.195
Intrinsic rewards 38.66 3.52 0.1069 0.657
Performance
Self-efficacy
17.15
1.94
-0.437
-0.285
The above table explains the normality of the data with mean, S.D, Skewness and
kurtosis. According to Hair et al, (2006) the Skewness and kurtosis should be between
(+ 2.58 to – 2.58). Therefore, all values in the above table lies between (+ 2.58 to –
2.58) which explain that the data is normally distributed. Skewness shows the tendency
of the deviation from the mean to be larger in one direction than in the other (
Melhotra; 2007). All values in above table except “instrumentality (Intrinsic rewards)”
indicate negatively skewed and instrumentality shows positively skewed. Furthermore,
the Kurtosis is a measure of the relative peakness or flatness. The kurtosis of a normal
distribution is zero (Melhotra ;2007). The positive value means that the distribution is
more peaked than normal distribution and negative values shows that the distribution is
less peaked than normal distribution. Therefore, in the above table, all values except
self-efficacy, transfer design and affective reaction have positive values which indicate
that distribution is more peaked than normal distribution. In contrast, self-efficacy,
transfer design and affective reaction have negative values, which indicate that the
distribution is less peaked than normal distribution.
In addition, With reference to mean or average, which is the most commonly used
measure of tendency (Naresh et al., 2007). The above table shows that mean of the
learner readiness is around 20 with 5 indicators; transfer motivation is around 13 with 3
indicators; peer support is around 12 with 3 indicators; supervisor support is around 12
with 3 indicators; training retention is around 10 with 3 indicators. Perceived content

138
validity is around 12 with 3 indicators; transfer design is around 13 with 3 indicators;
affective reaction is around 12 with 3 indicators; training transfer is around 13 with 3
indicators; instrumentality (intrinsic rewards) is around 39 with 7 indicators;
performance self-efficacy is around 17 with 4 indicators.
3.14 Data Analysis
Structural Equation modeling (SEM) is a family of statistical models that seek to
explain the relationship between multiple variables (Hair et al., 2007). SEM has
become one of the popular statistical tools to test the relationships proposed in a
parsimonious model (Cheng, 2007). In addition, Byrne (2001) pointed out that this
technique is appropriately used: “when the researcher has some knowledge of the
underlying latent variables structure. Based on knowledge of the theory, empirical
research, or both, he or she postulates relations between observed measures and the
underlying factors a prior and then tests this hypothesized structure statistically”
Cheng (2007) suggested that SEM is better statistical technique then other multivariate
techniques including multiple regression, path analysis and factor analysis. In addition,
Hair et al., (2007) claims that “SEM has been advocated because it can expand the
explanatory ability and statistical efficiency for model testing with a single
comprehensive method”.
Structural equation modeling researchers propose a two step procedure when
testing theoretical models (Medsker, Williams, and Holahan, 1994). The first step is to
examine and validate the measurement model, with the second step testing the
structural model and conducting hypothesis tests (Garver and Williams, 2009).

139
CFA defines the relationship between the latent variables and their indicator variables.
Normally CFA used to specify the indicators for each construct by assessing the extent
to which the observed variables are measuring the hypothesized latent construct as well
as measuring something other than the latent construct, and determining the best
indicators for a particular construct. The relationships between observed and latent
variables are expressed by factor loadings that inform researchers about the extent to
which a given indicator is able to measure the variable or functions as validity
coefficients. In addition, CFA compares the solution found against a hypothetical one
(Bryman and Cramer, 2001). Confirmatory factor analysis in structural equation
modeling (SEM) is refine and validate the measurement model (Garver and Williams,
2009) Awoniyi et al., (2002) proposed that confirmatory factor analysis (CFA) examine
the uniqueness of the construct and test the hypotheses in more appropriate way.
Therefore, to analyze the research data, two steps method was used by using Amos 16.
At first step, measurement model (factor) analyses evaluated the contribution of each
item to the construct (latent variables) being assessed. Then at the second step, the
structural model was tested to determine the strength of the hypothesized relationships
between the constructs.
3.15 Validity and Reliability Assessment
3.15.1 Reliability Assessment
The reliability of a measure indicates the extent to which the measure is without bias
(error free) and hence offers consistent measurement across time and across the various
items in the instrument (Cavana et al., 2001). To test the internal consistency of the
survey instrument, the researcher conducted pilot study in lieu with the traditional

140
reliability method. A pilot study is considered a small-scale test of the whole
administrative procedure (e.g. introduction letter, instrument etc.) for the survey
process (Malthotra 2007). In this regards, Cavana et al., (2001) argued that a
questionnaire should be piloted with a reasonable sample of respondents who come
from the target population or who closely resemble the target population.
To get the internal consistency of the instrument, researcher conducted pilot study and
worked as moderator to get the opinion and feedback from the respondent about the
survey instrument regarding clear understanding of the statement and asked for the
suggestions to improve the survey instrument. The targeted group which was selected
for the pilot study was not included in the population. Because the pilot study would
not contribute to generalize the knowledge and therefore, not considered research
(London and Flannery, 2004).
The researcher invited 60 employees form the different bank branches and distributed
the survey questionnaire including with cover letter stated that the purpose of pilot
study and assure them about the information and data belongs to respondent would be
kept confidential. The cover latter also declared that the result would be calculate on
aggregate bases. The respondents were required to evaluate each statement in the
survey instrument and check whether the statements are clear and understandable. With
reference to demographic point of view, respondents were asked to highlight if they
feel any statement disclose their privacy.
The respondent were asked to give their feedback about whether the statement are
clear, precise, well written by clicking on the yes or no box and their opinion about
addition, deletion or changing the statement to improve the survey instrument. In result,
respondents were agreed that the (a) the statements were easy to understand, (b)
statements were well written (c) response choice was easy to identify (d) survey

141
respondents privacy was respected and protected and (e) the survey length was suitable
to reply.
Table 3.9
Reliability of the Scale
Name of Variable Reliability Internal Consistency
Reaction 0.814 0.969
Instrumentality (Intrinsic
rewards)
0.791 0.930
Learner Readiness 0.787 0.672
Motivation to Transfer 0.796 0.769
Peer Support 0.806 0.970
Perceived Content Validity 0.807 0.759
Performance Self-Efficacy 0.798 0.968
Supervisor Support 0.779 0.704
Training Retention 0.851 0.859
Training Transfer 0.783 0.980
Transfer Design 0.788 0.686
Table 3.9 shows that the reliability and internal consistency of all scales is above then
0.7 (Hair et al., 2000) which indicates that all scales have higher reliability and internal
consistency level.

142
3.16 Validity Assessment:
There are different way to assess validity of the instrument like content validity,
construct validity and criterion validity.
3.16.1 Content Validity:
Content validity also called face validity has to do with items seeming to
measure what they claim to (Adcock and Collier, 2001). Content validity ensures that
the measures include an adequate and representative set of items that tap the concept.
“The more the scale items represents the domain or universe of the concept being
measured, the greater the content validity” (Cavana et al.,; 2000). All scales in this
research have been adopted from previous research and literature also confirmed the
content validity of all scales.
3.16.2 Method for assessing Construct Validity
“Construct validity testifies to how well results obtained from the use of the measures
fit the theories around which the test is designed” (Cavana et al.,: 2000). Researchers
divide construct validity into two types: Convergent validity and discriminant validity.
Hair et al., (2000) argued that “convergent and discriminant validity is both considered
subcategories of subtypes of construct validity”. To find out construct validity,
researcher have calculated both convergent and discriminant validity.
3.16.2.1 Convergent Validity:
“Convergent validity established when the scores obtained by two different
instruments measuring the same concept are highly correlated” (Cavana et al.,; 2000).
By using Amos results, researcher have calculated the convergent validity as below. To
find out the convergent validity, Researcher have used Average Variance Extracted
(AVE) method. (Fornell and Larcker, 1981) developed this method to calculate

143
convergent validity and consider “a construct to display convergent validity if average
variance extracted (AVE) is at least 0.50 (that is, when variance explained by the
construct is greater than measurement error)”.
AVE is the variance in indicator items captured by a construct as a proportion of
captured plus error variance. AVE is calculated as the sum of the squared standardized
indicator item loadings on the factor representing the construct, divided by this sum
plus the sum of indicator item error. Thus, let S1 = the sum of squared principal
components analysis factor loadings of the indicator variables on the factor
representing their construct. Let S2 = the quantity (1 - the squared loading) summed for
all indicators. Then
AVE = (S1) / ( S1 + S2)

144
Table 3.10
Convergent Validity
Construct
Composite
Convergent
Validity
AVE
Perceived Content
Validity
A13
0.714
0.715
A14
0.753
A15
0.680
Transfer design
A16
0.812
0.526
A17
0.766
Peer Support
A07
0.944
0.957
A08
0.990
A09
0.937
Supervisor
Support
A10
0.616
0.664

145
A11
0.726
A12
0.652
Learner Readiness
A24
0.873
0.652
A27
0.886
Transfer
Motivation
A02
0.798
0.723
A03
0.740
A04
0.633
Training Transfer
A25
0.998
0.970
A26
0.987
A29
0.927
Training Retention
A21
0.714
0.816
A20
0.842

146
A19 0.894
Intrinsic rewards
A39
0.693
0.806
A38
0.715
A37
0.791
A36
0.890
A35
0.912
A34
0.910
A33
0.731
Performance Self-
efficacy
A43
0.861
0.940
A32
0.945
A31
0.986
A30
0.969
Reaction
A28
0.913
0.955

147
A23
0.977
A22
0.975
Fornell and Larcker (1981) argued that the convergent validity of all scales should be at
least 0.50. As mentioned in the above table all variables have at least 0.50 or all values
are greater than 0.50 which shows that all scales have adequate convergent validity.
3.16.2.2 Discriminant Validity:
The second major type of “construct validity refers to the principle that the
indicators for different constructs should not be so highly correlated as to lead one to
conclude that they measure the same thing” (Garson, 2009). Furthermore, Garson
(2009) explained that “discriminant validity analysis refers to testing statistically
whether two constructs differ (as opposed to testing convergent validity by measuring
the internal consistency within one construct, as Cronbach's alpha does)”.
An alternative factor-based procedure for assessing discriminant validity is that
proposed by Fornell and Larcker (1981). In this method, “the researcher concludes that
constructs are different if the average variance extracted (AVE) for one's constructs is
greater than their shared variance”. “That is, the square root of the average variance
extracted (AVE) for a given construct should be greater than the absolute value of the
standardized correlation of the given construct with any other construct in the analysis.
For standardized data, squared covariances are equivalent”.
“AVE is calculated as the sum of the squared standardized indicator item loadings on
the factor representing the construct, divided by this sum plus the sum of indicator item

148
error”. “Thus, let S1 = the sum of squared principal components analysis factor
loadings of the indicator variables on the factor representing their construct”. “Let S2 =
the quantity (1 - the squared loading) summed for all indicators. Then AVE = (S1)/( S1
+ S2)”.
According to Garson (2009) “In terms of presentation, it is customary to provide a
matrix of squared covariance of each construct with each other construct, replacing the
diagonal elements with the AVE for the column construct”. Therefore, all items in the
table below are greater than squared covariance or greater than 0.60 as proposed by
(Ghazale; 2006) which demonstrate that all variables are discriminate each other and
statistically significant. See complete table for discriminant validity (Appendix B)
3.16.2.3 Criterion Validity:
“Criterion related validity is established when the measure differentiates individuals on
a criterion it is expected to predict” (Cavana et al; 2000). Criterion validity explains the
correlation between scale or instrument measurement. Criterion validity can be done by
establishing predictive validity. “Predictive validity indicates the ability of the
measuring instrument to differentiate among individuals on a future criterion” (Cavana
et al., 2000). For example in this research, researcher have predicted that if the trainee
will highly motivate, the more they will transfer the learned skills. The criterion
validity of studied variables verified by Holton (1998) and velada (2007). In addition,
the results obtained from hypothesis in this research established predictive validity
which will be explained further in next chapter.

149
Table 3.11
Standardized Measurement Model Results
Construct
Composite
Parameter
Estimate
P – Value
Perceived Content Validity
A13
0.741
****
A14
0.755
****
A15
0.742
****
Transfer design
A16
0.723
****
A17
0.772
****
A18
0.730
****
Peer Support
A07
0.737
****
A08
0.840
****
A09
0.712
****
Supervisor Support
A10
0.715
****

150
A11
0.813
****
A12
0.694
****
Learner Readiness
A01
0.523
****
A05
0.775
****
A06
0.765
****
A24
0.634
****
A27
0.586
****
Transfer Motivation
A02
0.752
****
A03
0.782
****
A04
0.694
****
Training Transfer
A25
0.832
****
A26
0.692
****
A29
0.694
****
151
Training Retention
A21
0.794
****
A20
0.818
****
A19
0.816
****
Intrinsic rewards
A39
0.684
****
A38
0.602
****
A37
0.705
****
A36
0.668
****
A35
0.772
****
A34
0.667
****
A33
0.639
****
Performance Self-efficacy
A43
0.704
****
A32
0.599
****
A31
0.746
****

152
A30
0.762
****
Reaction
A28
0.764
****
A23
0.829
****
A22
0.722
****
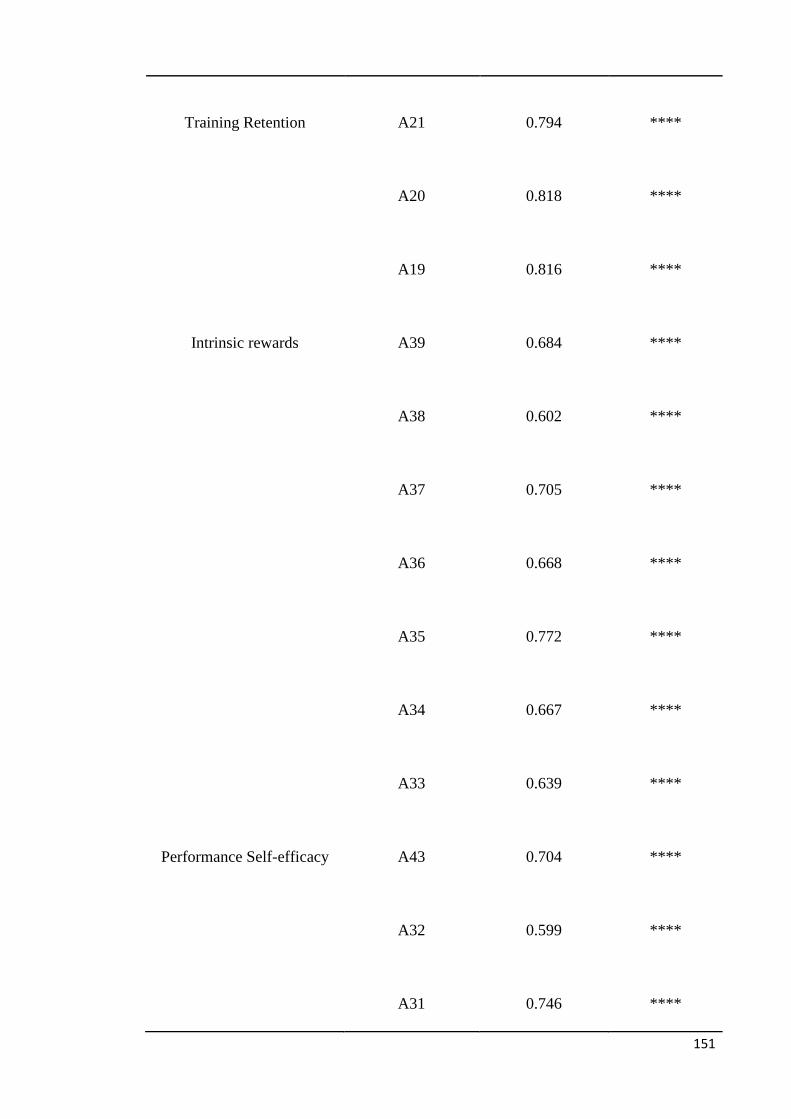
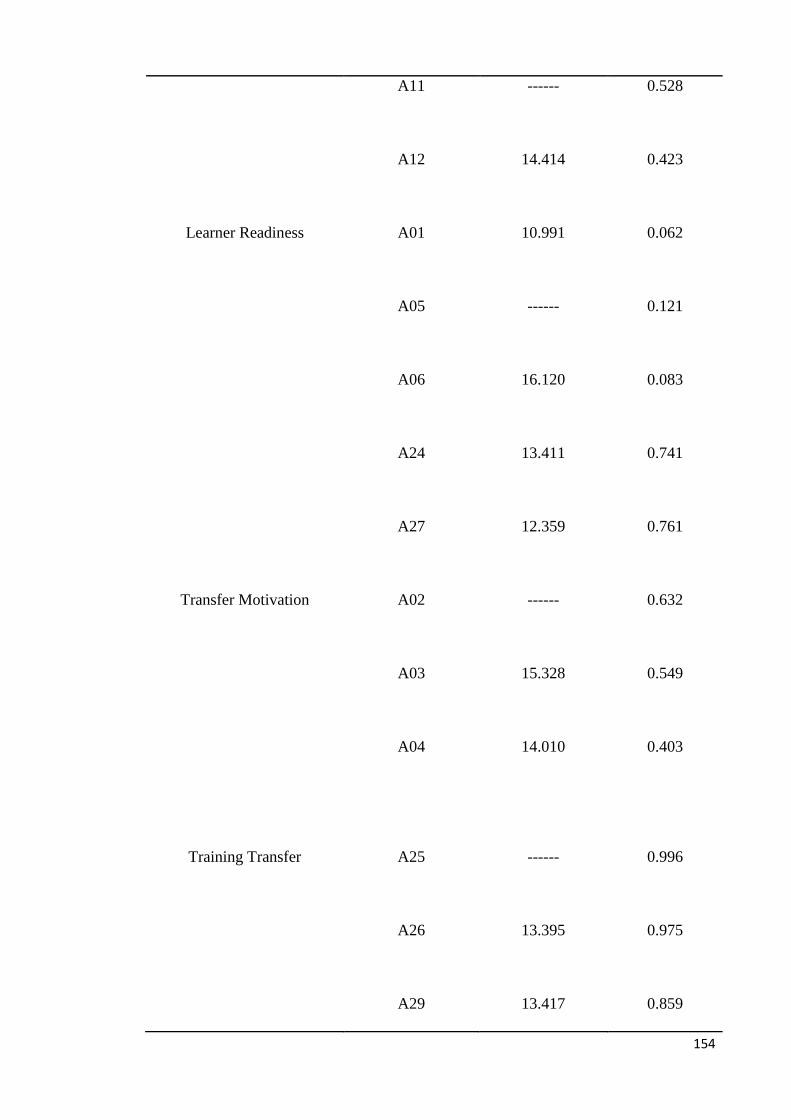
In the above table, the results of measurement model are displayed. The results display
that parameter estimates from composites to latent variables are of sufficient magnitude
and are statistically significant. All parameter estimates are greater than 0.6 (Garver and
Williams, 2009) with most values being 0.80 or greater. Furthermore, less than 0.01 p-
value shows that all parameters are statistically significant.

153
Table 3.12
Standardized measurement model fit
Construct
Composite
T - value
Squared
Multiple
Correlation
Perceived Content Validity
A13
15.460
0.507
A14 ------ 0.567
A15
15.479
0.465
Transfer design
A16
15.047
0.618
A17
------
0.602
A18
15.180
0.343
Peer Support
A07
16.391
0.891
A08
------
0.980
A09
15.674
0.877
Supervisor Support
A10
14.772
0.379
154
A11 ------ 0.528
A12
14.414
0.423
Learner Readiness
A01
10.991
0.062
A05
------
0.121
A06
16.120
0.083
A24
13.411
0.741
A27
12.359
0.761
Transfer Motivation
A02
------
0.632
A03
15.328
0.549
A04
14.010
0.403
Training Transfer
A25
------
0.996
A26
13.395
0.975
A29
13.417
0.859

155
Training Retention
A21
17.675
0.086
A20
------
0.701
A19
17.936
0.514
Intrinsic rewards
A39
------
0.481
A38
8.114
0.511
A37
9.712
0.626
A36
9.481
0.792
A35
10.060
0.833
A34
9.473
0.828
A33
6.154
0.534
Performance Self-efficacy
A43
------
0.741
A32
11.978
0.893
A31
14.562
0.972
156
A30
14.817
0.940
Reaction
A28
------
0.834
A23
15.858
0.955
A22
14.841
0.951
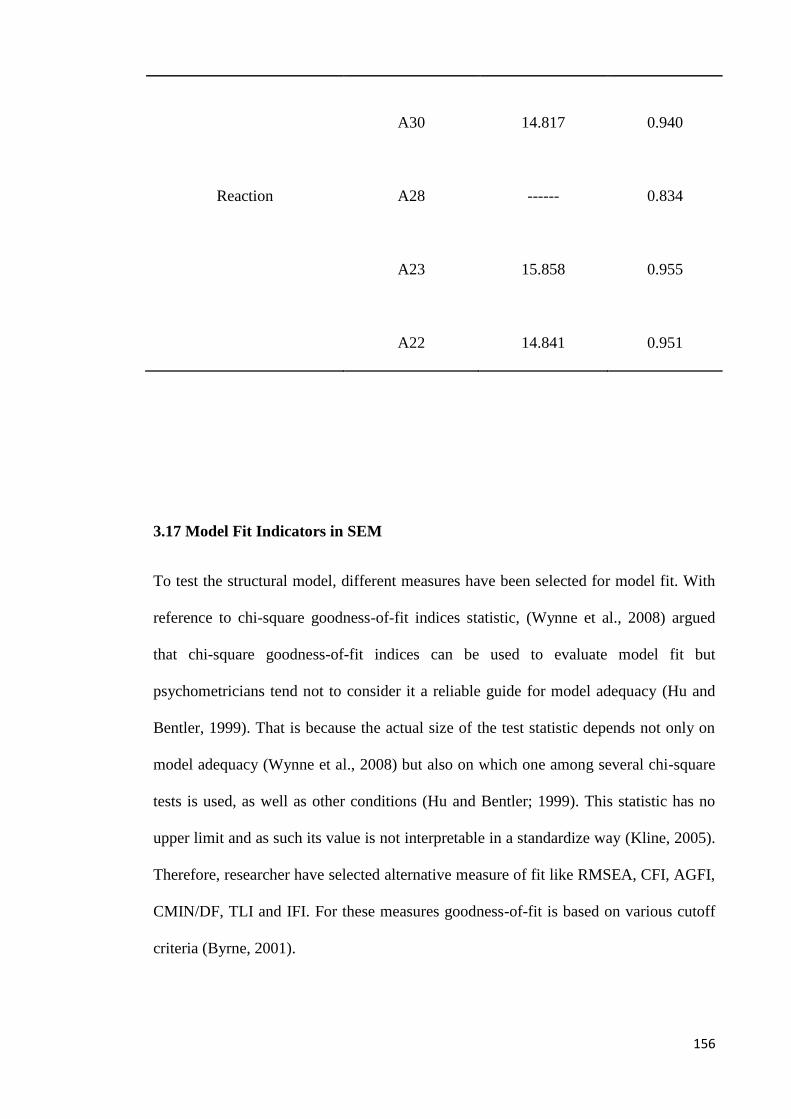
3.17 Model Fit Indicators in SEM
To test the structural model, different measures have been selected for model fit. With
reference to chi-square goodness-of-fit indices statistic, (Wynne et al., 2008) argued
that chi-square goodness-of-fit indices can be used to evaluate model fit but
psychometricians tend not to consider it a reliable guide for model adequacy (Hu and
Bentler, 1999). That is because the actual size of the test statistic depends not only on
model adequacy (Wynne et al., 2008) but also on which one among several chi-square
tests is used, as well as other conditions (Hu and Bentler; 1999). This statistic has no
upper limit and as such its value is not interpretable in a standardize way (Kline, 2005).
Therefore, researcher have selected alternative measure of fit like RMSEA, CFI, AGFI,
CMIN/DF, TLI and IFI. For these measures goodness-of-fit is based on various cutoff
criteria (Byrne, 2001).

157
For the goodness-of-fit indices like RMSEA, CFI, AGFI, CMIN/DF, TLI and IFI, it is
important to be aware that there is no distinction made in terms of degree of fit for
differences in fit indexes beyond the cutoff point (Wynne et al., 2008). For RMSEA,
value less than 0.05 indicate a good fit (Byrne, 2001, p, 85) and higher up to 0.10 can
indicate average fit (Chen, Kwok, and Goodson, 2008) but above a value of 0.10, the fit
is said to be poor (Byrne, 2001, p, 89).
CFI ranges from zero to one (Byrne, 2001). Researchers consider Comparative fit index
(CFI) ≥ 0.90 indicate adequate fit (Chau, 1997; Chen et al., 2008; Cheng, 2007;
Cleveland, Laroche, and Papadopoulos, 2009). Adjusted goodness-of-fit index (AGFI)
≥ 0.80 indicates good fit (Cheng, 2007, Chau, 1997). With reference to CMIN/df < 3
indicate good fit (Cheng, 2007; Byrne 2001; Chau, 1997). Tucker-Lewis index (TLI) >
0.89 indicate adequate fit (Loibl, cho, Diekmann, and Batte, 2009). Finally, IFI ≥ 0.90
can consider good model fit (Lai, 2009).
Notes for the Model
Table 3.13
Computation of degree of freedom (Default Model)
Number of distinct sample moments
820
Number of distinct parameter to be estimated
107
Degree of freedom (820-107)
713
158
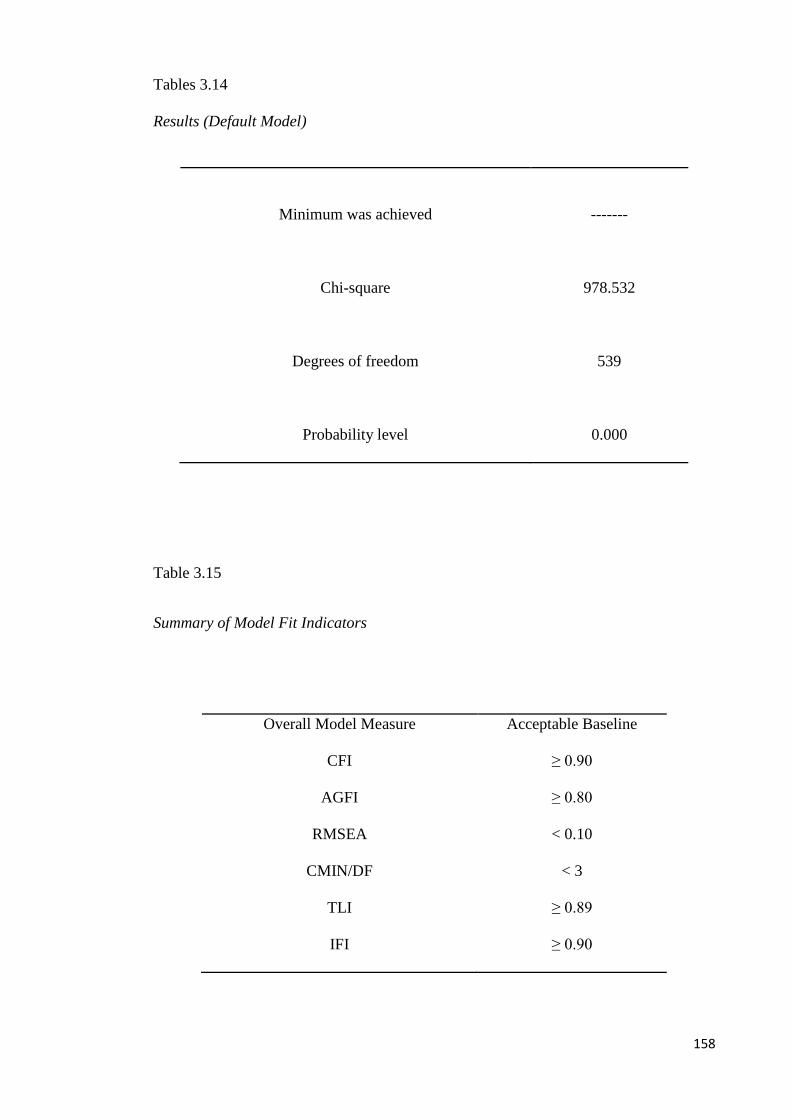
Tables 3.14
Results (Default Model)
Minimum was achieved
-------
Chi-square
978.532
Degrees of freedom
539
Probability level
0.000
Table 3.15
Summary of Model Fit Indicators
Overall Model Measure Acceptable Baseline
CFI ≥ 0.90
AGFI ≥ 0.80
RMSEA < 0.10
CMIN/DF < 3
TLI ≥ 0.89
IFI ≥ 0.90
159
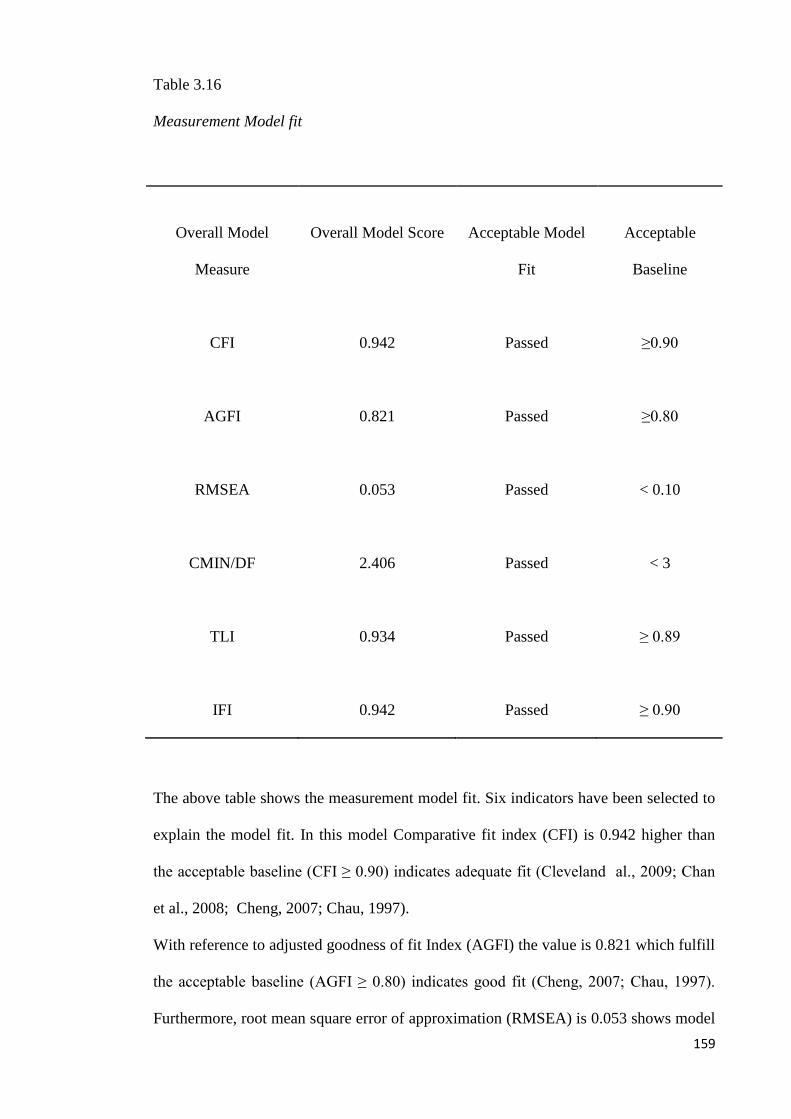
Table 3.16
Measurement Model fit
Overall Model
Measure
Overall Model Score
Acceptable Model
Fit
Acceptable
Baseline
CFI
0.942
Passed
≥0.90
AGFI
0.821
Passed
≥0.80
RMSEA
0.053
Passed
< 0.10
CMIN/DF
2.406
Passed
< 3
TLI
0.934
Passed
≥ 0.89
IFI
0.942
Passed
≥ 0.90
The above table shows the measurement model fit. Six indicators have been selected to
explain the model fit. In this model Comparative fit index (CFI) is 0.942 higher than
the acceptable baseline (CFI ≥ 0.90) indicates adequate fit (Cleveland al., 2009; Chan
et al., 2008; Cheng, 2007; Chau, 1997).
With reference to adjusted goodness of fit Index (AGFI) the value is 0.821 which fulfill
the acceptable baseline (AGFI ≥ 0.80) indicates good fit (Cheng, 2007; Chau, 1997).
Furthermore, root mean square error of approximation (RMSEA) is 0.053 shows model

160
fit value which should be less than 0.05 indicate a good fit (Byrne, 2001, p, 85) and
higher up to 0.10 can indicate average fit (Chen et al., 2008) but above a value of 0.10,
the fit is said to be poor (Byrne, 2001, p, 89). The chi-square/degree of freedom
(CMIN/d.f) is 2.406 also indicate good fit CMIN/df < 3 (Cheng, 2007; Byrne 2001;
Chau, 1997). In addition, Tucker-Lewis Index (TLI) is 0.934 indicate adequate fit
(Loibl et al., 2009). Finally, IFI is 0.942 which also consider adequate fit (Lai; 2009).
3.18 Research Methodology and Positivist Approach
Structural Equation Modeling (SEM) is used to test our effectiveness of training model.
Structural Equation Modeling (SEM) is a most reliable technique to test the
effectiveness of the model. SEM refers to quantitative approach. Positivist approach
towards management research is generally associated with quantitative method. Balu
and Scott (1963) argued that in order for knowledge or organizational phenomena to be
expanded, researchers should collect quantitative data from large-scale studies rather
than individual cases. While debate rages between these two established academics, it
appears that positivism retains its dominant status.
Van (1995) argued that management researchers tend to narrow the scope of their
research to a set of inflexible hypotheses. Paul (1995) argued that the process of
searching and finding laws in management research is reduced to a random process of
getting as high as possible the coefficient of determination values, r2. He further quoted
an example of a group of economists who did not care about their implausibility of
their assumptions so long as their r2 values are high. Hogan, Joyce and Roberts (1996)
argued that the focus of management research has become very narrow that
propositions being tested do not reflect the complexities in reality. Consequently,
management research findings only apply to narrow circumstances. Therefore, in order

161
to validate management theory, it has to be contextual. As a result, there is a trend
towards an interpretative approach in management research. Mitroff and Pondy (1978)
argued that management research‟s aim is to fit their theories to one objective reality in
which management researchers presume exist. Although there has been an emphasis of
management research approach to be more scientific, some argued that it is too diverse.
Pfeffer (1994) suggested that in order to resolve this diversity problem, there is a need
for methodological consensus and technical certainty.
Figure 3.2 : Proposed Framework
Situational Factors
Environmental
Factors
Transfer
Motivation
Training Design Factors
Affective
Reaction
Individual Factors
Training
Transfer
Supervisor Support
Peer Support
Transfer Design
Perceived Content
Validity
Performance Self-Efficacy
Learner Readiness
Training Retention
Instrumentality
or Intrinsic
rewards

162
3.19 Summary
Chapter 3 describes the methodology used to test the model. By testing this model and
the relationships between variables, this study will provide clear insight to the human
resource development professionals, trainers and training managers about the factors
effecting transfer of training in Malaysian Banking sector. The result of this study
would be helpful for trainers to develop better and effective training program and
maximize training transfer.
The research methodology for the study included a quantitative research design and
population of employees in 24 bank branches. The unit of analysis was employees in
Malaysian banking sector. The survey instrument which was consisted on 45 statements
was used to collect the data from 24 bank branches. To analysis the data the researcher
has used structural equation modeling (SEM) technique with Amos-16 and SPSS 16.
To test the reliability of the instrument, the researcher has conducted the pilot study
with 60 employees in banking sector. Finally, the data is analyzed and result is
interpreted. The result of the data is reported in chapter IV.