Embed Size (px)
Citation preview
38
CHAPTER 3
RESEARCH METHODOLOGY
3.0 Introduction
This chapter covers the research methodology that was used to test the hypotheses
generated from the research framework and elaborate research design under taken to
study the responses of Malaysian public listed companies to the IFRS convergence. This
study was carried out using questionnaire survey in order to investigate the key drivers
and internal barriers that impact the adoption of IFRS. The survey method of research
enables this study to identify external drivers that influence the preparedness of
companies for IFRS convergence by drawing upon institutional theory perspectives as
well as examine internal barriers that may impede the implementation of IFRS from the
resource-based view.
This chapter is organized as follows: Section 3.1 outlines the research design. Section
3.2 presents research framework and follow by Section 3.3 focuses on the hypotheses
development. Section 3.4 details measurements of research variables. Section 3.5
discusses sampling design and data collection procedures. Section 3.6 identifies unit of
analysis. Section 3.7 shows measurement development. Section 3.8 presents
administration of questionnaire. Section 3.9 focuses on data analyses procedures.
Section 3.10 summarizes what was achieved from this chapter.

39
3.1 Research Design
Research design is clarified by Cooper and Emory (1995) as, first, to have a detailed
plan that includes the selection of sources and types of information that used to answer
the research questions of the study. Second, it aims to investigate the relationship
between the variables, and thirdly, it is used to specify methods and procedures for
collecting and analyzing the data collected.
For this study, the research strategy used is a quantitative approach, which is also
referring to a positivism paradigm. Positivism is an approach to social research that
seeks to apply the natural science model of research to investigation of social
phenomena and explanation of the social context (Denscombe, 2003). This approach is
used in this study to investigate the drivers and barriers that affect the preparedness of
companies for IFRS convergence.
3.2 Research Framework
Based on the literatures that presented in Chapter 2, a research framework has been
developed. The framework for this study seeks to investigate the key drivers and internal
barriers that influence the preparedness of companies for the full convergence with
IFRS. The framework is shown in Figure 3.2. The institutional theory is employed to
identify the key drivers that influence the adoption of IFRS. Meanwhile, internal barriers
that impede the implementation of IFRS are developed through the lens of resource-
based view.
40
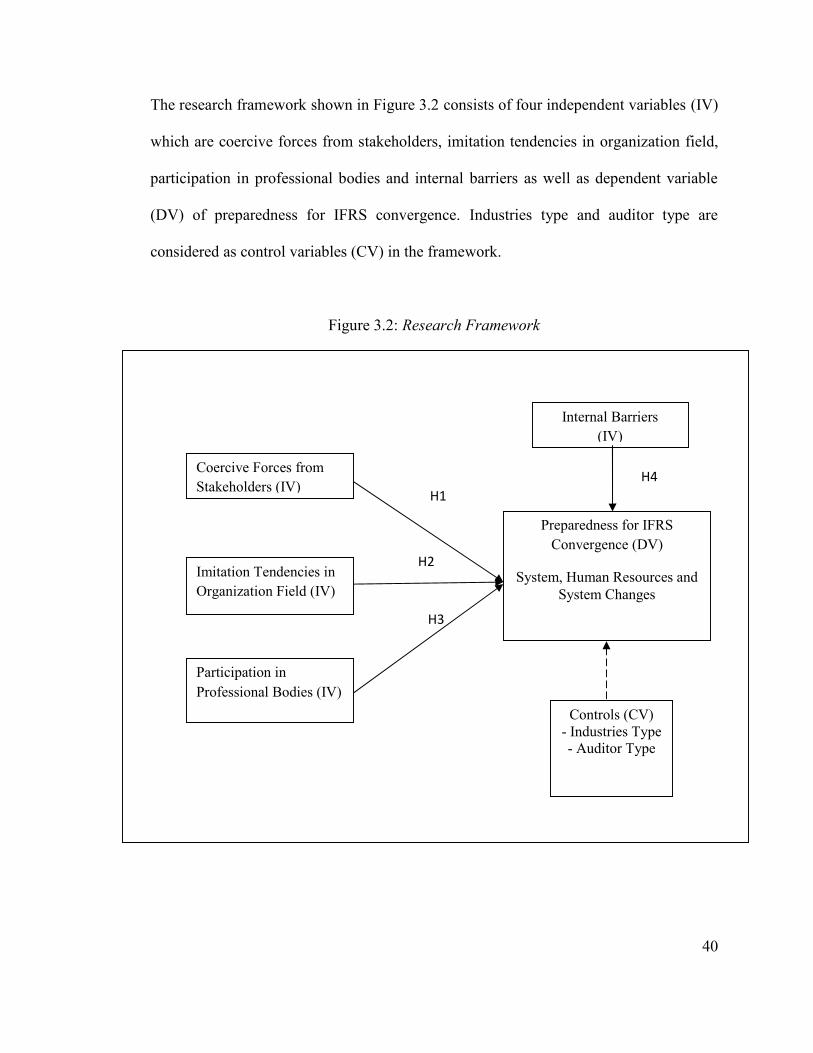
The research framework shown in Figure 3.2 consists of four independent variables (IV)
which are coercive forces from stakeholders, imitation tendencies in organization field,
participation in professional bodies and internal barriers as well as dependent variable
(DV) of preparedness for IFRS convergence. Industries type and auditor type are
considered as control variables (CV) in the framework.
Figure 3.2: Research Framework
Preparedness for IFRSConvergence (DV)
System, Human Resources andSystem Changes
Coercive Forces fromStakeholders (IV)
Participation inProfessional Bodies (IV)
Internal Barriers(IV)
Imitation Tendencies inOrganization Field (IV)
H1
H2
H4
Controls (CV)- Industries Type- Auditor Type
H3

41
3.3 Hypothesis Development
Saunders et al. (2009) defines a hypothesis as a testable proposition about the
relationship between two or more events or concepts. By testing the hypotheses and
confirming the conjectured relationships, it is expected that solutions can be provided to
answer the problem encountered (Cavana et al., 2001). Therefore, the following
hypotheses that shown in Figure 3.2 are developed as follows:
H1 There is a positive association between coercive forces from stakeholders and the
preparedness of companies for IFRS convergence.
H2 There is a positive association between imitation tendencies of companies in
organization field and the preparedness of companies for IFRS convergence.
H3 There is a positive association between the participation in accounting
professional bodies and the preparedness of companies for IFRS convergence.
H4 There is a negative association between internal barriers and the preparedness of
companies for IFRS convergence.
3.4 Measurement of Research Variables
The research instrument was designed after an exhaustive literature review of different
studies that provide the basis ground to develop appropriate measurement scales of
variables to be used in this study.
42
3.4.1 Dependent Variable
In the absence of prior researches for the preparedness of companies for convergence
with IFRS, the measurement of the scale was guided by the empirical studies done by
Guerreiro et al. (2008) to investigate the preparedness of Portuguese companies to adopt
IFRS and a number of survey studies done in EU and Canada (PwC, 2004 and CFERF,
2010). The extent of preparedness of companies to adopt IFRS was measured by nine
measurement items and five-point Likert-type scale was used that range from ‘1’
(Strongly Disagree) to ‘5’ (Strongly Agree) shown in Section 1 of the questionnaire
survey form.
3.4.2 Independent Variables
The independent variables consist of key drivers that influence the IFRS adoption. These
variables were adapted according to coercive, mimetic and normative pressures that
derived from institutional theory. These variables include internal barriers faced by
companies to adopt IFRS. Items for key drives were designed for response using a five-
point Likert-type scale, that was, ‘1’= Strongly Disagree to ‘5’= Strongly Agree.
Meanwhile, internal barriers were measured by five-point scale from ‘1’= Not at all to
‘5’= Greater Extent (See Table 3.4 for the details of measurement items and
questionnaire survey form in Appendix E).
3.4.3 Control Variables
Industry type is considered as one of the control variables in this study on the ground
that plantation industry, real-estate industry and finance institutes are most likely to be
43
affected by the new IFRS standards effective in 2012 onwards. This variable equals 1 if
the companies belong to plantation industry, real-estate industry and finance institutes
and 0 otherwise. Lastly, for the types of auditor, the influence of auditor type is assessed
by a dummy variable taking the value ‘1’ when the company is audited by a Big 4 audit
firm and ‘0’ otherwise.
44
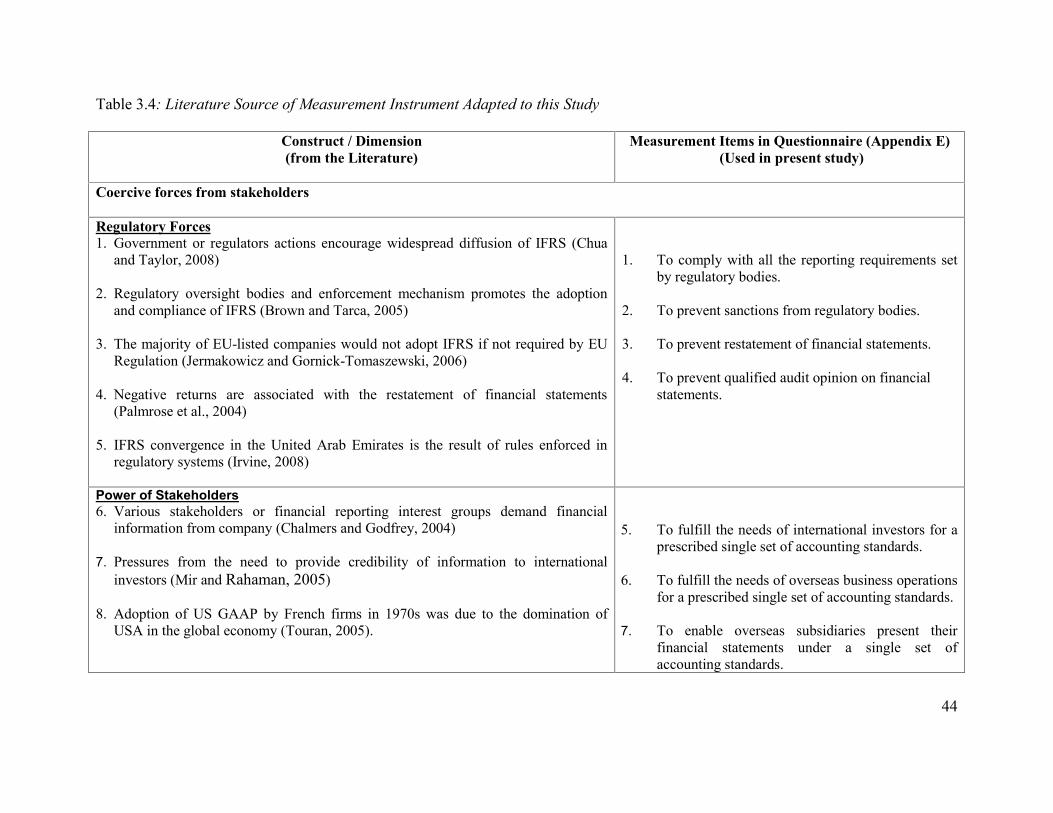
Table 3.4: Literature Source of Measurement Instrument Adapted to this Study
Construct / Dimension(from the Literature)
Measurement Items in Questionnaire (Appendix E)(Used in present study)
Coercive forces from stakeholders
Regulatory Forces1. Government or regulators actions encourage widespread diffusion of IFRS (Chua
and Taylor, 2008)
2. Regulatory oversight bodies and enforcement mechanism promotes the adoptionand compliance of IFRS (Brown and Tarca, 2005)
3. The majority of EU-listed companies would not adopt IFRS if not required by EURegulation (Jermakowicz and Gornick-Tomaszewski, 2006)
4. Negative returns are associated with the restatement of financial statements(Palmrose et al., 2004)
5. IFRS convergence in the United Arab Emirates is the result of rules enforced inregulatory systems (Irvine, 2008)
1. To comply with all the reporting requirements setby regulatory bodies.
2. To prevent sanctions from regulatory bodies.
3. To prevent restatement of financial statements.
4. To prevent qualified audit opinion on financialstatements.
Power of Stakeholders6. Various stakeholders or financial reporting interest groups demand financial
information from company (Chalmers and Godfrey, 2004)
7. Pressures from the need to provide credibility of information to internationalinvestors (Mir and Rahaman, 2005)
8. Adoption of US GAAP by French firms in 1970s was due to the domination ofUSA in the global economy (Touran, 2005).
5. To fulfill the needs of international investors for aprescribed single set of accounting standards.
6. To fulfill the needs of overseas business operationsfor a prescribed single set of accounting standards.
7. To enable overseas subsidiaries present theirfinancial statements under a single set ofaccounting standards.
45
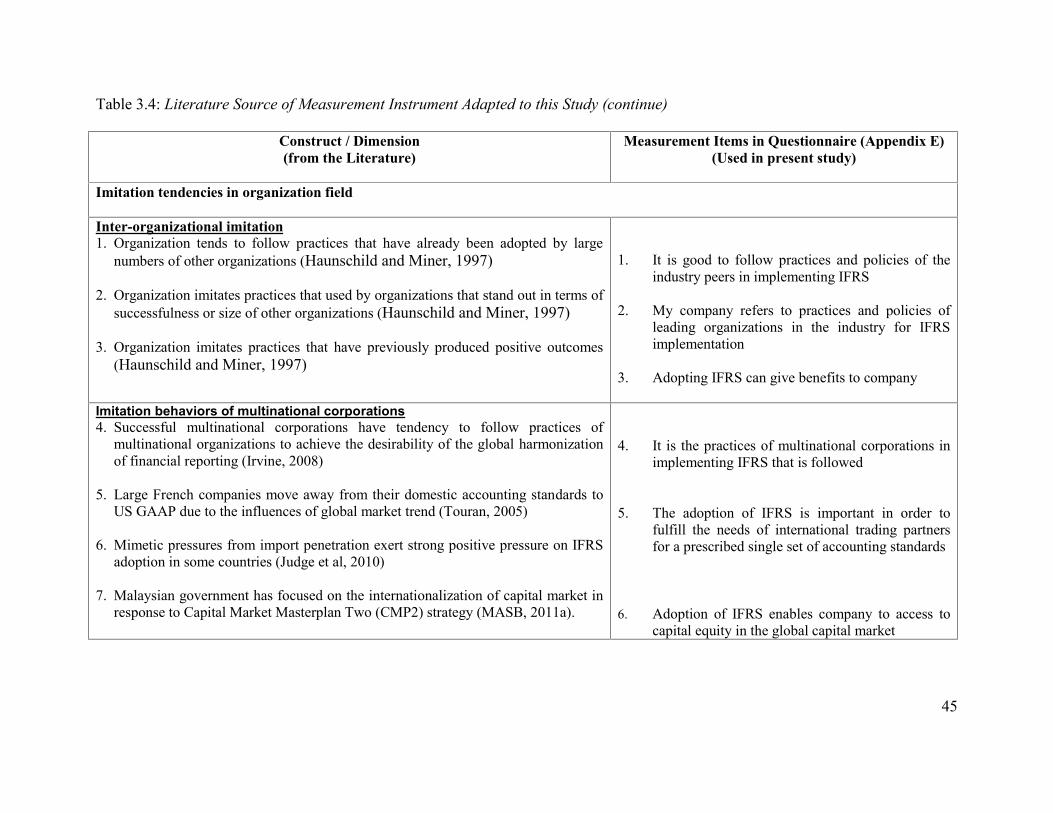
Table 3.4: Literature Source of Measurement Instrument Adapted to this Study (continue)
Construct / Dimension(from the Literature)
Measurement Items in Questionnaire (Appendix E)(Used in present study)
Imitation tendencies in organization field
Inter-organizational imitation1. Organization tends to follow practices that have already been adopted by large
numbers of other organizations (Haunschild and Miner, 1997)
2. Organization imitates practices that used by organizations that stand out in terms ofsuccessfulness or size of other organizations (Haunschild and Miner, 1997)
3. Organization imitates practices that have previously produced positive outcomes(Haunschild and Miner, 1997)
1. It is good to follow practices and policies of theindustry peers in implementing IFRS
2. My company refers to practices and policies ofleading organizations in the industry for IFRSimplementation
3. Adopting IFRS can give benefits to company
Imitation behaviors of multinational corporations4. Successful multinational corporations have tendency to follow practices of
multinational organizations to achieve the desirability of the global harmonizationof financial reporting (Irvine, 2008)
5. Large French companies move away from their domestic accounting standards toUS GAAP due to the influences of global market trend (Touran, 2005)
6. Mimetic pressures from import penetration exert strong positive pressure on IFRSadoption in some countries (Judge et al, 2010)
7. Malaysian government has focused on the internationalization of capital market inresponse to Capital Market Masterplan Two (CMP2) strategy (MASB, 2011a).
4. It is the practices of multinational corporations inimplementing IFRS that is followed
5. The adoption of IFRS is important in order tofulfill the needs of international trading partnersfor a prescribed single set of accounting standards
6. Adoption of IFRS enables company to access tocapital equity in the global capital market
46
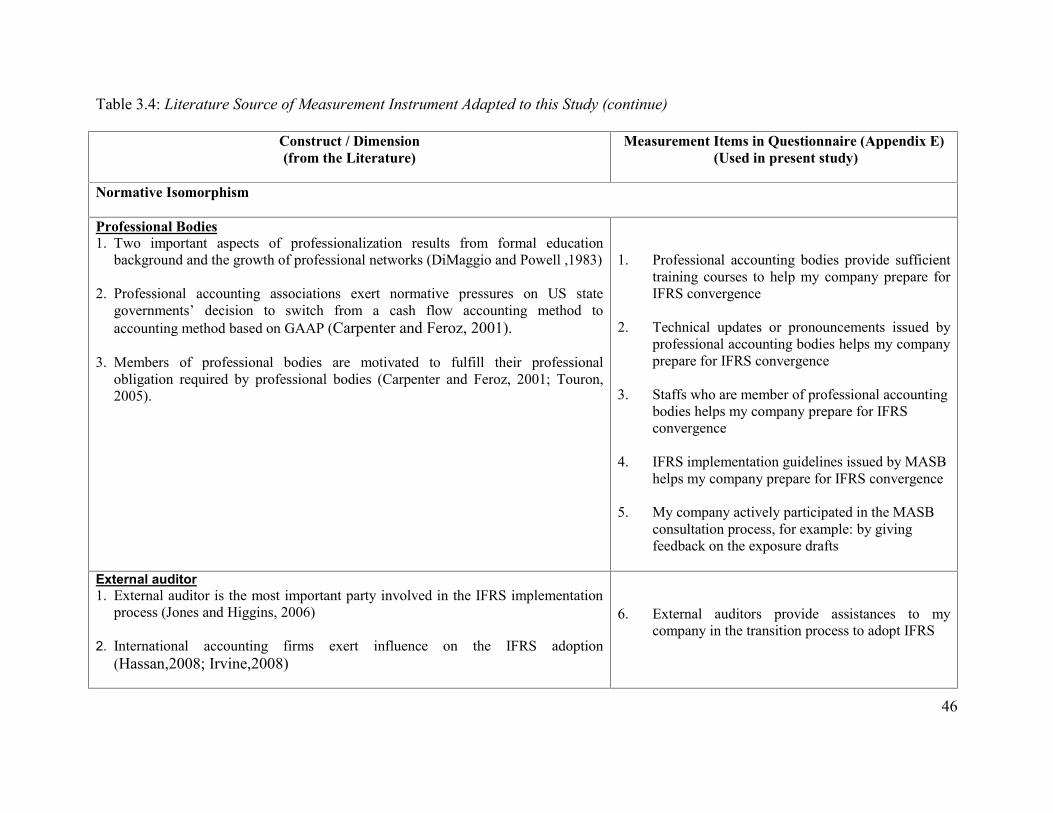
Table 3.4: Literature Source of Measurement Instrument Adapted to this Study (continue)
Construct / Dimension(from the Literature)
Measurement Items in Questionnaire (Appendix E)(Used in present study)
Normative Isomorphism
Professional Bodies1. Two important aspects of professionalization results from formal education
background and the growth of professional networks (DiMaggio and Powell ,1983)
2. Professional accounting associations exert normative pressures on US stategovernments’ decision to switch from a cash flow accounting method toaccounting method based on GAAP (Carpenter and Feroz, 2001).
3. Members of professional bodies are motivated to fulfill their professionalobligation required by professional bodies (Carpenter and Feroz, 2001; Touron,2005).
1. Professional accounting bodies provide sufficienttraining courses to help my company prepare forIFRS convergence
2. Technical updates or pronouncements issued byprofessional accounting bodies helps my companyprepare for IFRS convergence
3. Staffs who are member of professional accountingbodies helps my company prepare for IFRSconvergence
4. IFRS implementation guidelines issued by MASBhelps my company prepare for IFRS convergence
5. My company actively participated in the MASBconsultation process, for example: by givingfeedback on the exposure drafts
External auditor1. External auditor is the most important party involved in the IFRS implementation
process (Jones and Higgins, 2006)
2. International accounting firms exert influence on the IFRS adoption(Hassan,2008; Irvine,2008)
6. External auditors provide assistances to mycompany in the transition process to adopt IFRS
47
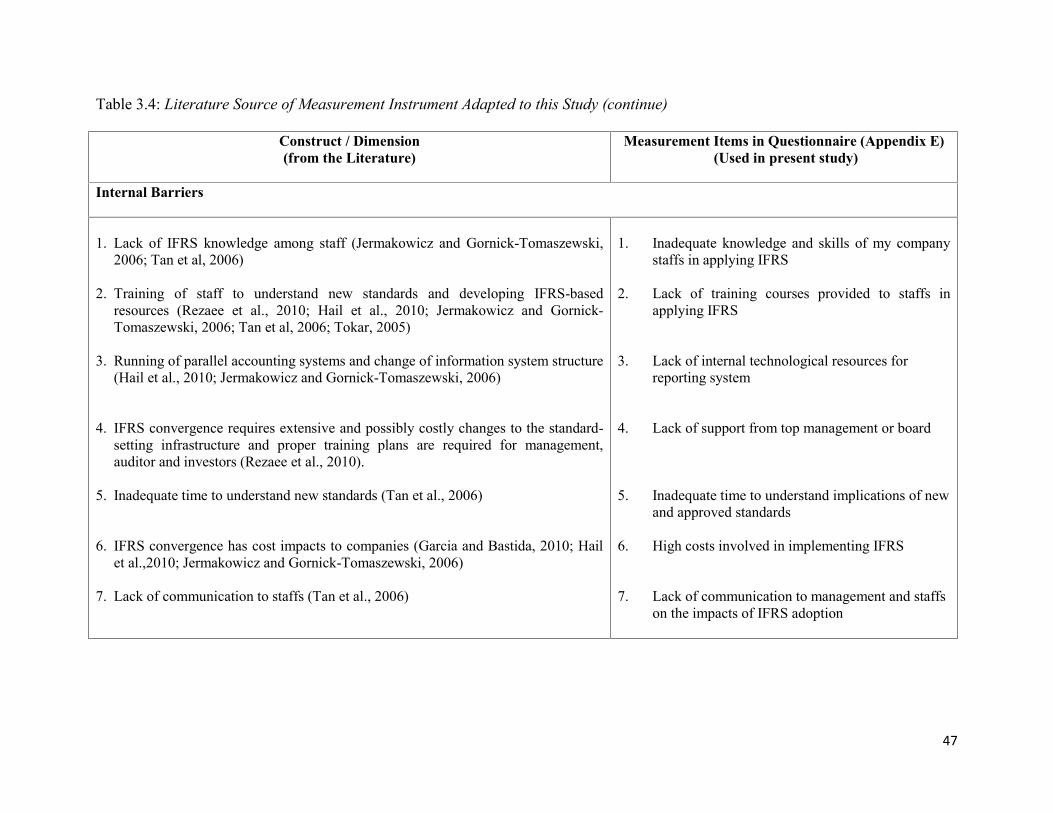
Table 3.4: Literature Source of Measurement Instrument Adapted to this Study (continue)
Construct / Dimension(from the Literature)
Measurement Items in Questionnaire (Appendix E)(Used in present study)
Internal Barriers
1. Lack of IFRS knowledge among staff (Jermakowicz and Gornick-Tomaszewski,2006; Tan et al, 2006)
2. Training of staff to understand new standards and developing IFRS-basedresources (Rezaee et al., 2010; Hail et al., 2010; Jermakowicz and Gornick-Tomaszewski, 2006; Tan et al, 2006; Tokar, 2005)
3. Running of parallel accounting systems and change of information system structure(Hail et al., 2010; Jermakowicz and Gornick-Tomaszewski, 2006)
4. IFRS convergence requires extensive and possibly costly changes to the standard-setting infrastructure and proper training plans are required for management,auditor and investors (Rezaee et al., 2010).
5. Inadequate time to understand new standards (Tan et al., 2006)
6. IFRS convergence has cost impacts to companies (Garcia and Bastida, 2010; Hailet al.,2010; Jermakowicz and Gornick-Tomaszewski, 2006)
7. Lack of communication to staffs (Tan et al., 2006)
1. Inadequate knowledge and skills of my companystaffs in applying IFRS
2. Lack of training courses provided to staffs inapplying IFRS
3. Lack of internal technological resources forreporting system
4. Lack of support from top management or board
5. Inadequate time to understand implications of newand approved standards
6. High costs involved in implementing IFRS
7. Lack of communication to management and staffson the impacts of IFRS adoption
48
3.5 Sampling Design and Data Collection Procedures
This study uses questionnaire to collect the data. In general term, questionnaire includes
all techniques of data collection in which each person is asked to respond to the same set
of questions in a predetermined order (De Vaus., 2002). Further, questionnaire is
essentially a measurement tool as well as an instrument to collect particular kinds of
data (Oppenheim, 2004). For this study, mail questionnaire is used to collect data as it
enables the survey reaches a large random sample of a population at a relatively low
cost. It also provides the respondents with a feeling of anonymity and less pressure to
answer the questionnaire (Cavana et al., 2001).
The sample size for this study comprises of all the companies totaling 859 companies
that listed on the Main Market of Bursa Malaysia. The list of all the companies that
listed on the Main Market of Bursa Malaysia was obtained from the Bursa Malaysia
website on 1 July 2011 (Bursa Malaysia, 2011). All these selected companies come from
various sectors, such as services, manufacturing, financial institutions and agriculture
and they are located all over the West and East Malaysia.
3.6 Unit of Analysis
The unit of analysis is basically where information about the study is collected. It
describes the characteristics of level of analysis of the study (De Vaus, 2002). The level
of analysis can be organizations, departments, work groups, dyads, individuals or
objects (Zinkmund, 2000).
49
Overall, full convergence with IFRS will have much impact on the publicly accountable
entity in Malaysia. MASB ED 75 states that entities that meet the definition of publicly
accountable entity are mandated to comply the IFRS-complaint FRS framework.
Specific examples of publicly accountable entity are also provided. On the other hand,
private entity that does not fulfill the meanings of a publicly accountable entity has the
option to either apply PERS or the IFRS-complaint FRS framework. In this regards,
companies listed on the Bursa Malaysia that meet the definition of publicly accountable
entity are selected as the unit of analysis in this study.
The questionnaires were sent through postal mail, to the Financial Controllers, Chief
Accountants or Head of Finance/Accounts Department as they are presumed to be
directly involved with the adoption process of IFRS in their respective companies and
have better understanding and wide knowledge on IFRS.
3.7 Measurement Development
This section covers questionnaire design, content and structure and sequencing of
questionnaires as well as pre-testing.
3.7.1 Questionnaire Design
From the literature review, established measures from related theories were incorporated
in the questionnaire. These measures represents constructs of the study that affect the
preparedness of companies for full convergence with IFRS, such as coercive, mimetic
and normative isomorphism that derived from institutional theory as well as internal

50
barriers faced by companies to implement IFRS from the resource-based view. The
questions in the survey were adapted from previous empirical studies and mainly
complemented by additional self-constructed items developed from literature review
(See Table 3.4 for the details of measurement items).
The questionnaire consisted of seven pages and cover page with university letter head
was allocated to explain the objectives of the study, contact details and assurance on the
confidentiality of the information provided. All the questions were arranged neatly and
enough space was provided to differentiate between them. Topics of questionnaire were
divided into few sections and parts. The questionnaires were also pre-coded to enable
non-respondents to be traced and followed-up subsequently. Please refer to Appendix E
on the questionnaire of the study.
3.7.2 Pre testing
In order to minimize measurement error, pre-testing was carried out. Every effort was
taken to produce an instrument that can help to meet the research objectives. According
to Oppenheim (2004), questionnaires have to be developed, tested and improved several
times before it can be sent out. One of the significant processes to refine the
questionnaire is undertaking pilot works. Although piloting may be costly, it can help to
improve the wording of questions, the sequencing of questions or even some procedural
matters such as cover letter of introduction (Oppenheim, 2004).

51
For the purpose of this study, the pilot questionnaire was distributed through email to
academics, audit practitioner and finance or account managers for comments on layout,
wording and content. This is critical to make sure that the questions asked are
understood and relevant to the Malaysian context. One academic from accounting field
in university, two audit practitioners, four finance or account managers and one English
lecturer responded in the pre testing.
Overall, from the feedback received, most of the respondents had a favorable response
to the questions, structure and design of questionnaire. There were some suggestions for
the wording and the scaling used. It also takes them between 15-20 minutes to respond
to the questionnaire. Considering the respondents’ views and comments, preliminary
draft of the questionnaire was discussed and edited for its clarity, applicability and
content validity. In addition, all unclear words and sentences highlighted during the pre-
testing stage were also addressed accordingly
3.8 Questionnaire Administration
Questionnaire administration is important to gain access to sample and attempt to
maximize response rate (Saunders et al., 2009). In order to increase the response rate,
respondents’ personal details had been identified specifically through phone call to all
the 859 companies listed on Bursa Malaysia such as their full name and designation. In
addition, the address of the companies was obtained from their respective annual report
and web site. These steps are necessary to make sure that the questionnaire has a better
52
chance of being opened and read if it is addressed to the respondent personally
(Oppenheim, 2004).
An official University of Malaya envelope was used in mail survey. It was anticipated
that the emblem and official address would reassure respondents on the significant of
study and looks more professional (Dillman, 1991; Oppenheim, 2004). A stamped and
self-addressed returned envelope was also included with the questionnaire.
Respondent’s name and their respective department in the company were shown clearly
on the envelope. This was done for the intention to minimize the respondents’ effort in
returning the questionnaire and encourage them to respond to the survey (De Vaus,
2002).
The questionnaires began to be posted in the last week of September 2011 in
anticipation of the festive mood and the overload of mails at the post office because of
the Hari Raya Aidil Fitri celebration in August 2011. Respondents were given two
weeks to respond to the questionnaire. The timing of data collection process should be
completed within acceptable time period because if too much time elapses in collecting
data, much might change during the time interval (Sekaran, 2003). In order to encourage
participation and increase the respond rate, a reminder letter together with the
questionnaire survey form were posted to respondents who had not replied on the survey
in the forth week of October 2011.

53
Of 859 questionnaires sent out, a total of 150 questionnaires were returned. After data
cleaning and checking for outliers, no response was discarded in this study. Thus, the
150 responses were used in the data analysis of this study contributing a usable response
rate of 17.46%. This response rate is low but common in Malaysia as managers are
typically reluctant to participate in mail survey. This response rate is normal in the case
of Malaysian environment and roughly comparable with those similar research surveys.
3.9 Data Analysis Procedures
In order to achieve the objectives of this study and test the hypotheses, Statistical
Package for Social Science (SPSS) 16.0 was used to analyze the collected data. This
study conducted the following data analysis.
3.9.1 Pre-Analysis Data Screening
Preliminary analyses were undertaken to ensure there is no violation of the assumptions
of normality and regression test. Normality test was performed to determine whether the
variables are normally distributed, to remove extreme outliers and also to determine
whether parametric or non-parametric test can be used in this study. Such normality test
normally includes Skewness and Kurtois, M-Estimators and Box-Plot analysis (Coakes
et al., 2010).
In regard to regression test, testing of assumptions were performed to ensure that the
data fit for regression analysis without any assumption violation. Those assumptions
include the following (Coakes et al., 2010; Pallant, 2007):
54
1. Ratio of cases to independent variables - the number of cases needed for regression
model should have desired level of 15 to 20 observations for each independent
variable. A general rule is that the minimum ratio of observations to independent
variables should never fall below of 5: 1 (Hair et al., 2010).
2. Normality, linearity and homoscedasticity - Residual scatter plot and residual normal
plot were used to analyze these assumptions
3. Multicollinearity and auto-correlation - the assumptions here are the independent
variables must not be highly correlated to avoid multicollinearity and there is no auto-
correlation whereby the observations or values are independent.
4. Multivariate outlier - extreme cases that have impact on the regression solution should
be deleted or modified to reduce their influence.
3.9.2 Descriptive Statistic Analysis
To better understand the characteristics of the sample profile of responding firms,
descriptive statistics analysis is performed. In addition, descriptive statistic analysis
illustrates the mean and standard deviation for each external drivers and internal barriers
that impact the preparedness of companies for IFRS convergence.
3.9.3 Factor Analysis
The objective of factor analysis is to reduce the research data and recap essential
information related to the variables (Hair et al., 2010). Factor analysis is commonly used
by researchers as an exploratory technique to summarize the structure of a set of
research variables (Coakes et al., 2010). Factor analysis has two common methods,

55
namely common factor analysis and principal components analysis (PCA). In this study,
PCA was adopted. Factor analysis is performed separately according to the categories of
dependent variable, independent variables and control variables. KMO value and
Bartlett’s test of Sphericity were first examined to ensure data sets are appropriate for
factor analysis, and then follow by determining number of components extracted by
using Kaisen’s criterion that have an eigenvalue exceeding 1 or above.
3.9.4 Reliability Analysis
Reliability analysis is necessary in the measurement scales. Generally, reliability
analysis is carried out to examine the extent to which the items in the questionnaire are
correlated to each other and an overall index of internal consistency of the whole can be
obtained, and item with low internal consistency should be deleted from the scale that
could be identified (Cavana et al., 2001). This is frequently measured by Cronbach's
coefficient alpha which is based on the average correlation of items within the test if the
items are standardized. According to Pallat (2005, p.90), "ideally, the Cronbach's alpha
coefficient of a scale should be above 0.7."
3.9.5 Hypothesis testing
Since all the hypotheses were formulated in the form of exploring relationships among
variables, both correlation and multiple regression analyses were performed to test the
hypotheses. Correlation analysis is used to describe the strength and direction of the
linear relationship between two variables. Meanwhile, multiple regressions can establish
that a set of independent variables explain a proportion of the variance in a dependent
56
variable at a significant level (significant test of R square), and can establish the relative
predictive importance of the independent variables (comparing beta weights) (Cavana et
al., 2001).
For this study, hierarchical multiple regression analysis is used to test the proposed
hypotheses on the constructs of the influences of external drivers and internal barriers on
the preparedness of companies for IFRS convergence whereas control variables were
included. The regression analysis will determine which key drivers influencing the
preparedness of companies for IFRS convergence and the impacts of internal barriers on
the implementation of IFRS. Moreover, regression analysis will indicate the degree of
impact of control variables on drivers and barriers that influence the adoption of IFRS.
3.10 Summary
This chapter presents the research methodology used in this study. First, research design
was discussed and the research framework and hypotheses to be tested were showed
accordingly. Secondly, the measurement of variables was explained in details. Thirdly,
sampling design and collection procedures was summarized. Fourthly, measurement
development of questionnaires that includes questionnaire design, pilot testing and
questionnaire administration were presented accordingly. Lastly, the appropriate
analyses techniques that include multiple regression analysis were identified. The
following chapter will discuss the findings of the analyses of data.