Embed Size (px)
Citation preview
Metro Nashville Long Range Paving Plan
3-1
CHAPTER 3 PAVEMENT MANAGEMENT DATA
3.1. PMS DATA REQUIREMENTS The key component to a quality PMS is quality data collection during the pavement
evaluation process. It is important that the data collected during each inspection can be compared with previous pavement inspections. Several methods for data collection are available. The methods selected should reflect the capabilities and goals of the pavement management program.
All pavement management programs should include a visual inspection of some type. A properly executed visual evaluation is one of the most reliable and efficient forms of pavement evaluation available. It is simple, inexpensive, and provides a great deal of valuable information about pavement condition. Visual inspection techniques range from informal drive-overs to formal methods such as the PCI or Long Term Pavement Performance methods. Larger transportation networks, like Metro's, tend to use the more formal systems. These systems, particularly PCI, provide a comprehensive record of pavement distresses at the time of the evaluation and are highly repeatable. Larger systems also tend to use image-based survey methods, which use a vehicle to collect film, video, or digital images of the pavement system. These images are then analyzed for the required distress data. An image-based assessment has the advantages in safety and speed of a drive-over survey without sacrificing the quality of a walking survey. The survey vehicles may also be used to collect additional data, such as roughness or right-of-way images, concurrently with the images.
Additional data are often collected to detect conditions not identifiable by visual inspection. The tests to collect these data are categorized into destructive, semi-destructive, and nondestructive testing.
Destructive testing is the traditional test method to determine physical pavement properties. Tests are conducted in test pits, samples are obtained from core borings, and laboratory tests are conducted on the samples. These tests have the advantage of examining actual in-service materials, however, they also have several disadvantages. Destructive tests are expensive, particularly considering the amount of testing necessary for a network-level survey and the fact that most properties determined by destructive testing change very little between surveys. Destructive testing can also have a significant impact on traffic.
Semi-destructive tests are tests that deploy a penetration device through a small-diameter hole. Common semi-destructive tests include the cone penetrometer and dynamic cone penetrometer. Semi-destructive tests typically characterize pavement layer and subgrade strength and moisture level. Although semi-destructive tests are typically faster and cheaper than destructive testing, they still require a small core or drill hole, and still affect traffic flow.
Several nondestructive alternative testing techniques are frequently used to allow examination of a considerably broader expanse of pavement than is practical with physical sampling. Among nondestructive testing techniques are ground penetration radar (GPR), seismic methods, impact and dynamic loading devices, friction measuring equipment, and roughness measuring devices. Each can provide valuable information of conditions, and each has certain
3-2 Metro Nashville Long Range Paving Plan
limitations. In practice, it is appropriate to select from available nondestructive techniques to fulfill specific investigative requirements.
A PMS also requires financial data to provide accurate results. The most import data of this type are the treatment costs. The best sources for cost data are the financial records of previous projects. If these are not available, bid tabs, quotes, and estimates can be used to determine the cost data. Financial data should be updated periodically, either by a simple inflation factor, or by recomputing unit costs based on projects completed since the last cost data update.
3.2. PAVEMENT DATA SELECTED FOR THE METRO PMS The Cartêgraph PAVEMENT view Plus software is capable of storing and analyzing
nearly any type of pavement data. Discussions with MPW personnel indicated that Metro is most interested in the surface condition, rutting, raveling, and ride quality of Metro pavements. A modified ASTM D6433 PCI survey was selected as the network level surface condition assessment procedure. The PCI method is well defined and is universally accepted and used. The PCI method also includes provisions to include rutting in the visual assessment. The International Roughness Index (IRI) was selected as the network-level ride quality measurement. IRI is determined by the absolute vertical travel of a standard wheel-and-spring system traveling at a standard speed over a pavement. IRI is typically calculated from non-contact profile measuring devices such as laser or acoustic profilometers.
Due to the various stresses applied and the dynamic properties of paved surfaces, pavement condition data have a limited life span, i.e., data collected quickly become out of date. Surface condition data are typically valid for two to three years. Profile data are valid for approximately one to two years. ARA recommends that each pavement segment in the Metro pavement system be surveyed for surface condition and ride quality every two years. Some high-traffic or high-profile areas may warrant annual inspection.
Data is generally of higher quality if a portion of the network is surveyed every year rather than waiting several years and surveying the entire network. Using this process keeps the data more up-to-date, and therefore more representative of the actual network conditions. It also allows Metro to flag problem areas that should be surveyed in sequential years due to rapid deterioration or other issues.
3.3. BENEFITS OF DIGITAL IMAGE-BASED DATA COLLECTION
Pavement condition data were collected using image-based survey procedures. In the past, manual surveys have been used by most agencies to collect pavement distress data. Manual surveys are labor and time intensive, and data reliability depends on training and rater performance. A number of studies have shown that manual ratings have high levels of variability with respect to rater repeatability as well as high rater-to-rater variability.
Image-based data collection systems produce permanent pavement surface images, offering the advantage of correlating rater analysis results for accuracy and repeatability. An additional advantage to using fixed images is the ability to re-calibrate raters who tend to drift from desired interpretations with time. Fixed images also provide a consistent calibration for new raters. The combination of establishing rater performance requirements and performing QC monitoring enables the production of the desired quality of data.
Metro Nashville Long Range Paving Plan
3-3
Image based data collection also provides a record of non-pavement assets, including but not limited to sidewalks, markings, and signs. These images can be made available to other areas of the Public Works Department to aid in planning and maintenance.
3.4. GIS UPDATES Metro Nashville uses GIS-centric processes to plan, communicate, and manage the
maintenance of its assets, including the publication of hardcopy and web-based maps to foster communication within Public Works and across the Metropolitan Government of Nashville - Davidson County, with consultants and other third-party organizations, and with the public at large. Aspects of the PMS process and the distress data that is collected as part of each year’s roadway survey are reflected onto Metro’s GIS-based roadway centerline data assets, where they are made available for use with other projects and programs within the government.
Specifically, each segment’s last-paved date and overall condition data (see discussion of OCI found later in this document) are made available to the GIS roadway centerline dataset. By virtue of the GIS updates, the last-paved date is made available to the greater Metro Nashville permitting suite, where it affects a fee that is levied at the time of permit request to help discourage and pay for the repair of cuts made into recently-paved sections of roadway. Another aspect of the GIS updates is the availability of the OCI and planned project type and IDs for each centerline segment — as well as the full extents of planned projects. This level of information is useful in coordinating projects across different departments (Water Services, ROW Maintenance) and related organizations (NES, TDOT), as well as in a variety of customer service and public relations situations.
The process for reflecting the pavement distress data (and other data stored within the PMS) onto the GIS resources is currently a database-intensive exercise that requires access to both “before” and “after” datasets from the PMS and the GIS. Since it is possible for the GIS data assets to change (e.g., through the splitting/intersection of a maintained segment to accommodate the recent addition of a new subdivision) between the time the data collection process begins and the time the updated PMS data is exported for use inside GIS, the distress data is always mapped to the “before” GIS resource as it stood when the data collection process began. Once that ”before” copy of the GIS data is updated (thereby maintaining a 1:1 relationship between segment IDs in the GIS data and the PMS data), GIS technicians use logical and spatial joins to isolate any affected records (e.g., “children” of the split “parent” segments from the example above) in the more current “after” centerline dataset and update those individually. The resulting dataset is the most recent version of the Metro enterprise roadway centerline dataset with current OCI values and pavement management project data for each segment that is accepted for maintenance.
The result of this GIS update process is that the Metro roadway distress data and the proposed project plans from the PMS can be displayed in a manner that helps stakeholders to visualize problems and their proposed solutions, as well as the “what-if” effects of applying various alternative treatments under varying levels of fiscal resources. While the GIS update process is detailed and time-consuming work in its current form, this process will become easier and faster as new server-based tools are developed and implemented. Considering the status of Metro’s movement toward the further deployment of server-based GIS tools, plans include the automation of the GIS update process through the eventual deployment of CartêGraph’s GEODATAconnect product and/or through the use of custom ESRI ArcGIS Server processes.

3-4 Metro Nashville Long Range Paving Plan
3.5. DATA COLLECTION PROCESS
3.5.1. Network Definition Before beginning the pavement evaluation survey, the Metro pavement network was
defined. Roads that Metro is not responsible for maintaining, including state, federal, and private roads, were removed from the network. The network was divided into routes based on street names. Routes were divided into segments based on four criteria:
• Block-to-block: Segments change at each intersection,
• Pavement change: Segments change at changes in pavement construction history,
• ½-mile: Segments are no longer than ½-mile in length,
• Paving groups: Segments must be entirely within one paving group.
These criteria resulted in a network containing 25,184 segments. Each segment was assigned to one of the five paving groups defined in Chapter 1.
3.5.2. Data Collection Vehicle A survey vehicle equipped with digital cameras was used to collect survey images, which
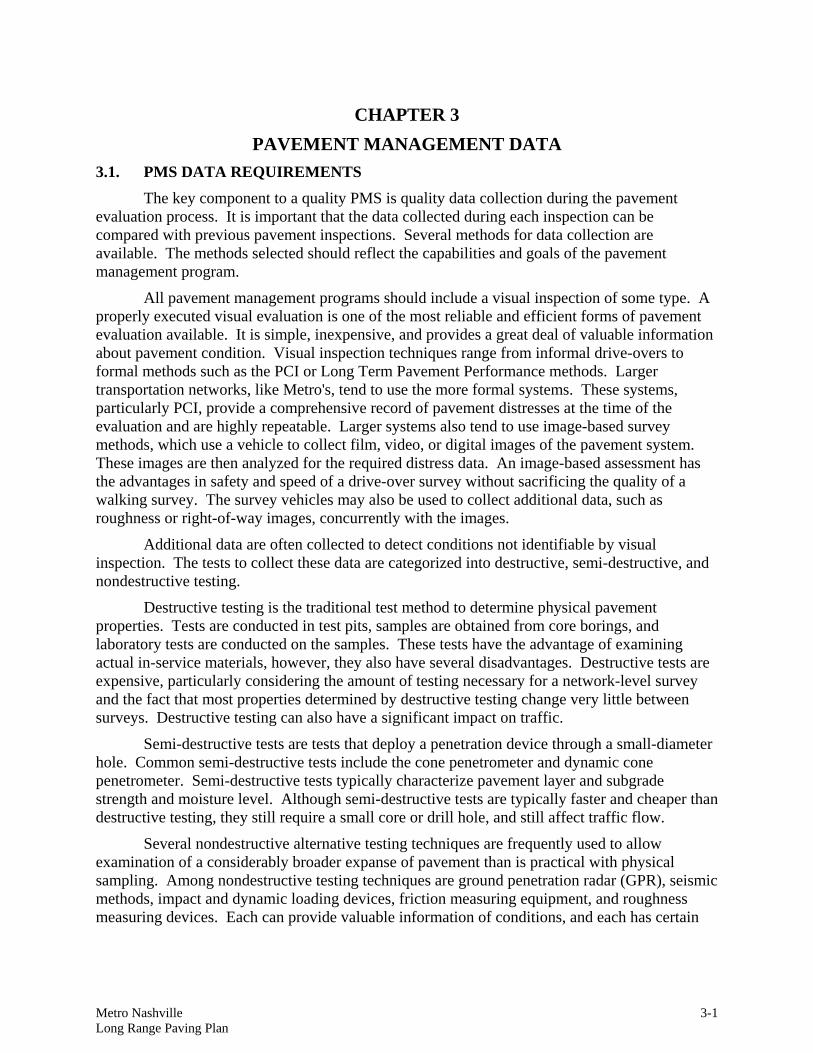
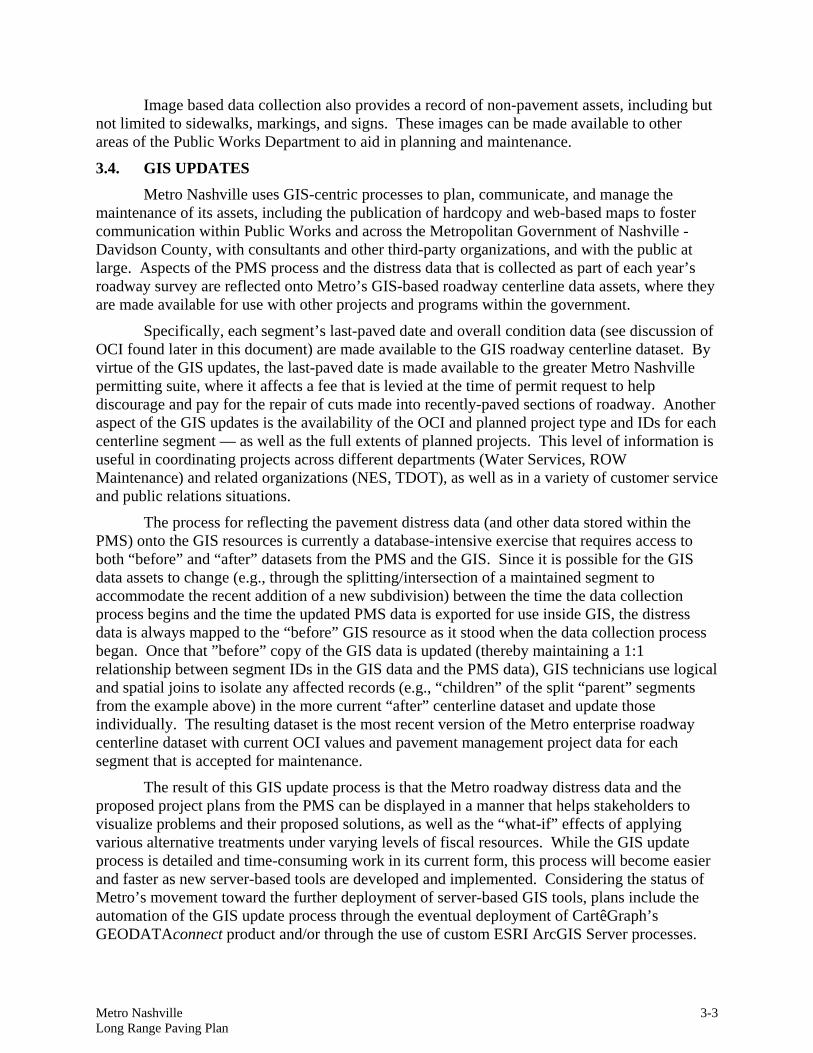
were analyzed for distress at specialized workstations. A laser profilometer mounted on the survey vehicle was used to collect pavement roughness (profile) data. The distress and profile data were then loaded into the pavement management software, and the images linked to pavement management segments. The van-mounted camera and profiler system is manufactured by International Cybernetics Corporation (ICC). This equipment simultaneously collects digital images of the pavement surface and right-of-way, longitudinal profile data (pavement roughness), and transverse profile data (rutting). Additionally, the vehicle is equipped with a differential global positioning system (GPS) receiver and an inertial navigation system capable of measuring the location of the vehicle and the images with sub-meter accuracy. The ARA digital survey vehicle (DSV) is shown in Figure 3.1. The survey system characteristics are summarized in Table 3.1.
Pavement images were collected using the vehicle-based digital imaging system consisting of Bassler 2,000-pixel digital line-scan camera, a computerized controller, and pavement illumination mounted on a van. The digital line scan camera is mounted on the rear of the vehicle and records continuous images with a width of survey of 14.5 feet (4.4 meters). Both wheel paths are included in the image. The computerized controller synchronizes the digital camera speed to the speed of the vehicle to record distresses as small as 1-mm in width at speeds of up to 50 MPH with controlled illumination. The pavement image is divided into 20-foot segments and stored in JPEG format on 40 GB removable hard drives. Each drive can hold enough images to cover over 150 lane-miles of survey.
Metro Nashville Long Range Paving Plan
3-5
Figure 3.1. Digital survey vehicle.
The pavement illumination system consists of ten 150W metal halide stage lights mounted on a custom framework on the rear of the DSV. The lights are fitted with specialized lenses that focus the light into a narrow band of intense illumination directly under the digital line scan camera. The illumination system ensures consistent lighting during the survey process, and mitigates the effects of cloudy days and shadows.
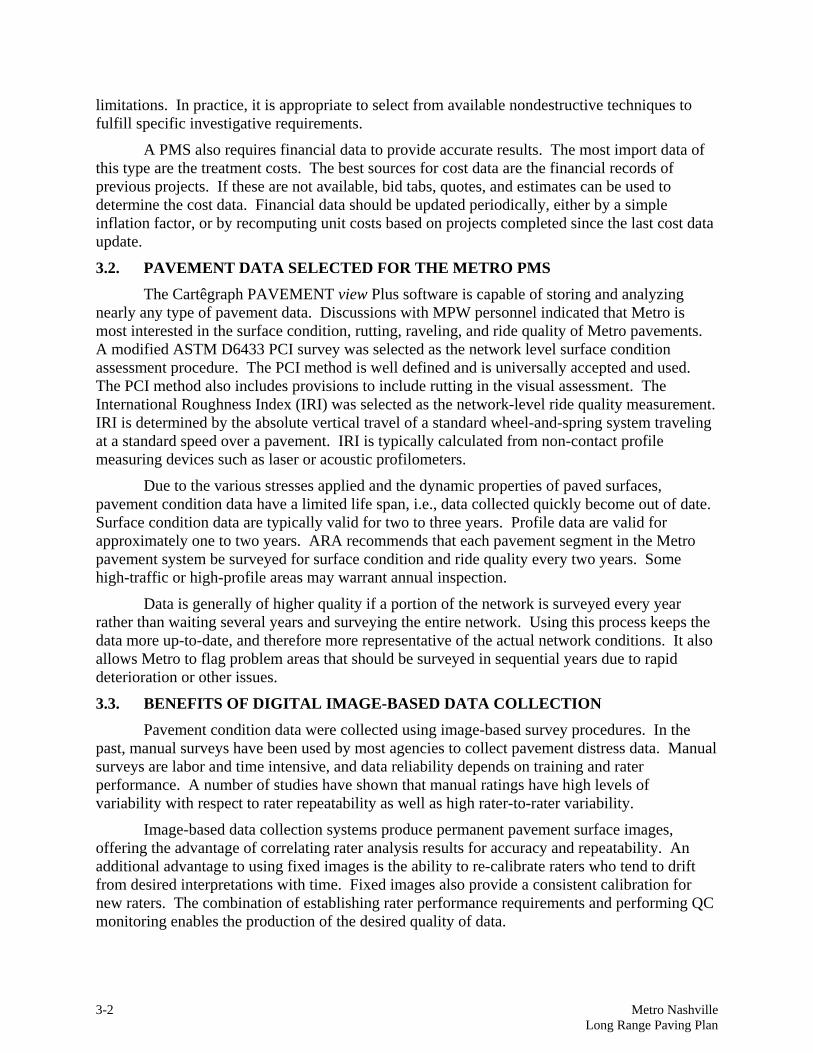
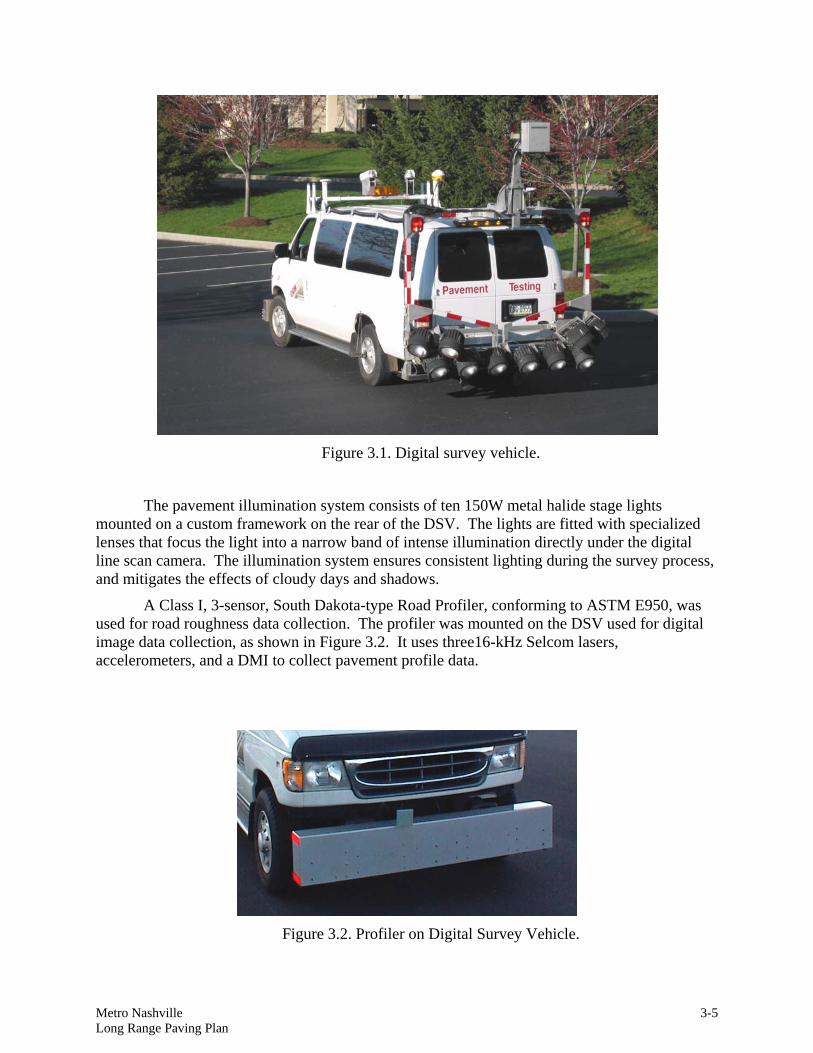
A Class I, 3-sensor, South Dakota-type Road Profiler, conforming to ASTM E950, was used for road roughness data collection. The profiler was mounted on the DSV used for digital image data collection, as shown in Figure 3.2. It uses three16-kHz Selcom lasers, accelerometers, and a DMI to collect pavement profile data.
Figure 3.2. Profiler on Digital Survey Vehicle.
3-6 Metro Nashville Long Range Paving Plan
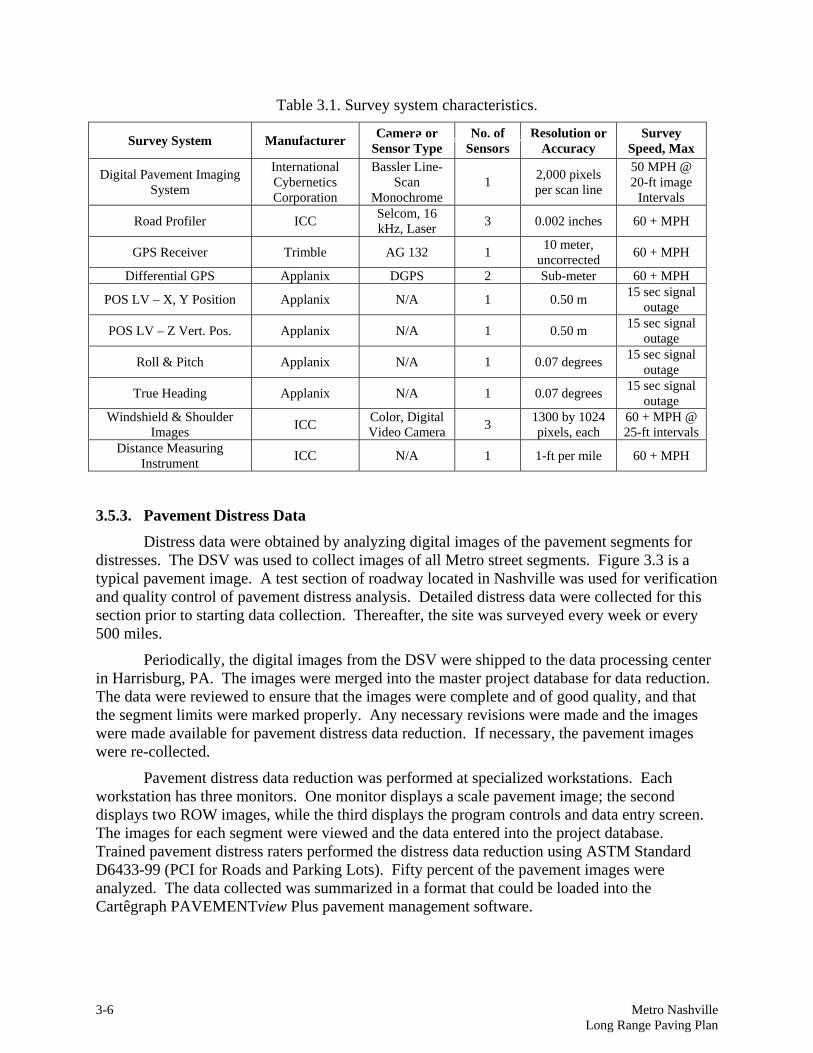
Table 3.1. Survey system characteristics.
Survey System Manufacturer Camera or Sensor Type
No. of Sensors
Resolution or Accuracy
Survey Speed, Max
Digital Pavement Imaging System
International Cybernetics Corporation
Bassler Line-Scan
Monochrome 1 2,000 pixels
per scan line
50 MPH @ 20-ft image
Intervals
Road Profiler ICC Selcom, 16 kHz, Laser 3 0.002 inches 60 + MPH
GPS Receiver Trimble AG 132 1 10 meter, uncorrected 60 + MPH
Differential GPS Applanix DGPS 2 Sub-meter 60 + MPH
POS LV – X, Y Position Applanix N/A 1 0.50 m 15 sec signal outage
POS LV – Z Vert. Pos. Applanix N/A 1 0.50 m 15 sec signal outage
Roll & Pitch Applanix N/A 1 0.07 degrees 15 sec signal outage
True Heading Applanix N/A 1 0.07 degrees 15 sec signal outage
Windshield & Shoulder Images ICC Color, Digital
Video Camera 3 1300 by 1024 pixels, each
60 + MPH @ 25-ft intervals
Distance Measuring Instrument ICC N/A 1 1-ft per mile 60 + MPH
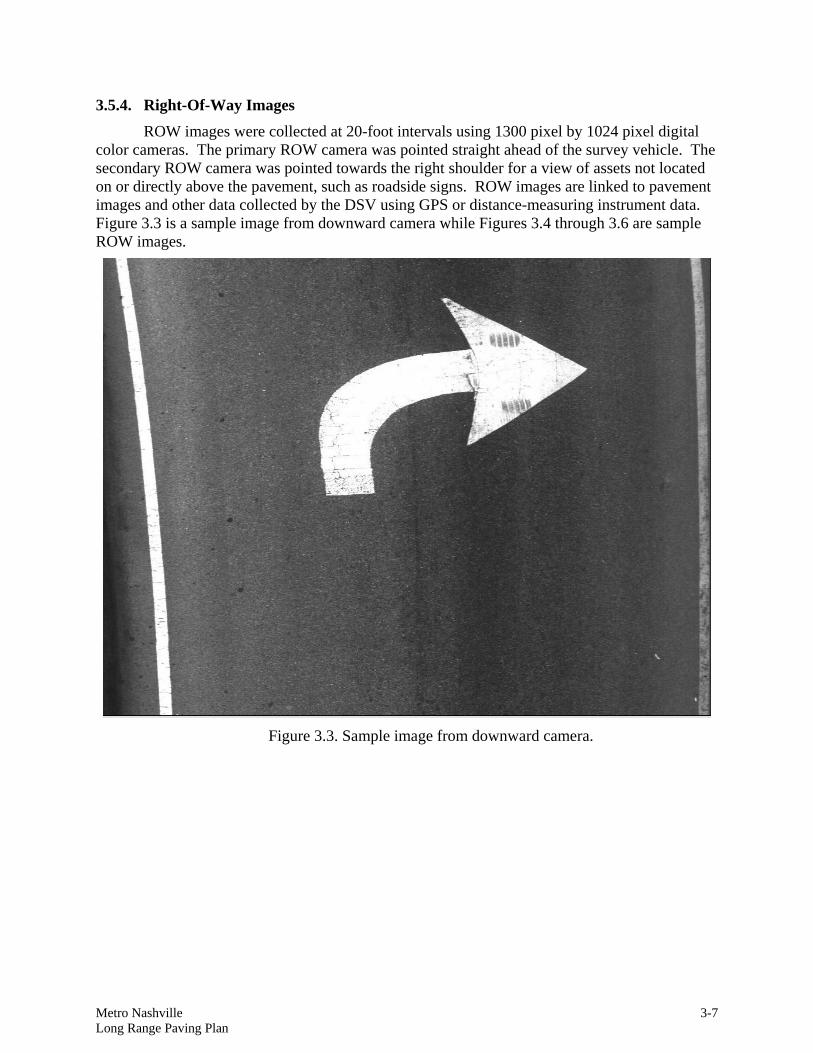
3.5.3. Pavement Distress Data Distress data were obtained by analyzing digital images of the pavement segments for
distresses. The DSV was used to collect images of all Metro street segments. Figure 3.3 is a typical pavement image. A test section of roadway located in Nashville was used for verification and quality control of pavement distress analysis. Detailed distress data were collected for this section prior to starting data collection. Thereafter, the site was surveyed every week or every 500 miles.
Periodically, the digital images from the DSV were shipped to the data processing center in Harrisburg, PA. The images were merged into the master project database for data reduction. The data were reviewed to ensure that the images were complete and of good quality, and that the segment limits were marked properly. Any necessary revisions were made and the images were made available for pavement distress data reduction. If necessary, the pavement images were re-collected.
Pavement distress data reduction was performed at specialized workstations. Each workstation has three monitors. One monitor displays a scale pavement image; the second displays two ROW images, while the third displays the program controls and data entry screen. The images for each segment were viewed and the data entered into the project database. Trained pavement distress raters performed the distress data reduction using ASTM Standard D6433-99 (PCI for Roads and Parking Lots). Fifty percent of the pavement images were analyzed. The data collected was summarized in a format that could be loaded into the Cartêgraph PAVEMENTview Plus pavement management software.
Asset Management Imaging System
Metro Nashville Long Range Paving Plan
3-7
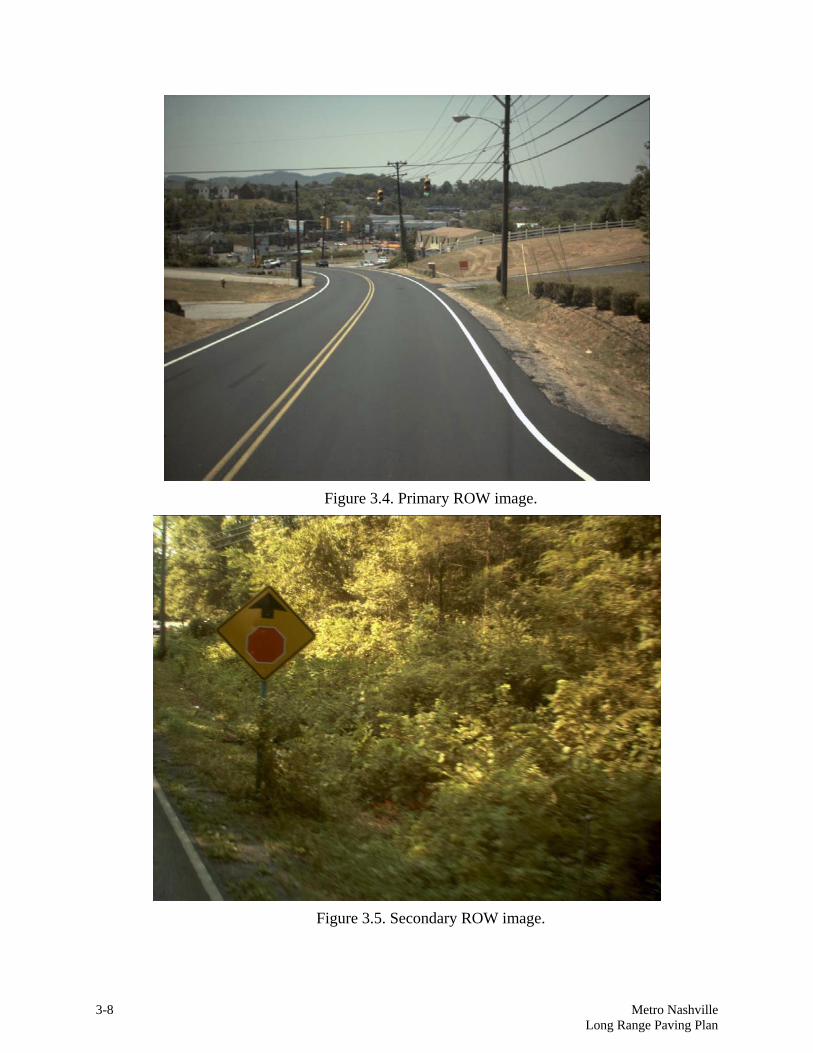
3.5.4. Right-Of-Way Images ROW images were collected at 20-foot intervals using 1300 pixel by 1024 pixel digital
color cameras. The primary ROW camera was pointed straight ahead of the survey vehicle. The secondary ROW camera was pointed towards the right shoulder for a view of assets not located on or directly above the pavement, such as roadside signs. ROW images are linked to pavement images and other data collected by the DSV using GPS or distance-measuring instrument data. Figure 3.3 is a sample image from downward camera while Figures 3.4 through 3.6 are sample ROW images.
Figure 3.3. Sample image from downward camera.
3-8 Metro Nashville Long Range Paving Plan
Figure 3.4. Primary ROW image.
Figure 3.5. Secondary ROW image.

Metro Nashville Long Range Paving Plan
3-9
Figure 3.6. Reverse ROW view image.
3.5.5. Road Roughness Data The International Roughness Index was calculated from the profile data. Rut depth was
also calculated by comparing profile data from each wheel path to the center sensor. Software simulates placing a straightedge across the wheel paths and measuring the rutting from this reference.
Profile measurements at were collected at intervals of approximately 3 inches. The laser sensors have a height resolution of 0.002 inches. The system uses the continuous 16-khz output of the lasers to determine the height points, a process that eliminates narrow cracks and openings from roughness calculations.
Industry standard reporting software, developed by ICC and UMTRI, were used to convert the sensor and accelerometer readings into longitudinal profiles and calculate IRI in accordance with ASTM E1926-98.
ARA data collection equipment is periodically calibrated at profiler validation sites in Harrisburg, PA. These sites are chosen and maintained by the Pennsylvania Department of Transportation. The sites have been selected by PennDOT to cover the range of roughness applicable to most highway systems. The profiler equipment traverses each site three times. The IRI for each run at each site is determined by using the software developed by ICC. These IRI values were averaged. The average IRI for each site was compared with the reference IRI for that site to verify accuracy. In addition, the IRI value for the individual runs of each site were compared with the average IRI of that site to verify repeatability. The internal QA accuracy requirement is +/- 5%.
3-10 Metro Nashville Long Range Paving Plan
A test site for roughness verification was also established in Nashville for quality control. The site was surveyed every week or every 500 miles. The results of each survey were compared with the initial reference values to verify accuracy and repeatability.
3.6. OVERALL CONDITION INDEX PMS software stores, sorts, and analyzes large amounts of many different types of data.
This data must be represented in a manner to allow human pavement managers compare the relative quality of pavement sections to make a decision about M&R and funding priorities. The overall condition index (OCI) is a single number representing the condition of a pavement section based on all the data available for that section. The Metro PMS is set up such that the OCI ranges from 0 to 100, with a 0 OCI indicating failed pavement and a 100 OCI indicating perfect pavement.
CartêGraph allows the user to combine several condition indices (cracking, rutting, surface distress, roughness, etc.) to calculate the OCI. Originally, the OCI defined for Metro was a combination of a surface distress rating and rideability. Surface distress was measured using the PCI methodology, which reflects surface condition, rutting, and structural cracking. Rideability was measured using the International Roughness Index (IRI), which reflects ride quality. Since IRI is measured in in/mi with smaller numbers representing a smoother ride and PCI is measured on a 0 to 100 scale with 100 representing a pavement with no distress, one of these measures had to be altered. Since OCI corresponded to a 0 (bad) to 100 (good) scale, IRI was normalized to the same scale. While the CartêGraph database used this normalized 0 to 100 rating for IRI in these calculations, the original value is also stored for later analysis, if necessary
OCI was calculated using a simple weighted average:
OCI=(0.80PCI)+(0.20IRIn)
where:
PCI is the segment PCI
IRIn is the normalized IRI (see Section 3.6.3)
This equation applies weighting factors to the PCI (80%) and IRI (20%) so that the OCI properly represents the impact of both indices on pavement performance and serviceability.
As it was implemented, Metro noted that there was a factor that was not accounted for in the OCI: the raveling on the road. This value is important because a raveled segment of pavement with limited amounts of other surface distresses can be treated inexpensively while significantly increasing the segment’s remaining life. Typically, raveling is considered a distress in the PCI methodology with a very high deduct value. In other words, in the professional opinion of Metro staff, entering raveling as a PCI distress would reduce the PCI and OCI by too much. It was determined that the best way to generate an OCI was to include raveling/weathering as a third term in the OCI calculation equation. More information regarding the measurement of raveling can be found in section 3.6.2.
Metro Nashville Long Range Paving Plan
3-11
A final modification to the OCI was made due to the method used to evaluate raveling: segments less than five years old may have incorrect raveling values if an open-graded asphalt mix was used to pave the segment. Based on this, the current equation for OCI is:
If Age < 5 or Rn is null:
OCI=(0.88PCI)+(0.12IRIn)
Otherwise:
OCI=(0.75PCI)+(0.10IRIn)+(0.15Rn)
where:
Age is the time since the last major rehabilitation
PCI is the segment PCI
IRIn is the normalized IRI according to Table 3.7
Rn is the normalized raveling according to Table 3.6
Deflection data has been used by the Metro to determine the structural integrity of the pavements, but this is very costly at the network level. Roads that carry heavy tractor-trailer vehicles may need periodic evaluation using deflection data. For most roads in the Metro network, deflection data is not warranted on a network level basis. Deflection data can be collected more cost effectively on a project level basis when the distress data indicates a possible structural deficiency.
3.6.1. Pavement Condition Index The PCI method is a distress based condition index, i.e., specific distresses in the
pavement are identified and tallied, and the type, severity, and extent of each distress is used to calculate a single number representing the pavement condition. This number is a composite value representing both structural integrity and serviceability, with higher numbers reflecting better pavement. A distress is any pavement condition that causes a loss of serviceability. Typical distresses include cracks, ruts, and bumps. ASTM D6433 defines 38 distinct distresses; 18 for AC pavements and 18 for PCC pavements as listed in Table 3.2. Most distresses have three severity levels defined by the standard: high, medium, and low.
3.6.1.1. Development of PCI Procedure The pavement condition index (PCI) method of rating the condition of both asphalt surfaced and concrete surfaced pavements originated with the U.S. Army Corps of Engineers. It has found widespread acceptance and implementation throughout the U.S. for roadway pavements at the state, county, and municipal levels. The procedure has been standardized in ASTM D6433.
The first step in calculating the pavement condition index (PCI) of a sample unit is to determine the distress density, which is the percent coverage of a distress. Density is determined by dividing the quantity of a distress by the size of the sample unit. The densities for each distress type are then used to obtain a deduct value for each distress. A deduct value is a number that reflects how much a distress degrades pavement performance. Charts for determining deduct values for each distress, as a function of distress type, severity level, and density, is
3-12 Metro Nashville Long Range Paving Plan
located in the appendix of ASTM D6433. Table 3.2 gives a list of the distress types that re defined in ASTM 6433 for both asphalt and concrete surfaced roads.
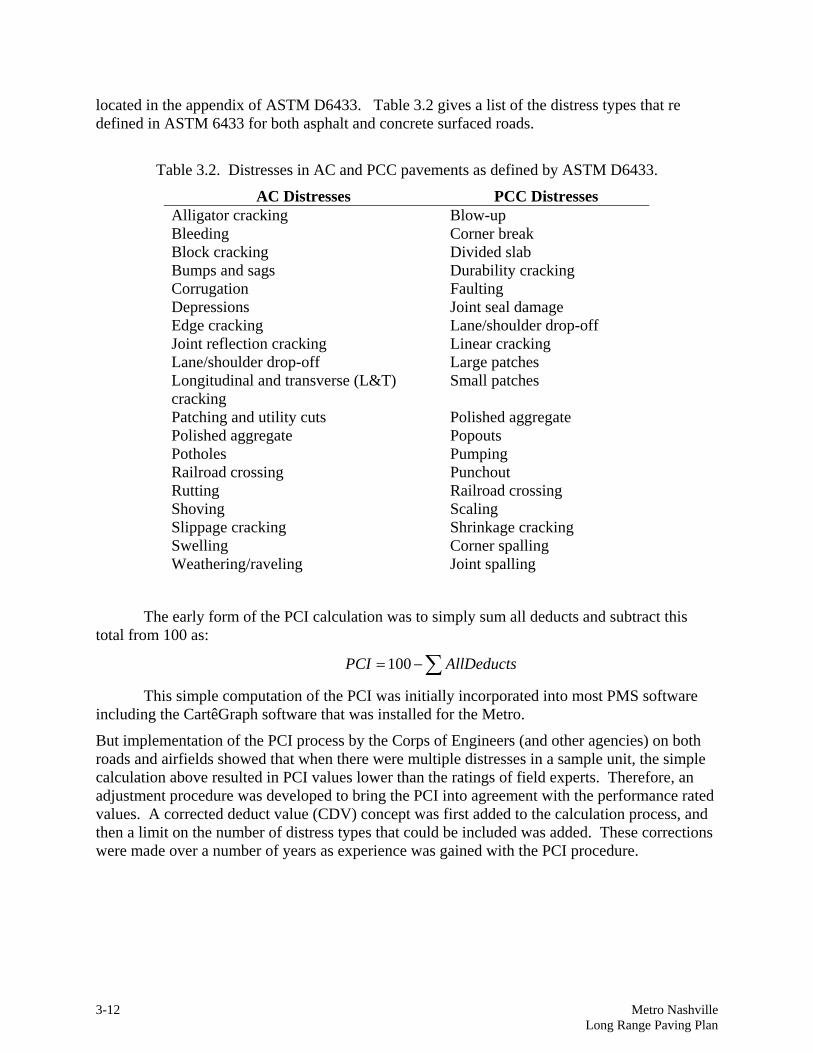
Table 3.2. Distresses in AC and PCC pavements as defined by ASTM D6433.
AC Distresses PCC Distresses Alligator cracking Blow-up Bleeding Corner break Block cracking Divided slab Bumps and sags Durability cracking Corrugation Faulting Depressions Joint seal damage Edge cracking Lane/shoulder drop-off Joint reflection cracking Linear cracking Lane/shoulder drop-off Large patches Longitudinal and transverse (L&T) cracking
Small patches
Patching and utility cuts Polished aggregate Polished aggregate Popouts Potholes Pumping Railroad crossing Punchout Rutting Railroad crossing Shoving Scaling Slippage cracking Shrinkage cracking Swelling Corner spalling Weathering/raveling Joint spalling
The early form of the PCI calculation was to simply sum all deducts and subtract this total from 100 as:
∑−= AllDeductsPCI 100
This simple computation of the PCI was initially incorporated into most PMS software including the CartêGraph software that was installed for the Metro.
But implementation of the PCI process by the Corps of Engineers (and other agencies) on both roads and airfields showed that when there were multiple distresses in a sample unit, the simple calculation above resulted in PCI values lower than the ratings of field experts. Therefore, an adjustment procedure was developed to bring the PCI into agreement with the performance rated values. A corrected deduct value (CDV) concept was first added to the calculation process, and then a limit on the number of distress types that could be included was added. These corrections were made over a number of years as experience was gained with the PCI procedure.
Metro Nashville Long Range Paving Plan
3-13
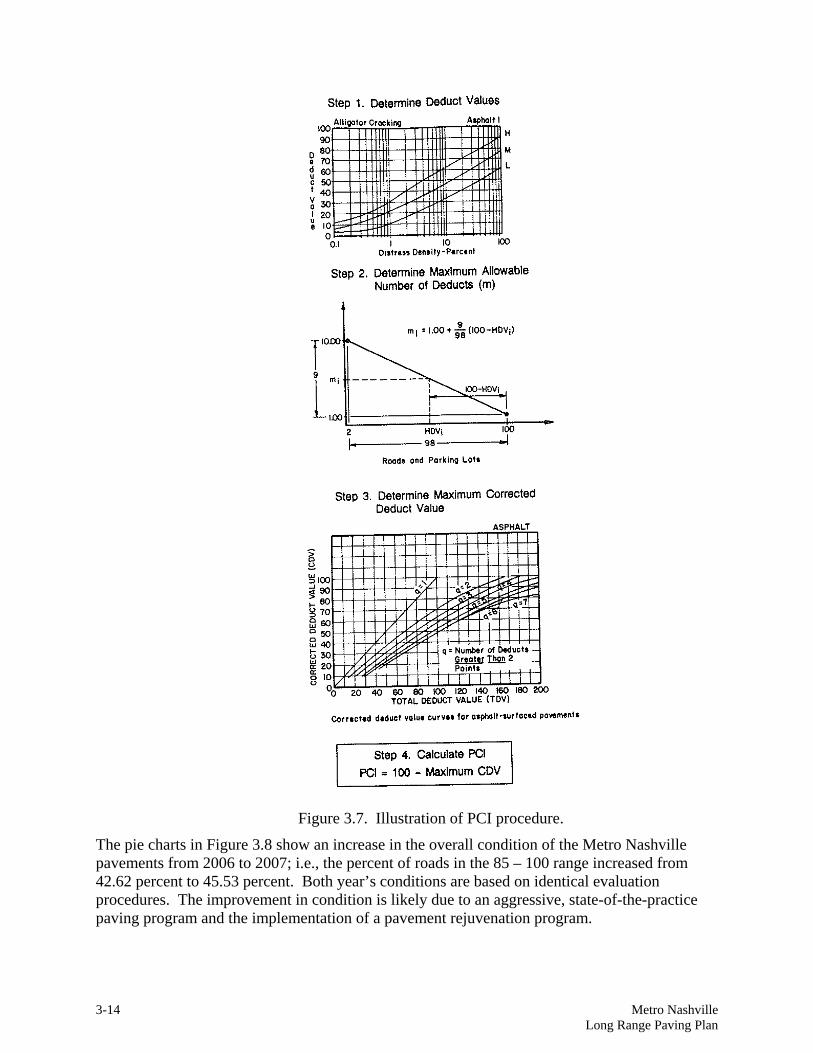
The equation below limits how many deducts can be applied to a sample unit during calculation of the PCI:
( )HDVm −+= 1009891
where:
m = number of allowable deduct values
HDV = highest individual deduct value
No more than ten deduct values may be applied to any given sample unit.
The deduct values are summed to determine the total deduct value, and the number of deduct values greater than two is counted and termed q. The total deduct value (TDV) and q are used to find the CDV from a chart. Then the lowest deduct value greater than two is changed to five and the process is repeated. This cycle continues until q = 1, that is, there is only one deduct value greater than two. The largest corrected deduct value is then subtracted from 100 to determine the PCI of the sample unit. The modified PCI procedure is illustrated in Figure 3.7.
The adjustments to the procedure result in a somewhat higher PCI value because some distresses are dropped from the calculation when there are multiple distresses present and the TDV is reduced to the CDV. The CDV correction had already been added to the CartêGraph software delivered to the Metro Nashville in 2004, and the limits on the number of deducts was added in early 2006.
3-14 Metro Nashville Long Range Paving Plan
Figure 3.7. Illustration of PCI procedure.
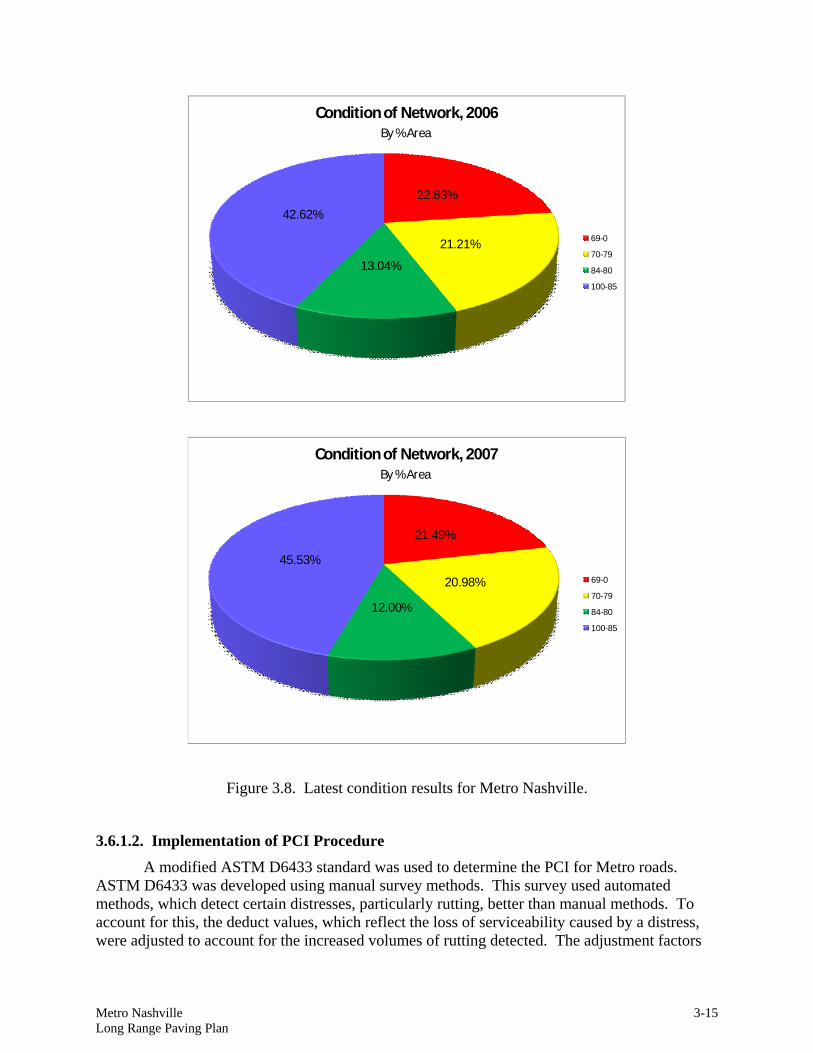
The pie charts in Figure 3.8 show an increase in the overall condition of the Metro Nashville pavements from 2006 to 2007; i.e., the percent of roads in the 85 – 100 range increased from 42.62 percent to 45.53 percent. Both year’s conditions are based on identical evaluation procedures. The improvement in condition is likely due to an aggressive, state-of-the-practice paving program and the implementation of a pavement rejuvenation program.
Metro Nashville Long Range Paving Plan
3-15
22.83%
21.21%
13.04%
42.62%
Condition of Network, 2006
69-0
70-79
84-80
100-85
By % Area
21.49%
20.98%
12.00%
45.53%
Condition of Network, 2007
69-0
70-79
84-80
100-85
By % Area
Figure 3.8. Latest condition results for Metro Nashville.
3.6.1.2. Implementation of PCI Procedure A modified ASTM D6433 standard was used to determine the PCI for Metro roads.
ASTM D6433 was developed using manual survey methods. This survey used automated methods, which detect certain distresses, particularly rutting, better than manual methods. To account for this, the deduct values, which reflect the loss of serviceability caused by a distress, were adjusted to account for the increased volumes of rutting detected. The adjustment factors
3-16 Metro Nashville Long Range Paving Plan
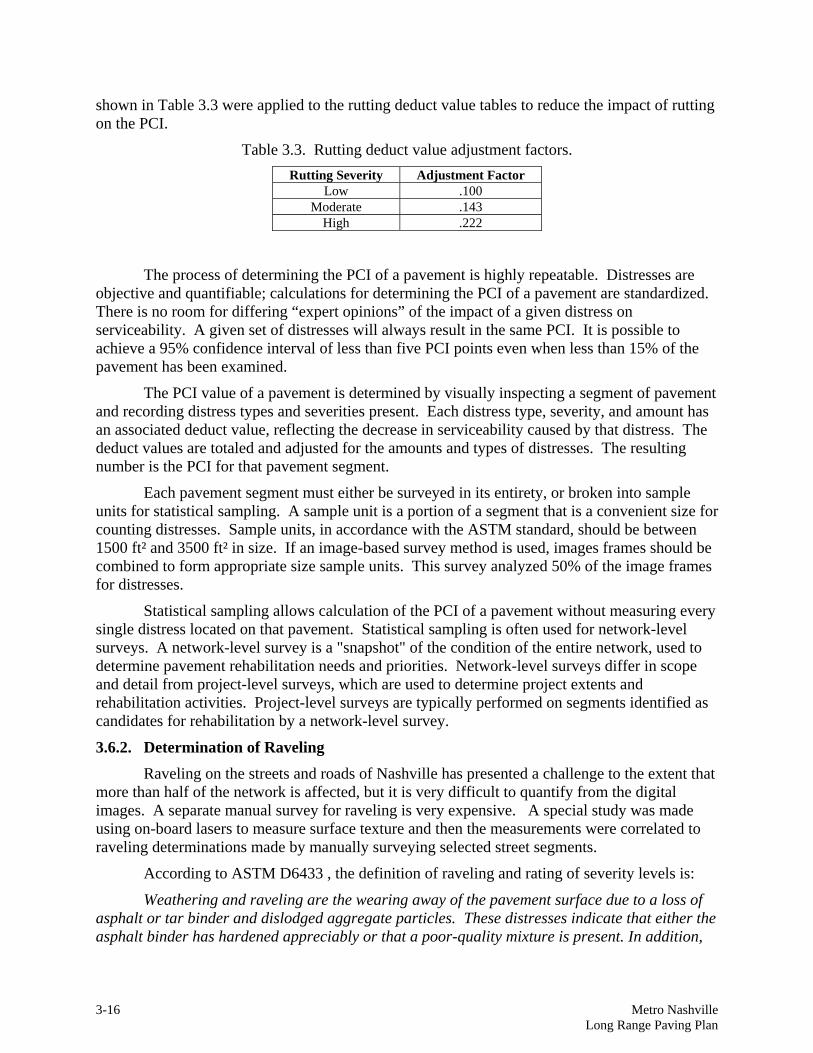
shown in Table 3.3 were applied to the rutting deduct value tables to reduce the impact of rutting on the PCI.
Table 3.3. Rutting deduct value adjustment factors. Rutting Severity Adjustment Factor
Low .100 Moderate .143
High .222
The process of determining the PCI of a pavement is highly repeatable. Distresses are objective and quantifiable; calculations for determining the PCI of a pavement are standardized. There is no room for differing “expert opinions” of the impact of a given distress on serviceability. A given set of distresses will always result in the same PCI. It is possible to achieve a 95% confidence interval of less than five PCI points even when less than 15% of the pavement has been examined.
The PCI value of a pavement is determined by visually inspecting a segment of pavement and recording distress types and severities present. Each distress type, severity, and amount has an associated deduct value, reflecting the decrease in serviceability caused by that distress. The deduct values are totaled and adjusted for the amounts and types of distresses. The resulting number is the PCI for that pavement segment.
Each pavement segment must either be surveyed in its entirety, or broken into sample units for statistical sampling. A sample unit is a portion of a segment that is a convenient size for counting distresses. Sample units, in accordance with the ASTM standard, should be between 1500 ft² and 3500 ft² in size. If an image-based survey method is used, images frames should be combined to form appropriate size sample units. This survey analyzed 50% of the image frames for distresses.
Statistical sampling allows calculation of the PCI of a pavement without measuring every single distress located on that pavement. Statistical sampling is often used for network-level surveys. A network-level survey is a "snapshot" of the condition of the entire network, used to determine pavement rehabilitation needs and priorities. Network-level surveys differ in scope and detail from project-level surveys, which are used to determine project extents and rehabilitation activities. Project-level surveys are typically performed on segments identified as candidates for rehabilitation by a network-level survey.
3.6.2. Determination of Raveling
Raveling on the streets and roads of Nashville has presented a challenge to the extent that more than half of the network is affected, but it is very difficult to quantify from the digital images. A separate manual survey for raveling is very expensive. A special study was made using on-board lasers to measure surface texture and then the measurements were correlated to raveling determinations made by manually surveying selected street segments.
According to ASTM D6433 , the definition of raveling and rating of severity levels is:
Weathering and raveling are the wearing away of the pavement surface due to a loss of asphalt or tar binder and dislodged aggregate particles. These distresses indicate that either the asphalt binder has hardened appreciably or that a poor-quality mixture is present. In addition,
Metro Nashville Long Range Paving Plan
3-17
raveling may be caused by certain types of traffic, for example, tracked vehicles. Softening of the surface and dislodging of the aggregates due to oil spillage also are included under raveling. Severity levels are defined as:
• Low - Aggregate or binder has started to wear away. In some areas, the surface is starting to pit. In the case of oil spillage, the oil stain can be seen, but the surface is hard and cannot be penetrated with a coin.
• Medium - Aggregate or binder has worn away. The surface texture is moderately rough and pitted. In the case of oil spillage, the surface is soft and can be penetrated with a coin.
• High - Aggregate or binder has been worn away considerably. The surface texture is very rough and severely pitted. The pitted areas are less than 10 mm (4 in.) in diameter and less than 13 mm (1⁄2 in.) deep; pitted areas larger than this are counted as potholes. In the case of oil spillage, the asphalt binder has lost its binding effect and the aggregate has become loose.
Identification of raveling from video images or by the data collection operator proved to be an inadequate procedure. Manual distress data collection using inspectors walking the roadway sections is time-consuming, costly, and unsafe.
The initial survey of the Metro network was made in 2004, with resurveys of parts of the network made in 2005 and 2006. The collection of raveling data with the automated survey method has not been satisfactory. Measurement of pavement texture using automated laser techniques was correlated to raveling.
The study to develop a correlation between texture and raveling was as follows:
1. Nashville personnel identified thirty-one (31) pavement sections that represent the full range of raveling expected. Consistent raveling within each section was also a criterion.
2. Nashville personnel quantified the severity and extent of raveling in each section. Two different personnel conducted independent manual “Foot on the Ground” evaluations at different times. The rating range for each section was none, low, or high. These values were considered ground truth.
3. The 31 sections were then evaluated with a 32-kHz laser sensor in the left wheel path to collect the macrotexture data. The data was summarized in 5-ft. intervals.
4. The method of analysis chosen was to determine the frequency distribution of the mean texture depth (MTD) values within each section and performed a correlation of MTD values at various percentiles with ground truth raveling values. Limiting MTD values for a determined percentile will be determined to identify the severity of raveling for each pavement section in Nashville’s highway network.
Criteria for determining the severity level of raveling in each pavement section was developed as follows:
1. The frequency distribution of the mean texture depth (MTD) values within each section was determined.
3-18 Metro Nashville Long Range Paving Plan
2. The MTD values at various percentiles were chosen for comparison to the ground truth raveling values for each test section.
3. Several limiting values of MTD for each percentile were chosen by inspection to determine none, low, and high severity raveling for each section.
4. Trial and error testing against the ground truth raveling values was performed to achieve the best percentile of MTD and the best Limiting Values.
5. The final step was to test the predicting MTD criteria against several hundred randomly selected pavement sections.
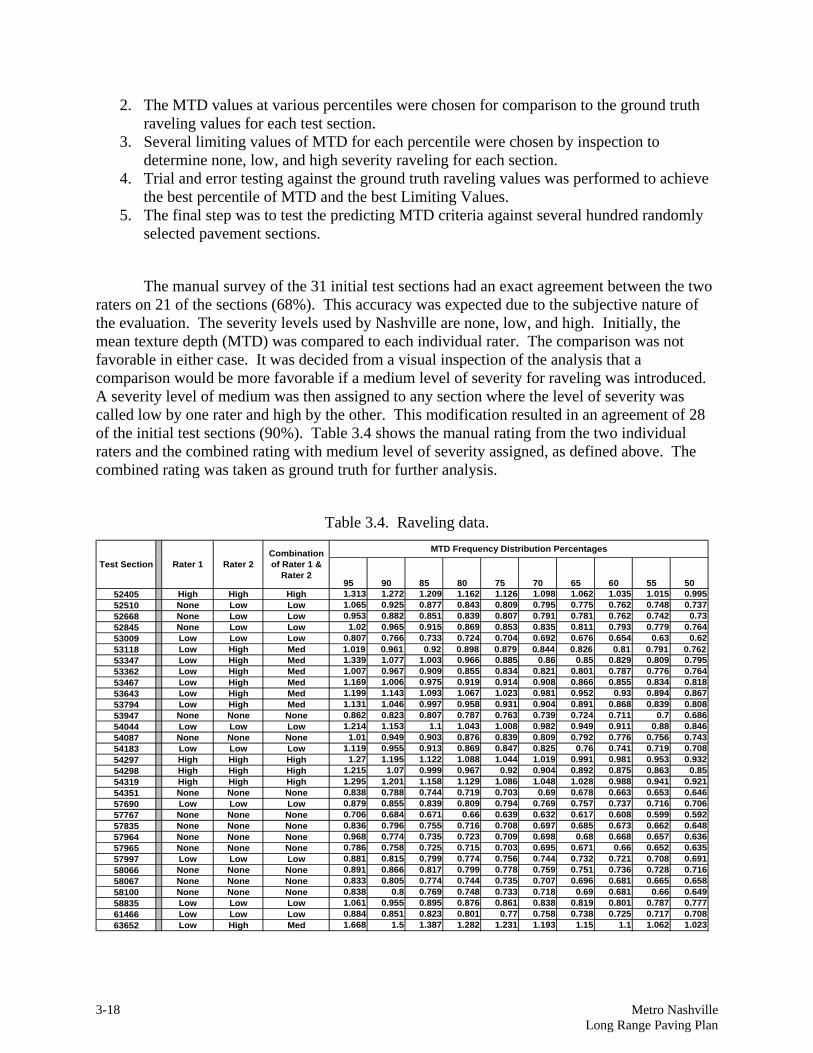
The manual survey of the 31 initial test sections had an exact agreement between the two raters on 21 of the sections (68%). This accuracy was expected due to the subjective nature of the evaluation. The severity levels used by Nashville are none, low, and high. Initially, the mean texture depth (MTD) was compared to each individual rater. The comparison was not favorable in either case. It was decided from a visual inspection of the analysis that a comparison would be more favorable if a medium level of severity for raveling was introduced. A severity level of medium was then assigned to any section where the level of severity was called low by one rater and high by the other. This modification resulted in an agreement of 28 of the initial test sections (90%). Table 3.4 shows the manual rating from the two individual raters and the combined rating with medium level of severity assigned, as defined above. The combined rating was taken as ground truth for further analysis.
Table 3.4. Raveling data.
95 90 85 80 75 70 65 60 55 5052405 High High High 1.313 1.272 1.209 1.162 1.126 1.098 1.062 1.035 1.015 0.99552510 None Low Low 1.065 0.925 0.877 0.843 0.809 0.795 0.775 0.762 0.748 0.73752668 None Low Low 0.953 0.882 0.851 0.839 0.807 0.791 0.781 0.762 0.742 0.7352845 None Low Low 1.02 0.965 0.915 0.869 0.853 0.835 0.811 0.793 0.779 0.76453009 Low Low Low 0.807 0.766 0.733 0.724 0.704 0.692 0.676 0.654 0.63 0.6253118 Low High Med 1.019 0.961 0.92 0.898 0.879 0.844 0.826 0.81 0.791 0.76253347 Low High Med 1.339 1.077 1.003 0.966 0.885 0.86 0.85 0.829 0.809 0.79553362 Low High Med 1.007 0.967 0.909 0.855 0.834 0.821 0.801 0.787 0.776 0.76453467 Low High Med 1.169 1.006 0.975 0.919 0.914 0.908 0.866 0.855 0.834 0.81853643 Low High Med 1.199 1.143 1.093 1.067 1.023 0.981 0.952 0.93 0.894 0.86753794 Low High Med 1.131 1.046 0.997 0.958 0.931 0.904 0.891 0.868 0.839 0.80853947 None None None 0.862 0.823 0.807 0.787 0.763 0.739 0.724 0.711 0.7 0.68654044 Low Low Low 1.214 1.153 1.1 1.043 1.008 0.982 0.949 0.911 0.88 0.84654087 None None None 1.01 0.949 0.903 0.876 0.839 0.809 0.792 0.776 0.756 0.74354183 Low Low Low 1.119 0.955 0.913 0.869 0.847 0.825 0.76 0.741 0.719 0.70854297 High High High 1.27 1.195 1.122 1.088 1.044 1.019 0.991 0.981 0.953 0.93254298 High High High 1.215 1.07 0.999 0.967 0.92 0.904 0.892 0.875 0.863 0.8554319 High High High 1.295 1.201 1.158 1.129 1.086 1.048 1.028 0.988 0.941 0.92154351 None None None 0.838 0.788 0.744 0.719 0.703 0.69 0.678 0.663 0.653 0.64657690 Low Low Low 0.879 0.855 0.839 0.809 0.794 0.769 0.757 0.737 0.716 0.70657767 None None None 0.706 0.684 0.671 0.66 0.639 0.632 0.617 0.608 0.599 0.59257835 None None None 0.836 0.796 0.755 0.716 0.708 0.697 0.685 0.673 0.662 0.64857964 None None None 0.968 0.774 0.735 0.723 0.709 0.698 0.68 0.668 0.657 0.63657965 None None None 0.786 0.758 0.725 0.715 0.703 0.695 0.671 0.66 0.652 0.63557997 Low Low Low 0.881 0.815 0.799 0.774 0.756 0.744 0.732 0.721 0.708 0.69158066 None None None 0.891 0.866 0.817 0.799 0.778 0.759 0.751 0.736 0.728 0.71658067 None None None 0.833 0.805 0.774 0.744 0.735 0.707 0.696 0.681 0.665 0.65858100 None None None 0.838 0.8 0.769 0.748 0.733 0.718 0.69 0.681 0.66 0.64958835 Low Low Low 1.061 0.955 0.895 0.876 0.861 0.838 0.819 0.801 0.787 0.77761466 Low Low Low 0.884 0.851 0.823 0.801 0.77 0.758 0.738 0.725 0.717 0.70863652 Low High Med 1.668 1.5 1.387 1.282 1.231 1.193 1.15 1.1 1.062 1.023
Test Section
MTD Frequency Distribution Percentages
Rater 1 Rater 2Combination of Rater 1 &
Rater 2
Metro Nashville Long Range Paving Plan
3-19
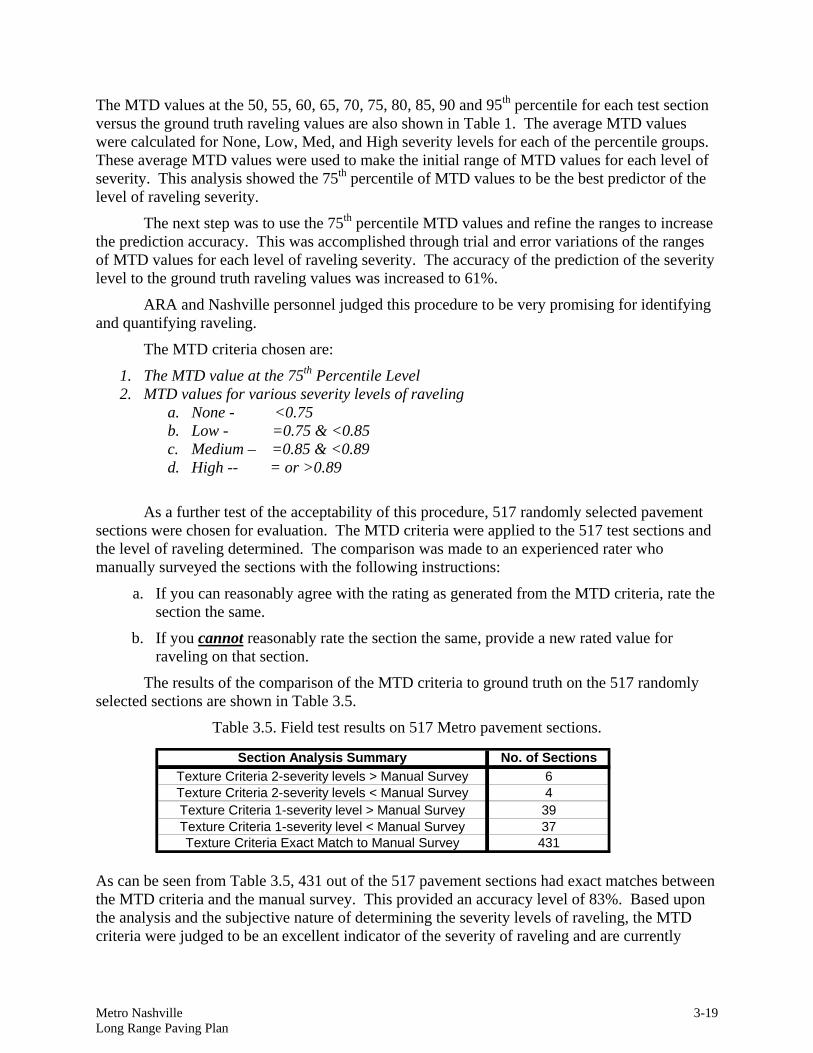
The MTD values at the 50, 55, 60, 65, 70, 75, 80, 85, 90 and 95th percentile for each test section versus the ground truth raveling values are also shown in Table 1. The average MTD values were calculated for None, Low, Med, and High severity levels for each of the percentile groups. These average MTD values were used to make the initial range of MTD values for each level of severity. This analysis showed the 75th percentile of MTD values to be the best predictor of the level of raveling severity.
The next step was to use the 75th percentile MTD values and refine the ranges to increase the prediction accuracy. This was accomplished through trial and error variations of the ranges of MTD values for each level of raveling severity. The accuracy of the prediction of the severity level to the ground truth raveling values was increased to 61%.
ARA and Nashville personnel judged this procedure to be very promising for identifying and quantifying raveling.
The MTD criteria chosen are:
1. The MTD value at the 75th Percentile Level 2. MTD values for various severity levels of raveling
a. None - <0.75 b. Low - =0.75 & <0.85 c. Medium – =0.85 & <0.89 d. High -- = or >0.89
As a further test of the acceptability of this procedure, 517 randomly selected pavement sections were chosen for evaluation. The MTD criteria were applied to the 517 test sections and the level of raveling determined. The comparison was made to an experienced rater who manually surveyed the sections with the following instructions:
a. If you can reasonably agree with the rating as generated from the MTD criteria, rate the section the same.
b. If you cannot reasonably rate the section the same, provide a new rated value for raveling on that section.
The results of the comparison of the MTD criteria to ground truth on the 517 randomly selected sections are shown in Table 3.5.
Table 3.5. Field test results on 517 Metro pavement sections.
As can be seen from Table 3.5, 431 out of the 517 pavement sections had exact matches between the MTD criteria and the manual survey. This provided an accuracy level of 83%. Based upon the analysis and the subjective nature of determining the severity levels of raveling, the MTD criteria were judged to be an excellent indicator of the severity of raveling and are currently
No. of Sections643937431Texture Criteria Exact Match to Manual Survey
Texture Criteria 1-severity level < Manual Survey
Texture Criteria 2-severity levels < Manual SurveyTexture Criteria 1-severity level > Manual Survey
Section Analysis SummaryTexture Criteria 2-severity levels > Manual Survey
3-20 Metro Nashville Long Range Paving Plan
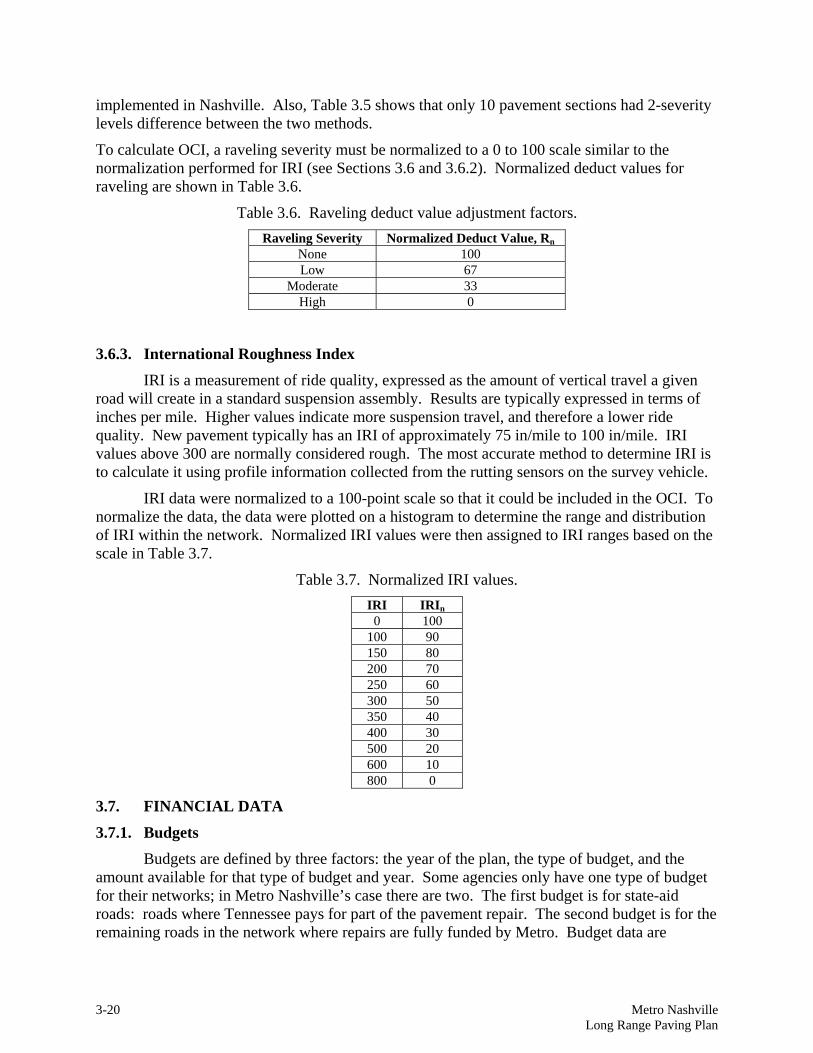
implemented in Nashville. Also, Table 3.5 shows that only 10 pavement sections had 2-severity levels difference between the two methods.
To calculate OCI, a raveling severity must be normalized to a 0 to 100 scale similar to the normalization performed for IRI (see Sections 3.6 and 3.6.2). Normalized deduct values for raveling are shown in Table 3.6.
Table 3.6. Raveling deduct value adjustment factors. Raveling Severity Normalized Deduct Value, Rn
None 100 Low 67
Moderate 33 High 0
3.6.3. International Roughness Index
IRI is a measurement of ride quality, expressed as the amount of vertical travel a given road will create in a standard suspension assembly. Results are typically expressed in terms of inches per mile. Higher values indicate more suspension travel, and therefore a lower ride quality. New pavement typically has an IRI of approximately 75 in/mile to 100 in/mile. IRI values above 300 are normally considered rough. The most accurate method to determine IRI is to calculate it using profile information collected from the rutting sensors on the survey vehicle.
IRI data were normalized to a 100-point scale so that it could be included in the OCI. To normalize the data, the data were plotted on a histogram to determine the range and distribution of IRI within the network. Normalized IRI values were then assigned to IRI ranges based on the scale in Table 3.7.
Table 3.7. Normalized IRI values. IRI IRIn
0 100 100 90 150 80 200 70 250 60 300 50 350 40 400 30 500 20 600 10 800 0
3.7. FINANCIAL DATA
3.7.1. Budgets
Budgets are defined by three factors: the year of the plan, the type of budget, and the amount available for that type of budget and year. Some agencies only have one type of budget for their networks; in Metro Nashville’s case there are two. The first budget is for state-aid roads: roads where Tennessee pays for part of the pavement repair. The second budget is for the remaining roads in the network where repairs are fully funded by Metro. Budget data are
Metro Nashville Long Range Paving Plan
3-21
typically determined from previous years funding levels and adjusted for any anticipated changes. A budget must be defined for each year the software is developing a plan.
3.7.2. Costs The CartêGraph software can accommodate an array of pavement preservation,
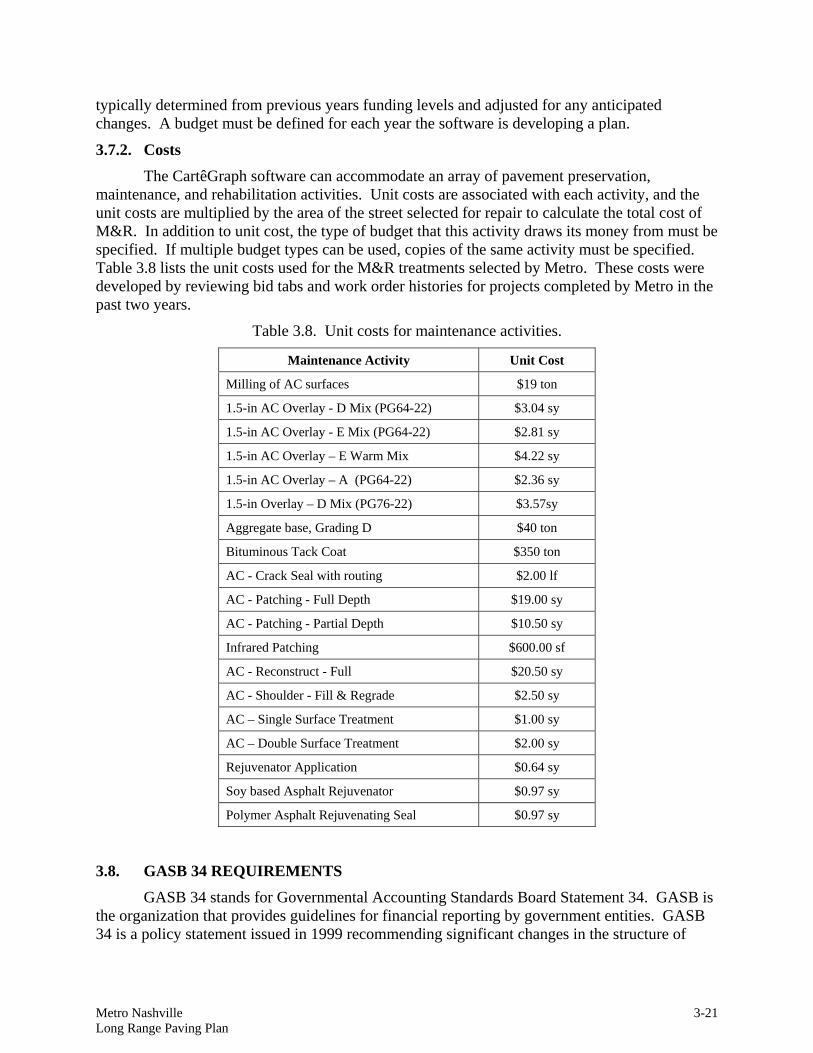
maintenance, and rehabilitation activities. Unit costs are associated with each activity, and the unit costs are multiplied by the area of the street selected for repair to calculate the total cost of M&R. In addition to unit cost, the type of budget that this activity draws its money from must be specified. If multiple budget types can be used, copies of the same activity must be specified. Table 3.8 lists the unit costs used for the M&R treatments selected by Metro. These costs were developed by reviewing bid tabs and work order histories for projects completed by Metro in the past two years.
Table 3.8. Unit costs for maintenance activities.
Maintenance Activity Unit Cost
Milling of AC surfaces $19 ton
1.5-in AC Overlay - D Mix (PG64-22) $3.04 sy
1.5-in AC Overlay - E Mix (PG64-22) $2.81 sy
1.5-in AC Overlay – E Warm Mix $4.22 sy
1.5-in AC Overlay – A (PG64-22) $2.36 sy
1.5-in Overlay – D Mix (PG76-22) $3.57sy
Aggregate base, Grading D $40 ton
Bituminous Tack Coat $350 ton
AC - Crack Seal with routing $2.00 lf
AC - Patching - Full Depth $19.00 sy
AC - Patching - Partial Depth $10.50 sy
Infrared Patching $600.00 sf
AC - Reconstruct - Full $20.50 sy
AC - Shoulder - Fill & Regrade $2.50 sy
AC – Single Surface Treatment $1.00 sy
AC – Double Surface Treatment $2.00 sy
Rejuvenator Application $0.64 sy
Soy based Asphalt Rejuvenator $0.97 sy
Polymer Asphalt Rejuvenating Seal $0.97 sy
3.8. GASB 34 REQUIREMENTS GASB 34 stands for Governmental Accounting Standards Board Statement 34. GASB is
the organization that provides guidelines for financial reporting by government entities. GASB 34 is a policy statement issued in 1999 recommending significant changes in the structure of
3-22 Metro Nashville Long Range Paving Plan
financial reporting methods. One area greatly affected by GASB 34 is valuation of long-term assets, such as bridges, roads, and other infrastructure items.
Prior to 1999, all governmental assets were valued at their purchase (construction) price and depreciated a set amount each year. Annual depreciation on all assets was listed as an expense in financial report. Repairs to the asset were considered expenses, but any preservation or rehabilitation treatments, e.g., rejuvenators or microsurfacing, were considered capital expenditures that must also be depreciated. Under this system, a government had little financial incentive to preserve infrastructure items, as financial reports would show large capital expenditures with little or no improvement in serviceability observed by the average citizen.
GASB 34 introduced the concept of "perpetual assets" into accounting, i.e., assets that depreciate with serviceability, not time. The perpetual asset concept recognizes the reality that a 20-year-old road in satisfactory condition is just as valuable as a 2-year-old road in satisfactory condition. The road should not be depreciated and the depreciation listed as an expense simply because it is old. Instead, any preservation or rehabilitation maintenance to keep the road in satisfactory condition should be listed as an expense. This is known as the modified approach to reporting.
To be allowed to use the modified approach, an agency must have in place a system to evaluate and track asset condition, and assets must be maintained at a target serviceability level. The PMS system implemented by Metro exceeds the GASB requirements for tracking pavement condition, and the Metro pavement management program specifies inspecting 50% of the pavement network annually. Metro has selected a target serviceability level for the network of 70% of all pavements having an OCI greater than 70.
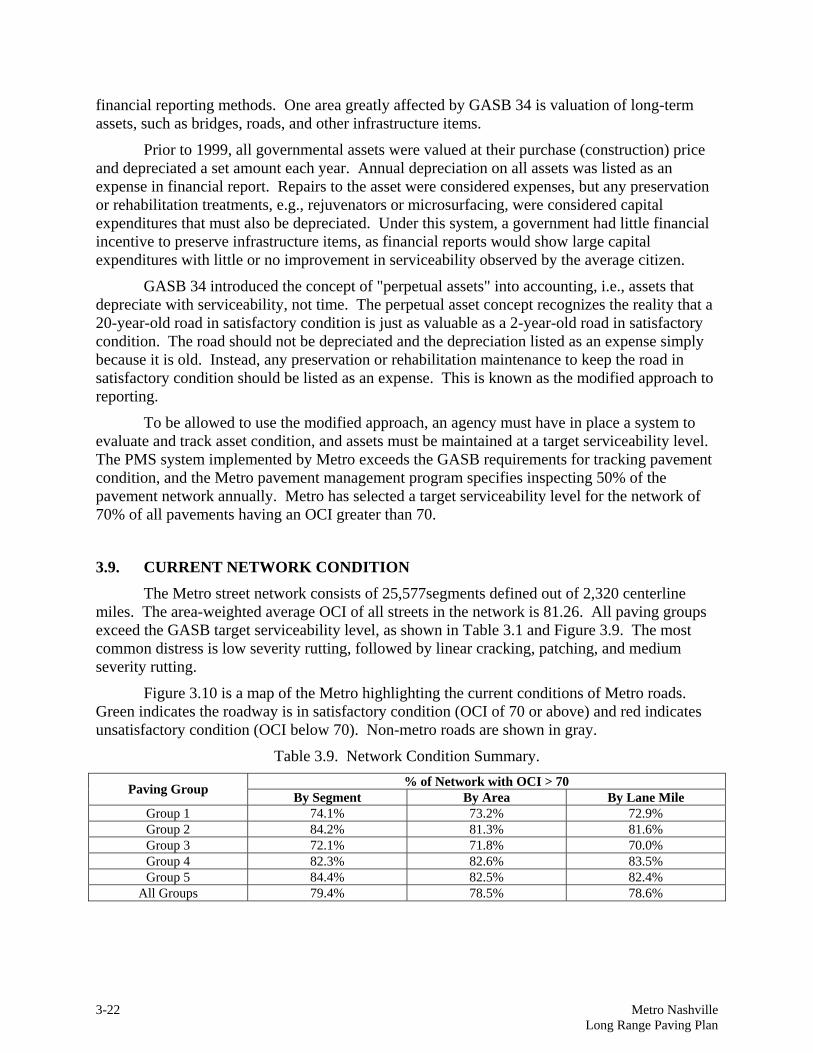
3.9. CURRENT NETWORK CONDITION The Metro street network consists of 25,577segments defined out of 2,320 centerline
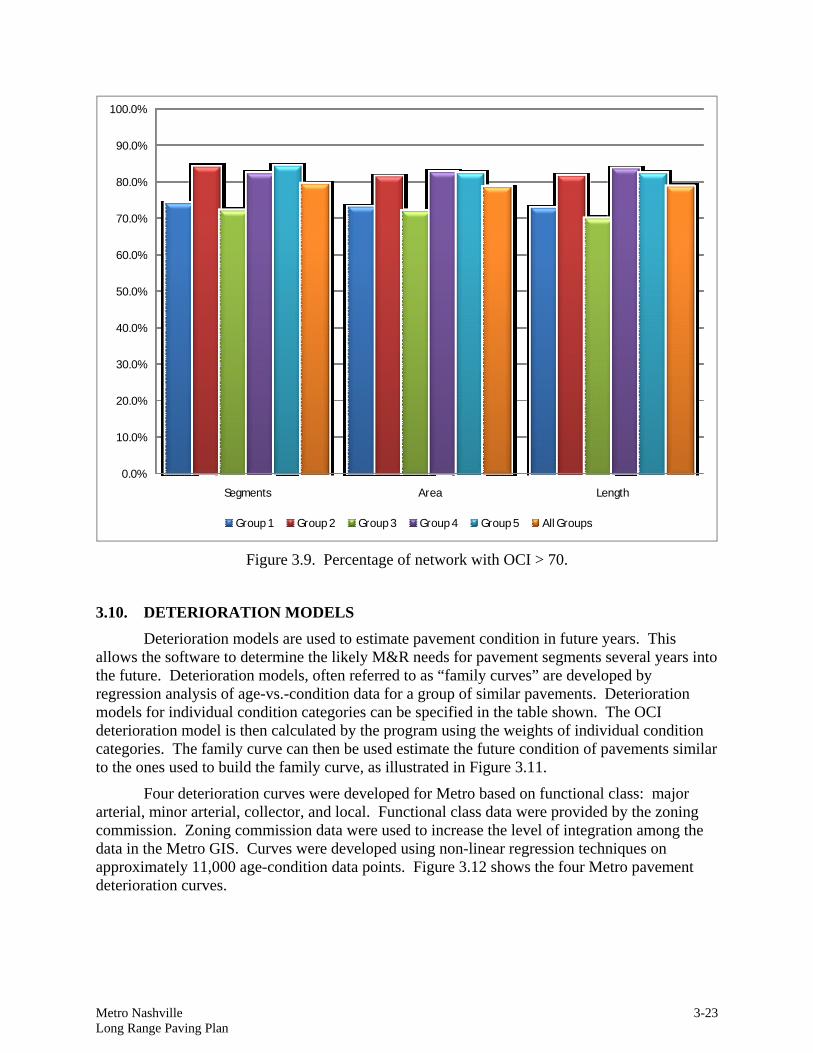
miles. The area-weighted average OCI of all streets in the network is 81.26. All paving groups exceed the GASB target serviceability level, as shown in Table 3.1 and Figure 3.9. The most common distress is low severity rutting, followed by linear cracking, patching, and medium severity rutting.
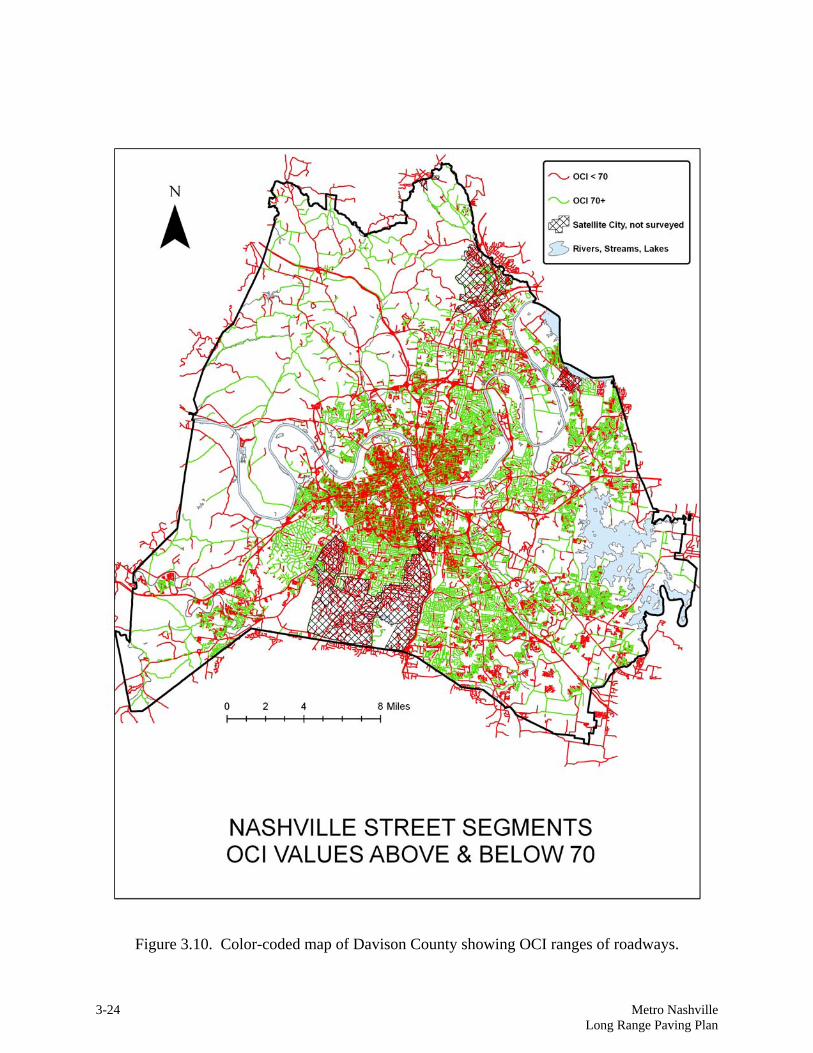
Figure 3.10 is a map of the Metro highlighting the current conditions of Metro roads. Green indicates the roadway is in satisfactory condition (OCI of 70 or above) and red indicates unsatisfactory condition (OCI below 70). Non-metro roads are shown in gray.
Table 3.9. Network Condition Summary. % of Network with OCI > 70 Paving Group By Segment By Area By Lane Mile
Group 1 74.1% 73.2% 72.9% Group 2 84.2% 81.3% 81.6% Group 3 72.1% 71.8% 70.0% Group 4 82.3% 82.6% 83.5% Group 5 84.4% 82.5% 82.4%
All Groups 79.4% 78.5% 78.6%
Metro Nashville Long Range Paving Plan
3-23
0.0%
10.0%
20.0%
30.0%
40.0%
50.0%
60.0%
70.0%
80.0%
90.0%
100.0%
Segments Area Length
Group 1 Group 2 Group 3 Group 4 Group 5 All Groups
Figure 3.9. Percentage of network with OCI > 70.
3.10. DETERIORATION MODELS
Deterioration models are used to estimate pavement condition in future years. This allows the software to determine the likely M&R needs for pavement segments several years into the future. Deterioration models, often referred to as “family curves” are developed by regression analysis of age-vs.-condition data for a group of similar pavements. Deterioration models for individual condition categories can be specified in the table shown. The OCI deterioration model is then calculated by the program using the weights of individual condition categories. The family curve can then be used estimate the future condition of pavements similar to the ones used to build the family curve, as illustrated in Figure 3.11.
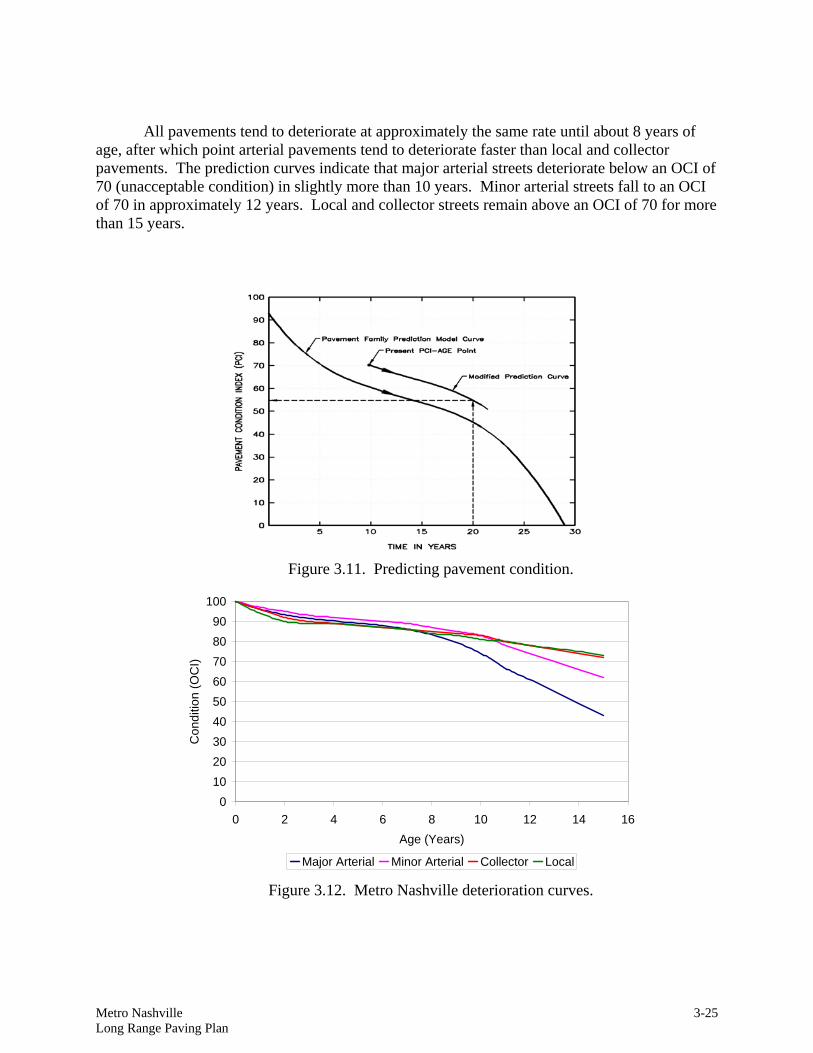
Four deterioration curves were developed for Metro based on functional class: major arterial, minor arterial, collector, and local. Functional class data were provided by the zoning commission. Zoning commission data were used to increase the level of integration among the data in the Metro GIS. Curves were developed using non-linear regression techniques on approximately 11,000 age-condition data points. Figure 3.12 shows the four Metro pavement deterioration curves.
3-24 Metro Nashville Long Range Paving Plan
Figure 3.10. Color-coded map of Davison County showing OCI ranges of roadways.
Metro Nashville Long Range Paving Plan
3-25
All pavements tend to deteriorate at approximately the same rate until about 8 years of age, after which point arterial pavements tend to deteriorate faster than local and collector pavements. The prediction curves indicate that major arterial streets deteriorate below an OCI of 70 (unacceptable condition) in slightly more than 10 years. Minor arterial streets fall to an OCI of 70 in approximately 12 years. Local and collector streets remain above an OCI of 70 for more than 15 years.
Figure 3.11. Predicting pavement condition.
0102030405060708090
100
0 2 4 6 8 10 12 14 16Age (Years)
Con
ditio
n (O
CI)
Major Arterial Minor Arterial Collector Local Figure 3.12. Metro Nashville deterioration curves.

3-26 Metro Nashville Long Range Paving Plan
This page intentionally blank.