Embed Size (px)
Citation preview
65
CHAPTER 3 PROTECTION FROM WIND AND SALT SPRAY
Thematic paper: Protective functions of coastal forests and trees against wind and salt spray
Eugene S. Takle, T.-C. Chen and Xiaoqing Wu1
This paper provides an overview of the hazard potential presented by wind and salt spray to human settlements in coastal areas of Southeast Asia. Damage to infrastructure (such as buildings, dams, bridges and dykes) and degradation of natural systems in Southeast Asia and India due to wind and salt spray are closely linked to climatological conditions that lead to high wind in the region (Section 1.1). The mechanisms for generation of salt spray and their relation to windspeed are discussed in Section 1.3. Introducing shelterbelts and coastal forests is proposed as an environmentally attractive method for suppressing damage due to wind and sea spray. The properties of shelterbelts that define their effectiveness for reducing wind and capturing sea salt are described in Section 2 and the development of guidelines for their re-establishment in coastal areas is addressed in Section 3. There is a brief discussion on economics and social aspects of establishing coastal forests in Section 4, and Section 5 offers concluding remarks.
1 Wind and salt spray damage in Asia Section 1 gives an overview of wind and salt spray damage potential for Southeast Asia. Actual records or maps of past damage to human assets in the region are neither comprehensive nor widely available, particularly in the context of salt spray damage. Available data for assessing wind and salt spray damage potential in Southeast Asia are perhaps a useful surrogate and arguably more relevant for policy-making, as actual damage maps would be highly dependent on the value of coastal human assets exposed to damaging conditions. Therefore, climatological information and maps offer opportunities for assessing hazard potential in various areas as a basis for evaluating alternative strategies for types of protection and hardening of structures in order to minimize the negative impacts of such hazards.
1.1 Wind
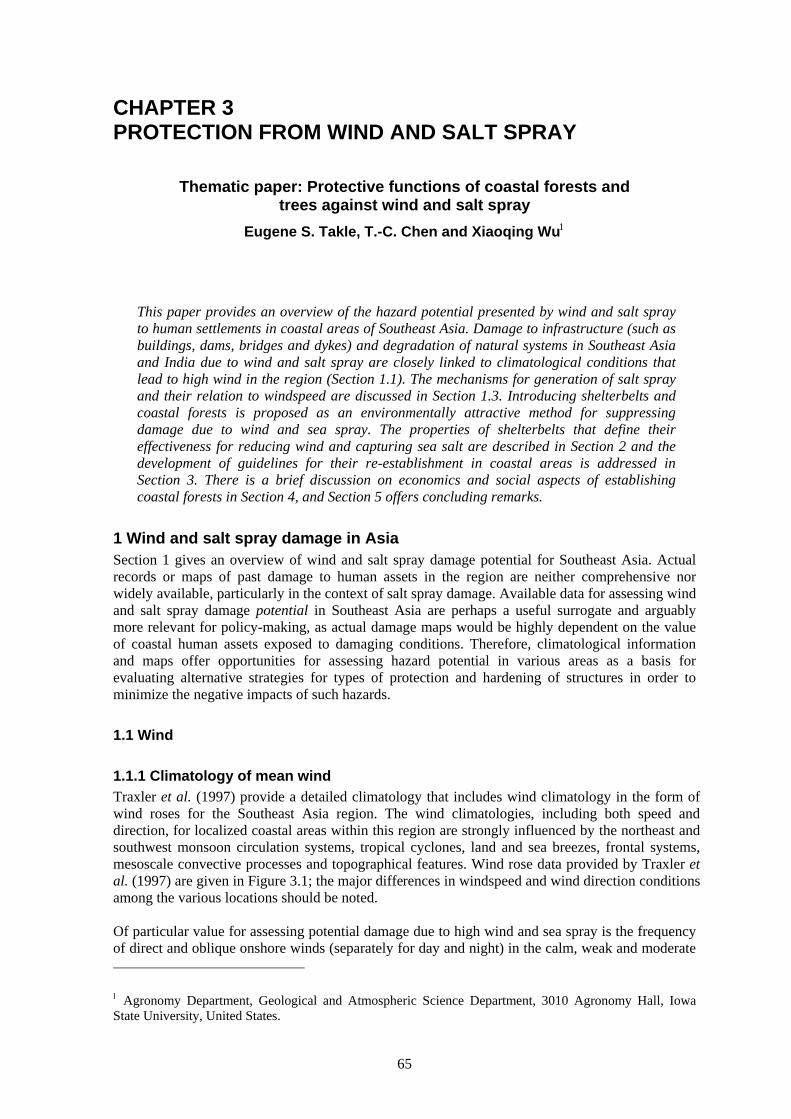
1.1.1 Climatology of mean wind Traxler et al. (1997) provide a detailed climatology that includes wind climatology in the form of wind roses for the Southeast Asia region. The wind climatologies, including both speed and direction, for localized coastal areas within this region are strongly influenced by the northeast and southwest monsoon circulation systems, tropical cyclones, land and sea breezes, frontal systems, mesoscale convective processes and topographical features. Wind rose data provided by Traxler et al. (1997) are given in Figure 3.1; the major differences in windspeed and wind direction conditions among the various locations should be noted. Of particular value for assessing potential damage due to high wind and sea spray is the frequency of direct and oblique onshore winds (separately for day and night) in the calm, weak and moderate 1 Agronomy Department, Geological and Atmospheric Science Department, 3010 Agronomy Hall, Iowa State University, United States.
66
speed categories for each of the 16 compass directions. Evaluating the protective function of trees and shelterbelts and determining the design factors (for example, species, orientation, density, width and length) for any particular location must first start with an assessment of the magnitude of the local threat and the direction from which it arrives. The Southeast Asian and Indian coastal regions subject to wind damage from tropical cyclones, monsoon and other meteorological events can be subdivided into five general locations: Viet Nam and coastal southeast China; the east-facing Malay Peninsula coast; the west-facing Malay
Figure 3.1 January wind roses showing frequency of wind occurrence in various
speed categories (including calm) for each compass direction (Traxler et al. 1997)
Peninsula coast; India’s east-facing coast; and India’s west-facing coast. For each of these regions the wind roses of Traxler et al. (1997) allow a summary of conditions, possibly leading to damage from wind and salt spray:
• Viet Nam and coastal southeast China: Mean winds from the north and northeast (onshore) from October to March (northeast monsoon) have periods in the 17–27 nautical miles per hour (knot or kt: equivalent to 32–50 kilometres/hour) range and higher frequency of occurrence of winds in the range of 7–16 kt (13–30 kilometres/hour). The southwest monsoon period (April to September) occasionally brings strong onshore winds in the southern part of this region.
• East-facing Malay Peninsula coast: The northeast monsoon period of November to April brings strong easterly winds that can persist both day and night. Mean winds can exceed 17 kt (32 kilometres/hour) in southern Thailand. In this region, only Singapore receives moderately high winds from the southwest monsoon (May to October).
• West-facing Malay Peninsula coast: Strong south and southwest winds associated with the southwest monsoon in April to September have the potential for extended periods of sea-spray generation and possibly isolated wind damage events.
• India’s east-facing coast: The summer southwest monsoon favours offshore flow in this region. The winter northeast monsoon mean wind direction is nearly parallel to the coast, thereby reducing the incidence of strong onshore flows.
67
• India’s west-facing coast: The southwest monsoon provides a persistent onshore flow in summer, and the northeast monsoon with offshore winds suppresses the potential for onshore salt transport in winter.
The polar frontal zone sags southward over the northern Bay of Bengal in winter, giving Bangladesh and adjacent areas primarily offshore winds of low speed. These offshore winds do not pose a threat to the coasts or inland transport of sea salt. In summer, the southwest monsoon provides flow primarily from the southwest for this region; it has persistent onshore winds with the potential for onshore flow with a high content of salt particles owing to long trajectories over a warm ocean, where waves launch bubbles that burst above the sea surface and distribute salt particles through the lower atmosphere (see Section 1.2).
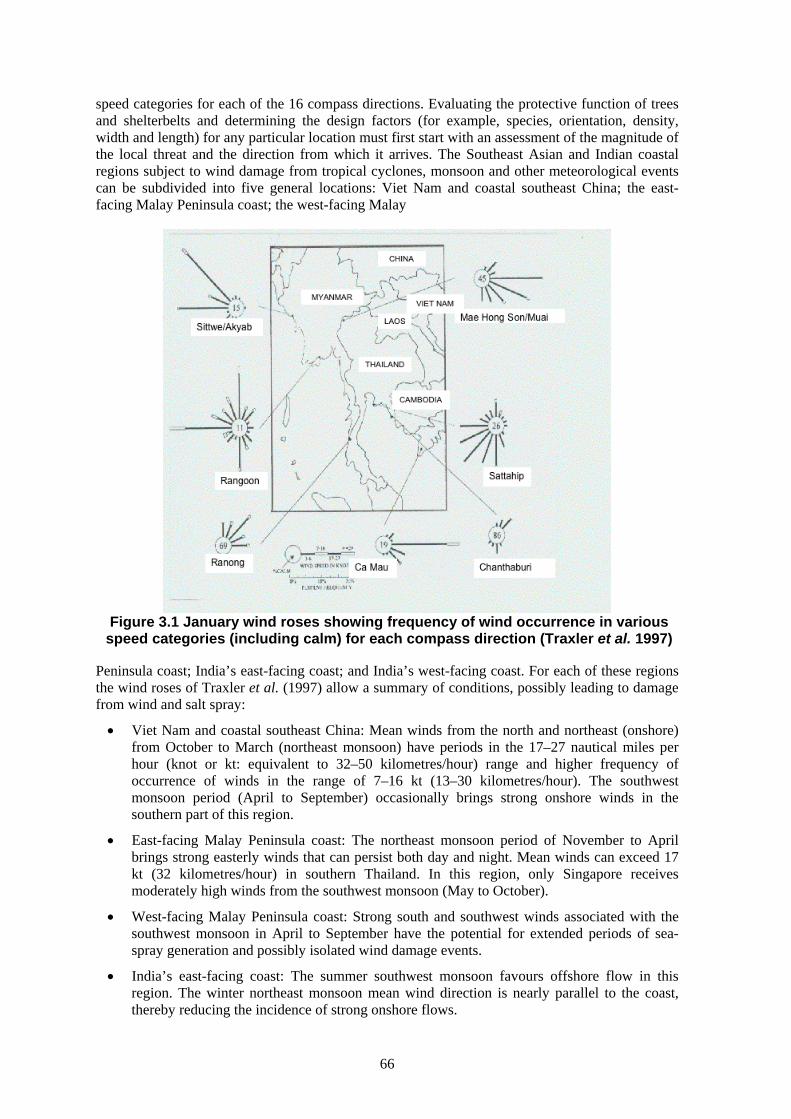
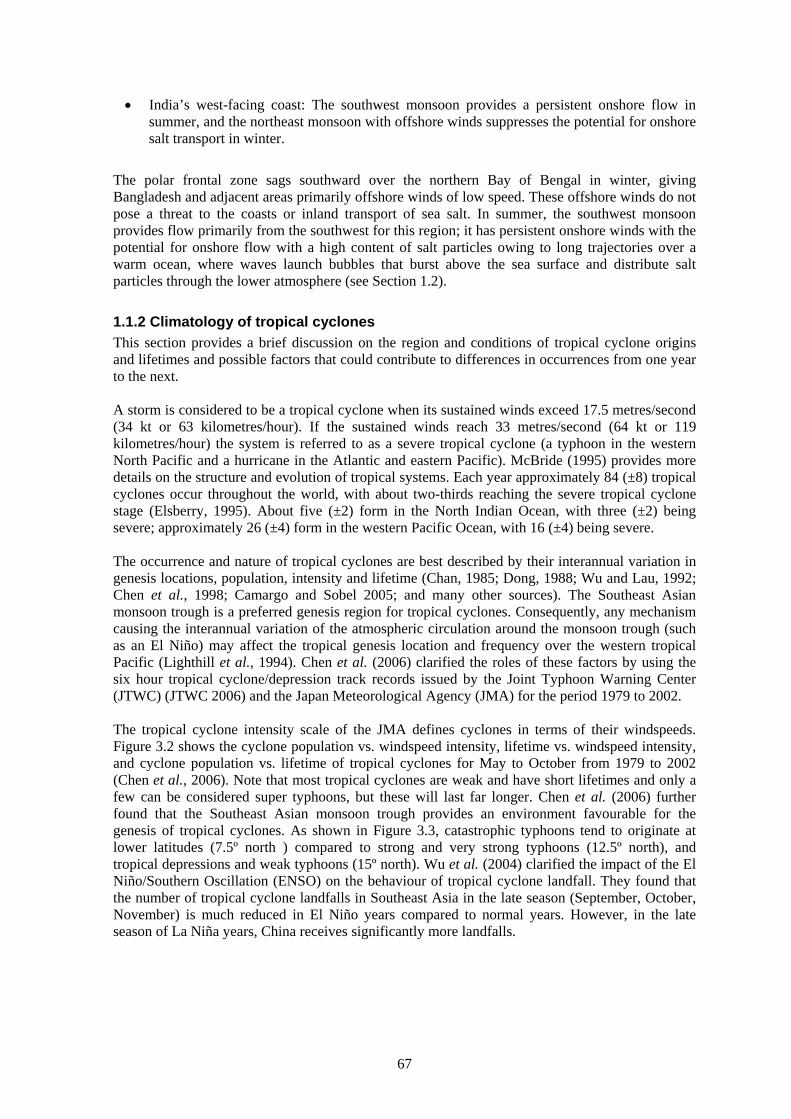
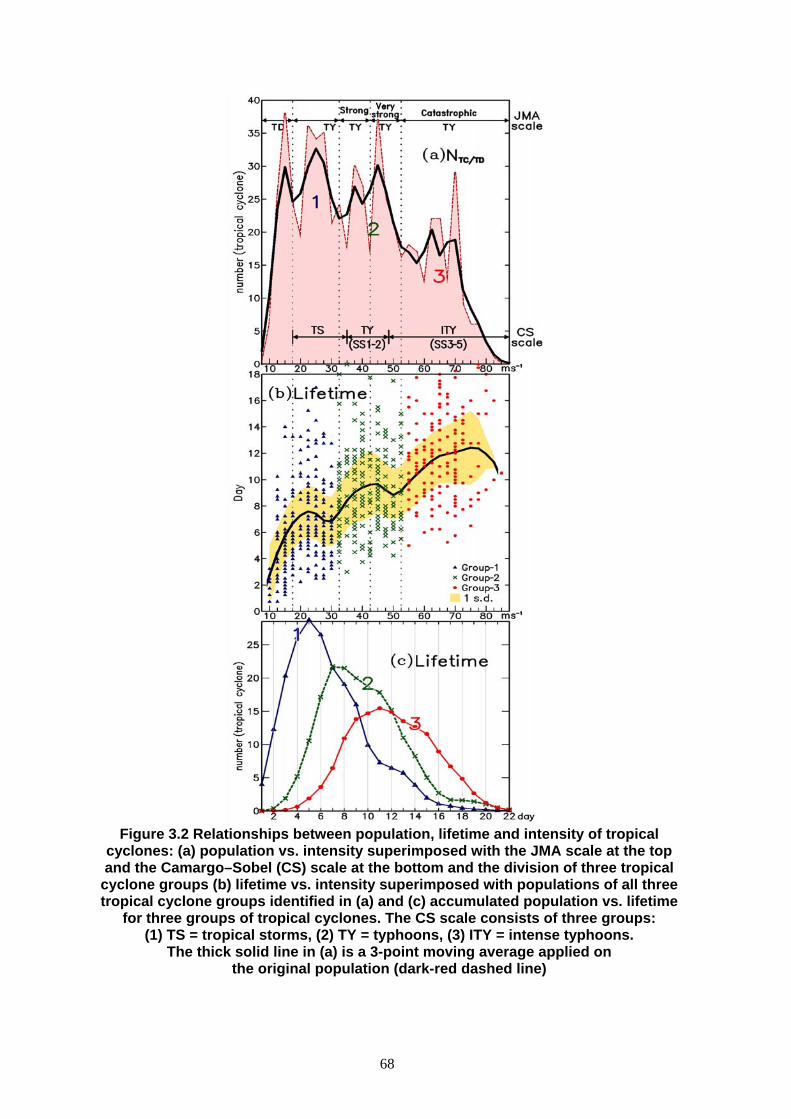
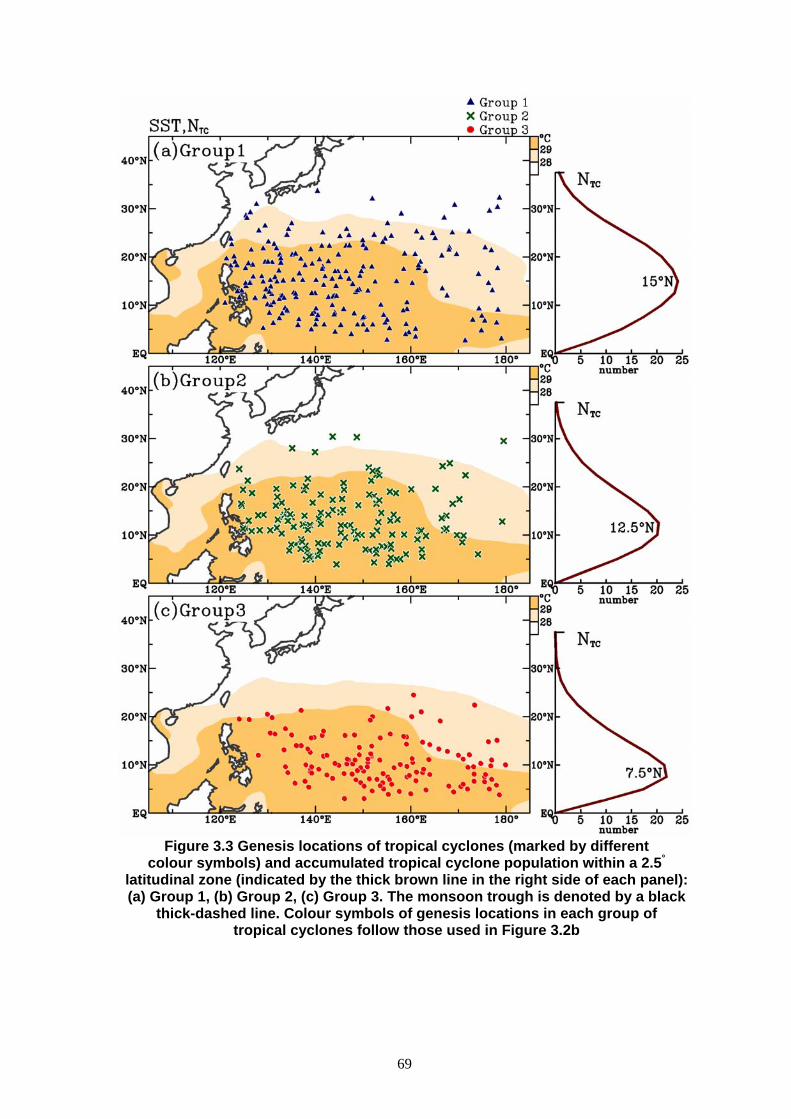
1.1.2 Climatology of tropical cyclones This section provides a brief discussion on the region and conditions of tropical cyclone origins and lifetimes and possible factors that could contribute to differences in occurrences from one year to the next. A storm is considered to be a tropical cyclone when its sustained winds exceed 17.5 metres/second (34 kt or 63 kilometres/hour). If the sustained winds reach 33 metres/second (64 kt or 119 kilometres/hour) the system is referred to as a severe tropical cyclone (a typhoon in the western North Pacific and a hurricane in the Atlantic and eastern Pacific). McBride (1995) provides more details on the structure and evolution of tropical systems. Each year approximately 84 (±8) tropical cyclones occur throughout the world, with about two-thirds reaching the severe tropical cyclone stage (Elsberry, 1995). About five (±2) form in the North Indian Ocean, with three (±2) being severe; approximately 26 (±4) form in the western Pacific Ocean, with 16 (±4) being severe. The occurrence and nature of tropical cyclones are best described by their interannual variation in genesis locations, population, intensity and lifetime (Chan, 1985; Dong, 1988; Wu and Lau, 1992; Chen et al., 1998; Camargo and Sobel 2005; and many other sources). The Southeast Asian monsoon trough is a preferred genesis region for tropical cyclones. Consequently, any mechanism causing the interannual variation of the atmospheric circulation around the monsoon trough (such as an El Niño) may affect the tropical genesis location and frequency over the western tropical Pacific (Lighthill et al., 1994). Chen et al. (2006) clarified the roles of these factors by using the six hour tropical cyclone/depression track records issued by the Joint Typhoon Warning Center (JTWC) (JTWC 2006) and the Japan Meteorological Agency (JMA) for the period 1979 to 2002. The tropical cyclone intensity scale of the JMA defines cyclones in terms of their windspeeds. Figure 3.2 shows the cyclone population vs. windspeed intensity, lifetime vs. windspeed intensity, and cyclone population vs. lifetime of tropical cyclones for May to October from 1979 to 2002 (Chen et al., 2006). Note that most tropical cyclones are weak and have short lifetimes and only a few can be considered super typhoons, but these will last far longer. Chen et al. (2006) further found that the Southeast Asian monsoon trough provides an environment favourable for the genesis of tropical cyclones. As shown in Figure 3.3, catastrophic typhoons tend to originate at lower latitudes (7.5º north ) compared to strong and very strong typhoons (12.5º north), and tropical depressions and weak typhoons (15º north). Wu et al. (2004) clarified the impact of the El Niño/Southern Oscillation (ENSO) on the behaviour of tropical cyclone landfall. They found that the number of tropical cyclone landfalls in Southeast Asia in the late season (September, October, November) is much reduced in El Niño years compared to normal years. However, in the late season of La Niña years, China receives significantly more landfalls.
68
Figure 3.2 Relationships between population, lifetime and intensity of tropical
cyclones: (a) population vs. intensity superimposed with the JMA scale at the top and the Camargo–Sobel (CS) scale at the bottom and the division of three tropical
cyclone groups (b) lifetime vs. intensity superimposed with populations of all three tropical cyclone groups identified in (a) and (c) accumulated population vs. lifetime
for three groups of tropical cyclones. The CS scale consists of three groups: (1) TS = tropical storms, (2) TY = typhoons, (3) ITY = intense typhoons.
The thick solid line in (a) is a 3-point moving average applied on the original population (dark-red dashed line)
69
Figure 3.3 Genesis locations of tropical cyclones (marked by different
colour symbols) and accumulated tropical cyclone population within a 2.5°
latitudinal zone (indicated by the thick brown line in the right side of each panel): (a) Group 1, (b) Group 2, (c) Group 3. The monsoon trough is denoted by a black
thick-dashed line. Colour symbols of genesis locations in each group of tropical cyclones follow those used in Figure 3.2b
70
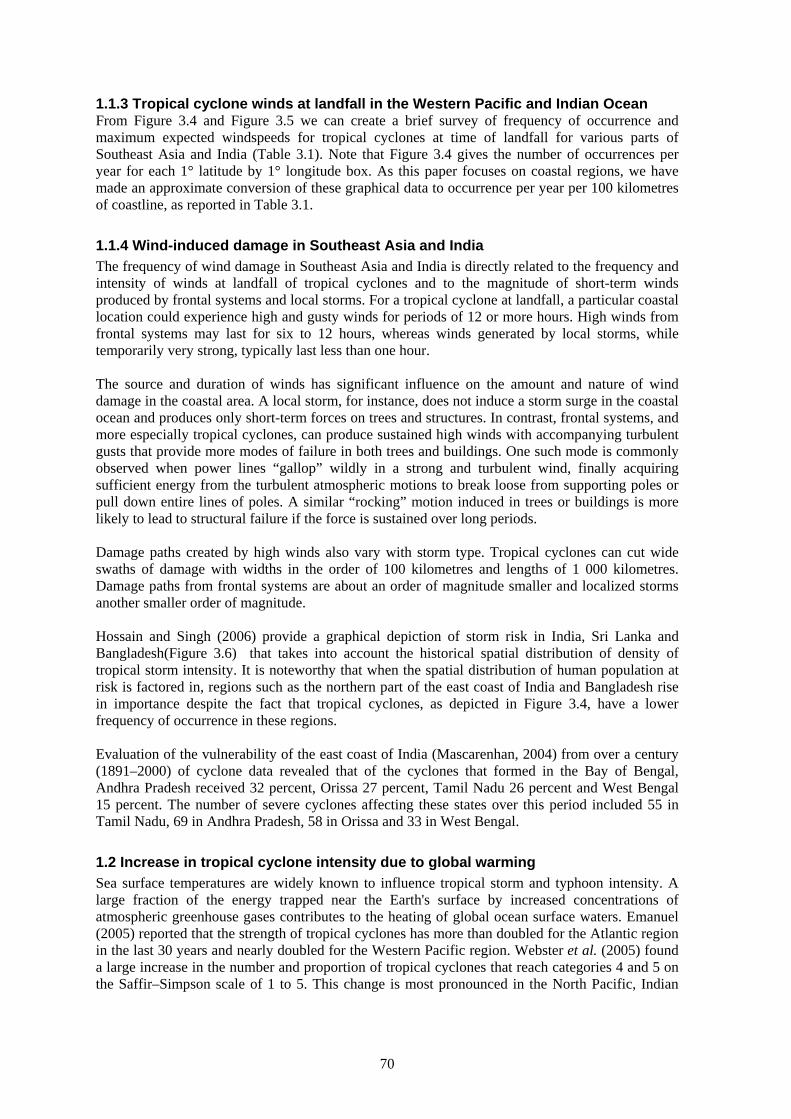
1.1.3 Tropical cyclone winds at landfall in the Western Pacific and Indian Ocean From Figure 3.4 and Figure 3.5 we can create a brief survey of frequency of occurrence and maximum expected windspeeds for tropical cyclones at time of landfall for various parts of Southeast Asia and India (Table 3.1). Note that Figure 3.4 gives the number of occurrences per year for each 1° latitude by 1° longitude box. As this paper focuses on coastal regions, we have made an approximate conversion of these graphical data to occurrence per year per 100 kilometres of coastline, as reported in Table 3.1.
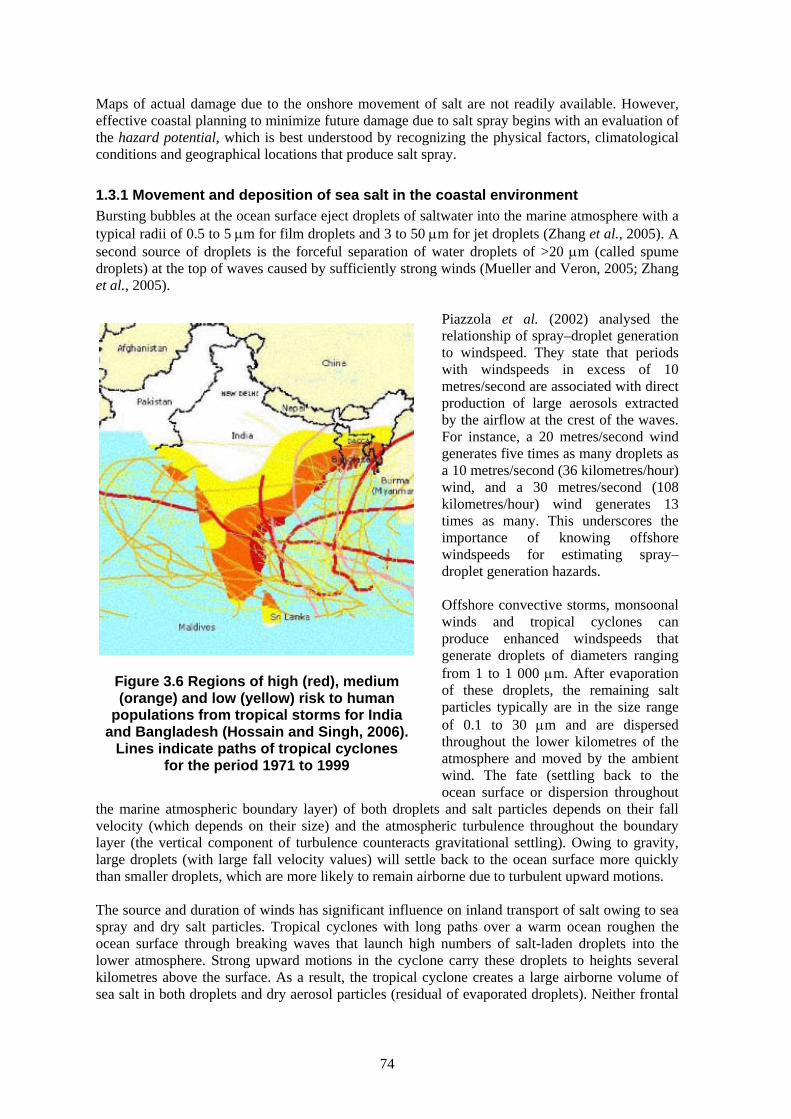
1.1.4 Wind-induced damage in Southeast Asia and India The frequency of wind damage in Southeast Asia and India is directly related to the frequency and intensity of winds at landfall of tropical cyclones and to the magnitude of short-term winds produced by frontal systems and local storms. For a tropical cyclone at landfall, a particular coastal location could experience high and gusty winds for periods of 12 or more hours. High winds from frontal systems may last for six to 12 hours, whereas winds generated by local storms, while temporarily very strong, typically last less than one hour. The source and duration of winds has significant influence on the amount and nature of wind damage in the coastal area. A local storm, for instance, does not induce a storm surge in the coastal ocean and produces only short-term forces on trees and structures. In contrast, frontal systems, and more especially tropical cyclones, can produce sustained high winds with accompanying turbulent gusts that provide more modes of failure in both trees and buildings. One such mode is commonly observed when power lines “gallop” wildly in a strong and turbulent wind, finally acquiring sufficient energy from the turbulent atmospheric motions to break loose from supporting poles or pull down entire lines of poles. A similar “rocking” motion induced in trees or buildings is more likely to lead to structural failure if the force is sustained over long periods. Damage paths created by high winds also vary with storm type. Tropical cyclones can cut wide swaths of damage with widths in the order of 100 kilometres and lengths of 1 000 kilometres. Damage paths from frontal systems are about an order of magnitude smaller and localized storms another smaller order of magnitude. Hossain and Singh (2006) provide a graphical depiction of storm risk in India, Sri Lanka and Bangladesh(Figure 3.6) that takes into account the historical spatial distribution of density of tropical storm intensity. It is noteworthy that when the spatial distribution of human population at risk is factored in, regions such as the northern part of the east coast of India and Bangladesh rise in importance despite the fact that tropical cyclones, as depicted in Figure 3.4, have a lower frequency of occurrence in these regions. Evaluation of the vulnerability of the east coast of India (Mascarenhan, 2004) from over a century (1891–2000) of cyclone data revealed that of the cyclones that formed in the Bay of Bengal, Andhra Pradesh received 32 percent, Orissa 27 percent, Tamil Nadu 26 percent and West Bengal 15 percent. The number of severe cyclones affecting these states over this period included 55 in Tamil Nadu, 69 in Andhra Pradesh, 58 in Orissa and 33 in West Bengal.
1.2 Increase in tropical cyclone intensity due to global warming Sea surface temperatures are widely known to influence tropical storm and typhoon intensity. A large fraction of the energy trapped near the Earth's surface by increased concentrations of atmospheric greenhouse gases contributes to the heating of global ocean surface waters. Emanuel (2005) reported that the strength of tropical cyclones has more than doubled for the Atlantic region in the last 30 years and nearly doubled for the Western Pacific region. Webster et al. (2005) found a large increase in the number and proportion of tropical cyclones that reach categories 4 and 5 on the Saffir–Simpson scale of 1 to 5. This change is most pronounced in the North Pacific, Indian
71
and Southwest Pacific oceans, with the least change in the North Atlantic Ocean. They find no long-term global trend in the number of storms or number of storm days.
Figure 3.4 Upper figure — frequency of tropical cyclones from 1974 to 2004 in
number of occurrences per year for each 1° latitude by 1° longitude box. Indochina, South China, Taiwan Province of China and the Philippines are most likely to have
tropical cyclone landfall. Lower figure — maximum windspeed of typhoons ever recorded in the period 1974 to 2004. The coastlines of Viet Nam, China and much of
India may receive 80 kt winds, while Taiwan Province of China, the Philippines and a small portion of India may encounter winds of about 120 kts
72
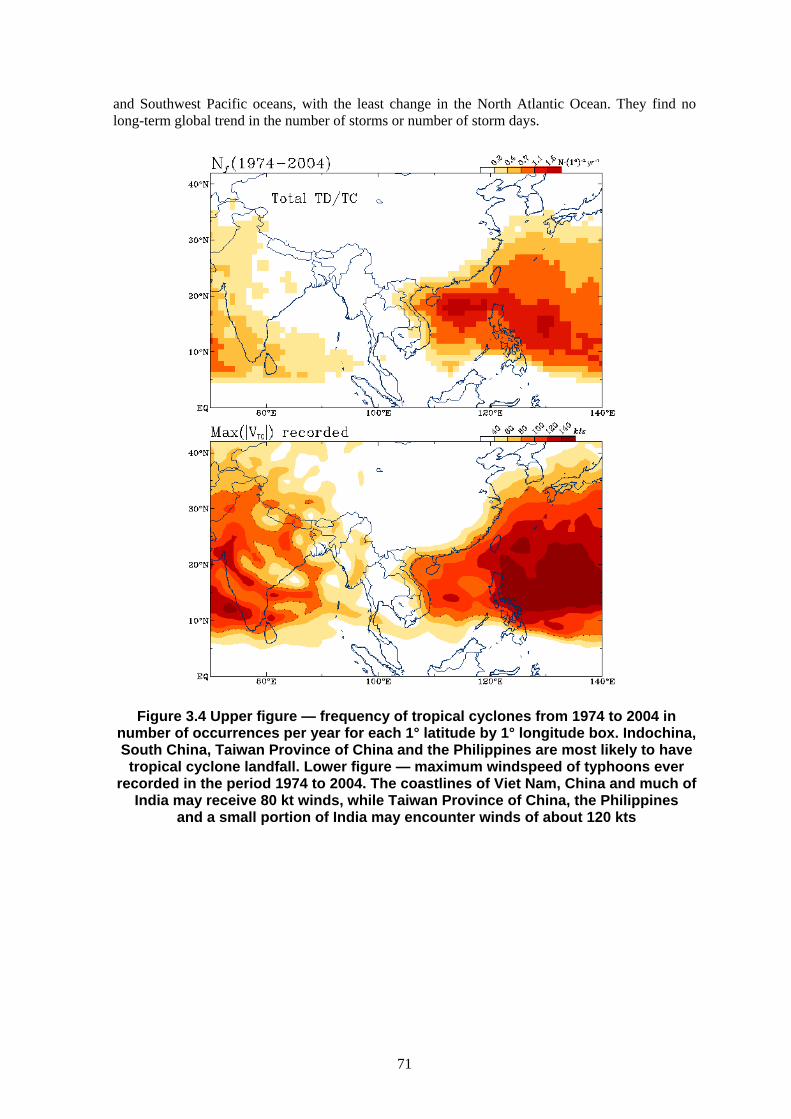
Figure 3.5 Frequency of tropical cyclones with windspeed within the range given in the upper lefthand corner; the most frequent windspeed of typhoons for coastlines around the South China Sea is between 25 and 50 kts, while most of the typhoons
that strike Indochina and China have an intensity under 100 kts
73
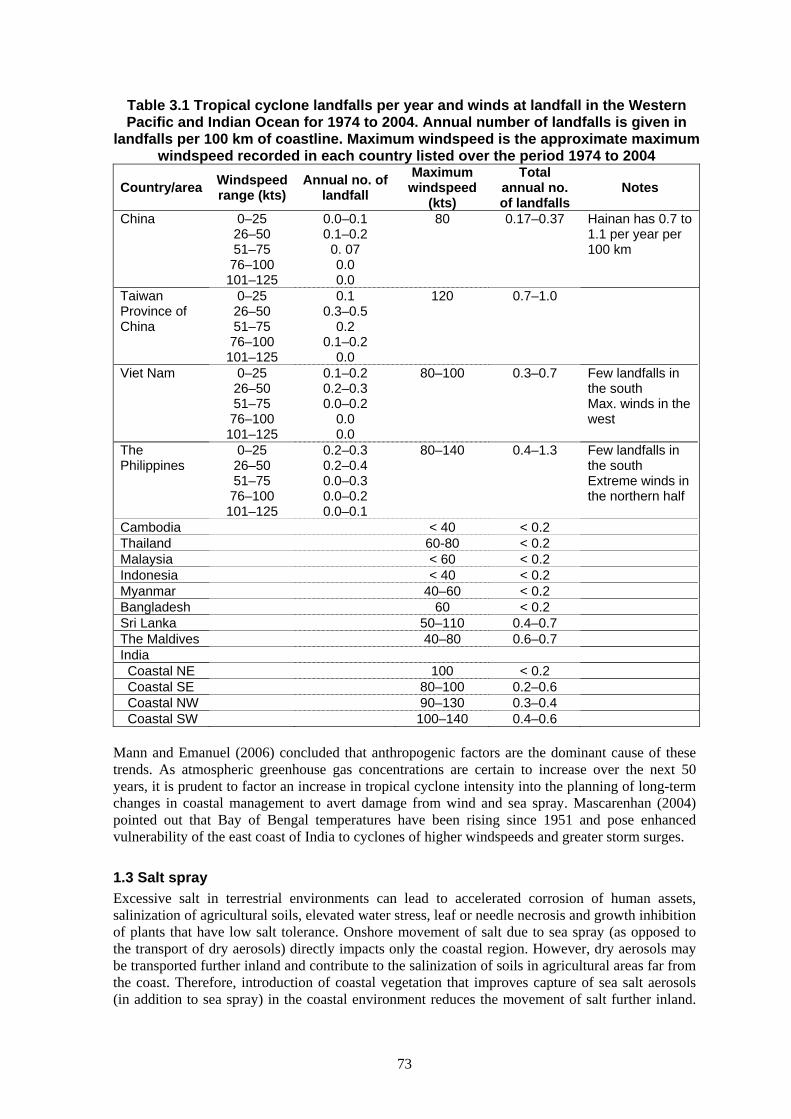
Table 3.1 Tropical cyclone landfalls per year and winds at landfall in the Western Pacific and Indian Ocean for 1974 to 2004. Annual number of landfalls is given in
landfalls per 100 km of coastline. Maximum windspeed is the approximate maximum windspeed recorded in each country listed over the period 1974 to 2004
Country/area Windspeed range (kts)
Annual no. of landfall
Maximum windspeed
(kts)
Total annual no. of landfalls
Notes
China 0–25 26–50 51–75 76–100
101–125
0.0–0.1 0.1–0.2
0. 07 0.0 0.0
80 0.17–0.37 Hainan has 0.7 to 1.1 per year per 100 km
Taiwan Province of China
0–25 26–50 51–75 76–100
101–125
0.1 0.3–0.5
0.2 0.1–0.2
0.0
120 0.7–1.0
Viet Nam 0–25 26–50 51–75 76–100
101–125
0.1–0.2 0.2–0.3 0.0–0.2
0.0 0.0
80–100 0.3–0.7 Few landfalls in the south Max. winds in the west
The Philippines
0–25 26–50 51–75 76–100
101–125
0.2–0.3 0.2–0.4 0.0–0.3 0.0–0.2 0.0–0.1
80–140 0.4–1.3 Few landfalls in the south Extreme winds in the northern half
Cambodia < 40 < 0.2 Thailand 60-80 < 0.2 Malaysia < 60 < 0.2 Indonesia < 40 < 0.2 Myanmar 40–60 < 0.2 Bangladesh 60 < 0.2 Sri Lanka 50–110 0.4–0.7 The Maldives 40–80 0.6–0.7 India Coastal NE 100 < 0.2 Coastal SE 80–100 0.2–0.6 Coastal NW 90–130 0.3–0.4 Coastal SW 100–140 0.4–0.6
Mann and Emanuel (2006) concluded that anthropogenic factors are the dominant cause of these trends. As atmospheric greenhouse gas concentrations are certain to increase over the next 50 years, it is prudent to factor an increase in tropical cyclone intensity into the planning of long-term changes in coastal management to avert damage from wind and sea spray. Mascarenhan (2004) pointed out that Bay of Bengal temperatures have been rising since 1951 and pose enhanced vulnerability of the east coast of India to cyclones of higher windspeeds and greater storm surges.
1.3 Salt spray Excessive salt in terrestrial environments can lead to accelerated corrosion of human assets, salinization of agricultural soils, elevated water stress, leaf or needle necrosis and growth inhibition of plants that have low salt tolerance. Onshore movement of salt due to sea spray (as opposed to the transport of dry aerosols) directly impacts only the coastal region. However, dry aerosols may be transported further inland and contribute to the salinization of soils in agricultural areas far from the coast. Therefore, introduction of coastal vegetation that improves capture of sea salt aerosols (in addition to sea spray) in the coastal environment reduces the movement of salt further inland.
74
Maps of actual damage due to the onshore movement of salt are not readily available. However, effective coastal planning to minimize future damage due to salt spray begins with an evaluation of the hazard potential, which is best understood by recognizing the physical factors, climatological conditions and geographical locations that produce salt spray.
1.3.1 Movement and deposition of sea salt in the coastal environment Bursting bubbles at the ocean surface eject droplets of saltwater into the marine atmosphere with a typical radii of 0.5 to 5 μm for film droplets and 3 to 50 μm for jet droplets (Zhang et al., 2005). A second source of droplets is the forceful separation of water droplets of >20 μm (called spume droplets) at the top of waves caused by sufficiently strong winds (Mueller and Veron, 2005; Zhang et al., 2005).
Piazzola et al. (2002) analysed the relationship of spray–droplet generation to windspeed. They state that periods with windspeeds in excess of 10 metres/second are associated with direct production of large aerosols extracted by the airflow at the crest of the waves. For instance, a 20 metres/second wind generates five times as many droplets as a 10 metres/second (36 kilometres/hour) wind, and a 30 metres/second (108 kilometres/hour) wind generates 13 times as many. This underscores the importance of knowing offshore windspeeds for estimating spray–droplet generation hazards. Offshore convective storms, monsoonal winds and tropical cyclones can produce enhanced windspeeds that generate droplets of diameters ranging from 1 to 1 000 μm. After evaporation of these droplets, the remaining salt particles typically are in the size range of 0.1 to 30 μm and are dispersed throughout the lower kilometres of the atmosphere and moved by the ambient wind. The fate (settling back to the ocean surface or dispersion throughout
the marine atmospheric boundary layer) of both droplets and salt particles depends on their fall velocity (which depends on their size) and the atmospheric turbulence throughout the boundary layer (the vertical component of turbulence counteracts gravitational settling). Owing to gravity, large droplets (with large fall velocity values) will settle back to the ocean surface more quickly than smaller droplets, which are more likely to remain airborne due to turbulent upward motions. The source and duration of winds has significant influence on inland transport of salt owing to sea spray and dry salt particles. Tropical cyclones with long paths over a warm ocean roughen the ocean surface through breaking waves that launch high numbers of salt-laden droplets into the lower atmosphere. Strong upward motions in the cyclone carry these droplets to heights several kilometres above the surface. As a result, the tropical cyclone creates a large airborne volume of sea salt in both droplets and dry aerosol particles (residual of evaporated droplets). Neither frontal
Figure 3.6 Regions of high (red), medium (orange) and low (yellow) risk to human
populations from tropical storms for India and Bangladesh (Hossain and Singh, 2006).
Lines indicate paths of tropical cyclones for the period 1971 to 1999
75
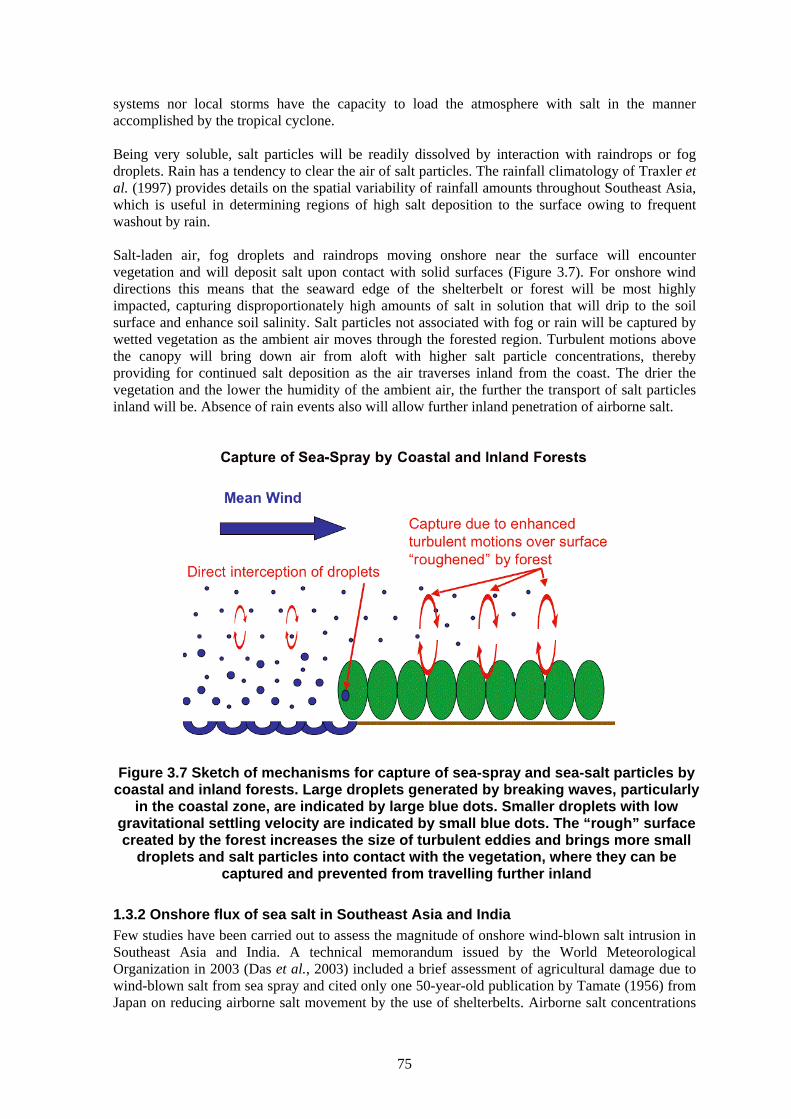
systems nor local storms have the capacity to load the atmosphere with salt in the manner accomplished by the tropical cyclone. Being very soluble, salt particles will be readily dissolved by interaction with raindrops or fog droplets. Rain has a tendency to clear the air of salt particles. The rainfall climatology of Traxler et al. (1997) provides details on the spatial variability of rainfall amounts throughout Southeast Asia, which is useful in determining regions of high salt deposition to the surface owing to frequent washout by rain. Salt-laden air, fog droplets and raindrops moving onshore near the surface will encounter vegetation and will deposit salt upon contact with solid surfaces (Figure 3.7). For onshore wind directions this means that the seaward edge of the shelterbelt or forest will be most highly impacted, capturing disproportionately high amounts of salt in solution that will drip to the soil surface and enhance soil salinity. Salt particles not associated with fog or rain will be captured by wetted vegetation as the ambient air moves through the forested region. Turbulent motions above the canopy will bring down air from aloft with higher salt particle concentrations, thereby providing for continued salt deposition as the air traverses inland from the coast. The drier the vegetation and the lower the humidity of the ambient air, the further the transport of salt particles inland will be. Absence of rain events also will allow further inland penetration of airborne salt.
Figure 3.7 Sketch of mechanisms for capture of sea-spray and sea-salt particles by
coastal and inland forests. Large droplets generated by breaking waves, particularly in the coastal zone, are indicated by large blue dots. Smaller droplets with low
gravitational settling velocity are indicated by small blue dots. The “rough” surface created by the forest increases the size of turbulent eddies and brings more small
droplets and salt particles into contact with the vegetation, where they can be captured and prevented from travelling further inland
1.3.2 Onshore flux of sea salt in Southeast Asia and India Few studies have been carried out to assess the magnitude of onshore wind-blown salt intrusion in Southeast Asia and India. A technical memorandum issued by the World Meteorological Organization in 2003 (Das et al., 2003) included a brief assessment of agricultural damage due to wind-blown salt from sea spray and cited only one 50-year-old publication by Tamate (1956) from Japan on reducing airborne salt movement by the use of shelterbelts. Airborne salt concentrations
76
in the lee of shelterbelts were measured to be 12 percent lower than on the windward side. Sequeira and Kelkar (1978) measured the sea salt content of rainwater at ten coastal and inland stations in India during the entire monsoon period of 1975 and estimated that four million tonnes of sea salt are likely to be transported annually into the country by monsoon winds. Rainwater near the coast had concentrations of sodium from 400 to 1 000 percent that of seawater. This is consistent with previous paragraphs that describe how air parcels with long trajectories over the ocean are continually supplied with droplets, which evaporate leaving salt particles that continually increase the salt loading of the parcel. Onshore moving air parcels very near the surface will interact with coastal forests, which provide some opportunity for salt to be extracted from the air. However, salt particles distributed throughout the lowest two kilometres of the atmosphere will have high salt content. These salt particles, high in the atmosphere, cannot be captured by coastal vegetation but will be washed out by rainfall further inland. Spray movement onshore can be expected when offshore winds are sufficiently strong to generate sea spray by the previously mentioned mechanisms, which generally require speeds in excess of 10 metres/second for the generation of large salt aerosols (Piazzola et al., 2002). Localized damage potential can be estimated by the frequency of winds exceeding this threshold. Damage to growing plants caused by salt from sea spray can be attributed to higher water stress and leaf or needle necrosis, as well as inhibition of growth (Griffiths and Orians, 2004) depending on the species. Differential responses to salt by different species can lead to gradations in the ecosystem community structure in the near coastal zone. Some species (for example, pines) are vulnerable to "salt-pruning" on their ocean-facing sides. When combined with a persistent or prevailing wind from the ocean, salt-pruning may cause a tree to become "flagged," with growth only occurring on the side of the tree protected from the salt spray (Storm Center Communications, 2006). If the coastal area has high levels of wastewater returned to the ocean, high concentrations of surfactants could be passed on to the spray droplets generated by waves breaking in the near-shore environment. Spray droplets containing surfactants counteract the natural low wetability (Rettori et al., 2005) and absorption of leaf surfaces of halophytes such as mangroves and Norfolk Island Pines, thereby allowing excessive amounts of salt spray to penetrate into the leaf through open stomata (leaf pores) (Allen, 2006). Rettori et al. (2005) reported that coastal vegetation damage in Italy is generated by this effect. Intense rainfall can reduce salt accumulation problems by washing salt from vegetation and leaching salt from the soil. Regions receiving in excess of 50 centimetres of rain per year have fewer problems with salt accumulation in the soil (Appleton et al., 2003).
2 Use of forests and trees for suppressing damage Research on the characteristics and sheltering effectiveness of coastal shelterbelts and forests is quite limited. Recent review papers on shelterbelt modelling (Wang et al., 2001) and worldwide applications of shelterbelts (Brandle et al., 2000) make no mention of coastal applications. Zhu et al. (2003) provide a model for winds within a coastal forest canopy, but do not address the sheltering function beyond the confines of the forest. However, the fluid dynamics of flow through vegetation barriers are based on universal laws of physics, so simulating flow through a coastal shelterbelt is no different than simulating flow through agricultural shelterbelts, provided that the characteristics of the coastal vegetation (see Section 2.1 below) are specified. Windbreaks consisting of shelterbelts (one or two rows of trees) and forest belts (multiple rows) are commonly used at inland locations as natural barriers to reduce windspeed, modify the microclimates of small regions and suppress the movement of snow, pollen, dust, sand and odours. They are most widely used in agriculture in regions of high windspeed such as Australia, New Zealand, the Russian Federation, China and the Great Plains of the United States. Therefore, the methods used and results derived from studies of agricultural shelterbelts can be applied to coastal shelterbelts and forests as well. In this section we discuss the knowledge base
77
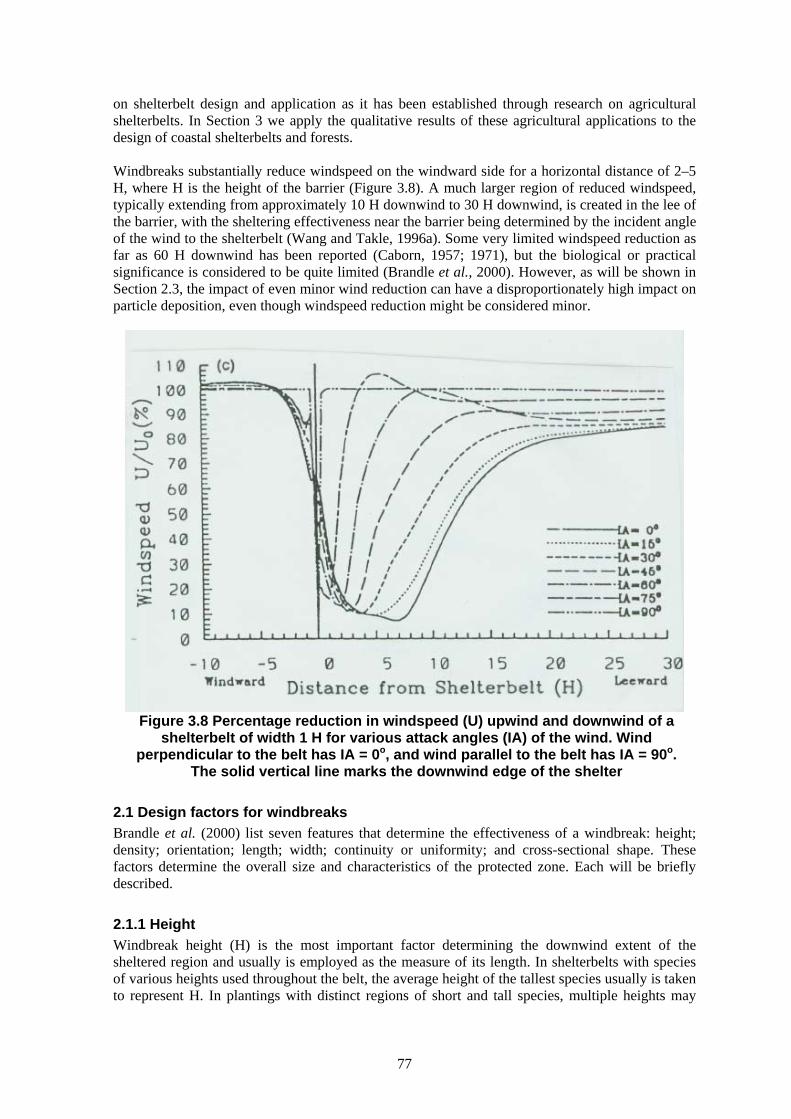
on shelterbelt design and application as it has been established through research on agricultural shelterbelts. In Section 3 we apply the qualitative results of these agricultural applications to the design of coastal shelterbelts and forests. Windbreaks substantially reduce windspeed on the windward side for a horizontal distance of 2–5 H, where H is the height of the barrier (Figure 3.8). A much larger region of reduced windspeed, typically extending from approximately 10 H downwind to 30 H downwind, is created in the lee of the barrier, with the sheltering effectiveness near the barrier being determined by the incident angle of the wind to the shelterbelt (Wang and Takle, 1996a). Some very limited windspeed reduction as far as 60 H downwind has been reported (Caborn, 1957; 1971), but the biological or practical significance is considered to be quite limited (Brandle et al., 2000). However, as will be shown in Section 2.3, the impact of even minor wind reduction can have a disproportionately high impact on particle deposition, even though windspeed reduction might be considered minor.
Figure 3.8 Percentage reduction in windspeed (U) upwind and downwind of a
shelterbelt of width 1 H for various attack angles (IA) of the wind. Wind perpendicular to the belt has IA = 0o, and wind parallel to the belt has IA = 90o.
The solid vertical line marks the downwind edge of the shelter
2.1 Design factors for windbreaks Brandle et al. (2000) list seven features that determine the effectiveness of a windbreak: height; density; orientation; length; width; continuity or uniformity; and cross-sectional shape. These factors determine the overall size and characteristics of the protected zone. Each will be briefly described.
2.1.1 Height Windbreak height (H) is the most important factor determining the downwind extent of the sheltered region and usually is employed as the measure of its length. In shelterbelts with species of various heights used throughout the belt, the average height of the tallest species usually is taken to represent H. In plantings with distinct regions of short and tall species, multiple heights may
78
need to be specified (see Section 2.1.5). The protected distance is measured from the most leeward row of trees in the windbreak.
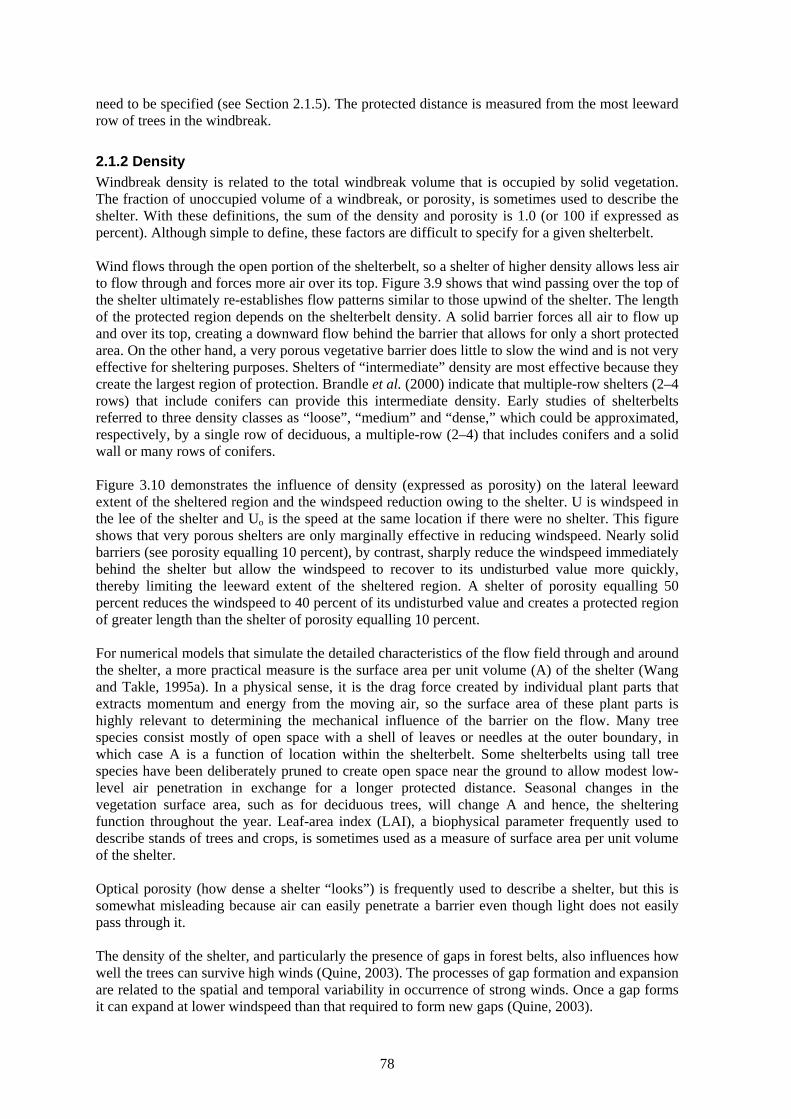
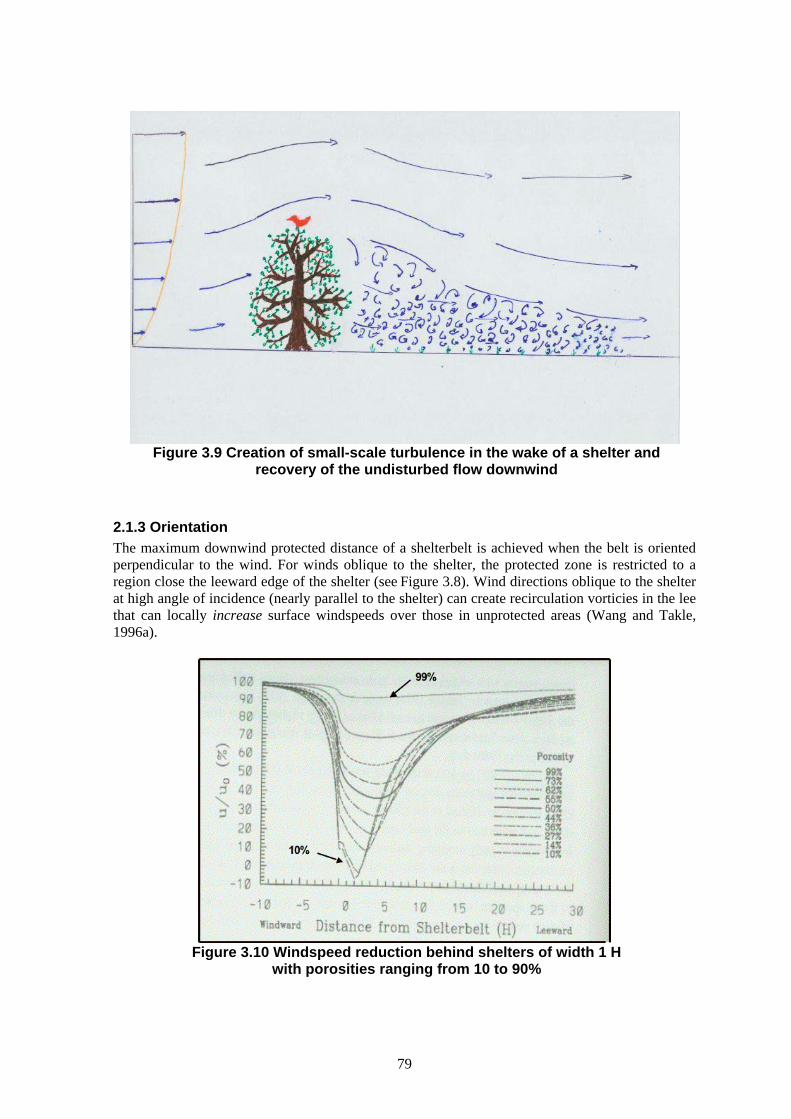
2.1.2 Density Windbreak density is related to the total windbreak volume that is occupied by solid vegetation. The fraction of unoccupied volume of a windbreak, or porosity, is sometimes used to describe the shelter. With these definitions, the sum of the density and porosity is 1.0 (or 100 if expressed as percent). Although simple to define, these factors are difficult to specify for a given shelterbelt. Wind flows through the open portion of the shelterbelt, so a shelter of higher density allows less air to flow through and forces more air over its top. Figure 3.9 shows that wind passing over the top of the shelter ultimately re-establishes flow patterns similar to those upwind of the shelter. The length of the protected region depends on the shelterbelt density. A solid barrier forces all air to flow up and over its top, creating a downward flow behind the barrier that allows for only a short protected area. On the other hand, a very porous vegetative barrier does little to slow the wind and is not very effective for sheltering purposes. Shelters of “intermediate” density are most effective because they create the largest region of protection. Brandle et al. (2000) indicate that multiple-row shelters (2–4 rows) that include conifers can provide this intermediate density. Early studies of shelterbelts referred to three density classes as “loose”, “medium” and “dense,” which could be approximated, respectively, by a single row of deciduous, a multiple-row (2–4) that includes conifers and a solid wall or many rows of conifers. Figure 3.10 demonstrates the influence of density (expressed as porosity) on the lateral leeward extent of the sheltered region and the windspeed reduction owing to the shelter. U is windspeed in the lee of the shelter and Uo is the speed at the same location if there were no shelter. This figure shows that very porous shelters are only marginally effective in reducing windspeed. Nearly solid barriers (see porosity equalling 10 percent), by contrast, sharply reduce the windspeed immediately behind the shelter but allow the windspeed to recover to its undisturbed value more quickly, thereby limiting the leeward extent of the sheltered region. A shelter of porosity equalling 50 percent reduces the windspeed to 40 percent of its undisturbed value and creates a protected region of greater length than the shelter of porosity equalling 10 percent. For numerical models that simulate the detailed characteristics of the flow field through and around the shelter, a more practical measure is the surface area per unit volume (A) of the shelter (Wang and Takle, 1995a). In a physical sense, it is the drag force created by individual plant parts that extracts momentum and energy from the moving air, so the surface area of these plant parts is highly relevant to determining the mechanical influence of the barrier on the flow. Many tree species consist mostly of open space with a shell of leaves or needles at the outer boundary, in which case A is a function of location within the shelterbelt. Some shelterbelts using tall tree species have been deliberately pruned to create open space near the ground to allow modest low-level air penetration in exchange for a longer protected distance. Seasonal changes in the vegetation surface area, such as for deciduous trees, will change A and hence, the sheltering function throughout the year. Leaf-area index (LAI), a biophysical parameter frequently used to describe stands of trees and crops, is sometimes used as a measure of surface area per unit volume of the shelter. Optical porosity (how dense a shelter “looks”) is frequently used to describe a shelter, but this is somewhat misleading because air can easily penetrate a barrier even though light does not easily pass through it. The density of the shelter, and particularly the presence of gaps in forest belts, also influences how well the trees can survive high winds (Quine, 2003). The processes of gap formation and expansion are related to the spatial and temporal variability in occurrence of strong winds. Once a gap forms it can expand at lower windspeed than that required to form new gaps (Quine, 2003).
79
Figure 3.9 Creation of small-scale turbulence in the wake of a shelter and recovery of the undisturbed flow downwind
2.1.3 Orientation The maximum downwind protected distance of a shelterbelt is achieved when the belt is oriented perpendicular to the wind. For winds oblique to the shelter, the protected zone is restricted to a region close the leeward edge of the shelter (see Figure 3.8). Wind directions oblique to the shelter at high angle of incidence (nearly parallel to the shelter) can create recirculation vorticies in the lee that can locally increase surface windspeeds over those in unprotected areas (Wang and Takle, 1996a).
Figure 3.10 Windspeed reduction behind shelters of width 1 H
with porosities ranging from 10 to 90%
80
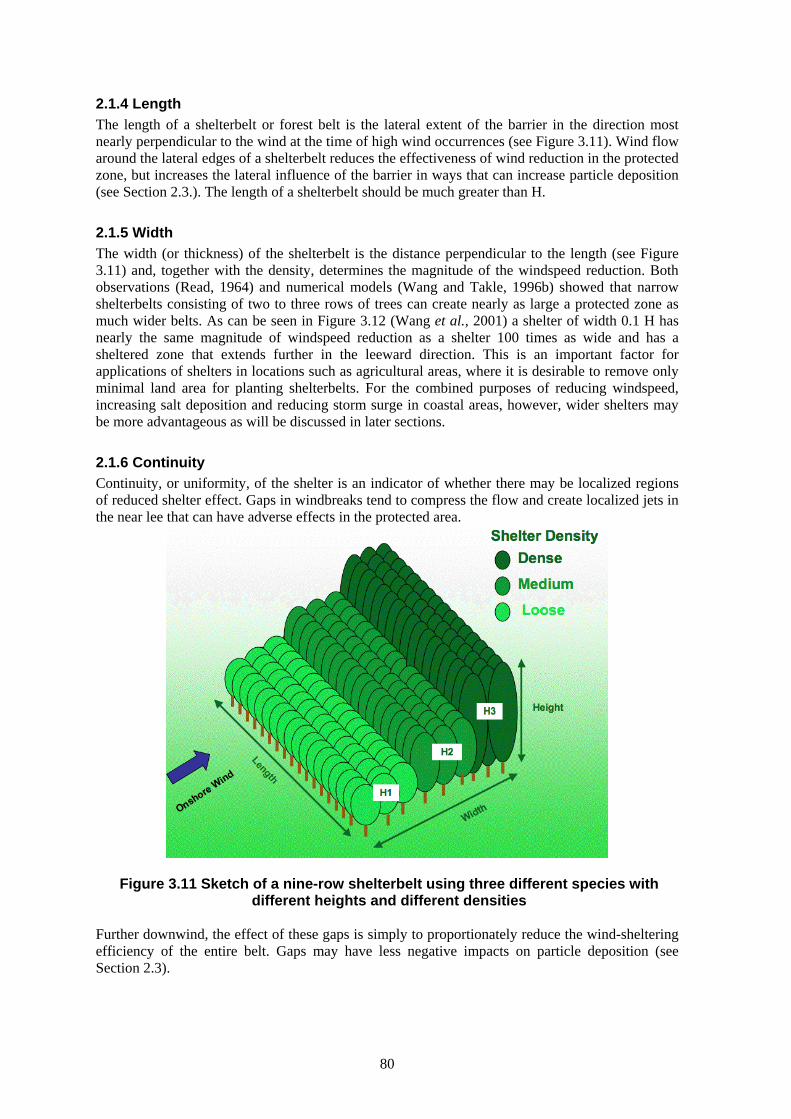
2.1.4 Length The length of a shelterbelt or forest belt is the lateral extent of the barrier in the direction most nearly perpendicular to the wind at the time of high wind occurrences (see Figure 3.11). Wind flow around the lateral edges of a shelterbelt reduces the effectiveness of wind reduction in the protected zone, but increases the lateral influence of the barrier in ways that can increase particle deposition (see Section 2.3.). The length of a shelterbelt should be much greater than H.
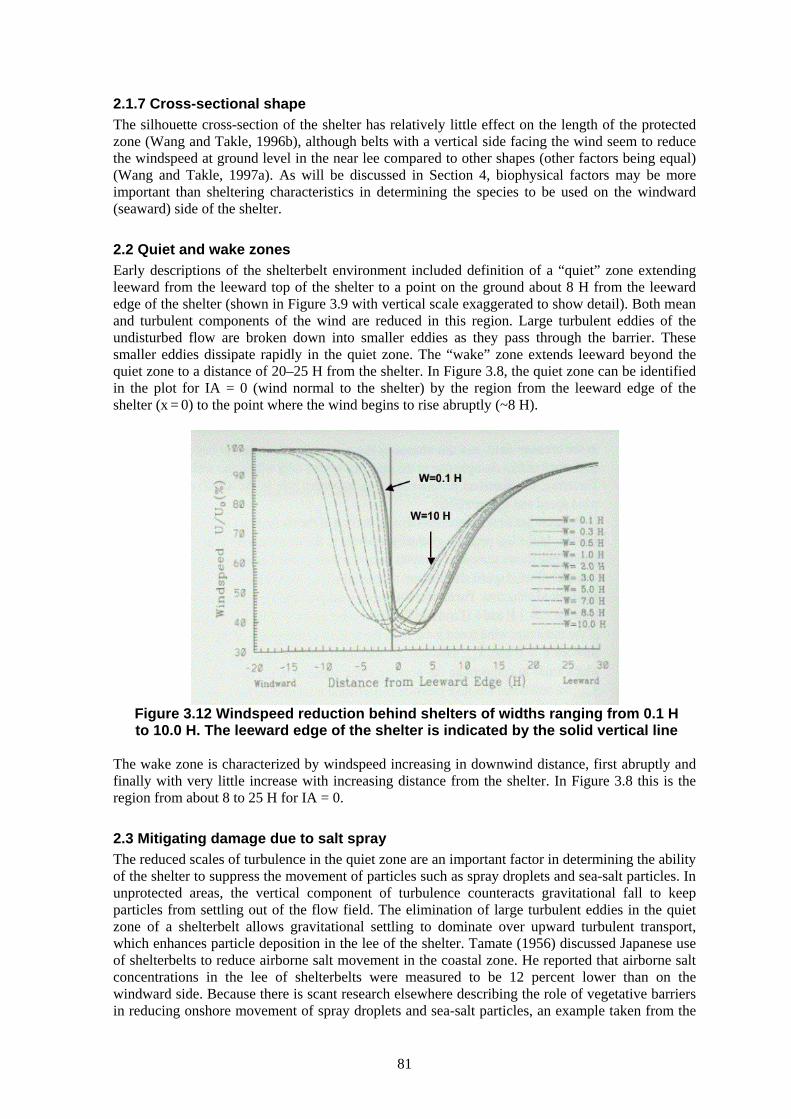
2.1.5 Width The width (or thickness) of the shelterbelt is the distance perpendicular to the length (see Figure 3.11) and, together with the density, determines the magnitude of the windspeed reduction. Both observations (Read, 1964) and numerical models (Wang and Takle, 1996b) showed that narrow shelterbelts consisting of two to three rows of trees can create nearly as large a protected zone as much wider belts. As can be seen in Figure 3.12 (Wang et al., 2001) a shelter of width 0.1 H has nearly the same magnitude of windspeed reduction as a shelter 100 times as wide and has a sheltered zone that extends further in the leeward direction. This is an important factor for applications of shelters in locations such as agricultural areas, where it is desirable to remove only minimal land area for planting shelterbelts. For the combined purposes of reducing windspeed, increasing salt deposition and reducing storm surge in coastal areas, however, wider shelters may be more advantageous as will be discussed in later sections.
2.1.6 Continuity Continuity, or uniformity, of the shelter is an indicator of whether there may be localized regions of reduced shelter effect. Gaps in windbreaks tend to compress the flow and create localized jets in the near lee that can have adverse effects in the protected area.
Figure 3.11 Sketch of a nine-row shelterbelt using three different species with different heights and different densities
Further downwind, the effect of these gaps is simply to proportionately reduce the wind-sheltering efficiency of the entire belt. Gaps may have less negative impacts on particle deposition (see Section 2.3).
81
2.1.7 Cross-sectional shape The silhouette cross-section of the shelter has relatively little effect on the length of the protected zone (Wang and Takle, 1996b), although belts with a vertical side facing the wind seem to reduce the windspeed at ground level in the near lee compared to other shapes (other factors being equal) (Wang and Takle, 1997a). As will be discussed in Section 4, biophysical factors may be more important than sheltering characteristics in determining the species to be used on the windward (seaward) side of the shelter.
2.2 Quiet and wake zones Early descriptions of the shelterbelt environment included definition of a “quiet” zone extending leeward from the leeward top of the shelter to a point on the ground about 8 H from the leeward edge of the shelter (shown in Figure 3.9 with vertical scale exaggerated to show detail). Both mean and turbulent components of the wind are reduced in this region. Large turbulent eddies of the undisturbed flow are broken down into smaller eddies as they pass through the barrier. These smaller eddies dissipate rapidly in the quiet zone. The “wake” zone extends leeward beyond the quiet zone to a distance of 20–25 H from the shelter. In Figure 3.8, the quiet zone can be identified in the plot for IA = 0 (wind normal to the shelter) by the region from the leeward edge of the shelter (x = 0) to the point where the wind begins to rise abruptly (~8 H).
Figure 3.12 Windspeed reduction behind shelters of widths ranging from 0.1 H to 10.0 H. The leeward edge of the shelter is indicated by the solid vertical line
The wake zone is characterized by windspeed increasing in downwind distance, first abruptly and finally with very little increase with increasing distance from the shelter. In Figure 3.8 this is the region from about 8 to 25 H for IA = 0.
2.3 Mitigating damage due to salt spray The reduced scales of turbulence in the quiet zone are an important factor in determining the ability of the shelter to suppress the movement of particles such as spray droplets and sea-salt particles. In unprotected areas, the vertical component of turbulence counteracts gravitational fall to keep particles from settling out of the flow field. The elimination of large turbulent eddies in the quiet zone of a shelterbelt allows gravitational settling to dominate over upward turbulent transport, which enhances particle deposition in the lee of the shelter. Tamate (1956) discussed Japanese use of shelterbelts to reduce airborne salt movement in the coastal zone. He reported that airborne salt concentrations in the lee of shelterbelts were measured to be 12 percent lower than on the windward side. Because there is scant research elsewhere describing the role of vegetative barriers in reducing onshore movement of spray droplets and sea-salt particles, an example taken from the
82
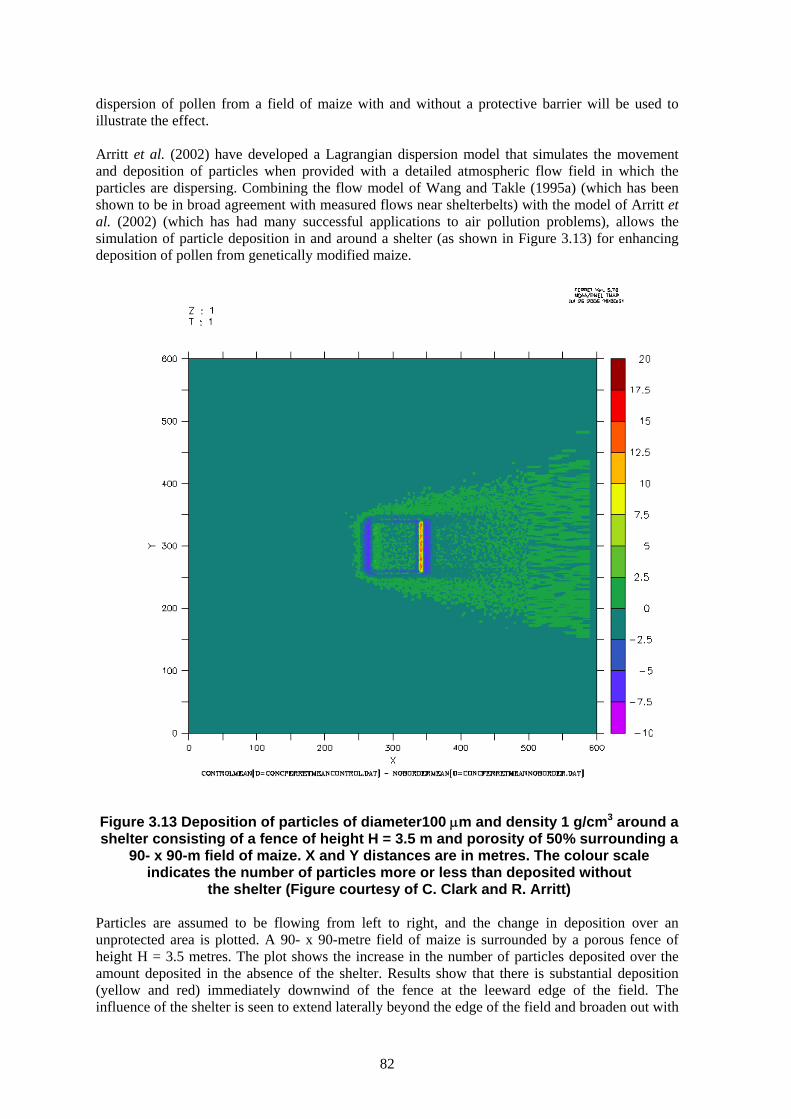
dispersion of pollen from a field of maize with and without a protective barrier will be used to illustrate the effect. Arritt et al. (2002) have developed a Lagrangian dispersion model that simulates the movement and deposition of particles when provided with a detailed atmospheric flow field in which the particles are dispersing. Combining the flow model of Wang and Takle (1995a) (which has been shown to be in broad agreement with measured flows near shelterbelts) with the model of Arritt et al. (2002) (which has had many successful applications to air pollution problems), allows the simulation of particle deposition in and around a shelter (as shown in Figure 3.13) for enhancing deposition of pollen from genetically modified maize.
Figure 3.13 Deposition of particles of diameter100 μm and density 1 g/cm3 around a shelter consisting of a fence of height H = 3.5 m and porosity of 50% surrounding a
90- x 90-m field of maize. X and Y distances are in metres. The colour scale indicates the number of particles more or less than deposited without
the shelter (Figure courtesy of C. Clark and R. Arritt) Particles are assumed to be flowing from left to right, and the change in deposition over an unprotected area is plotted. A 90- x 90-metre field of maize is surrounded by a porous fence of height H = 3.5 metres. The plot shows the increase in the number of particles deposited over the amount deposited in the absence of the shelter. Results show that there is substantial deposition (yellow and red) immediately downwind of the fence at the leeward edge of the field. The influence of the shelter is seen to extend laterally beyond the edge of the field and broaden out with
83
downwind distance. Even in the far lee (beyond 100 metres, or 30 H) the fence produces enhanced deposition compared to an unprotected field. Close inspection reveals that some enhanced deposition also takes place immediately upwind of the shelter. Only in a narrow region immediately behind the upwind and downwind edges of the field is the deposition behind the shelter less than would occur without the shelter. For application to the capture of sea spray and salt particles by coastal forests, we can interpret these results as follows. Compared to a shoreline with no vegetation, a coastal region having shelterbelts or forest fragments will provide regions where locally reduced wind allows droplets and particles to settle out by gravitational settling and by capture due to flow through the vegetation. Even a forest block (in analogy to the fenced region shown in Figure 3.13) will create both enhanced local deposition (bright areas in Figure 3.13) and a “wake region” of deposited particles revealed by the light green region extending leeward and broadening in the downwind direction.
2.4 Establishing shelterbelts as a part of dune restoration Sand dunes lacking vegetation provide an opportunity to develop protective barriers. Because drifting sand creates a hostile environment for developing plantings of woody vegetation, use of grasses for holding the dune intact and preventing saltation (launching of sand particles from the dune by wind action) is the first goal of such restoration. Low levels of organic matter (and hence water-holding capacity) and nutrients (particularly phosphorus and nitrogen) limit the types of grasses that can be used. Soil amendments in the form of manures, leaves, detritus and so forth provide both nutrients for recycling and a means of enhancing plant-available water. Groundnuts provide crop residues rich in nitrogen, and residues from crops in close proximity have proved to be successful sources of such materials (Jerve et al., 2003). Local climate considerations must be addressed to cope with the possible loss of nutrients (particularly nitrogen due to leaching) if heavy rains are a frequent occurrence, and drought-tolerant species if a prolonged dry season is a natural part of the local climate. Reclaiming such sandy areas has been proved difficult but successful, and may take a few years to accomplish. As there is very little, if any, economic return from these initial labour investments, the use of such areas to develop the local agricultural infrastructure will require financial investments in advance. Land-management policies allowing personal ownership or long-term leases provide incentives for the continuation of reclamation practices through the initial revenue-less period. As soon as the dune is stabilized and moving sand is suppressed, seedlings of woody perennials such as shrubs and trees may be introduced. Establishing the shelterbelt on dunes or protective dykes serves multiple purposes. The additional elevation allows better inception of high winds and a deeper layer of the atmospheric boundary layer for the capture of sea spray and salt particles (see Figure 3.7). The presence of woody vegetation also helps to protect the dune or dyke from erosion or from being a source of dust or sand moving inland.
2.5 Use of rigid (non-vegetative) barriers for protection against wind and sea spray Very little research has been done on the combined use of rigid and vegetative barriers for protection against wind and sea spray. Such combinations may, however, provide alternatives that protect newly planted trees from excessive damage, increase the density of a shelterbelt in places where available tree species do not provide sufficient vegetative mass, and reduce the area needed to achieve a particular sheltering objective.
84
3 Guidelines for establishing coastal forests and shelterbelts for reducing wind and particle transport Choosing the types of trees to be used for shelterbelts is dictated largely by the local climate and soil conditions. Of particular concern for shoreline environments is the tolerance to high salt conditions. If the leading edge of the shoreline shelter is to experience regular immersion in saltwater, the most likely choice is a species of mangroves, owing to their high salt tolerance and tolerance of frequent or constant inundation by seawater. Locations beyond the inundation zone have more options for species and allow for the consideration of characteristics that provide ecological and economic benefits in addition to more effective sheltering properties. To enhance the sheltering function, tall trees with strong rooting characteristics, rigid branches and dense foliage would be optimum. Casuarina is an example of this type of tree. Some species of coconuts have been found to be effective in this environment. Their height is a distinct advantage, and grown together with shorter, denser trees (perhaps other fruit or nut-bearing species), they can contribute substantially to wind reduction and the capture of sea-spray droplets and salt particles. Mangroves are the most abundant natural species that grow well and serve a sheltering function in tropical coastal regions. There are 69 species of mangroves worldwide (Selvam et al., 2005) with different levels of salt tolerance. In India, for instance, some coastal and wetland regions have many different mangrove species. They can reach heights of 30 to 35 metres, but typically are much shorter (7–20 metres). Their growth rate is less than one metre per year. Salt tolerance varies widely with some species; Avicennia marina tolerates soil salinity as high as 90 g/l, whereas most mangrove species grow luxuriantly only where the soil salinity is in the range of 10–20 g/l (Selvam et al., 2005). The M.S. Swaminathan Research Foundation (MSSRF) of Chennai, India provides a list of species that can be used for coastal forests and shelterbelts in India:
• Anacardium occidentale L. (cashew nut) • Azadirachta indica A. Juss. (neem tree) • Bambusa arundinacea (Retz.) Roxb. (thorny bamboo) • Bixa orellina L. (saffron) • Borassus flabellifer L. (palm) • Cassia fistula L. (Indian laburnum) • Casuarina equisetifolia Forst. (horse tail tree) • Clerodendrum serratum L. • Cocos nucifera L. (coconut) • Hibiscus tiliaceus L. (coast cotton tree) • Pogamia pinnata L. (Indian beach tree) • Salvadora persica L. (tooth brush tree) • Sapindus emarginatus Vahl (soap nut) • Thespesia populneoides Kostel (Indian tulip tree) • Vitex negundo L.
Selvam et al. (2005) developed a practical guide, published by the MSSRF, that describes mangroves and their multiple benefits for toughening coastal environments against the negative impacts of wind and water. They also provide recommendations for 15 non-mangrove species that have multiple uses (including suppressing windspeed) in coastal environments. Cordia subcordata (kou) is a non-mangrove species that is salt-tolerant and thrives in coastal zones throughout the Pacific Ocean region (Traditionaltree.org, 2006). Rhizophora apiculata and Rhizophora mucronata are two species commonly used in mangrove restoration and afforestation. Their stilt roots provide extra support against strong winds and the wave action of tropical cyclones and tsunamis (Selvam et al., 2005). R. apiculata has large propagules that are easy to collect, making it a favoured (despite its limitations) species for coastal restoration. Others, like Bruguiera spp., grow more like a shrub of 2–6 metres (taller in regions
85
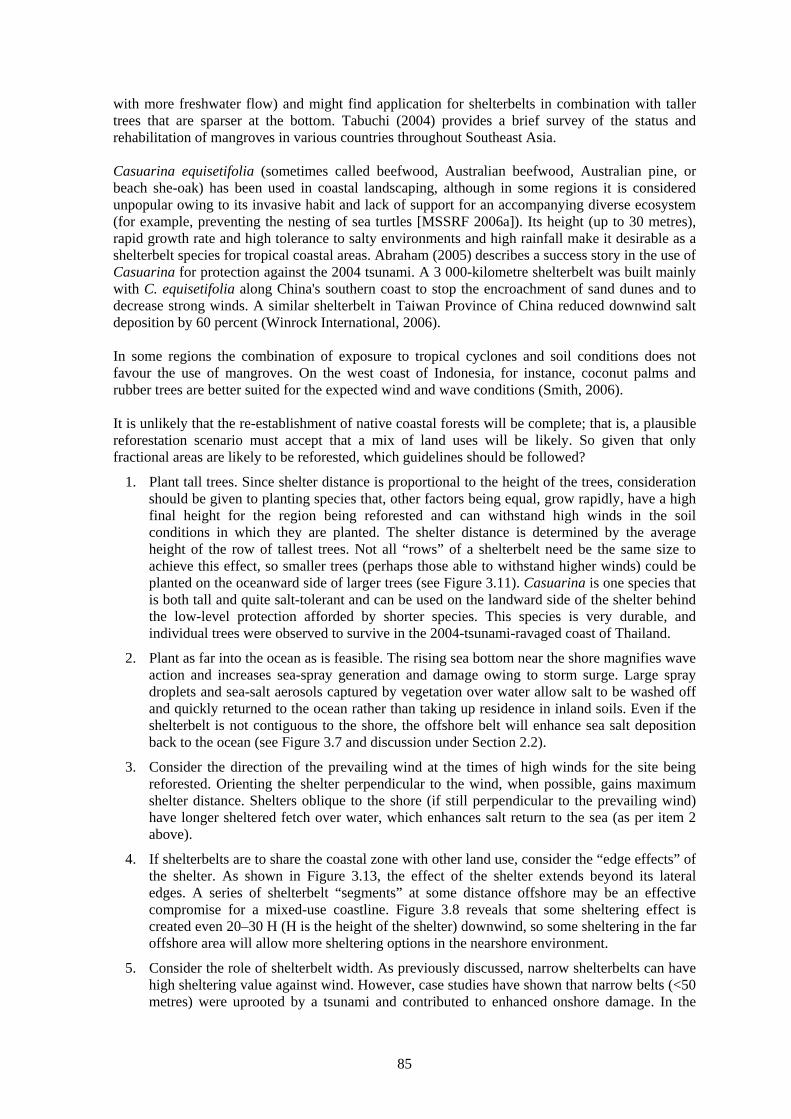
with more freshwater flow) and might find application for shelterbelts in combination with taller trees that are sparser at the bottom. Tabuchi (2004) provides a brief survey of the status and rehabilitation of mangroves in various countries throughout Southeast Asia. Casuarina equisetifolia (sometimes called beefwood, Australian beefwood, Australian pine, or beach she-oak) has been used in coastal landscaping, although in some regions it is considered unpopular owing to its invasive habit and lack of support for an accompanying diverse ecosystem (for example, preventing the nesting of sea turtles [MSSRF 2006a]). Its height (up to 30 metres), rapid growth rate and high tolerance to salty environments and high rainfall make it desirable as a shelterbelt species for tropical coastal areas. Abraham (2005) describes a success story in the use of Casuarina for protection against the 2004 tsunami. A 3 000-kilometre shelterbelt was built mainly with C. equisetifolia along China's southern coast to stop the encroachment of sand dunes and to decrease strong winds. A similar shelterbelt in Taiwan Province of China reduced downwind salt deposition by 60 percent (Winrock International, 2006). In some regions the combination of exposure to tropical cyclones and soil conditions does not favour the use of mangroves. On the west coast of Indonesia, for instance, coconut palms and rubber trees are better suited for the expected wind and wave conditions (Smith, 2006). It is unlikely that the re-establishment of native coastal forests will be complete; that is, a plausible reforestation scenario must accept that a mix of land uses will be likely. So given that only fractional areas are likely to be reforested, which guidelines should be followed?
1. Plant tall trees. Since shelter distance is proportional to the height of the trees, consideration should be given to planting species that, other factors being equal, grow rapidly, have a high final height for the region being reforested and can withstand high winds in the soil conditions in which they are planted. The shelter distance is determined by the average height of the row of tallest trees. Not all “rows” of a shelterbelt need be the same size to achieve this effect, so smaller trees (perhaps those able to withstand higher winds) could be planted on the oceanward side of larger trees (see Figure 3.11). Casuarina is one species that is both tall and quite salt-tolerant and can be used on the landward side of the shelter behind the low-level protection afforded by shorter species. This species is very durable, and individual trees were observed to survive in the 2004-tsunami-ravaged coast of Thailand.
2. Plant as far into the ocean as is feasible. The rising sea bottom near the shore magnifies wave action and increases sea-spray generation and damage owing to storm surge. Large spray droplets and sea-salt aerosols captured by vegetation over water allow salt to be washed off and quickly returned to the ocean rather than taking up residence in inland soils. Even if the shelterbelt is not contiguous to the shore, the offshore belt will enhance sea salt deposition back to the ocean (see Figure 3.7 and discussion under Section 2.2).
3. Consider the direction of the prevailing wind at the times of high winds for the site being reforested. Orienting the shelter perpendicular to the wind, when possible, gains maximum shelter distance. Shelters oblique to the shore (if still perpendicular to the prevailing wind) have longer sheltered fetch over water, which enhances salt return to the sea (as per item 2 above).
4. If shelterbelts are to share the coastal zone with other land use, consider the “edge effects” of the shelter. As shown in Figure 3.13, the effect of the shelter extends beyond its lateral edges. A series of shelterbelt “segments” at some distance offshore may be an effective compromise for a mixed-use coastline. Figure 3.8 reveals that some sheltering effect is created even 20–30 H (H is the height of the shelter) downwind, so some sheltering in the far offshore area will allow more sheltering options in the nearshore environment.
5. Consider the role of shelterbelt width. As previously discussed, narrow shelterbelts can have high sheltering value against wind. However, case studies have shown that narrow belts (<50 metres) were uprooted by a tsunami and contributed to enhanced onshore damage. In the
86
case of combined needs of sheltering against wind and suppressing the effects of storm surge, a wider shelterbelt is more effective. Furthermore, a longer path for air through or near the tops of vegetation increases the amount of momentum extracted and opportunities for capture of salt spray droplets and particles. Local considerations that take into account the likelihood and direction of arrival of both storm winds and tsunami waves should be a guide to determining shelter width.
6. Accept that the most seaward edge of the planting will take the brunt of the damage owing to “flagging” by wind, high salt impaction, or maybe even total destruction (MSSRF 2006b). Plan for higher maintenance and replacement costs for the leading edge plantings. Consideration may be given to use of an artificial fence for this most perilous position in order to better protect the first line of living barrier from salt and wind damage (possibly leading to taller growth and hiding the fence from view from the shore).
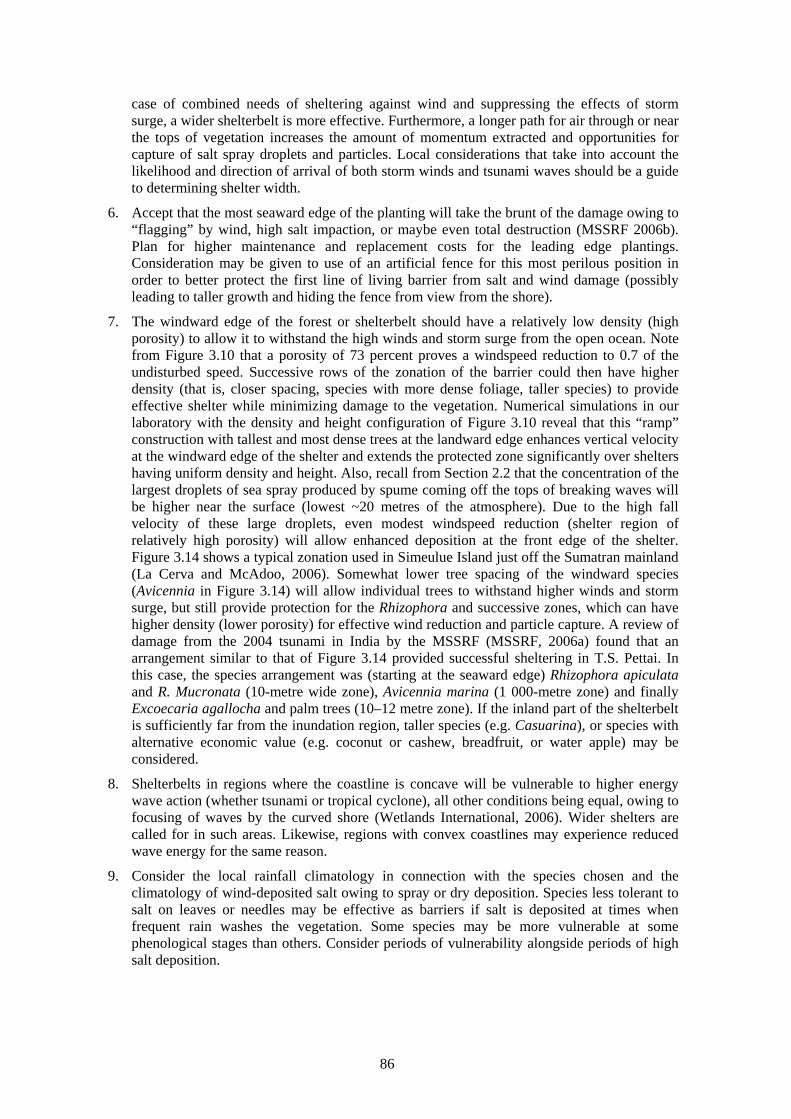
7. The windward edge of the forest or shelterbelt should have a relatively low density (high porosity) to allow it to withstand the high winds and storm surge from the open ocean. Note from Figure 3.10 that a porosity of 73 percent proves a windspeed reduction to 0.7 of the undisturbed speed. Successive rows of the zonation of the barrier could then have higher density (that is, closer spacing, species with more dense foliage, taller species) to provide effective shelter while minimizing damage to the vegetation. Numerical simulations in our laboratory with the density and height configuration of Figure 3.10 reveal that this “ramp” construction with tallest and most dense trees at the landward edge enhances vertical velocity at the windward edge of the shelter and extends the protected zone significantly over shelters having uniform density and height. Also, recall from Section 2.2 that the concentration of the largest droplets of sea spray produced by spume coming off the tops of breaking waves will be higher near the surface (lowest ~20 metres of the atmosphere). Due to the high fall velocity of these large droplets, even modest windspeed reduction (shelter region of relatively high porosity) will allow enhanced deposition at the front edge of the shelter. Figure 3.14 shows a typical zonation used in Simeulue Island just off the Sumatran mainland (La Cerva and McAdoo, 2006). Somewhat lower tree spacing of the windward species (Avicennia in Figure 3.14) will allow individual trees to withstand higher winds and storm surge, but still provide protection for the Rhizophora and successive zones, which can have higher density (lower porosity) for effective wind reduction and particle capture. A review of damage from the 2004 tsunami in India by the MSSRF (MSSRF, 2006a) found that an arrangement similar to that of Figure 3.14 provided successful sheltering in T.S. Pettai. In this case, the species arrangement was (starting at the seaward edge) Rhizophora apiculata and R. Mucronata (10-metre wide zone), Avicennia marina (1 000-metre zone) and finally Excoecaria agallocha and palm trees (10–12 metre zone). If the inland part of the shelterbelt is sufficiently far from the inundation region, taller species (e.g. Casuarina), or species with alternative economic value (e.g. coconut or cashew, breadfruit, or water apple) may be considered.
8. Shelterbelts in regions where the coastline is concave will be vulnerable to higher energy wave action (whether tsunami or tropical cyclone), all other conditions being equal, owing to focusing of waves by the curved shore (Wetlands International, 2006). Wider shelters are called for in such areas. Likewise, regions with convex coastlines may experience reduced wave energy for the same reason.
9. Consider the local rainfall climatology in connection with the species chosen and the climatology of wind-deposited salt owing to spray or dry deposition. Species less tolerant to salt on leaves or needles may be effective as barriers if salt is deposited at times when frequent rain washes the vegetation. Some species may be more vulnerable at some phenological stages than others. Consider periods of vulnerability alongside periods of high salt deposition.
87
4 Environmental and social implications of forest barriers
4.1 Economics of windbreaks The economic gain of establishing windbreaks must be balanced against their cost of establishment and management and foregone benefits of alternative land use. Such alternative use is more easily calculated for agricultural shelterbelts than coastal shelterbelts. However, methods more carefully refined for agricultural applications provide examples for consideration of the economics of coastal shelterbelts. Use of species that are well-adapted to the specific microclimate and microscale soil conditions for coastal shelterbelts and forests reduces both establishment and maintenance costs. Foregone benefits of alternative land use are highly location-dependent, but may include the value of onshore land for residential or tourism purposes. Large offshore fish farms require large areas free of mangroves or other such vegetation. Re-introduction of mangroves over large offshore regions may limit fish-farming opportunities, and establishment of shelterbelts that are contiguous onshore may limit the types of agriculture or forestry that are available in the coastal area. Economic gains include reduced damage to the natural and inland built environment as well as selective harvest of shelterbelt trees or fruit or nut crops. Some factors, such as irreversible massive coastal erosion, may be difficult to value economically. Additionally, improved yields of agricultural or forestry crops owing to reduced damage from wind or salinization provide an offset to the aforementioned costs. Recreational gains from expanded natural areas are offset by foregone gains from recreational use of a vegetation-free shoreline. Similarly, foregone offshore fish farming must be balanced against the aesthetic and practical (for example, water purification, limited harvest of wild species) value of rich and diverse offshore ecosystems. The per hectare cost of establishing mangroves in the intertidal zone where they are non-native has been estimated by Tecleab et al. (2000) for Eritrea to be US$190, including nursery costs, transplanting, fertilizer, protective fences and guarding the area. (The cost of labour in Eritrea is US$2.00 per worker per day.) A large-scale planting scheme in Viet Nam is estimated to have cost about US$92 per hectare (IFRC, 2002). The costs to successfully restore both the vegetative cover and ecological functions of a mangrove forest have been reported by Lewis (2001) to range from US$225 per hectare to US$216 000 per hectare. The local cost of labour has a very large influence on the total cost of establishing such planting schemes.
Figure 3.14 An example of zonation for mangrove species (Simeulue Island) (Adapted from La Cerva
and McAdoo, 2006 with image adapted from http://www.marine.uq.edu.au/
marbot/marineplants/mangrovezone.gif)
88
4.2 Social impacts Re-establishment of natural coastal vegetation re-creates the ecological balance in the landscape. This means that the selection of trees for shelterbelts should favour local native species where possible, in order to promote an environment favourable for various species such as birds, fish, turtles and land animals that are native to the region. This ecological balance promotes a sense of harmony with nature and the sustainability of local communities as well as local landscapes. Introduction (re-introduction) of specialty, locally adaptable agriculture and aquaculture replaces higher impact (chemical inputs, high population monocultures) commodity crops and seafood with lower impact but high-value counterparts targeted at local rather than global markets. This fosters local interdependencies within and among communities and between communities and local ecosystems. For instance, mangrove ecosystems traditionally have been used sustainably for the production of food, medicines, tannins, fuelwood and construction materials (Quarto, 2006). Millions of indigenous coastal residents have depended on mangrove forests to sustain their basic livelihoods and traditional cultures. The rapidly emerging demand for ecotourism offers additional low-impact economic opportunities for such communities. The choice of mangrove species may be a source of disagreement because state programmes prefer Rhizophora for its tolerance to flooding, it can meet the demand for poles, and its convenience in seedling production and planting. Local communities, however, may prefer Avicennia because the leaves are non-toxic and can contribute to pond fertility (Primavera, 2006).
5 Concluding remarks Measurements and numerical model results of flow through shelterbelts provide sufficient information to develop guidelines for re-establishing coastal forests and shelterbelts for increasing protection against wind and sea spray. However, a wide range of factors need to be considered for successful implementation in any given area. These considerations include species available that thrive in local conditions, wind conditions, the level of protection needed, soil quality, topography (both on- and offshore in the coastal region) and the need for shelters to provide other services in addition to protection from wind, to name a few.
6 Acknowledgements We thank Ray Arritt and Craig Clark for use of Figure 3.13. We also acknowledge the assistance of FAO and its reviewers for pointing out opportunities for improvement in early drafts of this manuscript.
89
Bibliography Abraham, T.K. 2005: Indian village beats tsunami with tree power. Reuters News Service.
(http://www.planetark.com/dailynewsstory.cfm?newsid=29275&newsdate=31-Jan-2005). Allen, V. 2006: Plant stress and adaptability in nature and Bonsai.
(http://www.zeta.org.au/~djterry/val1.html) Appleton, B., Greene, V., Smith, A. & S. French. 2003. Trees and shrubs that tolerate saline
soils and salt spray drift. Publication No. 430-031. Virginia Cooperative Extension Service. Arritt, R.W., Riese, J.M., Westgate, M.E., Takle, E.S. & M.J. Falk. 2002. Application of a
Lagrangian model for pollen dispersion. 15th Symposium on Boundary Layers and Turbulence. Amer. Meteor. Soc., Wageningen, the Netherlands.
Brandle, J.R., Hodges, l. & B. Wight. 2000. Windbreak practices. In: H.E. Garrett, W.J. Reitveld & R.F. Fisher, eds. North American agroforestry: an integrated science and practice. Madison, WI, American Society of Agronomy, Inc. 402 pp.
Caborn, J.M. 1957. Shelterbelts and microclimate. Forestry Commission Bull. No. 29. Edinburgh, Edinburgh University.
Carborn, J.M. 1971. The agronomic and biological significance of hedgerows. Outlook Agric., 6: 279–284.
Camargo, S.J. & A.H. Sobel. 2005. Western North Pacific tropical cyclone intensity and ENSO. J. Clim., 18: 2996.
Chan, J.C.L. K.S. & Liu. 2004. Global warming and western North Pacific typhoon activity from an observational perspective. J. Clim., 17: 4590.
Chen, T.-C., Weng, S.-P., Yamazaki, N. & S. Kiehne. 1998. Interannual variation in the tropical cyclone formation over the western North Pacific. Mon. Wea. Rev., 126: 1080–1090.
Chen, T.-C., Wang, S.-Y. & M.-C. Yen. 2006. Interannual variation of the tropical cyclone activity over the western north Pacific. J. Climate (in press).
Das, H.P., Adamenko, T. Il., Anaman, K.A., Gommes, R.G. & G. Johnson. 2003. Agrometeorology related to extreme events. World Meteorological Organization Technical Note 201. (WMO-No. 943). 152 pp. [www.wmo.ch/web/homs/WWD2004/docs/943E.pdf]
Dong, K.-Q. 1988. El Niño and tropical cyclone frequency in the Australian region and the northwest Pacific. Aust. Meteor. Mag., 28: 219–225.
Emanuel, K.A. 2005. Increasing destructiveness of tropical cyclones over the past 30 years. Nature, 436: 686–688.
Griffiths, M.E. & C.M. Orians. 2004. Salt spray effects on forest succession in rare coastal sandplain heathlands: evidence from field surveys and Pinus rigida transplant experiments. J. Torrey Bot. Soc., 131: 23–31.
Hossain, S.M.N. & A. Singh. 2006. Application of GIS for assessing human vulnerability to cyclone in India. [http://gis.esri.com/library/userconf/proc02/pap0701/p0701.html]
IFRC (International Federation of Red Cross and Red Crescent Societies). 2002. World disasters report 2002: focus on reducing risk. 239 pp.
INDOEX. 2006. The Indian Ocean experiment. [http://www-indoex.ucsd.edu/] Jerve, A.M., Minh, V.H., Overa, R., Tran, V.T.N. & H. Warfvinge. 2003. Rural development in
the coastal areas of Trieu Phong District, Quang Tri Province. Royal Norwegian Embassy, Hanoi. 60 pp.
Joint Typhoon Warning Center. 2006. Annual tropical cyclone reports. [http://www.npmoc.navy.mil/jtwc/atcr/atcr_archive.html].
LaCerva, G.R. & B.G. McAdoo. 2006. Simeulue Island mangrove rehabilitation assessment. Poughkeepssie, NY., Department of Geology, Vassar College. 12 pp.
[http://72.14.203.104/search?q=cache:CH07FcrKU68J:faculty.vassar.edu/brmcadoo/Simeulue%2520Mangrove%2520Study.pdf+gina+lacerva+mcadoo&hl=en&gl=us&ct=clnk&cd=1&client=safari]
Lewis, R.R. 2001. Mangrove restoration — costs and benefits of successful ecological restoration. Proceedings of the Mangrove Valuation Workshop. Penang, Universiti Sains Malaysia and Stockholm, Sweden, Beijer International Institute of Ecological Economics.
90
Li-Jones, X. 1998. What has been learned from the Indian Ocean Experiment? A brief summary of results from Pre-INDOEX experiment.
[http://www-indoex.ucsd.edu/whatlearned/whatlearned.html] Lighthill, J., Holland, G.J., Gray, W.M., Landsea, C., Emanuel, K., Craig, G., Evans, J., Kurihara,
Y. & C.P. Guard. 1994. Global climate change and tropical cyclones. Bull. Amer. Meteor. Soc., 75: 2147–2157.
Mann, M.E. & K.A. Emanuel. 2006. Atlantic hurricane trends linked to climate change. EOS, 87: 233, 238, 241.
Mascarenhan, A. 2004. Oceanographic validity of buffer zones for the east coast of India: A hydrometeorological perspective. Current Science, 867: l399–407.
McBride, J.L. 1996. Tropical cyclone formation. Global perspective on tropical cyclones.WMO/TD-NO. 693. World Meteorological Organization. pp.63–105.
Mueller, J.A. & F. Veron. 2005. A Lagrangian turbulent transport model of evolving sea-spray droplets over the ocean. 14th Conference on Interaction of the Sea and Atmosphere. American Meteorolical Society.
MSSRF. 2006a. Tsunami: mangroves, shelterbelts and tsunami in the Picharvaram region. [http://www.mssrf.org/sp/703/703_2.htm]
MSSRF. 2006b. Tsunami & Pichavaram mangroves. [http://www.mssrf.org/tsunami/tsunami_mangroves.htm] Piazzola, J., Forget, P. & S. Despiau. 2002. A sea spray generation function for fetch-limited
conditions. Annales Geophysicae, 20: 121–131. Primavera, J.H. 2006. Integrated mangrove-aquaculture systems in Asia. IUCN, the World
Conservation Union. [http://www.iucn.org] Quarto, A. 2006. The mangrove forest. Mangrove Action Project. [http://www.earthisland.org/map/tsunami.htm]. Quine, C.P. 2003. Wind-driven gap formation and gap expansion in spruce forests of
upland Britain. International Conference “Wind Effects on Trees”, University of Karlsruhe, Germany.
Read, R.A. 1964. Tree windbreaks for the central Great Plaines. U.S. Forest Service Rocky Mountain Forest and Range Experiment Station. Agricultural Handbook 250. Ft. Collins, CO, U.S. Forest Service Rocky Mountain Forest and Range Experiment Station.
Rettori, A., Paoletti, E., De Capua, E. & G. Nicolotti. 2005. Surfactant damages on coastal vegetation in southern Italy. Forest@ 2: 92–97. [http://www.sisef.it/]
Selvam,V., Ravishankar, T., Karunagaran, V.M., Ramasubramaniar, R., Eganathan, P. & A.K. Parida. 2005. Toolkit for establishing coastal bioshield. Centre for Research on Sustainable Agriculture and Rural Development, M.S. Swaminathan Research Foundation. [www. Mssrf.org].
Sequeira, R. & D. Kelkar. 1978. Geochemical implications of summer monsoonal rainwater composition over India. J. Appl. Meteor, 17: 1390–1396.
Smith, M. 2006. The right way to rebuild Asia's coastal barrier. Mangrove forests can act as 'bioshields' against storms. SciDev.Net. 12 January 2006.
[http://www.scidev.net/Features/index.cfm?fuseaction=readFeatures&itemid=492&language=1] Storm Center Communications. 2006. Watersheds. [http://wrc.iewatershed.com/index.php?pagename=education_coast_01] Tabuchi, R. 2004. The rehabilitation of mangroves in Southeast Asia. Hachioji, Japan, Forestry
and Forest Products Research Institute. Tamate, S. 1956. Effect of windbreaks on the decrease of salt content in seawind. Proc. of Int.
For. Res. Org. 12th Congress, Vol. 1. p. 47. Tecleab, S., Ghermai, M., Negassi, S., Ghezae, T., Riley, R. & G. Sato. 2000. Planting mangroves
in non-native environments. The Manzanar Project, Massawa, Eritrea, Ministry of Fisheries. 6 pp. [www.mangrove.org/video/planting.pdf]
Traditionaltree.org. 2006. Species profiles for Pacific Island agroforestry. [http://www.agroforestry.net/tti/Cordia-kou.pdf#search=%22salt%20spray%20mangroves%22].
91
Traxler, K.M., Donahue, C.A., Edwards, M.E., Cloys, K.P., Walters, K.R. Sr., Louer, J.W. III, Higdon, M.L., Harding, J.L., Surls, C.D. & S.A. Straw. 1997. Southeast Asia. A climatological study. AFCCC/TN-97/001. Scott Air Force Base, IL, Air Force Combat Climatology Center.
Tri, N.H., Adger, W.N. & P.M. Kelly. 1998. Natural resource management in mitigating climate impacts: the example of mangrove restoration in Viet Nam. Global Environmental Change, 8: 49–61.
Wang, H. & E.S. Takle. 1995a. Boundary-layer flow and turbulence near porous obstacles. I. Derivation of a general equation set for a porous medium. Bound.-Layer Meteor., 74: 73–88.
Wang, H. & E.S. Takle. 1996a. On shelter efficiency of shelterbelts in oblique winds. Agric. and For. Meteor., 81: 95–117.
Wang, H. & E.S. Takle. 1996b. On three-dimensionality of shelterbelt structure and its influences on shelter effects. Bound.-Layer Meteor., 79: 83–105.
Wang, H. & E.S. Takle. 1997a. Model simulated influences of shelterbelt shape on wind sheltering efficiency. J. Appl. Meteor., 36: 695–704.
Wang, H., Takle, E.S. & J. Shen, 2001. Shelterbelts and windbreaks: mathematical modeling and computer simulation of turbulent flows. Ann. Rev. Fluid Mech., 33: 549–586. (Invited review paper.)
Webster, P.J., Holland, G.J., Curry, J.A. & H.R. Chang. 2005. Changes in tropical cyclone number, duration, and intensity in warming environments. Science, 309: 1844–1846.
Wetlands International. 2006. Impact assessment of tsunami-affected areas. [http://wwww.wetlands.org/greencoast/En/articlemenu.aspx?id=53f2df5e-19f7-4976-a1e0-
26478af312e8] Winrock International. 2006. Difficult sites are home to Casuarina. [http://food-security.info/food-security.info/Winrock%20Archive/casuarina_sp.html] Wu, G. & N.C. Lau. 1992. A GCM simulation of the relationship between tropical storm
formation and ENSO. Mon. Wea. Rev., 120: 958–977. Wu, M.C., Chang, W.L. & W.M. Leung. 2004. Impacts of El Niño Southern Oscillation events
on tropical cyclone land falling activity in the western North Pacific. J. Climate, 17: 1419–1428.
Zhang, K.M., Knipping, E.M., Wexler, A.S., Bhave, P.V. & G.S. Tonnesen. 2005. Size distribution of sea-salt emissions as a function of relative humidity. Atmos. Env., 39: 3373–3379.
Zhu, J.-J., Gonda, Y., Matsuzaki, T. & M. Yamamoto. 2003. Modeling relative wind speed by optical stratification porosity within the canopy of a coastal protective forest at different stem densities. Silva Fennica, 37: 189–204.
92
Field study presentation: Use of coastal shelterbelts along the east coast of India Narasimhan Duvuru, Madras Christian College, India The east coast of India was affected extensively by the Indian Ocean tsunami in 2004. The need for shelterbelts along the coast was realized after this disaster. Plantation along the east coast was carried out prior to the tsunami, especially by forest departments and private landowners as an income generation activity. Plantation activities that address shelterbelts, bioshields and biowalls have gained much attention from all stakeholders in coastal regions after the tsunami. The coastline of Tamil Nadu and Andhra Pradesh is 2 069 kilometres in length. The key players in post-tsunami bioshield plantation activities include state forest departments and several NGOs. Major NGOs involved in developing coastal shelterbelts in Tamil Nadu are the M.S. Swaminathan Research Foundation — Chennai, Anawim, Thiruchendur and the Covenant Centre for Development (CCD), Madurai. Organizations such as the M.S. Swaminathan Research Foundation, Coastal Community Development Programme (CCDP), Sravanthi and Sangamitra are major players in Andhra Pradesh. The Tamil Nadu Forest Department developed plantations covering 2 000 hectares of coastal land in 2005. Anawim, in collaboration with the Tamil Nadu Forest Department as part of an agroforestry programme, has raised plantations of about 71.5 hectares along the southernmost part of the east coast. The M.S. Swaminathan Research Foundation, Chennai, has raised 30 hectares of mangrove shelterbelts and is in the process of developing non-mangrove shelterbelts in six villages along the coast. A mangrove shelterbelt has been the major focus in Andhra Pradesh, where about 100 hectares have been planted jointly by the major NGOs in the state. The Tamil Nadu Forest Department has raised Casuarina as a monocrop in 90 percent of the plantations. Some of the other species that are planted by the department include Anacardium occidentalis, Acacia planifrons, Ficus benghalensis, Madhuca longifolia and Syzygium cumini. The Tamil Nadu agroforestry programme involves communities in the decision-making process. NGOs are planting diverse species, including Casuarina, after taking community views into account. Some of the species preferred by the communities include Thespesia populnea, coconut and cashew. These species serve as bioshields and also improve the livelihoods of the communities. One of the major plantation activities along the coast is by private landowners who plant Casuarina and cashew as cash crops, both in Tamil Nadu and Andhra Pradesh. At several locations in Andhra Pradesh, plantations on private lands were of considerable help in mitigating tsunami damage. A collaborative model for planting private lands needs to be developed. Though Casuarina is an attractive option for planting on coastlines, the mixed species approach, especially using native species, should be encouraged — taking community needs into account. The east coast is characterized by tropical dry evergreen forest. Species in this forest such as Manilkara hexandra, Morinda pubescens, Pongamia pinnata, Gmelina asaitica and Streblus asper can be important components for bioshields and can be linked to the livelihoods of local communities. Apart from species, the length and breath of the shelterbelts should also be discussed with the community. Linking educational institutions in this process can help youth to become involved in this important endeavour by forging academic learning and social responsibility.
93
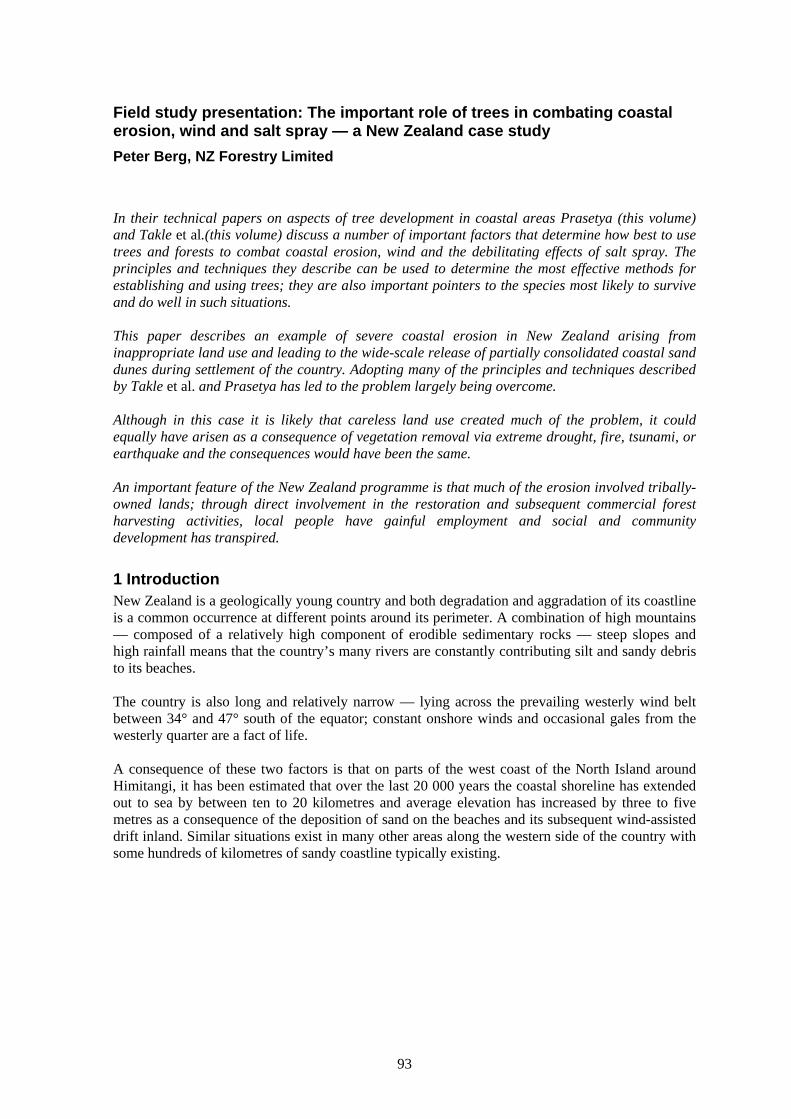
Field study presentation: The important role of trees in combating coastal erosion, wind and salt spray — a New Zealand case study Peter Berg, NZ Forestry Limited
In their technical papers on aspects of tree development in coastal areas Prasetya (this volume) and Takle et al.(this volume) discuss a number of important factors that determine how best to use trees and forests to combat coastal erosion, wind and the debilitating effects of salt spray. The principles and techniques they describe can be used to determine the most effective methods for establishing and using trees; they are also important pointers to the species most likely to survive and do well in such situations. This paper describes an example of severe coastal erosion in New Zealand arising from inappropriate land use and leading to the wide-scale release of partially consolidated coastal sand dunes during settlement of the country. Adopting many of the principles and techniques described by Takle et al. and Prasetya has led to the problem largely being overcome. Although in this case it is likely that careless land use created much of the problem, it could equally have arisen as a consequence of vegetation removal via extreme drought, fire, tsunami, or earthquake and the consequences would have been the same. An important feature of the New Zealand programme is that much of the erosion involved tribally-owned lands; through direct involvement in the restoration and subsequent commercial forest harvesting activities, local people have gainful employment and social and community development has transpired.
1 Introduction New Zealand is a geologically young country and both degradation and aggradation of its coastline is a common occurrence at different points around its perimeter. A combination of high mountains — composed of a relatively high component of erodible sedimentary rocks — steep slopes and high rainfall means that the country’s many rivers are constantly contributing silt and sandy debris to its beaches. The country is also long and relatively narrow — lying across the prevailing westerly wind belt between 34° and 47° south of the equator; constant onshore winds and occasional gales from the westerly quarter are a fact of life. A consequence of these two factors is that on parts of the west coast of the North Island around Himitangi, it has been estimated that over the last 20 000 years the coastal shoreline has extended out to sea by between ten to 20 kilometres and average elevation has increased by three to five metres as a consequence of the deposition of sand on the beaches and its subsequent wind-assisted drift inland. Similar situations exist in many other areas along the western side of the country with some hundreds of kilometres of sandy coastline typically existing.
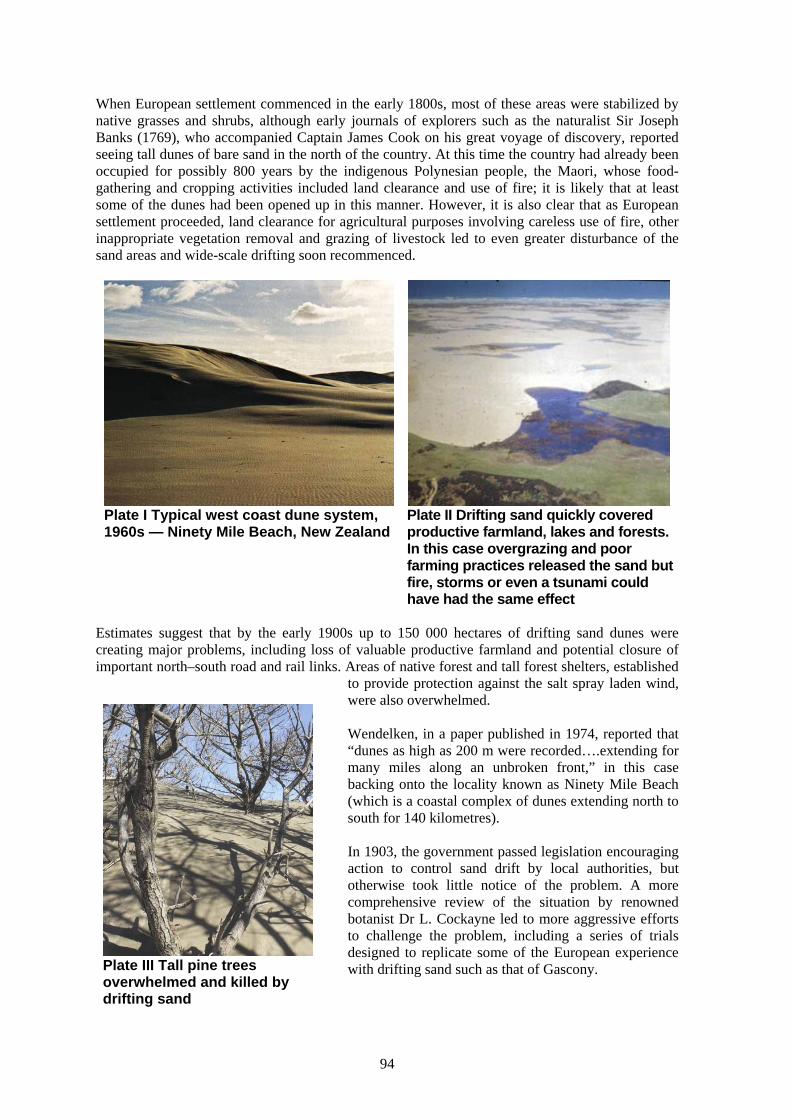
94
When European settlement commenced in the early 1800s, most of these areas were stabilized by native grasses and shrubs, although early journals of explorers such as the naturalist Sir Joseph Banks (1769), who accompanied Captain James Cook on his great voyage of discovery, reported seeing tall dunes of bare sand in the north of the country. At this time the country had already been occupied for possibly 800 years by the indigenous Polynesian people, the Maori, whose food-gathering and cropping activities included land clearance and use of fire; it is likely that at least some of the dunes had been opened up in this manner. However, it is also clear that as European settlement proceeded, land clearance for agricultural purposes involving careless use of fire, other inappropriate vegetation removal and grazing of livestock led to even greater disturbance of the sand areas and wide-scale drifting soon recommenced.
Plate I Typical west coast dune system, 1960s — Ninety Mile Beach, New Zealand
Plate II Drifting sand quickly covered productive farmland, lakes and forests. In this case overgrazing and poor farming practices released the sand but fire, storms or even a tsunami could have had the same effect
Estimates suggest that by the early 1900s up to 150 000 hectares of drifting sand dunes were creating major problems, including loss of valuable productive farmland and potential closure of important north–south road and rail links. Areas of native forest and tall forest shelters, established
to provide protection against the salt spray laden wind, were also overwhelmed. Wendelken, in a paper published in 1974, reported that “dunes as high as 200 m were recorded….extending for many miles along an unbroken front,” in this case backing onto the locality known as Ninety Mile Beach (which is a coastal complex of dunes extending north to south for 140 kilometres). In 1903, the government passed legislation encouraging action to control sand drift by local authorities, but otherwise took little notice of the problem. A more comprehensive review of the situation by renowned botanist Dr L. Cockayne led to more aggressive efforts to challenge the problem, including a series of trials designed to replicate some of the European experience with drifting sand such as that of Gascony.
Plate III Tall pine trees overwhelmed and killed by drifting sand
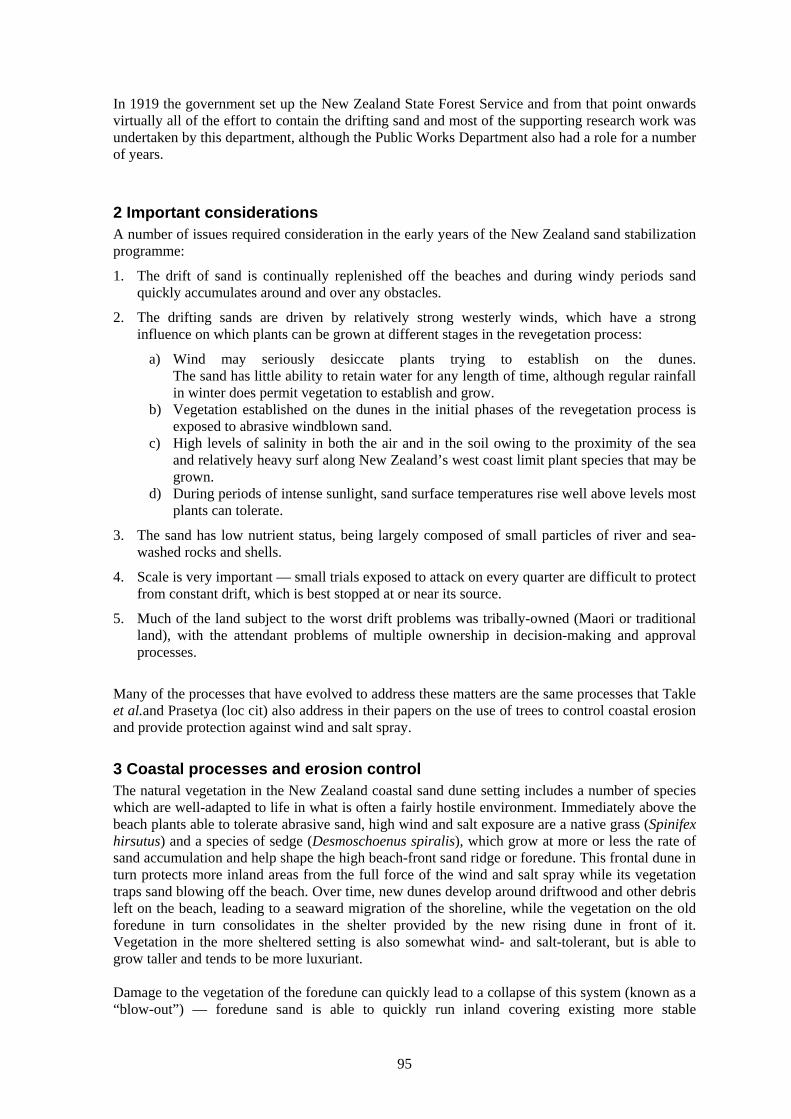
95
In 1919 the government set up the New Zealand State Forest Service and from that point onwards virtually all of the effort to contain the drifting sand and most of the supporting research work was undertaken by this department, although the Public Works Department also had a role for a number of years.
2 Important considerations A number of issues required consideration in the early years of the New Zealand sand stabilization programme:
1. The drift of sand is continually replenished off the beaches and during windy periods sand quickly accumulates around and over any obstacles.
2. The drifting sands are driven by relatively strong westerly winds, which have a strong influence on which plants can be grown at different stages in the revegetation process:
a) Wind may seriously desiccate plants trying to establish on the dunes. The sand has little ability to retain water for any length of time, although regular rainfall in winter does permit vegetation to establish and grow.
b) Vegetation established on the dunes in the initial phases of the revegetation process is exposed to abrasive windblown sand.
c) High levels of salinity in both the air and in the soil owing to the proximity of the sea and relatively heavy surf along New Zealand’s west coast limit plant species that may be grown.
d) During periods of intense sunlight, sand surface temperatures rise well above levels most plants can tolerate.
3. The sand has low nutrient status, being largely composed of small particles of river and sea-washed rocks and shells.
4. Scale is very important — small trials exposed to attack on every quarter are difficult to protect from constant drift, which is best stopped at or near its source.
5. Much of the land subject to the worst drift problems was tribally-owned (Maori or traditional land), with the attendant problems of multiple ownership in decision-making and approval processes.
Many of the processes that have evolved to address these matters are the same processes that Takle et al.and Prasetya (loc cit) also address in their papers on the use of trees to control coastal erosion and provide protection against wind and salt spray.
3 Coastal processes and erosion control The natural vegetation in the New Zealand coastal sand dune setting includes a number of species which are well-adapted to life in what is often a fairly hostile environment. Immediately above the beach plants able to tolerate abrasive sand, high wind and salt exposure are a native grass (Spinifex hirsutus) and a species of sedge (Desmoschoenus spiralis), which grow at more or less the rate of sand accumulation and help shape the high beach-front sand ridge or foredune. This frontal dune in turn protects more inland areas from the full force of the wind and salt spray while its vegetation traps sand blowing off the beach. Over time, new dunes develop around driftwood and other debris left on the beach, leading to a seaward migration of the shoreline, while the vegetation on the old foredune in turn consolidates in the shelter provided by the new rising dune in front of it. Vegetation in the more sheltered setting is also somewhat wind- and salt-tolerant, but is able to grow taller and tends to be more luxuriant. Damage to the vegetation of the foredune can quickly lead to a collapse of this system (known as a “blow-out”) — foredune sand is able to quickly run inland covering existing more stable
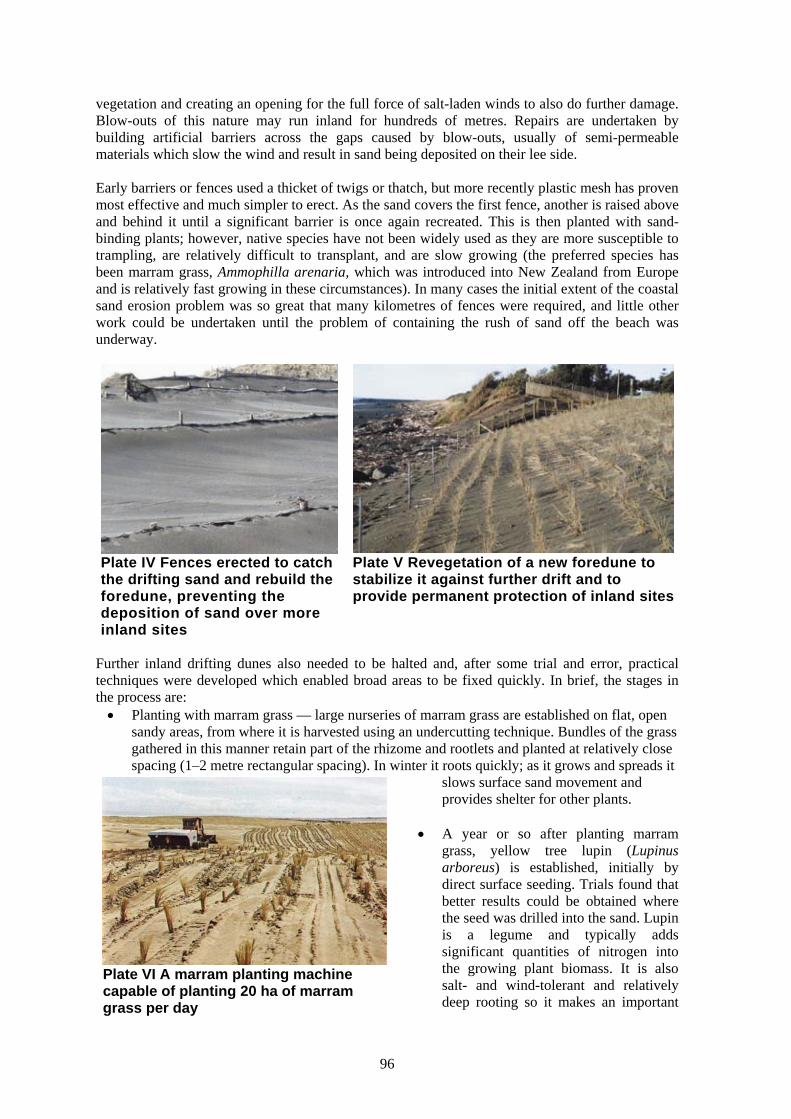
96
vegetation and creating an opening for the full force of salt-laden winds to also do further damage. Blow-outs of this nature may run inland for hundreds of metres. Repairs are undertaken by building artificial barriers across the gaps caused by blow-outs, usually of semi-permeable materials which slow the wind and result in sand being deposited on their lee side. Early barriers or fences used a thicket of twigs or thatch, but more recently plastic mesh has proven most effective and much simpler to erect. As the sand covers the first fence, another is raised above and behind it until a significant barrier is once again recreated. This is then planted with sand-binding plants; however, native species have not been widely used as they are more susceptible to trampling, are relatively difficult to transplant, and are slow growing (the preferred species has been marram grass, Ammophilla arenaria, which was introduced into New Zealand from Europe and is relatively fast growing in these circumstances). In many cases the initial extent of the coastal sand erosion problem was so great that many kilometres of fences were required, and little other work could be undertaken until the problem of containing the rush of sand off the beach was underway.
Plate IV Fences erected to catch the drifting sand and rebuild the foredune, preventing the deposition of sand over more inland sites
Plate V Revegetation of a new foredune to stabilize it against further drift and to provide permanent protection of inland sites
Further inland drifting dunes also needed to be halted and, after some trial and error, practical techniques were developed which enabled broad areas to be fixed quickly. In brief, the stages in the process are: • Planting with marram grass — large nurseries of marram grass are established on flat, open
sandy areas, from where it is harvested using an undercutting technique. Bundles of the grass gathered in this manner retain part of the rhizome and rootlets and planted at relatively close spacing (1–2 metre rectangular spacing). In winter it roots quickly; as it grows and spreads it
slows surface sand movement and provides shelter for other plants.
• A year or so after planting marram
grass, yellow tree lupin (Lupinus arboreus) is established, initially by direct surface seeding. Trials found that better results could be obtained where the seed was drilled into the sand. Lupin is a legume and typically adds significant quantities of nitrogen into the growing plant biomass. It is also salt- and wind-tolerant and relatively deep rooting so it makes an important
Plate VI A marram planting machine capable of planting 20 ha of marram grass per day
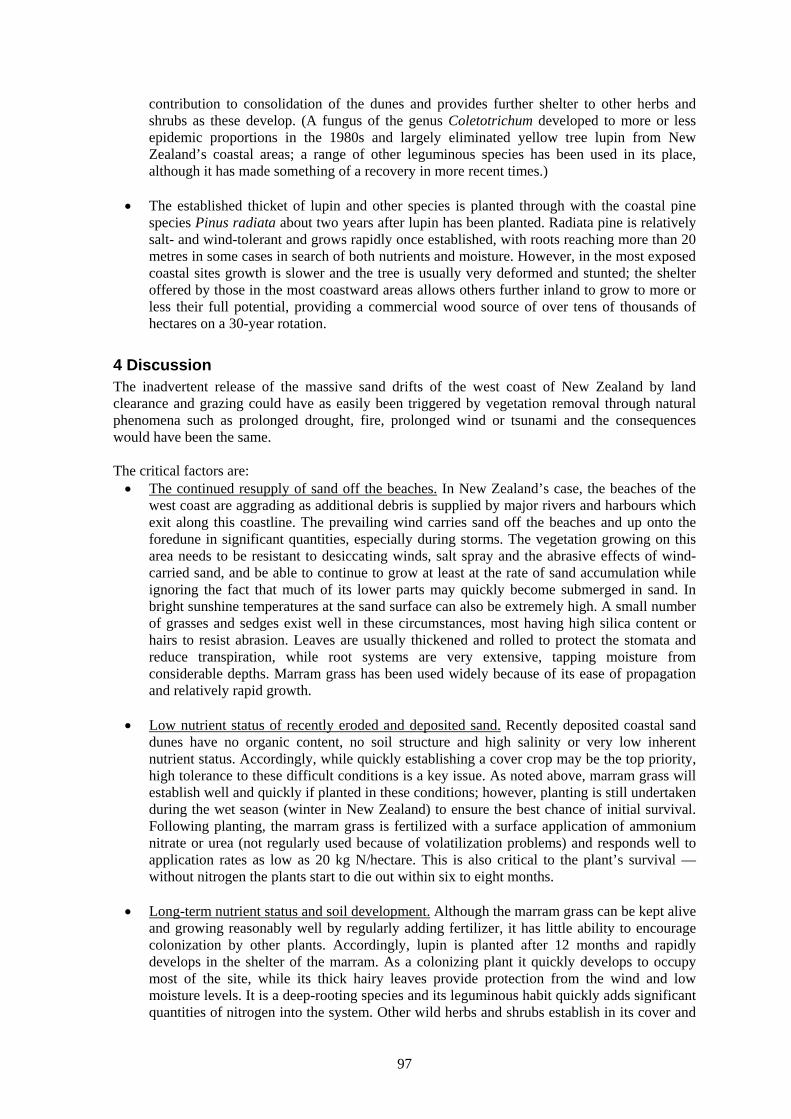
97
contribution to consolidation of the dunes and provides further shelter to other herbs and shrubs as these develop. (A fungus of the genus Coletotrichum developed to more or less epidemic proportions in the 1980s and largely eliminated yellow tree lupin from New Zealand’s coastal areas; a range of other leguminous species has been used in its place, although it has made something of a recovery in more recent times.)
• The established thicket of lupin and other species is planted through with the coastal pine
species Pinus radiata about two years after lupin has been planted. Radiata pine is relatively salt- and wind-tolerant and grows rapidly once established, with roots reaching more than 20 metres in some cases in search of both nutrients and moisture. However, in the most exposed coastal sites growth is slower and the tree is usually very deformed and stunted; the shelter offered by those in the most coastward areas allows others further inland to grow to more or less their full potential, providing a commercial wood source of over tens of thousands of hectares on a 30-year rotation.
4 Discussion The inadvertent release of the massive sand drifts of the west coast of New Zealand by land clearance and grazing could have as easily been triggered by vegetation removal through natural phenomena such as prolonged drought, fire, prolonged wind or tsunami and the consequences would have been the same. The critical factors are: • The continued resupply of sand off the beaches. In New Zealand’s case, the beaches of the
west coast are aggrading as additional debris is supplied by major rivers and harbours which exit along this coastline. The prevailing wind carries sand off the beaches and up onto the foredune in significant quantities, especially during storms. The vegetation growing on this area needs to be resistant to desiccating winds, salt spray and the abrasive effects of wind-carried sand, and be able to continue to grow at least at the rate of sand accumulation while ignoring the fact that much of its lower parts may quickly become submerged in sand. In bright sunshine temperatures at the sand surface can also be extremely high. A small number of grasses and sedges exist well in these circumstances, most having high silica content or hairs to resist abrasion. Leaves are usually thickened and rolled to protect the stomata and reduce transpiration, while root systems are very extensive, tapping moisture from considerable depths. Marram grass has been used widely because of its ease of propagation and relatively rapid growth.
• Low nutrient status of recently eroded and deposited sand. Recently deposited coastal sand
dunes have no organic content, no soil structure and high salinity or very low inherent nutrient status. Accordingly, while quickly establishing a cover crop may be the top priority, high tolerance to these difficult conditions is a key issue. As noted above, marram grass will establish well and quickly if planted in these conditions; however, planting is still undertaken during the wet season (winter in New Zealand) to ensure the best chance of initial survival. Following planting, the marram grass is fertilized with a surface application of ammonium nitrate or urea (not regularly used because of volatilization problems) and responds well to application rates as low as 20 kg N/hectare. This is also critical to the plant’s survival — without nitrogen the plants start to die out within six to eight months.
• Long-term nutrient status and soil development. Although the marram grass can be kept alive
and growing reasonably well by regularly adding fertilizer, it has little ability to encourage colonization by other plants. Accordingly, lupin is planted after 12 months and rapidly develops in the shelter of the marram. As a colonizing plant it quickly develops to occupy most of the site, while its thick hairy leaves provide protection from the wind and low moisture levels. It is a deep-rooting species and its leguminous habit quickly adds significant quantities of nitrogen into the system. Other wild herbs and shrubs establish in its cover and
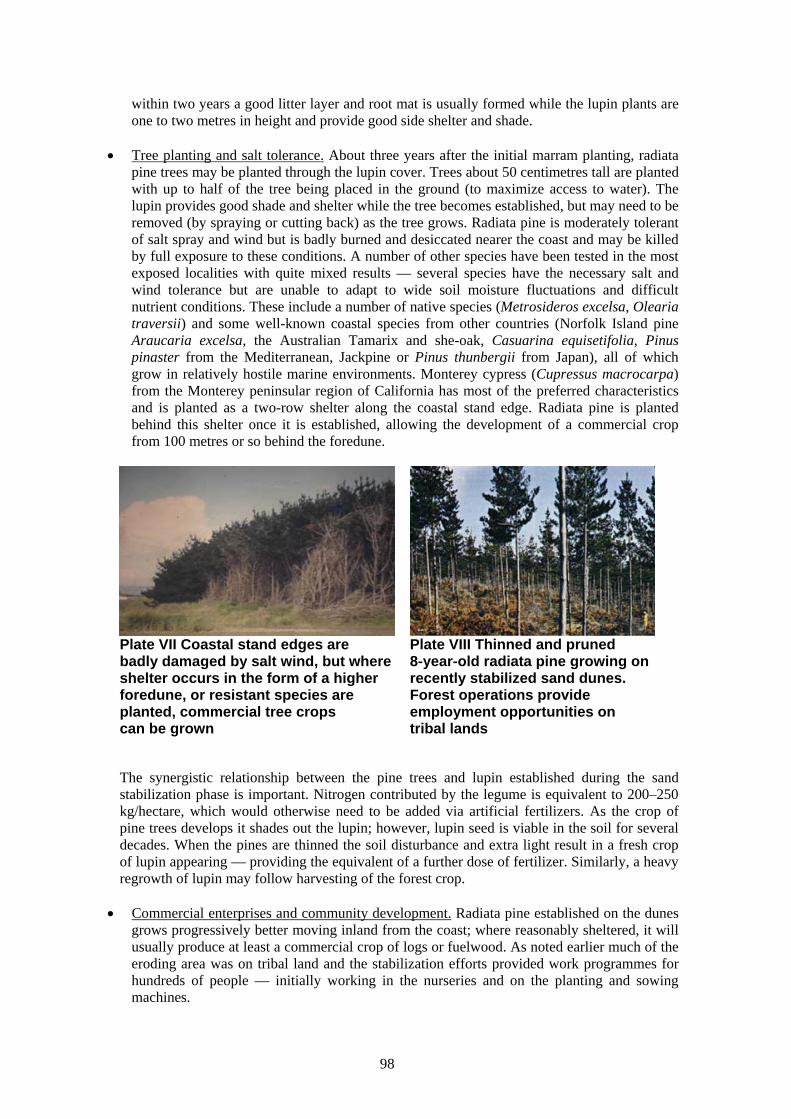
98
within two years a good litter layer and root mat is usually formed while the lupin plants are one to two metres in height and provide good side shelter and shade.
• Tree planting and salt tolerance. About three years after the initial marram planting, radiata
pine trees may be planted through the lupin cover. Trees about 50 centimetres tall are planted with up to half of the tree being placed in the ground (to maximize access to water). The lupin provides good shade and shelter while the tree becomes established, but may need to be removed (by spraying or cutting back) as the tree grows. Radiata pine is moderately tolerant of salt spray and wind but is badly burned and desiccated nearer the coast and may be killed by full exposure to these conditions. A number of other species have been tested in the most exposed localities with quite mixed results — several species have the necessary salt and wind tolerance but are unable to adapt to wide soil moisture fluctuations and difficult nutrient conditions. These include a number of native species (Metrosideros excelsa, Olearia traversii) and some well-known coastal species from other countries (Norfolk Island pine Araucaria excelsa, the Australian Tamarix and she-oak, Casuarina equisetifolia, Pinus pinaster from the Mediterranean, Jackpine or Pinus thunbergii from Japan), all of which grow in relatively hostile marine environments. Monterey cypress (Cupressus macrocarpa) from the Monterey peninsular region of California has most of the preferred characteristics and is planted as a two-row shelter along the coastal stand edge. Radiata pine is planted behind this shelter once it is established, allowing the development of a commercial crop from 100 metres or so behind the foredune.
Plate VII Coastal stand edges are badly damaged by salt wind, but where shelter occurs in the form of a higher foredune, or resistant species are planted, commercial tree crops can be grown
Plate VIII Thinned and pruned 8-year-old radiata pine growing on recently stabilized sand dunes. Forest operations provide employment opportunities on tribal lands
The synergistic relationship between the pine trees and lupin established during the sand stabilization phase is important. Nitrogen contributed by the legume is equivalent to 200–250 kg/hectare, which would otherwise need to be added via artificial fertilizers. As the crop of pine trees develops it shades out the lupin; however, lupin seed is viable in the soil for several decades. When the pines are thinned the soil disturbance and extra light result in a fresh crop of lupin appearing — providing the equivalent of a further dose of fertilizer. Similarly, a heavy regrowth of lupin may follow harvesting of the forest crop.
• Commercial enterprises and community development. Radiata pine established on the dunes
grows progressively better moving inland from the coast; where reasonably sheltered, it will usually produce at least a commercial crop of logs or fuelwood. As noted earlier much of the eroding area was on tribal land and the stabilization efforts provided work programmes for hundreds of people — initially working in the nurseries and on the planting and sowing machines.
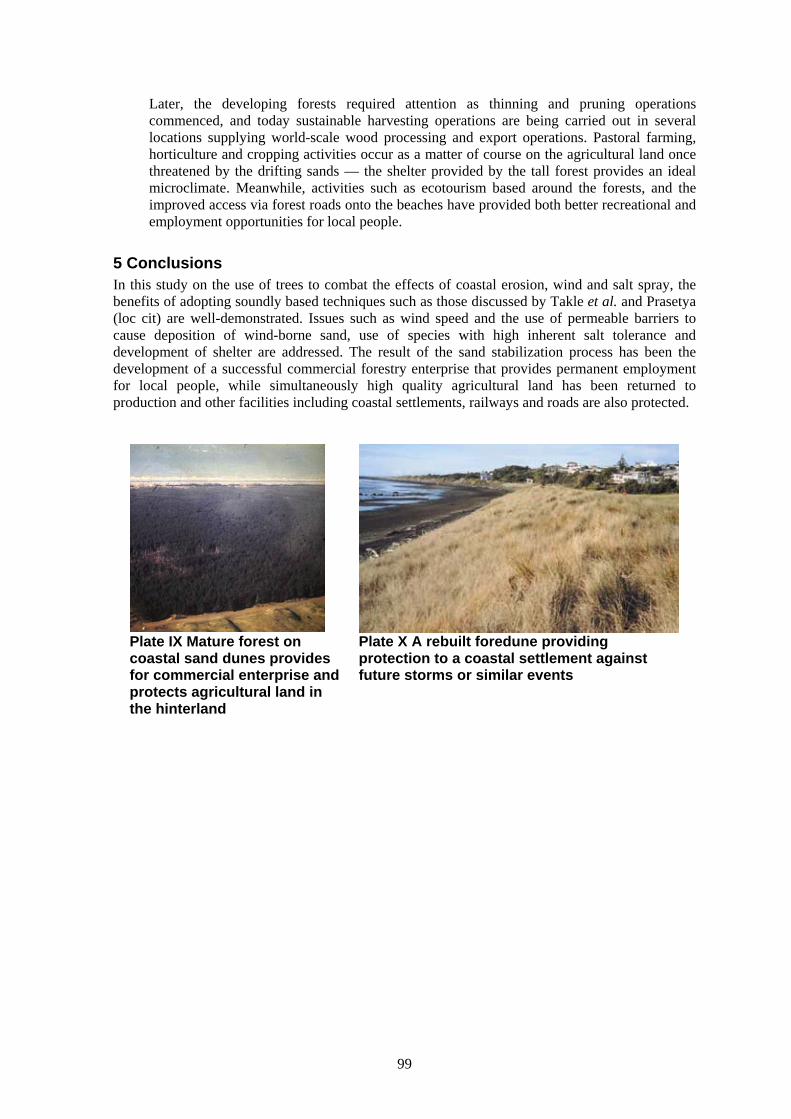
99
Later, the developing forests required attention as thinning and pruning operations commenced, and today sustainable harvesting operations are being carried out in several locations supplying world-scale wood processing and export operations. Pastoral farming, horticulture and cropping activities occur as a matter of course on the agricultural land once threatened by the drifting sands — the shelter provided by the tall forest provides an ideal microclimate. Meanwhile, activities such as ecotourism based around the forests, and the improved access via forest roads onto the beaches have provided both better recreational and employment opportunities for local people.
5 Conclusions In this study on the use of trees to combat the effects of coastal erosion, wind and salt spray, the benefits of adopting soundly based techniques such as those discussed by Takle et al. and Prasetya (loc cit) are well-demonstrated. Issues such as wind speed and the use of permeable barriers to cause deposition of wind-borne sand, use of species with high inherent salt tolerance and development of shelter are addressed. The result of the sand stabilization process has been the development of a successful commercial forestry enterprise that provides permanent employment for local people, while simultaneously high quality agricultural land has been returned to production and other facilities including coastal settlements, railways and roads are also protected.
Plate IX Mature forest on coastal sand dunes provides for commercial enterprise and protects agricultural land in the hinterland
Plate X A rebuilt foredune providing protection to a coastal settlement against future storms or similar events
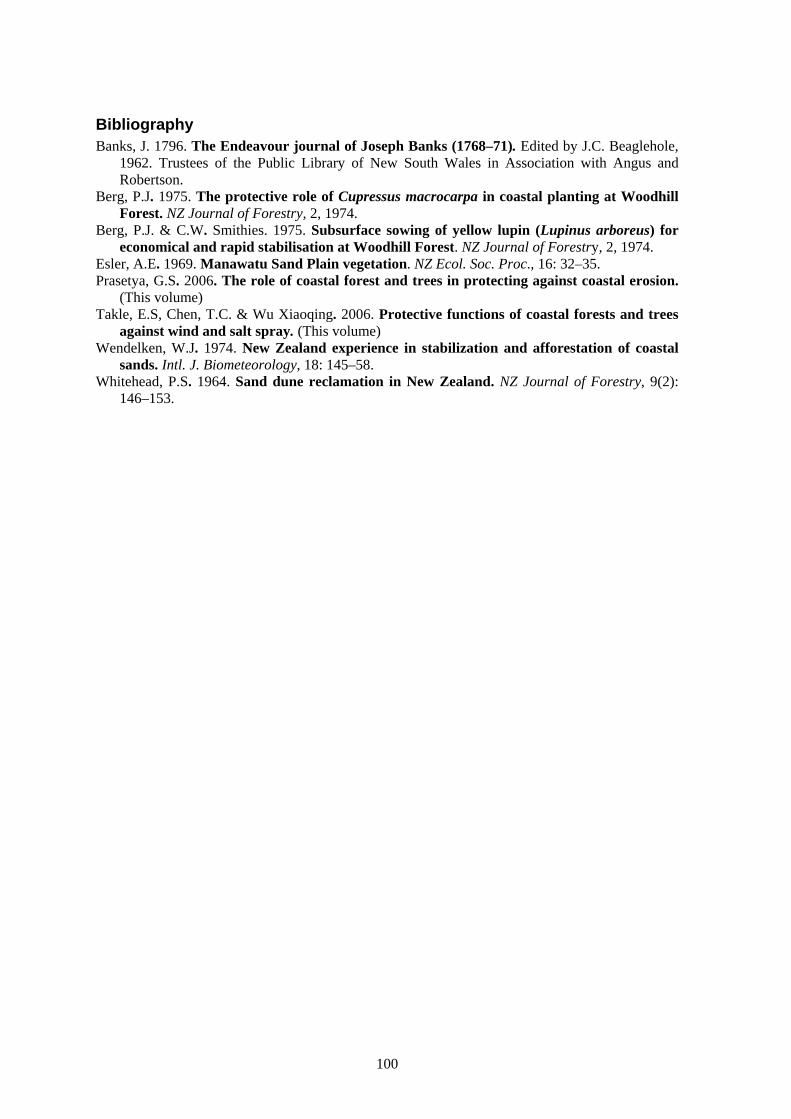
100
Bibliography Banks, J. 1796. The Endeavour journal of Joseph Banks (1768–71). Edited by J.C. Beaglehole,
1962. Trustees of the Public Library of New South Wales in Association with Angus and Robertson.
Berg, P.J. 1975. The protective role of Cupressus macrocarpa in coastal planting at Woodhill Forest. NZ Journal of Forestry, 2, 1974.
Berg, P.J. & C.W. Smithies. 1975. Subsurface sowing of yellow lupin (Lupinus arboreus) for economical and rapid stabilisation at Woodhill Forest. NZ Journal of Forestry, 2, 1974.
Esler, A.E. 1969. Manawatu Sand Plain vegetation. NZ Ecol. Soc. Proc., 16: 32–35. Prasetya, G.S. 2006. The role of coastal forest and trees in protecting against coastal erosion.
(This volume) Takle, E.S, Chen, T.C. & Wu Xiaoqing. 2006. Protective functions of coastal forests and trees
against wind and salt spray. (This volume) Wendelken, W.J. 1974. New Zealand experience in stabilization and afforestation of coastal
sands. Intl. J. Biometeorology, 18: 145–58. Whitehead, P.S. 1964. Sand dune reclamation in New Zealand. NZ Journal of Forestry, 9(2):
146–153.
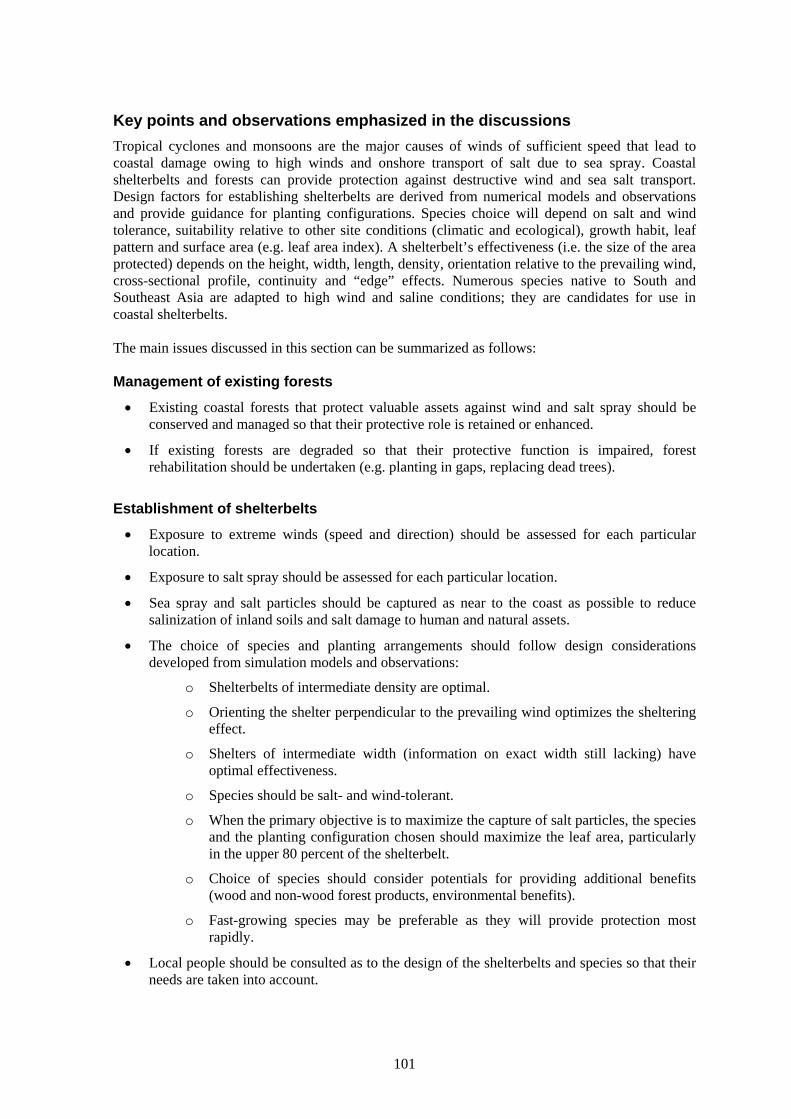
101
Key points and observations emphasized in the discussions Tropical cyclones and monsoons are the major causes of winds of sufficient speed that lead to coastal damage owing to high winds and onshore transport of salt due to sea spray. Coastal shelterbelts and forests can provide protection against destructive wind and sea salt transport. Design factors for establishing shelterbelts are derived from numerical models and observations and provide guidance for planting configurations. Species choice will depend on salt and wind tolerance, suitability relative to other site conditions (climatic and ecological), growth habit, leaf pattern and surface area (e.g. leaf area index). A shelterbelt’s effectiveness (i.e. the size of the area protected) depends on the height, width, length, density, orientation relative to the prevailing wind, cross-sectional profile, continuity and “edge” effects. Numerous species native to South and Southeast Asia are adapted to high wind and saline conditions; they are candidates for use in coastal shelterbelts. The main issues discussed in this section can be summarized as follows: Management of existing forests
• Existing coastal forests that protect valuable assets against wind and salt spray should be conserved and managed so that their protective role is retained or enhanced.
• If existing forests are degraded so that their protective function is impaired, forest rehabilitation should be undertaken (e.g. planting in gaps, replacing dead trees).
Establishment of shelterbelts
• Exposure to extreme winds (speed and direction) should be assessed for each particular location.
• Exposure to salt spray should be assessed for each particular location.
• Sea spray and salt particles should be captured as near to the coast as possible to reduce salinization of inland soils and salt damage to human and natural assets.
• The choice of species and planting arrangements should follow design considerations developed from simulation models and observations:
o Shelterbelts of intermediate density are optimal.
o Orienting the shelter perpendicular to the prevailing wind optimizes the sheltering effect.
o Shelters of intermediate width (information on exact width still lacking) have optimal effectiveness.
o Species should be salt- and wind-tolerant.
o When the primary objective is to maximize the capture of salt particles, the species and the planting configuration chosen should maximize the leaf area, particularly in the upper 80 percent of the shelterbelt.
o Choice of species should consider potentials for providing additional benefits (wood and non-wood forest products, environmental benefits).
o Fast-growing species may be preferable as they will provide protection most rapidly.
• Local people should be consulted as to the design of the shelterbelts and species so that their needs are taken into account.
102
Sand dune stabilization
• Maintaining natural vegetation cover on dunes is important.
• Destabilized dune systems can be stabilized by combined use of physical structures (nets, fencing) to provide initial stabilization and then fast-growing ground vegetation and trees.
• Once the dune system is stabilized, trees of higher value may be used.