Embed Size (px)
Citation preview
2004 Employee Survey Report Chapter 3 | Overall Results
Success Through People 1919 Success Through People
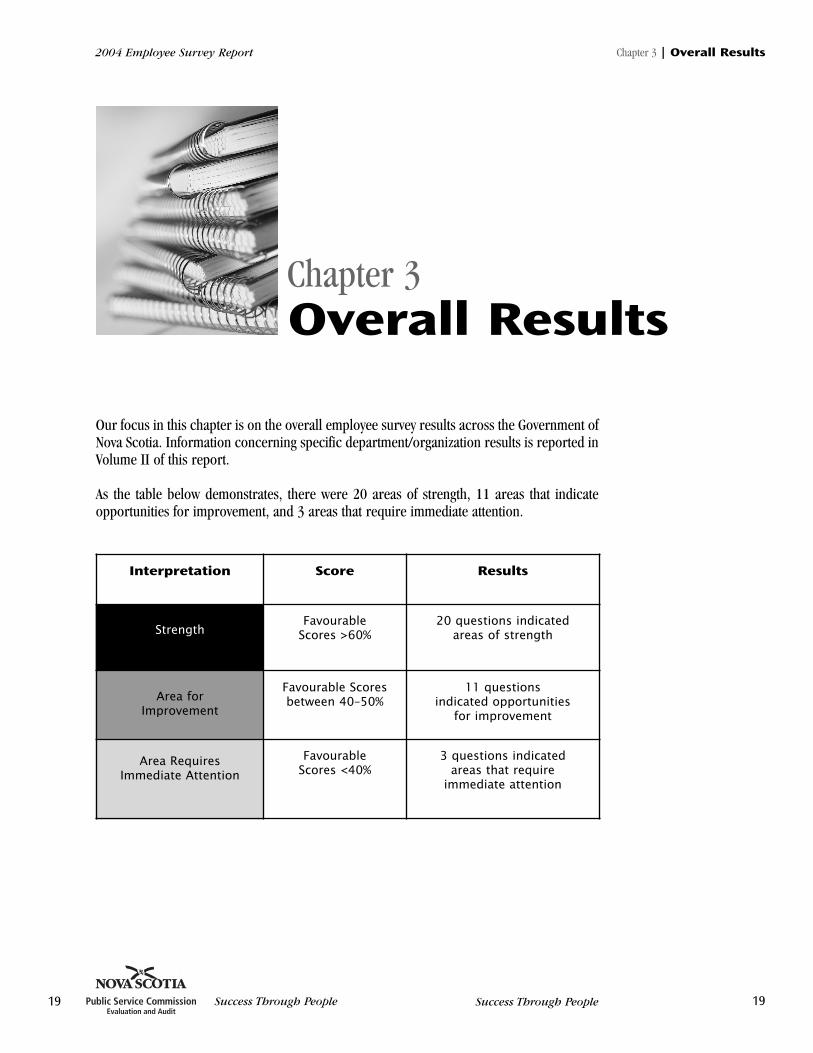
Our focus in this chapter is on the overall employee survey results across the Government ofNova Scotia. Information concerning specific department/organization results is reported inVolume II of this report.
As the table below demonstrates, there were 20 areas of strength, 11 areas that indicateopportunities for improvement, and 3 areas that require immediate attention.
Chapter 3Overall Results
Interpretation Score Results
StrengthFavourable
Scores >60%20 questions indicated
areas of strength
Area for Improvement
Favourable Scoresbetween 40–50%
11 questions indicated opportunities
for improvement
Area Requires Immediate Attention
Favourable Scores <40%
3 questions indicated areas that require
immediate attention
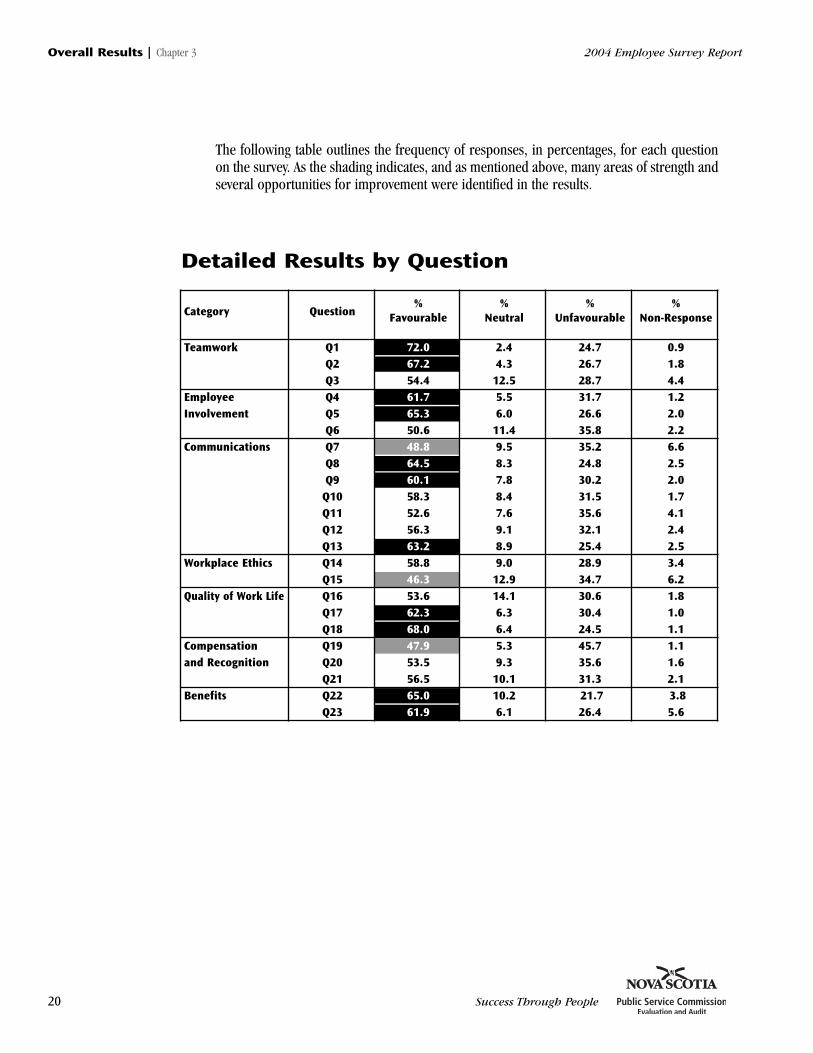
The following table outlines the frequency of responses, in percentages, for each questionon the survey. As the shading indicates, and as mentioned above, many areas of strength andseveral opportunities for improvement were identified in the results.
Overall Results | Chapter 3 2004 Employee Survey Report
20 Success Through People
Category Question%
Favourable
%
Neutral
%
Unfavourable
%
Non-Response
Teamwork Q1 72.0 2.4 24.7 0.9
Q2 67.2 4.3 26.7 1.8
Q3 54.4 12.5 28.7 4.4
Employee Q4 61.7 5.5 31.7 1.2
Involvement Q5 65.3 6.0 26.6 2.0
Q6 50.6 11.4 35.8 2.2
Communications Q7 48.8 9.5 35.2 6.6
Q8 64.5 8.3 24.8 2.5
Q9 60.1 7.8 30.2 2.0
Q10 58.3 8.4 31.5 1.7
Q11 52.6 7.6 35.6 4.1
Q12 56.3 9.1 32.1 2.4
Q13 63.2 8.9 25.4 2.5
Workplace Ethics Q14 58.8 9.0 28.9 3.4
Q15 46.3 12.9 34.7 6.2
Quality of Work Life Q16 53.6 14.1 30.6 1.8
Q17 62.3 6.3 30.4 1.0
Q18 68.0 6.4 24.5 1.1
Compensation Q19 47.9 5.3 45.7 1.1
and Recognition Q20 53.5 9.3 35.6 1.6
Q21 56.5 10.1 31.3 2.1
Benefits Q22 65.0 10.2 21.7 3.8
Q23 61.9 6.1 26.4 5.6
Detailed Results by Question
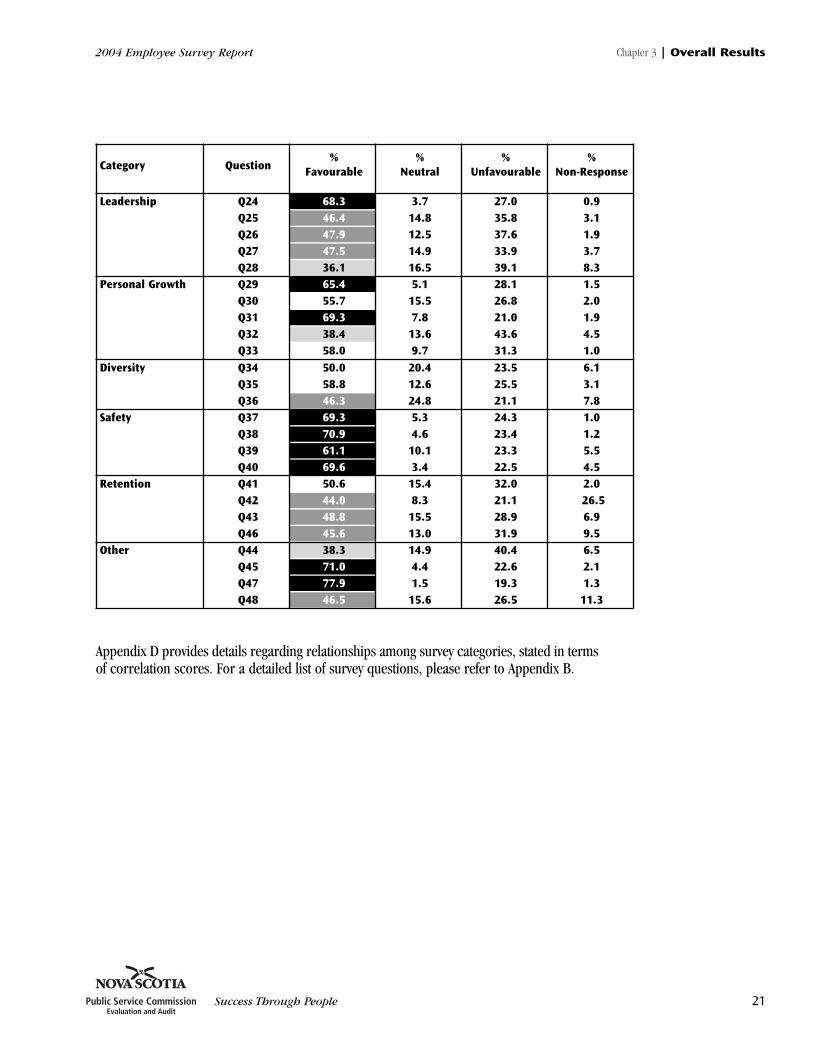
Appendix D provides details regarding relationships among survey categories, stated in termsof correlation scores. For a detailed list of survey questions, please refer to Appendix B.
2004 Employee Survey Report Chapter 3 | Overall Results
Success Through People 21
Diversity Q34 50.0 20.4 23.5 6.1
Q35 58.8 12.6 25.5 3.1
Q36 46.3 24.8 21.1 7.8
Safety Q37 69.3 5.3 24.3 1.0
Q38 70.9 4.6 23.4 1.2
Q39 61.1 10.1 23.3 5.5
Q40 69.6 3.4 22.5 4.5
Retention Q41 50.6 15.4 32.0 2.0
Q42 44.0 8.3 21.1 26.5
Q43 48.8 15.5 28.9 6.9
Q46 45.6 13.0 31.9 9.5
Other Q44 38.3 14.9 40.4 6.5
Q45 71.0 4.4 22.6 2.1
Q47 77.9 1.5 19.3 1.3
Q48 46.5 15.6 26.5 11.3
Category Question%
Favourable
%
Neutral
%
Unfavourable
%
Non-Response
Leadership Q24 68.3 3.7 27.0 0.9
Q25 46.4 14.8 35.8 3.1
Q26 47.9 12.5 37.6 1.9
Q27 47.5 14.9 33.9 3.7
Q28 36.1 16.5 39.1 8.3
Personal Growth Q29 65.4 5.1 28.1 1.5
Q30 55.7 15.5 26.8 2.0
Q31 69.3 7.8 21.0 1.9
Q32 38.4 13.6 43.6 4.5
Q33 58.0 9.7 31.3 1.0
Results
Teamwork
What are the strengths?
Employees feel that they work as part of a team. Seventy-two per cent of employees feel thattheir co-workers make an effort to help each other out. Sixty-seven per cent of employeesfeel that they work as part of a team.
What are the opportunities for improvement?
Fifty-four per cent of employees feel that shared goals are developed for their workgroup,which did not meet the target threshold of 60% in order to be considered a strength.
Recommendation 1 — It is recommended that the Government of Nova Scotiaidentify opportunities for continuous improvement, in order to continue building thisarea of strength.
Employee Involvement
What are the strengths?
Employees responded positively to questions regarding employee involvement. Sixty-two percent of employees feel that they can provide input on decisions that affect their jobs. Sixty-five per cent of employees feel that their supervisor considers their work-related ideas.
What are the opportunities for improvement?
Fifty-one per cent of employees feel that they can provide input into decisions that are madein their department.
Recommendation — please refer to Recommendation 1.
Overall Results | Chapter 3 2004 Employee Survey Report
22 Success Through People
Communications
What are the strengths?
Employees know how their work contributes to the department's overall purpose andpriorities. Sixty-five per cent of employees report that they know how their work contributesto their department's purpose and priorities. Employees also feel that they have thecommunications they need in order to do their jobs and that they know where to getinformation within the Government of Nova Scotia. Sixty per cent of employees feel that theyreceive the communications they need to do their jobs well, and sixty-three per cent ofemployees know where to get information within the Government of Nova Scotia in order todo their job well.
What are the opportunities for improvement?
More attention needs to be directed to strengthening the strategic alignment betweenindividual efforts and departmental objectives.
Employees report that they understand how their work contributes to their department'soverall purpose and priorities and that they receive the communications they need in orderto do their jobs. However, less than half, 49%, of employees received communications abouttheir department's business plan in the past 12 months. This is an indicator that individualefforts and department goals may not be strategically aligned. It may be beneficial to ensurethat employees receive specific business plan information in order to promote an accurateunderstanding of the department's priorities and purpose.
There were also four areas within communications that did not meet the target threshold of60% and therefore, are not considered areas of strength. As an example, 56% of employeesfeel that work-related information is shared in their department.
Recommendation 2 — To promote an accurate understanding of thedepartment's priorities and purpose, it is recommended that departments ensurethat employees receive communications regarding their business plan, in a formatthat is appropriate for their needs. Employees should also seek out thisinformation.
2004 Employee Survey Report Chapter 3 | Overall Results
Success Through People 23
Workplace Ethics
What are the strengths?
Results did not meet the target threshold of 60% in order to be considered an area of strength.
What are the opportunities for improvement?
Fifty-nine per cent of employees feel that they know the process for getting help to resolveworkplace ethical dilemmas or conflicts. This result did not meet the target threshold of60%, and is not considered a strength.
Employees expressed concerns regarding the process for resolving work-related ethicaldilemmas or concerns. Employees report knowing the process for resolving work-relatedethical concerns or conflicts; however, less than half, 46%, of respondents are confident thatthey can report those concerns without fear of reprisal.
Recommendation 3 — It is recommended that the government examine whyemployees expressed concern about reporting ethical concerns and conflicts.Government should also develop, implement, and communicate a process thatcould address these issues.
Quality of Work Life
What are the strengths?
Employees feel that they can balance the demands of their personal lives with workdemands; one exception is the management group. Employees also feel that they have theresources required to do their jobs well. Sixty-eight per cent of employees feel that they canbalance the demands of their work lives with the demands of their personal lives. Sixty-twoper cent of employees feel that they have the resources to do their jobs well.
What are the opportunities for improvement?
Fifty-four per cent of employees feel that they are provided with support to balance theirwork and family lives. This result did not meet the target threshold of 60% in order to beconsidered a strength.
Recommendation — Please refer to Recommendation 1.
Overall Results | Chapter 3 2004 Employee Survey Report
24 Success Through People
Compensation/Recognition
What are the strengths?
Results did not meet the target threshold of 60% in order to be considered an area ofstrength.
What are the opportunities for improvement?
Employees expressed concerns regarding the fairness of their compensation.
Compensation is also a concern for employees; 48% report that they are compensated fairlyfor their jobs. Compensation has been identified as a key driver of employee engagement9.What drives employee satisfaction with their compensation? Research suggests that foremployees to be satisfied, they need to believe the pay they receive is fair in relation to thework they do and believe that their pay compares favourably to the market for people doingthe same work in similar circumstances. Pay procedures are more likely to be perceived asfair if they are consistently applied to all employees, employee participation is included,appeals procedures are available, and the data used is accurate.10 Comments received byemployees were regarding pay equity for similar work and with other levels of government.Employees also expressed concern over the fairness of internal policies that restrict thecompensation for successful internal candidates when promoted to a new job, and theycommented that these policies are not applied to external candidates.
Recommendation 4 — Government should explore and seek to understand whyemployees report concerns regarding the fairness of their compensation relative tothe jobs they perform.
In exploring the source(s) of employees' concerns about the fairness of theircompensation, government should consider that pay procedures are more likely tobe perceived as fair if they are consistently applied to all employees, employeeparticipation is included, appeals procedures are available, and the data used isaccurate. These elements need to be reinforced by the PSC and departments.
9 Parker and Wright (2001).
10 Milkovich and Newman (1999). Compensation. Boston: Irwin McGraw-Hill. pp. 55-56.
2004 Employee Survey Report Chapter 3 | Overall Results
Success Through People 25
Leadership
What are the strengths?
Employees feel positive about their supervisors. Sixty-eight per cent of employees feel thatthey can talk openly with their supervisor about their work.
What are the opportunities for improvement?
More attention needs to be directed to effective leadership and strengthening the supportsavailable to leaders.
Employees also report concerns with regards to leadership; 48% of respondents haveconfidence in the leaders in their department, and 46% or respondents feel that leaders seta good example for employees. (The survey does not answer why employees feel this way;however, results indicate that employee perceptions of government's internal hiring process,communication, and compensation and recognition are strongly related to their perceptionsof leadership, which may provide some insight into how to make improvements in this area).
Some of the comments received from employees speak to a lack of access or connectionwith management. Interestingly, the management group responses speak to the need forsupport to balance work and life demands. To build relationships and trust, there needs tobe time and opportunities for leaders to interact with staff.
The Government of Nova Scotia is not alone. While 48% of Nova Scotia governmentemployees express confidence in the leaders in their department, 56% of Government ofSaskatchewan employees and 27% of employees in the Government of British Columbiareported having confidence in their leaders.
To maintain an effective government, strong leaders are essential. One of the first steps tobuilding employees' confidence in the leadership of their departments is to address issuesraised in this survey and actively engage employees in the response process.
Recommendation 5 — It is recommended that more attention be directedtowards effective leadership and strengthening employee confidence in theleadership group by understanding issues raised in this survey, and seekingsolutions with the involvement of employees in the process. This effort should seekout best practices that are internal to the Nova Scotia government and otherjurisdictions. The leadership section of Chapter 4 provides information on possiblesources of best practices.
In addition, the causes for employees' concerns about their supervisors' abilities tomanage conflict need to be identified. If appropriate, training and adequate supportmust be provided to supervisors so they are able to manage workgroup conflict.
Overall Results | Chapter 3 2004 Employee Survey Report
26 Success Through People
Personal Growth
What are the strengths?
Employees feel that they have access to training opportunities, which they can apply to theirjobs. Employees also feel that they have access to job postings. Sixty-five per cent ofemployees feel that they have access to training opportunities. Sixty-nine per cent ofemployees feel that they can apply what they have learned in training to their jobs. Seventy-one per cent of employees feel that they have access to job postings within the Governmentof Nova Scotia.
What are the opportunities for improvement?
Thirty-eight per cent of employees feel that they have opportunities for career advancementwithin the Government of Nova Scotia. This result is related to results of the question aboutperceptions of merit hiring in government.
Further details are outlined in Recommendation 8.
Diversity
What are the strengths?
Results did not meet the target threshold of 60% in order to be considered an area ofstrength. As an example, 50% of employees feel that the Government of Nova Scotiademonstrates its commitment to diversity.
What are the opportunities for improvement?
More attention needs to be directed towards the commitment by departments to diversity.Over half of the respondents feel that employees are respectful of employee differences andthat the Government of Nova Scotia demonstrates commitment to diversity. However, only46% of employees feel that their department values diversity, while 21% did not feel theirdepartment values diversity.
Recommendation 6 — It is recommended that government explore and seek tounderstand why employees have concerns about their department's commitment todiversity. This study should seek out best practices that are internal to the NovaScotia government and other jurisdictions. The Diversity section of Chapter 4provides information on possible sources of best practices.
2004 Employee Survey Report Chapter 3 | Overall Results
Success Through People 27
Following this study, action plans should be developed jointly by departments andthe PSC to address the causes of employee concerns and to outline solutions. ThePSC should also strengthen its support and monitoring role by establishingguidelines for departmental reporting of affirmative action plans and by auditingand evaluating their progress.
Safety
What are the strengths?
Seventy-one per cent of employees feel safe working in their jobs, and 69% of employees feelthat their department creates a safe work environment. Sixty-one per cent of employees feelthat harassment is not tolerated in their workplace, and 70% of employees know who theOccupational Health and Safety representatives are for their work area.
What are the opportunities for improvement?
It is recommended that government continue building this strength.
Please refer to Recommendation 1 for more details.
Overall Results | Chapter 3 2004 Employee Survey Report
28 Success Through People
Retention
What are the strengths?
Results did not meet the target threshold of 60% in order to be considered an area of strength.
What are the opportunities for improvement?
A substantial portion of employees indicated that they are not planning on staying with theGovernment of Nova Scotia.
Statistically there is a strong relationship between retention responses and responsesregarding personal growth, leadership, and quality of work life. Less than half, 44%, ofemployees report that they intend to stay with the government for the next 5 years, and 44%intend to stay for the next 10 years. Our retention results are slightly lower than those forother comparable organizations. Half, 51%, of respondents would recommend theGovernment of Nova Scotia as one of the best places to work in their community. (At theGovernment of Saskatchewan, 66% recommended government as a good place to work, andat Nova Scotia Power, 60% employees recommend NSP as the best place to work.)
Retention efforts should take into consideration that managers report higher levels ofintentions to leave than other groups. Other at-risk groups were the Generation X (24–41)age group and the MCP and Professional (PR) pay groups. It is interesting to note that PRand MCP employees reported the highest favourable scores for the compensation fairnessquestion, which supports the findings that personal growth, leadership, and quality of work-life balance showed stronger association with retention.
A recent Korn Ferry International study identified the key drivers of retention andcommitment and found that what employees want “depends very much on the stage whereeach one is in their career, as well as generational factors, gender, old versus new economypreferences, cultural dynamics and managerial versus implementation roles. We contendthat organizations need to personalize their retention efforts, cater to individual needs andtailor the employment package.”11
This research is supported by recent work completed at Carleton University that examinedwork expectations across different generations. They found that work expectations,motivators, and retention items vary depending on generational factors and age. Researchersoutlined four major generational groups and their views of retention.12
Millenials (23 years of age and younger) — Employees in this age group view job-hopping as normal. Millenials question why they would ever stay in one job.
11 Finegold, David (2004). What Do Employees Really Want? March 24, 2004. <http://www.linezine.com/7.2/articles/dfwderw.htm>
12 Lyons, Sean (2004). An Exploration of Generational Differences in Values at Life and at Work. (Ph.D. thesis.) Carleton University.
2004 Employee Survey Report Chapter 3 | Overall Results
Success Through People 29
Generation X (24–41 years of age) — Employees in this age group view job-hopping asstrategic. They have a “free agent” approach to organizational commitment and feel thatwork-life balance is essential. Generation X employees want to learn in their jobs.
Baby Boomers (42–57 years of age) — Employees in this age group view job-hopping ascounter-productive. They are often workaholics, see work as a means to personal fulfilment,and are accepting of stress. Baby Boomers want to know how their job fits into their career.
Matures (58 years of age and above) — Employees in this age group view job-hoppingas disloyal. Matures are persistent, loyal, and feel that work-life balance is a personalresponsibility.
Recommendation 7 — It is recommended that the PSC tailor its retention efforts,taking into consideration generational differences and the impact they have on at-risk groups. Managers report higher levels of intentions to leave than other groups.Other at-risk groups are the Generation X (24–41 years of age) group and theManagement Compensation Plan (MCP)and Professional (PR) pay groups. As anexample, even though quality of work life was considered a strength overall,Generation X and management perceptions of work-life balance were notfavourable. Attention to work-life balance factors should be a major focus of anyretention strategy, if government is to attract and retain these at-risk groups.
Overall Results | Chapter 3 2004 Employee Survey Report
30 Success Through People
Other
What are the strengths?
Seventy-one per cent of employees feel that they have access to job postings. Seventy-eightper cent of employees feel that they have the required qualifications to meet the needs oftheir job.
What are the opportunities for improvement?
A negative perception regarding the application of merit hiring is influencing employeeperceptions of career advancement opportunities within the Government of Nova Scotia.
Less than half, 38%, of employees perceive that hiring is based on merit within theGovernment of Nova Scotia. It should be noted that the merit results are much lower thanthose for other comparable organizations. (As an example, the federal government resultwas 66% for a similar question.)
Keeping in mind the merit results above, only 38% of employees feel that they haveopportunities for career advancement within the Government of Nova Scotia, and less than half,49%, of employees see a future for their career working for the Government of Nova Scotia.Less than half of respondents, 47%, feel they work for an effective organization, one thatregularly achieves the goals set out in our business plan.
Recommendation 8 — It is recommended that the PSC carry on with merit/staffingaudits. (Merit audits are included in the 2004–2005 PSC business plan and are underway.) Merit audits will provide objective evidence to determine if merit-based hiringpractices are utilized in the Government of Nova Scotia. Conducting merit audits mayalso help improve the perception of inconsistent applications of human resourcepolicies. It may also improve the perception of opportunities for career advancementand influence employees' perceptions of seeing a future for their career in theGovernment of Nova Scotia.
As well, Government should conduct further analysis to understand employeeperceptions, beliefs, and opinions about government’s merit hirings.
To promote an accurate understanding of the department's achievement of businessplan goals, employees need to have an accurate understanding of the department'sgoals, priorities, and purpose. It is recommended that departments ensure thatemployees receive information on their specific business plan and accountabilityreports in an appropriate format.
2004 Employee Survey Report Chapter 3 | Overall Results
Success Through People 31

Overall Recommendations
Recommendation 9 — In order to guide the overall action planning process, severalrecommendations are outlined below:
• It is recommended that the response to results be undertaken in a coordinated, timely,inclusive, and transparent manner. The creation of an advisory committee to helpcoordinate this effort is recommended.
• Leaders should demonstrate their commitment to action and solutions.
• Regular reporting of progress, and reassessment of employee opinions on an annualbasis, are recommended.
• It is recommended that government conduct further analysis to understand employeeperceptions, beliefs, and opinions, by engaging in discussions with employees in eachdepartment. Government should also explore with employees how to address concernsraised in the survey.
• Employees should be involved in the process of creating solutions in response to the issues.
• Departments should be encouraged to act on concerns expressed in the survey and advisethe PSC where key issues may require an organization-wide response or action. Identifyingissues that have readily available solutions, and outlining how they could be implemented,is a critical next step. Government should respond and act quickly, where possible, andcommunicate these actions to employees. Issues that require further investigation shouldalso be identified. If required, management should explain in an open manner when andwhy they cannot meet employees’ expectations in a particular area.
• At the government-wide level, results should contribute to a corporate human resourceplan and should be reflected in future corporate and department business plans. Theresults should also contribute to goal setting and the performance management processthroughout government.
• Government should celebrate and continue building on areas identified as strengths.
• It is recommended that information collected in the employee survey help direct the PSC’sevaluation and audit activities.
Overall Results | Chapter 3 2004 Employee Survey Report
32 Success Through People
Demographic trends noted in the survey
There were three areas where demographic differences in responses were strong:differences based on age, job levels, and pay plans.
Age Differences
Age 30–39 respondents provided consistently lower favourable (agreement) scoresthroughout the survey, compared to other age groups.
Age 20–29 respondents provided lower favourable (agreement) scores compared to otherage groups in areas such as teamwork, compensation, and benefits.
Age 40–49 respondents provided consistently higher favourable (agreement) scoresthroughout the survey, compared to other age groups.
With regards to perceptions of merit and career advancement opportunities, olderrespondents provided lower favourable (agreement) scores.
Job Levels
Generally, managers responded more favourably than staff and supervisors. In particular,management reported the highest level of favourable (agreement) scores in areas such asteamwork, employee involvement, communications, ethics, and leadership.
However, compared to other job levels, the management group is more likely to report thatthey cannot balance the demands of their work and personal lives. Management alsoreported lower levels of favourable (agreement) scores in the areas of retention andperceptions of being able to apply what they have learned in training to their jobs.
Pay Plans
Pay plan differences varied across question categories. A few examples are highlightedbelow. (Detailed results are presented with each category in Chapter 4 of the report.)
Management Compensation Plan Respondents
Lower favourable (agreement) scores were given in the areas of balancing the demands oftheir work lives with the demands of their personal lives, retention, and knowing who theirOccupational Health and Safety representatives are, compared to other pay plan groups.
Higher favourable (agreement) scores were given in the areas of compensation, perceptionsof merit-based hiring, leadership, employee involvement, and teamwork, compared to otherpay plan groups.
2004 Employee Survey Report Chapter 3 | Overall Results
Success Through People 33
CUPE Respondents
There were lower favourable (agreement) scores for the areas of teamwork,communications (specifically regarding receiving business plan communications andparticipating in performance reviews), compensation, leadership, diversity, perceptions ofcareer advancement opportunities, and perceptions of merit, compared to other pay plangroups.
There were higher favourable (agreement) scores for the areas of safety and security,retention, knowledge of benefits program, and ethics, compared to other pay plan groups.
NSGEU Local 480 Respondents
Lower favourable (agreement) scores were given for the areas of teamwork, employeeinvolvement, communications (specifically regarding receiving business plancommunications and participating in a performance review), compensation and feelingvalued at work, leadership, perceptions of career advancement opportunities, diversity, andethics, compared to other pay plan groups.
Higher favourable (agreement) scores were given for the areas of knowledge of benefitsprogram, knowing who their Occupational Health and Safety representatives are, and feelingthat they can balance the demands of their work life with the demands of their personal lives,compared to other pay plan groups.
Administrative Support Respondents
Lower favourable (agreement) scores were given for the areas of knowing whom theirOccupational Health and Safety representatives are, ethics, teamwork, and compensation.
Higher favourable (agreement) scores were given for leadership.
Further details regarding responses are outlined by each survey category in theremainder of this report. When reviewing the results of each category in the survey,please keep in mind the interpretation scale noted in the Methodology section.
Overall Results | Chapter 3 2004 Employee Survey Report
34 Success Through People