Embed Size (px)
Citation preview
Materials and Methods
36
CHAPTER 3
MATERIALS AND METHODS
The study on various aspects and objectives related to the present research
work was carried out during the year 2008 - 2012 at Department of Food Processing
Technology, A.D. Patel Institute of Technology, New Vallabh Vidyanagar, Anand and
Sophisticated Instrumentation Center for Applied Research and Testing, Vidyanagar,
Anand.
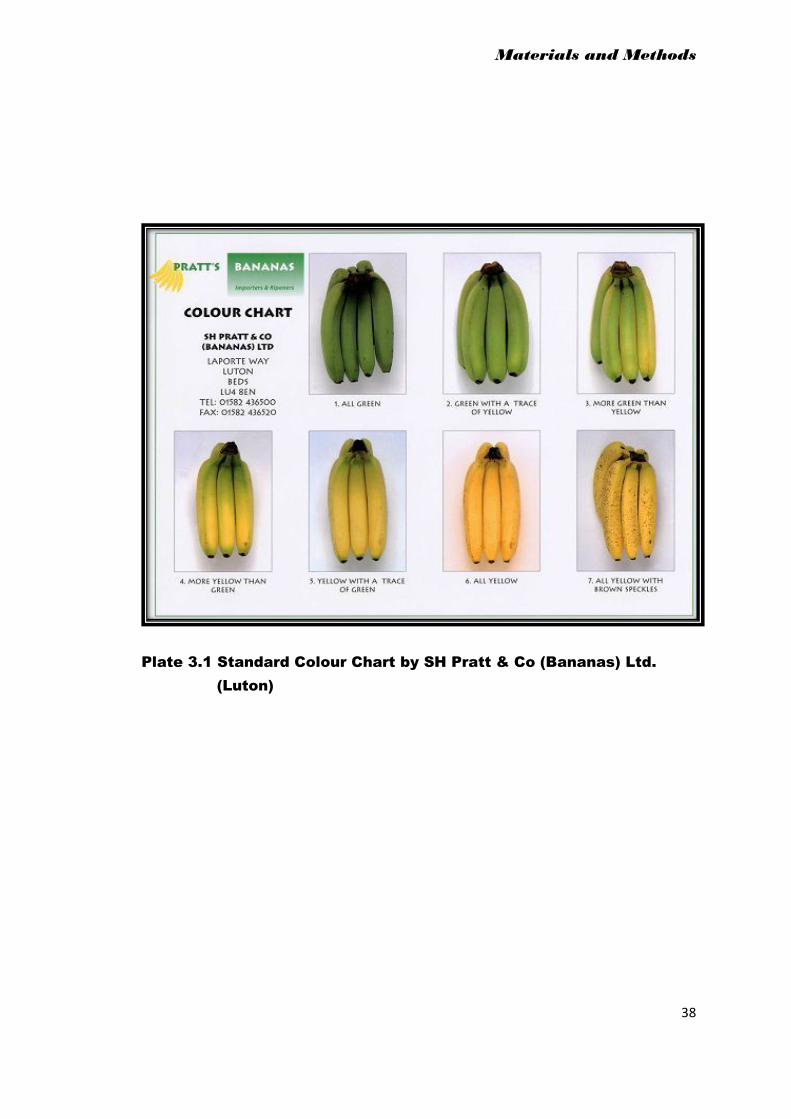
In the present investigation, advanced maturity stages of banana i.e. stage 5
(yellow with a trace of green), stage 6 (all yellow) and stage 7 (all yellow with a
brown speckles); according to Standard Banana Colour Chart as shown in Plate 3.1
have been selected to optimize the enzymatic clarification treatment and thereby to
develop the process technology for banana pulp clarification. Prepared clarified juices
of selected ripening stages have been further studied for physic-chemical parameters
and sensory evaluation. Another important aspect of current research project was to
inhibit the browning in clarified banana juice by applying some anti-browning
treatments. This chapter deals with the description of materials, experimental set-ups,
analytical techniques and processing techniques used in various experiments.
3.1 Materials
Banana Fruits
Bananas (Musa sp.) of variety ‘Robusta’ were used in the present study and for
every trial bananas were procured at the maturity stage 1(beginning to ripen) from
selected banana orchards near Anand city.
Commercial Enzymes
Commercial pectinolytic enzyme i.e. Pectinex Ultra SP-L and cellulase
enzyme i.e. Celluclast 1.5L were obtained from Novozymes South Asia Pvt. Ltd.,
Bangalore.
Ethrel (2-chloro ethyl phosphonic acid) used for ripening of banana and other
branded chemicals and reagents namely sodium phosphate, polyvinyl pyrrolidone,
Triton X-100, sulfuric acid, hydrochloric acid, silver nitrate, acetic acid, calcium
chloride, petroleum ether used during analysis were purchased from local chemical
supplier.

Materials and Methods
37
3.2 Methodology for Ripening of Banana
Banana (Musa sp var. ‘Robusta’) bunches harvested at optimum stage of
maturity (stage 1) were brought from orchard and banana hands were separated.
Selected banana hands were washed thoroughly with potable water and dipped in 500
ppm ethrel (2-chloro ethyl phosphonic acid) solution for 5 min. Treated fruits were
dried by gentle air to remove surface moisture. Thereafter, fruits were covered with
polyethylene sheet and packed in ventilated plastic baskets to create high RH 80%
atmosphere and kept for ripening at 20±1°C (Kulkarni et. al., 2010; Saeed et al.,
2001). As the ripening progressed, fruit passes through various ripening stages. But
fruits of advanced ripening stages viz. stage 5, 6 and 7 (as shown in Plate 3.1) were
selected for the present study. Hence, after ripening initiation at some specific
intervals when the bananas attained the maturity stage 5, 6 and 7; bananas of each
particular stage has been drawn and pulp of each selected stage has been used for juice
clarification study. Also fruits of each selected ripening stage were tested on the
following aspects.
Physico-chemical properties:
1. Pulp/peel ratio
2. PPO activity
3. Moisture
4. Ash
5. Fat
6. Protein
7. Titratable Acidity
8. Pectin
9. Total sugar
10. Starch
11. TSS
Mechanical properties:
1. Firmness
2. Cohesiveness
3. Chewiness
4. Fracture force
5. Stiffness
Materials and Methods
38
Plate 3.1 Standard Colour Chart by SH Pratt & Co (Bananas) Ltd.
(Luton)
Materials and Methods
39
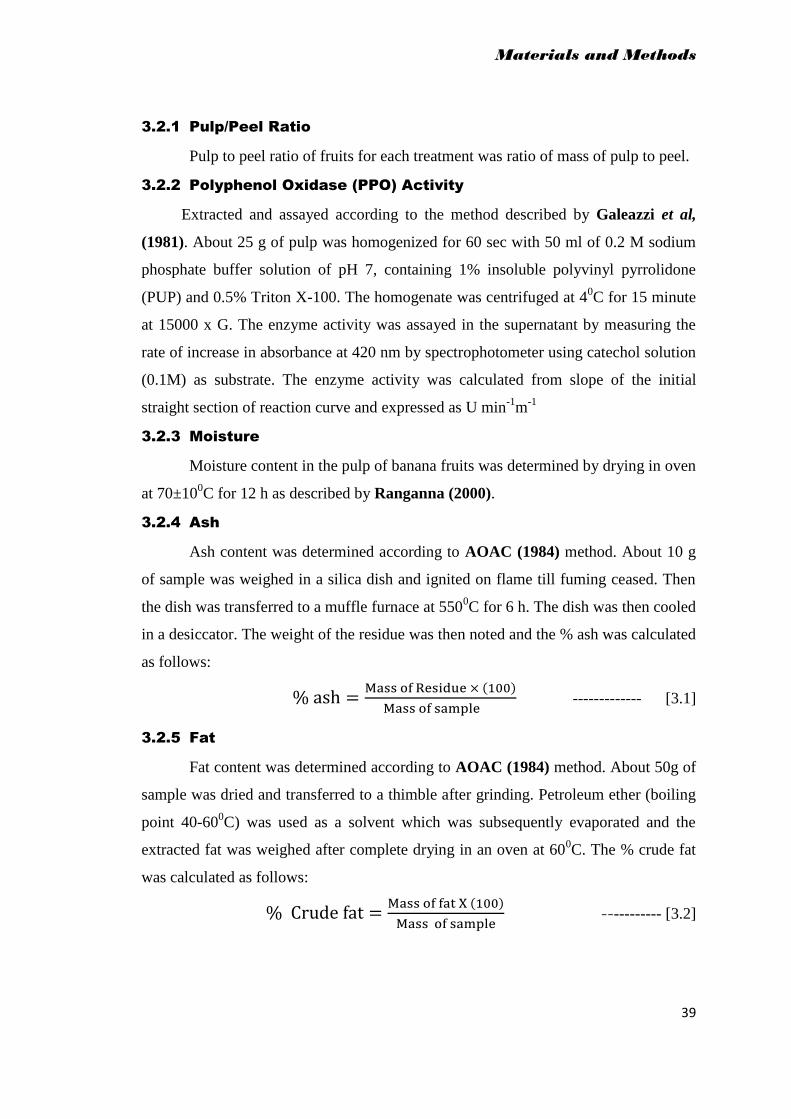
3.2.1 Pulp/Peel Ratio
Pulp to peel ratio of fruits for each treatment was ratio of mass of pulp to peel.
3.2.2 Polyphenol Oxidase (PPO) Activity
Extracted and assayed according to the method described by Galeazzi et al,
(1981). About 25 g of pulp was homogenized for 60 sec with 50 ml of 0.2 M sodium
phosphate buffer solution of pH 7, containing 1% insoluble polyvinyl pyrrolidone
(PUP) and 0.5% Triton X-100. The homogenate was centrifuged at 40C for 15 minute
at 15000 x G. The enzyme activity was assayed in the supernatant by measuring the
rate of increase in absorbance at 420 nm by spectrophotometer using catechol solution
(0.1M) as substrate. The enzyme activity was calculated from slope of the initial
straight section of reaction curve and expressed as U min-1
m-1
3.2.3 Moisture
Moisture content in the pulp of banana fruits was determined by drying in oven
at 70±100C for 12 h as described by Ranganna (2000).
3.2.4 Ash
Ash content was determined according to AOAC (1984) method. About 10 g
of sample was weighed in a silica dish and ignited on flame till fuming ceased. Then
the dish was transferred to a muffle furnace at 5500C for 6 h. The dish was then cooled
in a desiccator. The weight of the residue was then noted and the % ash was calculated
as follows:
------------- [3.1]
3.2.5 Fat
Fat content was determined according to AOAC (1984) method. About 50g of
sample was dried and transferred to a thimble after grinding. Petroleum ether (boiling
point 40-600C) was used as a solvent which was subsequently evaporated and the
extracted fat was weighed after complete drying in an oven at 600C. The % crude fat
was calculated as follows:
----------- [3.2]
Materials and Methods
40
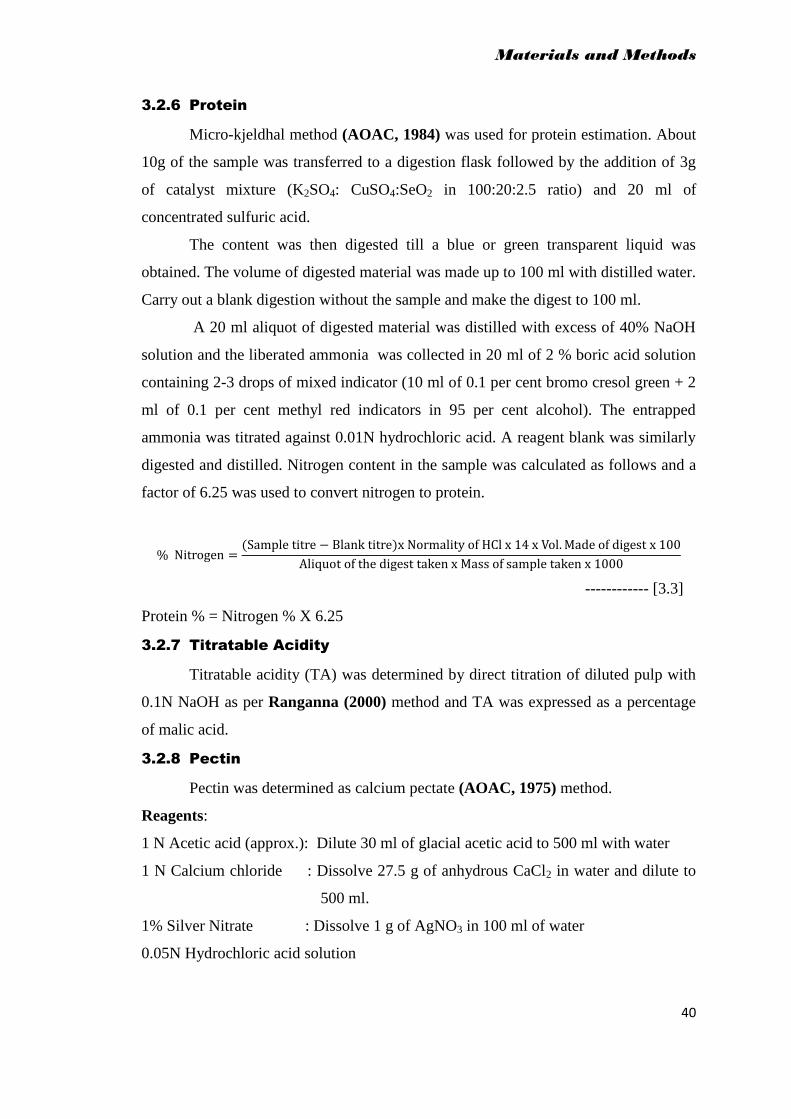
3.2.6 Protein
Micro-kjeldhal method (AOAC, 1984) was used for protein estimation. About
10g of the sample was transferred to a digestion flask followed by the addition of 3g
of catalyst mixture (K2SO4: CuSO4:SeO2 in 100:20:2.5 ratio) and 20 ml of
concentrated sulfuric acid.
The content was then digested till a blue or green transparent liquid was
obtained. The volume of digested material was made up to 100 ml with distilled water.
Carry out a blank digestion without the sample and make the digest to 100 ml.
A 20 ml aliquot of digested material was distilled with excess of 40% NaOH
solution and the liberated ammonia was collected in 20 ml of 2 % boric acid solution
containing 2-3 drops of mixed indicator (10 ml of 0.1 per cent bromo cresol green + 2
ml of 0.1 per cent methyl red indicators in 95 per cent alcohol). The entrapped
ammonia was titrated against 0.01N hydrochloric acid. A reagent blank was similarly
digested and distilled. Nitrogen content in the sample was calculated as follows and a
factor of 6.25 was used to convert nitrogen to protein.
------------ [3.3]
Protein % = Nitrogen % X 6.25
3.2.7 Titratable Acidity
Titratable acidity (TA) was determined by direct titration of diluted pulp with
0.1N NaOH as per Ranganna (2000) method and TA was expressed as a percentage
of malic acid.
3.2.8 Pectin
Pectin was determined as calcium pectate (AOAC, 1975) method.
Reagents:
1 N Acetic acid (approx.): Dilute 30 ml of glacial acetic acid to 500 ml with water
1 N Calcium chloride : Dissolve 27.5 g of anhydrous CaCl2 in water and dilute to
500 ml.
1% Silver Nitrate : Dissolve 1 g of AgNO3 in 100 ml of water
0.05N Hydrochloric acid solution
Materials and Methods
41
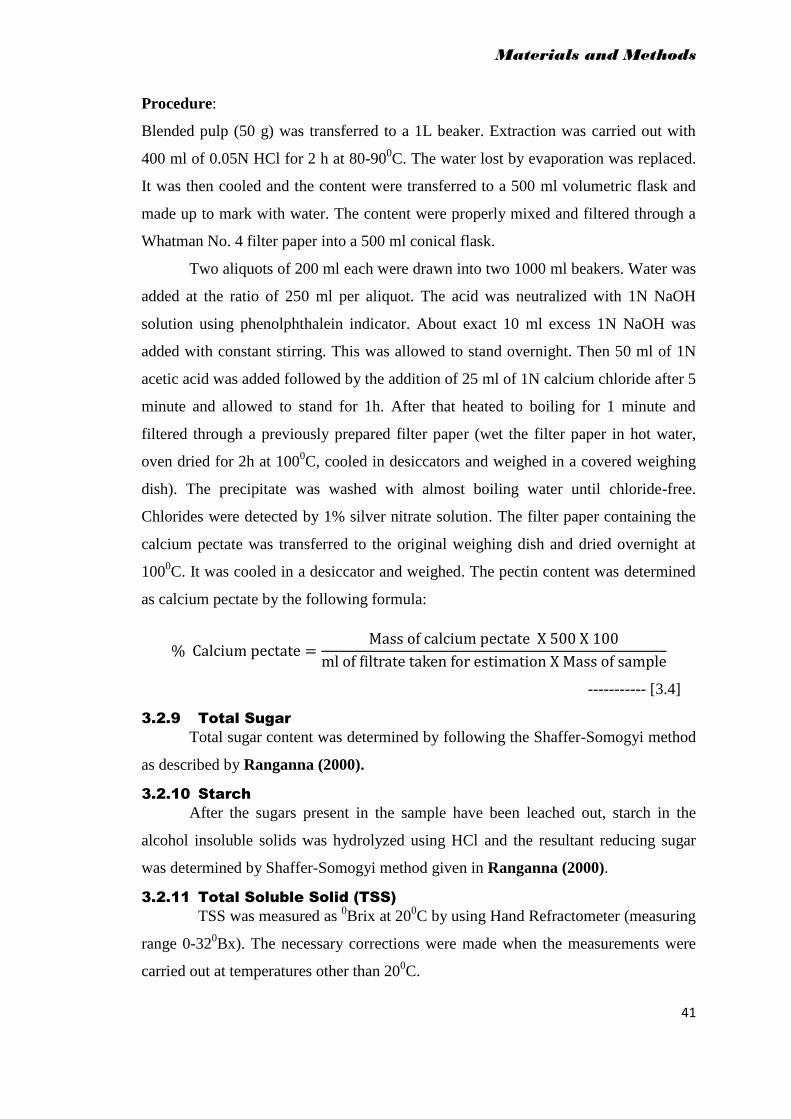
Procedure:
Blended pulp (50 g) was transferred to a 1L beaker. Extraction was carried out with
400 ml of 0.05N HCl for 2 h at 80-900C. The water lost by evaporation was replaced.
It was then cooled and the content were transferred to a 500 ml volumetric flask and
made up to mark with water. The content were properly mixed and filtered through a
Whatman No. 4 filter paper into a 500 ml conical flask.
Two aliquots of 200 ml each were drawn into two 1000 ml beakers. Water was
added at the ratio of 250 ml per aliquot. The acid was neutralized with 1N NaOH
solution using phenolphthalein indicator. About exact 10 ml excess 1N NaOH was
added with constant stirring. This was allowed to stand overnight. Then 50 ml of 1N
acetic acid was added followed by the addition of 25 ml of 1N calcium chloride after 5
minute and allowed to stand for 1h. After that heated to boiling for 1 minute and
filtered through a previously prepared filter paper (wet the filter paper in hot water,
oven dried for 2h at 1000C, cooled in desiccators and weighed in a covered weighing
dish). The precipitate was washed with almost boiling water until chloride-free.
Chlorides were detected by 1% silver nitrate solution. The filter paper containing the
calcium pectate was transferred to the original weighing dish and dried overnight at
1000C. It was cooled in a desiccator and weighed. The pectin content was determined
as calcium pectate by the following formula:
----------- [3.4]
3.2.9 Total Sugar
Total sugar content was determined by following the Shaffer-Somogyi method
as described by Ranganna (2000).
3.2.10 Starch
After the sugars present in the sample have been leached out, starch in the
alcohol insoluble solids was hydrolyzed using HCl and the resultant reducing sugar
was determined by Shaffer-Somogyi method given in Ranganna (2000).
3.2.11 Total Soluble Solid (TSS)
TSS was measured as 0Brix at 20
0C by using Hand Refractometer (measuring
range 0-320Bx). The necessary corrections were made when the measurements were
carried out at temperatures other than 200C.
Materials and Methods
42
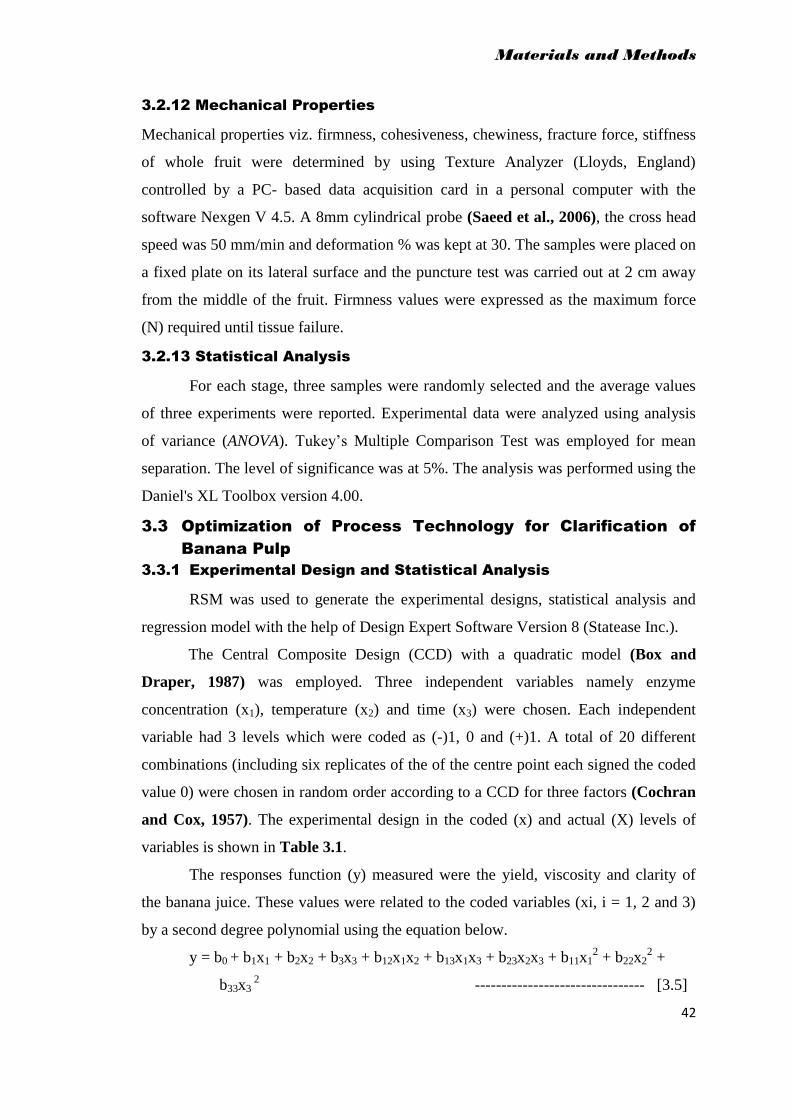
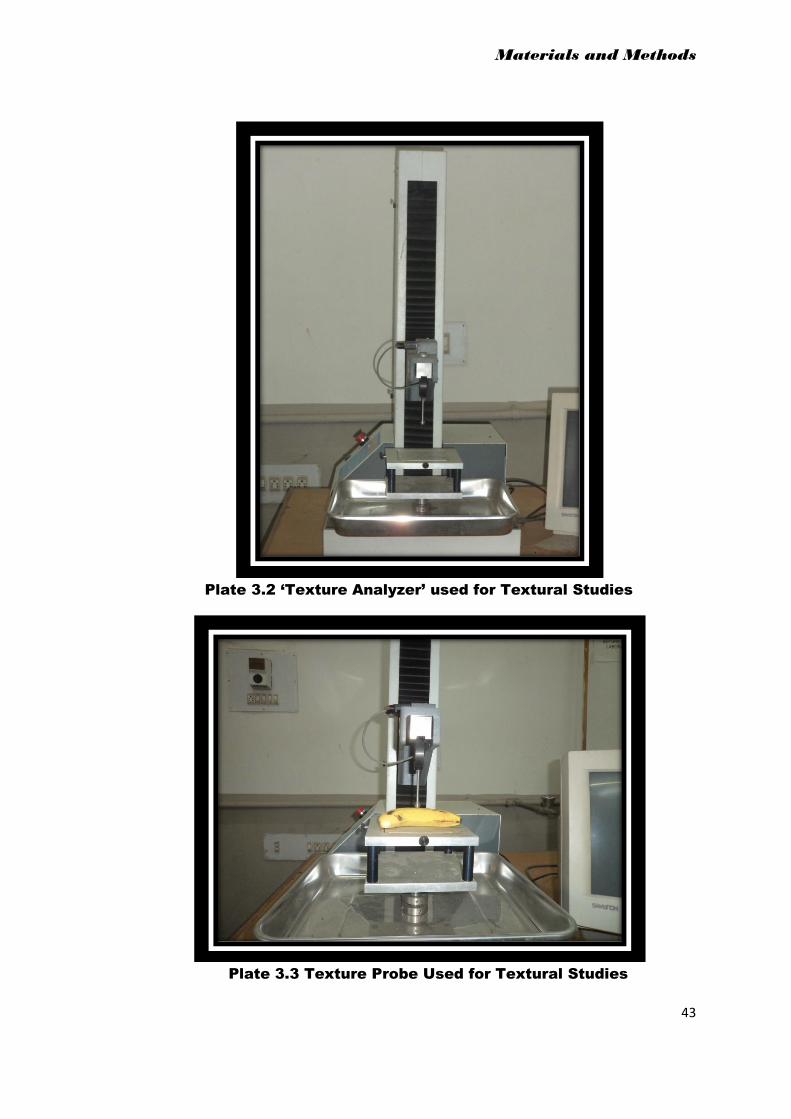
3.2.12 Mechanical Properties
Mechanical properties viz. firmness, cohesiveness, chewiness, fracture force, stiffness
of whole fruit were determined by using Texture Analyzer (Lloyds, England)
controlled by a PC- based data acquisition card in a personal computer with the
software Nexgen V 4.5. A 8mm cylindrical probe (Saeed et al., 2006), the cross head
speed was 50 mm/min and deformation % was kept at 30. The samples were placed on
a fixed plate on its lateral surface and the puncture test was carried out at 2 cm away
from the middle of the fruit. Firmness values were expressed as the maximum force
(N) required until tissue failure.
3.2.13 Statistical Analysis
For each stage, three samples were randomly selected and the average values
of three experiments were reported. Experimental data were analyzed using analysis
of variance (ANOVA). Tukey’s Multiple Comparison Test was employed for mean
separation. The level of significance was at 5%. The analysis was performed using the
Daniel's XL Toolbox version 4.00.
3.3 Optimization of Process Technology for Clarification of
Banana Pulp
3.3.1 Experimental Design and Statistical Analysis
RSM was used to generate the experimental designs, statistical analysis and
regression model with the help of Design Expert Software Version 8 (Statease Inc.).
The Central Composite Design (CCD) with a quadratic model (Box and
Draper, 1987) was employed. Three independent variables namely enzyme
concentration (x1), temperature (x2) and time (x3) were chosen. Each independent
variable had 3 levels which were coded as (-)1, 0 and (+)1. A total of 20 different
combinations (including six replicates of the of the centre point each signed the coded
value 0) were chosen in random order according to a CCD for three factors (Cochran
and Cox, 1957). The experimental design in the coded (x) and actual (X) levels of
variables is shown in Table 3.1.
The responses function (y) measured were the yield, viscosity and clarity of
the banana juice. These values were related to the coded variables (xi, i = 1, 2 and 3)
by a second degree polynomial using the equation below.
y = b0 + b1x1 + b2x2 + b3x3 + b12x1x2 + b13x1x3 + b23x2x3 + b11x12 + b22x2
2 +
b33x3 2 -------------------------------- [3.5]
Materials and Methods
43
Plate 3.2 ‘Texture Analyzer’ used for Textural Studies
Plate 3.3 Texture Probe Used for Textural Studies
Materials and Methods
44
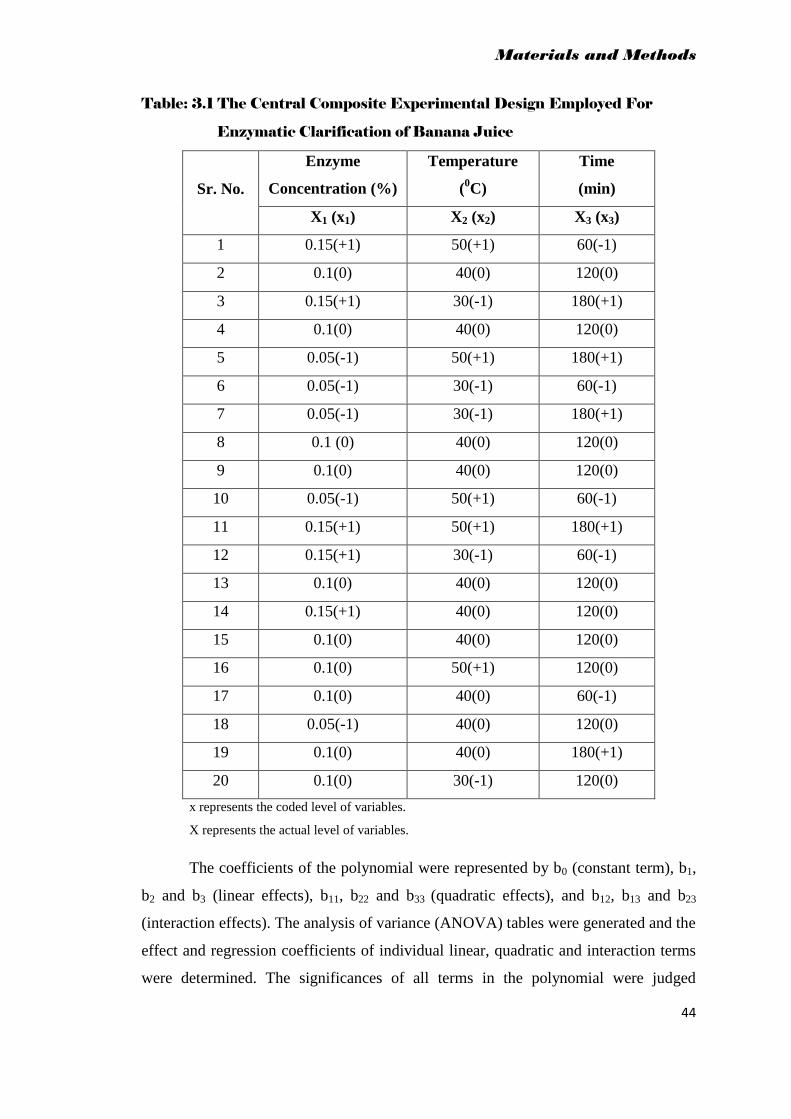
Table: 3.1 The Central Composite Experimental Design Employed For
Enzymatic Clarification of Banana Juice
Sr. No.
Enzyme
Concentration (%)
Temperature
(0C)
Time
(min)
X1 (x1) X2 (x2) X3 (x3)
1 0.15(+1) 50(+1) 60(-1)
2 0.1(0) 40(0) 120(0)
3 0.15(+1) 30(-1) 180(+1)
4 0.1(0) 40(0) 120(0)
5 0.05(-1) 50(+1) 180(+1)
6 0.05(-1) 30(-1) 60(-1)
7 0.05(-1) 30(-1) 180(+1)
8 0.1 (0) 40(0) 120(0)
9 0.1(0) 40(0) 120(0)
10 0.05(-1) 50(+1) 60(-1)
11 0.15(+1) 50(+1) 180(+1)
12 0.15(+1) 30(-1) 60(-1)
13 0.1(0) 40(0) 120(0)
14 0.15(+1) 40(0) 120(0)
15 0.1(0) 40(0) 120(0)
16 0.1(0) 50(+1) 120(0)
17 0.1(0) 40(0) 60(-1)
18 0.05(-1) 40(0) 120(0)
19 0.1(0) 40(0) 180(+1)
20 0.1(0) 30(-1) 120(0)
x represents the coded level of variables.
X represents the actual level of variables.
The coefficients of the polynomial were represented by b0 (constant term), b1,
b2 and b3 (linear effects), b11, b22 and b33 (quadratic effects), and b12, b13 and b23
(interaction effects). The analysis of variance (ANOVA) tables were generated and the
effect and regression coefficients of individual linear, quadratic and interaction terms
were determined. The significances of all terms in the polynomial were judged
Materials and Methods
45
statistically by computing the F-value and compared with standard significance level
of 0.1%, 1% and 5%. The regression coefficients were then used to make statistical
calculation to generate contour maps from the regression models.
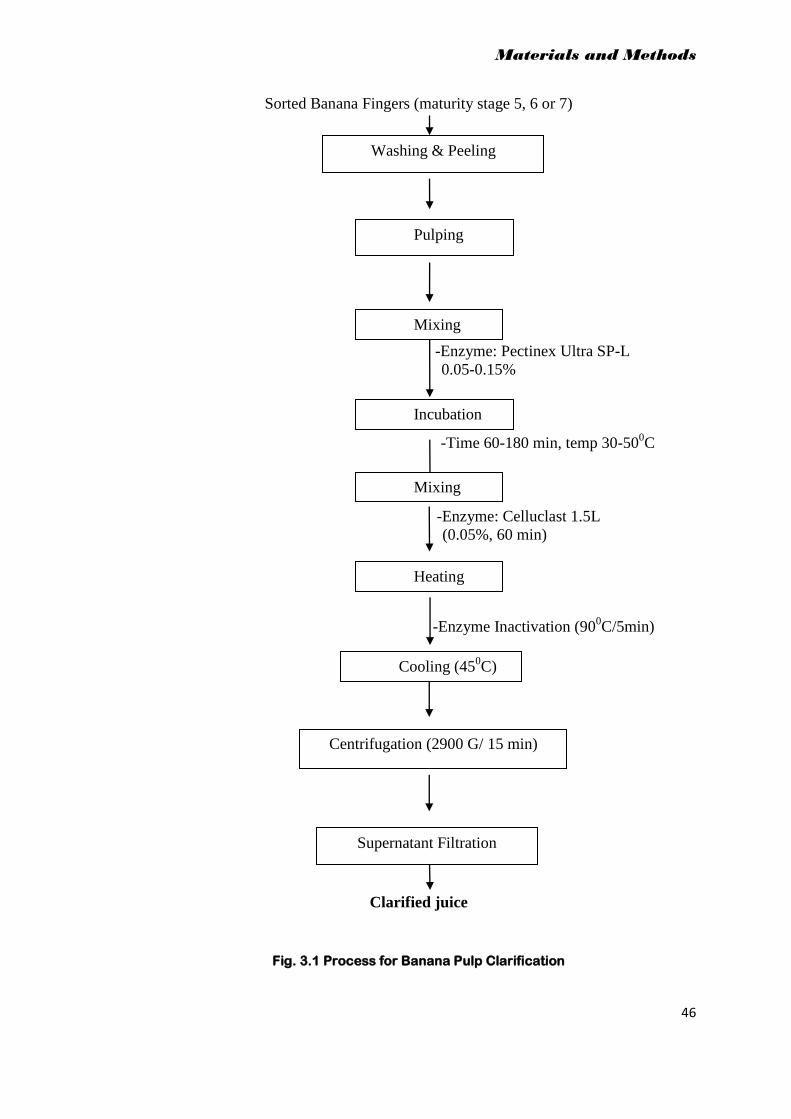
3.3.2 Banana Pulp Clarification Process
Banana pulp of each selected maturity stage i.e. stage 5, 6 and 7 were tested
separately for clarification process. Pulp clarification has been done by using the
commercial pectinolytic enzyme i.e. Pectinex Ultra SP-L and cellulase enzyme i.e.
Celluclast 1.5L as shown in Fig 3.1
The banana fruits were washed, peeled manually and cut into small pieces.
Pieces were then pulped using a kitchen blender for 2 minute into pulp. After the
pulping, the pulp was divided into equal portions for enzyme treatment. For each
experiment 500g pulp was subjected to different enzyme treatment conditions as
shown in Table 3.1. The required quantity (0.05-0.15%) of pectinase enzyme i.e.
Pectinex Ultra SP-L pulp was added to 500 g batches of banana pulp and incubated at
different temperature (30-500C) and time (60-180 min) and then treated with 0.05%
cellulase enzyme i.e. Celluclast 1.5L. At the end of the treatment, the enzymes in the
pulp was inactivated by heating at 900C for 5 minute and immediately cooled to room
temperature. At this stage viscosity of the pulp samples were measured. The enzyme
treated pulp was centrifuged at 2900 G/15 minute and the supernatant was filtered
through a fine mesh nylon cloth spread on glass funnel and juice was collected.
The following parameters of the clarified juice were used as basis for optimization
study:
1. Viscosity of treated pulp
2. Yield of clarified juice
3. Clarity
3.3.3 Methodology for Measurement of Effectiveness of Enzymatic
Clarification Treatments
3.3.3.1 Yield
The juice yield was estimated as percentage of the juice obtained based on the
initial pulp.
Materials and Methods
46
Sorted Banana Fingers (maturity stage 5, 6 or 7)
-Enzyme: Pectinex Ultra SP-L
0.05-0.15%
-Time 60-180 min, temp 30-500C
-Enzyme: Celluclast 1.5L
(0.05%, 60 min)
-Enzyme Inactivation (900C/5min)
Clarified juice
Fig. 3.1 Process for Banana Pulp Clarification
Washing & Peeling
Pulping
Mixing
Mixing
Incubation
Heating
Cooling (450C)
Centrifugation (2900 G/ 15 min)
Supernatant Filtration
Materials and Methods
47
3.3.3.2 Viscosity
The viscosity of clarified banana juice was determined by using a Brookfield
viscometer (Model LVDV-II+, Brookfield Engineering Laboratory, Inc.) at 100 rpm
with spindle No. LV3 and LV4.
3.3.3.3 Clarity
The clarity of the juice obtained was determined by measuring % transmittance
at a wavelength of 660 nm using Shimadzu UV–VIS spectrophotometer. Distilled
water was used as the reference.
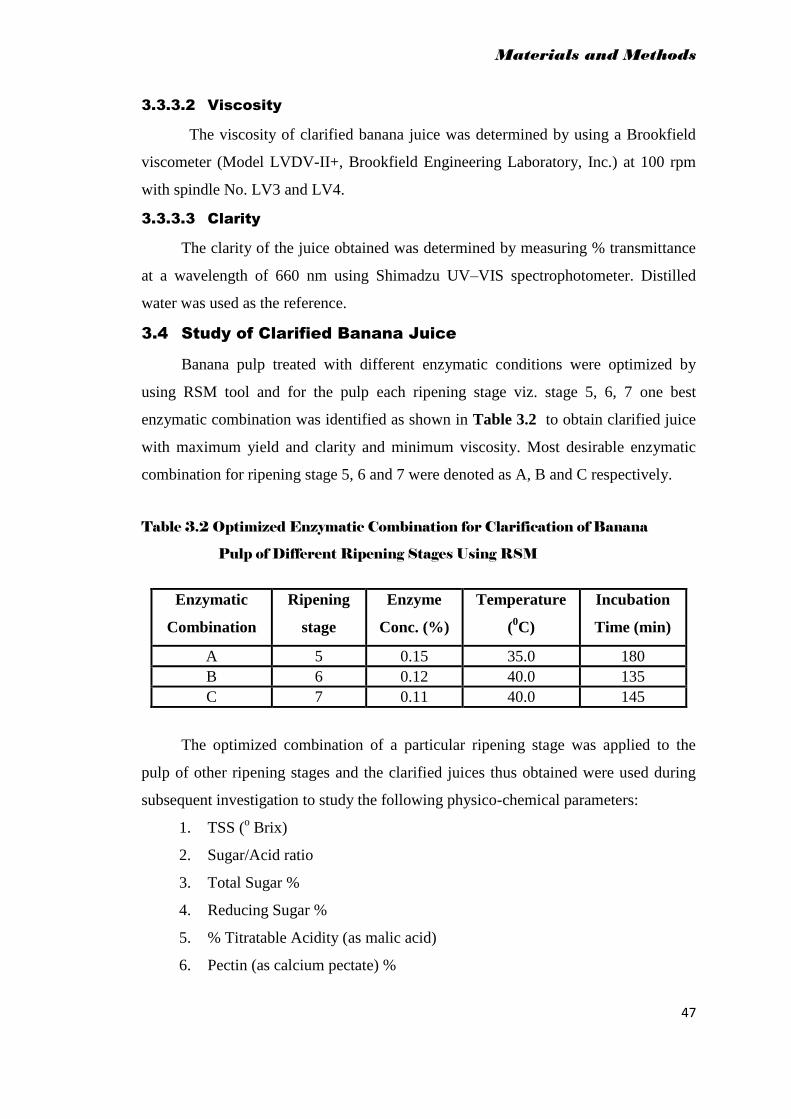
3.4 Study of Clarified Banana Juice
Banana pulp treated with different enzymatic conditions were optimized by
using RSM tool and for the pulp each ripening stage viz. stage 5, 6, 7 one best
enzymatic combination was identified as shown in Table 3.2 to obtain clarified juice
with maximum yield and clarity and minimum viscosity. Most desirable enzymatic
combination for ripening stage 5, 6 and 7 were denoted as A, B and C respectively.
Table 3.2 Optimized Enzymatic Combination for Clarification of Banana
Pulp of Different Ripening Stages Using RSM
The optimized combination of a particular ripening stage was applied to the
pulp of other ripening stages and the clarified juices thus obtained were used during
subsequent investigation to study the following physico-chemical parameters:
1. TSS (o Brix)
2. Sugar/Acid ratio
3. Total Sugar %
4. Reducing Sugar %
5. % Titratable Acidity (as malic acid)
6. Pectin (as calcium pectate) %
Enzymatic
Combination
Ripening
stage
Enzyme
Conc. (%)
Temperature
(0C)
Incubation
Time (min)
A 5 0.15 35.0 180
B 6 0.12 40.0 135
C 7 0.11 40.0 145
Materials and Methods
48
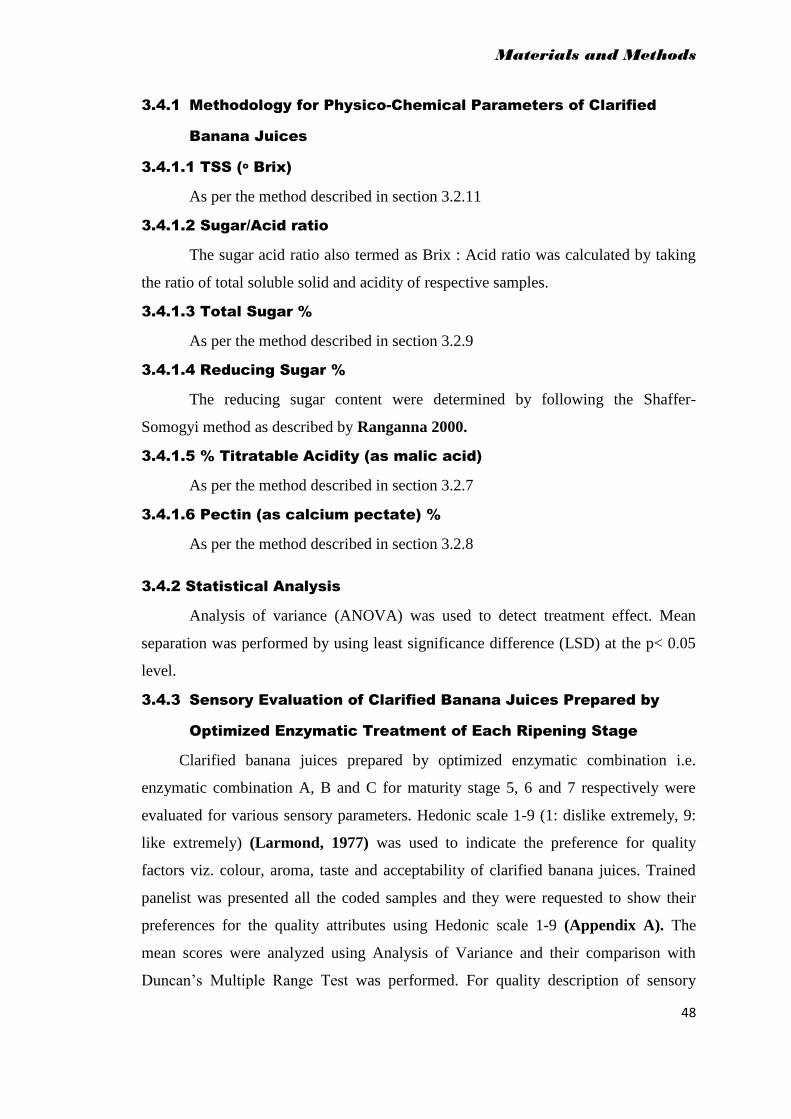
3.4.1 Methodology for Physico-Chemical Parameters of Clarified
Banana Juices
3.4.1.1 TSS (o Brix)
As per the method described in section 3.2.11
3.4.1.2 Sugar/Acid ratio
The sugar acid ratio also termed as Brix : Acid ratio was calculated by taking
the ratio of total soluble solid and acidity of respective samples.
3.4.1.3 Total Sugar %
As per the method described in section 3.2.9
3.4.1.4 Reducing Sugar %
The reducing sugar content were determined by following the Shaffer-
Somogyi method as described by Ranganna 2000.
3.4.1.5 % Titratable Acidity (as malic acid)
As per the method described in section 3.2.7
3.4.1.6 Pectin (as calcium pectate) %
As per the method described in section 3.2.8
3.4.2 Statistical Analysis
Analysis of variance (ANOVA) was used to detect treatment effect. Mean
separation was performed by using least significance difference (LSD) at the p< 0.05
level.
3.4.3 Sensory Evaluation of Clarified Banana Juices Prepared by
Optimized Enzymatic Treatment of Each Ripening Stage
Clarified banana juices prepared by optimized enzymatic combination i.e.
enzymatic combination A, B and C for maturity stage 5, 6 and 7 respectively were
evaluated for various sensory parameters. Hedonic scale 1-9 (1: dislike extremely, 9:
like extremely) (Larmond, 1977) was used to indicate the preference for quality
factors viz. colour, aroma, taste and acceptability of clarified banana juices. Trained
panelist was presented all the coded samples and they were requested to show their
preferences for the quality attributes using Hedonic scale 1-9 (Appendix A). The
mean scores were analyzed using Analysis of Variance and their comparison with
Duncan’s Multiple Range Test was performed. For quality description of sensory
Materials and Methods
49
evaluated samples, juice samples scored below 5 were considered as poor quality, 5 to
7 as fair and above 7 as good quality.
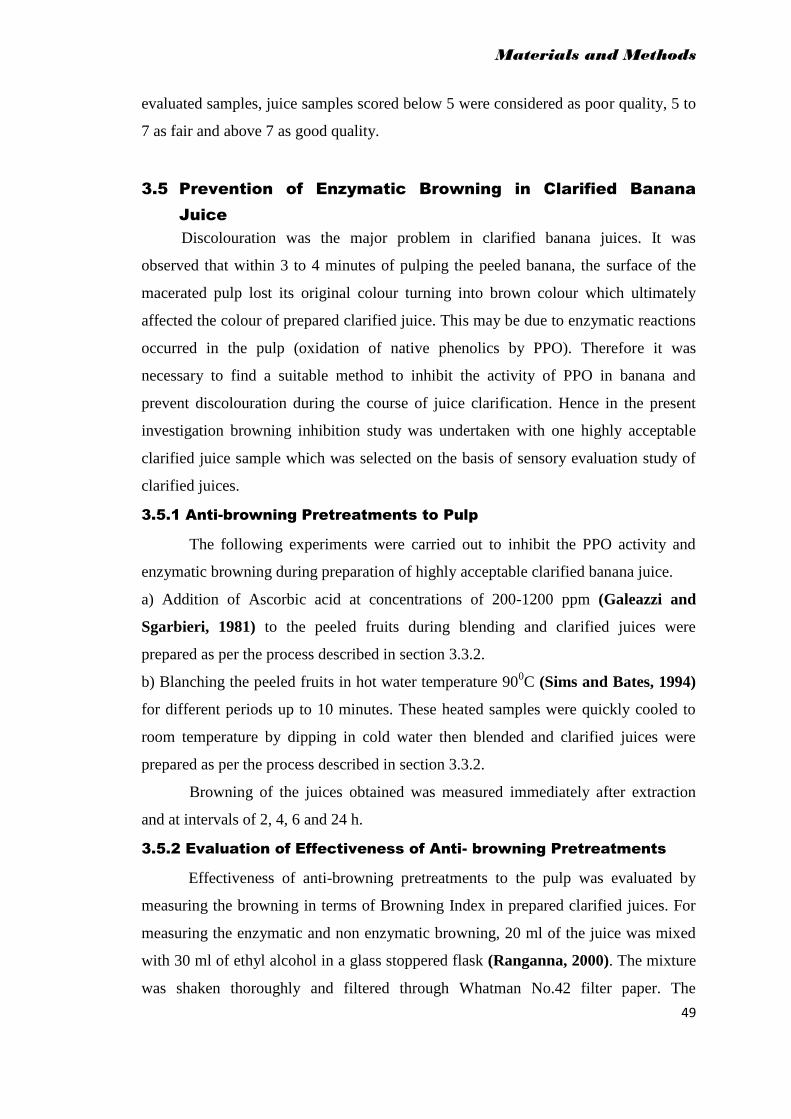
3.5 Prevention of Enzymatic Browning in Clarified Banana
Juice
Discolouration was the major problem in clarified banana juices. It was
observed that within 3 to 4 minutes of pulping the peeled banana, the surface of the
macerated pulp lost its original colour turning into brown colour which ultimately
affected the colour of prepared clarified juice. This may be due to enzymatic reactions
occurred in the pulp (oxidation of native phenolics by PPO). Therefore it was
necessary to find a suitable method to inhibit the activity of PPO in banana and
prevent discolouration during the course of juice clarification. Hence in the present
investigation browning inhibition study was undertaken with one highly acceptable
clarified juice sample which was selected on the basis of sensory evaluation study of
clarified juices.
3.5.1 Anti-browning Pretreatments to Pulp
The following experiments were carried out to inhibit the PPO activity and
enzymatic browning during preparation of highly acceptable clarified banana juice.
a) Addition of Ascorbic acid at concentrations of 200-1200 ppm (Galeazzi and
Sgarbieri, 1981) to the peeled fruits during blending and clarified juices were
prepared as per the process described in section 3.3.2.
b) Blanching the peeled fruits in hot water temperature 900C (Sims and Bates, 1994)
for different periods up to 10 minutes. These heated samples were quickly cooled to
room temperature by dipping in cold water then blended and clarified juices were
prepared as per the process described in section 3.3.2.
Browning of the juices obtained was measured immediately after extraction
and at intervals of 2, 4, 6 and 24 h.
3.5.2 Evaluation of Effectiveness of Anti- browning Pretreatments
Effectiveness of anti-browning pretreatments to the pulp was evaluated by
measuring the browning in terms of Browning Index in prepared clarified juices. For
measuring the enzymatic and non enzymatic browning, 20 ml of the juice was mixed
with 30 ml of ethyl alcohol in a glass stoppered flask (Ranganna, 2000). The mixture
was shaken thoroughly and filtered through Whatman No.42 filter paper. The

Materials and Methods
50
absorbance of the filtrate was measured at 420 nm against 60% aqueous alcohol in a
spectrophotometer. Browning index (A at 420 nm) was expressed as absorbance
value.
3.5.3 Statistical Analysis
Analysis of variance (ANOVA) was used to detect the effect of pretreatment
during different time intervals. Tukey’s Multiple Comparison Test was employed for
mean separation. The level of significance was at 5%. The analysis was performed
using the Daniel's XL Toolbox version 4.00.