Embed Size (px)
Citation preview
41
CHAPTER 3: Health behaviours and lifestyle
AYPH | Key Data on Young People 2017
CHAPTER 3: Health behaviours and lifestyle
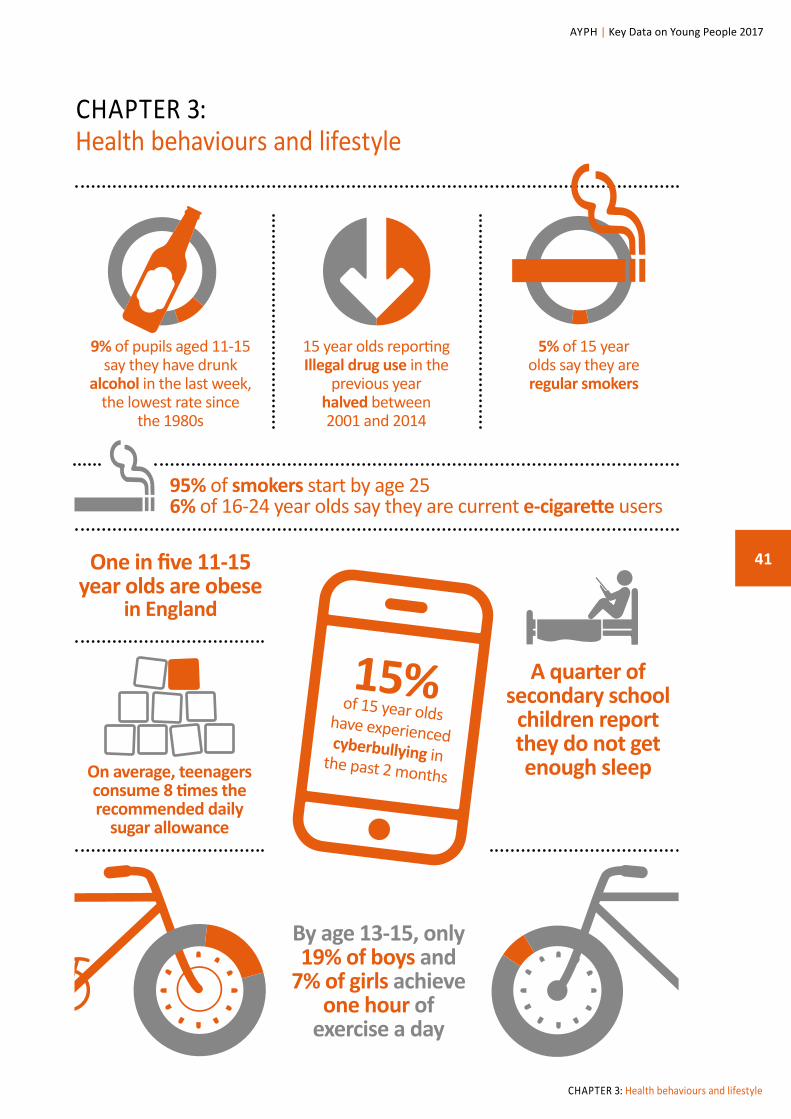
A quarter of secondary school
children report they do not get enough sleep
15%of 15 year olds have experiencedcyberbullying in the past 2 months
5% of 15 year olds say they are regular smokers
9% of pupils aged 11-15 say they have drunk
alcohol in the last week, the lowest rate since
the 1980s
95% of smokers start by age 25 6% of 16-24 year olds say they are current e-cigarette users
15 year olds reporting Illegal drug use in the
previous year halved between 2001 and 2014
By age 13-15, only 19% of boys and
7% of girls achieve one hour of
exercise a day
One in five 11-15 year olds are obese
in England
On average, teenagers consume 8 times the recommended daily
sugar allowance
42
CHAPTER 3: Health behaviours and lifestyle
AYPH | Key Data on Young People 2017
Health behaviours and lifestyle
Promoting healthy lifestyles is very important in adolescence and early adulthood. This is a time when life-long health behaviours are set in place. Health behaviours can directly affect health outcomes. In the longterm these may include cancer, heart disease and Type 2 diabetes. Prevention and early intervention are not just relevant for young children; they are equally possible in adolescence (Hagell and Rigby, 2015). Understanding patterns of youth health behaviour informs health promotion and commissioning and can prevent longterm difficulties from arising or escalating. In this chapter we focus on physical activity, nutrition and obesity, smoking, drinking and drug use, accidents, media and communication activities, and sleep. Sexual health is also critically important and this is the subject of the next chapter.
Physical activityYoung people’s physical activity levels are critical to their overall health (Department of Health, 2011a). Current UK guidelines for children and young people recommend at least one hour of moderate to vigorous physical activity every day (Department of Health, 2011b).
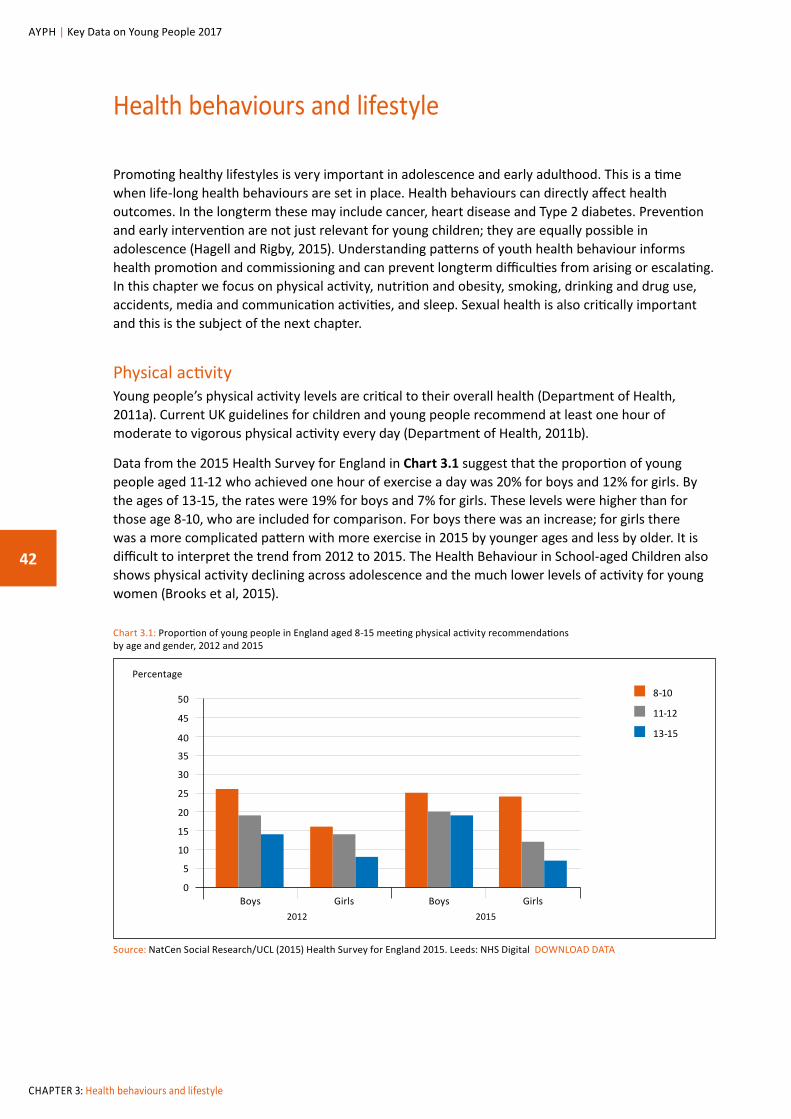
Data from the 2015 Health Survey for England in Chart 3.1 suggest that the proportion of young people aged 11-12 who achieved one hour of exercise a day was 20% for boys and 12% for girls. By the ages of 13-15, the rates were 19% for boys and 7% for girls. These levels were higher than for those age 8-10, who are included for comparison. For boys there was an increase; for girls there was a more complicated pattern with more exercise in 2015 by younger ages and less by older. It is difficult to interpret the trend from 2012 to 2015. The Health Behaviour in School-aged Children also shows physical activity declining across adolescence and the much lower levels of activity for young women (Brooks et al, 2015).
Source: NatCen Social Research/UCL (2015) Health Survey for England 2015. Leeds: NHS Digital DOWNLOAD DATA
50
45
35
25
40
30
20
10
15
5
0Girls GirlsBoys Boys
8-10
11-12
13-15
2012 2015
Chart 3.1: Proportion of young people in England aged 8-15 meeting physical activity recommendations by age and gender, 2012 and 2015
Percentage
43
CHAPTER 3: Health behaviours and lifestyle
AYPH | Key Data on Young People 2017
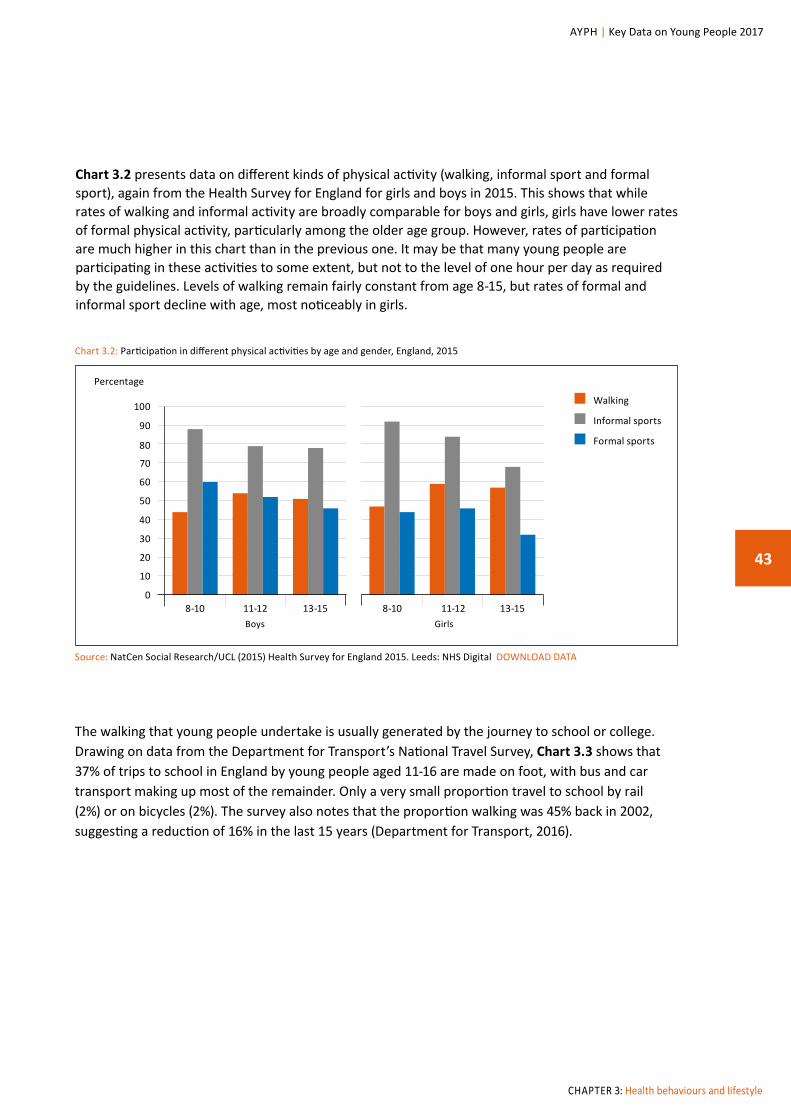
Chart 3.2 presents data on different kinds of physical activity (walking, informal sport and formal sport), again from the Health Survey for England for girls and boys in 2015. This shows that while rates of walking and informal activity are broadly comparable for boys and girls, girls have lower rates of formal physical activity, particularly among the older age group. However, rates of participation are much higher in this chart than in the previous one. It may be that many young people are participating in these activities to some extent, but not to the level of one hour per day as required by the guidelines. Levels of walking remain fairly constant from age 8-15, but rates of formal and informal sport decline with age, most noticeably in girls.
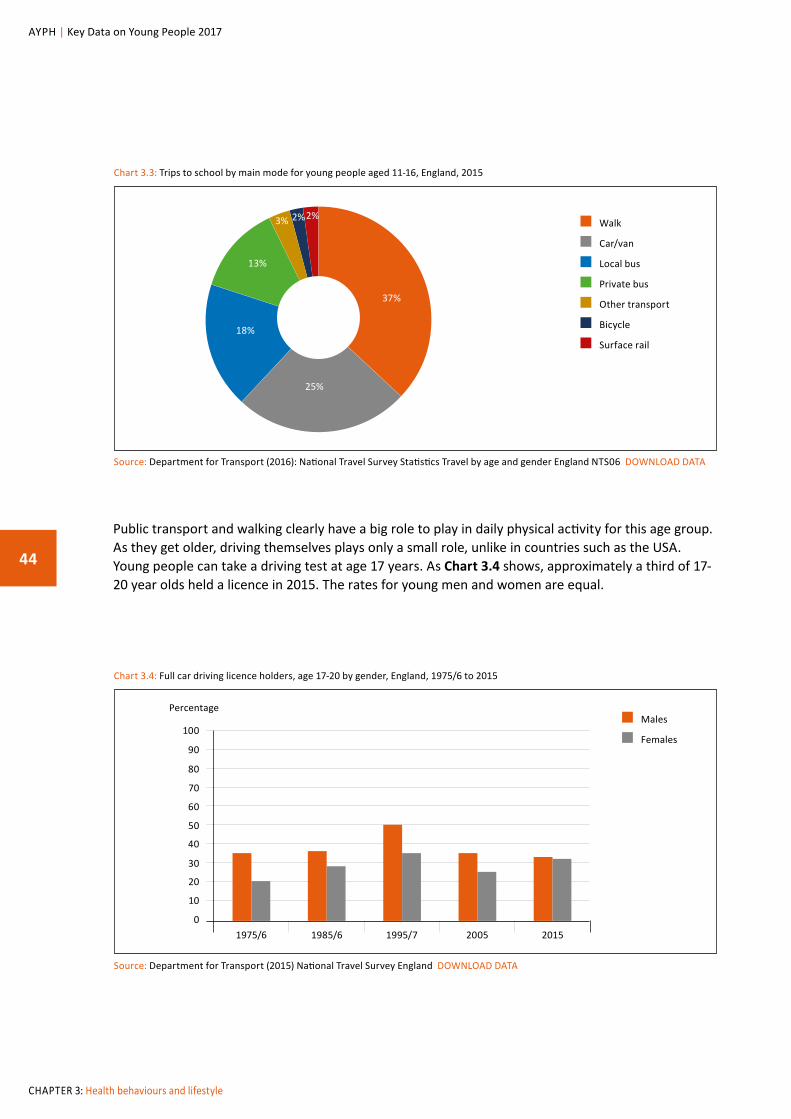
The walking that young people undertake is usually generated by the journey to school or college. Drawing on data from the Department for Transport’s National Travel Survey, Chart 3.3 shows that 37% of trips to school in England by young people aged 11-16 are made on foot, with bus and car transport making up most of the remainder. Only a very small proportion travel to school by rail (2%) or on bicycles (2%). The survey also notes that the proportion walking was 45% back in 2002, suggesting a reduction of 16% in the last 15 years (Department for Transport, 2016).
Source: NatCen Social Research/UCL (2015) Health Survey for England 2015. Leeds: NHS Digital DOWNLOAD DATA
100
90
70
50
80
60
40
20
30
10
08-10 8-1011-12 11-1213-15 13-15
Walking
Informal sports
Formal sports
Boys Girls
Chart 3.2: Participation in different physical activities by age and gender, England, 2015
Percentage
44
CHAPTER 3: Health behaviours and lifestyle
AYPH | Key Data on Young People 2017
Chart 3.4: Full car driving licence holders, age 17-20 by gender, England, 1975/6 to 2015
Source: Department for Transport (2015) National Travel Survey England DOWNLOAD DATA
Chart 3.3: Trips to school by main mode for young people aged 11-16, England, 2015
Source: Department for Transport (2016): National Travel Survey Statistics Travel by age and gender England NTS06 DOWNLOAD DATA
37%
25%
18%
13%
3% 2%2% Walk
Car/van
Local bus
Private bus
Other transport
Bicycle
Surface rail
1975/6 1985/6 1995/7 2005 2015
Percentage
10
20
30
40
50
60
70
80
90
100
0
Males
Females
Public transport and walking clearly have a big role to play in daily physical activity for this age group. As they get older, driving themselves plays only a small role, unlike in countries such as the USA. Young people can take a driving test at age 17 years. As Chart 3.4 shows, approximately a third of 17-20 year olds held a licence in 2015. The rates for young men and women are equal.
45
CHAPTER 3: Health behaviours and lifestyle
AYPH | Key Data on Young People 2017
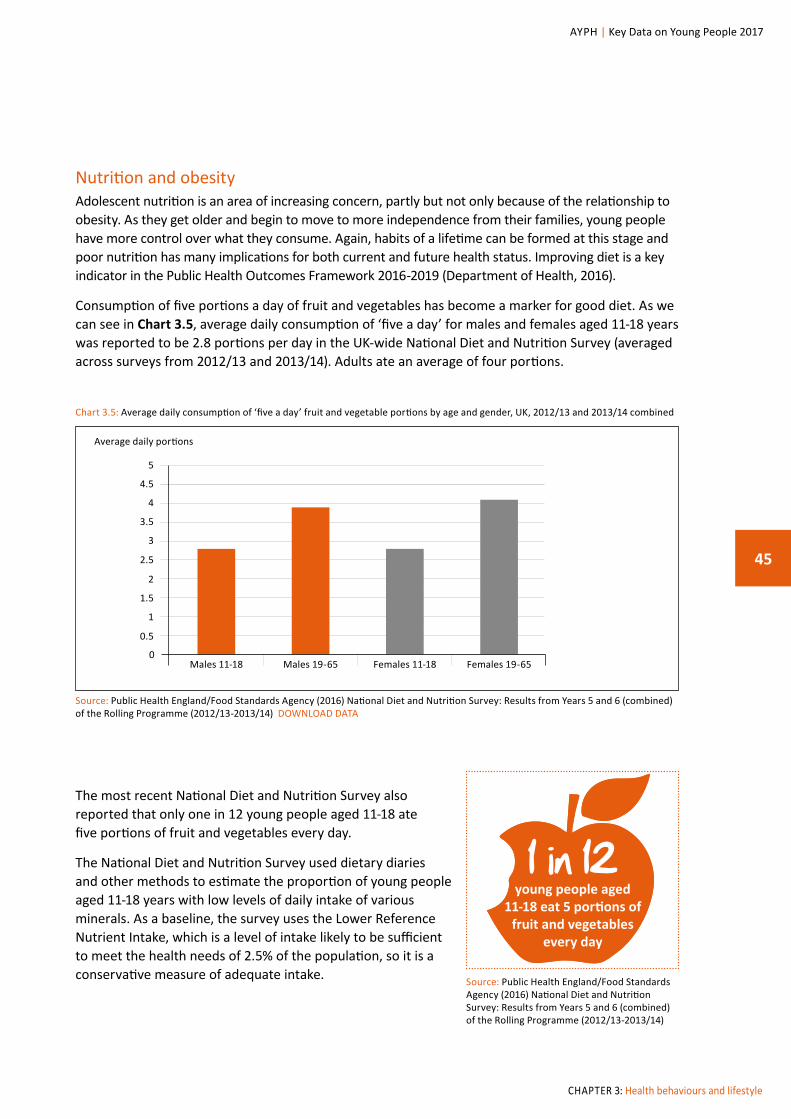
Nutrition and obesityAdolescent nutrition is an area of increasing concern, partly but not only because of the relationship to obesity. As they get older and begin to move to more independence from their families, young people have more control over what they consume. Again, habits of a lifetime can be formed at this stage and poor nutrition has many implications for both current and future health status. Improving diet is a key indicator in the Public Health Outcomes Framework 2016-2019 (Department of Health, 2016).
Consumption of five portions a day of fruit and vegetables has become a marker for good diet. As we can see in Chart 3.5, average daily consumption of ‘five a day’ for males and females aged 11-18 years was reported to be 2.8 portions per day in the UK-wide National Diet and Nutrition Survey (averaged across surveys from 2012/13 and 2013/14). Adults ate an average of four portions.
Source: Public Health England/Food Standards Agency (2016) National Diet and Nutrition Survey: Results from Years 5 and 6 (combined) of the Rolling Programme (2012/13-2013/14)
Chart 3.5: Average daily consumption of ‘five a day’ fruit and vegetable portions by age and gender, UK, 2012/13 and 2013/14 combined
Source: Public Health England/Food Standards Agency (2016) National Diet and Nutrition Survey: Results from Years 5 and 6 (combined) of the Rolling Programme (2012/13-2013/14) DOWNLOAD DATA
0Males 11-18 Males 19-65 Females 11-18 Females 19-65
Average daily portions
3
5
2.5
4.5
2
4
1.5
3.5
1
0.5
The most recent National Diet and Nutrition Survey also reported that only one in 12 young people aged 11-18 ate five portions of fruit and vegetables every day.
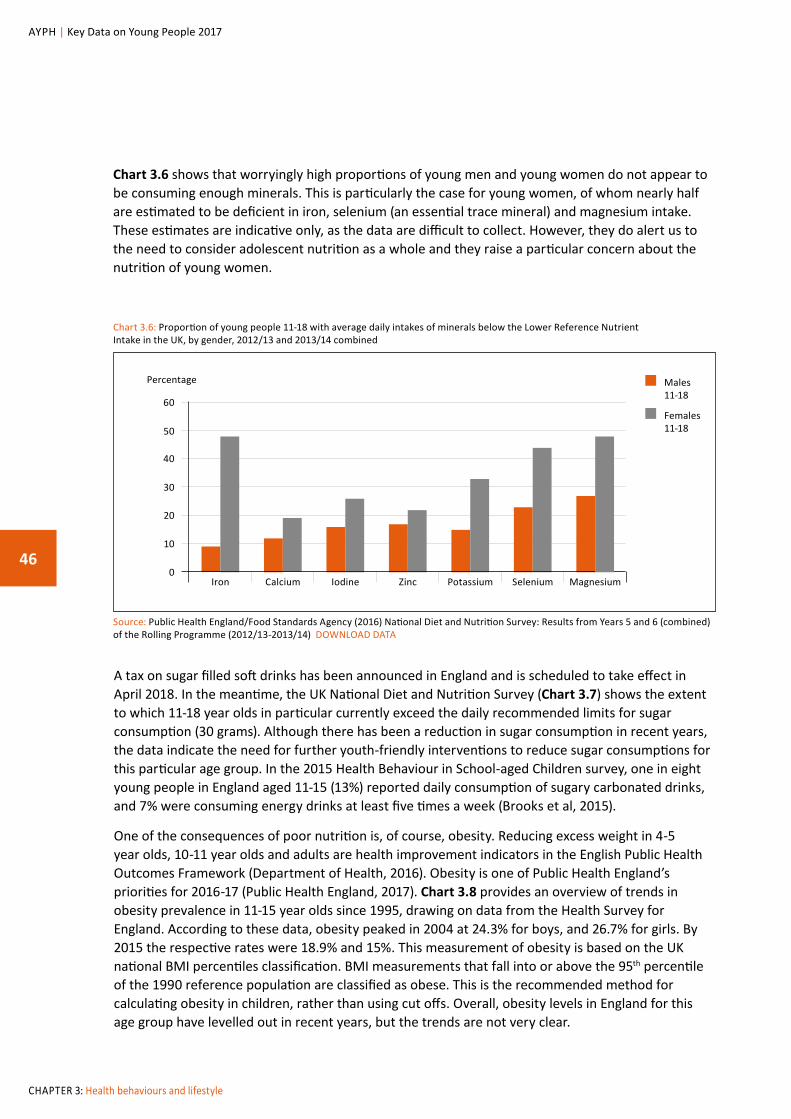
The National Diet and Nutrition Survey used dietary diaries and other methods to estimate the proportion of young people aged 11-18 years with low levels of daily intake of various minerals. As a baseline, the survey uses the Lower Reference Nutrient Intake, which is a level of intake likely to be sufficient to meet the health needs of 2.5% of the population, so it is a conservative measure of adequate intake.
1 in 12young people aged
11-18 eat 5 portions of fruit and vegetables
every day
46
CHAPTER 3: Health behaviours and lifestyle
AYPH | Key Data on Young People 2017
Chart 3.6 shows that worryingly high proportions of young men and young women do not appear to be consuming enough minerals. This is particularly the case for young women, of whom nearly half are estimated to be deficient in iron, selenium (an essential trace mineral) and magnesium intake. These estimates are indicative only, as the data are difficult to collect. However, they do alert us to the need to consider adolescent nutrition as a whole and they raise a particular concern about the nutrition of young women.
60
50
40
30
20
10
0Iron Calcium Iodine Zinc Potassium Selenium Magnesium
Males 11-18
Females 11-18
Percentage
Chart 3.6: Proportion of young people 11-18 with average daily intakes of minerals below the Lower Reference Nutrient Intake in the UK, by gender, 2012/13 and 2013/14 combined
Source: Public Health England/Food Standards Agency (2016) National Diet and Nutrition Survey: Results from Years 5 and 6 (combined) of the Rolling Programme (2012/13-2013/14) DOWNLOAD DATA
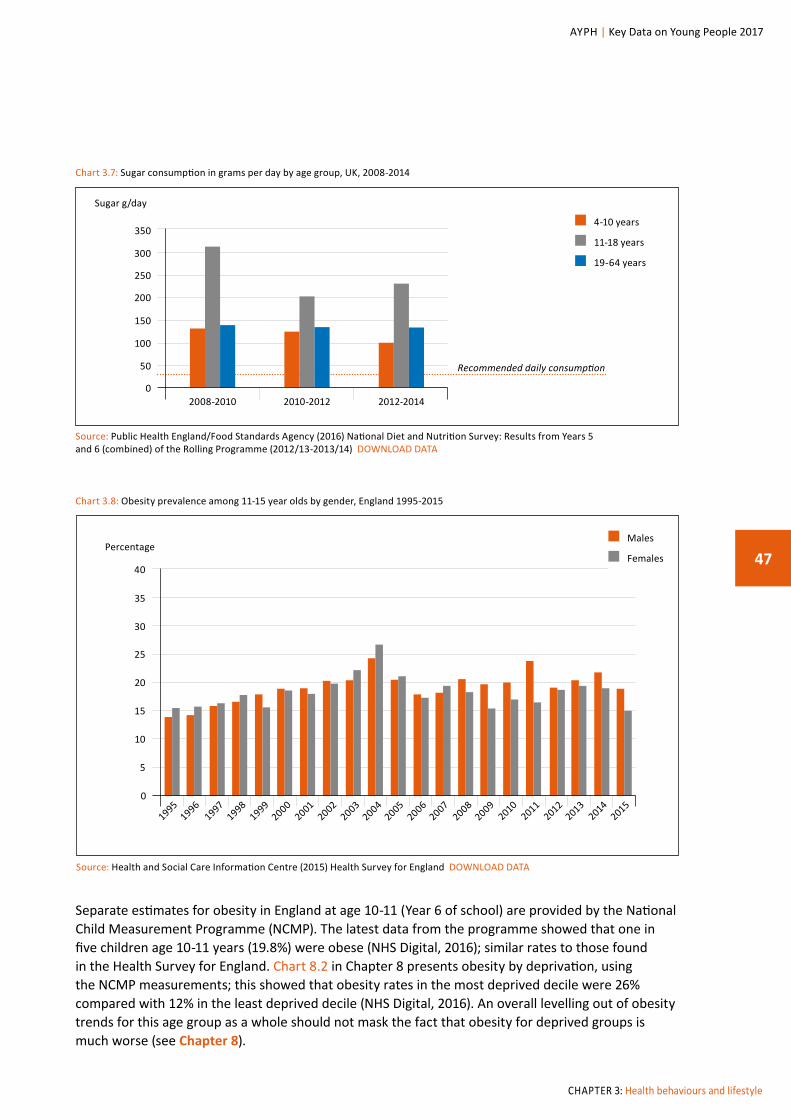
A tax on sugar filled soft drinks has been announced in England and is scheduled to take effect in April 2018. In the meantime, the UK National Diet and Nutrition Survey (Chart 3.7) shows the extent to which 11-18 year olds in particular currently exceed the daily recommended limits for sugar consumption (30 grams). Although there has been a reduction in sugar consumption in recent years, the data indicate the need for further youth-friendly interventions to reduce sugar consumptions for this particular age group. In the 2015 Health Behaviour in School-aged Children survey, one in eight young people in England aged 11-15 (13%) reported daily consumption of sugary carbonated drinks, and 7% were consuming energy drinks at least five times a week (Brooks et al, 2015).
One of the consequences of poor nutrition is, of course, obesity. Reducing excess weight in 4-5 year olds, 10-11 year olds and adults are health improvement indicators in the English Public Health Outcomes Framework (Department of Health, 2016). Obesity is one of Public Health England’s priorities for 2016-17 (Public Health England, 2017). Chart 3.8 provides an overview of trends in obesity prevalence in 11-15 year olds since 1995, drawing on data from the Health Survey for England. According to these data, obesity peaked in 2004 at 24.3% for boys, and 26.7% for girls. By 2015 the respective rates were 18.9% and 15%. This measurement of obesity is based on the UK national BMI percentiles classification. BMI measurements that fall into or above the 95th percentile of the 1990 reference population are classified as obese. This is the recommended method for calculating obesity in children, rather than using cut offs. Overall, obesity levels in England for this age group have levelled out in recent years, but the trends are not very clear.
47
CHAPTER 3: Health behaviours and lifestyle
AYPH | Key Data on Young People 2017
Chart 3.7: Sugar consumption in grams per day by age group, UK, 2008-2014
Source: Public Health England/Food Standards Agency (2016) National Diet and Nutrition Survey: Results from Years 5 and 6 (combined) of the Rolling Programme (2012/13-2013/14) DOWNLOAD DATA
350
250
300
200
100
150
50
02008-2010 2010-2012 2012-2014
4-10 years
11-18 years
19-64 years
Recommended daily consumption
Sugar g/day
Chart 3.8: Obesity prevalence among 11-15 year olds by gender, England 1995-2015
Source: Health and Social Care Information Centre (2015) Health Survey for England DOWNLOAD DATA
0
19951996
19971998
19992000
20012002
20032004
20052006
20072008
20092010
20112012
20142013
2015
Percentage
30
25
20
40
15
35
10
5
Males
Females
Separate estimates for obesity in England at age 10-11 (Year 6 of school) are provided by the National Child Measurement Programme (NCMP). The latest data from the programme showed that one in five children age 10-11 years (19.8%) were obese (NHS Digital, 2016); similar rates to those found in the Health Survey for England. Chart 8.2 in Chapter 8 presents obesity by deprivation, using the NCMP measurements; this showed that obesity rates in the most deprived decile were 26% compared with 12% in the least deprived decile (NHS Digital, 2016). An overall levelling out of obesity trends for this age group as a whole should not mask the fact that obesity for deprived groups is much worse (see Chapter 8).
48
CHAPTER 3: Health behaviours and lifestyle
AYPH | Key Data on Young People 2017
Estimates of obesity in children for Wales and Scotland are available from their own health surveys, including the Scottish Health Survey and the Public Health Wales Measurement Programme. The latest Scottish Health Survey 2015 reported that 15% of young people aged 12-15 were obese (Scottish Government, 2016). The Welsh child measurement programme only includes children aged 4-5 years and comparable data for older children are not available. However, the Welsh report from the Health Behaviour of School-aged Children survey in 2015 concluded that 18% of children aged 11-16 were obese (Ipsos MORI 2015). In Northern Ireland, government statistics on childhood obesity are only given for all children aged 2-15 collectively, again reducing comparability. Estimates across the countries of the UK for children at secondary school thus range from 15-20%, but direct comparisons are not possible because of the variation in the age group covered in the measurements. There are also differences in how the estimates are calculated in surveys which may also contribute to variation in estimates (for example, by self-report in the HBSC or direct measurement in others).
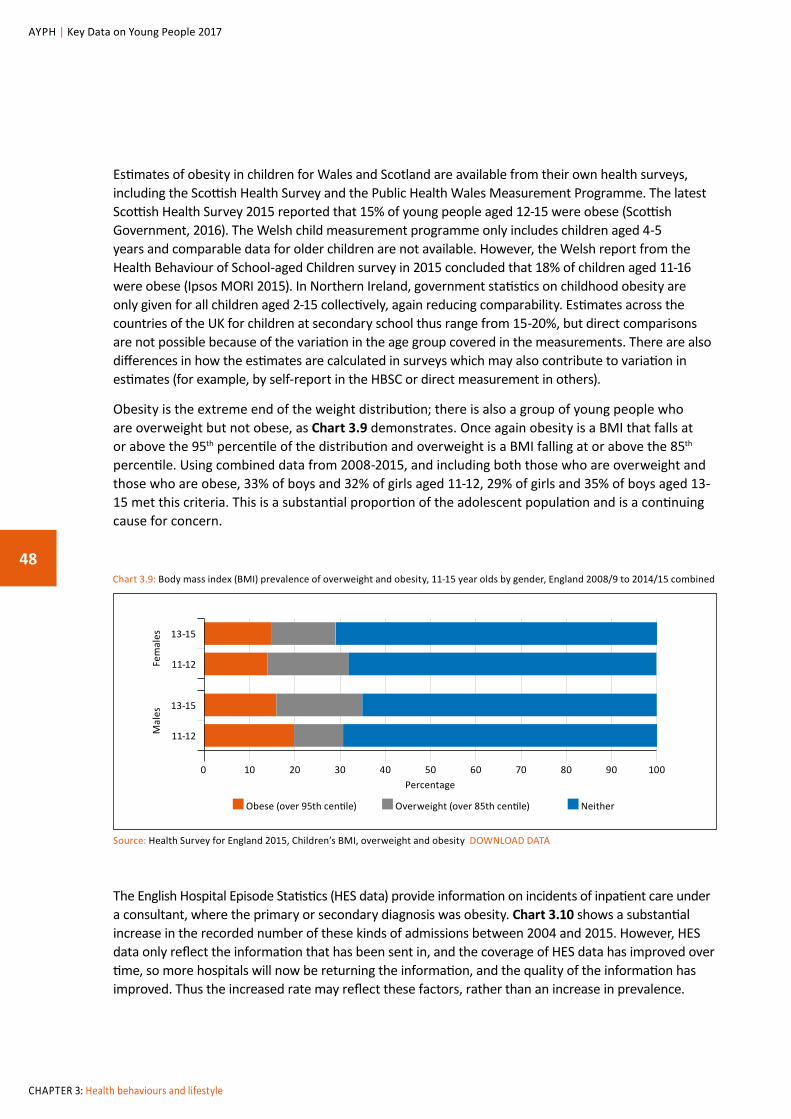
Obesity is the extreme end of the weight distribution; there is also a group of young people who are overweight but not obese, as Chart 3.9 demonstrates. Once again obesity is a BMI that falls at or above the 95th percentile of the distribution and overweight is a BMI falling at or above the 85th percentile. Using combined data from 2008-2015, and including both those who are overweight and those who are obese, 33% of boys and 32% of girls aged 11-12, 29% of girls and 35% of boys aged 13-15 met this criteria. This is a substantial proportion of the adolescent population and is a continuing cause for concern.
13-15
13-15
11-12
11-12
0 10 20 30 40 50 60 70 80 90 100Percentage
Obese (over 95th centile) Overweight (over 85th centile) Neither
Chart 3.9: Body mass index (BMI) prevalence of overweight and obesity, 11-15 year olds by gender, England 2008/9 to 2014/15 combined
Source: Health Survey for England 2015, Children’s BMI, overweight and obesity DOWNLOAD DATA
Fem
ales
Mal
es
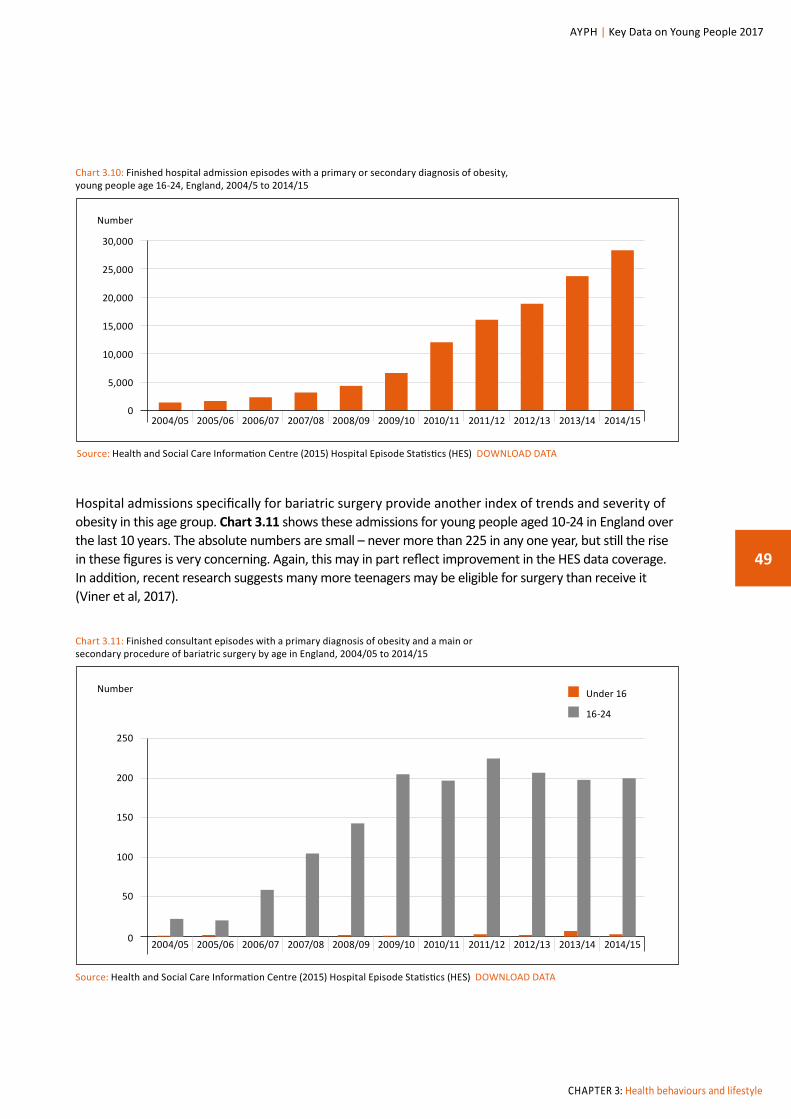
The English Hospital Episode Statistics (HES data) provide information on incidents of inpatient care under a consultant, where the primary or secondary diagnosis was obesity. Chart 3.10 shows a substantial increase in the recorded number of these kinds of admissions between 2004 and 2015. However, HES data only reflect the information that has been sent in, and the coverage of HES data has improved over time, so more hospitals will now be returning the information, and the quality of the information has improved. Thus the increased rate may reflect these factors, rather than an increase in prevalence.
49
CHAPTER 3: Health behaviours and lifestyle
AYPH | Key Data on Young People 2017
Chart 3.10: Finished hospital admission episodes with a primary or secondary diagnosis of obesity, young people age 16-24, England, 2004/5 to 2014/15
Source: Health and Social Care Information Centre (2015) Hospital Episode Statistics (HES) DOWNLOAD DATA
5,000
10,000
15,000
20,000
25,000
30,000
Number
02004/05 2005/06 2006/07 2007/08 2008/09 2009/10 2010/11 2011/12 2012/13 2013/14 2014/15
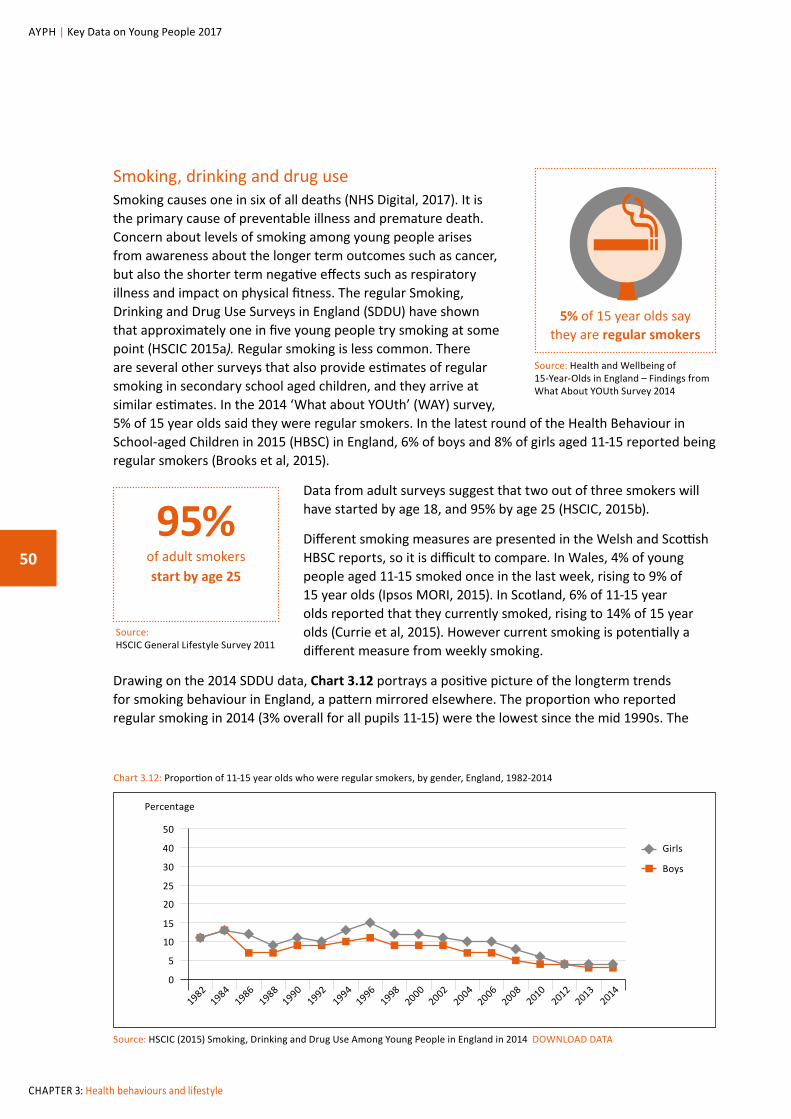
Hospital admissions specifically for bariatric surgery provide another index of trends and severity of obesity in this age group. Chart 3.11 shows these admissions for young people aged 10-24 in England over the last 10 years. The absolute numbers are small – never more than 225 in any one year, but still the rise in these figures is very concerning. Again, this may in part reflect improvement in the HES data coverage. In addition, recent research suggests many more teenagers may be eligible for surgery than receive it (Viner et al, 2017).
Chart 3.11: Finished consultant episodes with a primary diagnosis of obesity and a main or secondary procedure of bariatric surgery by age in England, 2004/05 to 2014/15
Source: Health and Social Care Information Centre (2015) Hospital Episode Statistics (HES) DOWNLOAD DATA
50
100
150
200
250
Number
0 2004/05 2005/06 2006/07 2007/08 2008/09 2009/10 2010/11 2011/12 2012/13 2013/14 2014/15
Under 16
16-24
50
CHAPTER 3: Health behaviours and lifestyle
AYPH | Key Data on Young People 2017
Smoking, drinking and drug useSmoking causes one in six of all deaths (NHS Digital, 2017). It is the primary cause of preventable illness and premature death. Concern about levels of smoking among young people arises from awareness about the longer term outcomes such as cancer, but also the shorter term negative effects such as respiratory illness and impact on physical fitness. The regular Smoking, Drinking and Drug Use Surveys in England (SDDU) have shown that approximately one in five young people try smoking at some point (HSCIC 2015a). Regular smoking is less common. There are several other surveys that also provide estimates of regular smoking in secondary school aged children, and they arrive at similar estimates. In the 2014 ‘What about YOUth’ (WAY) survey, 5% of 15 year olds said they were regular smokers. In the latest round of the Health Behaviour in School-aged Children in 2015 (HBSC) in England, 6% of boys and 8% of girls aged 11-15 reported being regular smokers (Brooks et al, 2015).
Data from adult surveys suggest that two out of three smokers will have started by age 18, and 95% by age 25 (HSCIC, 2015b).
Different smoking measures are presented in the Welsh and Scottish HBSC reports, so it is difficult to compare. In Wales, 4% of young people aged 11-15 smoked once in the last week, rising to 9% of 15 year olds (Ipsos MORI, 2015). In Scotland, 6% of 11-15 year olds reported that they currently smoked, rising to 14% of 15 year olds (Currie et al, 2015). However current smoking is potentially a different measure from weekly smoking.
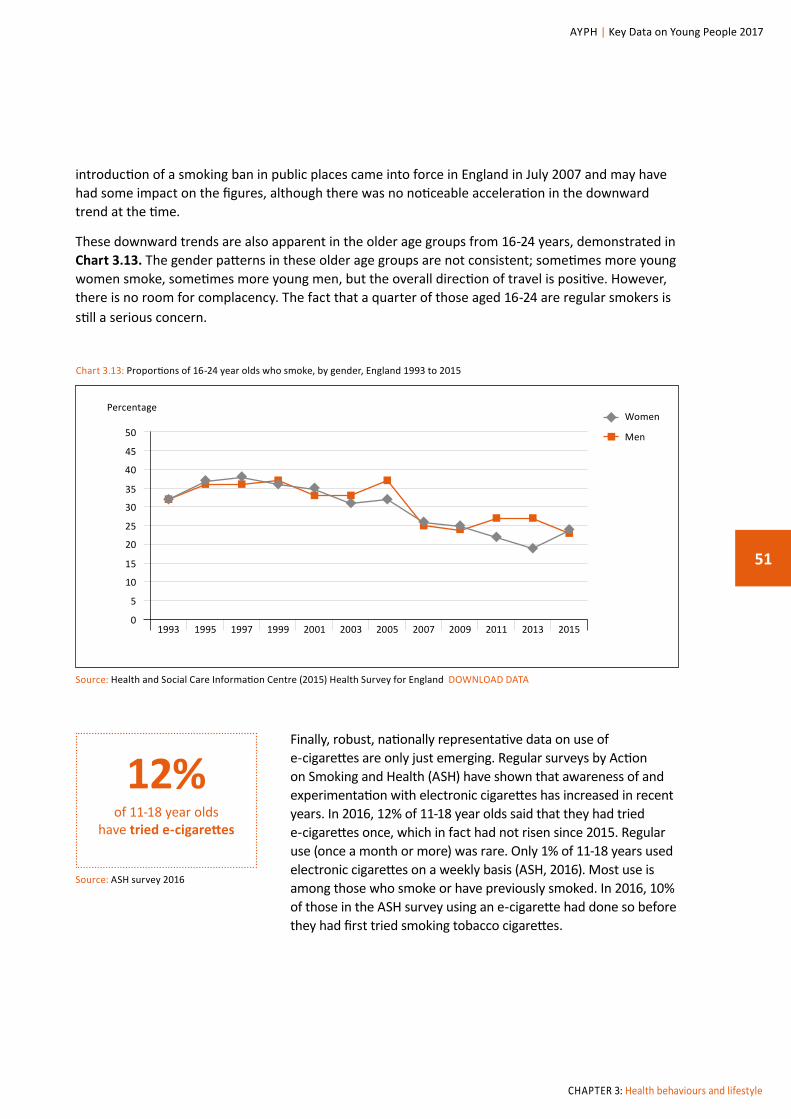
Drawing on the 2014 SDDU data, Chart 3.12 portrays a positive picture of the longterm trends for smoking behaviour in England, a pattern mirrored elsewhere. The proportion who reported regular smoking in 2014 (3% overall for all pupils 11-15) were the lowest since the mid 1990s. The
Source: Health and Wellbeing of 15-Year-Olds in England – Findings from What About YOUth Survey 2014
5% of 15 year olds say they are regular smokers
Source: HSCIC General Lifestyle Survey 2011
95%of adult smokers start by age 25
Source: HSCIC (2015) Smoking, Drinking and Drug Use Among Young People in England in 2014 DOWNLOAD DATA
19821984
19861988
19901992
19941996
19982000
20022004
20062008
20102012
20132014
Percentage
5
10
15
20
25
30
40
50
0
Girls
Boys
Chart 3.12: Proportion of 11-15 year olds who were regular smokers, by gender, England, 1982-2014
51
CHAPTER 3: Health behaviours and lifestyle
AYPH | Key Data on Young People 2017
introduction of a smoking ban in public places came into force in England in July 2007 and may have had some impact on the figures, although there was no noticeable acceleration in the downward trend at the time.
These downward trends are also apparent in the older age groups from 16-24 years, demonstrated in Chart 3.13. The gender patterns in these older age groups are not consistent; sometimes more young women smoke, sometimes more young men, but the overall direction of travel is positive. However, there is no room for complacency. The fact that a quarter of those aged 16-24 are regular smokers is still a serious concern.
Source: Health and Social Care Information Centre (2015) Health Survey for England DOWNLOAD DATA
1993 1995 1997 1999 2001 2003 2005 2007 2009 2011 2013 2015
Percentage
5
10
15
35
20
40
25
45
30
50
0
Women
Men
Chart 3.13: Proportions of 16-24 year olds who smoke, by gender, England 1993 to 2015
Finally, robust, nationally representative data on use of e-cigarettes are only just emerging. Regular surveys by Action on Smoking and Health (ASH) have shown that awareness of and experimentation with electronic cigarettes has increased in recent years. In 2016, 12% of 11-18 year olds said that they had tried e-cigarettes once, which in fact had not risen since 2015. Regular use (once a month or more) was rare. Only 1% of 11-18 years used electronic cigarettes on a weekly basis (ASH, 2016). Most use is among those who smoke or have previously smoked. In 2016, 10% of those in the ASH survey using an e-cigarette had done so before they had first tried smoking tobacco cigarettes.
Source: ASH survey 2016
12%of 11-18 year olds
have tried e-cigarettes
52
CHAPTER 3: Health behaviours and lifestyle
AYPH | Key Data on Young People 2017
Source Ever tried
Use less than once a
week
Use more than once a
week
Use (at least
monthly) in never smokers
Regular smokers who had
tried e-cigarettes
ASH Smokefree GB youth survey (11-18) (2016-March)
12.00% 0.70% 0.90% 0.30% 70%
Health Behaviour in School-Aged Children, Wales (11-16) (Nov 2013-Feb 2014)
12.30%1.5%
(use at least monthly)0.30%
Not reported
CHETS Wales survey (10-11 year olds) 2014
5.80%Not
reported Not
reportedNot
reportedNot
reported
SALSUS Scotland survey (15 and 13 year olds) 2015
23.57% 1.53% 2.33% 0.52% 90.19%
The Smoking, Drinking and Drug Use survey (11-15 year olds) 2014
22% 3% 1%Not
reported89%
What about YOUth Survey (15 year olds) 2014
18% 2% 1% 0% 84%
Chart 3.14: E-cigarette use among young people up to age 18, comparison of survey estimates (from Action for Smoking on Health), 2017
Source: Action on Smoking and Health (2016) Use of electronic cigarettes among children in Great Britain. London: ASH. Reproduced with permission DOWNLOAD DATA
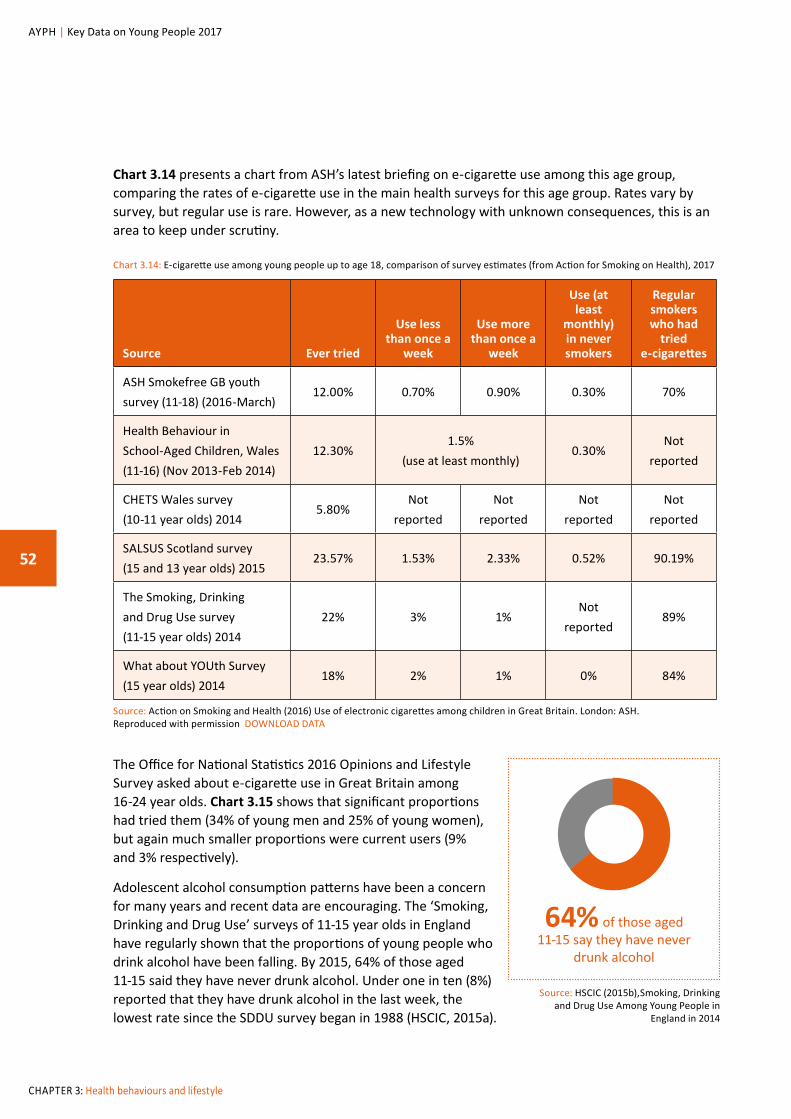
Chart 3.14 presents a chart from ASH’s latest briefing on e-cigarette use among this age group, comparing the rates of e-cigarette use in the main health surveys for this age group. Rates vary by survey, but regular use is rare. However, as a new technology with unknown consequences, this is an area to keep under scrutiny.
64% of those aged 11-15 say they have never
drunk alcohol
Source: HSCIC (2015b),Smoking, Drinking and Drug Use Among Young People in
England in 2014
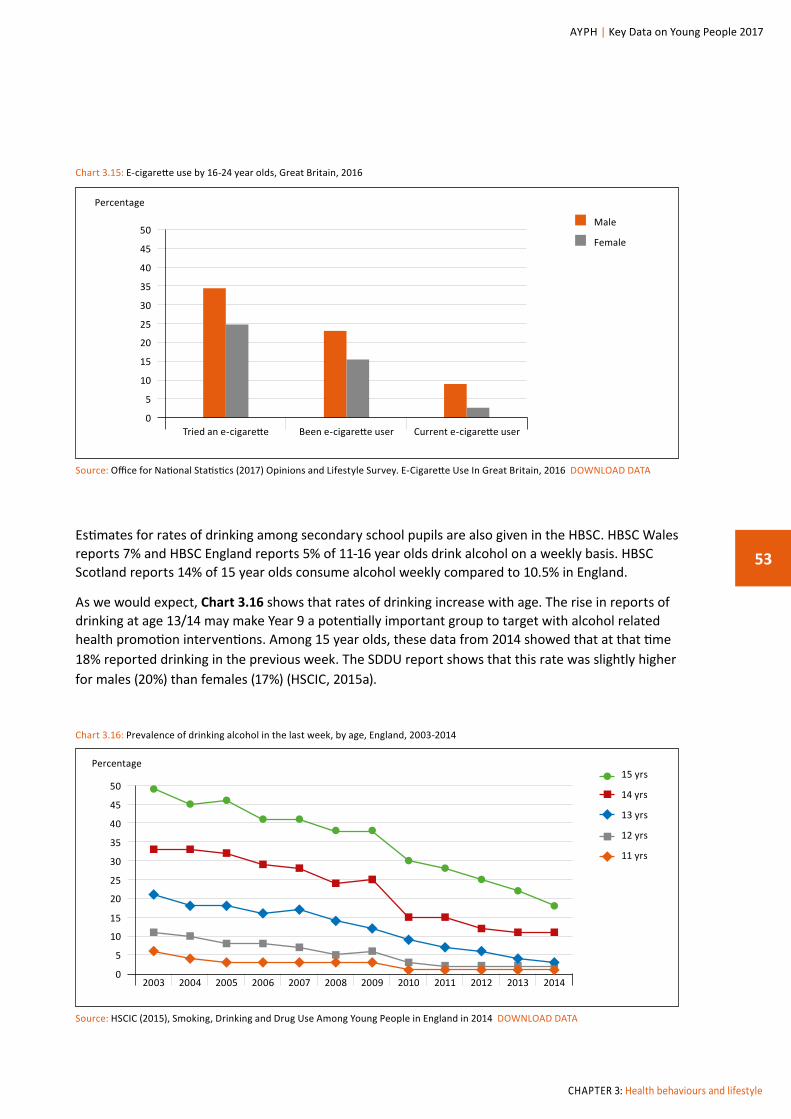
The Office for National Statistics 2016 Opinions and Lifestyle Survey asked about e-cigarette use in Great Britain among 16-24 year olds. Chart 3.15 shows that significant proportions had tried them (34% of young men and 25% of young women), but again much smaller proportions were current users (9% and 3% respectively).
Adolescent alcohol consumption patterns have been a concern for many years and recent data are encouraging. The ‘Smoking, Drinking and Drug Use’ surveys of 11-15 year olds in England have regularly shown that the proportions of young people who drink alcohol have been falling. By 2015, 64% of those aged 11-15 said they have never drunk alcohol. Under one in ten (8%) reported that they have drunk alcohol in the last week, the lowest rate since the SDDU survey began in 1988 (HSCIC, 2015a).
53
CHAPTER 3: Health behaviours and lifestyle
AYPH | Key Data on Young People 2017
Chart 3.15: E-cigarette use by 16-24 year olds, Great Britain, 2016
Source: Office for National Statistics (2017) Opinions and Lifestyle Survey. E-Cigarette Use In Great Britain, 2016 DOWNLOAD DATA
35
50
25
40
30
45
20
10
15
5
0Tried an e-cigarette Been e-cigarette user Current e-cigarette user
Male
Female
Percentage
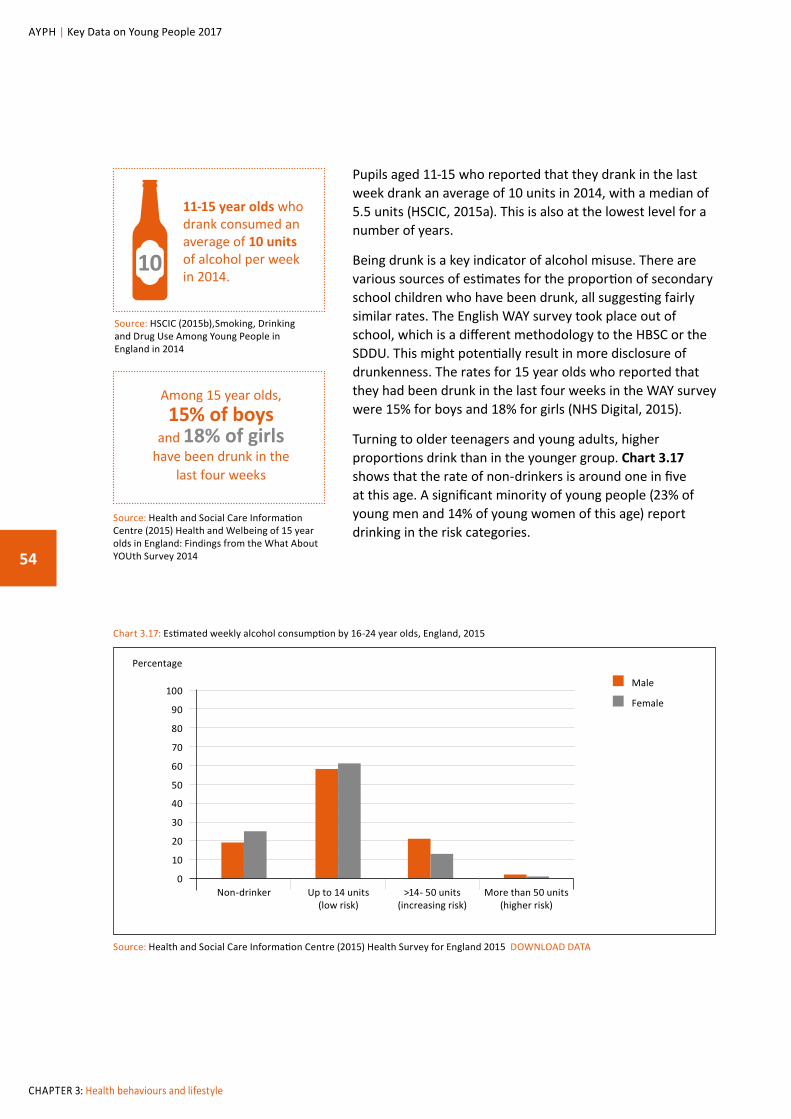
Estimates for rates of drinking among secondary school pupils are also given in the HBSC. HBSC Wales reports 7% and HBSC England reports 5% of 11-16 year olds drink alcohol on a weekly basis. HBSC Scotland reports 14% of 15 year olds consume alcohol weekly compared to 10.5% in England.
As we would expect, Chart 3.16 shows that rates of drinking increase with age. The rise in reports of drinking at age 13/14 may make Year 9 a potentially important group to target with alcohol related health promotion interventions. Among 15 year olds, these data from 2014 showed that at that time 18% reported drinking in the previous week. The SDDU report shows that this rate was slightly higher for males (20%) than females (17%) (HSCIC, 2015a).
Source: HSCIC (2015), Smoking, Drinking and Drug Use Among Young People in England in 2014 DOWNLOAD DATA
Chart 3.16: Prevalence of drinking alcohol in the last week, by age, England, 2003-2014
2003 2004 2005 2006 2007 2008 2009 2010 2011 2012 2013 2014
Percentage
5
10
15
20
25
30
35
45
40
50
0
15 yrs
14 yrs
13 yrs
12 yrs
11 yrs
54
CHAPTER 3: Health behaviours and lifestyle
AYPH | Key Data on Young People 2017
Pupils aged 11-15 who reported that they drank in the last week drank an average of 10 units in 2014, with a median of 5.5 units (HSCIC, 2015a). This is also at the lowest level for a number of years.
Being drunk is a key indicator of alcohol misuse. There are various sources of estimates for the proportion of secondary school children who have been drunk, all suggesting fairly similar rates. The English WAY survey took place out of school, which is a different methodology to the HBSC or the SDDU. This might potentially result in more disclosure of drunkenness. The rates for 15 year olds who reported that they had been drunk in the last four weeks in the WAY survey were 15% for boys and 18% for girls (NHS Digital, 2015).
Turning to older teenagers and young adults, higher proportions drink than in the younger group. Chart 3.17 shows that the rate of non-drinkers is around one in five at this age. A significant minority of young people (23% of young men and 14% of young women of this age) report drinking in the risk categories.
11-15 year olds who drank consumed an average of 10 units of alcohol per week in 2014.
Source: HSCIC (2015b),Smoking, Drinking and Drug Use Among Young People in England in 2014
10
Among 15 year olds, 15% of boys
and 18% of girls have been drunk in the
last four weeks
Source: Health and Social Care Information Centre (2015) Health and Welbeing of 15 year olds in England: Findings from the What About YOUth Survey 2014
Chart 3.17: Estimated weekly alcohol consumption by 16-24 year olds, England, 2015
Source: Health and Social Care Information Centre (2015) Health Survey for England 2015 DOWNLOAD DATA
70
100
50
80
60
90
40
20
30
10
0Non-drinker >14- 50 units
(increasing risk)Up to 14 units
(low risk)More than 50 units
(higher risk)
Male
Female
Percentage
55
CHAPTER 3: Health behaviours and lifestyle
AYPH | Key Data on Young People 2017
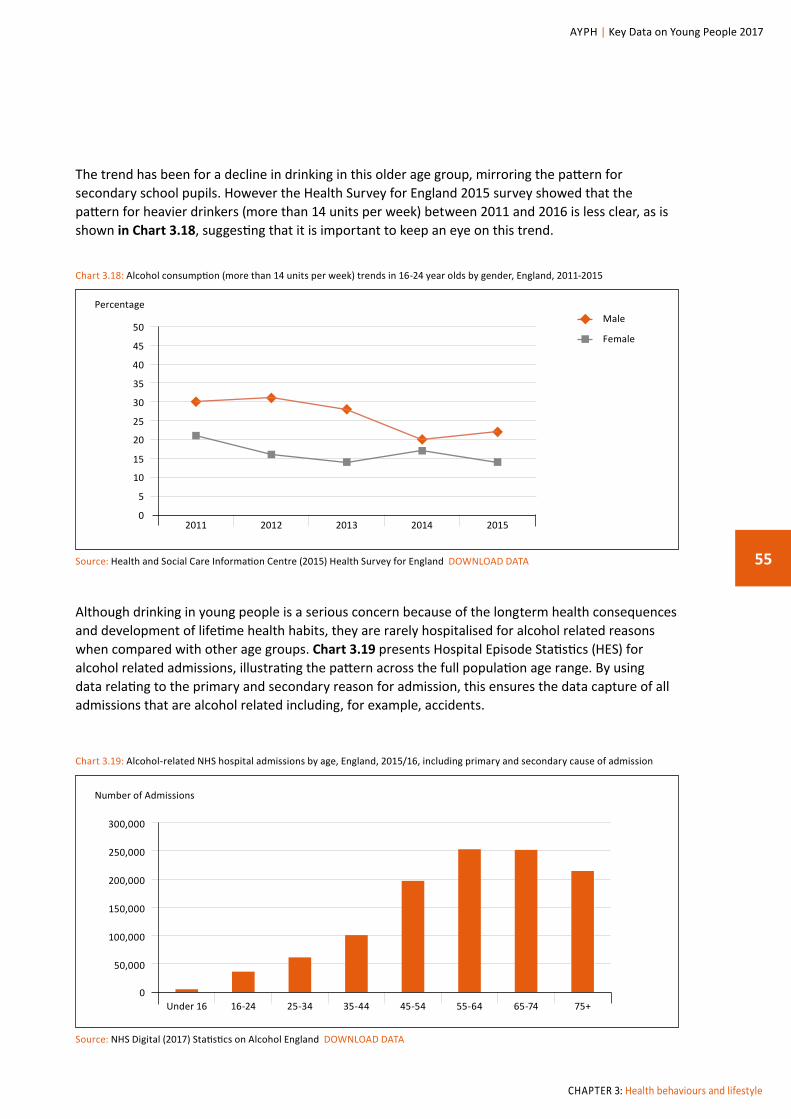
The trend has been for a decline in drinking in this older age group, mirroring the pattern for secondary school pupils. However the Health Survey for England 2015 survey showed that the pattern for heavier drinkers (more than 14 units per week) between 2011 and 2016 is less clear, as is shown in Chart 3.18, suggesting that it is important to keep an eye on this trend.
Chart 3.18: Alcohol consumption (more than 14 units per week) trends in 16-24 year olds by gender, England, 2011-2015
Source: Health and Social Care Information Centre (2015) Health Survey for England DOWNLOAD DATA
2011 2012 2013 2014 2015
Percentage
5
10
15
20
25
30
35
45
40
50
0
Male
Female
Although drinking in young people is a serious concern because of the longterm health consequences and development of lifetime health habits, they are rarely hospitalised for alcohol related reasons when compared with other age groups. Chart 3.19 presents Hospital Episode Statistics (HES) for alcohol related admissions, illustrating the pattern across the full population age range. By using data relating to the primary and secondary reason for admission, this ensures the data capture of all admissions that are alcohol related including, for example, accidents.
Chart 3.19: Alcohol-related NHS hospital admissions by age, England, 2015/16, including primary and secondary cause of admission
Source: NHS Digital (2017) Statistics on Alcohol England DOWNLOAD DATA
50,000
100,000
150,000
200,000
250,000
300,000
0Under 16 16-24 25-34 35-44 45-54 55-64 65-74 75+
Number of Admissions
56
CHAPTER 3: Health behaviours and lifestyle
AYPH | Key Data on Young People 2017
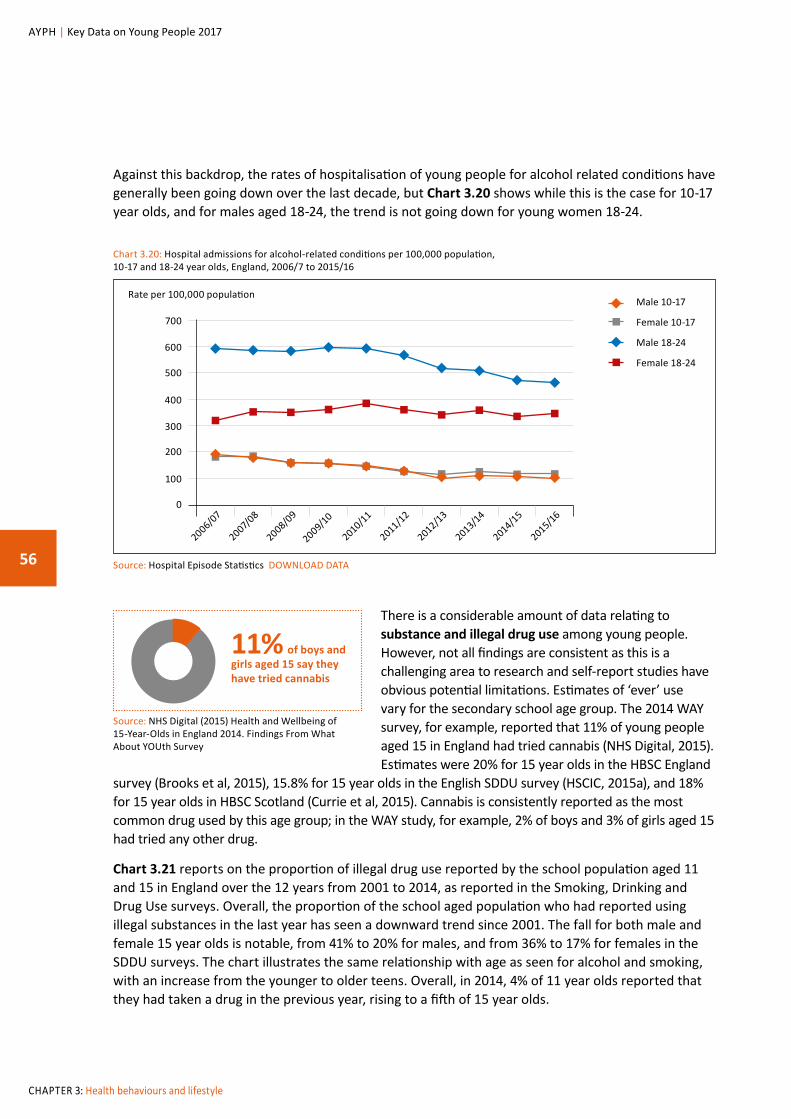
Against this backdrop, the rates of hospitalisation of young people for alcohol related conditions have generally been going down over the last decade, but Chart 3.20 shows while this is the case for 10-17 year olds, and for males aged 18-24, the trend is not going down for young women 18-24.
Chart 3.20: Hospital admissions for alcohol-related conditions per 100,000 population, 10-17 and 18-24 year olds, England, 2006/7 to 2015/16
Source: Hospital Episode Statistics DOWNLOAD DATA
Rate per 100,000 population
100
200
300
400
500
600
700
0
Male 10-17
Female 10-17
Male 18-24
Female 18-24
2006/07
2007/08
2008/09
2009/10
2010/11
2011/12
2012/13
2013/14
2014/15
2015/16
There is a considerable amount of data relating to substance and illegal drug use among young people. However, not all findings are consistent as this is a challenging area to research and self-report studies have obvious potential limitations. Estimates of ‘ever’ use vary for the secondary school age group. The 2014 WAY survey, for example, reported that 11% of young people aged 15 in England had tried cannabis (NHS Digital, 2015). Estimates were 20% for 15 year olds in the HBSC England
survey (Brooks et al, 2015), 15.8% for 15 year olds in the English SDDU survey (HSCIC, 2015a), and 18% for 15 year olds in HBSC Scotland (Currie et al, 2015). Cannabis is consistently reported as the most common drug used by this age group; in the WAY study, for example, 2% of boys and 3% of girls aged 15 had tried any other drug.
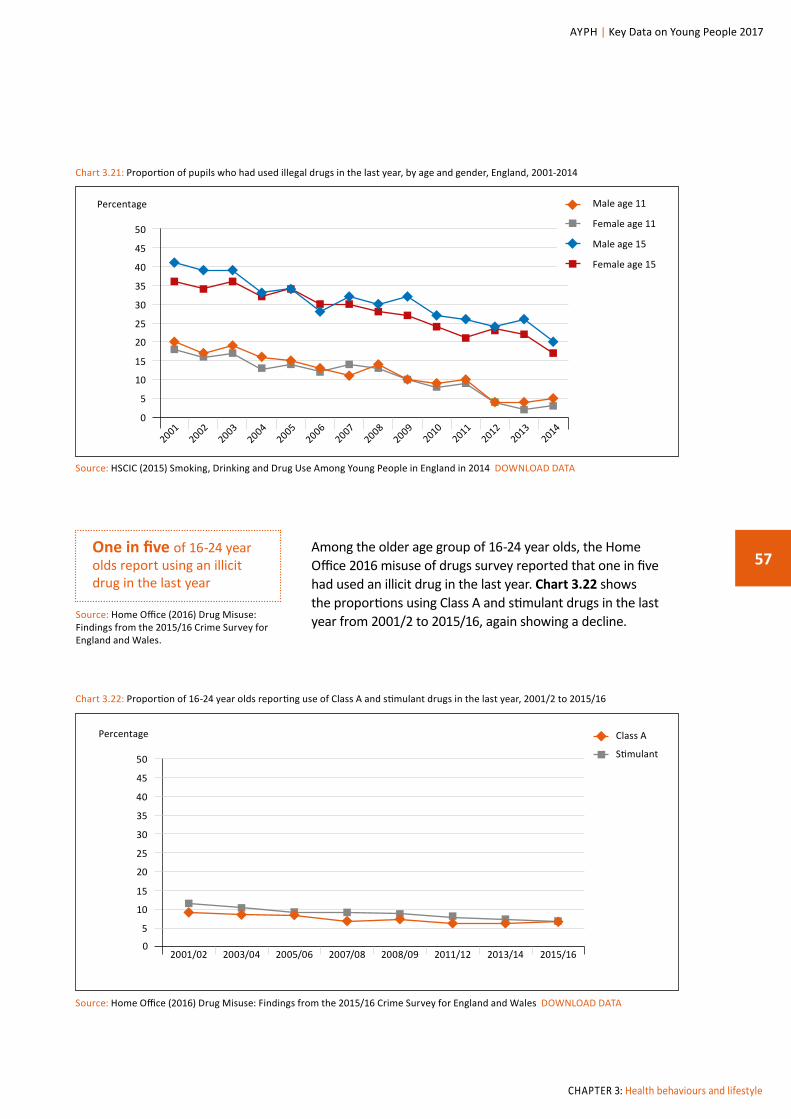
Chart 3.21 reports on the proportion of illegal drug use reported by the school population aged 11 and 15 in England over the 12 years from 2001 to 2014, as reported in the Smoking, Drinking and Drug Use surveys. Overall, the proportion of the school aged population who had reported using illegal substances in the last year has seen a downward trend since 2001. The fall for both male and female 15 year olds is notable, from 41% to 20% for males, and from 36% to 17% for females in the SDDU surveys. The chart illustrates the same relationship with age as seen for alcohol and smoking, with an increase from the younger to older teens. Overall, in 2014, 4% of 11 year olds reported that they had taken a drug in the previous year, rising to a fifth of 15 year olds.
Source: NHS Digital (2015) Health and Wellbeing of 15-Year-Olds in England 2014. Findings From What About YOUth Survey
11% of boys and girls aged 15 say they have tried cannabis
57
CHAPTER 3: Health behaviours and lifestyle
AYPH | Key Data on Young People 2017
Chart 3.21: Proportion of pupils who had used illegal drugs in the last year, by age and gender, England, 2001-2014
Source: HSCIC (2015) Smoking, Drinking and Drug Use Among Young People in England in 2014 DOWNLOAD DATA
Percentage
5
10
15
20
25
30
35
45
40
50
0
20012002
20032004
20052006
20072008
20092010
20112012
20132014
Male age 11
Female age 11
Male age 15
Female age 15
Among the older age group of 16-24 year olds, the Home Office 2016 misuse of drugs survey reported that one in five had used an illicit drug in the last year. Chart 3.22 shows the proportions using Class A and stimulant drugs in the last year from 2001/2 to 2015/16, again showing a decline.
One in five of 16-24 year olds report using an illicit drug in the last year
Source: Home Office (2016) Drug Misuse: Findings from the 2015/16 Crime Survey for England and Wales.
Source: Home Office (2016) Drug Misuse: Findings from the 2015/16 Crime Survey for England and Wales DOWNLOAD DATA
02001/02 2003/04 2005/06 2007/08 2008/09 2011/12 2013/14 2015/16
Chart 3.22: Proportion of 16-24 year olds reporting use of Class A and stimulant drugs in the last year, 2001/2 to 2015/16
Class A
Stimulant
5
10
15
20
25
30
35
45
40
50
Percentage
58
CHAPTER 3: Health behaviours and lifestyle
AYPH | Key Data on Young People 2017
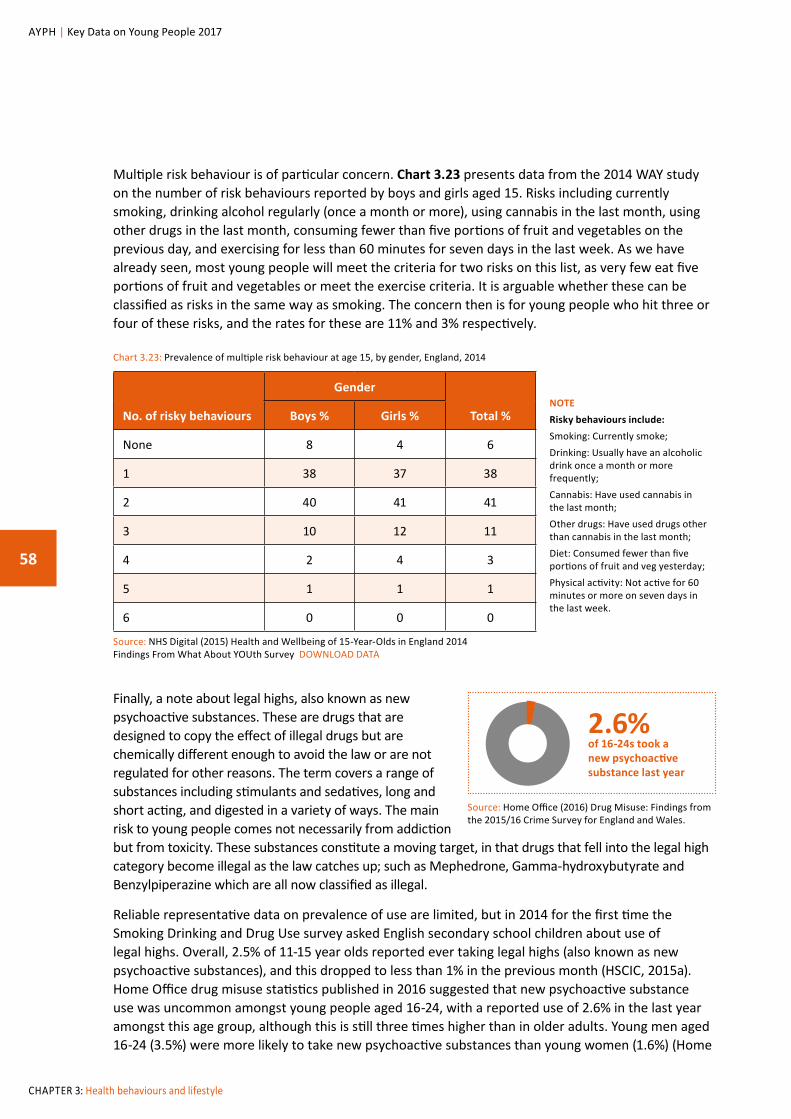
Multiple risk behaviour is of particular concern. Chart 3.23 presents data from the 2014 WAY study on the number of risk behaviours reported by boys and girls aged 15. Risks including currently smoking, drinking alcohol regularly (once a month or more), using cannabis in the last month, using other drugs in the last month, consuming fewer than five portions of fruit and vegetables on the previous day, and exercising for less than 60 minutes for seven days in the last week. As we have already seen, most young people will meet the criteria for two risks on this list, as very few eat five portions of fruit and vegetables or meet the exercise criteria. It is arguable whether these can be classified as risks in the same way as smoking. The concern then is for young people who hit three or four of these risks, and the rates for these are 11% and 3% respectively.
Finally, a note about legal highs, also known as new psychoactive substances. These are drugs that are designed to copy the effect of illegal drugs but are chemically different enough to avoid the law or are not regulated for other reasons. The term covers a range of substances including stimulants and sedatives, long and short acting, and digested in a variety of ways. The main risk to young people comes not necessarily from addiction but from toxicity. These substances constitute a moving target, in that drugs that fell into the legal high category become illegal as the law catches up; such as Mephedrone, Gamma-hydroxybutyrate and Benzylpiperazine which are all now classified as illegal.
Reliable representative data on prevalence of use are limited, but in 2014 for the first time the Smoking Drinking and Drug Use survey asked English secondary school children about use of legal highs. Overall, 2.5% of 11-15 year olds reported ever taking legal highs (also known as new psychoactive substances), and this dropped to less than 1% in the previous month (HSCIC, 2015a). Home Office drug misuse statistics published in 2016 suggested that new psychoactive substance use was uncommon amongst young people aged 16-24, with a reported use of 2.6% in the last year amongst this age group, although this is still three times higher than in older adults. Young men aged 16-24 (3.5%) were more likely to take new psychoactive substances than young women (1.6%) (Home
Chart 3.23: Prevalence of multiple risk behaviour at age 15, by gender, England, 2014
Source: NHS Digital (2015) Health and Wellbeing of 15-Year-Olds in England 2014Findings From What About YOUth Survey DOWNLOAD DATA
No. of risky behaviours
Gender
Total %Boys % Girls %
None 8 4 6
1 38 37 38
2 40 41 41
3 10 12 11
4 2 4 3
5 1 1 1
6 0 0 0
NOTERisky behaviours include: Smoking: Currently smoke;Drinking: Usually have an alcoholic drink once a month or more frequently;Cannabis: Have used cannabis in the last month;Other drugs: Have used drugs other than cannabis in the last month;Diet: Consumed fewer than five portions of fruit and veg yesterday;Physical activity: Not active for 60 minutes or more on seven days in the last week.
Source: Home Office (2016) Drug Misuse: Findings from the 2015/16 Crime Survey for England and Wales.
2.6% of 16-24s took a new psychoactive substance last year
59
CHAPTER 3: Health behaviours and lifestyle
AYPH | Key Data on Young People 2017
Office, 2016). It is important that we continue to watch developments in drugs that are outside the usual substances covered in many existing regular surveys.
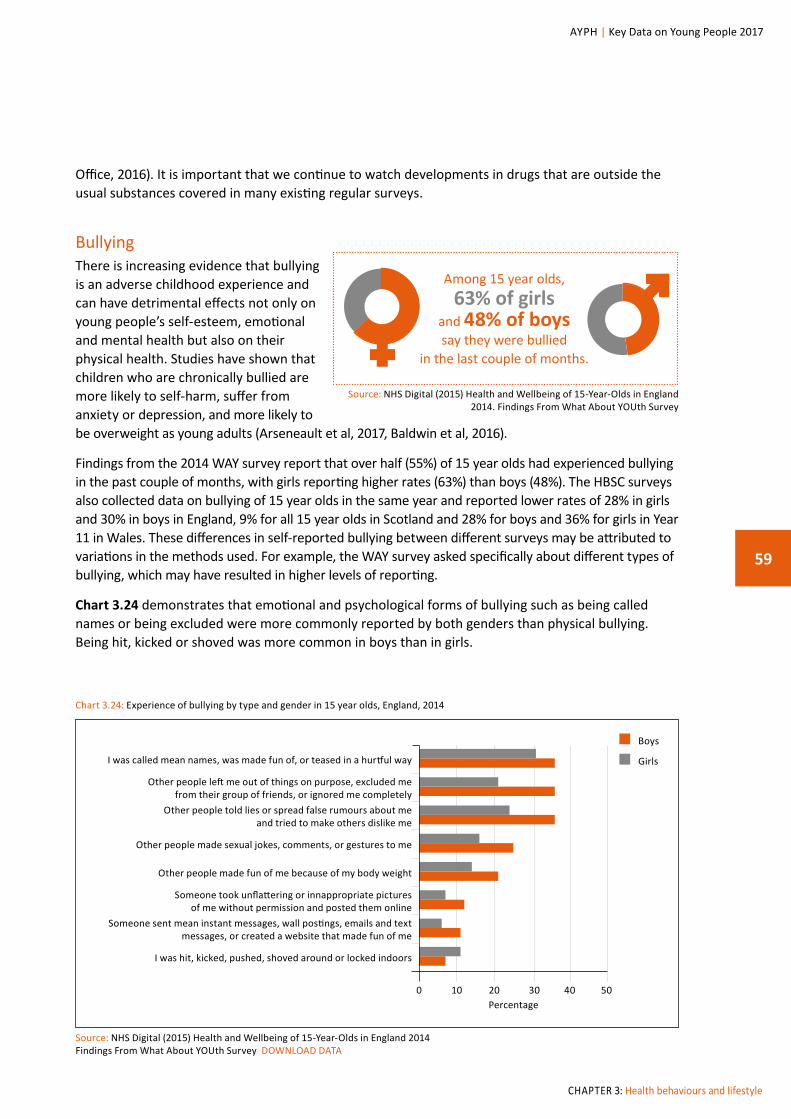
BullyingThere is increasing evidence that bullying is an adverse childhood experience and can have detrimental effects not only on young people’s self-esteem, emotional and mental health but also on their physical health. Studies have shown that children who are chronically bullied are more likely to self-harm, suffer from anxiety or depression, and more likely to be overweight as young adults (Arseneault et al, 2017, Baldwin et al, 2016).
Findings from the 2014 WAY survey report that over half (55%) of 15 year olds had experienced bullying in the past couple of months, with girls reporting higher rates (63%) than boys (48%). The HBSC surveys also collected data on bullying of 15 year olds in the same year and reported lower rates of 28% in girls and 30% in boys in England, 9% for all 15 year olds in Scotland and 28% for boys and 36% for girls in Year 11 in Wales. These differences in self-reported bullying between different surveys may be attributed to variations in the methods used. For example, the WAY survey asked specifically about different types of bullying, which may have resulted in higher levels of reporting.
Chart 3.24 demonstrates that emotional and psychological forms of bullying such as being called names or being excluded were more commonly reported by both genders than physical bullying. Being hit, kicked or shoved was more common in boys than in girls.
Chart 3.24: Experience of bullying by type and gender in 15 year olds, England, 2014
Source: NHS Digital (2015) Health and Wellbeing of 15-Year-Olds in England 2014 Findings From What About YOUth Survey DOWNLOAD DATA
I was hit, kicked, pushed, shoved around or locked indoors
Someone sent mean instant messages, wall postings, emails and text messages, or created a website that made fun of me
Someone took unflattering or innappropriate pictures of me without permission and posted them online
Other people made fun of me because of my body weight
Other people made sexual jokes, comments, or gestures to me
Other people told lies or spread false rumours about me and tried to make others dislike me
Other people left me out of things on purpose, excluded me from their group of friends, or ignored me completely
I was called mean names, was made fun of, or teased in a hurtful way
0 20 30 5010 40Percentage
Boys
Girls
Source: NHS Digital (2015) Health and Wellbeing of 15-Year-Olds in England 2014. Findings From What About YOUth Survey
Among 15 year olds, 63% of girls
and 48% of boys say they were bullied
in the last couple of months.
60
CHAPTER 3: Health behaviours and lifestyle
AYPH | Key Data on Young People 2017
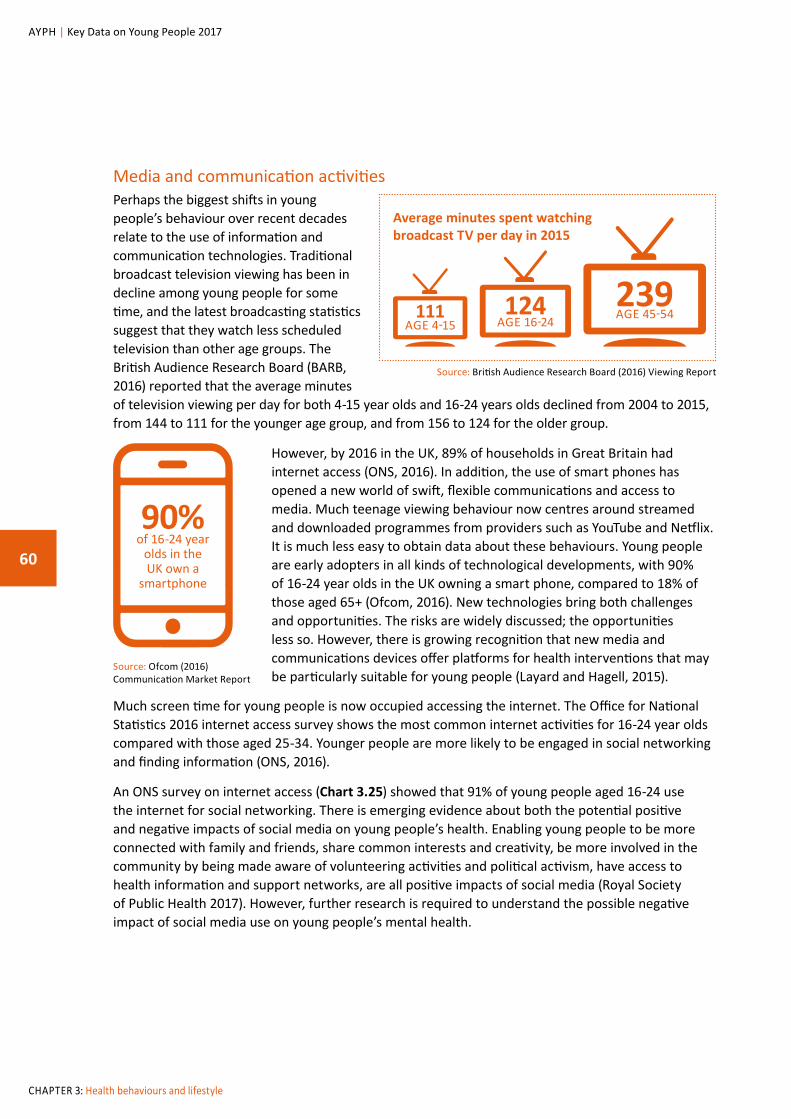
Media and communication activities Perhaps the biggest shifts in young people’s behaviour over recent decades relate to the use of information and communication technologies. Traditional broadcast television viewing has been in decline among young people for some time, and the latest broadcasting statistics suggest that they watch less scheduled television than other age groups. The British Audience Research Board (BARB, 2016) reported that the average minutes of television viewing per day for both 4-15 year olds and 16-24 years olds declined from 2004 to 2015, from 144 to 111 for the younger age group, and from 156 to 124 for the older group.
However, by 2016 in the UK, 89% of households in Great Britain had internet access (ONS, 2016). In addition, the use of smart phones has opened a new world of swift, flexible communications and access to media. Much teenage viewing behaviour now centres around streamed and downloaded programmes from providers such as YouTube and Netflix. It is much less easy to obtain data about these behaviours. Young people are early adopters in all kinds of technological developments, with 90% of 16-24 year olds in the UK owning a smart phone, compared to 18% of those aged 65+ (Ofcom, 2016). New technologies bring both challenges and opportunities. The risks are widely discussed; the opportunities less so. However, there is growing recognition that new media and communications devices offer platforms for health interventions that may be particularly suitable for young people (Layard and Hagell, 2015).
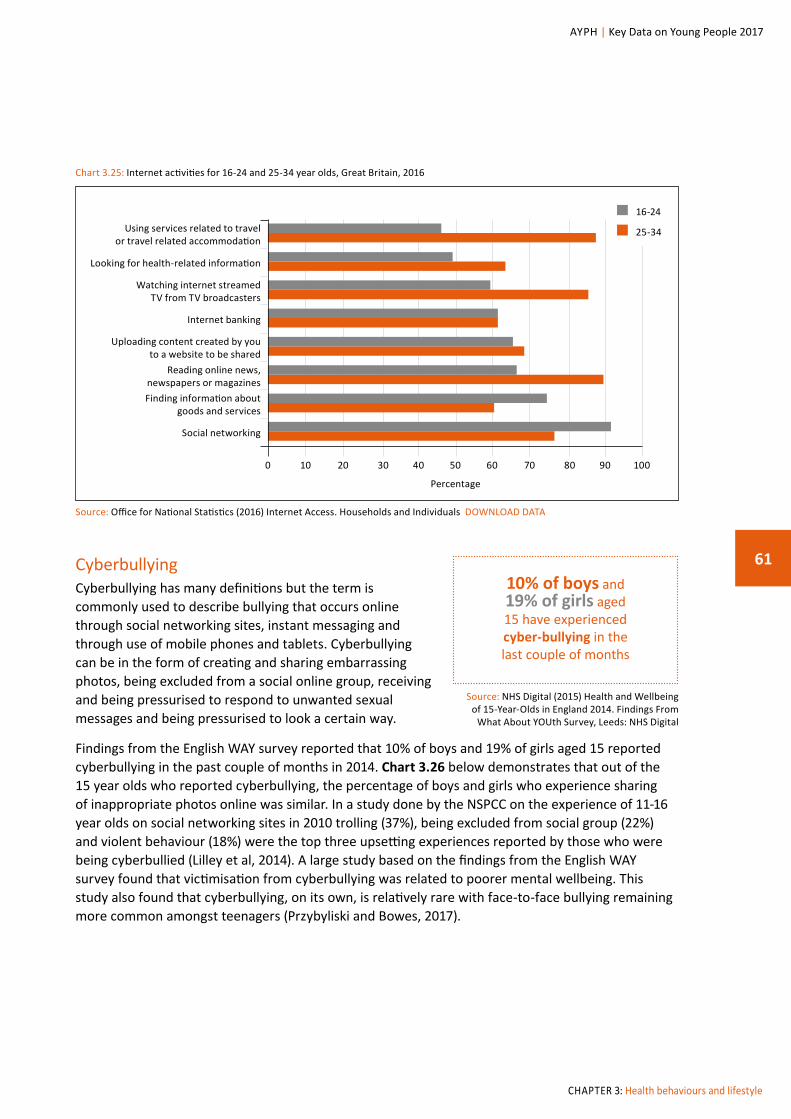
Much screen time for young people is now occupied accessing the internet. The Office for National Statistics 2016 internet access survey shows the most common internet activities for 16-24 year olds compared with those aged 25-34. Younger people are more likely to be engaged in social networking and finding information (ONS, 2016).
An ONS survey on internet access (Chart 3.25) showed that 91% of young people aged 16-24 use the internet for social networking. There is emerging evidence about both the potential positive and negative impacts of social media on young people’s health. Enabling young people to be more connected with family and friends, share common interests and creativity, be more involved in the community by being made aware of volunteering activities and political activism, have access to health information and support networks, are all positive impacts of social media (Royal Society of Public Health 2017). However, further research is required to understand the possible negative impact of social media use on young people’s mental health.
90% of 16-24 year
olds in the UK own a
smartphone
Source: British Audience Research Board (2016) Viewing Report
Average minutes spent watching broadcast TV per day in 2015
Source: Ofcom (2016) Communication Market Report
111 AGE 4-15
124 AGE 16-24
239 AGE 45-54
61
CHAPTER 3: Health behaviours and lifestyle
AYPH | Key Data on Young People 2017
CyberbullyingCyberbullying has many definitions but the term is commonly used to describe bullying that occurs online through social networking sites, instant messaging and through use of mobile phones and tablets. Cyberbullying can be in the form of creating and sharing embarrassing photos, being excluded from a social online group, receiving and being pressurised to respond to unwanted sexual messages and being pressurised to look a certain way.
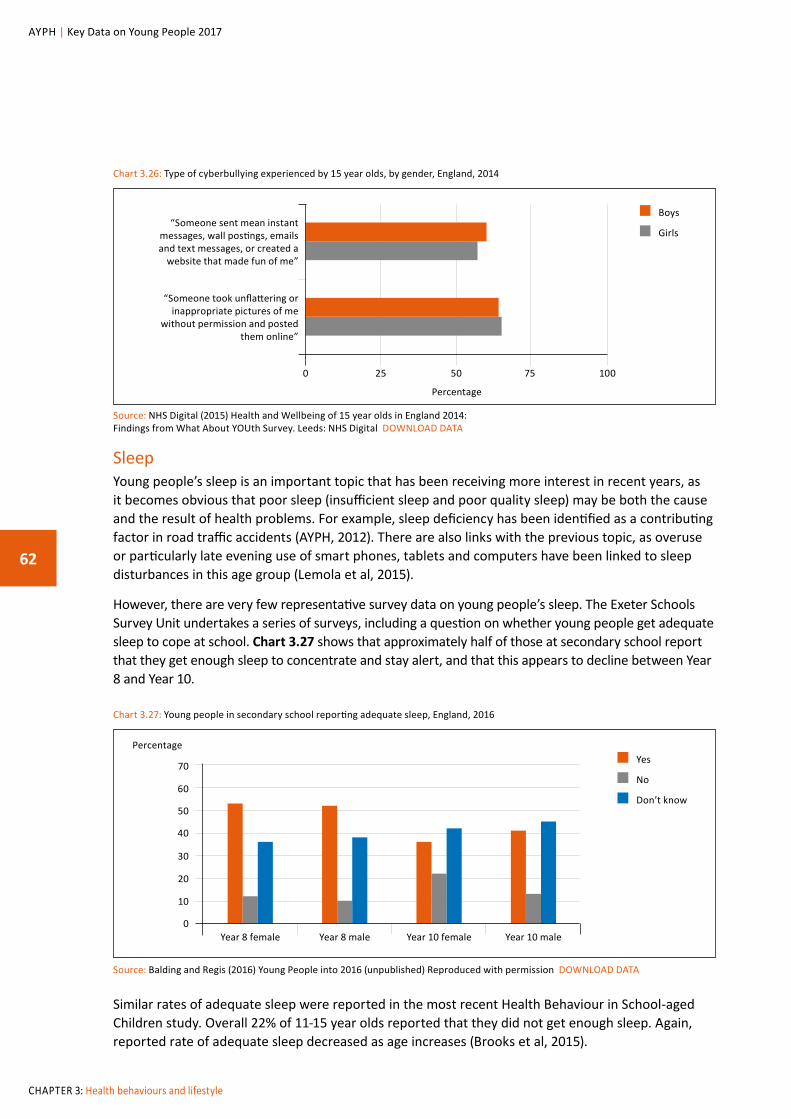
Findings from the English WAY survey reported that 10% of boys and 19% of girls aged 15 reported cyberbullying in the past couple of months in 2014. Chart 3.26 below demonstrates that out of the 15 year olds who reported cyberbullying, the percentage of boys and girls who experience sharing of inappropriate photos online was similar. In a study done by the NSPCC on the experience of 11-16 year olds on social networking sites in 2010 trolling (37%), being excluded from social group (22%) and violent behaviour (18%) were the top three upsetting experiences reported by those who were being cyberbullied (Lilley et al, 2014). A large study based on the findings from the English WAY survey found that victimisation from cyberbullying was related to poorer mental wellbeing. This study also found that cyberbullying, on its own, is relatively rare with face-to-face bullying remaining more common amongst teenagers (Przybyliski and Bowes, 2017).
Chart 3.25: Internet activities for 16-24 and 25-34 year olds, Great Britain, 2016
Source: Office for National Statistics (2016) Internet Access. Households and Individuals DOWNLOAD DATA
Social networking
Finding information about goods and services
Reading online news, newspapers or magazines
Uploading content created by you to a website to be shared
Internet banking
Watching internet streamed TV from TV broadcasters
Looking for health-related information
Using services related to travel or travel related accommodation
0 20 7030 8050 10010 6040 90
Percentage
16-24
25-34
10% of boys and 19% of girls aged 15 have experienced cyber-bullying in the last couple of months
Source: NHS Digital (2015) Health and Wellbeing of 15-Year-Olds in England 2014. Findings From
What About YOUth Survey, Leeds: NHS Digital
62
CHAPTER 3: Health behaviours and lifestyle
AYPH | Key Data on Young People 2017
Chart 3.26: Type of cyberbullying experienced by 15 year olds, by gender, England, 2014
Source: NHS Digital (2015) Health and Wellbeing of 15 year olds in England 2014: Findings from What About YOUth Survey. Leeds: NHS Digital DOWNLOAD DATA
“Someone took unflattering or inappropriate pictures of me
without permission and posted them online”
“Someone sent mean instant messages, wall postings, emails and text messages, or created a
website that made fun of me”
0 25 1007550
Percentage
Boys
Girls
Sleep Young people’s sleep is an important topic that has been receiving more interest in recent years, as it becomes obvious that poor sleep (insufficient sleep and poor quality sleep) may be both the cause and the result of health problems. For example, sleep deficiency has been identified as a contributing factor in road traffic accidents (AYPH, 2012). There are also links with the previous topic, as overuse or particularly late evening use of smart phones, tablets and computers have been linked to sleep disturbances in this age group (Lemola et al, 2015).
However, there are very few representative survey data on young people’s sleep. The Exeter Schools Survey Unit undertakes a series of surveys, including a question on whether young people get adequate sleep to cope at school. Chart 3.27 shows that approximately half of those at secondary school report that they get enough sleep to concentrate and stay alert, and that this appears to decline between Year 8 and Year 10.
Chart 3.27: Young people in secondary school reporting adequate sleep, England, 2016
Source: Balding and Regis (2016) Young People into 2016 (unpublished) Reproduced with permission DOWNLOAD DATA
70
50
60
40
20
30
10
0Year 8 female Year 8 male Year 10 female Year 10 male
Yes
No
Don’t know
Percentage
Similar rates of adequate sleep were reported in the most recent Health Behaviour in School-aged Children study. Overall 22% of 11-15 year olds reported that they did not get enough sleep. Again, reported rate of adequate sleep decreased as age increases (Brooks et al, 2015).
63
CHAPTER 3: Health behaviours and lifestyle
AYPH | Key Data on Young People 2017
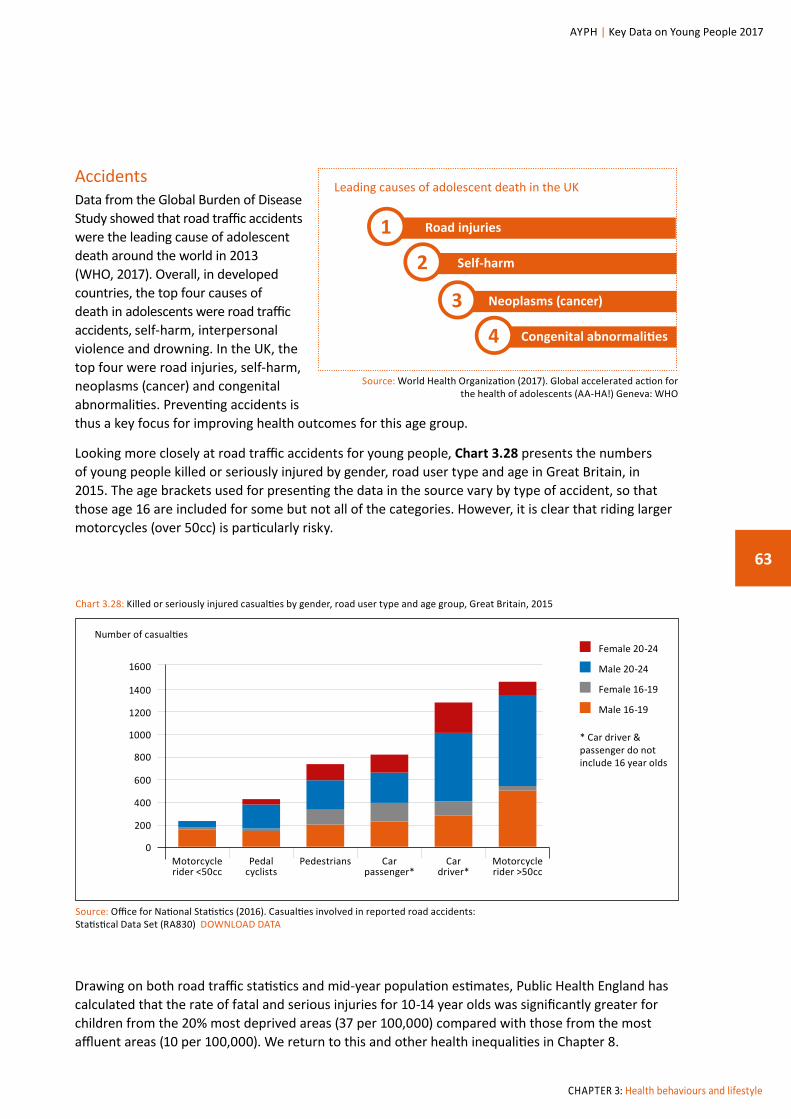
Accidents Data from the Global Burden of Disease Study showed that road traffic accidents were the leading cause of adolescent death around the world in 2013 (WHO, 2017). Overall, in developed countries, the top four causes of death in adolescents were road traffic accidents, self-harm, interpersonal violence and drowning. In the UK, the top four were road injuries, self-harm, neoplasms (cancer) and congenital abnormalities. Preventing accidents is thus a key focus for improving health outcomes for this age group.
Looking more closely at road traffic accidents for young people, Chart 3.28 presents the numbers of young people killed or seriously injured by gender, road user type and age in Great Britain, in 2015. The age brackets used for presenting the data in the source vary by type of accident, so that those age 16 are included for some but not all of the categories. However, it is clear that riding larger motorcycles (over 50cc) is particularly risky.
Leading causes of adolescent death in the UK
Road injuries1Self-harm2
Neoplasms (cancer)3Congenital abnormalities4
Source: World Health Organization (2017). Global accelerated action for the health of adolescents (AA-HA!) Geneva: WHO
Chart 3.28: Killed or seriously injured casualties by gender, road user type and age group, Great Britain, 2015
Source: Office for National Statistics (2016). Casualties involved in reported road accidents: Statistical Data Set (RA830) DOWNLOAD DATA
1400
1600
1000
1200
800
400
600
200
0Motorcycle rider <50cc
Pedal cyclists
Pedestrians Car passenger*
Car driver*
Motorcycle rider >50cc
Female 20-24
Male 20-24
Female 16-19
Male 16-19
Number of casualties
* Car driver & passenger do not include 16 year olds
Drawing on both road traffic statistics and mid-year population estimates, Public Health England has calculated that the rate of fatal and serious injuries for 10-14 year olds was significantly greater for children from the 20% most deprived areas (37 per 100,000) compared with those from the most affluent areas (10 per 100,000). We return to this and other health inequalities in Chapter 8.
64
CHAPTER 3: Health behaviours and lifestyle
AYPH | Key Data on Young People 2017
References Action on Smoking and Health (2016) Use of electronic cigarettes in Great Britain. London: ASH. http://ash.org.uk/information-and-resources/fact-sheets/use-of-electronic-cigarettes-vapourisers-among-children-in-great-britain/
Atkinson A, Sumnall H and Bellis M (2012) Substance use among 15-16 year olds in the UK: Key findings from the 2011 European School Survey Project on Alcohol and Other Drugs (ESPAD). Liverpool: Liverpool John Moores University Centre for Public Health. http://www.cph.org.uk/wp-content/uploads/2012/08/substance-use-among-15-16-year-olds-in-the-uk.pdf
Arseneault L (2017) The long-term impact of bullying victimization on mental health. World Psychiatry, 16(1), pp.27-28.
Association for Young People’s Health (2012) Adolescent Sleep: Summary AYPH Research Update No.10. London: AYPH www.youngpeopleshealth.org.uk/wp-content/uploads/2015/07/Sleep.pdf
BARB (2016) The Viewing Report 2016 London, BARB
Baldwin JR, Arseneault L, Odgers C, Belsky DW, Matthews T, Ambler A, Caspi A, Moffitt TE and Danese A, (2016) Childhood Bullying Victimization and Overweight in Young Adulthood: A Cohort Study. Psychosomatic Medicine, 78(9), 1094-1103.
Brooks F, Magnusson J, Klemera E, Chester K, Spencer N and Smeeton N, (2015) HBSC England national report 2014. Hatfield, UK: BMJ Publishing Group
Currie C, Van der Sluijs W, Whitehead R, Currie D., Rhodes G, Neville F, Inchley J (2015) HBSC 2014 Survey in Scotland National Report. Child and Adolescent Health Research Unit (CAHRU), University of St Andrews
Department of Health (2011a) Start Active, Stay Active: A report on physical activity for health from the four home countries’ Chief Medical Officers. London: Department of Health https://www.gov.uk/government/publications/start-active-stay-active-a-report-on-physical-activity-from-the-four-home-countries-chief-medical-officers
Department of Health (2011b) Physical activity guidelines for children and young people (5-18 years). London: Department of Health https://www.gov.uk/government/publications/uk-physical-activity-guidelines
Department of Health (2016) Public Health Outcomes Framework 2016-2019. London: Department of Health https://www.gov.uk/government/publications/public-health-outcomes-framework-2016-to-2019
Department for Transport (2016): National Travel Survey Statistics – Travel by age and gender England NTS06 https://www.gov.uk/government/uploads/system/uploads/attachment_data/file/551437/national-travel-survey-2015.pdf
Fuller E, Mindell J, Prior G (eds) (2015). Health Survey for England 2015: Health, social care and lifestyles. London: NHS Digital http://digital.nhs.uk/pubs/hse2015
Hagell A and Rigby E (2015) Prevention and early intervention British Journal of School Nursing, 10(1) http://www.magonlinelibrary.com/doi/10.12968/bjsn.2015.10.1.26
Health and Social Care Information Centre (HSCIC) (2015a) Smoking, drinking and drug use among young people in England in 2014. Leeds: HSCIC http://www.hscic.gov.uk/catalogue/PUB17879/smok-drin-drug-youn-peop-eng-2014-rep.pdf
Health and Social Care Information Centre (HSCIC) (2015b) Statistics on Smoking 2015. Leeds: Health and Social Care Information Centre
Health and Social Care Information Centre (HSCIC) (2016) Statistics on Obesity, Physical Activity and Diet. http://content.digital.nhs.uk/catalogue/PUB20562/obes-phys-acti-diet-eng-2016-rep.pdf
Home Office (2016) Drug Misuse: Findings from the 2015/16 Crime Survey for England and Wales. London: Home Office https://www.gov.uk/government/uploads/system/uploads/attachment_data/file/564760/drug-misuse-1516.pdf
Ipsos MORI (2015) Health Behaviour in School Aged children: Key Findings (Wales). Cardiff: Welsh Government http://gov.wales/docs/caecd/research/2015/151022-health-behaviour-school-children-2013-14-key-findings-en.pdf
65
CHAPTER 3: Health behaviours and lifestyle
AYPH | Key Data on Young People 2017
Layard R and Hagell A (2015) Healthy young minds: Transforming the mental health of children. Report of the WISH Mental Health and Wellbeing I Children Forum 2015. Qatar: World Innovation Summit for Health http://wish-qatar.org/summit/2015-summit/reports-en/mental-health-and-wellbeing-in-children-en
Lemola S, Perkinson-Gloor N, Brand S, Dewald-Kaufmann J and Grob A (2015) Adolescents’ electronic media use at night, sleep disturbance, and depressive symptoms in the smartphone age. Journal of Youth and Adolescence, 2 405-418 http://link.springer.com/article/10.1007%2Fs10964-014-0176-x
Lilley C, Ball R and Vernon H (2014) The experiences if 11-16 year olds on social networking sites. London: NSPCC
NHS Digital (2015) Health and wellbeing of 15 year olds in England – Main findings from the What About YOUth? Survey 2014. Leeds: NHS Digital http://content.digital.nhs.uk/article/3742/What-About-Youth-Study
NHS Digital (2016) National Child Measurement Programme England, 2015/16 school year. Leeds: NHS Digital http://content.digital.nhs.uk/catalogue/PUB22269/nati-chil-meas-prog-eng-2015-2016-rep.pdf
NHS Digital (2017) Statistics on Smoking, England 2017 Leeds: NHS Digital https://www.gov.uk/government/statistics/statistics-on-smoking-england-2017
Ofcom (2016) The Communications Market Report 2016 London: Ofcom https://www.ofcom.org.uk/about-ofcom/latest/media/media-releases/2015/cmr-uk-2015
Office for National Statistics (2016) Internet Access Households and Individuals 2016. London: ONS https://www.ons.gov.uk/peoplepopulationandcommunity/householdcharacteristics/homeinternetandsocialmediausage/bulletins/internetaccesshouseholdsandindividuals/2016
Przybyliski A and Bowes L (2017) Cyberbullying and adolescent well-being in England: a population-based cross-sectional study. The Lancet Child & Adolescent Health. Published online 12 July 2017 http://www.sciencedirect.com/science/article/pii/S2352464217300111
Public Health England (2014) Reducing unintentional injuries on the roads among children and young people under 25 years. London: PHE https://www.gov.uk/government/publications/reducing-unintentional-injuries-among-children-and-young-people
Public Health England (2016), Food standards Agency National Diet and Nutrition Survey Results from Years 5 and 6 (combined) of the Rolling Programme (2012/2013 – 2013/2014) London: PHE https://www.gov.uk/government/uploads/system/uploads/attachment_data/file/551352/NDNS_Y5_6_UK_Main_Text.pdf
Public Health England (2017) Annual Business Plan 2017-18 London: PHE https://www.gov.uk/government/uploads/system/uploads/attachment_data/file/610181/PHE_business_plan_2017_to_2018.pdf
Royal Society of Public Health (2017) #StatusofMind Social media and young people’s mental health and wellbeing https://www.rsph.org.uk/our-work/policy/social-media-and-young-people-s-mental-health-and-wellbeing.html
Scottish Government (2012) Scottish Health Survey: Topic report: Obesity http://www.gov.scot/Publications/2011/10/1138/14#figtwofour
Scottish Government (2016) Scottish Health Survey 2015, Vol 1: Main report. Edinburgh, Scottish Government http://www.gov.scot/Publications/2016/09/2764/downloads
Viner R, Kinra S, Nicholls D et al (2017) Burden of child and adolescent obesity on health services in England Arch Dis Child, on-line advance
Welsh Government (2012) Tobacco and health in Wales. Cardiff: Welsh Government. http://www.wales.nhs.uk/sitesplus/922/page/59800
World Health Organisation (2011) Global recommendations on physical activity for health, 5-17 year olds. Downloaded from http://www.who.int/dietphysicalactivity/physical-activity-recommendations-5-17years.pdf 29 May 2013
World Health Organization, 2017. Global accelerated action for the health of adolescents (AA-HA!): guidance to support country implementation. Geneva: WHO http://www.who.int/maternal_child_adolescent/topics/adolescence/framework-accelerated-action/en/