Embed Size (px)
Citation preview

Chapter 3: Graphs and Functions ISM: MyMathLab Algebra I
112
Section 3.3
Practice Exercises
1. The graph crosses the x-axis at the point (−4, 0). The x-intercept is (−4, 0). The graph crosses the y-axis at the point (0, −6). The y-intercept is (0, −6).
2. The graph crosses the x-axis at the point (−1, 0) and at the point (−0.5, 0). The x-intercepts are (−1, 0) and (−0.5, 0). The graph crosses the y-axis at the point (0, 1). The y-intercept is (0, 1).
3. The graph crosses both the x-axis and the y-axis at the point (0, 0). The x-intercept is (0, 0), and the y-intercept is (0, 0).
4. The graph does not cross the x-axis. There is no x-intercept. The graph crosses the y-axis at the point (0, 3). The y-intercept is (0, 3).
5. The graph crosses the x-axis at the point (−1, 0) and at the point (5, 0). The x-intercepts are (−1, 0) and (5, 0). The graph crosses the y-axis at the point (0, −2) and at the point (0, 2). The y-intercepts are (0, −2) and (0, 2).
6. Let y = 0. Let x = 0. 2 4
2(0) 40 4
4
x yx
xx
+ = −+ = −
+ = −= −
2 40 2 4
2 42
x yyyy
+ = −+ = −
= −= −
The x-intercept is (−4, 0), and the y-intercept is (0, −2). Let x = 2.
2 42 2 4
2 63
x yyyy
+ = −+ = −
= −= −
x y
−4 0
0 −2
2 −3
y
x
(0, –2) (2, –3)
(–4, 0)
x + 2y = –4
7. Let y = 0. Let x = 0. 33(0)0
x yxx
===
30 30
x yy
y
===
Both the x-intercept and the y-intercept are (0, 0). Let y = −1 Let y = 1. x = 3(−1) x = 3(1) x = −3 x = 3
x y
0 0
3 1
−3 −1
y
x(0, 0)
(3, 1)
(–3, –1)
x = 3y
8. Let y = 0. Let x = 0. 3 2 43 2(0) 43 4
4
3
x yxx
x
= += +=
=
3 2 43(0) 2 4
4 22
x yyy
y
= += +
− =− =
Let x = 2.
3 2 43(2) 2 4
6 2 42 21
x yyyy
y
= += += +==

ISM: MyMathLab Algebra I Chapter 3: Graphs and Functions
113
x y
0 −2
43
0
2 1
y
x(2, 1)
(0, –2)
3x = 2y + 4
43
0,⎛⎝⎜
⎞⎠⎟
9. For any x-value chosen, notice that y is 2.
x y
−5 2
0 2
5 2
y
x
(5, 2)(0, 2)
y = 2
(–5, 2)
10. For any y-value chosen, notice that x is −2.
x y
−2 −4
−2 0
−2 4
y
x
x = –2
(–2, 4)
(–2, 0)
(–2, –4)
Calculator Explorations
1. 3.78
3.78
x yx
y
=
=
–10
–10
10
10
2. 2.61
2.61
y xx
y
− =
=−
10
10
–10
–10
3. 3 7 217 3 21
33
7
x yy x
y x
+ == − +
= − +
10
10
–10
–10
4. 4 6 126 4 12
22
3
x yy x
y x
− + == +
= +
10
10
–10
–10
5. 2.2 6.8 15.56.8 2.2 15.5
2.2 15.5
6.8 6.8
x yy x
y x
− + == +
= +
10
10–10
–10
Chapter 3: Graphs and Functions ISM: MyMathLab Algebra I
114
6. 5.9 0.8 10.40.8 5.9 10.4
5.9 10.4
0.8 0.8
x yy x
y x
− = −− = − −
= +
10
10–10
–10
Vocabulary and Readiness Check
1. An equation that can be written in the form Ax + By = C is called a linear equation in two variables.
2. The form Ax + By = C is called standard form.
3. The graph of the equation y = −1 is a horizontal line.
4. The graph of the equation x = 5 is a vertical line.
5. A point where a graph crosses the y-axis is called a y-intercept.
6. A point where a graph crosses the x-axis is called a x-intercept.
7. Given an equation of a line, to find the x-intercept (if there is one), let y = 0 and solve for x.
8. Given an equation of a line, to find the y-intercept (if there is one), let x = 0 and solve for y.
9. False; for example, the horizontal line y = 2 does not have an x-intercept.
10. True
11. True
12. False; the graph of y = 5x contains the point (1, 5) but not the point (5, 1).
Exercise Set 3.3
2. x-intercept: (−4, 0) y-intercept: (0, 3)
4. x-intercepts: (−3, 0), (3, 0) y-intercept: (0, 5)
6. x-intercepts: (−4, 0), (−1, 0), (1, 0) y-intercept: (0, 4)
8. x-intercepts: (−3, 0), (3, 0) y-intercepts: (0, 2), (0, −2)
10. 1; because the line must either cross the x-axis or the y-axis.
12. 4; because the circle could cross each axis two times.
14. x − y = −4 y = 0, x − 0 = −4, x = −4 x = 0, 0 − y = −4, y = 4 x-intercept: (−4, 0); y-intercept: (0, 4)
x y
−4 0
0 4
y
x
x – y = –4
(–4, 0)
(0, 4)
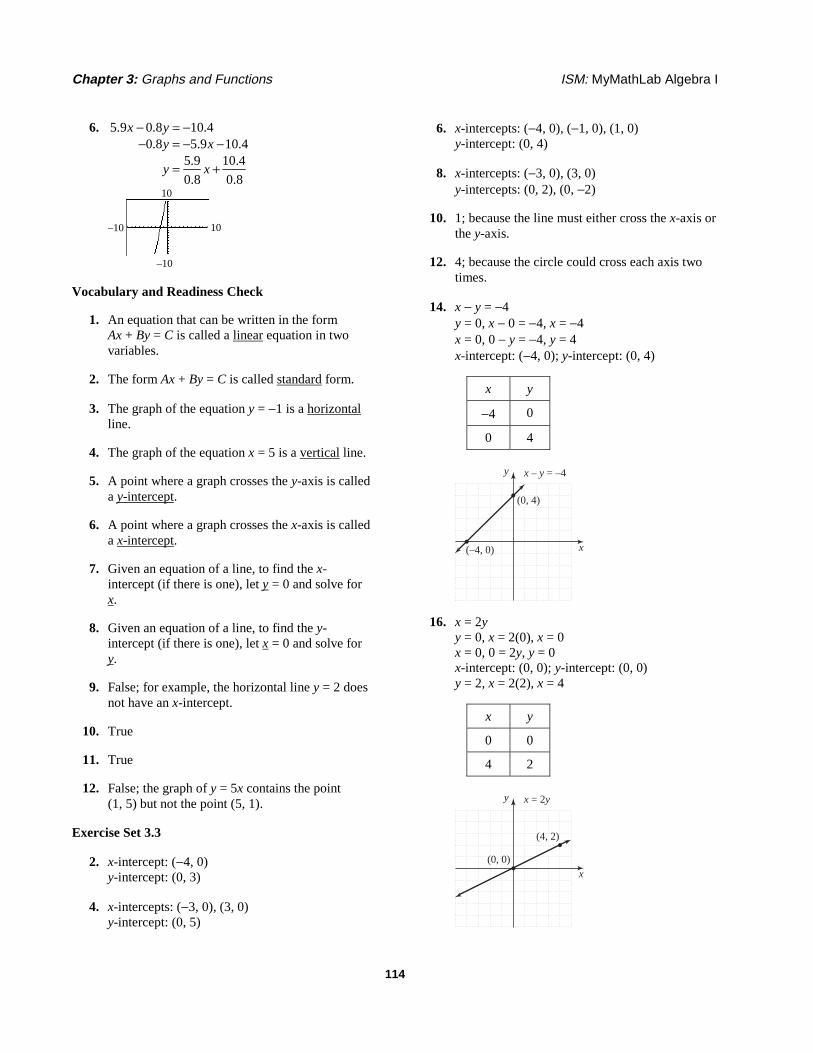
16. x = 2y y = 0, x = 2(0), x = 0 x = 0, 0 = 2y, y = 0 x-intercept: (0, 0); y-intercept: (0, 0) y = 2, x = 2(2), x = 4
x y
0 0
4 2
y
x
x = 2y
(0, 0)
(4, 2)
ISM: MyMathLab Algebra I Chapter 3: Graphs and Functions
115
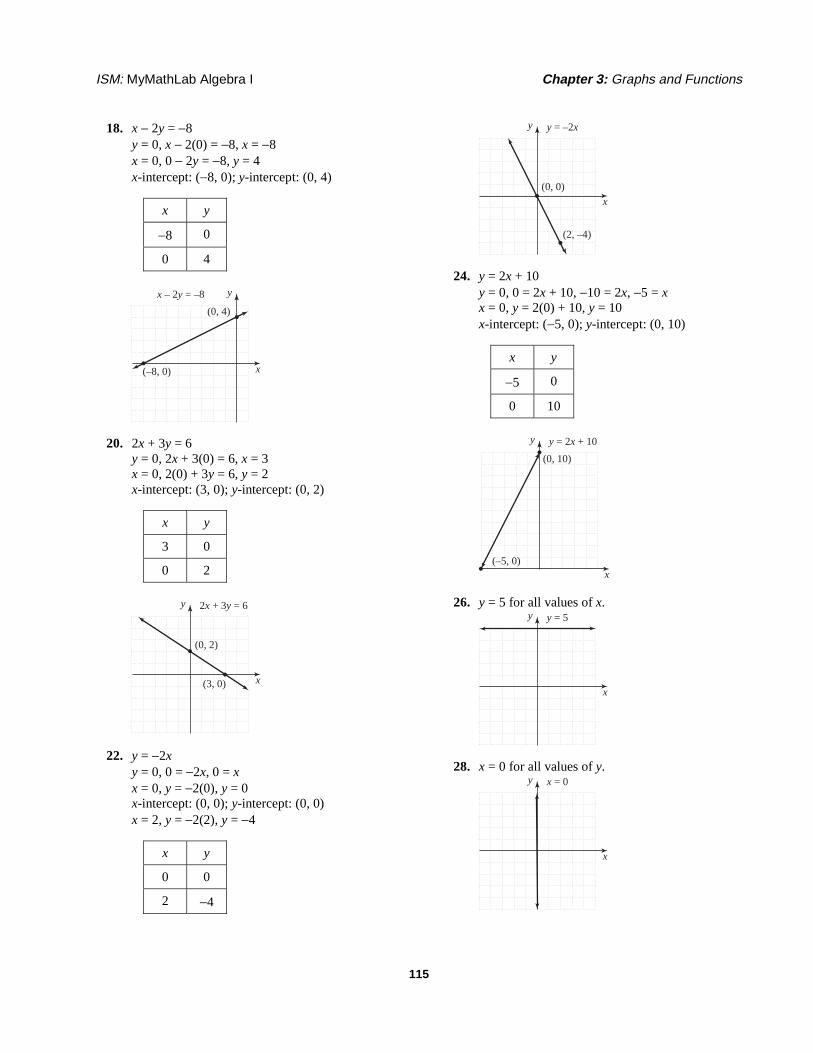
18. x − 2y = −8 y = 0, x − 2(0) = −8, x = −8 x = 0, 0 − 2y = −8, y = 4 x-intercept: (−8, 0); y-intercept: (0, 4)
x y
−8 0
0 4
y
x
x – 2y = –8
(–8, 0)
(0, 4)
20. 2x + 3y = 6 y = 0, 2x + 3(0) = 6, x = 3 x = 0, 2(0) + 3y = 6, y = 2 x-intercept: (3, 0); y-intercept: (0, 2)
x y
3 0
0 2
y
x
2x + 3y = 6
(3, 0)
(0, 2)
22. y = −2x y = 0, 0 = −2x, 0 = x x = 0, y = −2(0), y = 0 x-intercept: (0, 0); y-intercept: (0, 0) x = 2, y = −2(2), y = −4
x y
0 0
2 −4
y
x
y = –2x
(0, 0)
(2, –4)
24. y = 2x + 10 y = 0, 0 = 2x + 10, −10 = 2x, −5 = x x = 0, y = 2(0) + 10, y = 10 x-intercept: (−5, 0); y-intercept: (0, 10)
x y
−5 0
0 10
y
x
y = 2x + 10(0, 10)
(–5, 0)
26. y = 5 for all values of x. y
x
y = 5
28. x = 0 for all values of y. y
x
x = 0
Chapter 3: Graphs and Functions ISM: MyMathLab Algebra I
116
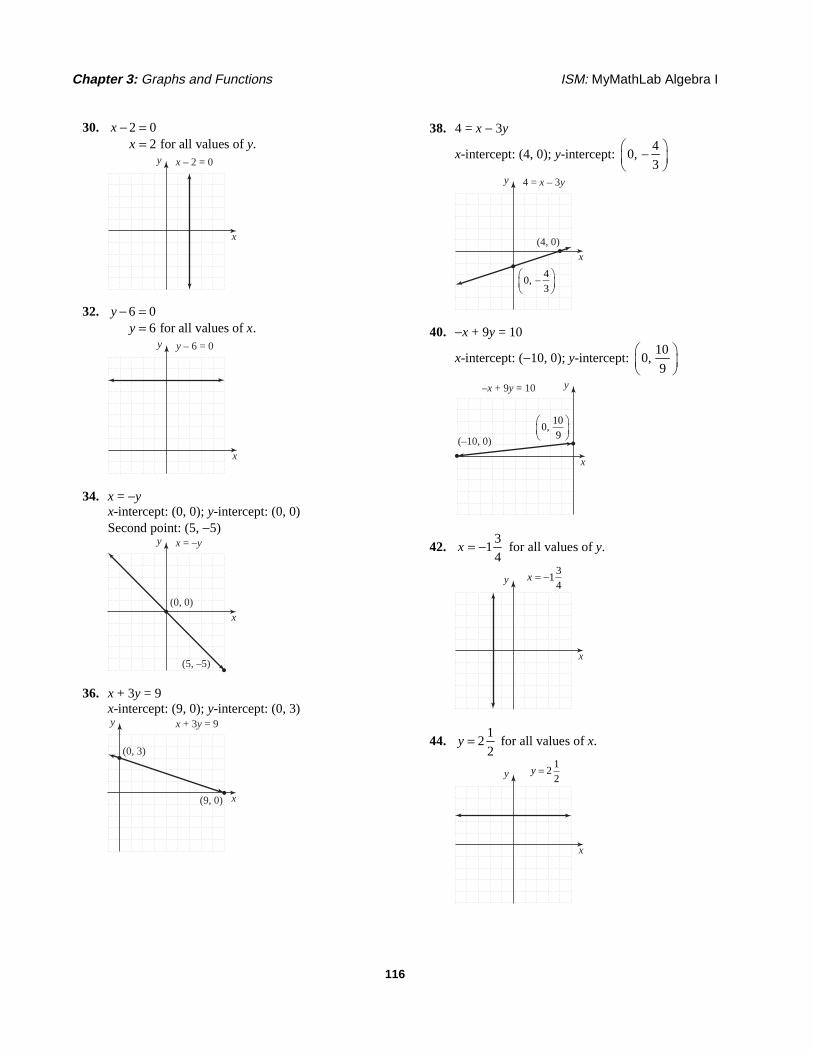
30. 2 02 for all values of .
xx y
− ==
y
x
x – 2 = 0
32. 6 06 for all values of .
yy x
− ==
y
x
y – 6 = 0
34. x = −y x-intercept: (0, 0); y-intercept: (0, 0) Second point: (5, −5)
y
x
x = –y
(0, 0)
(5, –5)
36. x + 3y = 9 x-intercept: (9, 0); y-intercept: (0, 3) y
x
x + 3y = 9
(0, 3)
(9, 0)
38. 4 = x − 3y
x-intercept: (4, 0); y-intercept: 4
0,3
⎛ ⎞−⎜ ⎟⎝ ⎠
y
x
4 = x – 3y
(4, 0)
0 43
, −⎛⎝⎜
⎞⎠⎟
40. −x + 9y = 10
x-intercept: (−10, 0); y-intercept: 10
0,9
⎛ ⎞⎜ ⎟⎝ ⎠
y
x
–x + 9y = 10
(–10, 0)0 10
9,⎛
⎝⎜
⎞⎠⎟
42. 3
14
x = − for all values of y.
y
x
x = −1 34
44. 1
22
y = for all values of x.
y
x
y = 2 12

ISM: MyMathLab Algebra I Chapter 3: Graphs and Functions
117
46. 3
35
y x= − +
x-intercept: (5, 0); y-intercept: (0, 3)
48. 9x − 6y + 3 = 0
x-intercept: 1
, 0 ;3
⎛ ⎞−⎜ ⎟⎝ ⎠
y-intercept: 1
0,2
⎛ ⎞⎜ ⎟⎝ ⎠
y
x
−⎛⎝⎜
⎞⎠⎟
13
0, 0 12
,⎛⎝⎜
⎞⎠⎟
9x – 6y + 3 = 0
50. y = 2x + 2 The y-intercept is (0, 2). F
52. x = 3 This is a vertical line with an x-intercept of (0, 3). A
54. y = −2x The x-intercept is (0, 0) and the y-intercept is (0, 0). D
56. 4 5 1
11 0 1
− −= =− − −
58. 12 3 9
910 9 1
− = =−
60. 2 2 0
03 5 2
− = =− −
62. y = −78.1x + 491.8
a. Let x = 0 and solve for y. y = −78.1(0) + 491.8 = 491.8 The y-intercept is (0, 491.8).
b. In 2000, the average price of a digital camera was $491.80.
64. y = 0.2x + 5.42
a. y = 0 0 0.2 5.42
5.42 0.227.1
xx
x
= +− =− =
The x-intercept is (−27.1, 0).
b. 27 years before 2000, admission to movie theaters was free.
c. Answers may vary
66. Parallel to x = 5 is vertical. x-intercept is (1, 0), so x = 1 for all values of y. x = 1
y
x
x = 1
68. Answers may vary
70. Answers may vary
Section 3.4
Practice Exercises
1. If we let 1 1( , )x y be (−4, 11), then 1 4x = − and
1 11.y = Also, let 2 2( , )x y be (2, 5) so that
2 2x = and 2 5.y =
2 1
2 1
5 11 61
2 ( 4) 6
y ym
x x
− − −= = = = −− − −
The slope of the line is −1.
2. Let 1 1( , )x y be (3, 1) and 2 2( , )x y be (−3, −1).
2 1
2 1
1 1 2 1
3 3 6 3
y ym
x x
− − − −= = = =− − − −
Chapter 3: Graphs and Functions ISM: MyMathLab Algebra I
118
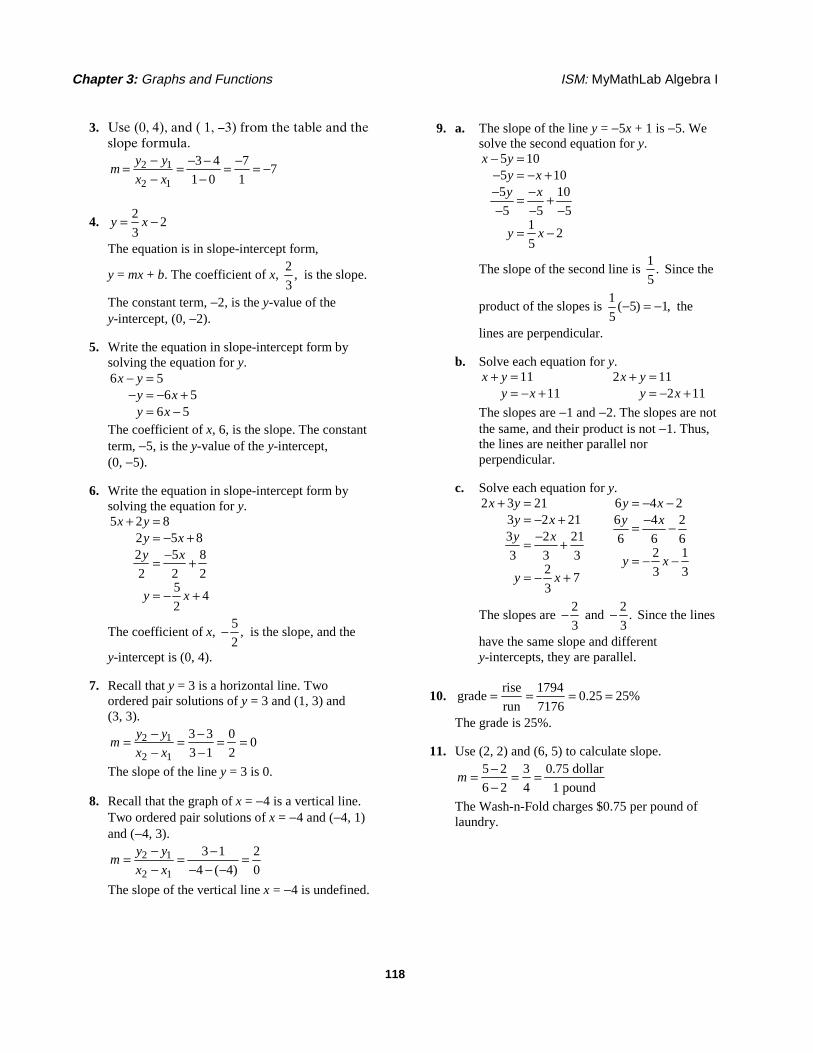
3. Use (0, 4), and ( 1, ---3) from the table and the slope formula.
2 1
2 1
3 4 77
1 0 1
y ym
x x
− − − −= = = = −− −
4. 2
23
y x= −
The equation is in slope-intercept form,
y = mx + b. The coefficient of x, 2
,3
is the slope.
The constant term, −2, is the y-value of the y-intercept, (0, −2).
5. Write the equation in slope-intercept form by solving the equation for y. 6 5
6 56 5
x yy xy x
− =− = − +
= −
The coefficient of x, 6, is the slope. The constant term, −5, is the y-value of the y-intercept, (0, −5).
6. Write the equation in slope-intercept form by solving the equation for y. 5 2 8
2 5 82 5 8
2 2 25
42
x yy xy x
y x
+ == − +
−= +
= − +
The coefficient of x, 5
,2
− is the slope, and the
y-intercept is (0, 4).
7. Recall that y = 3 is a horizontal line. Two ordered pair solutions of y = 3 and (1, 3) and (3, 3).
2 1
2 1
3 3 00
3 1 2
y ym
x x
− −= = = =− −
The slope of the line y = 3 is 0.
8. Recall that the graph of x = −4 is a vertical line. Two ordered pair solutions of x = −4 and (−4, 1) and (−4, 3).
2 1
2 1
3 1 2
4 ( 4) 0
y ym
x x
− −= = =− − − −
The slope of the vertical line x = −4 is undefined.
9. a. The slope of the line y = −5x + 1 is −5. We solve the second equation for y.
5 105 105 10
5 5 51
25
x yy xy x
y x
− =− = − +− −= +− − −
= −
The slope of the second line is 1
.5
Since the
product of the slopes is 1
( 5) 1,5
− = − the
lines are perpendicular.
b. Solve each equation for y. 11
11x y
y x+ =
= − + 2 11
2 11x y
y x+ =
= − +
The slopes are −1 and −2. The slopes are not the same, and their product is not −1. Thus, the lines are neither parallel nor perpendicular.
c. Solve each equation for y. 2 3 21
3 2 213 2 21
3 3 32
73
x yy xy x
y x
+ == − +
−= +
= − +
6 4 26 4 2
6 6 62 1
3 3
y xy x
y x
= − −−= −
= − −
The slopes are 2
3− and
2.
3− Since the lines
have the same slope and different y-intercepts, they are parallel.
10. rise 1794
grade 0.25 25%run 7176
= = = =
The grade is 25%.
11. Use (2, 2) and (6, 5) to calculate slope. 5 2 3 0.75 dollar
6 2 4 1 poundm
−= = =−
The Wash-n-Fold charges $0.75 per pound of laundry.

ISM: MyMathLab Algebra I Chapter 3: Graphs and Functions
119
Calculator Explorations
1. 1
2
3
3.83.8 33.8 9
y xy xy x
== −= +
–10 10
10
–10 All three lines appear to have the same positive slope. The graph of y = 3.8x – 3 is the graph of y = 3.8x moved 3 units downward. The graph of y = 3.8x + 9 is the graph of y = 3.8x moved 9 units upward.
2. 1
2
3
4.94.9 14.9 8
y xy xy x
= −= − += − +
10
10
–10
–10
All three lines appear to have the same negative slope. The graph of y = –4.9x + 1 is the graph of y = –4.9x moved 1 unit upward. The graph of y = –4.9x + 8 is the graph of y = –4.9x moved 8 units upward.
3. 1
2
3
1
41
541
84
y x
y x
y x
=
= +
= −
10
10–10
–10 All three lines appear to have the same positive
slope. The graph of 1
54
y x= + is the graph of
1
4y x= moved 5 units upward. The graph of
18
4y x= − is the graph of
1
4y x= moved 8
units downward.
4. 1
2
3
3
43
543
64
y x
y x
y x
= −
= − −
= − +
10
10–10
–10 All three lines appear to have the same negative
slope. The graph of 3
54
y x= − − is the graph of
3
4y x= − moved 5 units downward. The graph
of 3
64
y x= − + is the graph of 3
4y x= −
moved 6 units upward.
Vocabulary and Readiness Check
1. The measure of the steepness or tilt of a line is called slope.
2. If an equation is written in the form y = mx + b, the value of the letter m is the value of the slope of the graph.
3. The slope of a horizontal line is 0.
4. The slope of a vertical line is undefined.
5. If the graph of a line moves upward from left to right, the line has positive slope.
6. If the graph of a line moves downward from left to right, the line has negative slope.
7. Given two points of a line, change in
slope .change in
y
x=
8. The line goes down. The slope is negative.
9. The line goes up. The slope is positive.
10. The line is vertical. The slope is undefined.
11. The line is horizontal. The slope is 0.
12. The slope is positive. The line is “upward.”
13. The slope is negative. The line is “downward.”
Chapter 3: Graphs and Functions ISM: MyMathLab Algebra I
120
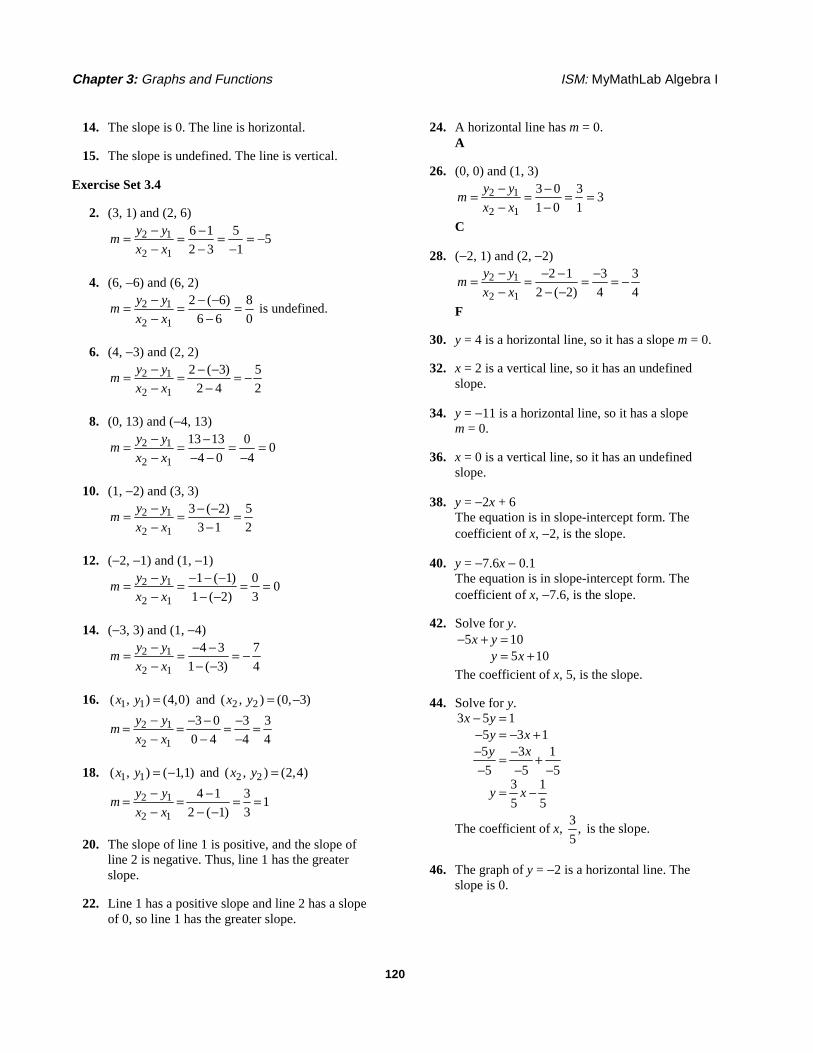
14. The slope is 0. The line is horizontal.
15. The slope is undefined. The line is vertical.
Exercise Set 3.4
2. (3, 1) and (2, 6)
2 1
2 1
6 1 55
2 3 1
y ym
x x
− −= = = = −− − −
4. (6, −6) and (6, 2)
2 1
2 1
2 ( 6) 8is undefined.
6 6 0
y ym
x x
− − −= = =− −
6. (4, −3) and (2, 2)
2 1
2 1
2 ( 3) 5
2 4 2
y ym
x x
− − −= = = −− −
8. (0, 13) and (−4, 13)
2 1
2 1
13 13 00
4 0 4
y ym
x x
− −= = = =− − − −
10. (1, −2) and (3, 3)
2 1
2 1
3 ( 2) 5
3 1 2
y ym
x x
− − −= = =− −
12. (−2, −1) and (1, −1)
2 1
2 1
1 ( 1) 00
1 ( 2) 3
y ym
x x
− − − −= = = =− − −
14. (−3, 3) and (1, −4)
2 1
2 1
4 3 7
1 ( 3) 4
y ym
x x
− − −= = = −− − −
16. 1 1( , ) (4,0)x y = and 2 2( , ) (0, 3)x y = −
2 1
2 1
3 0 3 3
0 4 4 4
y ym
x x
− − − −= = = =− − −
18. 1 1( , ) ( 1,1)x y = − and 2 2( , ) (2,4)x y =
2 1
2 1
4 1 31
2 ( 1) 3
y ym
x x
− −= = = =− − −
20. The slope of line 1 is positive, and the slope of line 2 is negative. Thus, line 1 has the greater slope.
22. Line 1 has a positive slope and line 2 has a slope of 0, so line 1 has the greater slope.
24. A horizontal line has m = 0. A
26. (0, 0) and (1, 3)
2 1
2 1
3 0 33
1 0 1
y ym
x x
− −= = = =− −
C
28. (−2, 1) and (2, −2)
2 1
2 1
2 1 3 3
2 ( 2) 4 4
y ym
x x
− − − −= = = = −− − −
F
30. y = 4 is a horizontal line, so it has a slope m = 0.
32. x = 2 is a vertical line, so it has an undefined slope.
34. y = −11 is a horizontal line, so it has a slope m = 0.
36. x = 0 is a vertical line, so it has an undefined slope.
38. y = −2x + 6 The equation is in slope-intercept form. The coefficient of x, −2, is the slope.
40. y = −7.6x − 0.1 The equation is in slope-intercept form. The coefficient of x, −7.6, is the slope.
42. Solve for y. 5 10
5 10x y
y x− + =
= +
The coefficient of x, 5, is the slope.
44. Solve for y. 3 5 1
5 3 15 3 1
5 5 53 1
5 5
x yy xy x
y x
− =− = − +− −= +− − −
= −
The coefficient of x, 3
,5
is the slope.
46. The graph of y = −2 is a horizontal line. The slope is 0.
ISM: MyMathLab Algebra I Chapter 3: Graphs and Functions
121
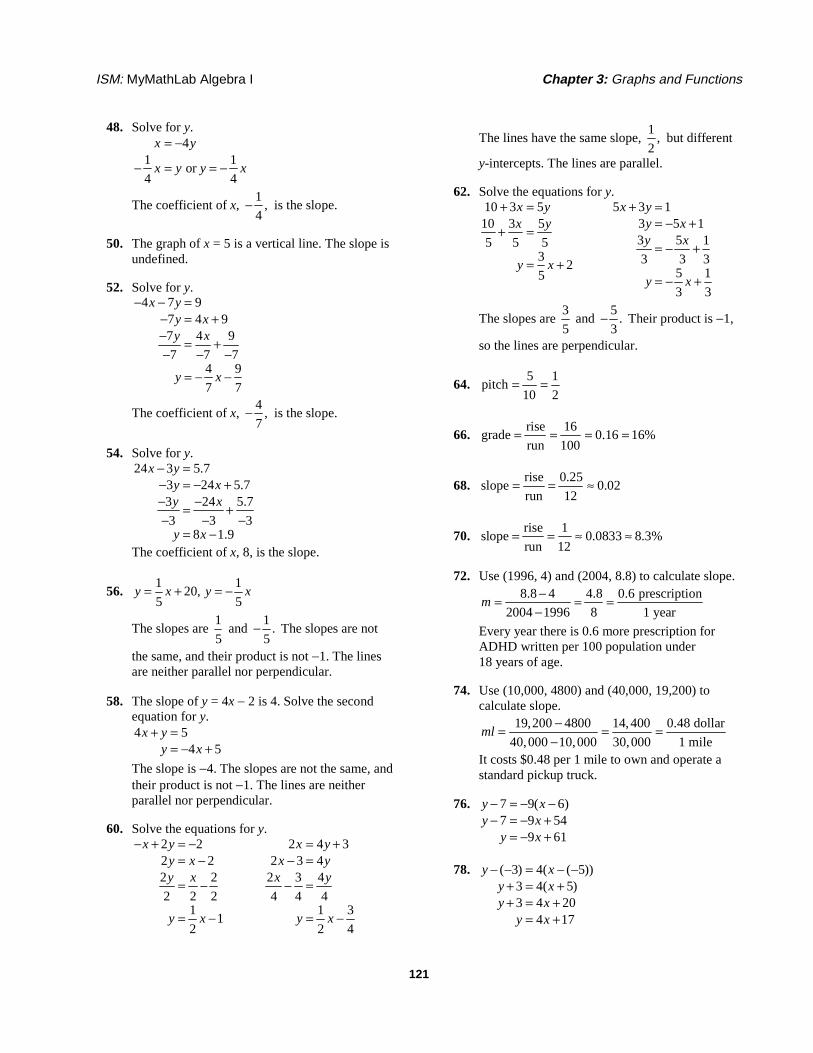
48. Solve for y. 4
1 1 or
4 4
x y
x y y x
= −
− = = −
The coefficient of x, 1
,4
− is the slope.
50. The graph of x = 5 is a vertical line. The slope is undefined.
52. Solve for y. 4 7 9
7 4 97 4 9
7 7 74 9
7 7
x yy xy x
y x
− − =− = +− = +− − −
= − −
The coefficient of x, 4
,7
− is the slope.
54. Solve for y. 24 3 5.7
3 24 5.73 24 5.7
3 3 38 1.9
x yy xy x
y x
− =− = − +− −= +− − −
= −
The coefficient of x, 8, is the slope.
56. 1 1
20,5 5
y x y x= + = −
The slopes are 1
5 and
1.
5− The slopes are not
the same, and their product is not −1. The lines are neither parallel nor perpendicular.
58. The slope of y = 4x − 2 is 4. Solve the second equation for y. 4 5
4 5x y
y x+ =
= − +
The slope is −4. The slopes are not the same, and their product is not −1. The lines are neither parallel nor perpendicular.
60. Solve the equations for y. 2 22 22 2
2 2 21
12
x yy xy x
y x
− + = −= −
= −
= −
2 4 32 3 4
2 3 4
4 4 41 3
2 4
x yx y
x y
y x
= +− =
− =
= −
The lines have the same slope, 1
,2
but different
y-intercepts. The lines are parallel.
62. Solve the equations for y. 10 3 510 3 5
5 5 53
25
x yx y
y x
+ =
+ =
= +
5 3 13 5 13 5 1
3 3 35 1
3 3
x yy xy x
y x
+ == − +
= − +
= − +
The slopes are 3
5 and
5.
3− Their product is −1,
so the lines are perpendicular.
64. 5 1
pitch10 2
= =
66. rise 16
grade 0.16 16%run 100
= = = =
68. rise 0.25
slope 0.02run 12
= = ≈
70. rise 1
slope 0.0833 8.3%run 12
= = ≈ ≈
72. Use (1996, 4) and (2004, 8.8) to calculate slope. 8.8 4 4.8 0.6 prescription
2004 1996 8 1 yearm
−= = =−
Every year there is 0.6 more prescription for ADHD written per 100 population under 18 years of age.
74. Use (10,000, 4800) and (40,000, 19,200) to calculate slope.
19,200 4800 14,400 0.48 dollar
40,000 10,000 30,000 1 mileml
−= = =−
It costs $0.48 per 1 mile to own and operate a standard pickup truck.
76. 7 9( 6)7 9 54
9 61
y xy x
y x
− = − −− = − +
= − +
78. ( 3) 4( ( 5))3 4( 5)3 4 20
4 17
y xy xy x
y x
− − = − −+ = ++ = +
= +
Chapter 3: Graphs and Functions ISM: MyMathLab Algebra I
122
80. (6, −2) and (1, 4)
2 1
2 1
4 ( 2) 6 6
1 6 5 5
y ym
x x
− − −= = = = −− − −
a. 6
5m = −
b. 5
6m =
82. (6, −1) and (−4, −10)
2 1
2 1
10 ( 1) 9 9
4 6 10 10
y ym
x x
− − − − −= = = =− − − −
a. 9
10m =
b. 10
9m = −
84. No; answers may vary
86. Answers may vary
88. In 2003, the average fuel economy was approximately 29.0 miles per gallon. In 2004, it was approximately 28.7 miles per gallon. The change was 28.7 − 29.0 or −0.3 mile per gallon. This is a decrease of 0.3 mile per gallon.
90. The highest point on the graph corresponds to the year 2003. The average fuel economy was approximately 29.0 miles per gallon.
92. The line segments from 1996 to 1997 and from 1997 to 1998 appear to have the same slope and are less steep than any other segment with positive slope.
94.
2
risepitch
run2 4
5
2 202
20 feet
x
x
x
=
=
⎛ ⎞ =⎜ ⎟⎝ ⎠
=
96. a. (2006, 15,722) and (2002, 14,774)
b. 2 1
2 114,774 15,722
2002 2006948
4237
y ym
x x
−=−
−=−
−=−
=
c. For the years 2002 through 2006, the number of kidney transplants increased at a rate of 237 per year.
98. (1, 3), (2, 1), (−4, 0) and (−3, −2)
1 21 3 1 ( 2) 3
2,2 1 2 ( 3) 5
m m− − −= = − = =− − −
3 42 0 3 0 3
2,3 ( 4) 1 ( 4) 5
m m− − −= = − = =
− − − − −
1 3m m= and 2 4 ,m m= so the opposite sides are
parallel. Therefore the quadrilateral is a parallelogram.
100. (−3.8, 1.2) and (−2.2, 4.5) 4.5 1.2 3.3
2.06252.2 ( 3.8) 1.6
m−= = =
− − −
102. (14.3, −10.1) and (9.8, −2.9) 2.9 ( 10.1) 7.2
1.69.8 14.3 4.5
m− − −= = = −
− −
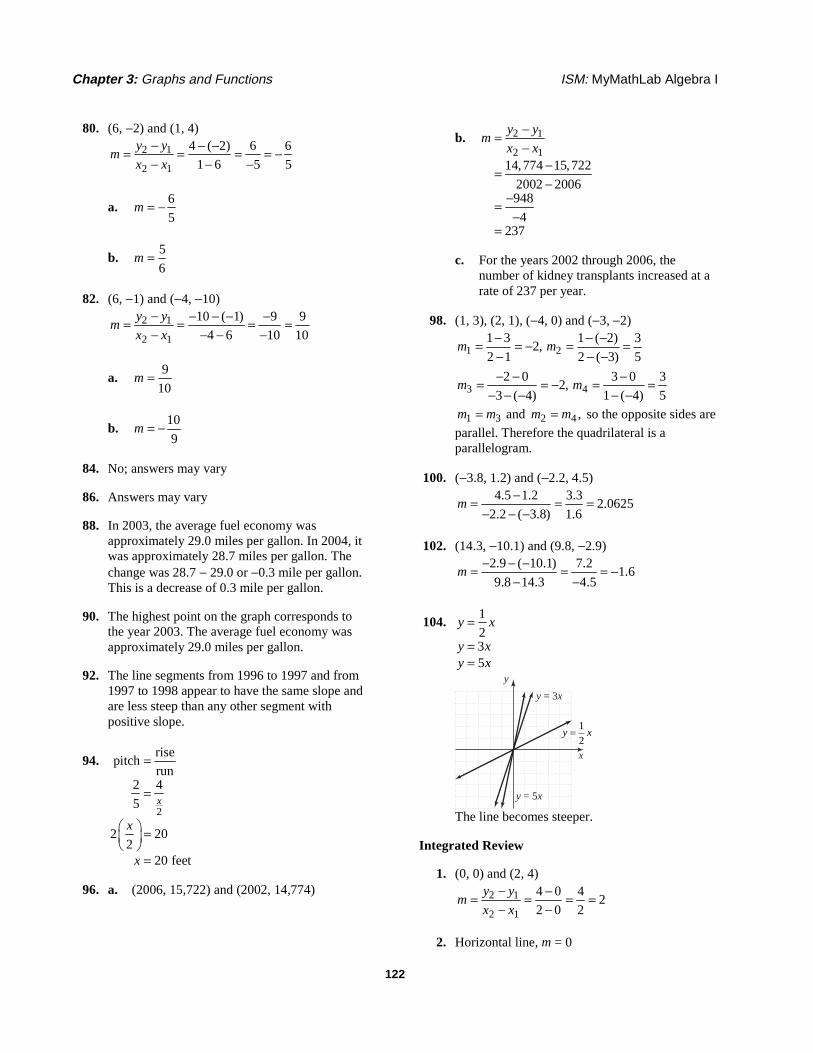
104. 1
235
y x
y xy x
=
==
y
x
y = 3x
y = 5x
y x=12
The line becomes steeper.
Integrated Review
1. (0, 0) and (2, 4)
2 1
2 1
4 0 42
2 0 2
y ym
x x
− −= = = =− −
2. Horizontal line, m = 0
ISM: MyMathLab Algebra I Chapter 3: Graphs and Functions
123
3. (0, 1) and (3, −1)
2 1
2 1
1 1 2
3 0 3
y ym
x x
− − −= = = −− −
4. Vertical line, slope is undefined.
5. y = −2x m = −2, b = 0
x y
0 0
1 −2
−1 2
y
x
y = –2x
6. 33
x yy x
+ == − +
m = −1, b = 3
x y
0 3
3 0
1 2
y
x
x + y = 3
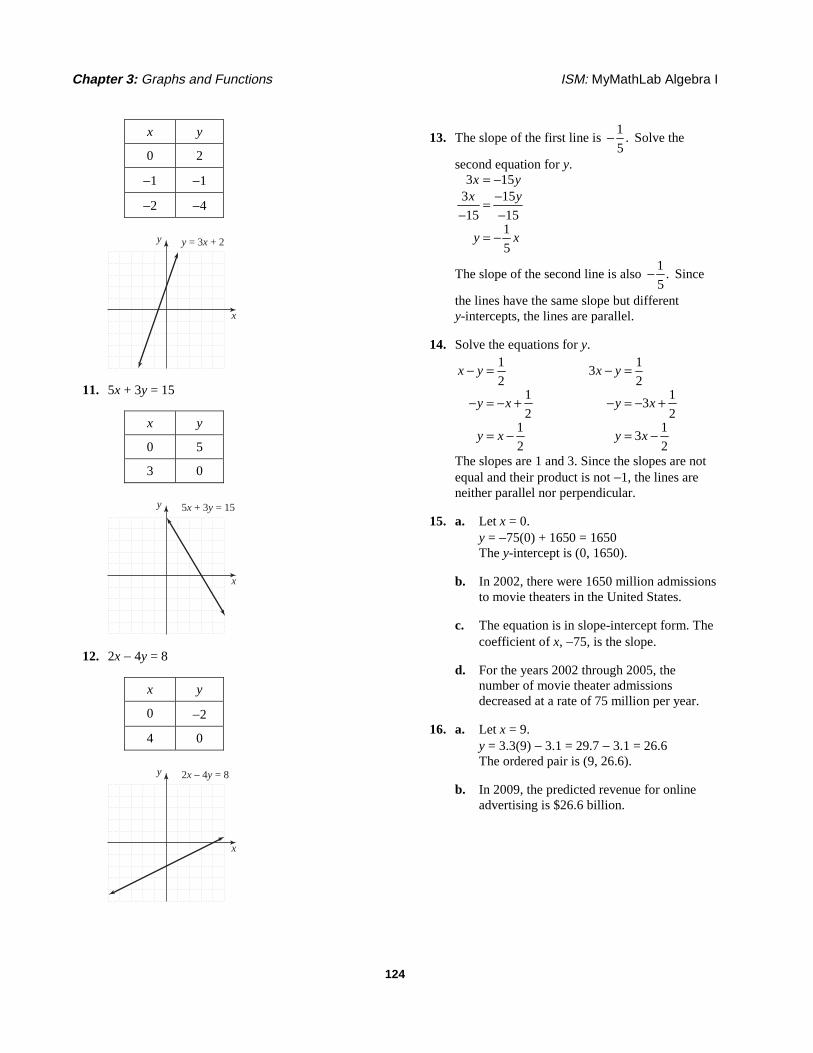
7. x = −1 for all values of y. Vertical line; slope is undefined.
y
x
x = –1
8. y = 4 for all values of x. Horizontal line; m = 0
y
x
y = 4
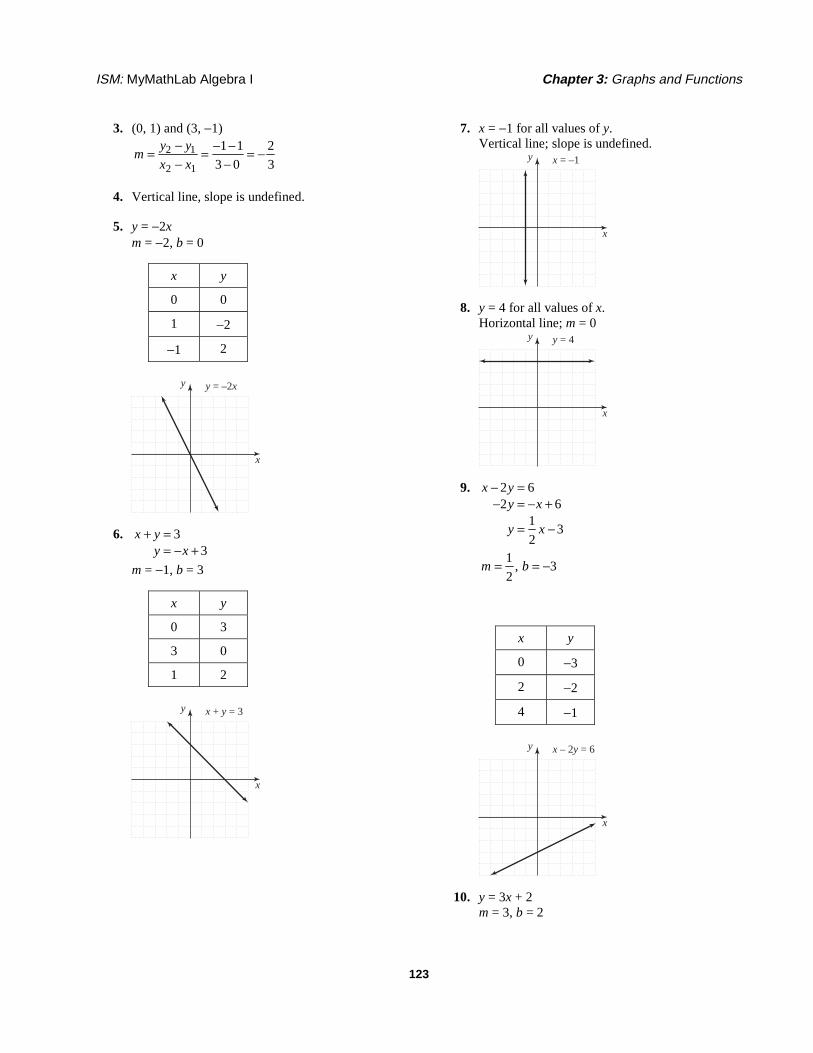
9. 2 62 6
13
2
x yy x
y x
− =− = − +
= −
1, 3
2m b= = −
x y
0 −3
2 −2
4 −1
y
x
x – 2y = 6
10. y = 3x + 2 m = 3, b = 2
Chapter 3: Graphs and Functions ISM: MyMathLab Algebra I
124
x y
0 2
−1 −1
−2 −4
y
x
y = 3x + 2
11. 5x + 3y = 15
x y
0 5
3 0
y
x
5x + 3y = 15
12. 2x − 4y = 8
x y
0 −2
4 0
y
x
2x – 4y = 8
13. The slope of the first line is 1
.5
− Solve the
second equation for y. 3 15
3 15
15 151
5
x yx y
y x
= −−=
− −
= −
The slope of the second line is also 1
.5
− Since
the lines have the same slope but different y-intercepts, the lines are parallel.
14. Solve the equations for y. 1
21
21
2
x y
y x
y x
− =
− = − +
= −
1
32
13
21
32
x y
y x
y x
− =
− = − +
= −
The slopes are 1 and 3. Since the slopes are not equal and their product is not −1, the lines are neither parallel nor perpendicular.
15. a. Let x = 0. y = −75(0) + 1650 = 1650 The y-intercept is (0, 1650).
b. In 2002, there were 1650 million admissions to movie theaters in the United States.
c. The equation is in slope-intercept form. The coefficient of x, −75, is the slope.
d. For the years 2002 through 2005, the number of movie theater admissions decreased at a rate of 75 million per year.
16. a. Let x = 9. y = 3.3(9) − 3.1 = 29.7 − 3.1 = 26.6 The ordered pair is (9, 26.6).
b. In 2009, the predicted revenue for online advertising is $26.6 billion.