Embed Size (px)
Citation preview

IOWA NURSING DEMAND SURVEY REPORT RELEASED APRIL 2021
A PROJECT OF: IOWA BOARD OF NURSING AND IOWA CENTER FOR NURSING WORKFORCE
IN COOPERATION WITH: IOWA WORKFORCE DEVELOPMENT
THE NURSING DEMAND SURVEY REPORT IS A PROJECT OF:
IOWA BOARD OF NURSING IOWA CENTER FOR NURSING WORKFORCE

Table of Contents
Introduction ..................................................................................................................................................... 1
Nursing Demand Survey Background ....................................................................................................... 2
Section One: Shortages & Recruiting (Overview) .................................................................................... 3
Section Two: Licensed Practical Nurses ...................................................................................................... 7
Section Three: Registered Nurses ............................................................................................................. 12
Section Four: Advanced Registered Nurse Practitioners ....................................................................... 17
Section Five: Shortages, Recruiting, & Retention (Employer Comparison) .......................................... 22
Highlights & Recognitions ........................................................................................................................... 30

1
.
Introduction Like no other year before it in modern history, the importance and relevance of nurses in the healthcare setting came to the forefront during the COVID-19 pandemic response in 2020. Coincidentally, 2020 had also been designated as the International Year of the Nurse and Midwife by the World Health Organization (WHO) Executive Board and endorsed by the World Health Assembly in 2019 (WHO, 2019). The year chosen to celebrate nurses on the 200th birth anniversary of Florence Nightingale – world renowned nurse researcher, nursing pioneer and wartime heroine – turned into a year where all nurses were recognized for their dedication, innovation, drive and willingness to war against an unknown viral enemy. It was a hard-
earned year of recognition for the nursing profession.
In addition to the WHO’s search for data about the international nursing workforce through their survey processes, in the United States (U.S.) the desire for accurate nursing workforce data is also sought after by nurse educators, nurse and health workforce leaders and those who hold policymaking positions. The Health Resources & Services Administration (HRSA), an agency under the U.S. Department of Health and Human Services, has conducted a survey of nurses since 1977 – its tenth cycle in 2018 – called the National Sample Survey of Registered Nurses (NSSRN). The survey is performed to fulfill the goals of congressional mandates aimed at understanding “the characteristics and distribution of RNs throughout the United States, including education,
employment, licensing and certification, and demographics” (U.S. Department of Health and Human Services, n.d.).
Another data source is the survey conducted by the National Council of State Boards of Nursing (NCSBN) and the National Forum of State Nursing Workforce Centers (the Forum) who have collaborated on a biennial national survey since 2013, to gather nursing supply data (Smiley, et.al, 2019). The NCSBN/Forum sample is gathered from the information reported to NCSBN’s Nursys® database by the state boards of nursing. Additionally, individual state nursing workforce centers conduct
their own research to assist with nursing workforce predictions (Iowa Center for Nursing Workforce, 2019).
In Iowa, during the professional licensure process through the Iowa Board of Nursing (IBON), registered nurses are asked their education, employment, and demographic information in a survey format at each three year renewal. Considered nursing supply data, the start of consistent nursing supply information began with the launch of a new licensure system by the IBON in November 2012. Also started at the same time was the development of the Iowa Center for Nursing Workforce (the Center) and the hiring of staff who has reported about the nursing supply in Iowa through the Nursing Trends report first issued by the Center in 2013. Many earlier Iowa health workforce studies included nurses and were generally produced through the Iowa
Department of Public Health staff dated back to 2006 (IDPH, 2006).
Therefore, historical supply information has been gathered, but no single source of nursing workforce demand data has been conducted, specifically by the Center. There is historical evidence suggesting that nursing shortages have existed in Iowa on and off for 30 years; or at least the distribution of nurses, where needed, has appeared short. Anecdotal reports of nursing shortages have been verbally reported to the Center across geographical pockets in Iowa over the last eight years; and as of
the release of this report, the demand across the state is great and the shortage is reported as widespread.
This report is the first of its kind analyzing the demand of nurses in the State of Iowa, conducted by the Iowa Center for Nursing Workforce under the Iowa Board of Nursing in partnership with Iowa Workforce Development, Labor Market Information Division. Ironically, the survey was launched in the Year of the Nurse and right as the COVID-19 pandemic was declared. As the war against the pandemic continues, the authors hope the insight and results provided in this report will contribute to the overall understanding about the needed demand for more nurses, how employers are handling the current employment
situation, and the importance of nurses’ contribution to a strong healthcare workforce.
References
Iowa Department of Public Health. (2006). Trends in nursing supply and education. Center for Health Workforce Planning. Bureau of Health Care Access. Des Moines, Iowa:
Iowa Department of Public Health.
Smiley, Richard; Lauer, Pam; Bienemy, Cynthia; Berg, Judith, Shireman, Emilie; Reneau, Kyrani, Alexander, Mary Ann. (2019). The 2017 National Nursing Workforce Survey.
Journal of Nursing Regulation. DOI: https://doi.org/10.1016/S2155-8256(18)30131-5
Iowa Center for Nursing Workforce. (2019). Nursing Trends. Nurse licensees and nursing education in Iowa. Academic years 2015-2016, 2016-2017, 2017-2018 – Released
July 2019. Des Moines, Iowa: Iowa Board of Nursing.
U.S. Department of Health and Human Services, Health Resources and Services Administration, National Center for Health Workforce Analysis. 2019. Technical Report for the National Sample Survey of Registered Nurses, Rockville, Maryland. Retrieved from (https://bhw.hrsa.gov/sites/default/files/bureau-health-workforce/data-research/nssrn-
technical-report.pdf).
World Health Organization (WHO), 2019. Retrieved from (https://www.who.int/news/item/30-01-2019-executive-board-designates-2020-as-the-year-of-the-nurse-and-
midwife-).
World Health Organization (WHO), 2020. State of the World’s Nursing report. Retrieved from (https://www.who.int/hrh/nursing_midwifery/state-of-the-worlds-nursing-and-
midwifery-2020-get-engaged.pdf?ua=1).

2
14.6%
47.6%
37.8% 39.1%
60.9%
25.2%18.6%
25.8%30.4%
0.0%
10.0%
20.0%
30.0%
40.0%
50.0%
60.0%
70.0%
Hospital Long-TermCare
Facility
AmbulatoryCare
Facility
UrbanLocation
RuralLocation
1-19Employees
20-49Employees
50-99Emloyees
100+Employees
nursing.iowa.gov nursing.iowa.gov/iowa-center-nursing-workforce
Nursing Demand Survey Starting February 2020 through mid-September 2020 Iowa Workforce Development (IWD) in cooperation with the Iowa Board of Nursing collected surveys from employers in the State of Iowa who employ nurses. The purpose of the survey was to gauge what the demand for nurses in Iowa is, potential shortages, and barriers in recruitment and retention. The survey was hosted by IWD online. A survey request letter was mailed to 2,547 locations. The locations were chosen by the industry classification of the organization.
Three industry classifications were chosen as the targets for receiving a survey request letter. Those classifications were determined to be the largest employers of nurses and included: hospitals, long-term care facilities, and ambulatory care facilities.
2,547 locations were sent a letter, 184 were returned due to bad addresses, for a total of 2,363 contacts
793 locations are represented in the survey
Response rate of the survey is estimated at 33.6%
All locations in the State of Iowa which were within one of the three identified industry classifications and had five or more employees were sent an invitation to participate in the 2020 Iowa Nursing Demand Survey. Surveys were collected between February 2020 and September 2020 The demographic breakout of survey respondents can be seen in the chart above.
Employer Type The largest percentage (47.6%) of survey respondents are classified as long-term care facilities. These include: assisted living facilities for the elderly; continuing care retirement communities; skilled nursing care facilities; residential intellectual & development disability facilities; and residential mental health & substance abuse facilities
Employer Location Nearly 61 percent of survey respondents are located in rural areas. These are classified as any location with a non-metro ZIP Code.
Employer Size A slight majority (30.4%) of survey respondents are locations with 100+ employees.
376 surveys were collected on or after
March 15, 2020 — representing the
COVID-19 Pandemic time period
Demographics of Survey Respondents: (767 Total Surveys)
Employer Type Employer Location Employer Size

3
58.4%
42.3%38.8%
20.4%
15.2%
6.5% 5.9%
0.0%
10.0%
20.0%
30.0%
40.0%
50.0%
60.0%
“I think there is an extreme shortage
of nurses in Iowa. Assisted living and long-term care facilities are battling to pay higher wages and because the work/life balance isn't as attractive as it is to work in a clinic or hospital that also makes things difficult…
”
Section One
Shortages & Recruiting Overview One purpose of the 2020 Nursing Demand Survey was to determine if there is a nursing shortage in the State of Iowa; that is, does Iowa have a situation where the demand for nursing professionals exceeds the supply? Survey respondents were asked: Is there a shortage of qualified job applicants for nursing positions? Nearly three-fifths (58.5%) of respondents stated, “yes.” Those that find that there is a current shortage were asked to define the degree. The breakout of the their responses is below.
The shortage is: Finding Qualified Candidates Is the number one workforce challenge reported by respondents with nearly three-fifths (57.4%) indicating this has been an issue in the last 12 months.
Turnover/Attrition This is the second greatest workforce challenge, with 42.3 percent of respondents selecting it as an issue.
Hiring New Employees Due to cost, available budget, and competition the process and ability of hiring new employees is the third greatest workforce challenge reported (38.6%).
Respondents were asked to define the biggest workforce challenges they have faced in the last 12 months in regards to nursing positions. The top results to this question can be seen in the ‘Workforce Challenges’ chart above. Respondents were allowed to choose multiple answers to this question, therefore, the percentage total will exceed 100 percent. Among those that answered “Other” the top write-in answers were: unable to get nurse candidates to work in a rural location; pay rates offered are not competitive; candidates are unwilling to work evenings/weekends; and competition (i.e. being close to a large hospital).
Find
ing Q
ualif
ied C
and
ida
tes
Turn
ove
r/A
ttri
tion
Hirin
g N
ew
Em
plo
yees
None
of
the A
bove
Repla
cing
Retire
es
Pro
fess
iona
l D
eve
lopm
ent
/Tr
ain
ing
Pro
motion/
Adva
ncem
ent
Workforce Challenges
8.9%
35.7% 35.9%
19.4%
0.0%
10.0%
20.0%
30.0%
40.0%
Slight
Moderate Great
Extreme

4
2.7%
2.8%
3.9%
4.1%
4.4%
9.2%
12.0%
13.3%
14.1%
14.8%
18.5%
19.2%
23.6%
33.9%
47.0%
49.0%
49.3%
0.0% 5.0% 10.0% 15.0% 20.0% 25.0% 30.0% 35.0% 40.0% 45.0% 50.0%
Response to Workforce
Challenges Respondents were asked to share what steps have been taken at their location in response to nursing workforce challenges. The results to this question can be seen in the ‘Response to Challenges’ chart above. Respondents were allowed to choose multiple answers to this question, therefore, the percentage total will exceed 100 percent. Among those that answered “Other” the top write-in answers were:
Implemented sign-on bonus and/or referral bonus program
Hired more qualified applicants
Offered tuition reimbursement as a benefit of employment
Top 3 Responses
Increasing Overtime or Hours for Current Staff Is the number one response to nursing workforce challenges among respondents. Nearly half (49.3%) indicated they do or have done this.
Increasing Recruiting Efforts Is the second most indicated response, according to survey takers, with 49 percent indicating they currently are doing this or have done this.
Revising the Pay Scale The third top response (47.0%) among survey takers in regards to how to respond to workforce challenges was revising the pay scale in order to attract applicants and retain current staff.
“ I think a focus on preventing nurse burn-out
would help retain bedside nurses. I think nurses pursue non-bedside jobs because they love what they do but burn out and can no longer continue working the way they do.
”
Increased Overtime or Hours for Current Staff
Increased Recruiting Efforts
Revised Pay Scale
Provided Flexible Scheduling
Outsourced Work or Used Contract Services
Hired a Less Qualified Candidate
None of the Above
Used Temp Services
Increased Training
Revised Benefits
Chose Not to Fill Job Openings
Automated Functions/New Equipment or Systems
No Action Taken
Turned Down/Did Not Pursue Business Opportunities
Lowered Job Requirements
Other
Used State Workforce Services
$
Response to Challenges This chart indicates the actions
employers have taken in response to workforce challenges
nursing.iowa.gov nursing.iowa.gov/iowa-center-nursing-workforce

5
Top Difficulties Filling
Vacancies Respondents were given a number of potential reasons their location may have difficulty filling nursing vacancies (results in chart below). They were asked to rate these reasons from strongly agree to strongly
disagree.
The following three reasons were those which had the greatest percentage of respondents agree or strongly
agree were difficulties in filling nursing openings.
A General Lack of Applicants Over two-thirds (69.2%) of respondents either agreed or strongly agreed that they have difficulty filling nursing openings due to just a general lack of applicants for their available positions.
Local Competition This reason had the second greatest percentage (60.2%) of respondents indicate that they agreed or strongly agreed this was a problem for them in hiring nurses
Expected Wages Nearly half (49.9%) of respondents either agreed or strongly agreed that the wages expected by applicants or what applicants are willing to accept has made filling nursing positions difficult.
Least of the Issues Of the reasons respondents were given to rate, some had a slight majority of survey takers indicate that they either disagreed or strongly disagreed that it was a contributing problem for them in filling nursing
positions at their location (results in chart below).
The following three reasons were those which had the greatest percentage of respondents disagree or strongly disagree were difficulties in filling nursing vacancies. Additionally, each of these reasons had the greatest percentage of respondents rate the issue as
“neutral”.
Type of Work Involved Nearly two-fifths (38.8%) disagreed or strongly disagreed that the nature of the work involved in nursing occupations made it difficult to fill openings. Only 21.7 percent agreed or strongly agreed that it contributed to the problem.
Hours or Shifts Offered Many respondents (36.6%) also disagreed or strongly disagreed that the hours and/or shifts available to applicants had a negative effect on filling nursing positions. However, nearly one-third (30.2%) agreed or strongly agreed that this had an adverse impact.
Expected Benefits More than one-third (36.0%) of respondents either disagreed or strongly disagreed that the benefits expected by applicants made filling nursing positions difficult.
43.7%
34.0%
33.2%
39.6%
29.2%
26.6%
16.9%
0.0% 5.0% 10.0% 15.0% 20.0% 25.0% 30.0% 35.0% 40.0% 45.0%
Applicants' lack of experience
Expected Benefits
Hours or shifts offered
Type of work involved
Expected wages
Local competition
General lack of applicants
Strongly Agree Agree Neutral Disagree Strongly Disagree
69.2%
13.9%
60.2%
13.2%
49.9%
20.9%
21.7%
38.8%
30.2%
36.6%
30.0%
36.0%
22.9%
33.4%
Sum of Strongly Agree & Agree
We often have a problem filling nursing positions due to...
$
Sum of Strongly Disagree & Disagree

6
44.4%
32.6%28.3%
25.0%
16.8%
7.9%3.7% 3.4%
1.4%0.0%
5.0%
10.0%
15.0%
20.0%
25.0%
30.0%
35.0%
40.0%
45.0%
Barriers to Recruiting Respondents were asked to share what barriers they have encountered when recruiting nurses at their location. The results to this question can be seen in the ‘Barrier to Recruiting for this Location’ chart above. Respondents were allowed to choose multiple answers to this question, therefore, the percentage total will exceed 100 percent. Among those that answered “Other” the top write-in answers were:
Candidates are unwilling to work evenings and/or weekends
Candidates lack experience in specialized areas
Proximity of location to a large hospital (i.e. local competition)
Travel requirements of the position
Retirements In addition to nursing shortages, workforce challenges, and recruitment issues the aging nursing workforce also has an impact on the availability of nurses in Iowa. Survey respondents were asked how many nurses retired at their location in the last 12 months and how many nurses are eligible to retire, at their location, in the next 12 months.
Retirees in the Last 12 Months To this question, 185 of 776 survey takers responded that they had nurses retire in the last year; equating to a total of 397 nurses or an average of 2.1 nurses per location.
Retirees in the Next 12 Months To this question, 234 of 776 survey takers responded that they had nurses who are eligible to retire in the next year; equating to a total of 569 nurses or an average of 2.4 nurses per location.
Op
port
unity f
or
Ad
vanc
em
ent
“ As a small employer,
it is very hard to compete with larger companies wages and benefits, especially government jobs. Many nurses are now getting BSN or master’s degrees and want to be paid more for this work, however, not all jobs require BSN or greater.
”
Com
petitive
Wa
ges
Com
petitive
Bene
fits
Pack
age
None
of
the A
bove
Loca
tion
Ava
ilab
le H
ous
ing (
Qua
ntity o
r Q
ualit
y Iss
ues)
Oth
er
Aff
ord
able
Hous
ing
Barriers to Recruiting for this Location
Qua
lity o
f Sch
ools in
Are
a
“ There are not enough
experienced nurses to fill the knowledge gaps from retirements.
”
nursing.iowa.gov nursing.iowa.gov/iowa-center-nursing-workforce

7
576
102
325
149
286 290
2359
207287
326
76
199
51
156 170
1044
97
175
0
200
400
600
800
1,000
Total Hospital Long-TermCare
Facility
AmbulatoryCare
Facility
UrbanLocation
RuralLocation
1-19Employees
20-49Employees
50-99Employees
100+Employees
Full-Time Openings Part-Time Openings
Employer Type Employer Location Employer Size
Section Two
LPN Openings Survey participants were asked: Does this location have current openings for LPNs? To this question, 298 respondents (38.4%) answered “yes.” Of this group, over two-thirds (69.1%) of respondents represent long-term care facilities. Additionally, among those that answered “yes” a majority were located in a rural area (62.4%) versus an urban area (37.6%). Finally, in regards to the demographics of these respondents, the majority were mid-to-large sized employers with 38.9 percent of respondents answering “yes” having 50-99 employees and 37.6 percent having 100+ employees. These respondents reported a total of 902 current LPN openings. Of these 63.9 percent were full-time positions and 36.1 percent were part-time. Lastly, less than one percent (0.44%) of all reported openings (4) were for contract/travel/agency LPNs. Openings by employer type, employer location, and employer size are detailed in the following chart.
Employer Type Long-term care facilities represent the largest portion (69.1%) of respondents who reported current LPN openings. Likewise, the greatest number of total openings reported (524 of 902) were at long-term care facilities; representing 58.1 percent of all LPN openings reported.
Employer Location Respondents located in a rural ZIP Code represent the largest portion (62.4%) of respondents who reported current LPN openings. However, rural locations represent only a slight majority in total openings reported (460 of 902) over urban locations; representing 51.0 percent of all LPN openings reported.
Employer Size Mid-to-large sized employers (50-99 employees and 100+ employees) represent the largest portion (76.5%) of respondents who reported current LPN openings. The greatest number of total openings reported (766 of 902) were also among mid-to-large sized employers; representing about 84.9 percent of all LPN openings reported.
Licensed Practical Nurses Overview Survey participants were asked about openings, expected changes in employment, and recruitment issues for several different nursing titles. This section reviews the survey results in those areas for the occupation of licensed practical nurse (LPN). Each area is examined by employer type, employer location, and employer size.
LPN Openings by Demographics of Employer

8
15.3%
18.8%
9.4%
5.4%
11.6%
14.3%
12.6%
14.4%
6.1%
12.6%
2.3%
2.1%
4.3%
2.2%
3.6%
1.1%
1.8%
3.7%
1.0%
2.6%
82.3%
79.2%
86.3%
92.4%
84.9%
84.6%
85.6%
81.9%
92.9%
84.8%
0% 20% 40% 60% 80% 100%
100+ Employees
50-99 Employees
20-49 Employees
1-19 Employees
Rural Location
Urban Location
Ambulatory Care Facility
Long-Term Care Facility
Hospital
Total (All Respondents)
Increase Decrease Remain Stable
Future of Available LPN
Positions Respondents were asked how the number of LPN positions are expected to change at their location in the next 12 months. A total of 730 respondents answered this question. The demographic breakout of these respondents are as follows:
48.5% long-term care facilities; 37.9% ambulatory care facilities; and 13.6% hospitals
61.6% located in a rural ZIP Code and 38.4% located in an urban ZIP Code
29.5% have 100+ employees; 26.3% have 50-99
employees; 25.2% have 1-19 employees; and 19.0% have 20-49 employees
The chart above displays, within each demographic breakout, the percentage of respondents who expect an increase, decrease, or no change in LPN positions over the next 12 months. The majority of respondents within each breakout do not foresee any change in LPN employment at their location.
Employer Type 14.4% of long-term care facility respondents expect an increase in LPN positions over the next 12 months. Among this group, slightly over 88 percent foresee an increase of 1-4 LPN positions.
Employer Location 14.3% of respondents located in an urban ZIP Code expect an increase in LPN positions over the next 12 months. Among this group, 72.5 percent expect an increase of 1-4 LPN positions.
Employer Size 18.8% of respondents with a total of 50-99 employees expect an increase in LPN positions over the next 12 months. Among this group, 91.7 percent foresee an increase of 1-4 positions.
“ LPN’s are hard to find
and we would prefer them over a CMA. I am not sure they are paid enough in comparison to the CMA. ”
$
Em
plo
yer
Type
Em
plo
yer
Lo
cation
Em
plo
yer
Siz
e
100%
Expected Changes
How will the number of LPN positions at this location change in
the next 12 months?
nursing.iowa.gov nursing.iowa.gov/iowa-center-nursing-workforce

9
Ease of Recruiting &
Hiring LPNs Respondents were asked to rate their experience with recruiting and hiring LPNs at their location. Respondents rated their experience from very easy to
very difficult.
There were a total of 528 respondents that provided
a rating. The results are broken out below.
Very Easy Somewhat Easy Neither Easy nor Difficult Somewhat Difficult Very Difficult
DIFFICULT
Timeline to Fill Openings Respondents were asked to indicate the average number of days it takes their location to fill open
positions for LPNs.
A total of 511 respondents answered this question.
The results are provided below.
1-30 Days 31-60 Days 61-90 Days Greater than 90 Days
The majority of respondents (31.3%) indicated it took them approximately 31-60 days to fill an LPN opening. However, the next greatest percentage of respondents (28.0%) reported that it averaged greater than 90 days to fill an opening for a licensed practical nurse.
2.5
19.3
8.9
40.7
28.6
% RATING
21.8%
69.3%
EASY
% AVERAGE TIMEFRAME
17.4
31.3
23.3
28.0
Hired LPNs Respondents were asked how many LPNs were hired at their location in the last 12 months. Additionally, they were asked if their location hired any new LPN graduates during that year and if so how many. Overall results are given below.
617 full-time LPNs were hired
294 part-time LPNs were hired
42 contract/travel LPNs were hired
162 respondents (23.8%) indicated that they had hired new
LPN graduates at their location within the last year.
Reporting 276 new LPN graduates hired
Respondents were asked to provide wage information regarding their LPN employees. Participating survey takers provided the entry-level hourly wage their location offers as well as their maximum hourly wage for LPNs. Additionally, respondents provided entry-level annual salaries and maximum annual salaries offered at their location for LPNs.
Median Entry-Level Hourly Wage
$18.56
Median Maximum Hourly Wage
$24.00
Median Entry-Level Annual Salary
$37,960
Median Maximum Annual Salary
$50,180
“ We have not had an applicant for our LPN
positions for the past few years and have re-formatted the position due to this. Other assisted living communities in the area have experienced the same problem. ”
10
$
[25.1%]
[16.2%]
[11.4%]
[34.7%]
[22.4%]
[20.7%]
[29.9%]
[15.6%]
[28.6%]
[21.8%]
7.4%
6.6%
8.0%
16.3%
9.4%
8.0%
12.8%
6.1%
11.4%
8.9%
[67.4%]
[77.2%]
[80.7%]
[49.0%]
[68.2%]
[71.3%]
[57.3%]
[78.2%]
[60.0%]
[69.3%]
0% 20% 40% 60% 80% 100%
100+ Employees
50-99 Employees
20-49 Employees
1-19 Employees
Rural Location
Urban Location
Ambulatory Care Facility
Long-Term Care Facility
Hospital
Total (All Respondents)
Very Easy Somewhat Easy Neither Somewhat Difficult Very Difficult
Employer Location Employer Size
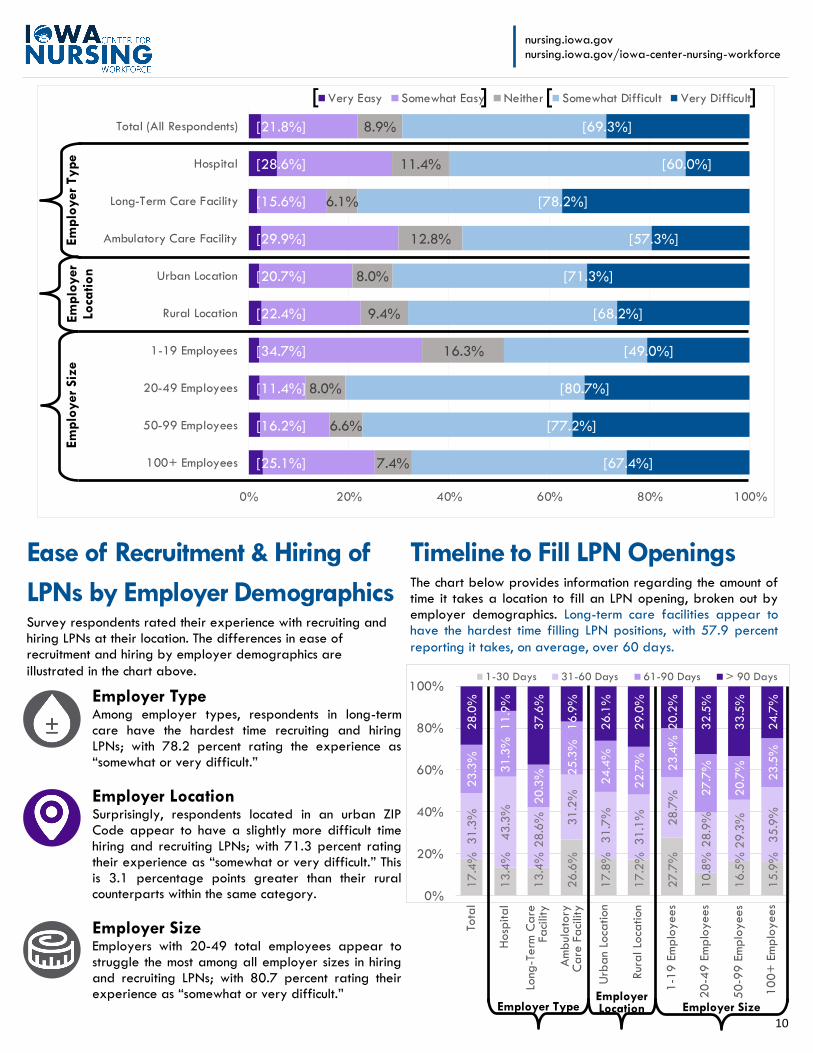
Ease of Recruitment & Hiring of
LPNs by Employer Demographics Survey respondents rated their experience with recruiting and hiring LPNs at their location. The differences in ease of recruitment and hiring by employer demographics are
illustrated in the chart above. Employer Type Among employer types, respondents in long-term care have the hardest time recruiting and hiring LPNs; with 78.2 percent rating the experience as “somewhat or very difficult.”
Employer Location Surprisingly, respondents located in an urban ZIP Code appear to have a slightly more difficult time hiring and recruiting LPNs; with 71.3 percent rating their experience as “somewhat or very difficult.” This is 3.1 percentage points greater than their rural counterparts within the same category.
Employer Size Employers with 20-49 total employees appear to struggle the most among all employer sizes in hiring and recruiting LPNs; with 80.7 percent rating their experience as “somewhat or very difficult.”
Timeline to Fill LPN Openings The chart below provides information regarding the amount of time it takes a location to fill an LPN opening, broken out by employer demographics. Long-term care facilities appear to have the hardest time filling LPN positions, with 57.9 percent
reporting it takes, on average, over 60 days.
Em
plo
yer
Type
Em
plo
yer
Lo
cation
Em
plo
yer
Siz
e
[ ] [ ]
17.4
%
13.4
%
13.4
%
26.6
%
17.8
%
17.2
%
27.7
%
10.8
%
16.5
%
15.9
%
31.3
%
43.3
%
28.6
% 31.2
%
31.7
%
31.1
% 28.7
%
28.9
%
29.3
%
35.9
%
23.3
%
31.3
%
20.3
% 25.3
%
24.4
%
22.7
%
23.4
%
27.7
%
20.7
%
23.5
%
28.0
%
11.9
%
37.6
%
16.9
%
26.1
%
29.0
%
20.2
%
32.5
%
33.5
%
24.7
%
0%
20%
40%
60%
80%
100%1-30 Days 31-60 Days 61-90 Days > 90 Days
Tota
l
Hosp
ital
Long
-Term
Care
Fa
cilit
y
Am
bula
tory
C
are
Faci
lity
Urb
an
Loca
tion
Rur
al Lo
cation
1-1
9 E
mplo
yees
20
-49
Em
plo
yees
50
-99
Em
plo
yees
10
0+
Em
plo
yees
Employer Type
nursing.iowa.gov nursing.iowa.gov/iowa-center-nursing-workforce

11
Hired LPNs by Employer Demographics Respondents were asked how many LPNs were hired at their location in the last 12 months. Additionally, they were asked if their location hired any new LPN graduates during that year and if so how many. Results, by employer demographics, can be seen in the chart below. The number of new graduate hires are incorporated into the full-time/part-time/contract totals; however, the overall total number of new grads is indicated separately by the green dot.
Where are LPNs hired the most? As a percentage of total hires, long-term care facilities, represent 60.7 percent of all LPN hires which is the greatest among all employer types. In regards to employer location, employers located in rural ZIP Codes represent 51.2 percent of total LPN hires, slightly outpacing urban employers. Lastly, employers with 100+ employees hire the greatest amount of LPNs, representing 55.2 percent of all LPN hires, when hires are examined by employer size.
Where do new LPN graduates go? Long-term care facilities, by far, hire more new LPN graduates than any other employer type. A total of 276 new LPN graduates were hired in the last year, based upon survey data, and 69.2 percent were hired at long-term care facilities.
617
106
367
144
280337
18
91
176
332
294
49
172
73
168126
10 34
65
185
42
39
3
17 25
14
28
9
27644
191
41 131 145 11
19
88
158
0
200
400
600
800
1,000
1,200
Total Hospital Long-TermCare
Facility
AmbulatoryCare
Facility
UrbanLocation
RuralLocation
1-19Employees
20-49Employees
50-99Employees
100+Employees
Full-Time Hires Part-Time Hires Contract/Travel Hires New Grad Hires
Employer Type Employer Location Employer Size
Participating survey takers provided the entry-level hourly wage/annual salary their location offers as well as the maximum hourly wage/annual salary provided to experienced LPNs. Median wage information by employer demographics are given in the table to the right. In general, long-term care facilities offer the highest wages. There is very little difference in wages between urban and rural locations.
Employer CharacteristicsEntry-Level
Hourly Wage
Maximum
Hourly Wage
Entry-Level
Annual Salary
Maximum
Annual Salary
Total (All Respondents) 18.56$ 24.00$ 37,960.00$ 50,180.00$
Hospital 16.30$ 24.26$ 32,930.56$ 49,395.84$
Long-Term Care Facility 20.00$ 23.90$ 41,600.00$ 52,000.00$
Ambulatory Care Facility 17.04$ 24.00$ 35,445.00$ 47,840.00$
Urban Location 18.56$ 24.39$ 37,824.50$ 50,481.60$
Rural Location 18.56$ 23.76$ 37,960.00$ 49,733.00$
1-19 Employees 17.00$ 23.87$ 35,360.00$ 43,499.78$
20-49 Employees 19.00$ 23.00$ 37,440.00$ 50,481.60$
50-99 Employees 20.00$ 23.50$ 40,560.00$ 50,690.00$
100+ Employees 18.00$ 24.50$ 37,652.65$ 51,012.00$
Median Wages
Wages of LPNs by Employer Demographics
Blue highlighting indicates the areas where the highest wages are offered per level. Purple highlighting indicates where the lowest wages are offered per level.

12
Section Three
RN Openings Survey participants were asked: Does this location have current openings for RNs? To this question, 370 respondents (47.7%) answered “yes.” Of this group, nearly three-fifths (59.2%) of respondents represent long-term care facilities. Additionally, among those that answered “yes” a majority were located in a rural area (63.2%) versus an urban area (36.8%). Finally, in regards to the demographics of these respondents, the majority were mid-to-large size employers with 32.7 percent of respondents answering “yes” having 50-99 employees and 43.8 percent having 100+ employees. These respondents reported a total of 1,572 current RN openings. Of these 66.5 percent are full-time positions and 33.5 percent were part-time. Openings by employer type, employer location, and employer size are detailed in the chart below. Respondents were also asked to indicate if these openings were for direct care or indirect care nurses. The majority (88.9%) reported these openings were for direct care RNs, 9.2 percent were for indirect care RNs, and 2.0 percent reported they did not know the care classification of the openings. Lastly, nearly two percent of all reported openings (31) were for contract/travel/agency RNs.
Employer Type Long-term care facilities represent the largest portion (59.2%) of respondents who reported current RN openings. However, the greatest number of total openings reported (709 of 1,572) were at hospitals; representing 45.1 percent of all RN openings reported.
Employer Location Respondents located in a rural ZIP Code represent the largest portion (63.2%) of respondents who reported current RN openings. However, urban locations represent a majority of total openings reported (881 of 1,572); representing 56.0 percent of all RN openings reported.
Employer Size Mid-to-large sized employers (50-99 employees and 100+ employees) represent the largest portion (76.5%) of respondents who reported current RN openings. The greatest number of total openings reported (1,417 of 1,572) were also among mid-to-large sized employers; representing about 90 percent of all RN openings reported.
Registered Nurses Overview Survey participants were asked about openings, expected changes in employment, and recruitment issues for several different nursing titles. This section reviews the survey results in those areas for the occupation of registered nurse (RN). Each area is examined by employer type, employer location, and employer size.
1,045
455325 265
599446
2876
194
747
527
254
198
75
282
245
1338
109
367
0
200
400
600
800
1,000
1,200
1,400
1,600
1,800
Total Hospital Long-TermCare
Facility
AmbulatoryCare
Facility
UrbanLocation
RuralLocation
1-19Employees
20-49Employees
50-99Employees
100+Employees
Full-Time Openings Part-Time Openings
Employer Type Employer Location Employer Size
RN Openings by Demographics of Employer
13
24.5%
32.8%
14.7%
7.8%
20.1%
21.5%
19.1%
23.2%
15.4%
20.6%
1.9%
1.1%
0.7%
2.2%
2.1%
0.7%
1.8%
1.4%
1.1%
1.5%
73.6%
66.1%
84.6%
89.9%
77.8%
77.8%
79.0%
75.4%
83.5%
77.8%
0% 20% 40% 60% 80% 100%
100+ Employees
50-99 Employees
20-49 Employees
1-19 Employees
Rural Location
Urban Location
Ambulatory Care Facility
Long-Term Care Facility
Hospital
Total (All Respondents)
Increase Decrease Remain Stable
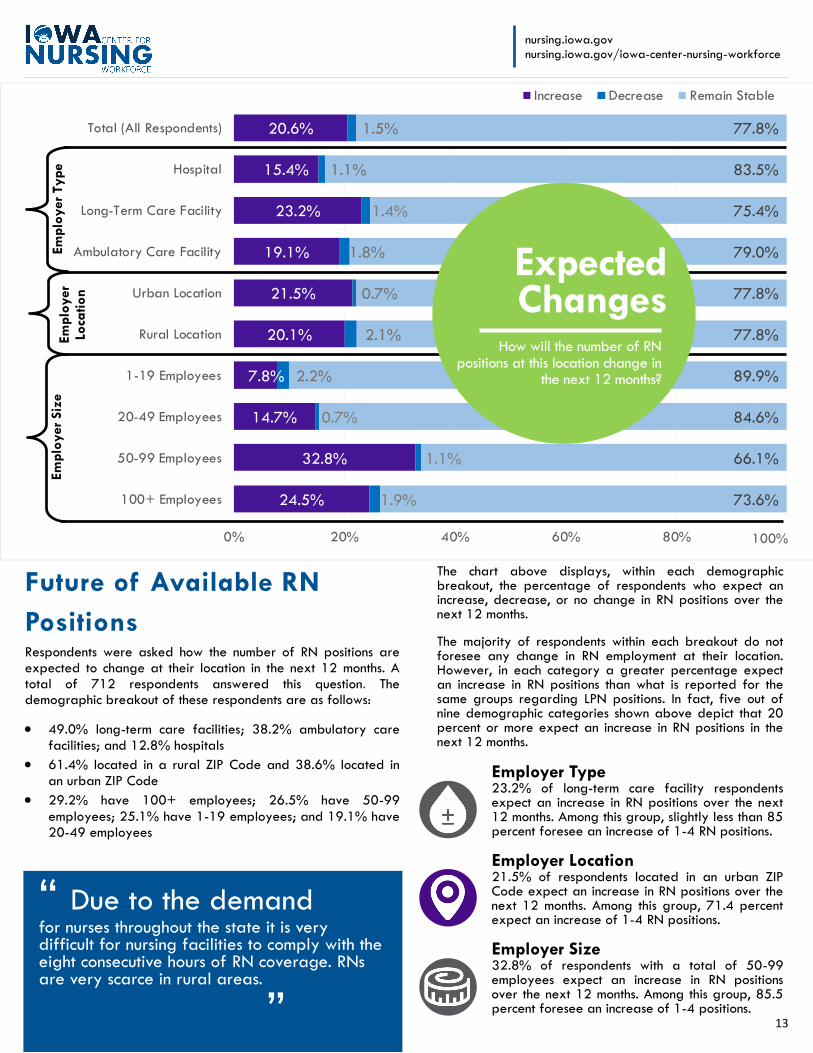
Future of Available RN
Positions Respondents were asked how the number of RN positions are expected to change at their location in the next 12 months. A total of 712 respondents answered this question. The demographic breakout of these respondents are as follows:
49.0% long-term care facilities; 38.2% ambulatory care facilities; and 12.8% hospitals
61.4% located in a rural ZIP Code and 38.6% located in an urban ZIP Code
29.2% have 100+ employees; 26.5% have 50-99
employees; 25.1% have 1-19 employees; and 19.1% have 20-49 employees
The chart above displays, within each demographic breakout, the percentage of respondents who expect an increase, decrease, or no change in RN positions over the next 12 months. The majority of respondents within each breakout do not foresee any change in RN employment at their location. However, in each category a greater percentage expect an increase in RN positions than what is reported for the same groups regarding LPN positions. In fact, five out of nine demographic categories shown above depict that 20 percent or more expect an increase in RN positions in the next 12 months.
Employer Type 23.2% of long-term care facility respondents expect an increase in RN positions over the next 12 months. Among this group, slightly less than 85 percent foresee an increase of 1-4 RN positions.
Employer Location 21.5% of respondents located in an urban ZIP Code expect an increase in RN positions over the next 12 months. Among this group, 71.4 percent expect an increase of 1-4 RN positions.
Employer Size 32.8% of respondents with a total of 50-99 employees expect an increase in RN positions over the next 12 months. Among this group, 85.5 percent foresee an increase of 1-4 positions.
“ Due to the demand
for nurses throughout the state it is very difficult for nursing facilities to comply with the eight consecutive hours of RN coverage. RNs are very scarce in rural areas. ”
$
Em
plo
yer
Type
Em
plo
yer
Lo
cation
Em
plo
yer
Siz
e
100%
Expected Changes
How will the number of RN positions at this location change in
the next 12 months?
nursing.iowa.gov nursing.iowa.gov/iowa-center-nursing-workforce

14
Timeline to Fill Openings Respondents were asked to indicate the average number of days it takes their location to fill open
positions for RNs.
A total of 586 respondents answered this question.
The results are provided below.
1-30 Days 31-60 Days 61-90 Days Greater than 90 Days
The majority of respondents (34.6%) indicated it took them greater than 90 days to fill an RN opening. The next greatest percentage of respondents (26.0%) reported that it averaged 61-90 days to fill an opening for a registered nurse.
% AVERAGE TIMEFRAME
15.7
23.7
26.0
34.6
Hired RNs Respondents were asked how many RNs were hired at their location in the last 12 months. Additionally, they were asked if their location hired any new RN graduates during that year and if so how many. Overall results are given below.
1,627 full-time RNs were hired
529 part-time RNs were hired
142 contract/travel RNs were hired
201 respondents (29.1%) indicated that they had hired new
RN graduates at their location within the last year.
Reporting 448 new RN graduates hired
Respondents were asked to provide wage information regarding their RN employees. Participating survey takers provided the entry-level hourly wage their location offers as well as their maximum hourly wage for RNs. Additionally, respondents provided entry-level annual salaries and maximum annual salaries offered at their location for RNs.
Median Entry-Level Hourly Wage
$24.00
Median Maximum Hourly Wage
$30.00
Median Entry-Level Annual Salary
$50,018
Median Maximum Annual Salary
$65,000
IS A PAY DIFFERENTIAL GIVEN TO BSN REGISTERED NURSES OVER ADN RNs?
88.1% of respondents said, “NO.”
ADN vs BSN prepared Registered Nurses
Is a hiring preference given to BSN RNs over ADN RNs?
89.2% of respondents said, “NO.”
Are BSN RNs generally better prepared and/or give better care than ADN RNs? Respondents said:
49.7% - “No, or they are the same.” 38.4% - “I don’t know.” 10.3% - “Yes” 1.0% - “Other” 0.6% - “Experience makes more of a
difference than degrees do.”
Ease of Recruiting &
Hiring RNs Respondents were asked to rate their experience with recruiting and hiring RNs at their location. Respondents
rated their experience from very easy to very difficult.
There were a total of 605 respondents that provided
a rating. The results are broken out below.
Very Easy Somewhat Easy Neither Easy nor Difficult Somewhat Difficult Very Difficult
DIFFICULT
1.5
12.7
7.4
33.9
44.5
% RATING
14.2%
78.4%
EASY

15
$
[12.3%]
[11.4%]
[13.6%]
[22.4%]
[13.1%]
[16.1%]
[23.8%]
[8.5%]
[12.9%]
[14.3%]
5.1%
4.0%
5.9%
18.1%
7.5%
7.4%
13.9%
4.1%
4.7%
7.4%
[82.6%]
[84.6%]
[80.5%]
[59.5%]
[79.4%]
[76.5%]
[62.3%]
[87.4%]
[82.4%]
[78.3%]
0% 20% 40% 60% 80% 100%
100+ Employees
50-99 Employees
20-49 Employees
1-19 Employees
Rural Location
Urban Location
Ambulatory Care Facility
Long-Term Care Facility
Hospital
Total (All Respondents)
Very Easy Somewhat Easy Neither Somewhat Difficult Very Difficult
Employer Location Employer Size
Ease of Recruitment & Hiring of
RNs by Employer Demographics Survey respondents rated their experience with recruiting and hiring RNs at their location. The differences in ease of recruitment and hiring by employer demographics are
illustrated in the chart above. Employer Type Among employer types, respondents in long-term care have the hardest time recruiting and hiring RNs; with 87.4 percent rating the experience as “somewhat or very difficult.”
Employer Location Respondents located in a rural ZIP Code appear to have a slightly more difficult time hiring and recruiting RNs; with 79.4 percent rating their experience as “somewhat or very difficult.” This is 2.9 percentage points greater than their urban counterparts within the same category.
Employer Size Employers with 50-99 total employees appear to struggle the most among all employer sizes in hiring and recruiting RNs; with 84.6 percent rating their experience as “somewhat or very difficult.”
Timeline to Fill RN Openings The chart below provides information regarding the amount of time it takes a location to fill an RN opening, broken out by employer demographics. Long-term care facilities appear to have the hardest time filling RN positions, with 66.8 percent
reporting it takes, on average, over 60 days.
Em
plo
yer
Type
Em
plo
yer
Lo
cation
Em
plo
yer
Siz
e
[ ] [ ]
15
.7%
15
.3%
10
.9%
23
.9%
19
.3%
13
.5%
20
.0%
14
.9%
14
.2%
15
.2%
23
.7%
18
.8%
22
.4% 2
8.2
%
25
.1%
22
.9%
26
.7%
26
.3%
21
.6%
22
.5%
25
.9%
35
.3%
24
.0%
25
.0%
29
.1%
24
.0% 22
.9%
22
.8%
25
.6%
29
.8%
34
.6%
30
.6%
42
.8%
22
.9%
26
.5%
39
.7%
30
.5%
36
.0%
38
.6%
32
.5%
0%
20%
40%
60%
80%
100%1-30 Days 31-60 Days 61-90 Days > 90 Days
Tota
l
Hosp
ital
Long
-Term
C
are
Faci
lity
Am
bula
tory
C
are
Faci
lity
Urb
an
Loca
tion
Rur
al Lo
cation
1-1
9 E
mplo
yees
20
-49
Em
plo
yees
50
-99
Em
plo
yees
10
0+
Em
plo
yees
Employer Type
nursing.iowa.gov nursing.iowa.gov/iowa-center-nursing-workforce

16
Hired RNs by Employer Demographics Respondents were asked how many RNs were hired at their location in the last 12 months. Additionally, they were asked if their location hired any new RN graduates during that year and if so how many. Results, by employer demographics, can be seen in the chart below. The number of new graduate hires are incorporated into the full-time/part-time/contract totals; however, the overall total number of new grads is indicated separately by the green dot.
1,627
746
464 417
860767
81 163291
1,092
529
280
142107
274255
24 4468
393
142
86
488
6181
9 5
34
94
448
273 105 70 216 23212 16
65355
0
200
400
600
800
1,000
1,200
1,400
1,600
1,800
2,000
2,200
2,400
2,600
Total Hospital Long-TermCare
Facility
AmbulatoryCare
Facility
UrbanLocation
RuralLocation
1-19Employees
20-49Employees
50-99Employees
100+Employees
Full-Time Hires Part-Time Hires Contract/Travel Hires New Grad Hires
Employer Type Employer Location Employer Size
Where are RNs hired the most? As a percentage of total hires, hospitals, represent 48.4 percent of all RN hires which is the greatest among all employer types. In regards to employer location, employers located in urban ZIP Codes represent 52.0 percent of total RN hires, slightly outpacing rural employers. Lastly, employers with 100+ employees hire the greatest amount of RNs, representing 68.7 percent of all RN hires, when hires are examined by employer size.
Where do new RN graduates go? Hospitals, by far, hire more new RN graduates than any other employer type. A total of 448 new RN graduates were hired in the last year, based upon survey data, and 60.9 percent were hired at hospitals. Additionally the majority of new graduates went to rural locations (51.8%) and to employers with over 100 total employees (79.2%).
Employer CharacteristicsEntry-Level
Hourly Wage
Maximum
Hourly Wage
Entry-Level
Annual Salary
Maximum
Annual Salary
Total (All Respondents) 24.00$ 30.00$ 50,018.00$ 65,000.00$
Hospital 23.91$ 35.56$ 49,608.00$ 73,195.00$
Long-Term Care Facility 24.49$ 29.00$ 52,000.00$ 64,313.50$
Ambulatory Care Facility 22.00$ 30.00$ 48,382.50$ 65,000.00$
Urban Location 24.00$ 31.23$ 50,018.00$ 68,640.00$
Rural Location 23.85$ 30.00$ 50,000.00$ 62,400.00$
1-19 Employees 22.00$ 29.69$ 47,840.00$ 60,000.00$
20-49 Employees 23.00$ 29.00$ 52,000.00$ 65,000.00$
50-99 Employees 24.00$ 29.01$ 50,960.00$ 63,273.50$
100+ Employees 24.00$ 34.01$ 51,000.00$ 71,638.00$
Median Wages
Wages of RNs by Employer Demographics Participating survey takers provided the entry-level hourly wage/annual salary their location offers as well as the maximum hourly wage/annual salary provided to experienced RNs. Median wage information by employer demographics are given in the table to the right.
Long-term care facilities offer the highest entry-level wages. However, hospitals offer the highest maximum wages available to experienced RNs. There is little difference in wages between urban and rural locations, except at the maximum annual salary level.
Blue highlighting indicates the areas where the highest wages are offered per level. Purple highlighting indicates where the lowest wages are offered per level.

17
Section Four Employer Type Ambulatory care facilities represent the largest portion (56.5%) of respondents who reported current ARNP openings. Likewise, the greatest number of total openings reported (71 of 113) were at ambulatory care facilities; representing 62.8 percent of all openings reported.
Employer Location Respondents located in a rural ZIP Code represent the largest portion (56.5%) of respondents who reported current openings. However, rural locations represent only 36.3 percent of total openings reported (41 of 113).
Employer Size Large employers (100+ employees) represent the largest portion (58.7%) of respondents who reported current ARNP openings. The greatest number of total openings reported (85 of 113) were also large employers; representing about 75.2 percent of all ARNP openings reported.
ARNP Openings Survey participants were asked: ‘Does this location have current openings?’ for the four advanced nursing roles defined above. To this question, 46 respondents (6.0%) answered “yes.” Among these, 39 reported openings for NPs, 11 had openings for CRNAs, and 4 had CNS openings. No survey respondents reported openings for CNMs.
These respondents reported a total of 113 current ARNP openings. Nurse practitioners represent 94 of these openings. A total of 16 openings were reported for CRNAs and 3 CNS openings are represented in the chart below. Among all reported openings 87.6 percent were full-time positions and 12.4 percent were part-time. Lastly, less than two percent (1.8%) of all reported openings (2) were for contract/travel/agency advanced nurses, both were for NPs. Openings by employer type, employer location, and employer size are detailed in the following chart.
99
32
2
65 67
32
11 7 4
77
14
8
0
6 5
9
22 2
8
0
50
100
Total Hospital Long-TermCare
Facility
AmbulatoryCare
Facility
UrbanLocation
RuralLocation
1-19Employees
20-49Employees
50-99Employees
100+Employees
Full-Time Openings Part-Time Openings
Employer Type Employer Location Employer Size
ARNP Openings by Demographics of Employer
Overview Survey participants were asked about openings, expected changes in employment, and recruitment issues for several different nursing titles. This section reviews the survey results in those areas for advanced registered nurse practitioners (ARNP). Each area is examined by employer type, employer location, and employer size. Analysis is given for each of the following roles: nurse practitioner (NP), certified registered nurse anesthetist (CRNA), clinical nurse specialist (CNS), and certified nurse midwife (CNM). Many subject areas, however, will require that data for all four of these titles be aggregated in order to conduct analysis.
Advanced Registered Nurse Practitioners
18
1.6%
0.8%
1.1%
1.0%
0.7%
1.7%
2.3%
0.0%
1.8%
1.1%
0.0%
0.2%
0.7%
0.9%
0.5%
0.5%
0.5%
0.4%
0.0%
0.4%
98.4%
99.1%
98.2%
98.1%
98.9%
97.8%
97.2%
99.6%
98.2%
98.5%
0% 20% 40% 60% 80% 100%
100+ Employees
50-99 Employees
20-49 Employees
1-19 Employees
Rural Location
Urban Location
Ambulatory Care Facility
Long-Term Care Facility
Hospital
Total (All Respondents)
Increase Decrease Remain Stable
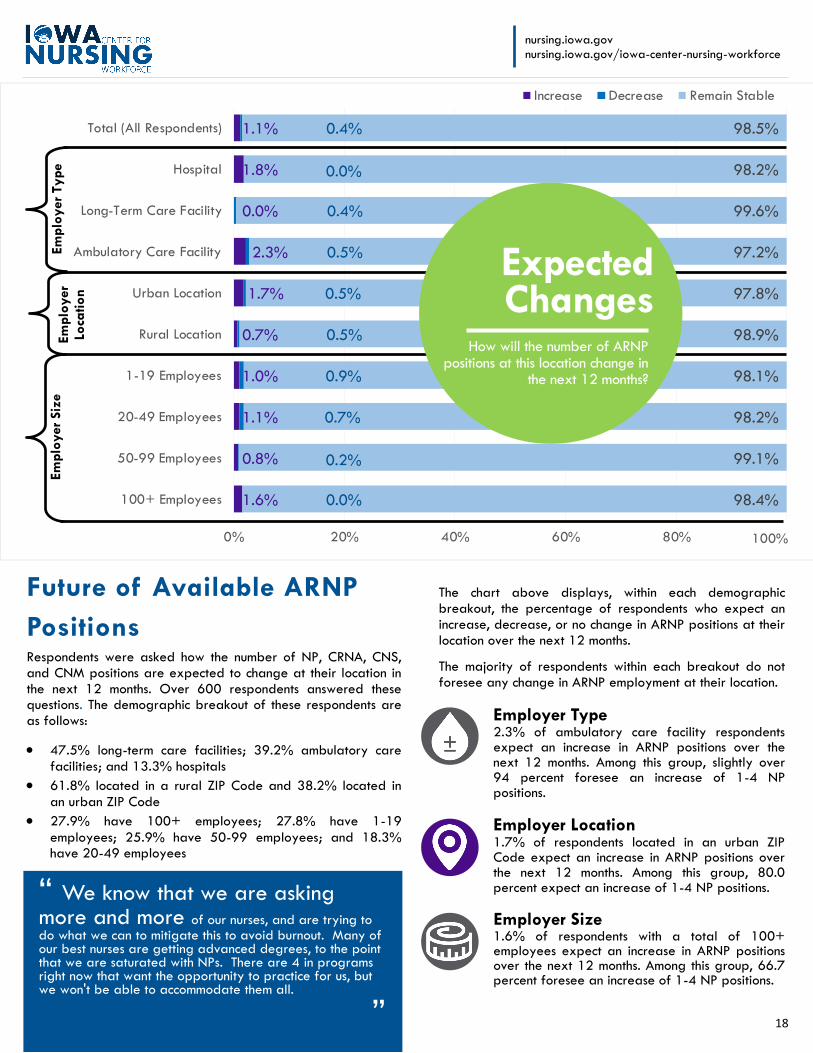
“ We know that we are asking more and more of our nurses, and are trying to do what we can to mitigate this to avoid burnout. Many of our best nurses are getting advanced degrees, to the point that we are saturated with NPs. There are 4 in programs right now that want the opportunity to practice for us, but we won't be able to accommodate them all.
”
Future of Available ARNP
Positions Respondents were asked how the number of NP, CRNA, CNS, and CNM positions are expected to change at their location in the next 12 months. Over 600 respondents answered these questions. The demographic breakout of these respondents are as follows:
47.5% long-term care facilities; 39.2% ambulatory care facilities; and 13.3% hospitals
61.8% located in a rural ZIP Code and 38.2% located in an urban ZIP Code
27.9% have 100+ employees; 27.8% have 1-19
employees; 25.9% have 50-99 employees; and 18.3% have 20-49 employees
The chart above displays, within each demographic breakout, the percentage of respondents who expect an increase, decrease, or no change in ARNP positions at their location over the next 12 months.
The majority of respondents within each breakout do not foresee any change in ARNP employment at their location.
Employer Type 2.3% of ambulatory care facility respondents expect an increase in ARNP positions over the next 12 months. Among this group, slightly over 94 percent foresee an increase of 1-4 NP positions.
Employer Location 1.7% of respondents located in an urban ZIP Code expect an increase in ARNP positions over the next 12 months. Among this group, 80.0 percent expect an increase of 1-4 NP positions.
Employer Size 1.6% of respondents with a total of 100+ employees expect an increase in ARNP positions over the next 12 months. Among this group, 66.7 percent foresee an increase of 1-4 NP positions.
$
Em
plo
yer
Type
Em
plo
yer
Lo
cation
Em
plo
yer
Siz
e
100%
Expected Changes
How will the number of ARNP positions at this location change in
the next 12 months?
nursing.iowa.gov nursing.iowa.gov/iowa-center-nursing-workforce

19
Ease of Recruiting &
Hiring ARNPs Respondents were asked to rate their experience with recruiting and hiring ARNPs at their location. Respondents rated their experience from very easy to
very difficult.
There were a total of 312 respondents that provided
a rating. The results are broken out below.
Very Easy Somewhat Easy Neither Easy nor Difficult Somewhat Difficult Very Difficult
DIFFICULT
Timeline to Fill Openings Respondents were asked to indicate the average number of days it takes their location to fill open
positions for ARNPs.
A total of 224 respondents answered this question.
The results are provided below.
1-30 Days 31-60 Days 61-90 Days Greater than 90 Days
The majority of respondents (35.7%) indicated it took them more than 90 days to fill an ARNP opening. The next greatest percentage of respondents (30.4%) reported that it averaged 31-60 days to fill an opening.
4.2
21.8
31.1
29.8
13.1
% RATING
26.0%
42.9%
EASY
% AVERAGE TIMEFRAME
9.8
30.4
24.1
35.7
Certified Registered Nurse Anesthetist
Nurse Practitioner
Hired ARNPs Respondents were asked how many NPs, CRNAs, CNS, and CNMs were hired at their location in the last 12 months. Overall results are given below.
196 full-time NPs, 15 full-time CRNAs, 2 full-time CNS, and
3 full-time CNMs were hired
45 part-time NPs, 4 part-time CRNAs, 0 part-time CNS, and
3 part-time CNMs were hired
3 contract/travel NPs, 16 contract/travel CRNAs, 1
contract/travel CNS, and 7 contract/travel CNMs were
hired
Respondents were asked to provide wage information regarding their NP, CRNA, CNS, and CNM employees. Participating survey takers provided the entry-level hourly wage their location offers as well as their maximum hourly wage for these occupations. Additionally, respondents provided entry-level annual salaries and maximum annual salaries offered. Note: Too few respondents provided wage information for
Clinical Nurse Specialists (CNS); therefore, wage data is not available for this occupation.
Median Entry-Level Hourly Wage
$42.26 $79.75 $44.47
Median Maximum Hourly Wage
$62.00 $115.63 $65.69
Median Entry-Level Annual Salary
$91,760 $170,909 $90,502
Median Maximum Annual Salary
$126,880 $244,800 $126,056
“ Nursing programs are
graduating fewer nurses. Many nurses are going back to school for their Advanced Nurse Practice degrees and the market is becoming saturated. They do not consider post graduate degrees that lead to teaching, leadership positions, etc. This is unfortunate because we desperately need both. ”
Certified Nurse Midwife

20
$
[26.0%]
[10.6%]
[22.2%]
[37.3%]
[26.0%]
[25.8%]
[32.9%]
[2.1%]
[27.0%]
[21.8%]
27.9%
61.7%
16.7%
25.3%
34.9%
25.0%
20.8%
70.8%
27.8%
8.9%
[46.1%]
[27.7%]
[61.1%]
[37.3%]
[39.1%]
[49.2%]
[46.3%]
[27.1%]
[45.2%]
[69.3%]
0% 20% 40% 60% 80% 100%
100+ Employees
50-99 Employees
20-49 Employees
1-19 Employees
Rural Location
Urban Location
Ambulatory Care Facility
Long-Term Care Facility
Hospital
Total (All Respondents)
Very Easy Somewhat Easy Neither Somewhat Difficult Very Difficult
Employer Location Employer Size
Ease of Recruitment & Hiring by
Employer Demographics Survey respondents rated their experience with recruiting and hiring ARNPs at their location. The differences in ease of recruitment and hiring by employer demographics are
illustrated in the chart above. Employer Type Among employer types, respondents in ambulatory care have the hardest time recruiting and hiring NPs, CRNAs, CNS, and CNMs; with 46.3 percent rating the experience as “somewhat or very difficult.”
Employer Location Surprisingly, respondents located in an urban ZIP Code appear to have a more difficult time hiring and recruiting; with 49.2 percent rating their experience as “somewhat or very difficult.”
Employer Size Employers with 20-49 total employees appear to struggle the most among all employer sizes in hiring and recruiting NPs, CRNAs, CNS, and CNMs; with 61.1 percent rating their experience as “somewhat or very difficult.”
Timeline to Fill Openings The chart below provides information regarding the amount of time it takes a location to fill an ARNP opening, broken out by employer demographics. Long-term care facilities appear to have the hardest time filling these positions, with 54.5 percent
reporting it takes, on average, over 90 days.
Em
plo
yer
Type
Em
plo
yer
Lo
cation
Em
plo
yer
Siz
e
[ ] [ ]
9.8
%
10
.2%
10
.4%
8.7
%
10
.6%
9.3
%
12
.5%
13
.6%
8.9
%
30
.4%
25
.5%
45
.5%
33
.0%
42
.4%
22
.0% 38
.9%
16
.7% 31
.8%
29
.0%
24
.1%
28
.6%
22
.6% 2
6.1
%
22
.7% 20
.4%
25
.0%
31
.8%
24
.2%
35
.7%
35
.7%
54
.5%
33
.9%
22
.8%
44
.7%
31
.5%
45
.8%
22
.7%
37
.9%
0%
20%
40%
60%
80%
100%1-30 Days 31-60 Days 61-90 Days > 90 Days
Tota
l
Hosp
ital
Long
-Term
C
are
Faci
lity
Am
bula
tory
C
are
Faci
lity
Urb
an
Loca
tion
Rur
al Lo
cation
1-1
9 E
mplo
yees
20
-49
Em
plo
yees
50
-99
Em
plo
yees
10
0+
Em
plo
yees
Employer Type
nursing.iowa.gov nursing.iowa.gov/iowa-center-nursing-workforce
21
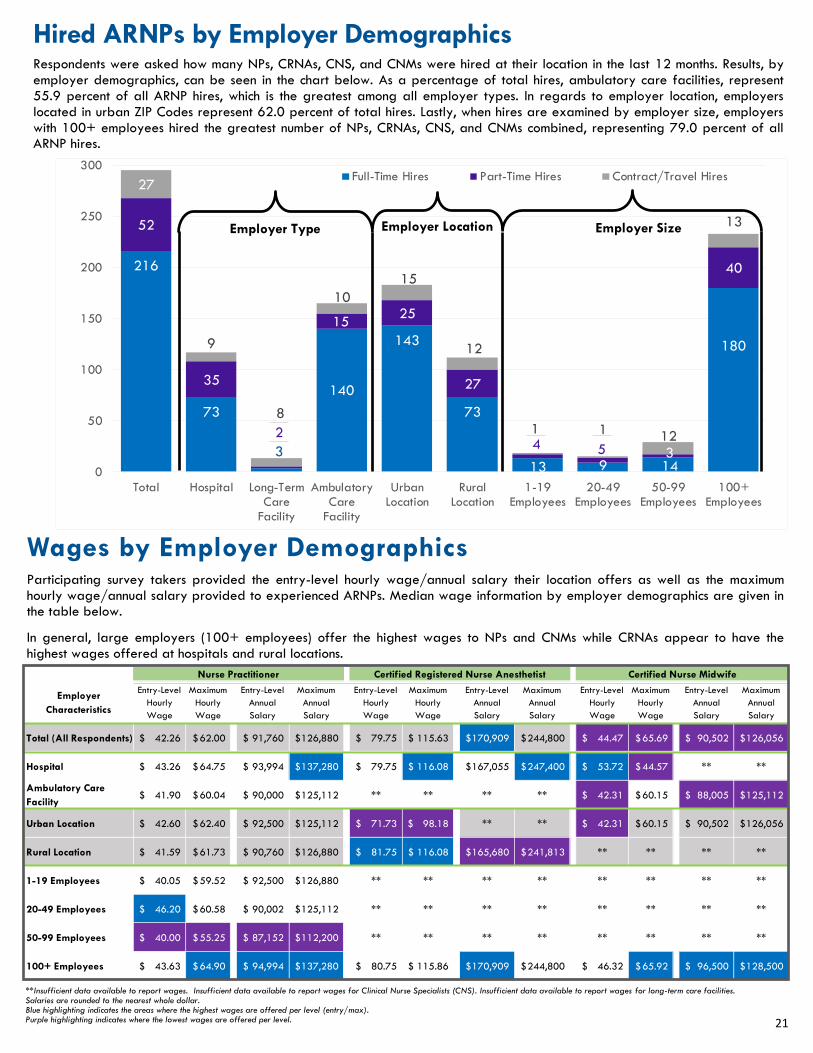
Hired ARNPs by Employer Demographics Respondents were asked how many NPs, CRNAs, CNS, and CNMs were hired at their location in the last 12 months. Results, by employer demographics, can be seen in the chart below. As a percentage of total hires, ambulatory care facilities, represent 55.9 percent of all ARNP hires, which is the greatest among all employer types. In regards to employer location, employers located in urban ZIP Codes represent 62.0 percent of total hires. Lastly, when hires are examined by employer size, employers with 100+ employees hired the greatest number of NPs, CRNAs, CNS, and CNMs combined, representing 79.0 percent of all ARNP hires.
216
73
3
140
143
73
13 9 14
180
52
35
2
1525
27
4 5 3
40
27
9
8
10
15
12
1 1 12
13
0
50
100
150
200
250
300
Total Hospital Long-TermCare
Facility
AmbulatoryCare
Facility
UrbanLocation
RuralLocation
1-19Employees
20-49Employees
50-99Employees
100+Employees
Full-Time Hires Part-Time Hires Contract/Travel Hires
Employer Type Employer Location Employer Size
Participating survey takers provided the entry-level hourly wage/annual salary their location offers as well as the maximum hourly wage/annual salary provided to experienced ARNPs. Median wage information by employer demographics are given in the table below.
In general, large employers (100+ employees) offer the highest wages to NPs and CNMs while CRNAs appear to have the highest wages offered at hospitals and rural locations.
Wages by Employer Demographics
Employer
Characteristics
Entry-Level
Hourly
Wage
Maximum
Hourly
Wage
Entry-Level
Annual
Salary
Maximum
Annual
Salary
Entry-Level
Hourly
Wage
Maximum
Hourly
Wage
Entry-Level
Annual
Salary
Maximum
Annual
Salary
Entry-Level
Hourly
Wage
Maximum
Hourly
Wage
Entry-Level
Annual
Salary
Maximum
Annual
Salary
Total (All Respondents) 42.26$ 62.00$ 91,760$ 126,880$ 79.75$ 115.63$ 170,909$ 244,800$ 44.47$ 65.69$ 90,502$ 126,056$
Hospital 43.26$ 64.75$ 93,994$ 137,280$ 79.75$ 116.08$ 167,055$ 247,400$ 53.72$ 44.57$ ** **
Ambulatory Care
Facility41.90$ 60.04$ 90,000$ 125,112$ ** ** ** ** 42.31$ 60.15$ 88,005$ 125,112$
Urban Location 42.60$ 62.40$ 92,500$ 125,112$ 71.73$ 98.18$ ** ** 42.31$ 60.15$ 90,502$ 126,056$
Rural Location 41.59$ 61.73$ 90,760$ 126,880$ 81.75$ 116.08$ 165,680$ 241,813$ ** ** ** **
1-19 Employees 40.05$ 59.52$ 92,500$ 126,880$ ** ** ** ** ** ** ** **
20-49 Employees 46.20$ 60.58$ 90,002$ 125,112$ ** ** ** ** ** ** ** **
50-99 Employees 40.00$ 55.25$ 87,152$ 112,200$ ** ** ** ** ** ** ** **
100+ Employees 43.63$ 64.90$ 94,994$ 137,280$ 80.75$ 115.86$ 170,909$ 244,800$ 46.32$ 65.92$ 96,500$ 128,500$
Nurse Practitioner Certified Registered Nurse Anesthetist Certified Nurse Midwife
**Insufficient data available to report wages. Insufficient data available to report wages for Clinical Nurse Specialists (CNS). Insufficient data available to report wages for long-term care facilities. Salaries are rounded to the nearest whole dollar. Blue highlighting indicates the areas where the highest wages are offered per level (entry/max). Purple highlighting indicates where the lowest wages are offered per level.

22
Section Five
Shortages, Recruiting, & Retention Employer Comparisons The first section of this report provided an overview of survey results regarding shortages and recruiting issues for nursing occupations in Iowa. This section provides a comparison of these same topics by employer type, employer location, and employer size; in order to determine if certain issues are more or less problematic for certain employers based upon these demographics. To begin with, survey respondents were asked: Is there a shortage of qualified job applicants for nursing positions? The chart below shows the percentage within each employer demographic that responded ‘yes’ to this question. Nearly four-fifths (78.4%) of long-term care facility respondents agreed there is a nursing shortage; while among small employers (1-19 employees) only 40.9 percent agreed there is a shortage.
74.7
%
78.4
%
50.0
%
64.3
%
69.0
%
40.9
%
68.2
% 78.1
%
78.1
%
0%
20%
40%
60%
80%
100%
Hospital Long-TermCare Facility
AmbulatoryCare Facility
UrbanLocation
RuralLocation
1-19Employees
20-49Employees
50-99Employees
100+Employees
13.8% 6.6% 11.2% 9.7% 8.5% 10.6% 3.4% 6.2%14.2%
35.4%36.7%
33.9% 40.6%32.9% 31.8% 46.6%
33.6%
33.1%
35.4%37.0% 33.9% 27.3% 41.0% 37.9% 26.1%
40.3%36.5%
15.4% 19.7% 21.0% 22.4% 17.6% 19.7% 23.9% 19.9% 16.2%
0%
20%
40%
60%
80%
100%
Hospital Long-TermCare Facility
AmbulatoryCare Facility
UrbanLocation
Rural Location 1-19Employees
20-49Employees
50-99Employees
100+Employees
Slight Moderate Great Extreme
Those that find that there is a current shortage were asked to define the degree. The breakout of the their responses, by employer demographics, is in the chart to the right.
With the exception of respondents located in urban ZIP Codes, over 50 percent of respondents in every other category characterized the shortage as either “great” or “extreme.” Over three-fifths (60.2%) of respondents whose location employs 50-99 employees reported the shortage as “great” or “extreme.”
“ I don’t understand where all the nurses are going in our area when they graduate. We have one large hospital and several long-term care/skilled nursing facilities but we are all working short staff with nurses…southeastern Iowa definitely has a shortage and it is not getting better. We are a stand alone facility and it is hard to keep up with the competition of higher paying facilities that are big/corporate also.
”

23
10.5%
11.6%
11.6%
25.6%
40.7%
55.8%
68.6%
0% 20% 40% 60% 80%
None of the Above
Promotion/Advancement
Professional Development
Replacing Retirees
Hiring New Employees
Turnover/Attrition
Finding Qualified Candidates
Hospital Long-Term Care Facility Ambulatory Care Facility
Urban Location Rural Location 1-19 Employees
20-49 Employees 50-99 Employees 100+ Employees
Finding Qualified Candidates Is the number one workforce challenge reported by each category of respondents, with the exception of small employers (with 1-19 employees) who indicated that none of the options provided represented their top workforce challenge. However, finding qualified candidates was this group’s second highest selected option, with 39.9% reporting it as a challenge.
Turnover/Attrition For nearly every category of respondents this is the second greatest workforce challenge, with 55.8 percent of respondents representing hospitals selecting it as an issue. However, for employers with 20-49 employees the second biggest issue is in hiring new employees; and ambulatory care facility respondents indicated that none of the options provided represented their second greatest challenge.
Hiring New Employees Due to cost, available budget, and competition the process and ability of hiring new employees is the third greatest workforce challenge reported among all categories of respondents. The two categories that had the greatest percentage of respondents rate this challenge were employers with 100+ employees (45.7%) and long-term care facilities (42.2%).
Workforce Challenges
“ I feel there is a challenge
of hiring new nurses for nursing facilities (I have heard this from student nurses). Colleges encourage students to work at hospitals or clinics. I have heard that they do not promote nursing facilities. I would like to see more clinical offers to nursing facilities; in turn we can enlighten students with the satisfied feeling and knowledge they can receive from working in a nursing facility (long-term, skilled, memory care, or assisted living).
”
Survey respondents were asked to identify what challenges
their location faces in regards to hiring and retaining their
nursing staff. Respondents were allowed to select multiple
challenges, as well as write-in responses.
The top challenges reported, by employer category, are
illustrated in the chart on this page. However, the top write-in
answers, which aren’t displayed, are the following:
Unable to get nurse candidates to work in a rural
location
Pay rates offered are not competitive
Candidates are unwilling to work evenings/weekends
Competition (i.e. being close to a large hospital)
$ LOCATION PAY COMPETITION HOURS/SHIFTS
nursing.iowa.gov nursing.iowa.gov/iowa-center-nursing-workforce
24
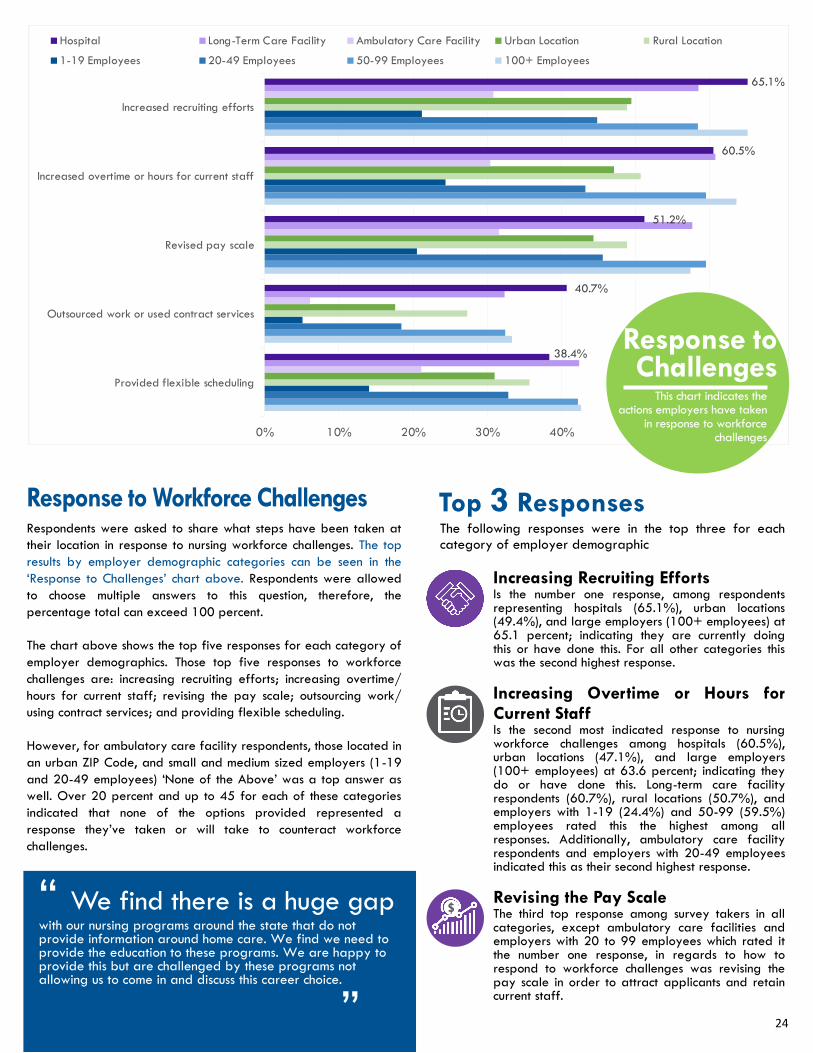
38.4%
40.7%
51.2%
60.5%
65.1%
0% 10% 20% 30% 40% 50% 60%
Provided flexible scheduling
Outsourced work or used contract services
Revised pay scale
Increased overtime or hours for current staff
Increased recruiting efforts
Hospital Long-Term Care Facility Ambulatory Care Facility Urban Location Rural Location
1-19 Employees 20-49 Employees 50-99 Employees 100+ Employees
Response to Challenges
This chart indicates the actions employers have taken
in response to workforce challenges
Respondents were asked to share what steps have been taken at
their location in response to nursing workforce challenges. The top
results by employer demographic categories can be seen in the
‘Response to Challenges’ chart above. Respondents were allowed
to choose multiple answers to this question, therefore, the
percentage total can exceed 100 percent.
The chart above shows the top five responses for each category of
employer demographics. Those top five responses to workforce
challenges are: increasing recruiting efforts; increasing overtime/
hours for current staff; revising the pay scale; outsourcing work/
using contract services; and providing flexible scheduling.
However, for ambulatory care facility respondents, those located in
an urban ZIP Code, and small and medium sized employers (1-19
and 20-49 employees) ‘None of the Above’ was a top answer as
well. Over 20 percent and up to 45 for each of these categories
indicated that none of the options provided represented a
response they’ve taken or will take to counteract workforce
challenges.
Top 3 Responses The following responses were in the top three for each category of employer demographic
Increasing Recruiting Efforts Is the number one response, among respondents representing hospitals (65.1%), urban locations (49.4%), and large employers (100+ employees) at 65.1 percent; indicating they are currently doing this or have done this. For all other categories this was the second highest response.
Increasing Overtime or Hours for Current Staff Is the second most indicated response to nursing workforce challenges among hospitals (60.5%), urban locations (47.1%), and large employers (100+ employees) at 63.6 percent; indicating they do or have done this. Long-term care facility respondents (60.7%), rural locations (50.7%), and employers with 1-19 (24.4%) and 50-99 (59.5%) employees rated this the highest among all responses. Additionally, ambulatory care facility respondents and employers with 20-49 employees indicated this as their second highest response.
Revising the Pay Scale The third top response among survey takers in all categories, except ambulatory care facilities and employers with 20 to 99 employees which rated it the number one response, in regards to how to respond to workforce challenges was revising the pay scale in order to attract applicants and retain current staff.
“ We find there is a huge gap
with our nursing programs around the state that do not provide information around home care. We find we need to provide the education to these programs. We are happy to provide this but are challenged by these programs not allowing us to come in and discuss this career choice. ”
$

25
By Employer Type
Hospital: A General Lack of Applicants 68.7% agreed or strongly agreed
Local Competition 67.5% agreed or strongly agreed
Lack of Qualified Applicants 58.3% agreed or strongly agreed
Long-Term Care: A General Lack of Applicants 83.0% agreed or strongly agreed
Local Competition 67.9% agreed or strongly agreed
Lack of Qualified Applicants 53.3% agreed or strongly agreed
Ambulatory Care: A General Lack of Applicants 50.7% agreed or strongly agreed
Expected Wages 47.7% agreed or strongly agreed
Local Competition 46.9% agreed or strongly agreed
By Employer Location
Urban: A General Lack of Applicants 67.1% agreed or strongly agreed
Local Competition 63.6% agreed or strongly agreed
Lack of Qualified Applicants 53.6% agreed or strongly agreed
Rural: A General Lack of Applicants 70.6% agreed or strongly agreed
Local Competition 58.1% agreed or strongly agreed
Lack of Qualified Applicants 50.3% agreed or strongly agreed
By Employer Size
1-19 Employees: A General Lack of Applicants 45.8% agreed or strongly agreed
Expected Wages 44.8% agreed or strongly agreed
Local Competition 43.0% agreed or strongly agreed
20-49 Employees: A General Lack of Applicants 67.8% agreed or strongly agreed
Lack of Qualified Applicants 54.3% agreed or strongly agreed
Local Competition 53.0% agreed or strongly agreed
50-99 Employees: A General Lack of Applicants 82.9% agreed or strongly agreed
Local Competition 67.6% agreed or strongly agreed
Lack of Qualified Applicants 56.9% agreed or strongly agreed
100+ Employees: A General Lack of Applicants 74.8% agreed or strongly agreed
Local Competition 70.6% agreed or strongly agreed
Lack of Qualified Applicants 54.7% agreed or strongly agreed
Top Difficulties Filling Positions by Employer Demographics Respondents were given a number of potential reasons their location may have difficulty filling nursing vacancies. They were
asked to rate these reasons from strongly agree to strongly disagree.
The top three reasons, in the graphic below, were those which had the greatest percentage of respondents agree or strongly
agree were difficulties in filling nursing openings. These results are broken out by employer demographics below.
$
$
“ The shortage is
being felt particularly hard
in long-term care and other non-acute care settings. The draw for new graduates is focused in the acute care setting; leaving the other areas with a severe and significant lack of qualified applicants. Nursing programs are limited in the number of applicants to the nursing programs and have long waiting lists; however, the graduating classes tend to be greatly reduced in number from the number that initially enrolled.
”
“ Wages are a
major concern for home
health strategists like myself. When competing for a dwindling pool of qualified candidates with major hospitals, it leaves the reimbursement structure of those companies that primarily utilize Medicaid funding in the lurch. We are looking at altering our recruitment strategies, to primarily focus on LPN acquisition and targeting older/seasoned nurses who are at or near retirement age, as the cares we provide are minute compared to our peers at hospitals or nursing homes. Our reimbursement structure allows us to be more competitive in these two areas and can entice them to make the jump to home health.
”
“ Due to the small
size of our facility and the private
ownership, our resources pale in comparison to the corporate machine.
” 25
nursing.iowa.gov nursing.iowa.gov/iowa-center-nursing-workforce
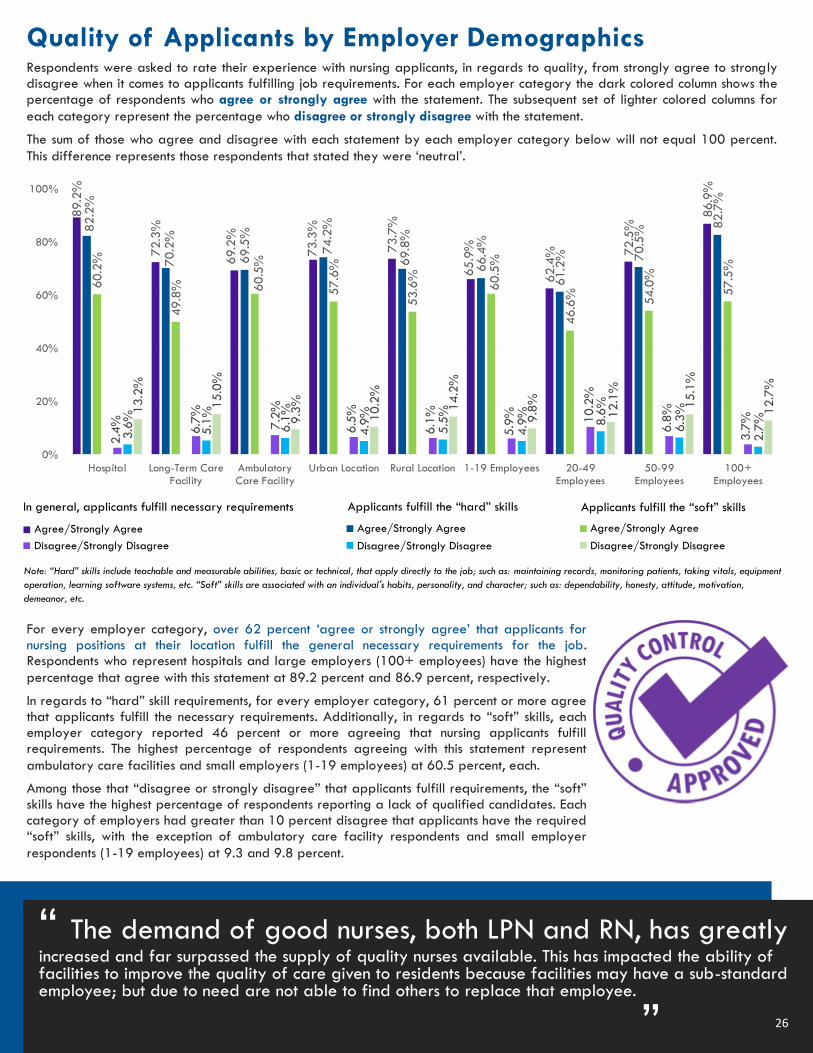
26
89.2
%
72.3
%
69.2
%
73.3
%
73.7
%
65.9
%
62.4
% 72.5
%
86.9
%
82.2
%
70.2
%
69.5
%
74.2
%
69.8
%
66.4
%
61.2
% 70.5
%
82.7
%
60.2
%
49.8
% 60.5
%
57.6
%
53.6
%
60.5
%
46.6
% 54.0
%
57.5
%
2.4
%
6.7
%
7.2
%
6.5
%
6.1
%
5.9
% 10.2
%
6.8
%
3.7
%
3.6
%
5.1
%
6.1
%
4.9
%
5.5
%
4.9
%
8.6
%
6.3
%
2.7
%
13.2
%
15.0
%
9.3
%
10.2
%
14.2
%
9.8
%
12.1
%
15.1
%
12.7
%
0%
20%
40%
60%
80%
100%
Hospital Long-Term CareFacility
AmbulatoryCare Facility
Urban Location Rural Location 1-19 Employees 20-49Employees
50-99Employees
100+Employees
Quality of Applicants by Employer Demographics Respondents were asked to rate their experience with nursing applicants, in regards to quality, from strongly agree to strongly disagree when it comes to applicants fulfilling job requirements. For each employer category the dark colored column shows the percentage of respondents who agree or strongly agree with the statement. The subsequent set of lighter colored columns for
each category represent the percentage who disagree or strongly disagree with the statement.
The sum of those who agree and disagree with each statement by each employer category below will not equal 100 percent.
This difference represents those respondents that stated they were ‘neutral’.
Note: “Hard” skills include teachable and measurable abilities, basic or technical, that apply directly to the job; such as: maintaining records, monitoring patients, taking vitals, equipment
operation, learning software systems, etc. “Soft” skills are associated with an individual's habits, personality, and character; such as: dependability, honesty, attitude, motivation,
demeanor, etc.
Agree/Strongly Agree
Disagree/Strongly Disagree
In general, applicants fulfill necessary requirements Applicants fulfill the “hard” skills
Agree/Strongly Agree
Disagree/Strongly Disagree
Applicants fulfill the “soft” skills
Agree/Strongly Agree
Disagree/Strongly Disagree
For every employer category, over 62 percent ‘agree or strongly agree’ that applicants for nursing positions at their location fulfill the general necessary requirements for the job. Respondents who represent hospitals and large employers (100+ employees) have the highest
percentage that agree with this statement at 89.2 percent and 86.9 percent, respectively.
In regards to “hard” skill requirements, for every employer category, 61 percent or more agree that applicants fulfill the necessary requirements. Additionally, in regards to “soft” skills, each employer category reported 46 percent or more agreeing that nursing applicants fulfill requirements. The highest percentage of respondents agreeing with this statement represent
ambulatory care facilities and small employers (1-19 employees) at 60.5 percent, each.
Among those that “disagree or strongly disagree” that applicants fulfill requirements, the “soft” skills have the highest percentage of respondents reporting a lack of qualified candidates. Each category of employers had greater than 10 percent disagree that applicants have the required “soft” skills, with the exception of ambulatory care facility respondents and small employer
respondents (1-19 employees) at 9.3 and 9.8 percent.
“ The demand of good nurses, both LPN and RN, has greatly
increased and far surpassed the supply of quality nurses available. This has impacted the ability of facilities to improve the quality of care given to residents because facilities may have a sub-standard employee; but due to need are not able to find others to replace that employee. ” 26
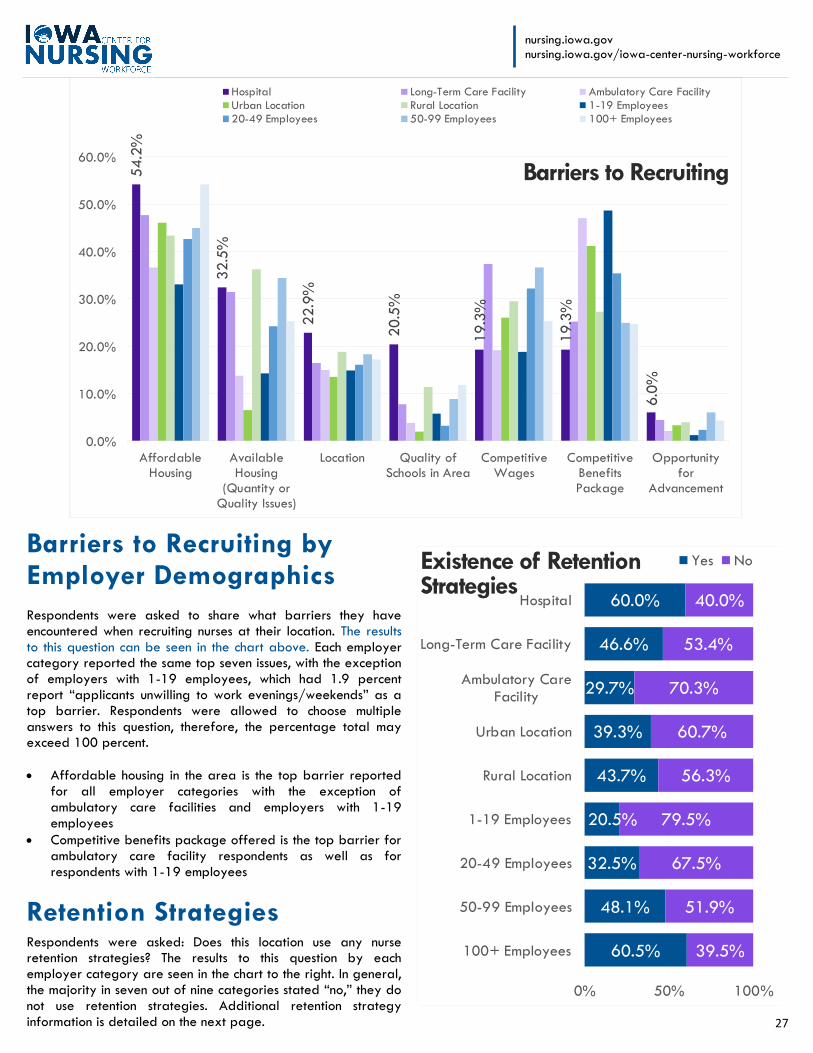
27
54.2
%
32.5
%
22.9
%
20.5
%
19.3
%
19.3
%
6.0
%
0.0%
10.0%
20.0%
30.0%
40.0%
50.0%
60.0%
AffordableHousing
AvailableHousing
(Quantity orQuality Issues)
Location Quality ofSchools in Area
CompetitiveWages
CompetitiveBenefitsPackage
Opportunityfor
Advancement
Hospital Long-Term Care Facility Ambulatory Care Facility
Urban Location Rural Location 1-19 Employees
20-49 Employees 50-99 Employees 100+ Employees
Barriers to Recruiting by Employer Demographics Respondents were asked to share what barriers they have encountered when recruiting nurses at their location. The results to this question can be seen in the chart above. Each employer category reported the same top seven issues, with the exception of employers with 1-19 employees, which had 1.9 percent report “applicants unwilling to work evenings/weekends” as a top barrier. Respondents were allowed to choose multiple answers to this question, therefore, the percentage total may exceed 100 percent.
Affordable housing in the area is the top barrier reported for all employer categories with the exception of ambulatory care facilities and employers with 1-19 employees
Competitive benefits package offered is the top barrier for ambulatory care facility respondents as well as for respondents with 1-19 employees
Retention Strategies Respondents were asked: Does this location use any nurse retention strategies? The results to this question by each employer category are seen in the chart to the right. In general, the majority in seven out of nine categories stated “no,” they do not use retention strategies. Additional retention strategy information is detailed on the next page.
Barriers to Recruiting
60.5%
48.1%
32.5%
20.5%
43.7%
39.3%
29.7%
46.6%
60.0%
39.5%
51.9%
67.5%
79.5%
56.3%
60.7%
70.3%
53.4%
40.0%
0% 50% 100%
100+ Employees
50-99 Employees
20-49 Employees
1-19 Employees
Rural Location
Urban Location
Ambulatory CareFacility
Long-Term Care Facility
Hospital
Yes NoExistence of Retention Strategies
nursing.iowa.gov nursing.iowa.gov/iowa-center-nursing-workforce

28
Retention Strategy Hospital
Long-Term
Care
Facility
Ambulatory
Care
Facility
Urban
Location
Rural
Location
1-19
Employees
20-49
Employees
50-99
Employees
100+
Employees
Shift Differential Pay 94.0% 74.0% 33.8% 60.8% 70.7% 26.7% 46.3% 74.7% 79.6%
Onboarding & Orientation 90.0% 69.3% 85.9% 87.6% 71.8% 86.7% 68.3% 69.0% 85.0%
Clean & Safe Work Environment 88.0% 83.3% 83.1% 88.7% 81.6% 86.7% 90.2% 75.9% 87.6%
A Culture of Open
Communication86.0% 84.0% 88.7% 89.7% 83.3% 93.3% 90.2% 83.9% 83.2%
Competitive Benefits 82.0% 61.3% 83.1% 77.3% 67.2% 73.3% 70.7% 60.9% 77.9%
Recognition & Rewards Systems 78.0% 60.7% 54.9% 64.9% 60.9% 46.7% 51.2% 59.8% 72.6%
Exit Interviews 76.0% 43.3% 66.2% 51.5% 57.5% 66.7% 48.8% 44.8% 62.8%
Competitive Wages 72.0% 76.7% 73.2% 73.2% 75.9% 66.7% 85.4% 71.3% 76.1%
Healthy Work/Life Balance 70.0% 69.3% 93.0% 84.5% 70.7% 96.7% 65.9% 72.4% 76.1%
Clear-cut Expectations & Policies 60.0% 50.0% 70.4% 56.7% 57.5% 66.7% 58.5% 57.5% 54.0%
Flexible Staffing 56.0% 57.3% 56.3% 48.5% 61.5% 53.3% 48.8% 66.7% 53.1%
Selective Hiring 52.0% 38.0% 40.8% 48.5% 37.4% 33.3% 31.7% 42.5% 46.0%
Meaningful Opportunities 46.0% 44.0% 42.3% 51.5% 39.7% 50.0% 31.7% 47.1% 44.2%
Nurse Residency Programs Survey participants were asked: Is there a nurse residency program offered to nurses at this location? To this question, an overwhelming percentage of respondents answered, ‘no’. By employer category, only two categories had less than 90 percent answer ‘no’ to this question.
67.1% of hospital respondents said they do not provide a nurse residency program; 32.9% said that they do
84.3% of respondents with 100+ employees said they do not provide a nurse residency program; 15.7% said that
they do
A follow-up question was asked of survey participants who answered that their location offers a nurse residency program. They were asked: How is this nurse residency program managed? For some employer category breakouts there was an insufficient number of responses to report results. The following outlines results for those with adequate responses for analysis.
HOSPITALS: 92.6% manage their nurse residency program; 7.4% have it managed by a third party
AMBULATORY CARE FACILITIES: 100% manage their nurse residency program
URBAN LOCATIONS: 100% manage their nurse residency program
RURAL LOCATIONS: 76.5% manage their nurse residency program; 23.5% have it managed by a third party
1-19 EMPLOYEES: 100% manage their nurse residency program
100+ EMPLOYEES: 89.3% manage their nurse residency program; 10.7% have it managed by a third party
Retention Strategies by Employer Demographics Survey participants who indicated that they do employ retention strategies for nursing employees were asked to indicate which
strategies they use. The results are in the table below broken out by each employer category. The top 13 results for each area
are presented. The table is sorted high-to-low for the hospital category; however, the number one answer for each category is
highlighted green. The strategies of ‘quarterly reviews’ (40.0%) and ‘mentorship programs’ (30.0%) were among the top
strategies reported for employers with 1-19 employees but are not represented in the following table.
“ Work life balance is a continuous struggle...
I think if this was kept in check we would have significantly less turnover. ” 28

29
Educational Support Provided Those respondents that indicated they provide support to their nursing staff to pursue education and training opportunities were asked what kind of support was provided. The chart below shows the top six response for each of the employer categories analyzed. The greatest percentage of respondents within each category reported “tuition reimbursement” as a mode of support they offer.
86.0%
51.2%
40.4%
45.5%
55.7%
36.7% 36.8%
50.8%
74.9%
14.0%
48.8%
59.6%
54.5%
44.3%
63.3% 63.2%
49.2%
25.1%
0%
10%
20%
30%
40%
50%
60%
70%
80%
90%
100%
Hospital Long-Term CareFacility
Ambulatory CareFacility
Urban Location Rural Location 1-19 Employees 20-49 Employees 50-99 Employees 100+ Employees
Yes No
36.2%
40.6%
44.9%
47.8%
66.7%
91.3%
0% 20% 40% 60% 80% 100%
Staff Promotes/Encourages Use ofPrograms for Additional Education/Training
Time-Off to Attend Training/Classes
Scholarships/Grants
Flexible Scheduling
Support from Leadership to PursueEducation/Training Opportunities
Tuition Reimbursement
Hospital Long-Term Care Facility Ambulatory Care Facility Urban Location Rural Location
1-19 Employees 20-49 Employees 50-99 Employees 100+ Employees
Education Support
Is support provided to nurses at this location to achieve
advanced degrees and/or certifications?
nursing.iowa.gov nursing.iowa.gov/iowa-center-nursing-workforce
30
nursing.iowa.gov nursing.iowa.gov/iowa-center-nursing-workforce
Highlights and Recognitions _______________________________________________________________________________________________________
Survey Highlights
Nearly three-fifths (58.5%) of respondents reported a shortage of qualified applicants for the needed nursing positions.
Nearly 80% of long-term care facilities agree there is a nursing shortage; while among small employers (1-19 employees)
only 40.9% agree there is a shortage.
The greatest reason cited as a workforce challenge is difficulty finding qualified candidates with turnover/attrition cited as
the second greatest workforce challenge.
To meet workforce challenges, employers have increased overtime for staff, increased recruiting efforts, revised pay scales,
provided flexible scheduling or outsourced work or used contract services.
The top difficulties filling vacancies are reported as a general lack of applicants by over two-thirds (69.2%) of the
respondents.
Barriers for recruiting are competitive wages and benefits, location of the job opening, or opportunities for advancement.
Additional reasons include candidates are unwilling to work evenings and/or weekend, candidates lack experience in
specialized area.
Retirements are top of mind for many employers with an increase seen in the last 12 months and over 550 nurses who are
eligible to retire in the next year.
When asked about the ease of recruiting and hiring over 80% of respondents considered it somewhat to very difficult to hire
LPNs and RNs; for ARNPs, 43% of respondents said it was difficult to hire.
Approximately one-third of all respondents reported it takes on average over 90 days to hire LPNs, RNs, and ARNPs in the
state.
With the exception of respondents located in urban zip codes, over 50% of respondents in every other category
characterized the shortage as either “great” or “extreme.” Likewise, over 60% of respondents whose location employs 50 –
99 employees reported the shortage as “great” or “extreme.”
In summary, nurse workforce challenges exist throughout the state of Iowa and across all locations, all facility types and all
employer sizes. This demand survey report provides a statistical snapshot that Iowa employers want to hire more nurses – yet the
supply of nurses is lacking. Nursing supply data is analyzed in the Iowa Board of Nursing’s Trends in Nursing report, which is
typically published every three years. Until such time as the demand and supply data can be combined, the data supplied in this
report is largely descriptive in nature. The limitations of this report include the year in which the data was gathered (2020) and
under the conditions of a worldwide pandemic. It will take the work of all nurse workforce stakeholders to solve the recruitment
and retention problems illustrated and reported here.
Recognitions
The Iowa Board of Nursing would like to thank the Iowa Center for Nursing Workforce Advisory Committee members for their
input and advice in the development of the Center’s first demand survey. Additionally, the Iowa Board of Nursing staff are
grateful for the assistance, direction and technical assistance provided by the Labor Market Information Division of Iowa
Workforce Development under the leadership of Ryan Murphy, Bureau Chief.
Lastly, the Iowa Board of Nursing is thankful to all employers who participated in this survey; allowing us to more clearly see the
issues involved in the demand for nursing staff across the state of Iowa.
Report Authors:
Katie Lippold, Labor Market Research Economist, Iowa Workforce Development
Laura R. Hudson, MSN, RN, Associate Director, Iowa Board of Nursing
Suggested Citation: Iowa Center for Nursing Workforce. (2021). Iowa nursing demand survey report (Released April 2021). Des Moines, Iowa: Iowa
Board of Nursing. https://nursing.iowa.gov/iowa-center-for-nursing-workforce

For more information contact: Iowa Board of Nursing Laura R. Hudson, MSN, RN Associate Director 515.281.3255 [email protected] nursing.iowa.gov