Embed Size (px)
Citation preview

CHAPTER 3
AFFECTED ENVIRONMENT

This page intentionally left blank
Chapter 3 Affected Environment
A-1 Flow Equalization Basin 3-1 February 2013 Draft Environmental Impact Statement
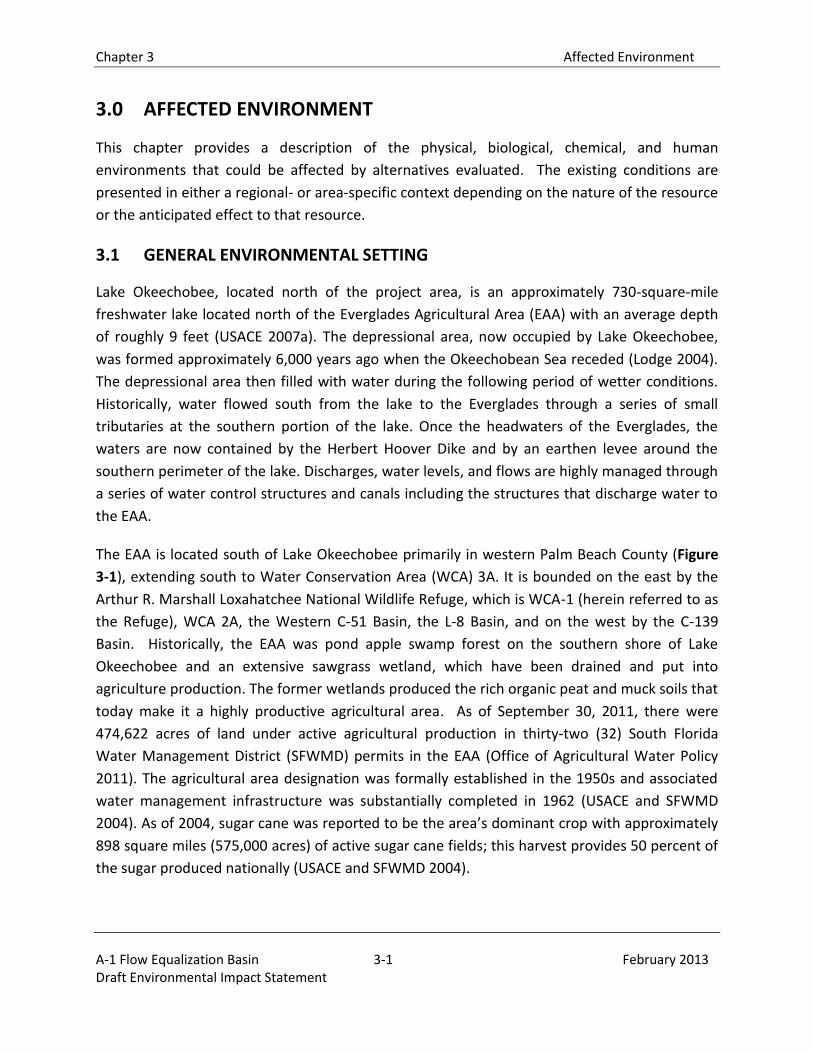
3.0 AFFECTED ENVIRONMENT
This chapter provides a description of the physical, biological, chemical, and human
environments that could be affected by alternatives evaluated. The existing conditions are
presented in either a regional- or area-specific context depending on the nature of the resource
or the anticipated effect to that resource.
3.1 GENERAL ENVIRONMENTAL SETTING
Lake Okeechobee, located north of the project area, is an approximately 730-square-mile
freshwater lake located north of the Everglades Agricultural Area (EAA) with an average depth
of roughly 9 feet (USACE 2007a). The depressional area, now occupied by Lake Okeechobee,
was formed approximately 6,000 years ago when the Okeechobean Sea receded (Lodge 2004).
The depressional area then filled with water during the following period of wetter conditions.
Historically, water flowed south from the lake to the Everglades through a series of small
tributaries at the southern portion of the lake. Once the headwaters of the Everglades, the
waters are now contained by the Herbert Hoover Dike and by an earthen levee around the
southern perimeter of the lake. Discharges, water levels, and flows are highly managed through
a series of water control structures and canals including the structures that discharge water to
the EAA.
The EAA is located south of Lake Okeechobee primarily in western Palm Beach County (Figure
3-1), extending south to Water Conservation Area (WCA) 3A. It is bounded on the east by the
Arthur R. Marshall Loxahatchee National Wildlife Refuge, which is WCA-1 (herein referred to as
the Refuge), WCA 2A, the Western C-51 Basin, the L-8 Basin, and on the west by the C-139
Basin. Historically, the EAA was pond apple swamp forest on the southern shore of Lake
Okeechobee and an extensive sawgrass wetland, which have been drained and put into
agriculture production. The former wetlands produced the rich organic peat and muck soils that
today make it a highly productive agricultural area. As of September 30, 2011, there were
474,622 acres of land under active agricultural production in thirty-two (32) South Florida
Water Management District (SFWMD) permits in the EAA (Office of Agricultural Water Policy
2011). The agricultural area designation was formally established in the 1950s and associated
water management infrastructure was substantially completed in 1962 (USACE and SFWMD
2004). As of 2004, sugar cane was reported to be the area’s dominant crop with approximately
898 square miles (575,000 acres) of active sugar cane fields; this harvest provides 50 percent of
the sugar produced nationally (USACE and SFWMD 2004).
Chapter 3 Affected Environment
A-1 Flow Equalization Basin 3-2 February 2013 Draft Environmental Impact Statement
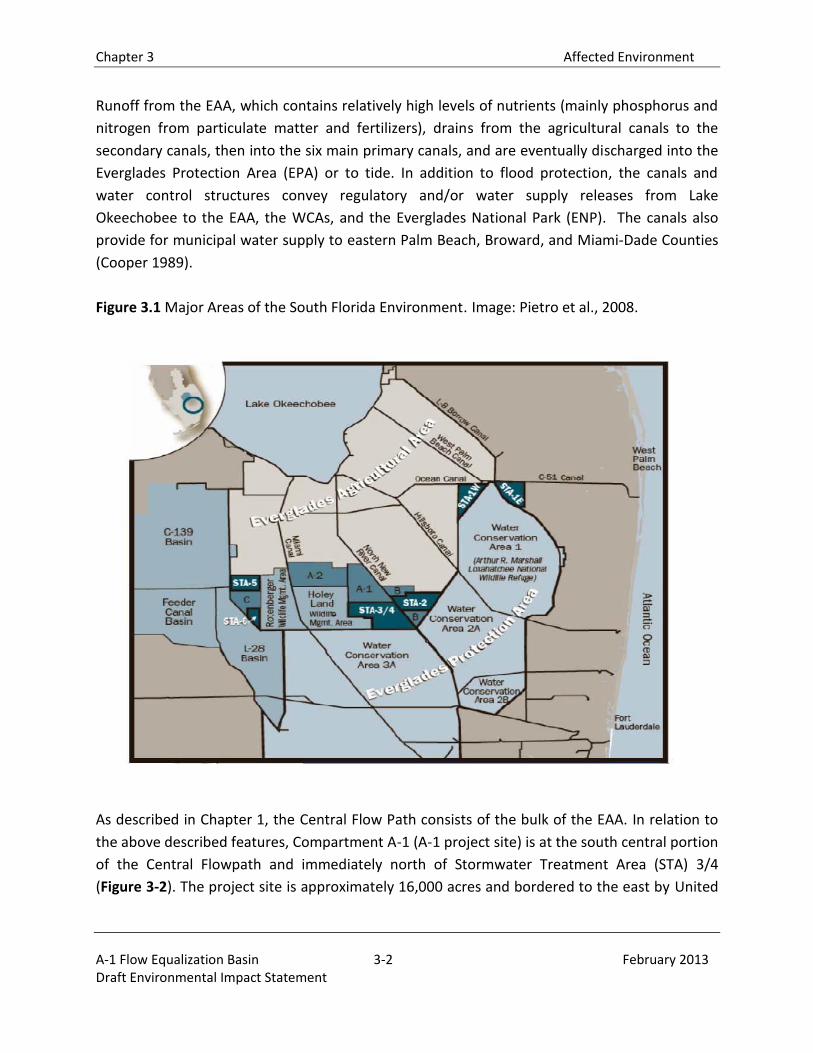
Runoff from the EAA, which contains relatively high levels of nutrients (mainly phosphorus and
nitrogen from particulate matter and fertilizers), drains from the agricultural canals to the
secondary canals, then into the six main primary canals, and are eventually discharged into the
Everglades Protection Area (EPA) or to tide. In addition to flood protection, the canals and
water control structures convey regulatory and/or water supply releases from Lake
Okeechobee to the EAA, the WCAs, and the Everglades National Park (ENP). The canals also
provide for municipal water supply to eastern Palm Beach, Broward, and Miami-Dade Counties
(Cooper 1989).
Figure 3.1 Major Areas of the South Florida Environment. Image: Pietro et al., 2008.
As described in Chapter 1, the Central Flow Path consists of the bulk of the EAA. In relation to
the above described features, Compartment A-1 (A-1 project site) is at the south central portion
of the Central Flowpath and immediately north of Stormwater Treatment Area (STA) 3/4
(Figure 3-2). The project site is approximately 16,000 acres and bordered to the east by United
Chapter 3 Affected Environment
A-1 Flow Equalization Basin 3-3 February 2013 Draft Environmental Impact Statement
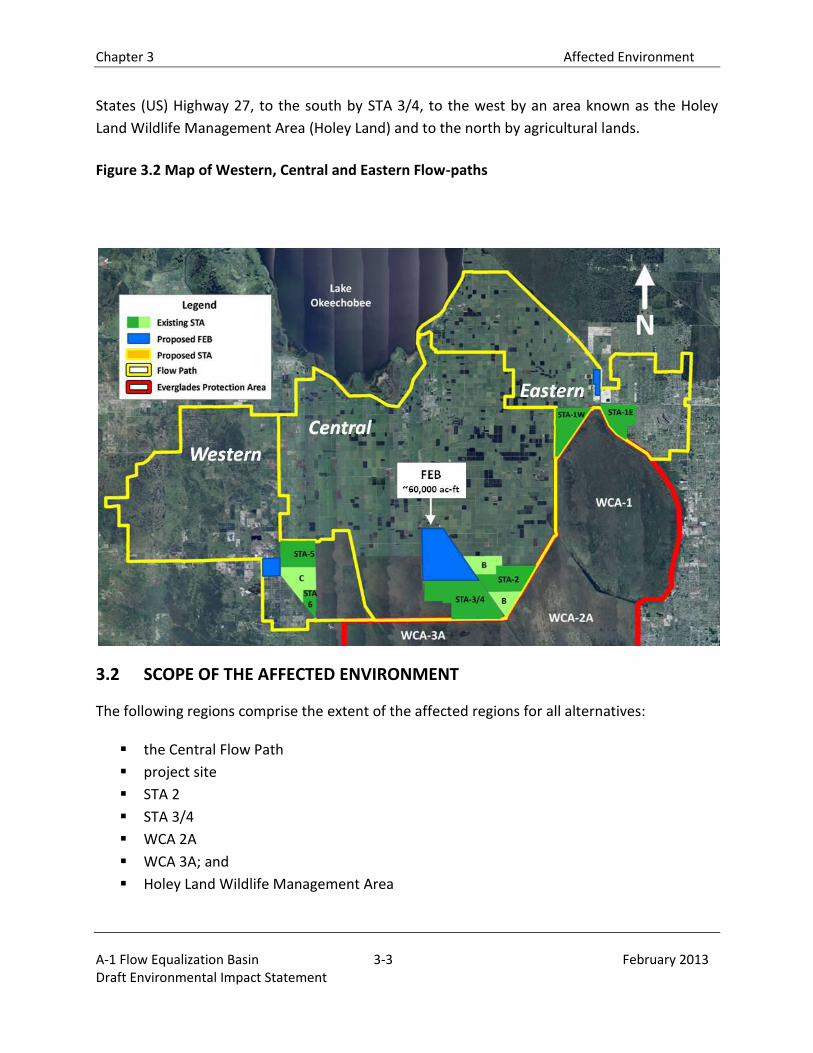
States (US) Highway 27, to the south by STA 3/4, to the west by an area known as the Holey
Land Wildlife Management Area (Holey Land) and to the north by agricultural lands.
Figure 3.2 Map of Western, Central and Eastern Flow-paths
3.2 SCOPE OF THE AFFECTED ENVIRONMENT
The following regions comprise the extent of the affected regions for all alternatives:
the Central Flow Path
project site
STA 2
STA 3/4
WCA 2A
WCA 3A; and
Holey Land Wildlife Management Area
Chapter 3 Affected Environment
A-1 Flow Equalization Basin 3-4 February 2013 Draft Environmental Impact Statement
The physical, biological, chemical, and human environments of those areas that may be
affected include land use; geology, topography, and soils; hydrology to include surface water
and ground water hydrology; water quality; climate; vegetation and cover types; threatened
and endangered species; fish and wildlife species; aesthetics; cultural, historic and
archaeological resources; socioeconomics; environmental justice; recreation; hazardous and
toxic wastes; and flood protection. The spatial extent of the effect for each components
described in this chapter varies based on the geographic extent of effects on the environment
being described and will be addressed by topic.
Areas not considered as part of the affected environment include Lake Okeechobee, C-139
Basin, and the Rotenberger Wildlife Management Area since the No Action Alternatives and the
Action Alternatives would have no effect on these areas.
3.3 LAND USE
The general pattern of land use within the region of South Florida consists of an expanding zone
of urban development within the coastal strip adjacent to the Atlantic Ocean; a large area
dominated by intensive agricultural use east, south, and west of Lake Okeechobee; and a band
of largely undeveloped land within the EPA. The following discussion addresses existing land
use patterns within the project site, the STAs and other areas including the WCAs and the Holey
Land.
3.3.1 PROJECT SITE
SFWMD acquired title to approximately 50,000 acres of land in March 1999 pursuant to Grant
Agreement FB-4 with the United States Fish and Wildlife Service (USFWS)/Department of the
Interior (DOI). The approximately 50,000 acres of land acquisition included the 16,000-acre A-1
project site. The SFWMD has managed the A-1 property under agricultural leases prior to the
land being utilized for a restoration project. A project to construct a reservoir on the A-1
project site was included in the Comprehensive Environmental Restoration Plan (CERP) as it was
designed to improve the quantity, quality, timing and delivery of water in the Everglades. The
reservoir would have provided water storage in order to improve timing of water deliveries
from the EAA to the WCAs, reduce Lake Okeechobee regulatory releases to the estuaries, meet
supplemental agricultural irrigation demands, and increase flood protection within the EAA. In
2006, SFWMD was given Department of the Army (DA) authorization to construct the reservoir
on the A-1 project site. USFWS/DOI provided approval for the interim land use change for
construction of the reservoir.
Chapter 3 Affected Environment
A-1 Flow Equalization Basin 3-5 February 2013 Draft Environmental Impact Statement
3.3.2 STORMWATER TREATMENT AREAS
STA 2 (including Compartment B) and STA 3/4 were constructed and are being operated to
provide water quality improvement in discharges to the EPA. Physical features within the
existing STAs include the constructed wetlands and the associated water management
infrastructure (such as levees, canals, and water control structures). Land cover within the STAs
is primarily a mixture of open water, emergent, and submergent marshes. Land use for these
areas can be classified as public/institutional or conservation. To varying degrees, the STAs also
support ancillary recreational uses such as hunting, fishing, and wildlife viewing.
3.3.3 WATER CONSERVATION AREAS AND HOLEY LAND WILDLIFE MANAGEMENT AREA
Within the Central Flowpath, WCAs 2 and 3 abut the southern boundaries of the EAA (Figure 3-
2). WCAs 2A and 3A were designated primarily to receive flood waters from adjacent areas and
store the waters for beneficial municipal, urban, and agricultural uses; however, they are
currently managed for multiple uses including flood protection, water supply storage, and
environmental resource protection. The Holey Land is another parcel of land that was also
managed for flood protection, water supply storage, and environmental resource protection.
However, since 2008, no inflow or outflows have occurred in the Holey Land and the area is
currently managed for environmental resource purposes. The Florida Fish and Wildlife
Conservation Commission (FWCC) currently manages the fish and wildlife in the WCAs and the
Holey Land.
3.4 GEOLOGY, TOPOGRAPHY, AND SOILS
3.4.1 GEOLOGY
At the project site, the upper carbonate sand and limestone constitutes the Fort Thompson
Formation. Below this, shelly sand and sparse limestone constitutes the Caloosahatchee
Formation and possibly part of the Tamiami Formation. The top of the Fort Thompson
Formation consists of a hard limestone layer about four and a half to five feet thick, which is
locally called caprock. The caprock is generally white, light gray, tan or yellowish brown. The
caprock is underlain by silty carbonate sand extending to about 23.5 to 24.5 feet deep, where
another hard limestone layer one and a half feet to three feet thick is encountered. A thinner,
hard limestone layer about one half foot to one foot thick is often encountered at around 16 to
17 feet deep. The sand and lower limestone layers are generally white to very pale brown.
Laboratory testing of the sand sampled in the borings averaged 84.2 percent calcium carbonate
content with an average of 22 percent passing the #200 sieve in gradation tests. Visual
Chapter 3 Affected Environment
A-1 Flow Equalization Basin 3-6 February 2013 Draft Environmental Impact Statement
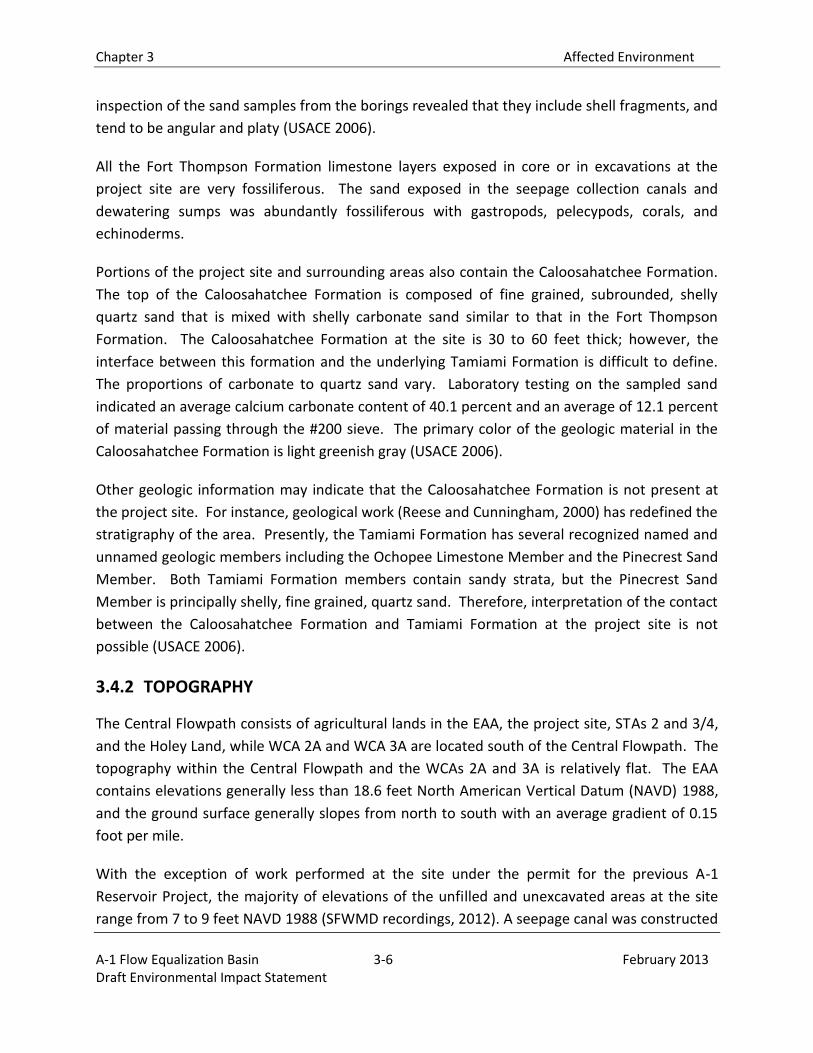
inspection of the sand samples from the borings revealed that they include shell fragments, and
tend to be angular and platy (USACE 2006).
All the Fort Thompson Formation limestone layers exposed in core or in excavations at the
project site are very fossiliferous. The sand exposed in the seepage collection canals and
dewatering sumps was abundantly fossiliferous with gastropods, pelecypods, corals, and
echinoderms.
Portions of the project site and surrounding areas also contain the Caloosahatchee Formation.
The top of the Caloosahatchee Formation is composed of fine grained, subrounded, shelly
quartz sand that is mixed with shelly carbonate sand similar to that in the Fort Thompson
Formation. The Caloosahatchee Formation at the site is 30 to 60 feet thick; however, the
interface between this formation and the underlying Tamiami Formation is difficult to define.
The proportions of carbonate to quartz sand vary. Laboratory testing on the sampled sand
indicated an average calcium carbonate content of 40.1 percent and an average of 12.1 percent
of material passing through the #200 sieve. The primary color of the geologic material in the
Caloosahatchee Formation is light greenish gray (USACE 2006).
Other geologic information may indicate that the Caloosahatchee Formation is not present at
the project site. For instance, geological work (Reese and Cunningham, 2000) has redefined the
stratigraphy of the area. Presently, the Tamiami Formation has several recognized named and
unnamed geologic members including the Ochopee Limestone Member and the Pinecrest Sand
Member. Both Tamiami Formation members contain sandy strata, but the Pinecrest Sand
Member is principally shelly, fine grained, quartz sand. Therefore, interpretation of the contact
between the Caloosahatchee Formation and Tamiami Formation at the project site is not
possible (USACE 2006).
3.4.2 TOPOGRAPHY
The Central Flowpath consists of agricultural lands in the EAA, the project site, STAs 2 and 3/4,
and the Holey Land, while WCA 2A and WCA 3A are located south of the Central Flowpath. The
topography within the Central Flowpath and the WCAs 2A and 3A is relatively flat. The EAA
contains elevations generally less than 18.6 feet North American Vertical Datum (NAVD) 1988,
and the ground surface generally slopes from north to south with an average gradient of 0.15
foot per mile.
With the exception of work performed at the site under the permit for the previous A-1
Reservoir Project, the majority of elevations of the unfilled and unexcavated areas at the site
range from 7 to 9 feet NAVD 1988 (SFWMD recordings, 2012). A seepage canal was constructed
Chapter 3 Affected Environment
A-1 Flow Equalization Basin 3-7 February 2013 Draft Environmental Impact Statement
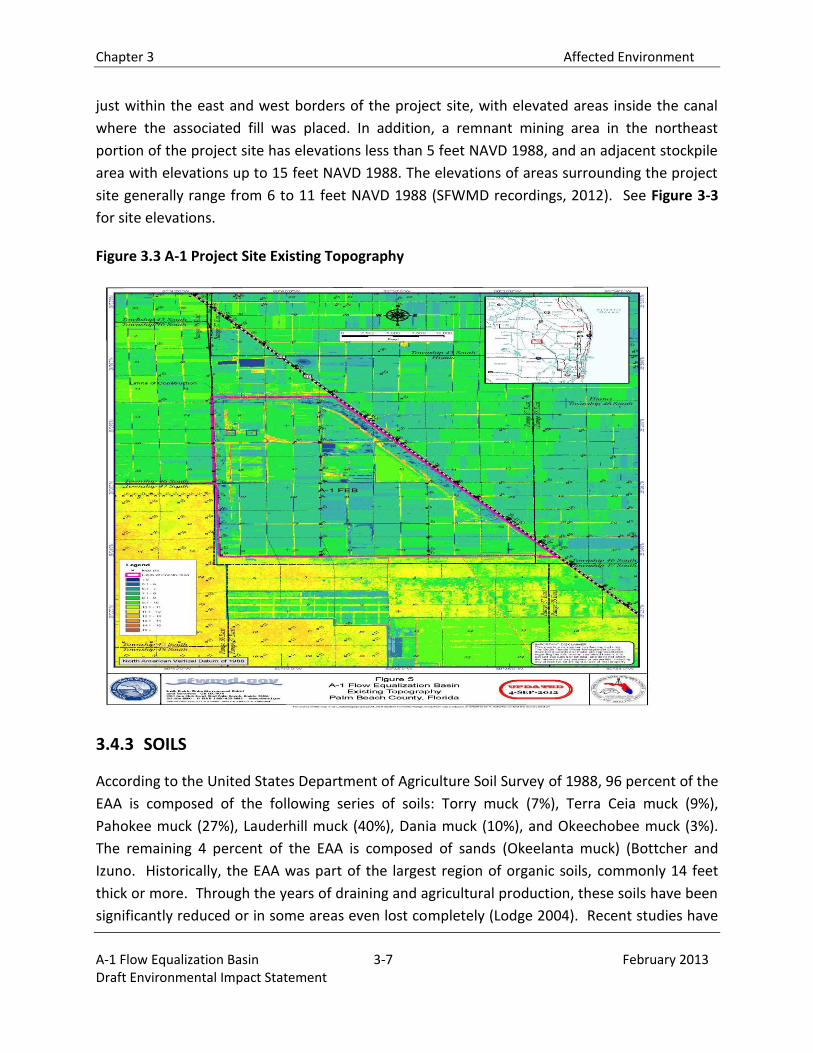
just within the east and west borders of the project site, with elevated areas inside the canal
where the associated fill was placed. In addition, a remnant mining area in the northeast
portion of the project site has elevations less than 5 feet NAVD 1988, and an adjacent stockpile
area with elevations up to 15 feet NAVD 1988. The elevations of areas surrounding the project
site generally range from 6 to 11 feet NAVD 1988 (SFWMD recordings, 2012). See Figure 3-3
for site elevations.
Figure 3.3 A-1 Project Site Existing Topography
3.4.3 SOILS
According to the United States Department of Agriculture Soil Survey of 1988, 96 percent of the
EAA is composed of the following series of soils: Torry muck (7%), Terra Ceia muck (9%),
Pahokee muck (27%), Lauderhill muck (40%), Dania muck (10%), and Okeechobee muck (3%).
The remaining 4 percent of the EAA is composed of sands (Okeelanta muck) (Bottcher and
Izuno. Historically, the EAA was part of the largest region of organic soils, commonly 14 feet
thick or more. Through the years of draining and agricultural production, these soils have been
significantly reduced or in some areas even lost completely (Lodge 2004). Recent studies have
Chapter 3 Affected Environment
A-1 Flow Equalization Basin 3-8 February 2013 Draft Environmental Impact Statement
been conducted on the subsidence of soils in the EAA, and it is projected that by 2050 nearly
half of the EAA will have less than 8 inches of soil, which means the soil elevation on average is
decreasing 0.6 inches a year (Snyder 2004).
The A-1 project site contains Pahokee muck (primarily in the southern portion of the site) and
Lauderhill muck (primarily in the northern portion of the site). Numerous soil borings, taken
from 50 to 100 feet below ground surface, were completed within the project site in December
2004 and January 2005. The borings generally penetrated through approximately one half to
two feet of surficial peat/muck and marl, then through 22 to 26 feet of primarily carbonate
sand and limestone, and then into primarily shelly quartz sand with sparse limestone to their
completed depths. The marl beneath the peat and muck is known by some authors as the Lake
Flirt Marl (Reese and Cunningham, 2000; Harvey et. al., 2002), but is undifferentiated from the
peat and muck layer for this EIS.
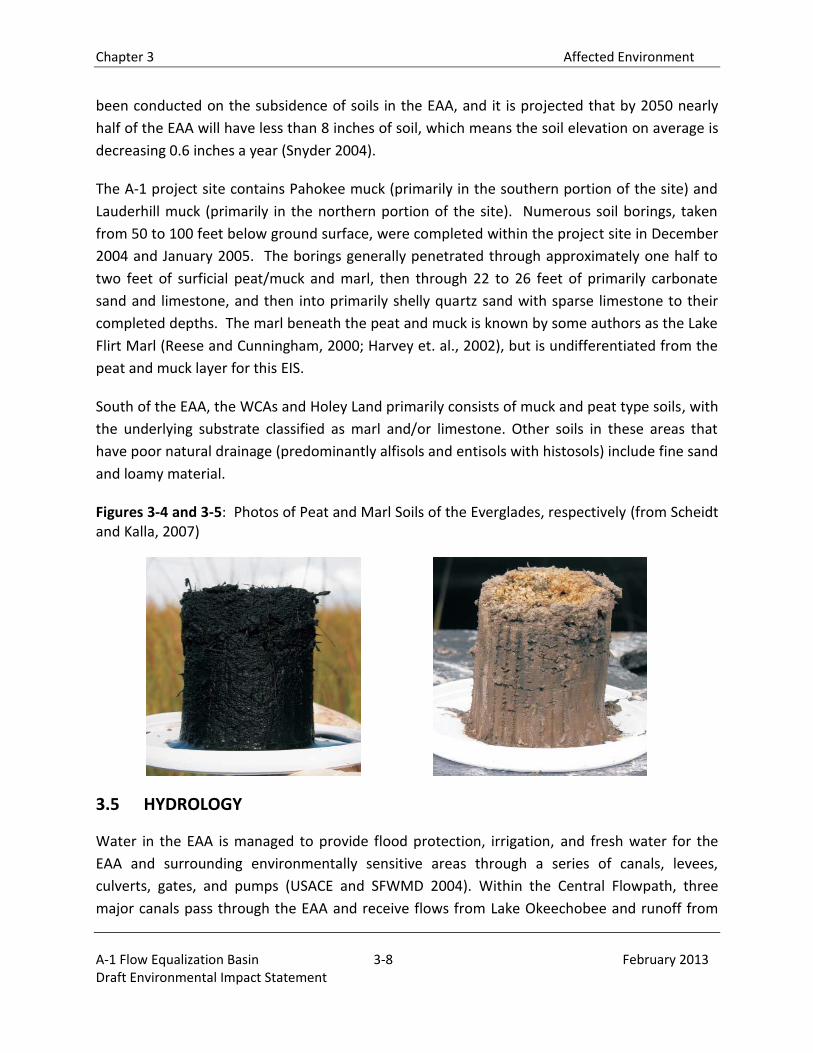
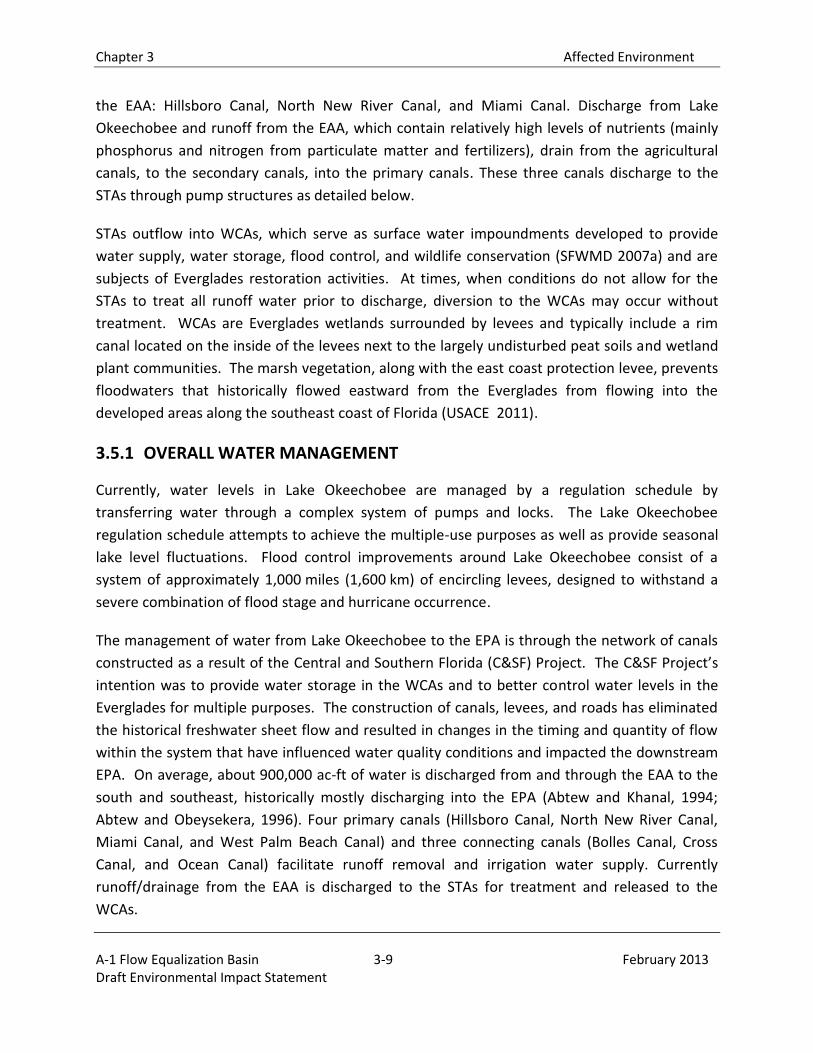
South of the EAA, the WCAs and Holey Land primarily consists of muck and peat type soils, with
the underlying substrate classified as marl and/or limestone. Other soils in these areas that
have poor natural drainage (predominantly alfisols and entisols with histosols) include fine sand
and loamy material.
Figures 3-4 and 3-5: Photos of Peat and Marl Soils of the Everglades, respectively (from Scheidt and Kalla, 2007)
3.5 HYDROLOGY
Water in the EAA is managed to provide flood protection, irrigation, and fresh water for the
EAA and surrounding environmentally sensitive areas through a series of canals, levees,
culverts, gates, and pumps (USACE and SFWMD 2004). Within the Central Flowpath, three
major canals pass through the EAA and receive flows from Lake Okeechobee and runoff from
Chapter 3 Affected Environment
A-1 Flow Equalization Basin 3-9 February 2013 Draft Environmental Impact Statement
the EAA: Hillsboro Canal, North New River Canal, and Miami Canal. Discharge from Lake
Okeechobee and runoff from the EAA, which contain relatively high levels of nutrients (mainly
phosphorus and nitrogen from particulate matter and fertilizers), drain from the agricultural
canals, to the secondary canals, into the primary canals. These three canals discharge to the
STAs through pump structures as detailed below.
STAs outflow into WCAs, which serve as surface water impoundments developed to provide
water supply, water storage, flood control, and wildlife conservation (SFWMD 2007a) and are
subjects of Everglades restoration activities. At times, when conditions do not allow for the
STAs to treat all runoff water prior to discharge, diversion to the WCAs may occur without
treatment. WCAs are Everglades wetlands surrounded by levees and typically include a rim
canal located on the inside of the levees next to the largely undisturbed peat soils and wetland
plant communities. The marsh vegetation, along with the east coast protection levee, prevents
floodwaters that historically flowed eastward from the Everglades from flowing into the
developed areas along the southeast coast of Florida (USACE 2011).
3.5.1 OVERALL WATER MANAGEMENT
Currently, water levels in Lake Okeechobee are managed by a regulation schedule by
transferring water through a complex system of pumps and locks. The Lake Okeechobee
regulation schedule attempts to achieve the multiple-use purposes as well as provide seasonal
lake level fluctuations. Flood control improvements around Lake Okeechobee consist of a
system of approximately 1,000 miles (1,600 km) of encircling levees, designed to withstand a
severe combination of flood stage and hurricane occurrence.
The management of water from Lake Okeechobee to the EPA is through the network of canals
constructed as a result of the Central and Southern Florida (C&SF) Project. The C&SF Project’s
intention was to provide water storage in the WCAs and to better control water levels in the
Everglades for multiple purposes. The construction of canals, levees, and roads has eliminated
the historical freshwater sheet flow and resulted in changes in the timing and quantity of flow
within the system that have influenced water quality conditions and impacted the downstream
EPA. On average, about 900,000 ac-ft of water is discharged from and through the EAA to the
south and southeast, historically mostly discharging into the EPA (Abtew and Khanal, 1994;
Abtew and Obeysekera, 1996). Four primary canals (Hillsboro Canal, North New River Canal,
Miami Canal, and West Palm Beach Canal) and three connecting canals (Bolles Canal, Cross
Canal, and Ocean Canal) facilitate runoff removal and irrigation water supply. Currently
runoff/drainage from the EAA is discharged to the STAs for treatment and released to the
WCAs.
Chapter 3 Affected Environment
A-1 Flow Equalization Basin 3-10 February 2013 Draft Environmental Impact Statement
The WCAs are regulated for the Congressionally-authorized C&SF project purposes to provide
flood control; water supply for agricultural irrigation, municipalities and industry, and ENP;
regional groundwater control and prevention of saltwater intrusion; enhancement of fish and
wildlife; and recreation (USACE 2011). The WCAs are managed using the Everglades
Restoration Transition Plan (ERTP). ERTP superseded the 2006 Interim Operational Plan (IOP)
because the IOP was no longer a viable option for water management within WCA 3A based on
the status of endangered species within WCA 3A. The ERTP maximizes operational flexibilities
to provide further hydrological improvements consistent with protection of multiple listed
animal species, including the Everglades snail kite, wood stork and other wading birds and their
habitats in south Florida, while maintaining nesting season requirements for the Cape Sable
Seaside Sparrow, along with C&SF Project purposes. Water management operating criteria
outlined within ERTP is to be superseded once the features of the Modified Water Deliveries
(MWD) to the Everglades National Park project and the C-111 Project are available for water
management operations. Therefore, the ERTP serves as a transition plan between the previous
2006 IOP for Protection of the Cape Sable Seaside Sparrow and a future operational plan.
Currently, the MWD Project elements are scheduled to be constructed by the end of 2013.
(USACE March 2011).
3.5.2 SURFACE WATER
3.5.2.1 Project Site
The surface water hydrology at the A-1 project site is currently rainfall driven. The site was
previously farmed as agricultural lands, but the agricultural activities have ceased. As a result
of the prior construction activities for the A-1 Reservoir, a seepage canal was constructed
within the north, east and west border of the project site. The canal was not completed. To
maintain flow, the levee at the south end of the A-1 project site was degraded to allow surface
runoff to enter the STA 3/4 seepage canal. Therefore, the surface waters currently flow from
the existing agricultural ditches to the STA 3/4 seepage canal.
3.5.2.2 Stormwater Treatment Area 2
The general management goal for STAs is to maintain shallow inundation in emergent aquatic
vegetation cells (EAV) for most of the year and to maintain shallow inundation of submerged
aquatic vegetation (SAV) cells throughout the year. Dry out and desiccation of submerged
aquatic vegetation and associated periphyton communities causes mortality and a significant
reduction in phosphorus removal performance.
Chapter 3 Affected Environment
A-1 Flow Equalization Basin 3-11 February 2013 Draft Environmental Impact Statement
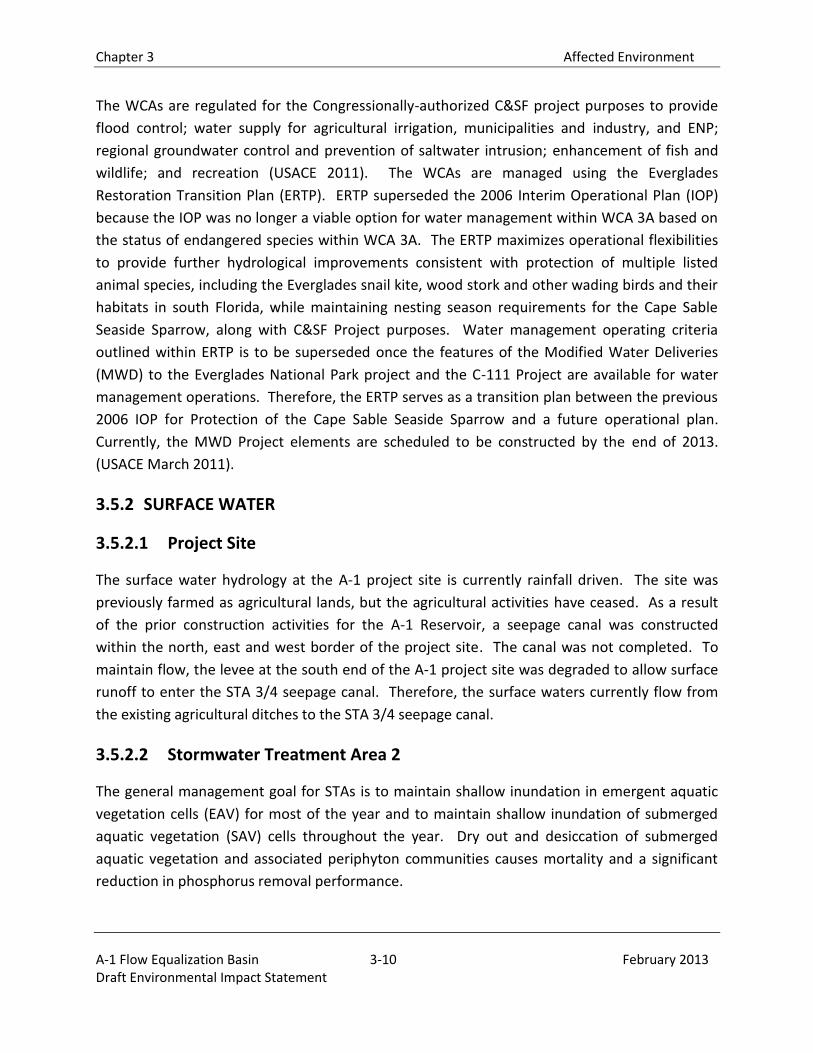
Inflows. STA 2 currently receives water from the North New River Canal, which is pumped into
the STA via the G-434 and G-435 pump stations. Runoff collected via the Hillsboro Canal is
pumped into STA 2 via the S-6 pump station. In addition, runoff from agricultural lands adjacent
to STA 2 is pumped into STA 2 via the G-328 pump station.
Outflows. Treated discharges from STA 2 are pumped into the L-6 Canal via the G-335 and G-
436 pump stations, and then conveyed to either northern WCA 2A through a set of box culverts
or to western WCA 2A through a section of degraded L-6 Canal levee. See Figure 3-6 for a
simple schematic of STA 2.
Figure 3-6 Simplified schematic of STA 2 showing major inflow and outflow structures, flow directions, and dominant/target vegetation types.
3.5.2.3 Stormwater Treatment Area 3/4
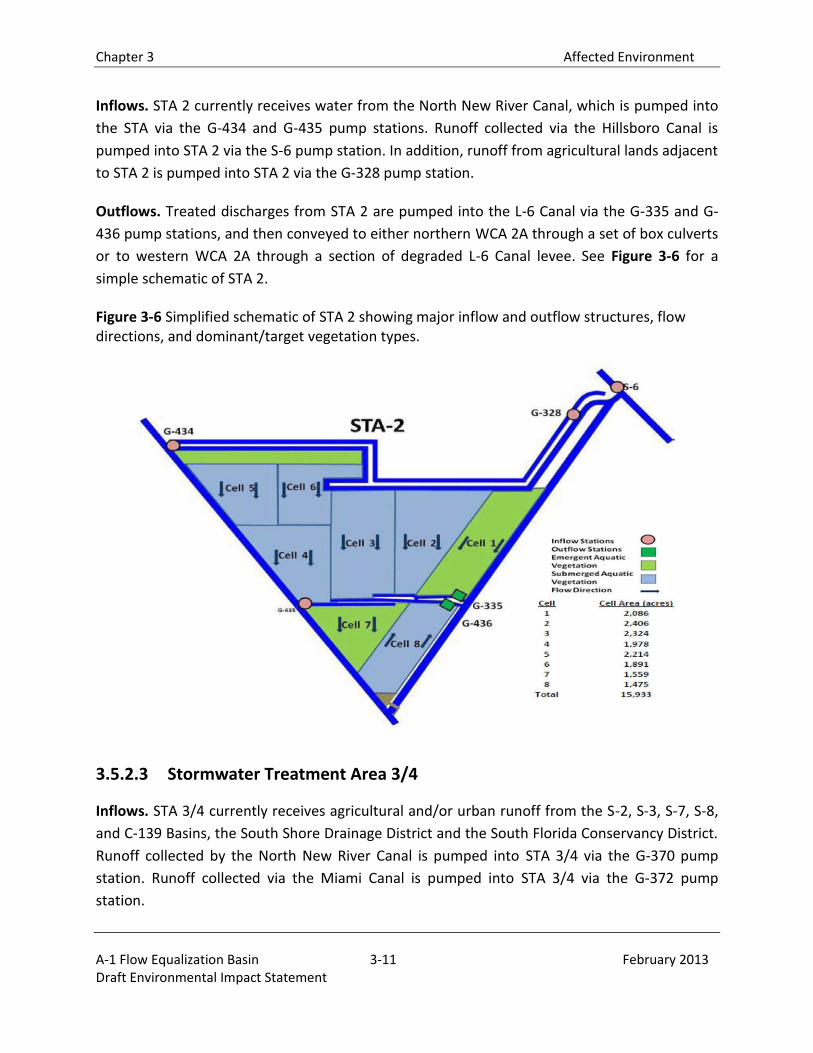
Inflows. STA 3/4 currently receives agricultural and/or urban runoff from the S-2, S-3, S-7, S-8,
and C-139 Basins, the South Shore Drainage District and the South Florida Conservancy District.
Runoff collected by the North New River Canal is pumped into STA 3/4 via the G-370 pump
station. Runoff collected via the Miami Canal is pumped into STA 3/4 via the G-372 pump
station.
Chapter 3 Affected Environment
A-1 Flow Equalization Basin 3-12 February 2013 Draft Environmental Impact Statement
Outflows. Treated discharges from STA 3/4 are conveyed to the STA 3/4 Discharge Canal and L-
5 Canal, and then conveyed to either western WCA 2A via the S-7 pump station, to eastern
WCA 3A via S-150, or western WCA 3A via the S-8 pump station. Pump station G-404 can also
be operated to convey treated STA 3/4 discharges to the northwest corner of WCA 3A and to
provide supplemental irrigation water supply to the Big Cypress Seminole Indian Reservation (in
conjunction with pump station G-409). See Figure 3-7 for a simple schematic of STA 3/4.
Figure 3-7. Simplified schematic of STA 3/4 showing major inflow and outflow structures, flow
directions, and dominant/target vegetation types.
3.5.2.4 Water Conservation Area 2A
Water within either the Hillsboro Canal or the North New River Canal enters into WCA 2A from
STA 2 and STA 3/4 primarily through pump stations S-7 (STA 3/4), G-335 (STA 2), and G-436
(STA 2). Pump stations deliver water from the canals to the WCAs. The S-7 pump station has an
adjacent gated spillway that can be opened to allow water supply deliveries from WCA 2A to
the EAA. Surface water inflows to WCA 2A also enter from the Refuge through the S-10A, S-10C,
Chapter 3 Affected Environment
A-1 Flow Equalization Basin 3-13 February 2013 Draft Environmental Impact Statement
and S-10D spillways located along the L-39 Levee. An interior levee across the southern portion
of WCA 2 subdivides WCA 2A from WCA 2B. The majority of the surface water flows from WCA
2A into WCA 3A primarily through the S-11 spillways; however, a portion is released via the S-
144, S-145 and S-146 structures to WCA-2B. When pool elevations in WCA 2B exceeds 11.0 feet
NGVD, water is discharged from WCA 2B to the North New River Canal via spillway structure S-
141.
3.5.2.5 Water Conservation Area 3A
WCA 3A receives water from Lake Okeechobee, WCA-2 and the EAA via the North New River
and Miami Canals with the majority of the inflows delivered from WCA 2A through the S-11
spillways. Another large source of water entering into WCA 3A is from STA 3/4 and STA-5, which
enter through the S-8 and G-404 pump stations, and the S-150 and G-357 culverts, all of which
are located at the northern boundary of WCA 3A. Under high water conditions, water flows
across the open portion of the western boundary of WCA 3A and into Big Cypress National
Preserve. However, surface outflows are primarily made to the ENP through the S-12 spillways
and the S-333 structure.
The S-140 pump station discharges runoff from the C-139 Annex, as well as the Seminole Tribe
of Florida Big Cypress Reservation and the Miccosukee Tribe of Indians of Florida Reservation
located along the northwestern boundary of WCA 3A. Water supply deliveries to the Seminole
Tribe of Florida Big Cypress Reservation are made via the G-409 pump station located just west
of the northwest corner of WCA 3A. Sources of water for this pump station include Lake
Okeechobee (delivered via the G-404 pump station), STA 3/4, STA-5, STA-6, Rotenberger and
Holey Land WMAs, EAA runoff, and WCA 3A.
Interior levees running across the southeast portion of WCA 3 subdivide WCA 3A from WCA-3B.
WCA-3B receives most of its water from rainfall, but occasionally receives water supply releases
from WCA 3A via the Miami and L-67 Canals (through S-151). Water is discharged from WCA-3B
to the adjacent basins through the S-31 and S-337 structures via the Miami Canal, although
plans are underway to enable discharges to the Northeast Shark River Slough along the
northeast boundary of ENP from WCA-3B via the S-355 structures (Cooper, 1991; Grein et al.,
2003; Hwa, 2003; SFWMD, 2000; SFWMD Operations, 2003; Smelt, 2003; STRIVE, 1999; and
USACOE, 1999).
3.5.2.6 Holey Land Wildlife Management Area
Historically, inflows to Holey Land occurred via inflow pump station G-200A. The source of
inflows was the portion of the Miami Canal (L-23, L-24 and L-25) south of STA 3/4 diversion
Chapter 3 Affected Environment
A-1 Flow Equalization Basin 3-14 February 2013 Draft Environmental Impact Statement
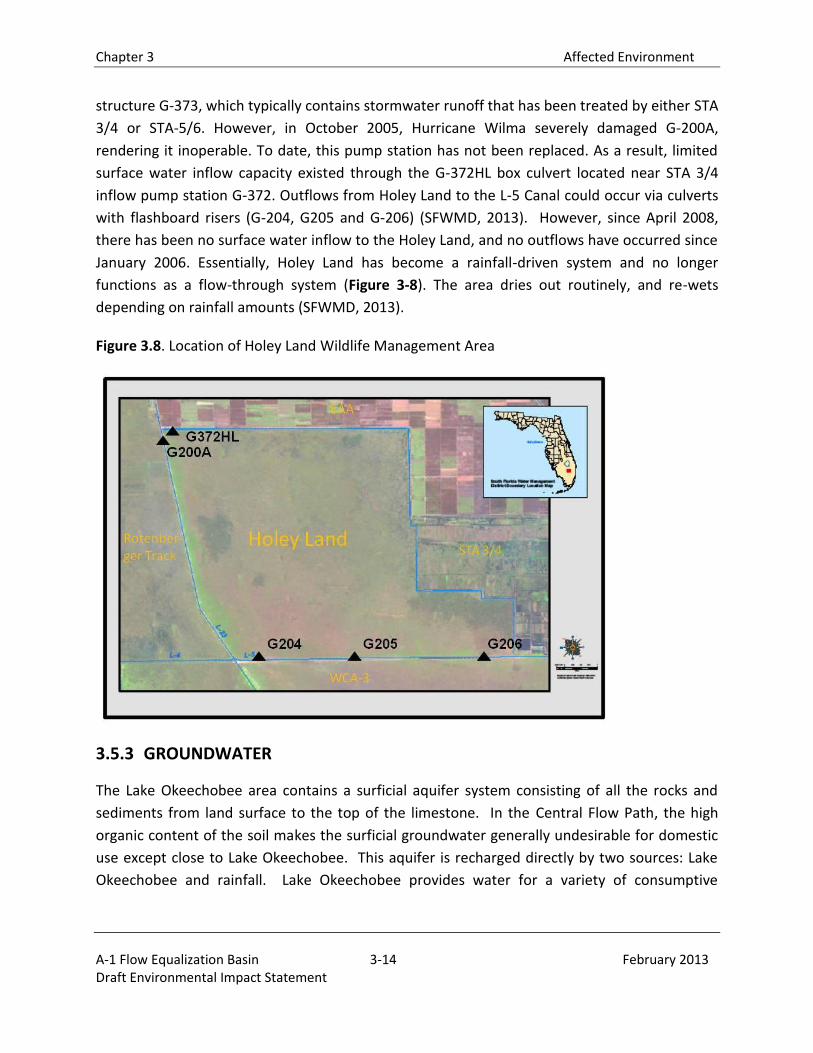
structure G-373, which typically contains stormwater runoff that has been treated by either STA
3/4 or STA-5/6. However, in October 2005, Hurricane Wilma severely damaged G-200A,
rendering it inoperable. To date, this pump station has not been replaced. As a result, limited
surface water inflow capacity existed through the G-372HL box culvert located near STA 3/4
inflow pump station G-372. Outflows from Holey Land to the L-5 Canal could occur via culverts
with flashboard risers (G-204, G205 and G-206) (SFWMD, 2013). However, since April 2008,
there has been no surface water inflow to the Holey Land, and no outflows have occurred since
January 2006. Essentially, Holey Land has become a rainfall-driven system and no longer
functions as a flow-through system (Figure 3-8). The area dries out routinely, and re-wets
depending on rainfall amounts (SFWMD, 2013).
Figure 3.8. Location of Holey Land Wildlife Management Area
3.5.3 GROUNDWATER
The Lake Okeechobee area contains a surficial aquifer system consisting of all the rocks and
sediments from land surface to the top of the limestone. In the Central Flow Path, the high
organic content of the soil makes the surficial groundwater generally undesirable for domestic
use except close to Lake Okeechobee. This aquifer is recharged directly by two sources: Lake
Okeechobee and rainfall. Lake Okeechobee provides water for a variety of consumptive
Chapter 3 Affected Environment
A-1 Flow Equalization Basin 3-15 February 2013 Draft Environmental Impact Statement
demands, including urban drinking water, irrigation for agricultural lands, and recharge for
wellfields.
Beneath the surficial aquifer is the Floridian aquifer system. It is the largest aquifer in Florida
and the most productive in the world. This system underlies an area of approximately 100,000
square miles (258,999 km2) in Florida, southeastern Alabama, southern Georgia, and southern
South Carolina. This aquifer is composed of a thick sequence of limestone layers and is divided
into Upper Floridian and Lower Floridan, by a less permeable middle confining unit of
carbonates. In the EAA, the water of the Floridan aquifer is rather salty, particularly in the
Lower Floridan (Sprinkle, 1989).
The intermediate confining unit is located approximately 200 to 250 feet below ground surface
(bgs) and will restrict any seepage from the project site that might reach this depth. There is a
high degree of communication between groundwater and surface water in the area, the
groundwater gradient in the surficial aquifer system is controlled, to a large extent, by the
operation of the hundreds of canals throughout the region. Therefore, even though the
general regional gradient in the surficial aquifer system is believed to be southward, localized
gradients may actually be in other directions in portions of the area surrounding the project site
due to the operation of canals and wells in the region.
3.5.4 STA PHOSPHORUS REMOVAL
Native soils within STA 2 (including Compartment B) and STA 3/4 are primarily organic muck. As
dead plant material is accumulated in the STA, the material slowly is converted to a layer of
peat soil. The accretion of new soil primarily from vegetation and detritus material in the STA
occurs at a rate of approximately 1.2 ± 0.3 and 1.7 ± 0.8 cm/yr, respectively (Bhomia, Rupesh
2012).
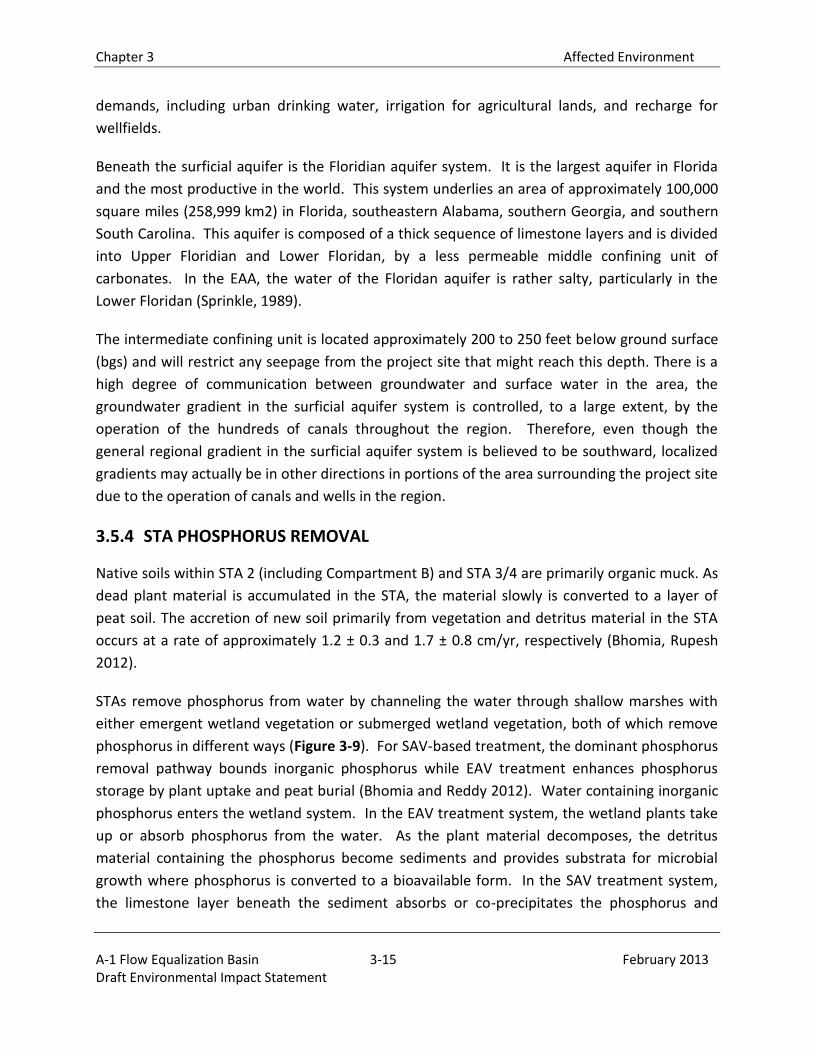
STAs remove phosphorus from water by channeling the water through shallow marshes with
either emergent wetland vegetation or submerged wetland vegetation, both of which remove
phosphorus in different ways (Figure 3-9). For SAV-based treatment, the dominant phosphorus
removal pathway bounds inorganic phosphorus while EAV treatment enhances phosphorus
storage by plant uptake and peat burial (Bhomia and Reddy 2012). Water containing inorganic
phosphorus enters the wetland system. In the EAV treatment system, the wetland plants take
up or absorb phosphorus from the water. As the plant material decomposes, the detritus
material containing the phosphorus become sediments and provides substrata for microbial
growth where phosphorus is converted to a bioavailable form. In the SAV treatment system,
the limestone layer beneath the sediment absorbs or co-precipitates the phosphorus and
Chapter 3 Affected Environment
A-1 Flow Equalization Basin 3-16 February 2013 Draft Environmental Impact Statement
makes it unavailable. As a whole system, phosphorus reduction in the STAs is carried out by the
various physical, chemical, and biological processes, but it primarily takes place at the soil-
water-plant roots interface, assisted by microbes in the water column and within the soil layer.
Ultimately, the removal of phosphorus occurs as it is sequestered in the accreted soils.
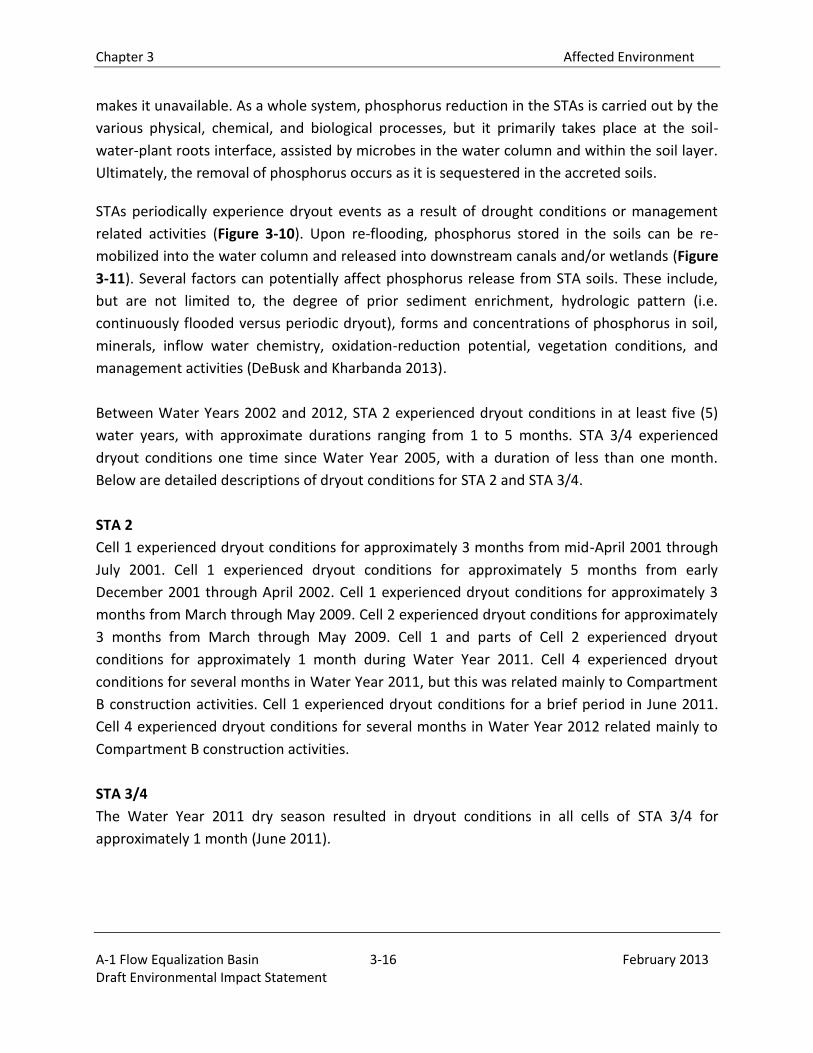
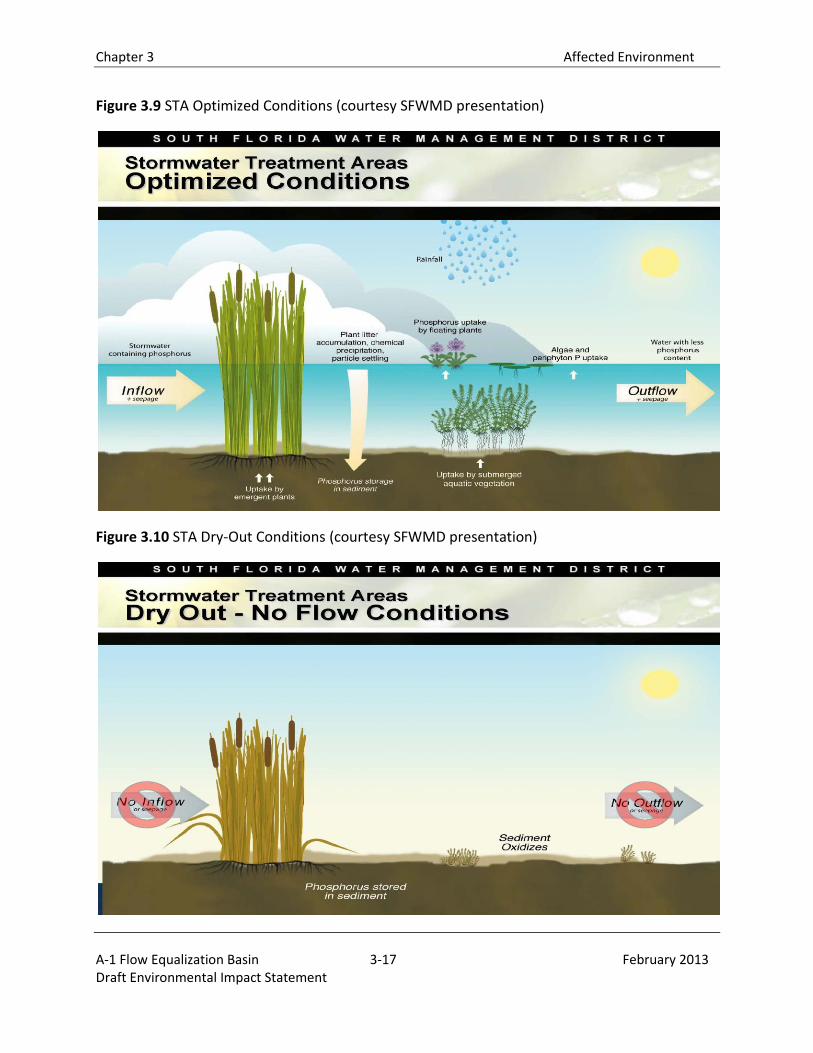
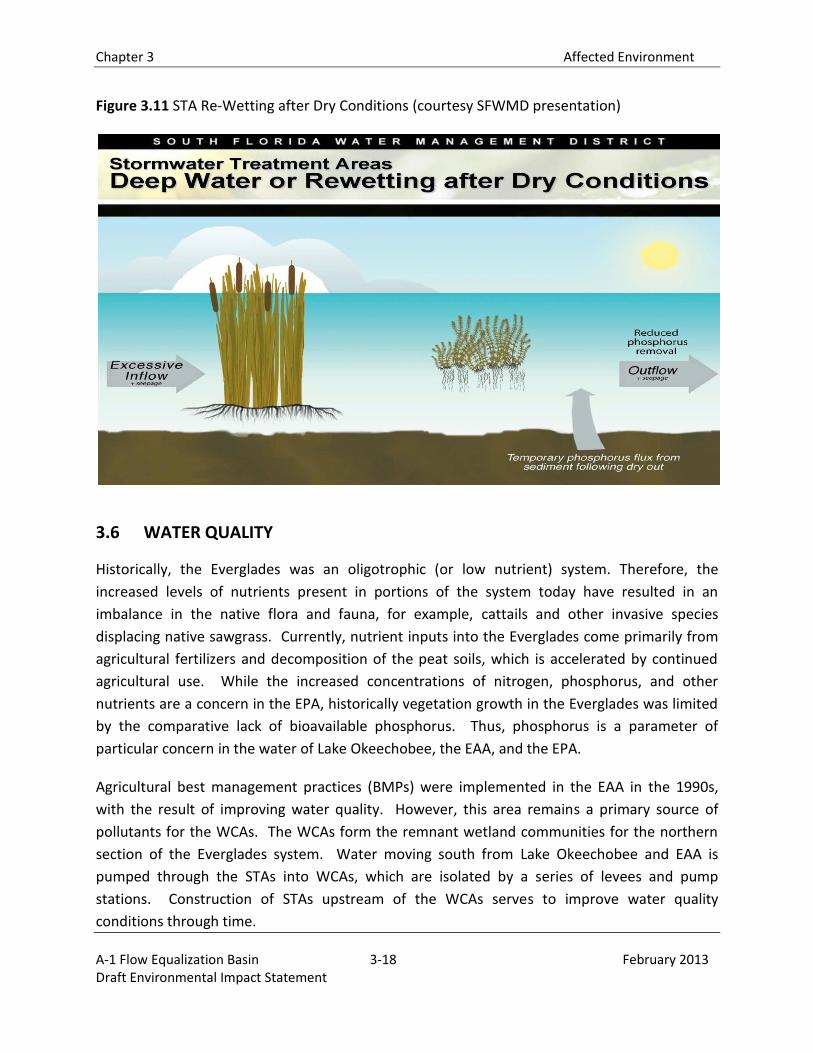
STAs periodically experience dryout events as a result of drought conditions or management
related activities (Figure 3-10). Upon re-flooding, phosphorus stored in the soils can be re-
mobilized into the water column and released into downstream canals and/or wetlands (Figure
3-11). Several factors can potentially affect phosphorus release from STA soils. These include,
but are not limited to, the degree of prior sediment enrichment, hydrologic pattern (i.e.
continuously flooded versus periodic dryout), forms and concentrations of phosphorus in soil,
minerals, inflow water chemistry, oxidation-reduction potential, vegetation conditions, and
management activities (DeBusk and Kharbanda 2013).
Between Water Years 2002 and 2012, STA 2 experienced dryout conditions in at least five (5)
water years, with approximate durations ranging from 1 to 5 months. STA 3/4 experienced
dryout conditions one time since Water Year 2005, with a duration of less than one month.
Below are detailed descriptions of dryout conditions for STA 2 and STA 3/4.
STA 2
Cell 1 experienced dryout conditions for approximately 3 months from mid-April 2001 through
July 2001. Cell 1 experienced dryout conditions for approximately 5 months from early
December 2001 through April 2002. Cell 1 experienced dryout conditions for approximately 3
months from March through May 2009. Cell 2 experienced dryout conditions for approximately
3 months from March through May 2009. Cell 1 and parts of Cell 2 experienced dryout
conditions for approximately 1 month during Water Year 2011. Cell 4 experienced dryout
conditions for several months in Water Year 2011, but this was related mainly to Compartment
B construction activities. Cell 1 experienced dryout conditions for a brief period in June 2011.
Cell 4 experienced dryout conditions for several months in Water Year 2012 related mainly to
Compartment B construction activities.
STA 3/4
The Water Year 2011 dry season resulted in dryout conditions in all cells of STA 3/4 for
approximately 1 month (June 2011).
Chapter 3 Affected Environment
A-1 Flow Equalization Basin 3-17 February 2013 Draft Environmental Impact Statement
Figure 3.9 STA Optimized Conditions (courtesy SFWMD presentation)
Figure 3.10 STA Dry-Out Conditions (courtesy SFWMD presentation)
Chapter 3 Affected Environment
A-1 Flow Equalization Basin 3-18 February 2013 Draft Environmental Impact Statement
Figure 3.11 STA Re-Wetting after Dry Conditions (courtesy SFWMD presentation)
3.6 WATER QUALITY
Historically, the Everglades was an oligotrophic (or low nutrient) system. Therefore, the
increased levels of nutrients present in portions of the system today have resulted in an
imbalance in the native flora and fauna, for example, cattails and other invasive species
displacing native sawgrass. Currently, nutrient inputs into the Everglades come primarily from
agricultural fertilizers and decomposition of the peat soils, which is accelerated by continued
agricultural use. While the increased concentrations of nitrogen, phosphorus, and other
nutrients are a concern in the EPA, historically vegetation growth in the Everglades was limited
by the comparative lack of bioavailable phosphorus. Thus, phosphorus is a parameter of
particular concern in the water of Lake Okeechobee, the EAA, and the EPA.
Agricultural best management practices (BMPs) were implemented in the EAA in the 1990s,
with the result of improving water quality. However, this area remains a primary source of
pollutants for the WCAs. The WCAs form the remnant wetland communities for the northern
section of the Everglades system. Water moving south from Lake Okeechobee and EAA is
pumped through the STAs into WCAs, which are isolated by a series of levees and pump
stations. Construction of STAs upstream of the WCAs serves to improve water quality
conditions through time.
Chapter 3 Affected Environment
A-1 Flow Equalization Basin 3-19 February 2013 Draft Environmental Impact Statement
The focus of the water quality improvements in the Everglades is to reduce the total
phosphorus concentrations in the water entering into the EPA marsh. Water quality standards
are established to protect the designated use of a waterbody. The EPA waters have been
designated as Class III which has the designated use of “recreation, propagation, and
maintenance of healthy, well-balanced population of fish and wildlife” (62.302.540 FAC). The
numeric total phosphorus criterion for Class III waters in the EPA as established in 62- 302.540
FAC is 10 parts per billion (ppb) measured as a long-term geometric mean. Achievement of the
10 ppb criterion in the Refuge and WCAs 2 and 3 is dependent on the total phosphorus (TP)
concentrations in the water leaving the EAA. The 10 ppb criterion is applied using an
achievement methodology that takes into account spatial and temporal variability, which is
described below.
Achievement of the criterion in impacted and unimpacted areas of the Refuge, WCA 2 and WCA
3 is determined based upon data from stations that are evenly distributed and located in
freshwater open water sloughs similar to the areas from which data were obtained to derive
the phosphorus criterion. Determining achievement of the criterion is based on data collected
monthly from the network of monitoring stations in both the impacted and unimpacted areas.
The waterbody is assessed for attainment of the criterion as determined by a four-part test. In
order to provide protection against imbalances of aquatic flora or fauna, the following
provisions must all be met:
a. The 5-year geometric mean averaged across all stations is less than or equal to 10 ppb; b. The annual geometric mean averaged across all stations is less than or equal to 10 ppb
for 3 of 5 years; c. The annual geometric mean averaged across all stations is less than or equal to 11 ppb;
and d. The annual geometric mean at all individual stations is less than or equal to 15 ppb.
Assessment of the phosphorus criterion within the Everglades indicates that the 4-part test is
typically met in the unimpacted portions of each WCA, while the impacted portions of each
WCA fail one or more parts of the test and therefore exceed the criterion. (SFWMD 2012).
3.6.1 PROJECT SITE
Water quality data at the project site are not available, but is anticipated to be similar to that of
other fallow cropland in the EAA. It is reasonable to assume that phosphorus levels in the soil
and in runoff would be lower than active agricultural activities, but higher than sites not
previously farmed.
Chapter 3 Affected Environment
A-1 Flow Equalization Basin 3-20 February 2013 Draft Environmental Impact Statement
3.6.2 STA 2 AND STA 3/4
The original STA 2 consisted of three treatment cells (1, 2, & 3) with approximately 6,400 acres
of effective treatment area and began operation in 2000. The treatment area was expanded by
approximately 1,900 acres with the construction of Cell 4, which was flow capable by December
2006. However, this cell went off-line in Water Year (WY) 2010 (water budget standard
duration measured between May 1, 2009 and April 30, 2010) for Compartment B construction.
Compartment B construction was completed in December 2011 and was flow capable in April
2012, adding approximately 7,000 acres of treatment area. The STA 2/Compartment B complex
has a total of eight treatment cells, five flow-ways, and a total effective treatment area of
approximately 15,000 acres. (Figure 3-6).
STA 3/4 consists of six treatment cells (1A, 1B, 2A, 2B, 3A and 3B) and the Periphyton-based STA
(PSTA) Implementation Project cells (Upper SAV, Lower SAV and PSTA). STA 3/4 has 16,300
acres of effective treatment area and began operation in 2003 (Figure 3-7).
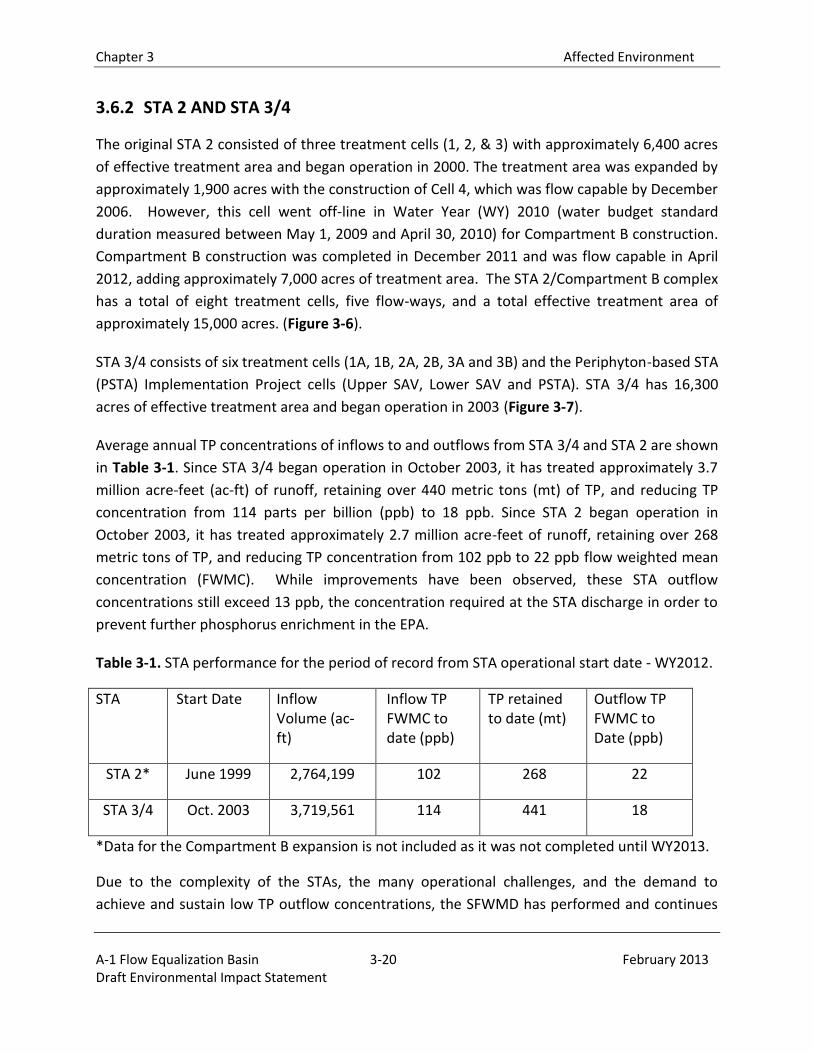
Average annual TP concentrations of inflows to and outflows from STA 3/4 and STA 2 are shown
in Table 3-1. Since STA 3/4 began operation in October 2003, it has treated approximately 3.7
million acre-feet (ac-ft) of runoff, retaining over 440 metric tons (mt) of TP, and reducing TP
concentration from 114 parts per billion (ppb) to 18 ppb. Since STA 2 began operation in
October 2003, it has treated approximately 2.7 million acre-feet of runoff, retaining over 268
metric tons of TP, and reducing TP concentration from 102 ppb to 22 ppb flow weighted mean
concentration (FWMC). While improvements have been observed, these STA outflow
concentrations still exceed 13 ppb, the concentration required at the STA discharge in order to
prevent further phosphorus enrichment in the EPA.
Table 3-1. STA performance for the period of record from STA operational start date - WY2012.
STA Start Date Inflow Volume (ac-ft)
Inflow TP FWMC to date (ppb)
TP retained to date (mt)
Outflow TP FWMC to Date (ppb)
STA 2* June 1999 2,764,199 102 268 22
STA 3/4 Oct. 2003 3,719,561 114 441 18
*Data for the Compartment B expansion is not included as it was not completed until WY2013.
Due to the complexity of the STAs, the many operational challenges, and the demand to
achieve and sustain low TP outflow concentrations, the SFWMD has performed and continues
Chapter 3 Affected Environment
A-1 Flow Equalization Basin 3-21 February 2013 Draft Environmental Impact Statement
to conduct scientific investigations and research with the goals of enhancing knowledge of the
complex treatment systems, the factors affecting performance, and the various TP removal
mechanisms in the STAs. The research projects and results are presented annually in the South
Florida Environmental Reports (SFERs) (available at www.sfwmd.gov/sfer). It is evident,
however, that maintaining minimum stages to keep the STAs hydrated and to ensure the
viability of EAV and SAV, and regulating inflows to minimize high hydraulic loading rates
improves their performance.
3.6.3 WATER CONSERVATION AREAS
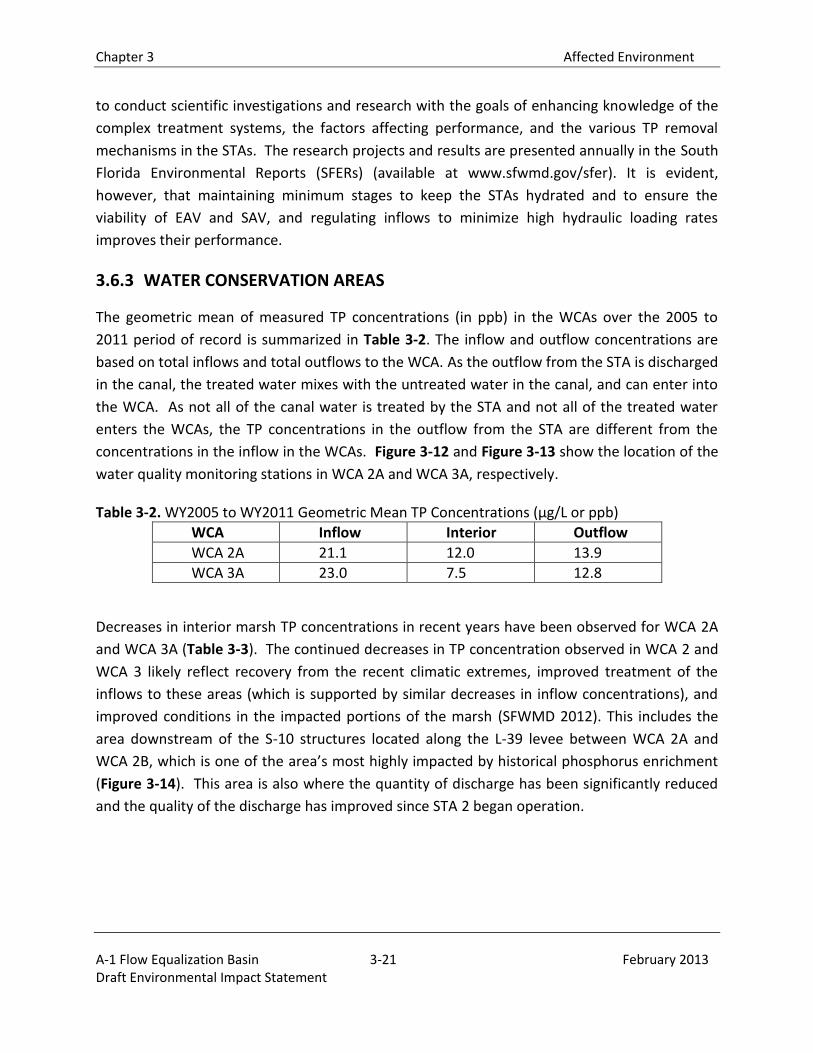
The geometric mean of measured TP concentrations (in ppb) in the WCAs over the 2005 to
2011 period of record is summarized in Table 3-2. The inflow and outflow concentrations are
based on total inflows and total outflows to the WCA. As the outflow from the STA is discharged
in the canal, the treated water mixes with the untreated water in the canal, and can enter into
the WCA. As not all of the canal water is treated by the STA and not all of the treated water
enters the WCAs, the TP concentrations in the outflow from the STA are different from the
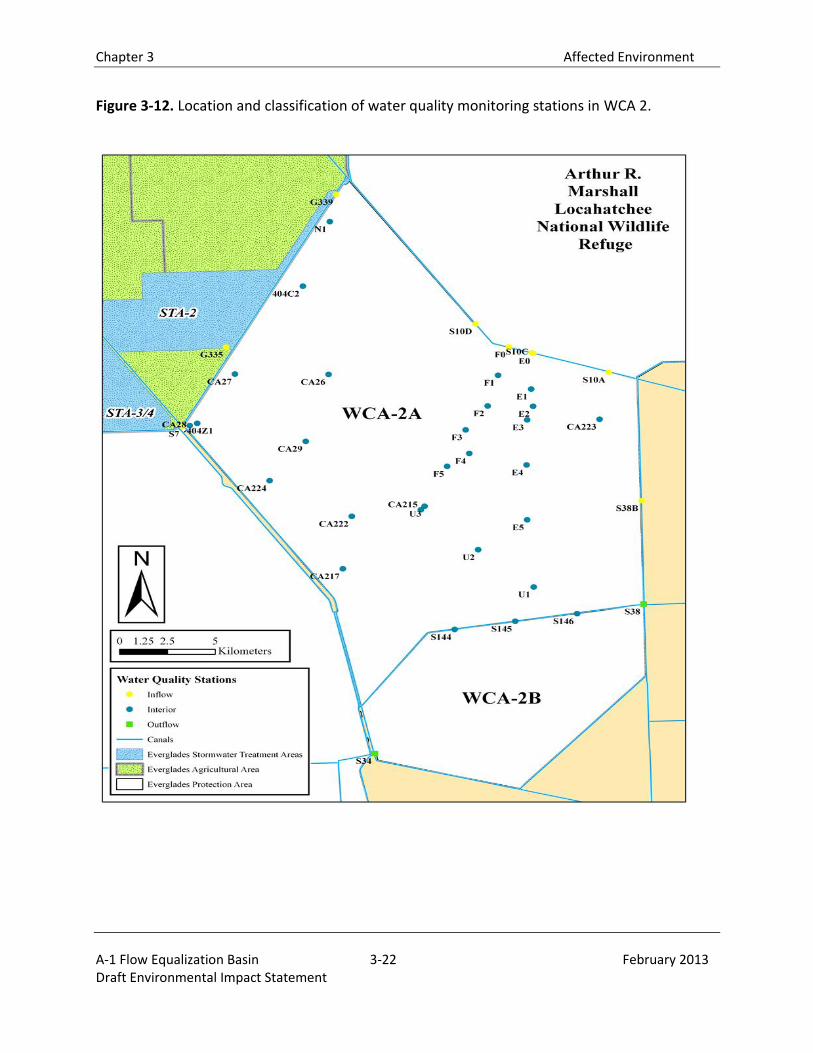
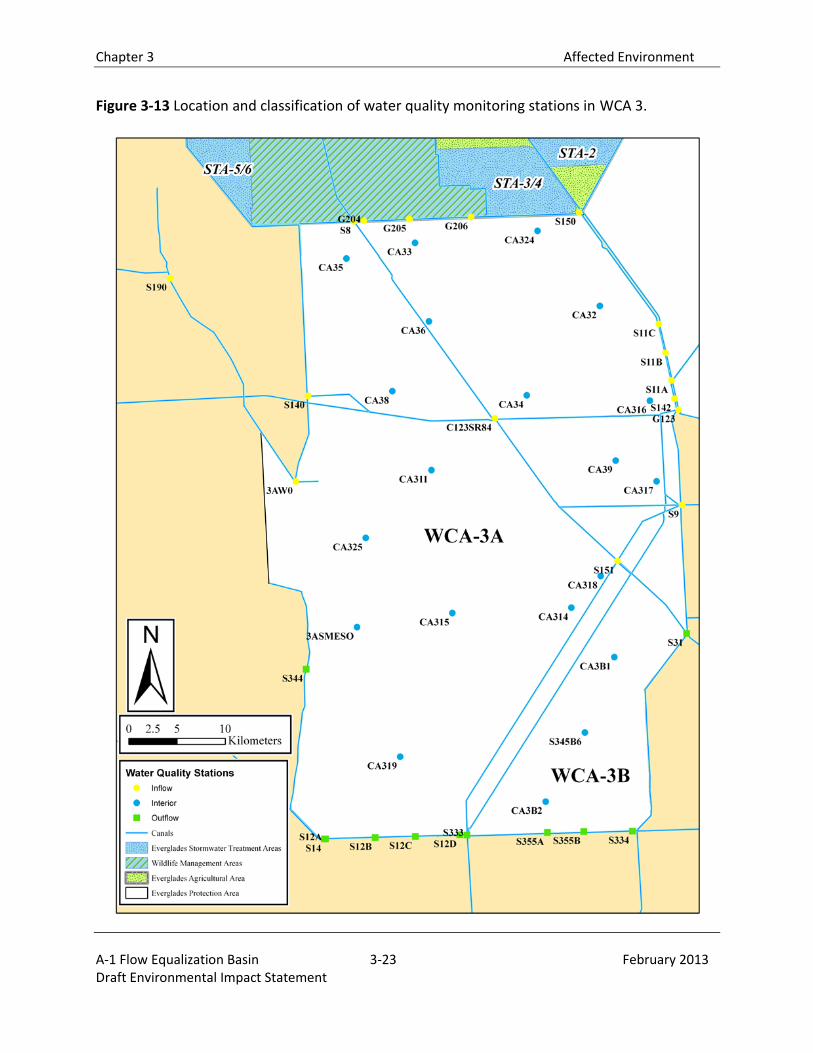
concentrations in the inflow in the WCAs. Figure 3-12 and Figure 3-13 show the location of the
water quality monitoring stations in WCA 2A and WCA 3A, respectively.
Table 3-2. WY2005 to WY2011 Geometric Mean TP Concentrations (μg/L or ppb)
WCA Inflow Interior Outflow
WCA 2A 21.1 12.0 13.9
WCA 3A 23.0 7.5 12.8
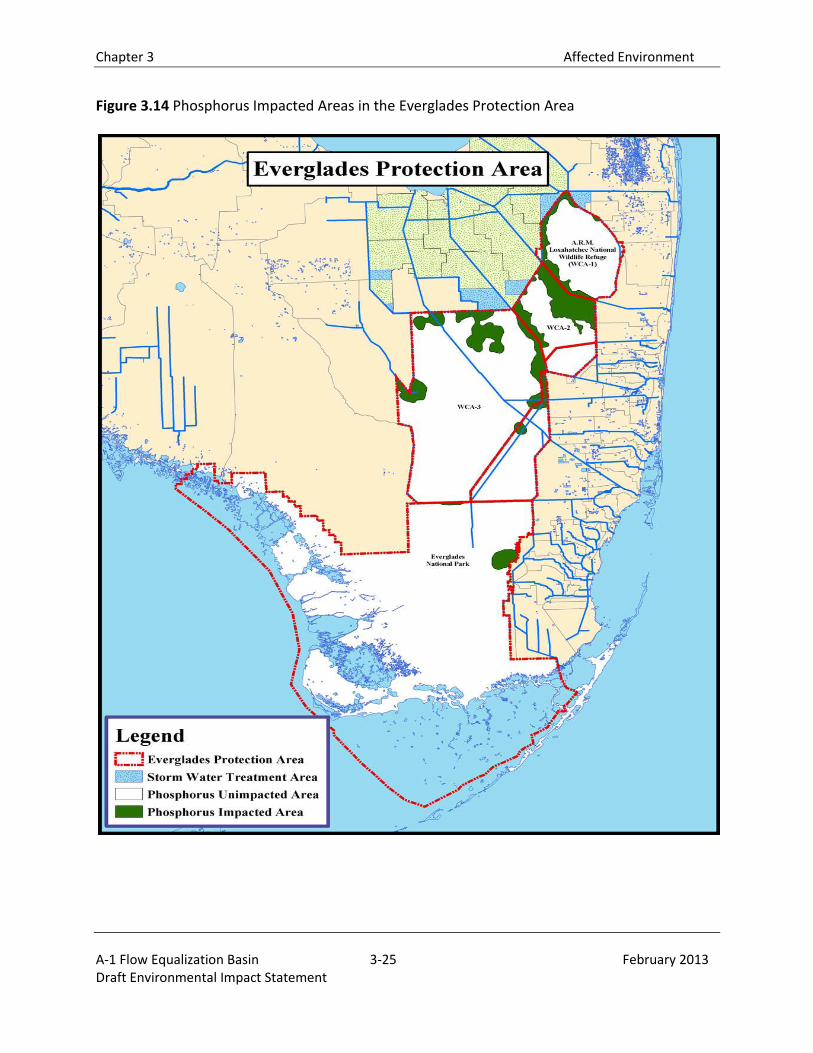
Decreases in interior marsh TP concentrations in recent years have been observed for WCA 2A
and WCA 3A (Table 3-3). The continued decreases in TP concentration observed in WCA 2 and
WCA 3 likely reflect recovery from the recent climatic extremes, improved treatment of the
inflows to these areas (which is supported by similar decreases in inflow concentrations), and
improved conditions in the impacted portions of the marsh (SFWMD 2012). This includes the
area downstream of the S-10 structures located along the L-39 levee between WCA 2A and
WCA 2B, which is one of the area’s most highly impacted by historical phosphorus enrichment
(Figure 3-14). This area is also where the quantity of discharge has been significantly reduced
and the quality of the discharge has improved since STA 2 began operation.
Chapter 3 Affected Environment
A-1 Flow Equalization Basin 3-22 February 2013 Draft Environmental Impact Statement
Figure 3-12. Location and classification of water quality monitoring stations in WCA 2.
Chapter 3 Affected Environment
A-1 Flow Equalization Basin 3-23 February 2013 Draft Environmental Impact Statement
Figure 3-13 Location and classification of water quality monitoring stations in WCA 3.
Chapter 3 Affected Environment
A-1 Flow Equalization Basin 3-24 February 2013 Draft Environmental Impact Statement
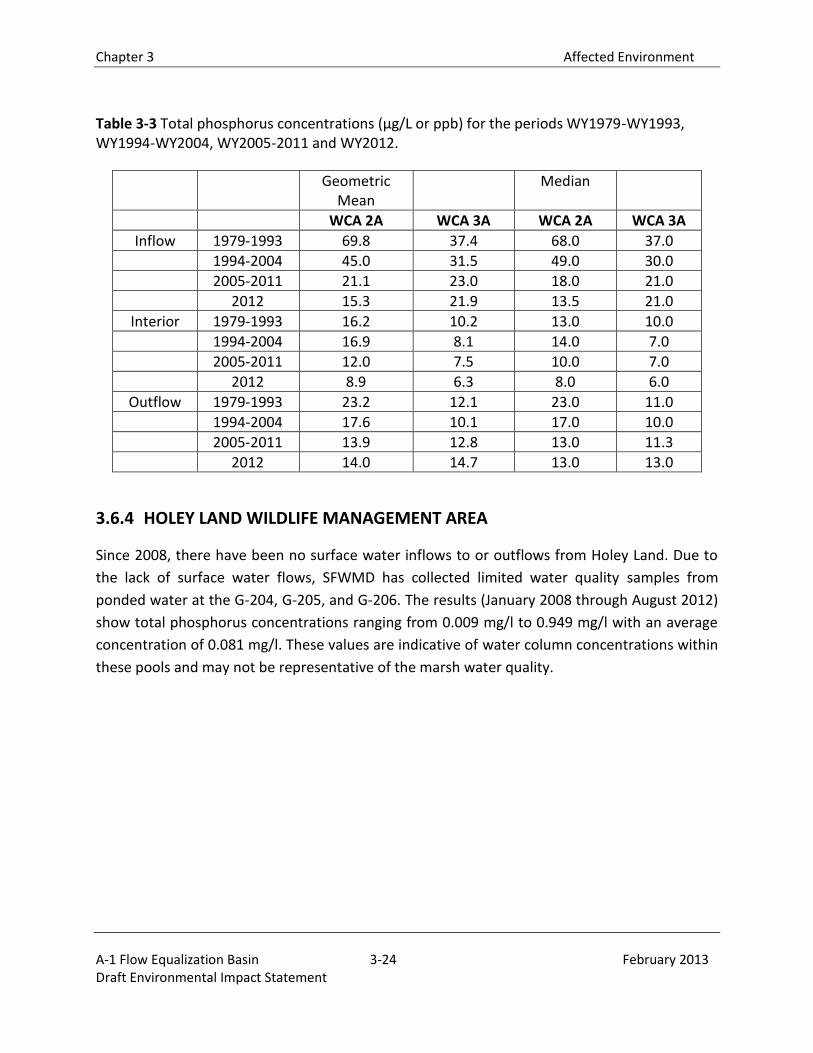
Table 3-3 Total phosphorus concentrations (μg/L or ppb) for the periods WY1979-WY1993, WY1994-WY2004, WY2005-2011 and WY2012.
Geometric Mean
Median
WCA 2A WCA 3A WCA 2A WCA 3A
Inflow 1979-1993 69.8 37.4 68.0 37.0
1994-2004 45.0 31.5 49.0 30.0
2005-2011 21.1 23.0 18.0 21.0
2012 15.3 21.9 13.5 21.0
Interior 1979-1993 16.2 10.2 13.0 10.0
1994-2004 16.9 8.1 14.0 7.0
2005-2011 12.0 7.5 10.0 7.0
2012 8.9 6.3 8.0 6.0
Outflow 1979-1993 23.2 12.1 23.0 11.0
1994-2004 17.6 10.1 17.0 10.0
2005-2011 13.9 12.8 13.0 11.3
2012 14.0 14.7 13.0 13.0
3.6.4 HOLEY LAND WILDLIFE MANAGEMENT AREA
Since 2008, there have been no surface water inflows to or outflows from Holey Land. Due to
the lack of surface water flows, SFWMD has collected limited water quality samples from
ponded water at the G-204, G-205, and G-206. The results (January 2008 through August 2012)
show total phosphorus concentrations ranging from 0.009 mg/l to 0.949 mg/l with an average
concentration of 0.081 mg/l. These values are indicative of water column concentrations within
these pools and may not be representative of the marsh water quality.
Chapter 3 Affected Environment
A-1 Flow Equalization Basin 3-25 February 2013 Draft Environmental Impact Statement
Figure 3.14 Phosphorus Impacted Areas in the Everglades Protection Area
Chapter 3 Affected Environment
A-1 Flow Equalization Basin 3-26 February 2013 Draft Environmental Impact Statement
3.7 VEGETATION
3.7.1 PROJECT SITE
The project site is contains 16,152 acres of land, of which 14,705 acres are waters of the US and
1,447 acres are uplands. The waters of the US consists of 10,158 acres of mixed scrub shrub
wetlands, 234 acres of exotic scrub shrub wetlands, 3,877 acres of herbaceous freshwater
marsh wetlands, 109 acres of lateral farm ditches, and 327 acres of channelized waterway. The
uplands consist of existing levees and areas that have been previously filled to store rock
material and muck soils.
The mixed scrub shrub wetlands (10,158 acres) are areas that previously contained sugar cane
vegetation. Since active sugarcane cultivation has ceased in 2009, these wetland areas have
gone fallow. Sugar cane vegetation is no longer present and wetland vegetation has recruited
back into the area. These areas, which are in an altered condition, contain plant species such as
Carolina willow or often just referred to as willow (Salix caroliniana), wand goldenrod (Solidago
stricta), bushy broomsedge (Andropogon glomeratus), salt bush (Baccharis glomerulifolia),
elephant grass, primrose willow (Ludwigia peruviana) and cattail (Typha spp.).Standing water
was not observed in these areas during a site visit in October 2012.
The 233 acres of wetland that were high quality depressional wetlands in 2005 are now in a
degraded condition with 90% nuisance and exotic species such as Elephant grass (Pennisetum
purpureum) and castor bean (Ricinus communis). These areas did not contain standing water
during a site visit in October 2012. (See FDEP field trip report in Appendix C for details.)
The 3,877 acres of freshwater marsh wetlands were previously scraped down during
construction activities for the A-1 Reservoir. These areas are considered higher quality
wetlands as compared to the exotic wetland areas and scrub shrub wetlands because they
contain a dominance of native plant species including water-primrose (Ludwigia peruviana),
bushy aster (Aster dumosus), marsh fleabane (Pluchea rosea), flat-sedge (Cyperus spp.), jointed
spikerush (Eleocharis interstincta), and water-hyssops (Bacopa caroliniana). Also these areas
contained standing water during the site visit in October 2012.
The waters of the US include 109 acres of lateral farm ditches and 327 acres of channelized
waterway. Spatter-dock (Nuphar spp.) and water lettuce (Pistia Stratiotes) were found floating
on the surface of the canals and ditches. Refer to Chapter 5 to review the SFWMD’s Unified
Mitigation Assessment Methodology (UMAM)wetland function and value scores for existing
site conditions.
Chapter 3 Affected Environment
A-1 Flow Equalization Basin 3-27 February 2013 Draft Environmental Impact Statement
3.7.2 STA 2 AND STA 3/4
Cells within the STA's are designed for either EAV or SAV and open water areas. The dominant
submerged aquatic vegetation species include Najas sp. (water-nymph) and Chara (muskgrass),
a gray-green branched multicellular algae, while the dominant emergent aquatic vegetation is
cattail (Typha domingensis).
Maintaining water depths at levels optimal to cattail growth and survival is an important
management strategy in the STAs. Changes in hydrologic regimes in a marsh can have subtle to
drastic effects on cattail (Chen et al., 2010). Cattail species can be eliminated under extended
periods of deeper water level conditions (Appelbaum, 1985 as cited in Chen 2013; Sojda and
Solberg, 1993 as cited in Chen 2013). Extended deepwater conditions can cause the formation
of cattail floating mats in the STAs (Chen et al., 2010). Heavy hydraulic loading, particularly
during storm events, has impacted cattail coverage and density in EAV cells.
Dry-outs have less effect on cattails than SAV as cattails can survive short periods of dry-out.
Lowering water levels to near ground level for a moderate time improves cattail recruitment
and establishment (Chen 2013); however long periods of complete dry-out can also result in
cattail mortality. In SAV cells, dryout events typically have adverse effects on the vegetation
and potentially alter the community characteristics following rehydration. Dry-out of SAV cells
leads to die off of the SAV and the associated periphyton communities essential to phosphorus
sequestration. For example, a STA 3/4 central flow-way dryout/re-flood event in 2011 resulted
in a dramatic change in the SAV community from a water-nymph and muskgrass co-dominated
to a muskgrass dominated system. (DeBusk and Kharbanda 2013)
3.7.3 WATER CONSERVATION AREAS 2A AND 3A
Almost all of the WCAs are grass-dominated wetlands interspersed with tree islands
(hammocks) and Carolina willow strands. Tree islands are a unique feature of the Everglades
ecosystem. In general, there are two recognizable types of basin wetland communities present
in the WCAs:
1. Sawgrass marsh composed of sawgrass (Cladium jamaicense) with cattail (Typha spp.), maidencane (Panicum hemitomon), arrowhead (Sagittaria sp.), pickerelweed (Pontederia cordata), Carolina willow, buttonbush (Cephalanthus occidentalis), wax myrtle (Myrica cerifera), and saltbush.
2. Wet prairie, composed of beakrush (Rhynchospora spp.), spikerush (Eleocharis spp.), maidencane, string lily (Crinum americanum) and white water lily (Nymphaea odorata).
Chapter 3 Affected Environment
A-1 Flow Equalization Basin 3-28 February 2013 Draft Environmental Impact Statement
There are also forested wetlands within the WCAs, which include both wetland strands and
hydric hammocks. Forested wetland strands are dominated by cypress and Carolina willow
trees. Other species found within this community include pond cypress (Taxodium ascendens),
bald cypress (Taxodium distichum), Carolina willow, buttonbush, wax myrtle, sawgrass (Cladium
jamaicense), and royal fern (Osmunda regalis). Vegetative species associated with the hydric
hammocks include sweet bay (Magnolia virginiana), red bay (Persea borbonia), cocoplum
(Chrysobalanus icaco), strangler fig (Ficus aurea), wax myrtle, Carolina willow, elderberry
(Sambucus nigra), hackberry (Celtis laevigata), cabbage palm (Sabal palmetto), red maple (Acer
rubrum), false nettle (Boehmeria cylindrical), and water oak (Quercus nigra) (USACE and
SFWMD 2006).
High nutrient concentrations have resulted in widespread changes to the ecology of the
Everglades, including invasion of cattail. The proliferation of cattail in the Everglades is
attributed to increased phosphorus levels in the soil and increased water depth and duration of
flooding (Newman et. al. 1998). Monospecific stands of cattail have replaced the historic
sawgrass marsh ridge and slough landscape over nearly 12,500 hectares (30,888 acres) in the
Everglades (SFWMD 2012).
Vegetation maps provided in the following sections were produced by the SFWMD utilizing
color infrared aerial photography. Data sets were ground-truthed and vegetation types
delineated and classified using the Vegetation Classification for South Florida Natural Areas
(Rutchey et al. 2006).
Major plant communities in WCA 2A now consist of remnant tree islands, open water sloughs,
large expanses of sawgrass, and sawgrass intermixed with dense cattail stands. Remaining tree
islands are found primarily at higher ground level elevations, located in the northwest corner of
WCA 2A. Remnant tree islands, dominated primarily by Carolina willow, are found scattered
throughout the central and southern sections of WCA 2A. Cattail distribution in WCA 2 reflects
4,400 acres in which cattails represent more than 50% of the vegetation coverage and 24,000
acres of mixed or scattered cattail (<50% coverage) present in the northeast portion of WCA 2A
(USACE 2009).
Several studies conducted within WCA 2A show that cattail out-compete sawgrass in their
ability to absorb excess nutrients with increased cattail production during years of high nutrient
inflows (Toth, 1988; Davis, 1991). Cattail is considered a high nutrient status species that is
opportunistic and highly competitive, relative to sawgrass, in nutrient-enriched situations (Toth,
1988; Davis, 1991). Davis (1991) concluded that both sawgrass and cattail increased annual
Chapter 3 Affected Environment
A-1 Flow Equalization Basin 3-29 February 2013 Draft Environmental Impact Statement
production in response to elevated nutrient concentrations, but that cattail differed in its ability
to increase plant production during years of high nutrient supply.
The community structure and species diversity of Everglades vegetation located north of I-75
(WCA 3A North) is very different from the wetland plant communities found south of I-75 (WCA
3A South). Improvements made to the Miami Canal and the impoundment of WCA 3A by
levees have over-drained the north end of WCA 3A and shortened its natural hydroperiod.
These hydrological changes have increased the frequency of severe peat fires that have
resulted in loss of tree islands, aquatic slough, and wet prairie habitat that were once
characteristic of the area. Today, northern WCA 3A is largely dominated by sawgrass and lacks
the natural structural diversity of plant communities seen in southern WCA 3A.
Over-drainage of the northwestern portion of WCA 3A has allowed the invasion of a number of
terrestrial species such as saltbush, dog fennel (Eupatorium sp.), and broomsedge (Andropogon
glomeratus). Melaleuca (Melaleuca quinquenervia) has become well-established in the
southeastern corner of WCA 3A, and is spreading to the north and west.
Vegetation located in the central and southern portion of WCA 3A represents some of the best
examples of original Everglades habitat left in South Florida. This region of the Everglades
appears to have changed the least since the 1950s, and contains a mosaic of tree islands, wet
prairies, sawgrass stands, and aquatic sloughs.
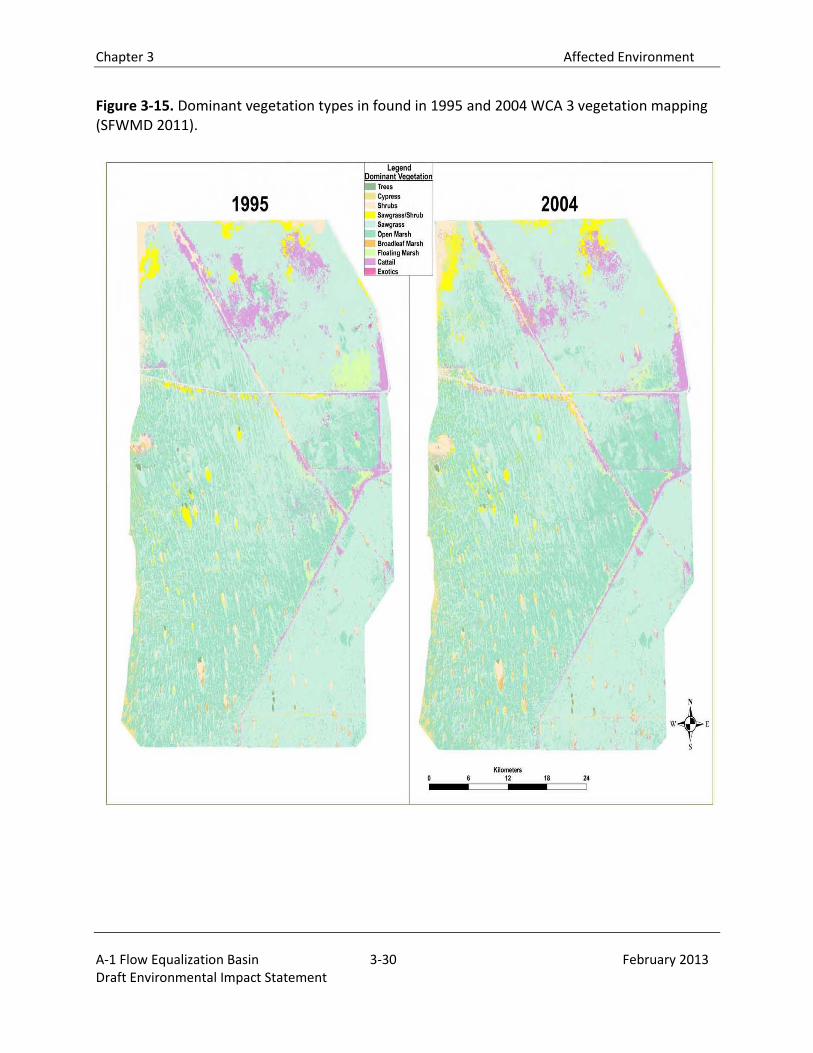
A comparison of vegetation in WCA 3 vegetation maps from 1995 to 2004 (SFWMD 2011)
indicate an increase in sawgrass/shrub by 48 percent (9,566 acres to 14,179 acres, 30 percent
increase in broadleaf marsh (2,775 acres to 3,593 acres), while floating marsh decreased by 37
percent (8,948 acres to 5,632 acres) (See Figure 3-15). Most significant may be the trend in
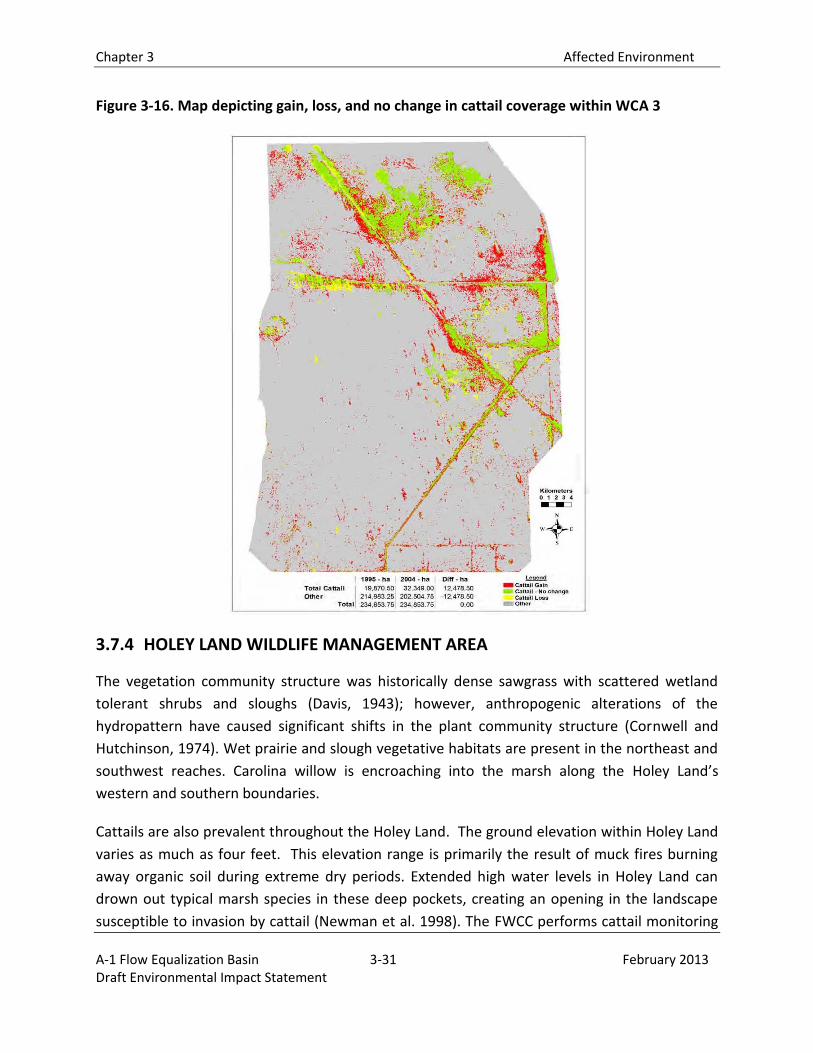
cattail coverage which increased 38% within WCA 3, representing a state change from historic
ridge and slough patterns (SFWMD 2011 and 2013)(Figure 3-16).
Chapter 3 Affected Environment
A-1 Flow Equalization Basin 3-30 February 2013 Draft Environmental Impact Statement
Figure 3-15. Dominant vegetation types in found in 1995 and 2004 WCA 3 vegetation mapping (SFWMD 2011).
Chapter 3 Affected Environment
A-1 Flow Equalization Basin 3-31 February 2013 Draft Environmental Impact Statement
Figure 3-16. Map depicting gain, loss, and no change in cattail coverage within WCA 3
3.7.4 HOLEY LAND WILDLIFE MANAGEMENT AREA
The vegetation community structure was historically dense sawgrass with scattered wetland
tolerant shrubs and sloughs (Davis, 1943); however, anthropogenic alterations of the
hydropattern have caused significant shifts in the plant community structure (Cornwell and
Hutchinson, 1974). Wet prairie and slough vegetative habitats are present in the northeast and
southwest reaches. Carolina willow is encroaching into the marsh along the Holey Land’s
western and southern boundaries.
Cattails are also prevalent throughout the Holey Land. The ground elevation within Holey Land
varies as much as four feet. This elevation range is primarily the result of muck fires burning
away organic soil during extreme dry periods. Extended high water levels in Holey Land can
drown out typical marsh species in these deep pockets, creating an opening in the landscape
susceptible to invasion by cattail (Newman et al. 1998). The FWCC performs cattail monitoring
Chapter 3 Affected Environment
A-1 Flow Equalization Basin 3-32 February 2013 Draft Environmental Impact Statement
in Holey Land (SFWMD, 2011). The results of the 2011 survey estimate that 18% (6,300 acres)
of the area is covered by cattail. This indicates an increase in estimated cattail coverage from
2010 (which was 10% of the area); however, it is still significantly less than what was estimated
in 2004 at 27% coverage of the area.
3.8 FISH AND WILDLIFE
3.8.1 GENERAL FISH AND WILDLIFE SPECIES
3.8.1.1 Overall area
Aquatic macroinvertebrates form a vital link between the algal and detrital food web base of
freshwater wetlands and the fishes, amphibians, reptiles, and wading birds that feed upon
them. Important macroinvertebrates of the freshwater aquatic community include crayfish
(Procambarus alleni), riverine grass shrimp (Palaemonetes paludosus), amphipods (Hyallela
aztecus), Florida apple snail (Pomacea paludosa), Seminole ramshorn (Planorbella duryi), and
numerous species of aquatic insects (USACE 1999a).
Small freshwater marsh fishes are also important processors of algae, plankton, macrophytes,
and macroinvertebrates. Marsh fishes provide an important food source for wading birds,
amphibians, and reptiles. Common small freshwater marsh species include the golden
topminnow (Fundulus chrysotus), least killifish (Heterandria formosa), Florida flagfish
(Jordenella floridae), golden shiner (Notemigonus crysoleucas), sailfin molly (Poecilia latipinna),
bluefin killifish (Lucania goodei), oscar (Astronotus ocellatus), eastern mosquitofish (Gambusia
holbrookii), and small sunfishes (Lepomis spp.) (USACE 1999a). The density and distribution of
marsh fish populations fluctuates with seasonal changes in water levels. Populations of marsh
fishes increase during extended periods of continuous flooding during the wet season. As marsh
surface waters recede during the dry season, marsh fishes become concentrated in areas that
hold water through the dry season, such as alligator holes, limestone solution holes, and
longer-hydroperiod marshes and sloughs. Concentrated dry season assemblages of marsh
fishes are more susceptible to predation and provide an important food source for wading birds
(USACE 1999a).
Numerous sport and larger predatory fishes occur in deeper canals and sloughs. Common
species include largemouth bass (Micropterus salmoides), bluegill (Lepomis macrochirus),
redear sunfish (Lepomis microlophus), black crappie (Pomoxis nigromaculatus), Florida gar
(Lepisosteus platyrhincus), threadfin shad (Dorosoma petenense), gizzard shad (Dorosoma
cepedianum), yellow bullhead (Ameiurus natilis), white catfish (Ameiurus catus), bowfin (Amia
Chapter 3 Affected Environment
A-1 Flow Equalization Basin 3-33 February 2013 Draft Environmental Impact Statement
calva), and tilapia (Tilapia spp.) (USACE 1999a). Larger fish are an important food source for
raptors and other birds of prey, wading birds, alligators, otters, raccoons, and mink.
The freshwater wetland complex supports a diverse assemblage of reptiles and amphibians.
Common amphibians include the greater siren (Siren lacertina), Everglades dwarf siren
(Pseudobranchus striatus), two-toed amphiuma (Amphiuma means), pig frog (Rana grylio),
southern leopard frog (Rana sphenocephala), Florida cricket frog (Acris gryllus), southern
chorus frog (Pseudacris nigrita), squirrel tree frog (Hyla squirela), and green tree frog (Hyla
cinerea) (USACE 1999). Amphibians represent an important forage base for wading birds,
alligators, and larger predatory fishes (USACE 1999a).
Common reptiles of freshwater wetlands include the American alligator (Alligator
mississippiensis), snapping turtle (Chelydra serpentina), striped mud turtle (Kinosternon bauri),
mud turtle (Kinosternon subrubrum), cooter (Chrysemys floridana), Florida chicken turtle
(Deirochelys reticularia), Florida softshell turtle (Trionys ferox), water snake (Natrix sipidon),
green water snake (Natrix cyclopion), mud snake (Francia abacura), and Florida cottonmouth
(Agkistrodon piscivorus) (USACE 1999a). The alligator was historically most abundant in the
peripheral Everglades marshes and freshwater mangrove habitats, but is now most abundant in
canals and the deeper slough habitats of the central Everglades, the STAs, WCAs and the Holey
Lands. Drainage of peripheral wetlands and increasing salinity in mangrove wetlands as a result
of decreased freshwater flows has limited the occurrence of alligators in these habitats
(Mazzotti and Brandt 1994).
The freshwater wetlands of the STAs, WCAs and the Holey Land are noted for their abundance
and diversity of colonial wading birds. Common wading birds include the white ibis (Eudocimus
albus), glossy ibis (Plegadus falcenellus), great egret (Casmerodius albus), great blue heron
(Ardea herodius), little blue heron (Egretta caerulea), tricolored heron (Egretta tricolor), snowy
egret (Egretta thula), green-backed heron (Butorides striatus), cattle egret (Bubulcus ibis),
black-crowned night heron (Nycticorax nycticorax), yellow-crowned night heron (Nycticorax
violacea), roseate spoonbill (Ajaia ajaja), and wood stork (Mycteria americana) (USACE 1999a).
The Everglades National Park historically supported the largest number of nests in the Greater
Everglades, but in recent decades the majority of nesting has occurred further inland in the
WCAs. In 2012 an estimated 24,191 nests (92% of all south Florida nests) were initiated either
in the WCAs or Everglades National Park (ENP). This estimate is 40% lower than the decadal
average and 66% lower than in 2009 when a record high of 73,096 nests was recorded. Most
other regions of south Florida experienced similar declines in nest numbers during 2012. (Cook
and Kobza 2012). Wading bird populations in the Everglades are dynamic, changing constantly
Chapter 3 Affected Environment
A-1 Flow Equalization Basin 3-34 February 2013 Draft Environmental Impact Statement
and are influenced by many other aspects (Russell et al. 2002). However, the most influential
aspect is perhaps human habitat alteration; particularly those that change the natural
hydrological conditions. Food availability is consider the most important factor limiting
populations of wading birds in the Everglades (Frederick & Spalding 1994); however hydrology
is the factor that ultimately determines the availability of food. Data obtained during each SRF
over the years, support the important role that hydrological conditions plays on the abundance
and distributions of wading bird populations in the lower Everglades. The concept of too
much/too little or just the right amount of water and the too late/too early or just at the right
time seem to be of particular importance for wading birds. (Cook and Kobza 2012).
Mammals that are well-adapted to the aquatic and wetland conditions of the freshwater marsh
complex include the rice rat (Oryzomys palustris natator), round-tailed muskrat, and river otter
(Lutra canadensis). Additional mammals that may utilize freshwater wetlands on a temporary
basis include the white-tailed deer (Odocoileus virginianus), Florida panther (Puma concolor
coryi), bobcat (Lynx rufus), and racoon (Procyon lotor). Additional information on Greater
Everglades fauna is also contained within the South Florida Environmental Reports which are
published annually by the SFWMD:
(http://my.sfwmd.gov/portal/page/portal/xweb%20about%20us/agency%20reports#previous_ reports).
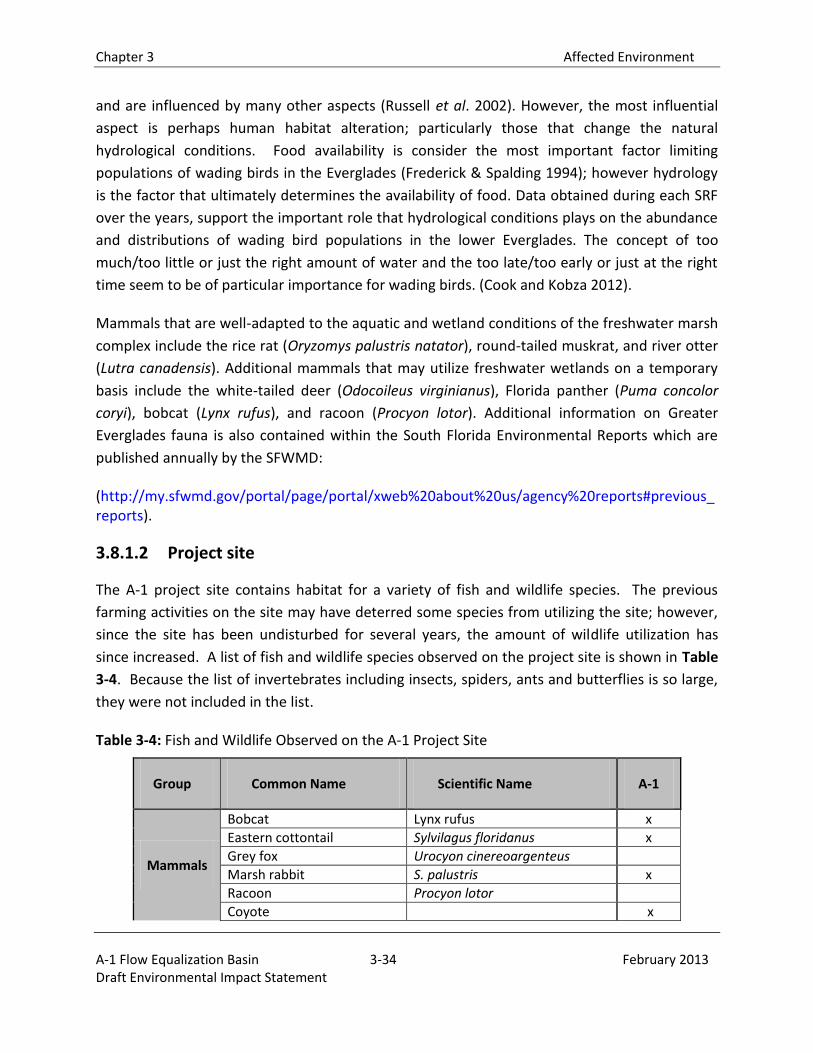
3.8.1.2 Project site
The A-1 project site contains habitat for a variety of fish and wildlife species. The previous
farming activities on the site may have deterred some species from utilizing the site; however,
since the site has been undisturbed for several years, the amount of wildlife utilization has
since increased. A list of fish and wildlife species observed on the project site is shown in Table
3-4. Because the list of invertebrates including insects, spiders, ants and butterflies is so large,
they were not included in the list.
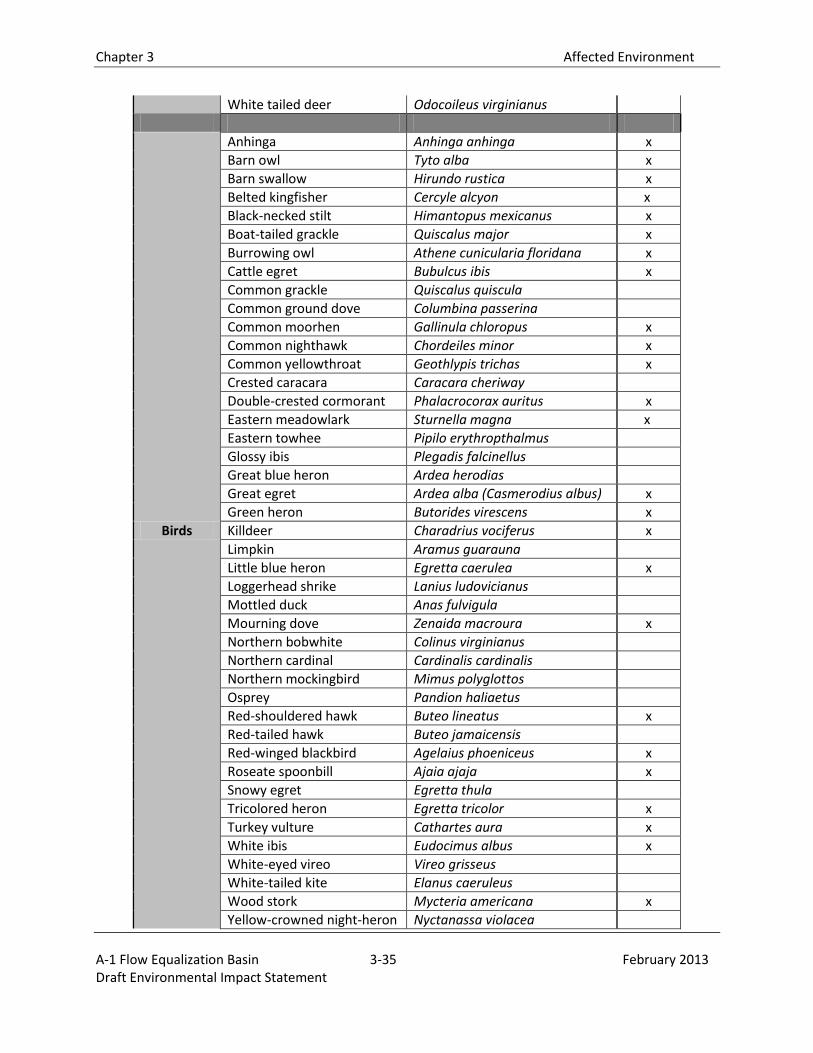
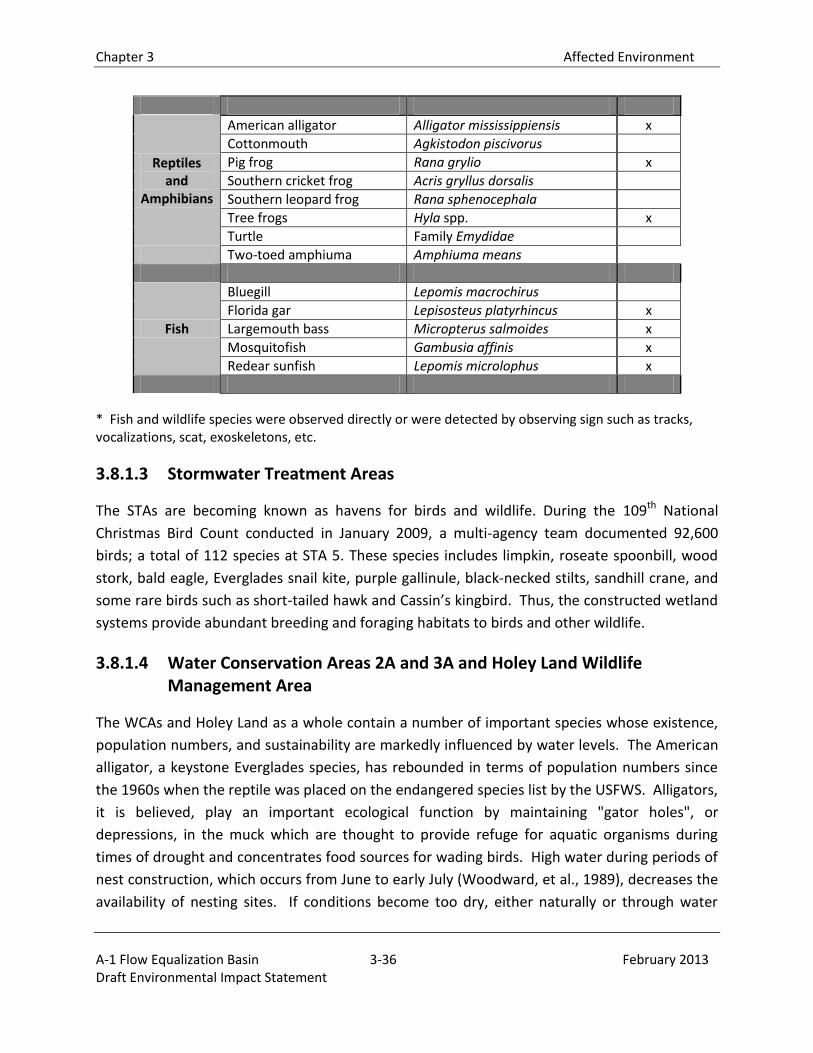
Table 3-4: Fish and Wildlife Observed on the A-1 Project Site
Group Common Name Scientific Name A-1
Mammals
Bobcat Lynx rufus x
Eastern cottontail Sylvilagus floridanus x
Grey fox Urocyon cinereoargenteus
Marsh rabbit S. palustris x
Racoon Procyon lotor
Coyote x
Chapter 3 Affected Environment
A-1 Flow Equalization Basin 3-35 February 2013 Draft Environmental Impact Statement
White tailed deer Odocoileus virginianus
Birds
Anhinga Anhinga anhinga x
Barn owl Tyto alba x
Barn swallow Hirundo rustica x
Belted kingfisher Cercyle alcyon x
Black-necked stilt Himantopus mexicanus x
Boat-tailed grackle Quiscalus major x
Burrowing owl Athene cunicularia floridana x
Cattle egret Bubulcus ibis x
Common grackle Quiscalus quiscula
Common ground dove Columbina passerina
Common moorhen Gallinula chloropus x
Common nighthawk Chordeiles minor x
Common yellowthroat Geothlypis trichas x
Crested caracara Caracara cheriway
Double-crested cormorant Phalacrocorax auritus x
Eastern meadowlark Sturnella magna x
Eastern towhee Pipilo erythropthalmus
Glossy ibis Plegadis falcinellus
Great blue heron Ardea herodias
Great egret Ardea alba (Casmerodius albus) x
Green heron Butorides virescens x
Killdeer Charadrius vociferus x
Limpkin Aramus guarauna
Little blue heron Egretta caerulea x
Loggerhead shrike Lanius ludovicianus
Mottled duck Anas fulvigula
Mourning dove Zenaida macroura x
Northern bobwhite Colinus virginianus
Northern cardinal Cardinalis cardinalis
Northern mockingbird Mimus polyglottos
Osprey Pandion haliaetus
Red-shouldered hawk Buteo lineatus x
Red-tailed hawk Buteo jamaicensis
Red-winged blackbird Agelaius phoeniceus x
Roseate spoonbill Ajaia ajaja x
Snowy egret Egretta thula
Tricolored heron Egretta tricolor x
Turkey vulture Cathartes aura x
White ibis Eudocimus albus x
White-eyed vireo Vireo grisseus
White-tailed kite Elanus caeruleus
Wood stork Mycteria americana x
Yellow-crowned night-heron Nyctanassa violacea
Chapter 3 Affected Environment
A-1 Flow Equalization Basin 3-36 February 2013 Draft Environmental Impact Statement
Reptiles and
Amphibians
American alligator Alligator mississippiensis x
Cottonmouth Agkistodon piscivorus
Pig frog Rana grylio x
Southern cricket frog Acris gryllus dorsalis
Southern leopard frog Rana sphenocephala
Tree frogs Hyla spp. x
Turtle Family Emydidae
Two-toed amphiuma Amphiuma means
Fish
Bluegill Lepomis macrochirus
Florida gar Lepisosteus platyrhincus x
Largemouth bass Micropterus salmoides x
Mosquitofish Gambusia affinis x
Redear sunfish Lepomis microlophus x
* Fish and wildlife species were observed directly or were detected by observing sign such as tracks, vocalizations, scat, exoskeletons, etc.
3.8.1.3 Stormwater Treatment Areas
The STAs are becoming known as havens for birds and wildlife. During the 109th National
Christmas Bird Count conducted in January 2009, a multi-agency team documented 92,600
birds; a total of 112 species at STA 5. These species includes limpkin, roseate spoonbill, wood
stork, bald eagle, Everglades snail kite, purple gallinule, black-necked stilts, sandhill crane, and
some rare birds such as short-tailed hawk and Cassin’s kingbird. Thus, the constructed wetland
systems provide abundant breeding and foraging habitats to birds and other wildlife.
3.8.1.4 Water Conservation Areas 2A and 3A and Holey Land Wildlife Management Area
The WCAs and Holey Land as a whole contain a number of important species whose existence,
population numbers, and sustainability are markedly influenced by water levels. The American
alligator, a keystone Everglades species, has rebounded in terms of population numbers since
the 1960s when the reptile was placed on the endangered species list by the USFWS. Alligators,
it is believed, play an important ecological function by maintaining "gator holes", or
depressions, in the muck which are thought to provide refuge for aquatic organisms during
times of drought and concentrates food sources for wading birds. High water during periods of
nest construction, which occurs from June to early July (Woodward, et al., 1989), decreases the
availability of nesting sites. If conditions become too dry, either naturally or through water
Chapter 3 Affected Environment
A-1 Flow Equalization Basin 3-37 February 2013 Draft Environmental Impact Statement
management practices, water levels may fall too low to maintain gator holes, forcing the animal
to seek other areas to survive.
Other important reptile species commonly encountered within the WCAs and Holey Land
include a number of species of turtles, lizards, and snakes. Turtle species include the snapping
turtle, striped mud turtle, mud turtle, cooter, Florida chicken turtle, and Florida soft-shell turtle.
Lizards such as the green anole are found in the central Everglades, and several species of
skinks occur more commonly in terrestrial habitats. Numerous snakes inhabit the wetland and
terrestrial environments. Drier habitats support such species as the Florida brown snake,
southern ringneck snake, southern black racer, scarlet snake, and two rattlesnake species. The
eastern indigo snake, a federally-listed threatened species, and the Florida pine snake, a state
species of special concern, may also exist in drier areas. Wetter habitats support more aquatic
species such as the water snake, the green water snake, mud snake, eastern garter snake,
ribbon snake, rat snake, and the Florida cottonmouth (McDiarmid and Pritchard, 1978).
Important amphibians known to occur in South Florida include the Everglades bullfrog, Florida
cricket frog, southern leopard frog, southern chorus frog, and various tree frogs common to
tree islands and cypress forests. Salamanders inhabit the densely vegetated, still or slow-
moving waters of the sawgrass marshes and wet prairies. They include the greater siren and
the Everglades dwarf siren. Toads such as the eastern narrow-mouth toad also occur within the
WCAs.
Colonial wading birds utilize the WCAs and Holey Land as both feeding and breeding habitat.
The most common species utilizing the WCAs include the white ibis, great egrets, snowy egrets,
cattle egrets, great blue herons, tricolored herons, little blue herons, green herons, black-
crowned night herons, yellow-crowned night herons, wood storks, and glossy ibis, with
populations varying widely in relationship to seasonal water level fluctuations. Historically,
white ibis has been the most abundant colonial wading bird species within the WCAs with the
great egret as the second (Frederick and Collopy, 1988). The WCAs and Holey Land support
additional aquatic avifauna, such as the limpkin, two species of bitterns, the anhinga, as well as
a number of resident and migratory waterfowl.
The Everglades fish community is composed of a variety of forage fish important in the diet of
many wading birds, sport fish, native species, and exotics introduced partly through
aquaculture practices and the aquarium trade. Forage species include the Florida flagfish,
bluefin killifish, least killifish, shiners, mosquito fish, and sailfin molly.
Chapter 3 Affected Environment
A-1 Flow Equalization Basin 3-38 February 2013 Draft Environmental Impact Statement
The WCAs provide a valuable sport fishery for South Florida. Many of the canals, notably along
US 41, I-75, and in the L-35B and L-67A, provide valuable recreational fishing for largemouth
bass, sunfish, oscar, gar, bowfin, catfish and other species. Generally, Everglades sportfish are
harvested from the borrow canals that surround the marsh. As water levels in the canal and
marsh rise, fish populations disperse into the interior marsh and reproduce with minimum
competition and predation. As water levels recede, fish concentrate into the deeper waters of
the surrounding canals, where they become available as prey for wildlife and fishermen.
Several game and non-game wildlife species occur within the wetland systems in the WCAs and
Holey Land including: white-tailed deer, common snipe, and marsh rabbit. Blue-winged teal,
mottled ducks, and other game waterfowl are found in the sloughs. Feral hogs may also be
present in drier areas or on tree islands.
3.8.2 FEDERALLY LISTED THREATENED AND ENDANGERED SPECIES
3.8.2.1 Overall Area
The federal endangered, threatened, and species of special concern list is maintained by the
USFWS and the National Marine Fisheries Service (NMFS) in accordance with the Endangered
Species Act (ESA). In the ESA, “endangered” species are in danger of extinction throughout all
or a significant portion of its range, “threatened” species are likely to become endangered
within the foreseeable future throughout all or a significant portion of its range, and “species of
special concern” might need concentrated conservation actions. A list of federally designated
critical habitat for protected species is also maintained by the USFWS and NMFS in accordance
with the ESA. The ESA defines “critical habitat” as 1) the specific areas within the geographical
area occupied by the species at the time it is listed on which are found physical or biological
features essential to the conservation of the species and which may require special
management consideration or protection; and 2) specific areas outside of the geographical
areas occupied by the species at the time it is listed upon a determination that such areas are
essential for the conservation of the species. Listed species and designated critical habitat
discussed are those that may be affected by the proposed project and the alternatives. A list of
the federally protected species and critical habitat that may occur on the project site is shown
in Table 3-5.
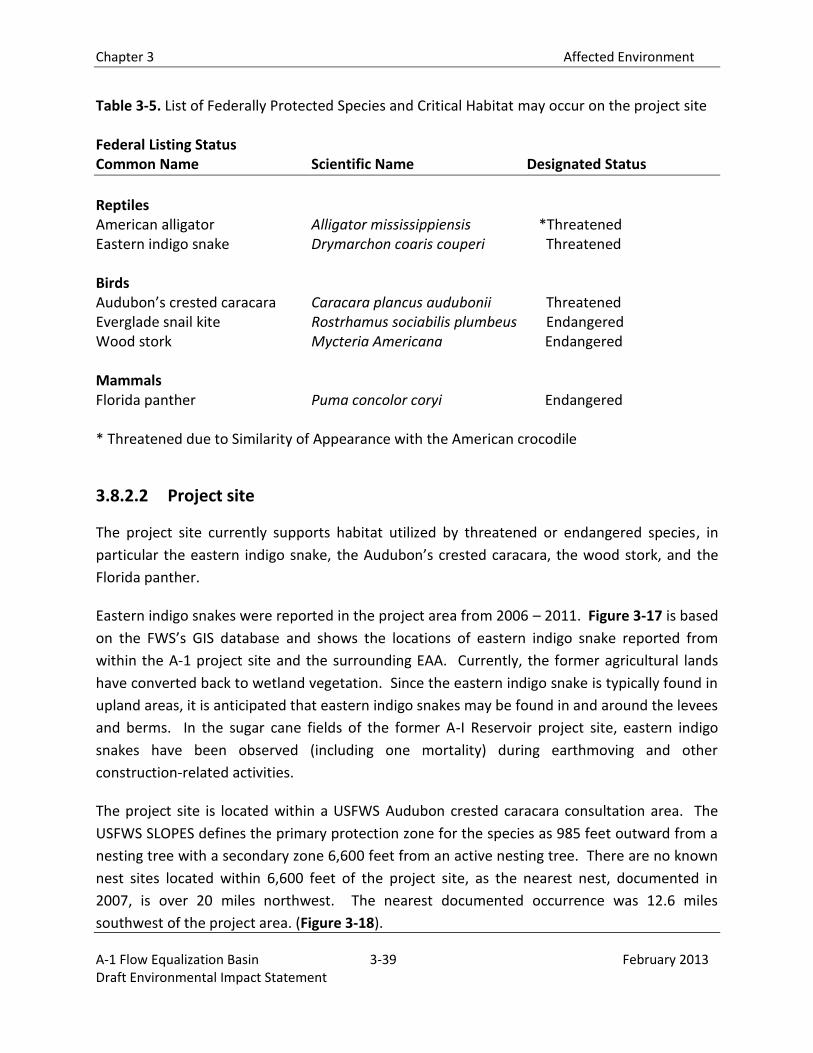
Chapter 3 Affected Environment
A-1 Flow Equalization Basin 3-39 February 2013 Draft Environmental Impact Statement
Table 3-5. List of Federally Protected Species and Critical Habitat may occur on the project site Federal Listing Status Common Name Scientific Name Designated Status
Reptiles American alligator Alligator mississippiensis *Threatened Eastern indigo snake Drymarchon coaris couperi Threatened Birds Audubon’s crested caracara Caracara plancus audubonii Threatened Everglade snail kite Rostrhamus sociabilis plumbeus Endangered Wood stork Mycteria Americana Endangered Mammals Florida panther Puma concolor coryi Endangered * Threatened due to Similarity of Appearance with the American crocodile
3.8.2.2 Project site
The project site currently supports habitat utilized by threatened or endangered species, in
particular the eastern indigo snake, the Audubon’s crested caracara, the wood stork, and the
Florida panther.
Eastern indigo snakes were reported in the project area from 2006 – 2011. Figure 3-17 is based
on the FWS’s GIS database and shows the locations of eastern indigo snake reported from
within the A-1 project site and the surrounding EAA. Currently, the former agricultural lands
have converted back to wetland vegetation. Since the eastern indigo snake is typically found in
upland areas, it is anticipated that eastern indigo snakes may be found in and around the levees
and berms. In the sugar cane fields of the former A-I Reservoir project site, eastern indigo
snakes have been observed (including one mortality) during earthmoving and other
construction-related activities.
The project site is located within a USFWS Audubon crested caracara consultation area. The
USFWS SLOPES defines the primary protection zone for the species as 985 feet outward from a
nesting tree with a secondary zone 6,600 feet from an active nesting tree. There are no known
nest sites located within 6,600 feet of the project site, as the nearest nest, documented in
2007, is over 20 miles northwest. The nearest documented occurrence was 12.6 miles
southwest of the project area. (Figure 3-18).
Chapter 3 Affected Environment
A-1 Flow Equalization Basin 3-40 February 2013 Draft Environmental Impact Statement
The freshwater wetlands serve as foraging habitat for the wood stork. Although the nearest
active wood stork colony is located over 25 miles away, wood stork are observed on the site
(Figure 3-20).
Within the project area, there has been no panther focus area (based on telemetry point
density) designated. However, within a 10 mile buffer area, 19,688 acres have been identified
as a primary panther zone and 101,350 acres have been identified as secondary panther zone
(USFWS GIS database, 2012). Therefore, it is anticipated that panthers may hunt on the project
site, but it is unlikely that they would use these areas for any extended length of time because
of the lack of suitable long-term panther habitat (URS 2007). In addition, the site borders the
eastern extent of the panther’s secondary zone (Figure 3-21). No Florida panthers have been
sighted on the property; however, they have been documented in the area (Figure 3-22).
3.8.2.3 Stormwater Treatment Areas 2 and 3/4
The eastern extent of STA 2 is within the core foraging area of four wood stork colonies, and
the wood storks have been documented to utilize the wetlands within the both STAs. The
southeast corner of STA 3/4 also falls within the 18.6 mile buffer area of a wood stork colony.
The levees and berms may provide habitat for the eastern indigo snake. Alligators are present
within both STAs. Although it was originally anticipated that the Everglades snail kites would
only forage in the STAs, there have been documented reports that the snail kites nested within
STA 3/4 in 2011 and have begun nesting in STA 1E (USFWS GIS database, 2012).
3.8.2.4 Water Conservation Areas and Holey Land Wildlife Management Area
Federally protected species occurring in the WCAs include many of the protected species in the
South Florida region including the American alligator, wood stork, Audubon’s crested caracara,
Everglades snail kite, Florida panther, and possibly the Eastern indigo snake. The WCAs also
have designated critical habitat for the Everglades snail kite in WCA 2 and WCA 3, and support
several successful nests.
3.8.2.5 Species Descriptions
3.8.2.5.1 American Alligator
The American alligator (Alligator mississippiensis) is a large, carnivorous reptile related to
crocodiles that inhabits freshwater lakes, ponds, marshes, sloughs, swamps, canals and,
occasionally, brackish waters throughout the southeastern United States. It is commonly seen
on canal banks throughout the EAA and in the WCAs.
Chapter 3 Affected Environment
A-1 Flow Equalization Basin 3-41 February 2013 Draft Environmental Impact Statement
In 1985, alligators were down-listed in Florida from “threatened” to status of “threatened due
to similarity of appearance” because of its similarity to the endangered American crocodile
(Crocodylus acutus). A distinguishing characteristic from the American crocodile, a close
relative, is that only the upper teeth are visible with the alligator’s mouth closed, while both the
upper and lower teeth are visible on the American crocodile. The listing “threatened due to
similarity of appearance” is defined for species that are not currently biologically threatened
but that are believed likely to become endangered in the future (50 CFR Part 17). Therefore,
no coordination is needed for this species.
3.8.2.5.2 Eastern Indigo Snake
The eastern indigo snake (Drymarchon corais couperi) is federally listed as threatened. It is a
large, black, non-venomous snake that reaches lengths up to of 265 cm (Ashton and Ashton
1981). Its historical range extended throughout Florida and the coastal plains of Mississippi,
Alabama, and Georgia (USFWS 1999).
The eastern indigo snakes preferred habitats are uplands (flatwoods, dry prairies, tropical
hardwood hammocks, and coastal dunes). They are not usually found in Everglades wetlands
(Steiner and others 1983), but can be found on the edges of freshwater marshes and in
agricultural fields (USFWS 1999). They are extremely susceptible to desiccation and cold. In
dry, cold habitats (Georgia, Alabama, and the Florida panhandle), eastern indigo snakes depend
on the holes of the gopher tortoise (Gopherus polyphemus), which provide protection from cold
and dry conditions (Layne and Steiner 1996). Throughout the warmer environment of
peninsular Florida, eastern indigo snakes may exist in any terrestrial habitats with low urban
development (USFWS 1999). They frequently use natural holes, gopher tortoise burrows, trash
piles and the like even in warmer south Florida. They use a variety of food sources including
fish, frogs, toads, lizards, turtles and their eggs, small alligators, birds and small mammals
(USFWS, 1999).
Initially, the population decline of eastern indigo snakes was from over-collecting for the pet
trade (43 FR 4028), but current major threats to the eastern indigo snake include loss and
fragmentation of habitat from increased development (USFWS 1999). Other threats to the
eastern indigo snake associated with development include increased mortality from vehicular
collisions, domestic pets, and people, and pesticides (USFWS 1999).
Eastern indigo snakes range over large areas and use various habitats throughout the year, with
most activity occurring in the summer and fall (Smith 1987; Moler 1985a). Adult males have
larger home ranges than adult females and juveniles; their ranges average 554 acres (Moler
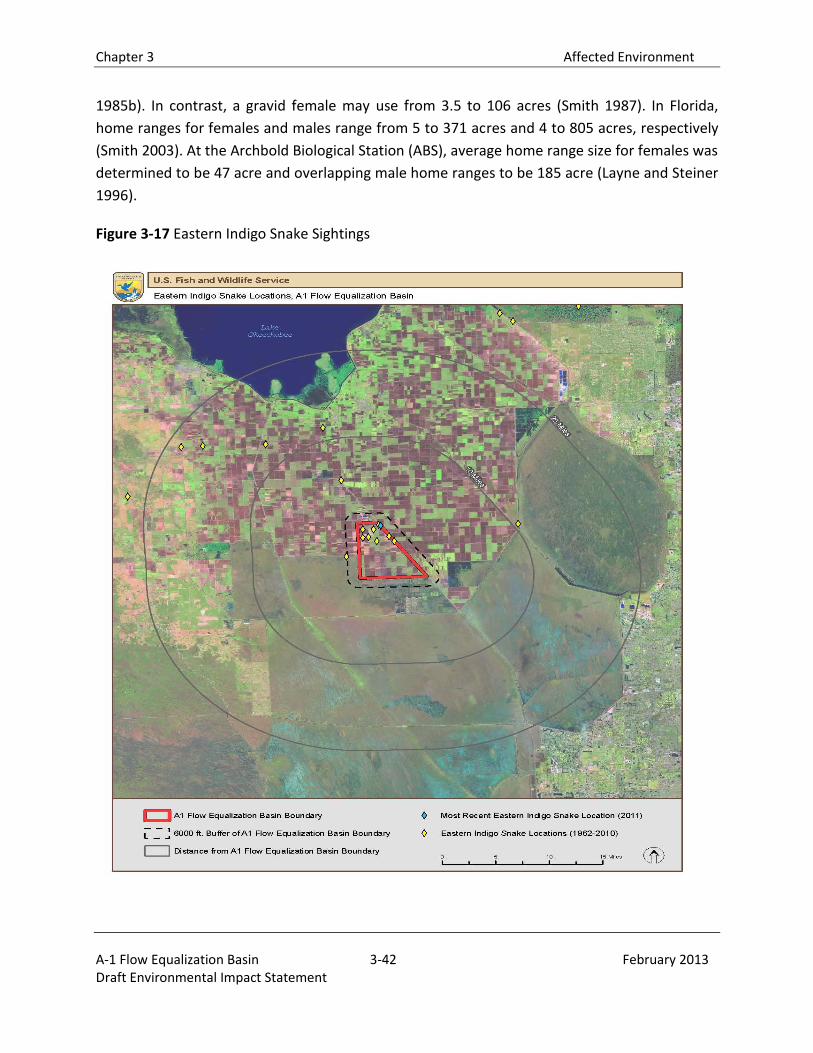
Chapter 3 Affected Environment
A-1 Flow Equalization Basin 3-42 February 2013 Draft Environmental Impact Statement
1985b). In contrast, a gravid female may use from 3.5 to 106 acres (Smith 1987). In Florida,
home ranges for females and males range from 5 to 371 acres and 4 to 805 acres, respectively
(Smith 2003). At the Archbold Biological Station (ABS), average home range size for females was
determined to be 47 acre and overlapping male home ranges to be 185 acre (Layne and Steiner
1996).
Figure 3-17 Eastern Indigo Snake Sightings
Chapter 3 Affected Environment
A-1 Flow Equalization Basin 3-43 February 2013 Draft Environmental Impact Statement
3.8.2.5.3 Audubon’s Crested Caracara
The Audubon’s crested caracara (Polyborus plancus audubonii) is federally listed as threatened.
It is a large non-migratory raptor with its overall distribution including the southern United
States, Mexico, and Central America to Panama. In Florida, the most abundant populations of
crested caracara are in Glades, Desoto, Highlands, Okeechobee, and Osceola counties, all of
which are located north and west of Lake Okeechobee (USFWS 1999). Caracaras are most
commonly found in dry or wet prairies with occasional cabbage palms (Sabal palmetto) or
scattered wooded vegetation. Prey include insects and other small invertebrates, small
mammals, reptiles, and fish. Because of changes in land use, the crested caracara also now
uses improved or semi-improved pastures (USFWS 1999). The primary threat to the crested
caracara is in the conversion from dried prairies to agriculture and development. The project
site is located within a USFWS crested caracara consultation area. See Figure 3-18 for the
nearest documented occurrence of the Audubon’s crested caracara in relation to the project
site.
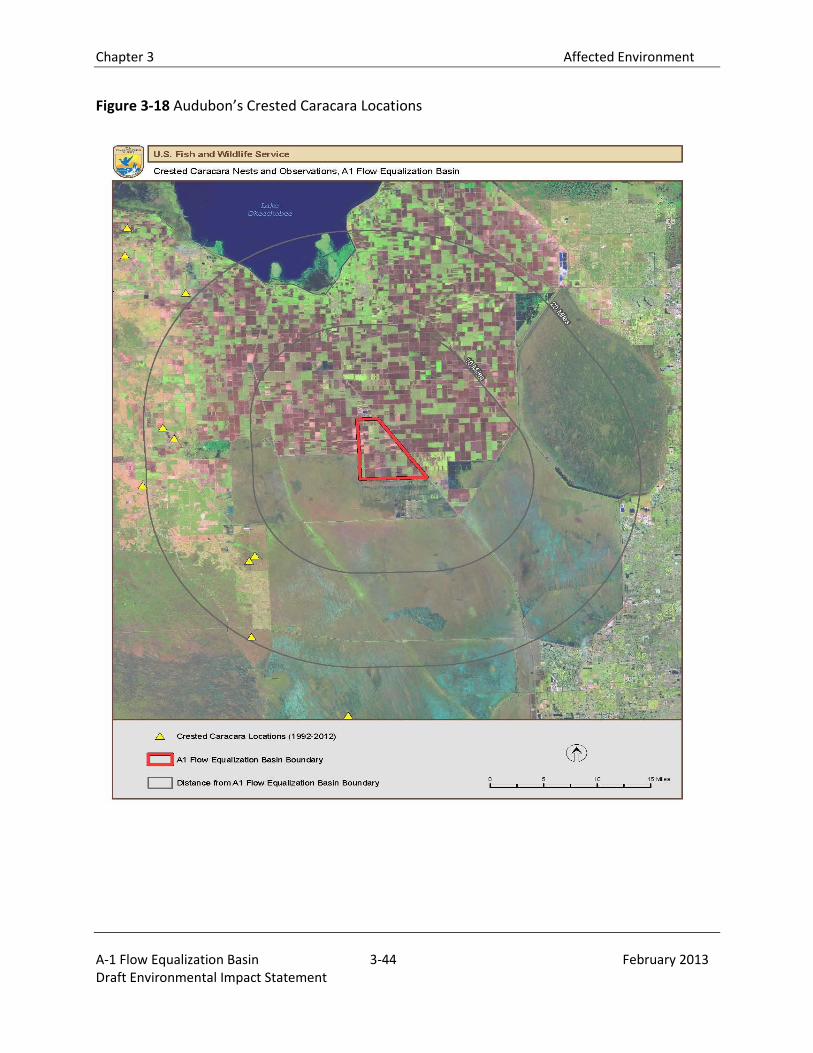
Chapter 3 Affected Environment
A-1 Flow Equalization Basin 3-44 February 2013 Draft Environmental Impact Statement
Figure 3-18 Audubon’s Crested Caracara Locations
Chapter 3 Affected Environment
A-1 Flow Equalization Basin 3-45 February 2013 Draft Environmental Impact Statement
3.8.2.5.4 Everglade Snail Kite
The endangered Everglade snail kite (Rostrhamus sociabilis plumbeus) is a medium sized raptor
that feeds almost entirely on apple snails (Pomacea paludosa) which are found in palustrine
emergent, long hydroperiod wetlands (USFWS, 1999). The snail kite’s foraging habitat is
restricted to clear, calm waters of freshwater marshes and shallow vegetated littoral zones of
lakes in South and Central Florida including Palm Beach and Hendry Counties. Snail kites
require small trees or shrubs near foraging areas as nest sites and shallow inundated areas to
sustain their food source, apple snail.
Apple snails inhabit a wide range of ecosystems from swamps, ditches and ponds to lakes and
rivers. Apple snails eat, feed, breed, and lay eggs on emergent vegetation in waterbodies that
are flooded continuously for longer than 1 year (USFWS 1999). Changes in water regimes and
depth and duration of inundation are important characteristics for wetland vegetation that
supports snail kite nesting and foraging habitat, Florida apple snails, and all aspects of snail kite
and apple snail life history. Rapid and/or large increases in water depth may detrimentally
affect desirable vegetation, and can flood out Florida apple snail eggs, leading to reductions in
apple snail populations and reduced snail kite foraging (USFWS 2006).
Designated critical habitat for the snail kite exists on the western side of Lake Okeechobee and
portions of the EPA, including WCA 1, WCA 2 and WCA 3A. Snail kites are also found in Holey
Land. Wood storks and snail kites have overlapping ranges, but different feeding mechanisms
and require different hydrologic conditions for optimum feeding. Historically, both have
survived with the hydrologic variability characteristic of the natural system. The reduced
heterogeneity and extent of natural area of the present system make the snail kites more
vulnerable to natural and human-caused threats (USFWS, 1999).
Loss and degradation of habitat are the primary threat to snail kites. Water levels, duration,
and quality are primary concerns in Everglade snail kite conservation. Water levels must allow
for appropriate nesting sites, durations of water levels must be sufficient to support apple snail
populations, and water quality must be such that invasive species do not take over Everglade
snail kite foraging habitat (USFWS 1999). The project site, the STAs and WCAs are all within
Everglade snail kite USFWS consultation area. The nearest nest to the project area, recorded in
2011, was located approximately 3 miles from the A-1 project site (Figure 3-19). The most
recent nests, recorded in 2012, were located 14.1 miles to the west and 22.3 miles to the east
(WCA 1).
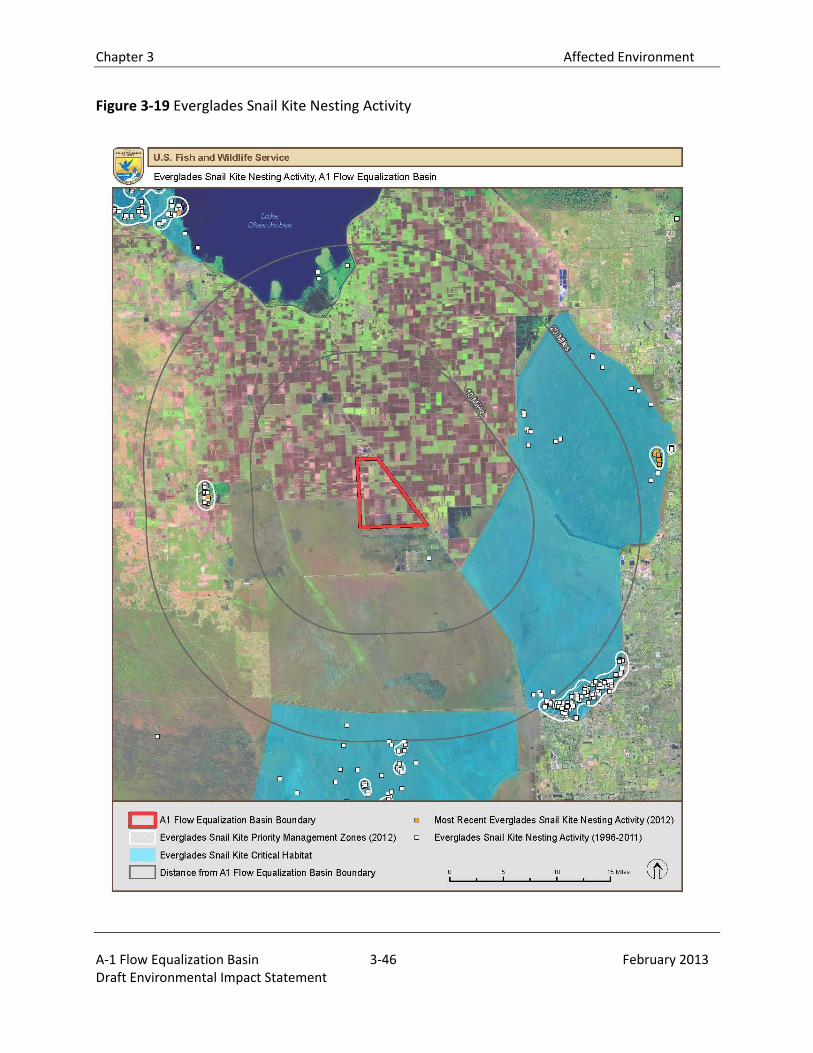
Chapter 3 Affected Environment
A-1 Flow Equalization Basin 3-46 February 2013 Draft Environmental Impact Statement
Figure 3-19 Everglades Snail Kite Nesting Activity
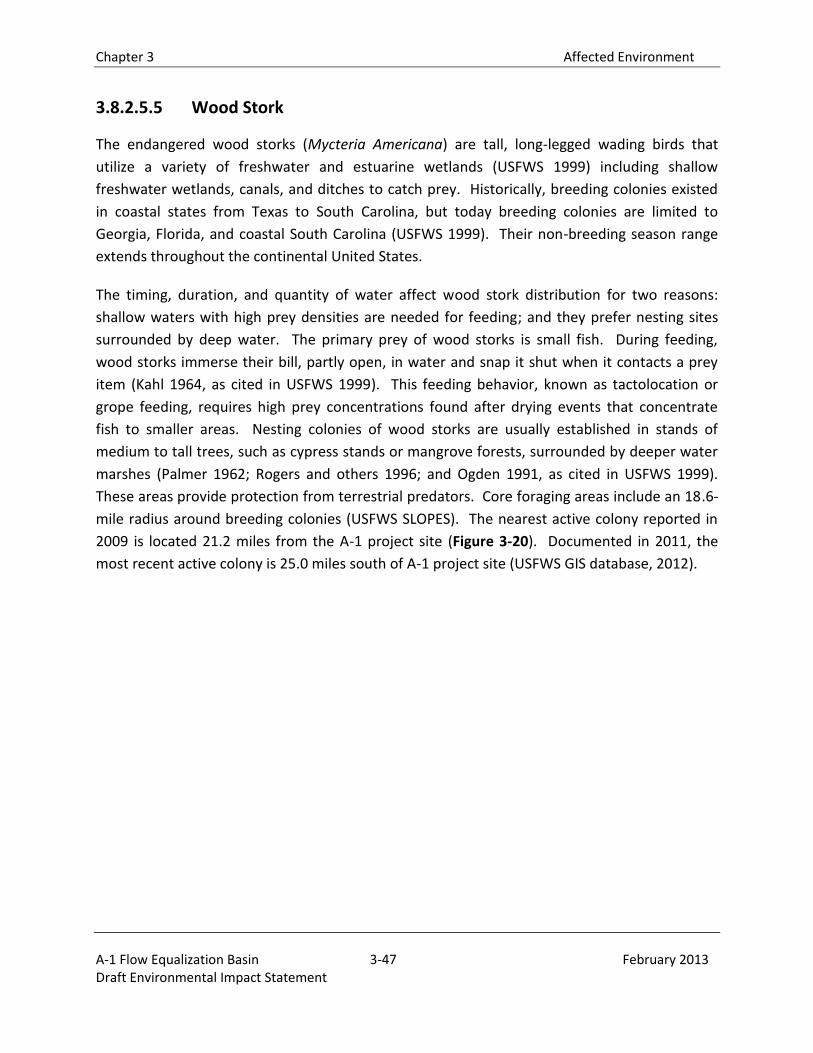
Chapter 3 Affected Environment
A-1 Flow Equalization Basin 3-47 February 2013 Draft Environmental Impact Statement
3.8.2.5.5 Wood Stork
The endangered wood storks (Mycteria Americana) are tall, long-legged wading birds that
utilize a variety of freshwater and estuarine wetlands (USFWS 1999) including shallow
freshwater wetlands, canals, and ditches to catch prey. Historically, breeding colonies existed
in coastal states from Texas to South Carolina, but today breeding colonies are limited to
Georgia, Florida, and coastal South Carolina (USFWS 1999). Their non-breeding season range
extends throughout the continental United States.
The timing, duration, and quantity of water affect wood stork distribution for two reasons:
shallow waters with high prey densities are needed for feeding; and they prefer nesting sites
surrounded by deep water. The primary prey of wood storks is small fish. During feeding,
wood storks immerse their bill, partly open, in water and snap it shut when it contacts a prey
item (Kahl 1964, as cited in USFWS 1999). This feeding behavior, known as tactolocation or
grope feeding, requires high prey concentrations found after drying events that concentrate
fish to smaller areas. Nesting colonies of wood storks are usually established in stands of
medium to tall trees, such as cypress stands or mangrove forests, surrounded by deeper water
marshes (Palmer 1962; Rogers and others 1996; and Ogden 1991, as cited in USFWS 1999).
These areas provide protection from terrestrial predators. Core foraging areas include an 18.6-
mile radius around breeding colonies (USFWS SLOPES). The nearest active colony reported in
2009 is located 21.2 miles from the A-1 project site (Figure 3-20). Documented in 2011, the
most recent active colony is 25.0 miles south of A-1 project site (USFWS GIS database, 2012).
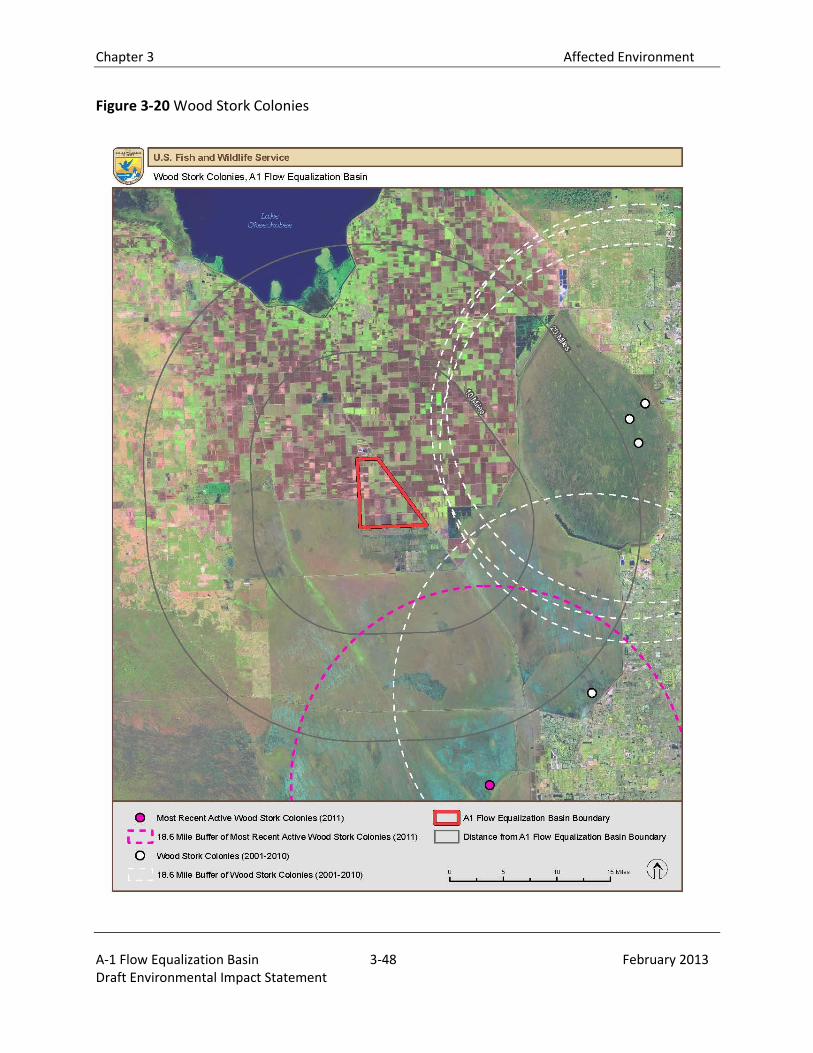
Chapter 3 Affected Environment
A-1 Flow Equalization Basin 3-48 February 2013 Draft Environmental Impact Statement
Figure 3-20 Wood Stork Colonies
Chapter 3 Affected Environment
A-1 Flow Equalization Basin 3-49 February 2013 Draft Environmental Impact Statement
3.8.2.5.6 Florida Panther
The Florida panther (Puma concolor coryi), a medium-sized tawny-colored long-tailed puma, is
one of the most federally listed endangered land mammal. At one time, the panther’s range
extended through Arkansas, Louisiana, Mississippi, Alabama, Georgia, Southern Tennessee,
South Carolina, and Florida. Today, the only existing population is found in a two million acre
area in central and South Florida with population estimates of only 80 total individuals, 30 to 50
adults and approximately 30 subadults (USFWS 1999). The Big Cypress Swamps/Everglades has
the only known breeding panther population (USFWS 1999).
The Florida panther, a subspecies of the mountain lion, is Florida’s designated state mammal.
Male panthers weigh 102 to 154 pounds and reach 7 feet in length, while the smaller females
weigh 50 to 108 pounds and reach 6 feet in length (Roelke 1990). Panther’s preferred habitats
are hardwood hammocks and pine flatwoods, but they can also be found in wetlands and
disturbed habitat (USFWS 1999). The panther diet includes feral hogs (Sus scrofa), white-tailed
deer (Odocoileus virginianus), raccoon (Procyon lotor), and armadillo (Dasypus novemcinctus)
(Maehr et. al. 1990).
Habitat loss and fragmentation from development are the largest threat to panthers and have
lead to inbreeding, reduced prey availability, and mortality from vehicle strikes. An individual
panther range may extend on average 200 square miles for males and 74 square miles for
females (Land 1994). The panther’s wide-range recovery plan cites three conditions necessary
for the survival and recovery of the species: (1) protection and enhancement of existing
populations, habitats, and prey resources; (2) improving genetic health and population viability;
and (3) re-establishing a minimum of two more reproducing populations within the historical
range.
Panther telemetry data from 1981 to 2005 show panthers in the EAA, including areas directly
adjacent to the project site and in WCA 3A (USFWS 2006). Based on the USFWS’ GIS Database,
Figure 3-21 depicts the panther telemetry data from 1997 through 2011 while Figure 3-22
indicates recent occurrences in the area.
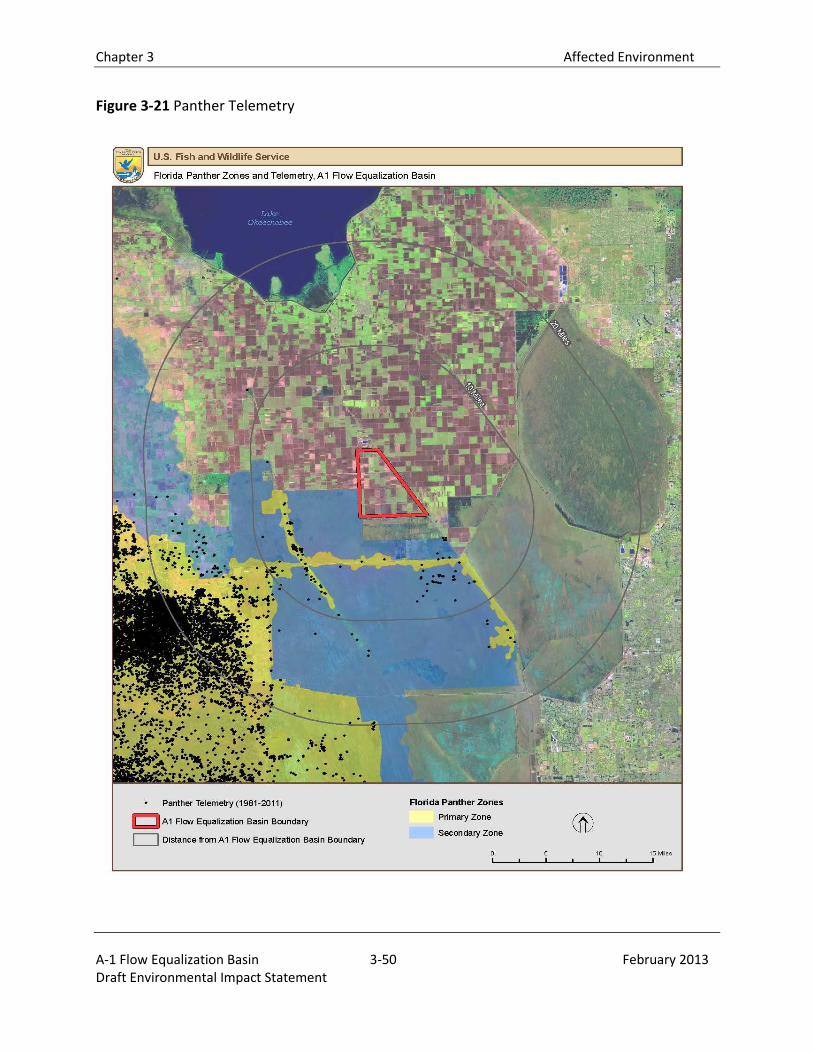
Chapter 3 Affected Environment
A-1 Flow Equalization Basin 3-50 February 2013 Draft Environmental Impact Statement
Figure 3-21 Panther Telemetry
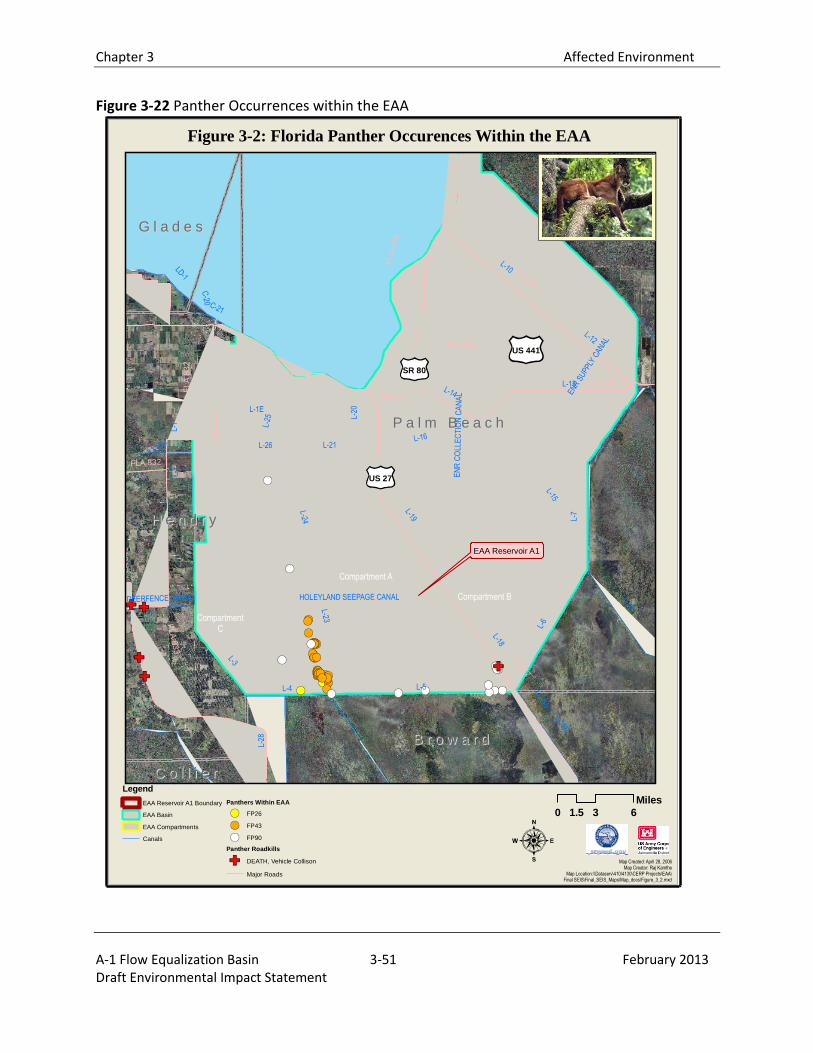
Chapter 3 Affected Environment
A-1 Flow Equalization Basin 3-51 February 2013 Draft Environmental Impact Statement
Figure 3-22 Panther Occurrences within the EAA
EAA Reservoir A1
CompartmentC
Compartment A
Compartment B
US 441
SR 80
US 27
P a l m B e a c hP a l m B e a c h
H e n d r yH e n d r y
B r o w a r dB r o w a r d
G l a d e sG l a d e s
C o l l i e rC o l l i e r
L-8
L-3L-
7
L-5
L-23
L-6
L-15
L-13
L-18
L-12
L-10
L-1
L-19
L-14
L-24
L-4
L-16
L-39
L-21
L-28
L-1E
L-38E
L-25 L-
20
L-38W
LD-1
L-2W
L-2
L-26
C-21
HOLEYLAND SEEPAGE CANAL
C-20
DEERFENCE CANAL
NO
RT
H F
EE
DE
R C
AN
AL
EN
R C
OLL
EC
TIO
N C
AN
AL EN
R S
UPP
LY C
ANAL
US 27
US 98
US 441
FLA
83
3
FLA 880
FLA
84
6
FLA
83
2
SR 80F
LA
729
FLA 832
0 3 61.5
Miles
Map Created: April 28, 2006Map Creator: Raj Kamthe
Map Location:\\Dataserv\410\4130\CERP Projects\EAA\Final SEIS\Final_SEIS_Maps\Map_docs\Figure_3_2.mxd
Legend
EAA Reservoir A1 Boundary
EAA Basin
EAA Compartments
Canals
Panthers Within EAA
FP26
FP43
FP90
Panther Roadkills
DEATH, Vehicle Collison
Major Roads
Figure 3-2: Florida Panther Occurences Within the EAA
Chapter 3 Affected Environment
A-1 Flow Equalization Basin 3-52 February 2013 Draft Environmental Impact Statement
3.8.3 STATE LISTED SPECIES
3.8.3.1 Overall Area
The project site and the affected areas contain habitat for several state listed species. State
listed endangered animal species include the whooping crane (Grus Americana) while the listed
threatened animal species include the Florida sandhill crane (Grus Canadensis pratensis). The
species of special concern include the Florida mouse (Podomys floridanus), black skimmer
(Rynchopsniger), limpkin (Aramus guarauna), reddish egret (Egretta rufescens), snowy egret
(Egretta thula), little blue heron (Egretta caerulea), tricolored heron (Egretta tricolor), white ibis
(Eudocimus albus), roseate spoonbill (Ajaia ajaia), the burrowing owl (Athene cunicularia),
gopher tortoise (Gopherus polyphemus), and the gopher frog (Rana capito). Information for
each species was obtained directly from the Florida Fish and Wildlife Conservation
Commission’s website at:
http://myfwc.com/wildlifehabitats/imperiled/profiles.
3.8.3.2 Endangered Species
3.8.3.2.1 Whooping Crane
The whooping crane is the tallest bird in North America, standing nearly five feet tall with a
wing span of seven to eight feet. Adult whooping cranes are solid white with a red crown on
their head, long black legs, and a long “S” shaped neck. Whooping crane chicks have a
cinnamon brown body color; however, by the age of four months they will begin to gain adult-
like white feathers. The diet of whooping cranes primarily consists of aquatic invertebrates
(insects, crustaceans, and mollusks), small vertebrates (fish, reptiles, amphibians, birds, and
mammals), roots, acorns, and berries.
While courting, males will perform a dancing ritual that includes them jumping, flapping their
wings, and tossing objects into the air (The Cornell Lab of Ornithology 2011). The nesting
season in Wood Buffalo National Park (located in Alberta and the Northwest Territories of
Canada) occurs between the months of April and May, while cranes in Florida breed between
the months of January and May. The clutch size for the whooping crane ranges from one to
three eggs (M. Folk pers comm. 2011). Eggs are incubated for 29-31 days with both parents
sharing the incubating duties. Breeding pairs will re-nest if the first clutch of eggs is destroyed
before mid-incubation. It is rare for more than one of the chicks from a single nest to survive.
Whooping crane chicks are able to fly (fledge) at 80 to 90 days old. Juvenile migratory cranes
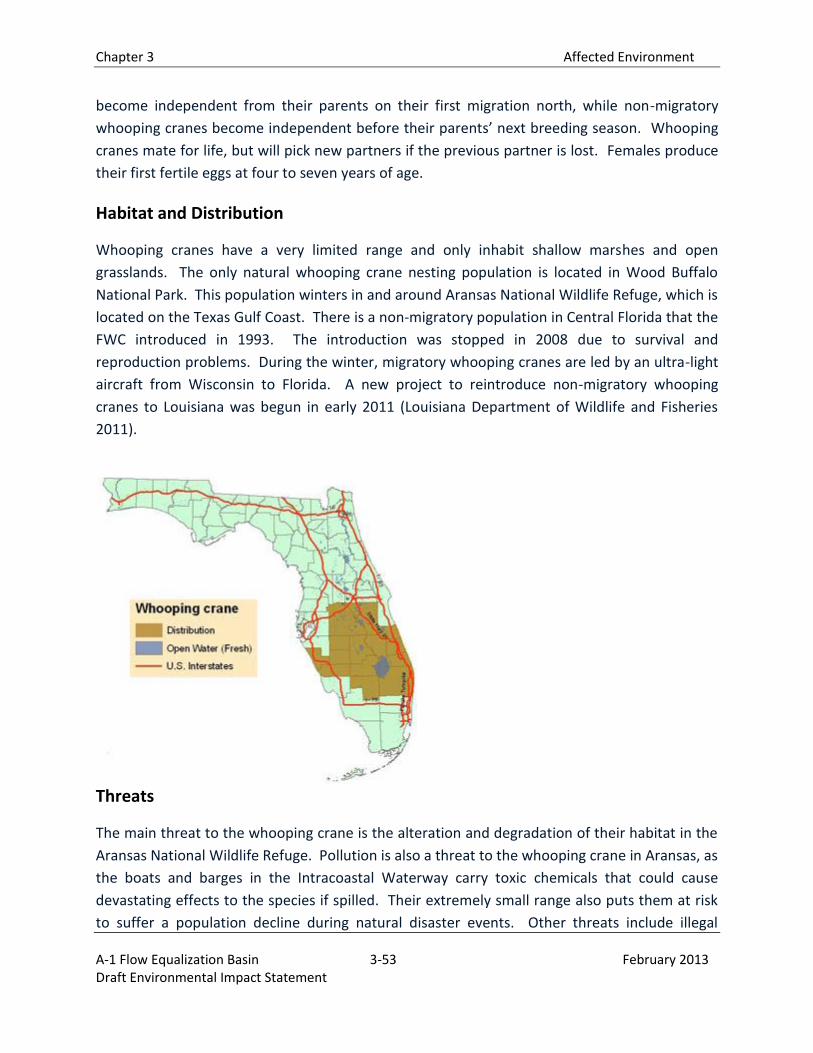
Chapter 3 Affected Environment
A-1 Flow Equalization Basin 3-53 February 2013 Draft Environmental Impact Statement
become independent from their parents on their first migration north, while non-migratory
whooping cranes become independent before their parents’ next breeding season. Whooping
cranes mate for life, but will pick new partners if the previous partner is lost. Females produce
their first fertile eggs at four to seven years of age.
Habitat and Distribution
Whooping cranes have a very limited range and only inhabit shallow marshes and open
grasslands. The only natural whooping crane nesting population is located in Wood Buffalo
National Park. This population winters in and around Aransas National Wildlife Refuge, which is
located on the Texas Gulf Coast. There is a non-migratory population in Central Florida that the
FWC introduced in 1993. The introduction was stopped in 2008 due to survival and
reproduction problems. During the winter, migratory whooping cranes are led by an ultra-light
aircraft from Wisconsin to Florida. A new project to reintroduce non-migratory whooping
cranes to Louisiana was begun in early 2011 (Louisiana Department of Wildlife and Fisheries
2011).
Threats
The main threat to the whooping crane is the alteration and degradation of their habitat in the
Aransas National Wildlife Refuge. Pollution is also a threat to the whooping crane in Aransas, as
the boats and barges in the Intracoastal Waterway carry toxic chemicals that could cause
devastating effects to the species if spilled. Their extremely small range also puts them at risk
to suffer a population decline during natural disaster events. Other threats include illegal
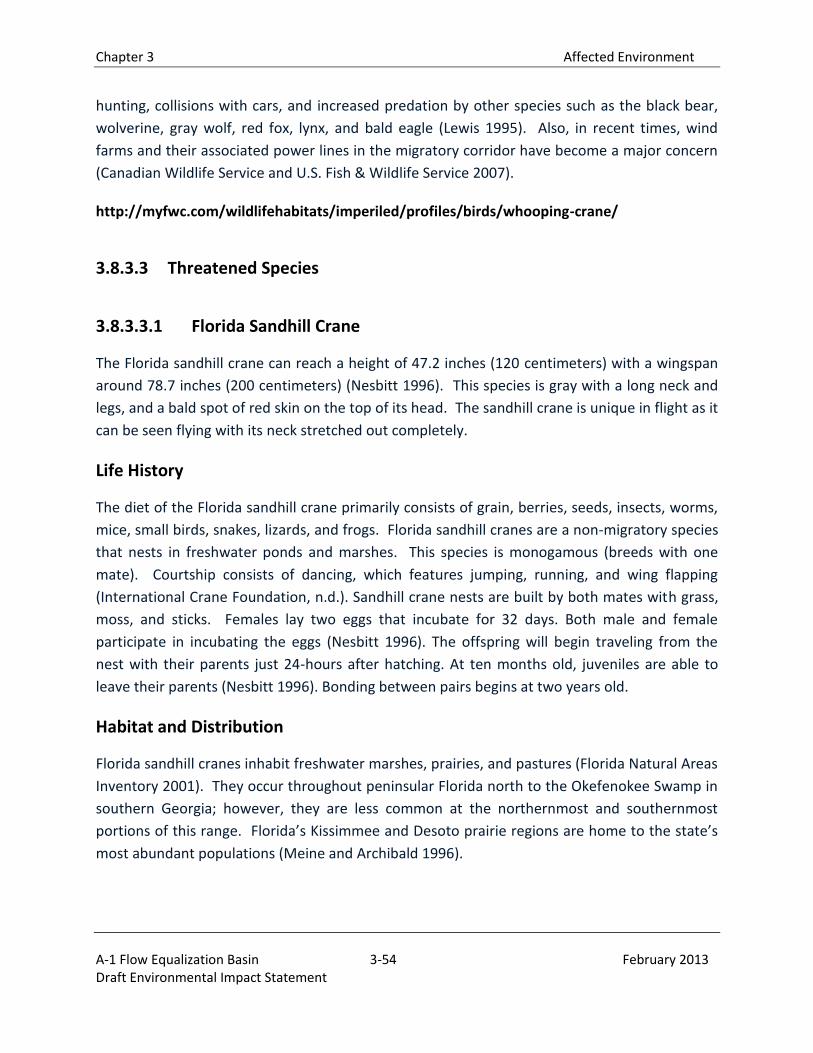
Chapter 3 Affected Environment
A-1 Flow Equalization Basin 3-54 February 2013 Draft Environmental Impact Statement
hunting, collisions with cars, and increased predation by other species such as the black bear,
wolverine, gray wolf, red fox, lynx, and bald eagle (Lewis 1995). Also, in recent times, wind
farms and their associated power lines in the migratory corridor have become a major concern
(Canadian Wildlife Service and U.S. Fish & Wildlife Service 2007).
http://myfwc.com/wildlifehabitats/imperiled/profiles/birds/whooping-crane/
3.8.3.3 Threatened Species
3.8.3.3.1 Florida Sandhill Crane
The Florida sandhill crane can reach a height of 47.2 inches (120 centimeters) with a wingspan
around 78.7 inches (200 centimeters) (Nesbitt 1996). This species is gray with a long neck and
legs, and a bald spot of red skin on the top of its head. The sandhill crane is unique in flight as it
can be seen flying with its neck stretched out completely.
Life History
The diet of the Florida sandhill crane primarily consists of grain, berries, seeds, insects, worms,
mice, small birds, snakes, lizards, and frogs. Florida sandhill cranes are a non-migratory species
that nests in freshwater ponds and marshes. This species is monogamous (breeds with one
mate). Courtship consists of dancing, which features jumping, running, and wing flapping
(International Crane Foundation, n.d.). Sandhill crane nests are built by both mates with grass,
moss, and sticks. Females lay two eggs that incubate for 32 days. Both male and female
participate in incubating the eggs (Nesbitt 1996). The offspring will begin traveling from the
nest with their parents just 24-hours after hatching. At ten months old, juveniles are able to
leave their parents (Nesbitt 1996). Bonding between pairs begins at two years old.
Habitat and Distribution
Florida sandhill cranes inhabit freshwater marshes, prairies, and pastures (Florida Natural Areas
Inventory 2001). They occur throughout peninsular Florida north to the Okefenokee Swamp in
southern Georgia; however, they are less common at the northernmost and southernmost
portions of this range. Florida’s Kissimmee and Desoto prairie regions are home to the state’s
most abundant populations (Meine and Archibald 1996).
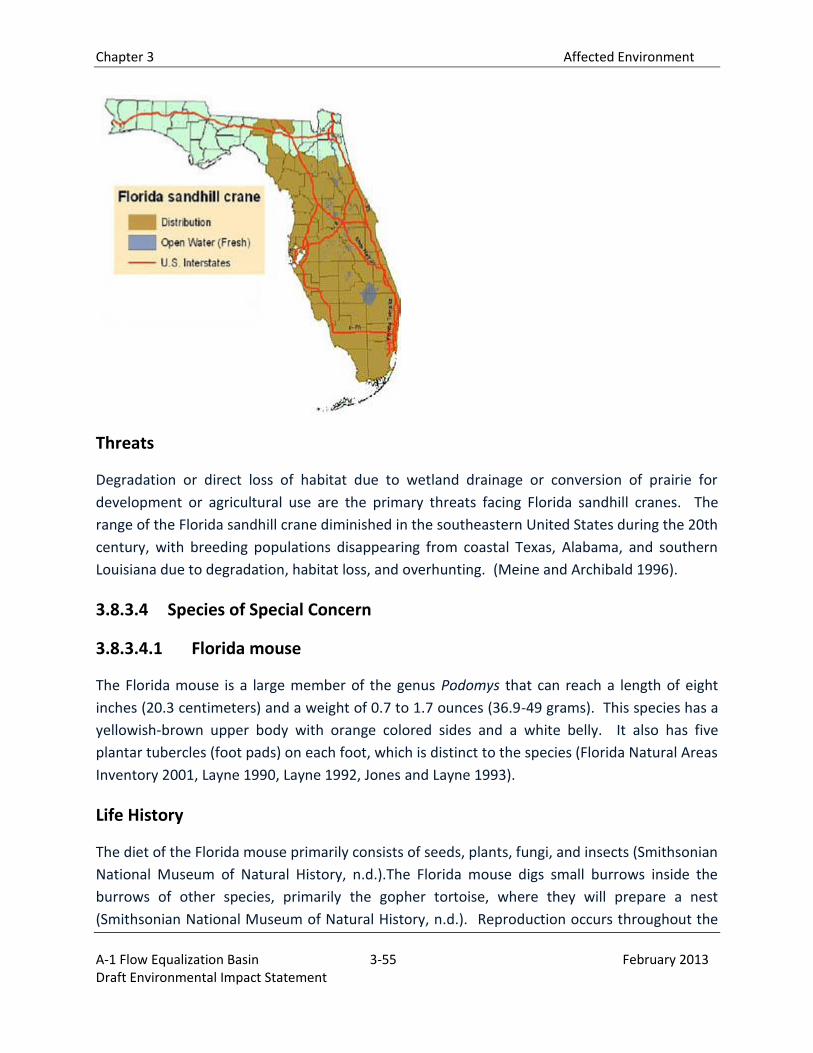
Chapter 3 Affected Environment
A-1 Flow Equalization Basin 3-55 February 2013 Draft Environmental Impact Statement
Threats
Degradation or direct loss of habitat due to wetland drainage or conversion of prairie for
development or agricultural use are the primary threats facing Florida sandhill cranes. The
range of the Florida sandhill crane diminished in the southeastern United States during the 20th
century, with breeding populations disappearing from coastal Texas, Alabama, and southern
Louisiana due to degradation, habitat loss, and overhunting. (Meine and Archibald 1996).
3.8.3.4 Species of Special Concern
3.8.3.4.1 Florida mouse
The Florida mouse is a large member of the genus Podomys that can reach a length of eight
inches (20.3 centimeters) and a weight of 0.7 to 1.7 ounces (36.9-49 grams). This species has a
yellowish-brown upper body with orange colored sides and a white belly. It also has five
plantar tubercles (foot pads) on each foot, which is distinct to the species (Florida Natural Areas
Inventory 2001, Layne 1990, Layne 1992, Jones and Layne 1993).
Life History
The diet of the Florida mouse primarily consists of seeds, plants, fungi, and insects (Smithsonian
National Museum of Natural History, n.d.).The Florida mouse digs small burrows inside the
burrows of other species, primarily the gopher tortoise, where they will prepare a nest
(Smithsonian National Museum of Natural History, n.d.). Reproduction occurs throughout the
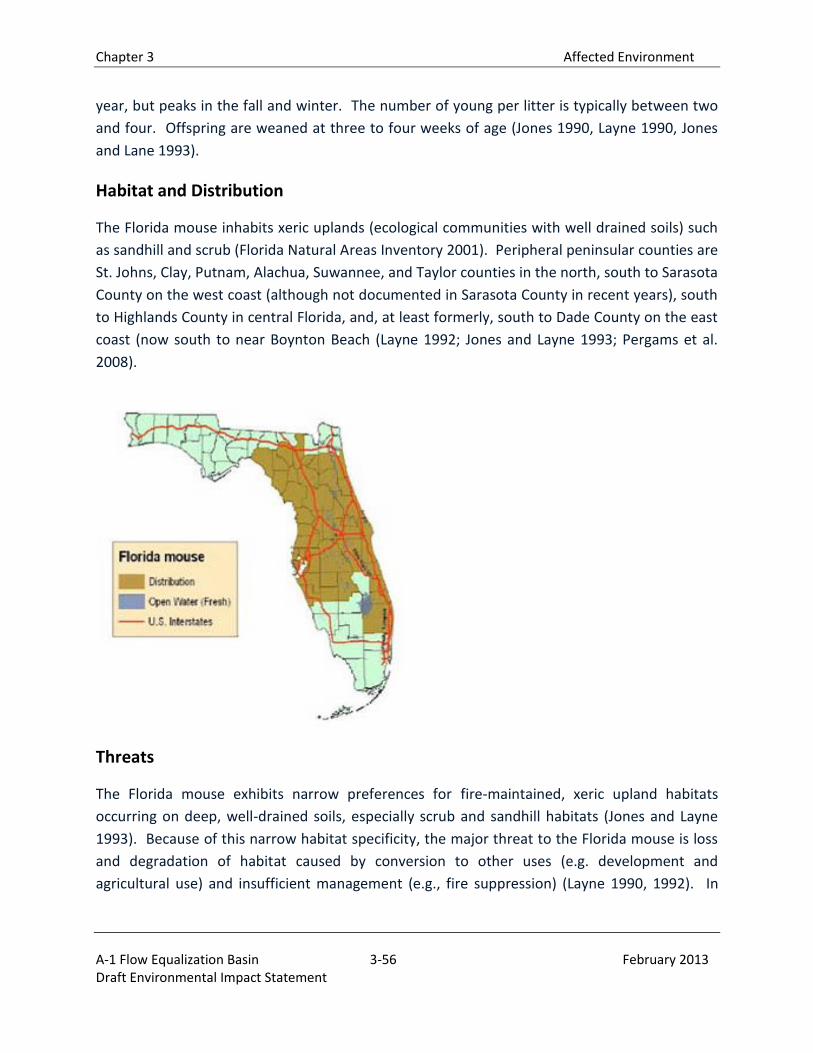
Chapter 3 Affected Environment
A-1 Flow Equalization Basin 3-56 February 2013 Draft Environmental Impact Statement
year, but peaks in the fall and winter. The number of young per litter is typically between two
and four. Offspring are weaned at three to four weeks of age (Jones 1990, Layne 1990, Jones
and Lane 1993).
Habitat and Distribution
The Florida mouse inhabits xeric uplands (ecological communities with well drained soils) such
as sandhill and scrub (Florida Natural Areas Inventory 2001). Peripheral peninsular counties are
St. Johns, Clay, Putnam, Alachua, Suwannee, and Taylor counties in the north, south to Sarasota
County on the west coast (although not documented in Sarasota County in recent years), south
to Highlands County in central Florida, and, at least formerly, south to Dade County on the east
coast (now south to near Boynton Beach (Layne 1992; Jones and Layne 1993; Pergams et al.
2008).
Threats
The Florida mouse exhibits narrow preferences for fire-maintained, xeric upland habitats
occurring on deep, well-drained soils, especially scrub and sandhill habitats (Jones and Layne
1993). Because of this narrow habitat specificity, the major threat to the Florida mouse is loss
and degradation of habitat caused by conversion to other uses (e.g. development and
agricultural use) and insufficient management (e.g., fire suppression) (Layne 1990, 1992). In
Chapter 3 Affected Environment
A-1 Flow Equalization Basin 3-57 February 2013 Draft Environmental Impact Statement
Highlands County, 64% of the species’ habitat was destroyed between 1940 and 1980, with an
additional 10% considered disturbed or degraded (Layne 1992).
http://myfwc.com/wildlifehabitats/imperiled/profiles/mammals/florida-mouse/
3.8.3.4.2 Black skimmer
The black skimmer is a seabird with defining physical characteristics that make it easily
distinguishable from others. The key physical feature of the skimmer is its large red and black
bill. The bill begins to widen at the top and gradually becomes smaller as it forms a sharp tip at
the end of the bill. The lower part of the bill is longer than the top, which is important because
they use their bill to skim along the top of the water to catch fish, for which they are aptly
named. Skimmers can reach a height of 19.7 inches (50 centimeters) with a wingspan of 3 to
3.5 feet (.9-1.1 meters) (The Cornell Lab of Ornithology 2011, E. Sachs pers. comm. 2011).
Skimmers have a black back, black wings with white edging, and a white belly and head.
Life History
The diet of the black skimmer primarily consists of fish. The skimmer has a unique style of
feeding that involves literally “skimming” the surface of the water with their lower bill. When
they contact a prey item, they quickly bend their head forward and snap the upper bill closed,
seizing their prey. Breeding occurs during the summer, generally between May and early
September (Katja Schulz, n.d.). Skimmers nest on the sand along beaches, sandbars, and
islands developed by dredged-up material. Nesting occurs in colonies consisting of one to
several hundred pairs of skimmers. Skimmers are protective of their nests and offspring and
will utilize group mobbing to protect the nests. Skimmers usually lay three to five eggs per nest
and eggs are incubated by both parents for approximately 23-25 days (The Cornell Lab of
Ornithology 2011). Each parent incubates the eggs for up to four hours at a time (Gochfield
and Burger, 1994). Once hatched, parents guard the offspring until they are able to fly at about
28-30 days old (Katja Schulz, n.d.).
Habitat and Distribution
The black skimmer inhabits coastal areas in Florida such as estuaries, beaches, and sandbars.
Skimmers can be found from the coasts of the northeastern U.S., down to Mexico, and over to
the Gulf Coast of Florida. Breeding range is from Southern California, down to Ecuador.
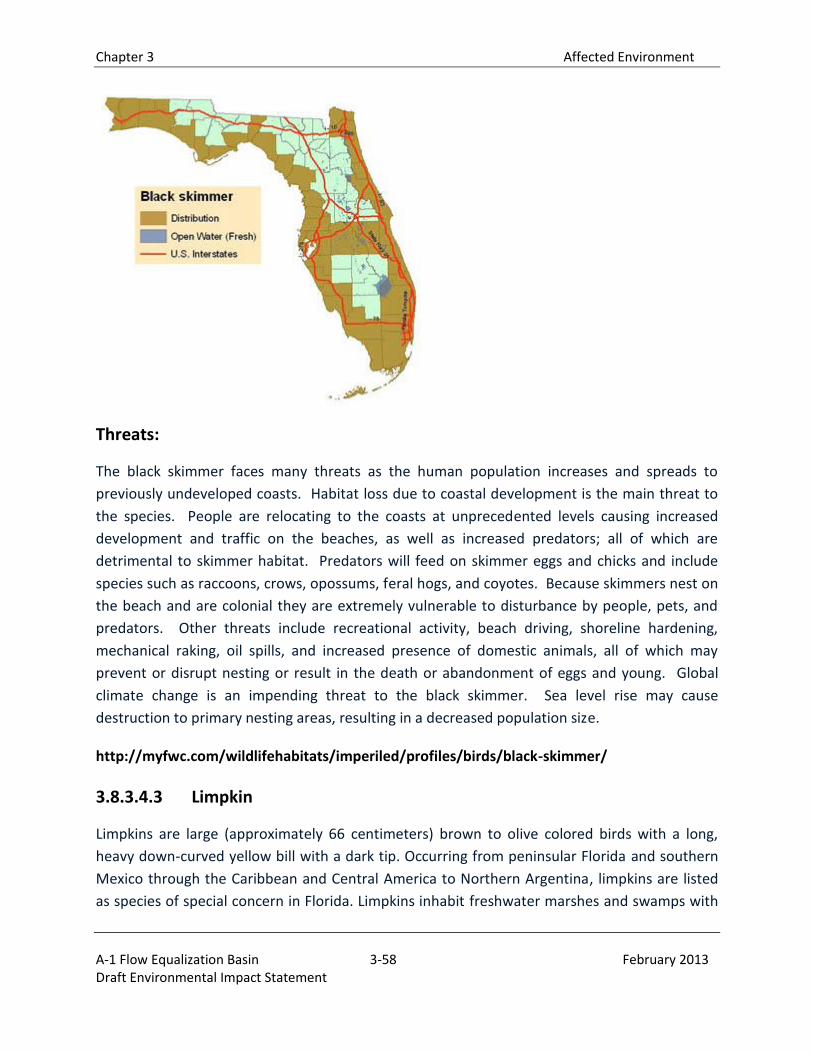
Chapter 3 Affected Environment
A-1 Flow Equalization Basin 3-58 February 2013 Draft Environmental Impact Statement
Threats:
The black skimmer faces many threats as the human population increases and spreads to
previously undeveloped coasts. Habitat loss due to coastal development is the main threat to
the species. People are relocating to the coasts at unprecedented levels causing increased
development and traffic on the beaches, as well as increased predators; all of which are
detrimental to skimmer habitat. Predators will feed on skimmer eggs and chicks and include
species such as raccoons, crows, opossums, feral hogs, and coyotes. Because skimmers nest on
the beach and are colonial they are extremely vulnerable to disturbance by people, pets, and
predators. Other threats include recreational activity, beach driving, shoreline hardening,
mechanical raking, oil spills, and increased presence of domestic animals, all of which may
prevent or disrupt nesting or result in the death or abandonment of eggs and young. Global
climate change is an impending threat to the black skimmer. Sea level rise may cause
destruction to primary nesting areas, resulting in a decreased population size.
http://myfwc.com/wildlifehabitats/imperiled/profiles/birds/black-skimmer/
3.8.3.4.3 Limpkin
Limpkins are large (approximately 66 centimeters) brown to olive colored birds with a long,
heavy down-curved yellow bill with a dark tip. Occurring from peninsular Florida and southern
Mexico through the Caribbean and Central America to Northern Argentina, limpkins are listed
as species of special concern in Florida. Limpkins inhabit freshwater marshes and swamps with
Chapter 3 Affected Environment
A-1 Flow Equalization Basin 3-59 February 2013 Draft Environmental Impact Statement
tall reeds, as well as mangroves. They are largely nocturnal, but daytime activities have also
been observed (Holyoak and Colston 2003).Limpkins forage primarily in shallow water and on
floating vegetation, such as water hyacinth and water lettuce. Similar to snail kite, this wading
bird species feeds primarily on apple snails of the genus Pomacea. The availability of apple
snails has a significant effect on the local distribution of the limpkin (Cottam 1936). Freshwater
mussels and other species of snail are secondary food resources. Less important prey items
include insects, frogs, lizards, crustaceans and worms, which may be important dietary
components during periods of drought or flooding when birds may be forced to forage in
suboptimal areas.
3.8.3.4.4 White Ibis
The white ibis is easily identified by its long red legs, all white plumage, red face, long decurved
red bill and black tipped wings. White ibises are medium-sized wading birds, weighing about
two pounds, with a 36-inch wingspan, and a length of 24 inches. White ibises inhabit shallow
coastal marshes, wetlands and mangrove swamps and feed on crayfish, crabs, insects, snakes,
frogs and fish (Kushlan and Bildstein 1992). Nesting occurs in trees, shrubs, and grass clumps
from ground level to a height of 50 feet. Nests are constructed of vegetation sticks, leaves
and/or roots. Females typically lay two to three eggs; eggs are incubated for 21 to 22 days. The
young are able to leave the nest at 9 to 16 days of age. Nestlings are independent at 40 to 50
days of age. Breeding season extends from March to August (FWC 2003c). Ibises are known for
frequent shifts in roost and colony sites.
The white ibis has been recorded breeding throughout the state of Florida; the center of
breeding abundance occurs in the Everglades, with breeding populations extending into Florida
Bay and the Keys (FWC 2003c). Aerial surveys have revealed 90 percent declines in south
Florida breeding pairs since the 1940s and 20 to 50 percent declines statewide during the past
decade. Because of this, the FWC listed the white ibis as a state listed species of special
concern (FWC 2003c). Population declines of the species are attributed to loss and degradation
of suitable habitat; however, large populations of white ibises remain.
The white ibis is a midsized member of the Family Threskiornithidae. This species is
approximately 22 inches (56 centimeters) long with a wingspan of approximately 37 inches (96
centimeters) (Frederick 1996). Adults are mostly white with black tipped wings, a red face, red
legs, and a very distinct downcurved, pink bill which is used to probe the ground for food while
foraging.
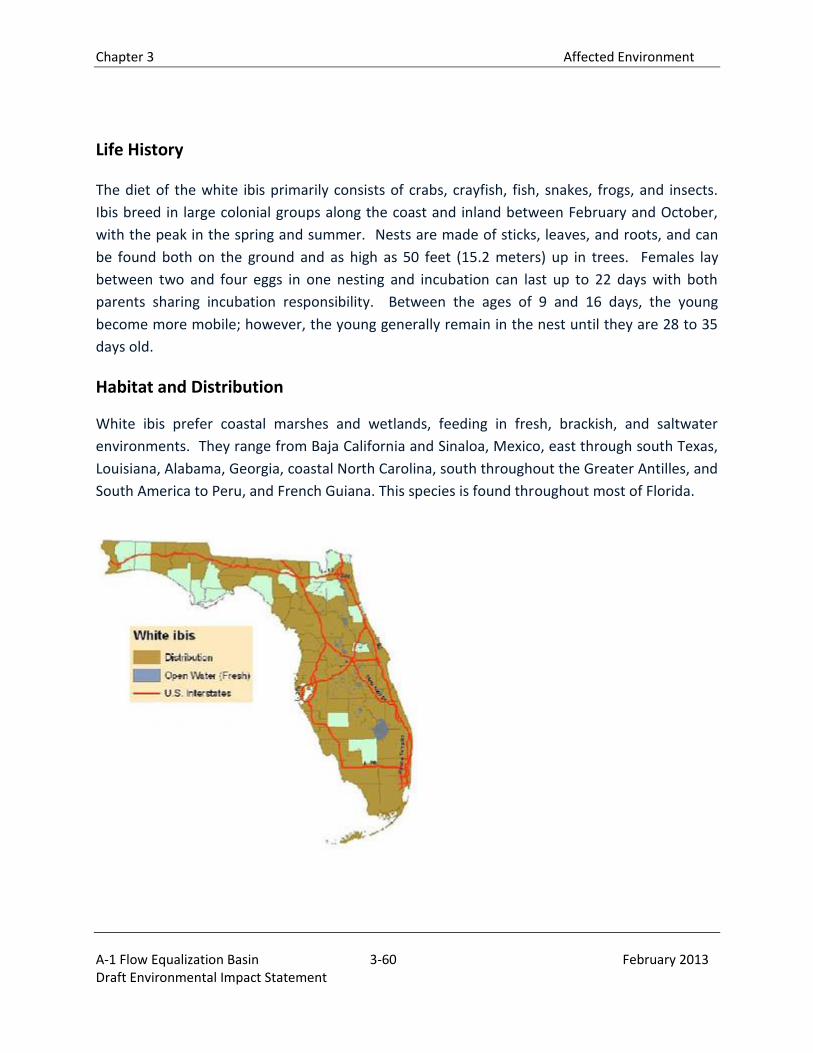
Chapter 3 Affected Environment
A-1 Flow Equalization Basin 3-60 February 2013 Draft Environmental Impact Statement
Life History
The diet of the white ibis primarily consists of crabs, crayfish, fish, snakes, frogs, and insects.
Ibis breed in large colonial groups along the coast and inland between February and October,
with the peak in the spring and summer. Nests are made of sticks, leaves, and roots, and can
be found both on the ground and as high as 50 feet (15.2 meters) up in trees. Females lay
between two and four eggs in one nesting and incubation can last up to 22 days with both
parents sharing incubation responsibility. Between the ages of 9 and 16 days, the young
become more mobile; however, the young generally remain in the nest until they are 28 to 35
days old.
Habitat and Distribution
White ibis prefer coastal marshes and wetlands, feeding in fresh, brackish, and saltwater
environments. They range from Baja California and Sinaloa, Mexico, east through south Texas,
Louisiana, Alabama, Georgia, coastal North Carolina, south throughout the Greater Antilles, and
South America to Peru, and French Guiana. This species is found throughout most of Florida.
Chapter 3 Affected Environment
A-1 Flow Equalization Basin 3-61 February 2013 Draft Environmental Impact Statement
Threats:
The main threat to the white ibis is the loss of wetland habitat due to the human development
of coastal areas and their freshwater feeding areas. The alteration of wetlands, pollution, and
saltwater influxes are other habitat threats as these practices degrade the quality of wetlands
and decrease the availability of prey (Florida Natural Areas Inventory 2001, Bildstein et al. 1990,
Frederick 1987, Adams and Frederick 2009, Herring et al. 2010).
3.8.3.4.5 Snowy Egret, Reddish Egret, Little Blue Heron and Tricolored Heron
The snowy egret, reddish egret, little blue heron and tricolored heron are listed by the FWC as a
species of special concern. Snowy egrets are medium sized herons, with entirely white
plumage, long slender black bills, long black legs and bright yellow feet (Parsons and Masters
2000). The snowy egret breeds in Florida from January through August, breeding mostly in
central and southern Florida in freshwater and saltwater marshes (FWC 2003c). The tricolored
heron occupies similar habitats; breeding occurs in February through August (FWC 2003c). The
tricolored heron is ornately colored; it is slate-blue on its head and upper body and has a
purplish chest with white under parts and fore-neck (Frederick 1997). The little blue heron is a
smaller-sized heron, dark overall with yellow-green legs, and a blue bill with a black tip (Rodgers
and Smith 1995). The little blue heron shows a preference for freshwater habitat; however, it
also inhabits saltwater marshes. Little blue herons breed later than tricolored herons or snowy
egrets; breeding occurs in April through September in Florida. The little blue heron is more
widely distributed throughout the state in comparison to the tricolored herons or snowy egrets.
Like the snowy egret, breeding populations are concentrated in central and southern Florida
(FWC 2003c).
Reddish egrets have two color morphs; white and dark. Dark morphs have gray bodies with
chestnut heads, blue legs and pink bills with black tips (Lowther and Paul 2002). The reddish
egret is the rarest heron in Florida and is entirely restricted to the Florida coast with
concentrations in Florida Bay and the Keys; two-thirds of the state’s breeding population. The
heron forages on shallow flats and sandbars for fish species, including killifish. In Florida Bay,
reddish egrets nest from November through May (FWC 2003c). Population declines of the
species are attributed to loss and degradation of suitable habitat. Target nest numbers for
snowy egrets and tricolored herons combined are 10,000 to 20,000 pairs. Nesting targets for
the snowy egret and tricolored heron have not been met in the WCAs and ENP since the
implementation of IOP in 2002. Nesting effort (number of nests) of these species from 2002 to
2008 is summarized as follows; 2000-2002: 8,614 pairs, 2001-2003: 8,088 pairs, 2002-2004:
8,079, 2003-2005: 4,085 pairs, 2004-2006: 6,410 pairs, 2005-2007: 4,400 pairs, 2006-2008
Chapter 3 Affected Environment
A-1 Flow Equalization Basin 3-62 February 2013 Draft Environmental Impact Statement
3,778 pairs(SFWMD 2009b). However, target numbers have not been met prior to the current
operating regime; 1998-2000: 2,788 pairs, 1999-2001 4,270 pairs. Little blue heron censuses
from aerial surveys are unreliable due to its dark plumage and tendency to nest in small,
isolated colonies (FWC 2003c).
3.8.3.4.6 Roseate Spoonbill
Roseate spoonbills have a pink body with a white neck and breast, pink wings with highlights of
red and long reddish legs. Spoonbills have an unfeathered head which can be yellow or green.
Roseate spoonbills are large wading birds, weighing about three pounds and have a 50-inch
wingspan. Characteristic to the species is a long, spatulate bill. The spoonbill feeds by wading
through shallow water, head down, probing the bottom by sweeping its long, spoon-shaped bill
back and forth in the water. When prey is detected by touch, the bill snaps shut; small fish,
crustaceans, and insects make up the bulk of the diet (Dumas 2000). Spoonbills typically
establish nests in Florida Bay between November 1 and December 15, with a mean nest
initiation date of November 18. Females typically lay three eggs; eggs are incubated for about
21 days. After the young spoonbills hatch, chicks require a continuous supply of food for 42
days. Spoonbills primarily feed on wetland fishes. Foraging adult spoonbills require water levels
at or below 13 centimeters within the coastal wetlands to forage efficiently and feed young
(Lorenz et al. 2010). Nestlings fledge in approximately four weeks (FWC 2003c).
Thirty-nine of Florida Bay’s keys have been used by roseate spoonbills as nesting colonies.
These colonies have been divided into five distinct nesting regions based on the colonies
primary foraging locations: northeast region, northwest region, central region, south region,
and southwest region. The northeast and northwest colonies contain the largest nesting
colonies and these birds principally use wetlands on the mainland as their primary foraging
grounds (Lorenz et al. 2010). In addition to a large nesting population in Florida Bay, roseate
spoonbills historically nested along the southwest coast of the Everglades in the SRS and
Lostman’s Slough estuaries. Although there has been some documentation of spoonbill nesting
in this area, the numbers have been negligible (Lorenz et al. 2009).
The roseate spoonbill is state listed by the FWC as a species of special concern. In 1979, 1,258
roseate spoonbill nests were located in Florida Bay. More than half of these nests (688) were
located in the northeast region (Lorenz et al. 2008). Drops in nests coincide with the completion
of the SDCS in 1982, when water deliveries to Taylor Slough and northeastern Florida Bay
changed dramatically. Since completion of the SDCS, spoonbill nesting effort has shifted to the
northwest region of Florida Bay; nesting effort has been consistent since the early 1980s and
the population remains stable with an average of 1.24 chicks produced per nest, per year
Chapter 3 Affected Environment
A-1 Flow Equalization Basin 3-63 February 2013 Draft Environmental Impact Statement
(Lorenz et al. 2008). Prior to the construction of the SDCS, spoonbills in the northeast region of
Florida Bay produced an average of 1.38 chicks per nest, per year. Following completion of the
SDCS, spoonbill production dropped to 0.67 chicks per nest, per year (Lorenz et al. 2008).
Wading bird studies suggest that a population that does not produce at least one chick per
nest, on average, will decline.
3.8.3.4.7 Gopher tortoise
The gopher tortoise is a moderate-sized, terrestrial turtle that averages 9-11 inches (23-28
centimeters) long. This species of tortoise has a brown, gray, or tan upper shell (carapace), a
yellow lower shell (plastron), and brown to dark gray skin (Florida Natural Areas Inventory
2001). Gopher tortoises have stumpy, elephant-like hind feet and flattened, shovel-like
forelimbs that are used for digging burrows.
Life History
Gopher tortoises dig deep burrows that average 15 feet long (4.6 meters) and 6.5 feet (two
meters) deep. These burrows provide protection from extreme temperatures, moisture loss,
predators, and serve as refuges for 350-400 other species. Because so many other animals
depend on the burrows (commensals), gopher tortoises are referred to as a keystone species.
Gopher tortoises generally forage within 160 feet (48.8 meters) of their burrows but have been
known to travel greater distances to meet their nutritional needs. Gopher tortoises feed on a
wide variety of plants including broadleaf grasses, wiregrass, grass-like asters, legumes,
blackberries, and the prickly pear cactus.
Gopher tortoises are slow to reach sexual maturity, have low reproductive potential, but they
have a long life span – 60 years or longer. Females reach sexual maturity between 10-20 years
of age. The breeding season is generally between March and October. Females lay five to nine
eggs between May and June. Nests are excavated in areas of abundant sunlight, especially in
the sand mound that is located in front of a burrow. Egg incubation lasts 80 to 90 days in
Florida. Hatchlings are capable of digging their own burrow, but may use other tortoises’
burrows instead (Gopher Tortoise Council 2000).
Habitat and Distribution
Gopher tortoises are found in the southeastern Coastal Plain, from southern South Carolina,
southwest to extreme southeastern Louisiana (Florida Natural Areas Inventory 2001). In
Florida, tortoises occur in parts of all 67 counties, but prefer high, dry sandy habitats such as
longleaf pine-xeric oak sandhills. They also may be found in scrub, dry hammocks, pine
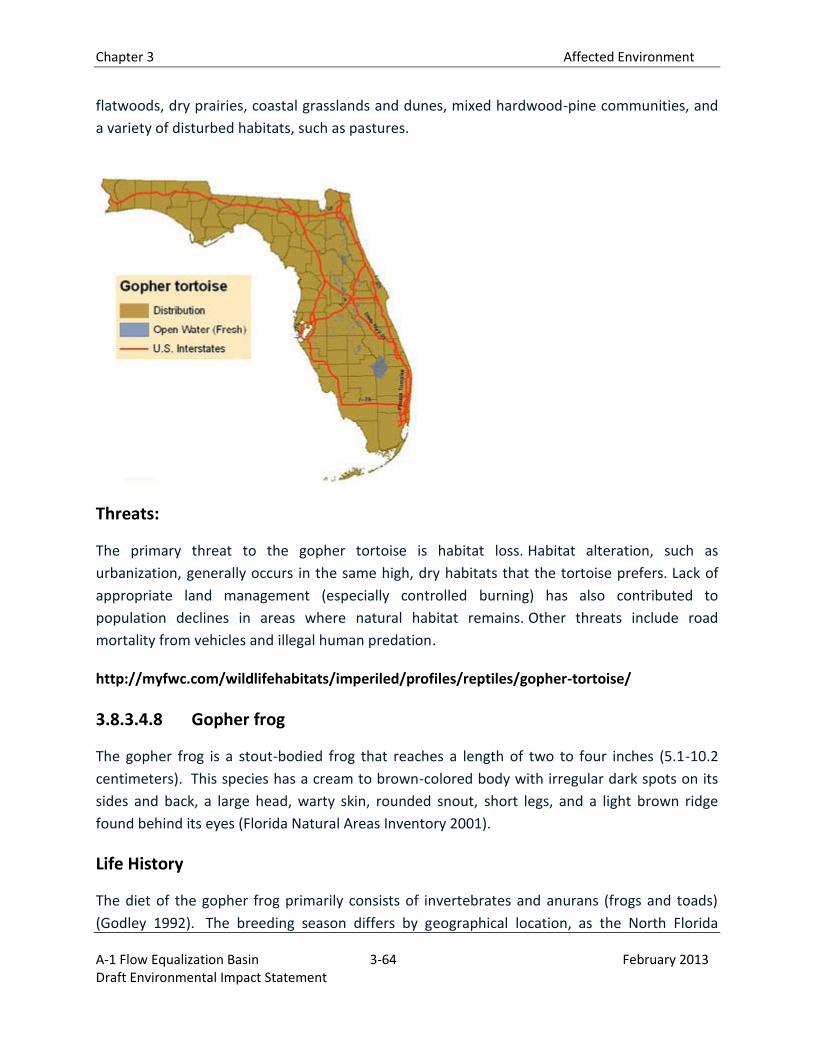
Chapter 3 Affected Environment
A-1 Flow Equalization Basin 3-64 February 2013 Draft Environmental Impact Statement
flatwoods, dry prairies, coastal grasslands and dunes, mixed hardwood-pine communities, and
a variety of disturbed habitats, such as pastures.
Threats:
The primary threat to the gopher tortoise is habitat loss. Habitat alteration, such as
urbanization, generally occurs in the same high, dry habitats that the tortoise prefers. Lack of
appropriate land management (especially controlled burning) has also contributed to
population declines in areas where natural habitat remains. Other threats include road
mortality from vehicles and illegal human predation.
http://myfwc.com/wildlifehabitats/imperiled/profiles/reptiles/gopher-tortoise/
3.8.3.4.8 Gopher frog
The gopher frog is a stout-bodied frog that reaches a length of two to four inches (5.1-10.2
centimeters). This species has a cream to brown-colored body with irregular dark spots on its
sides and back, a large head, warty skin, rounded snout, short legs, and a light brown ridge
found behind its eyes (Florida Natural Areas Inventory 2001).
Life History
The diet of the gopher frog primarily consists of invertebrates and anurans (frogs and toads)
(Godley 1992). The breeding season differs by geographical location, as the North Florida
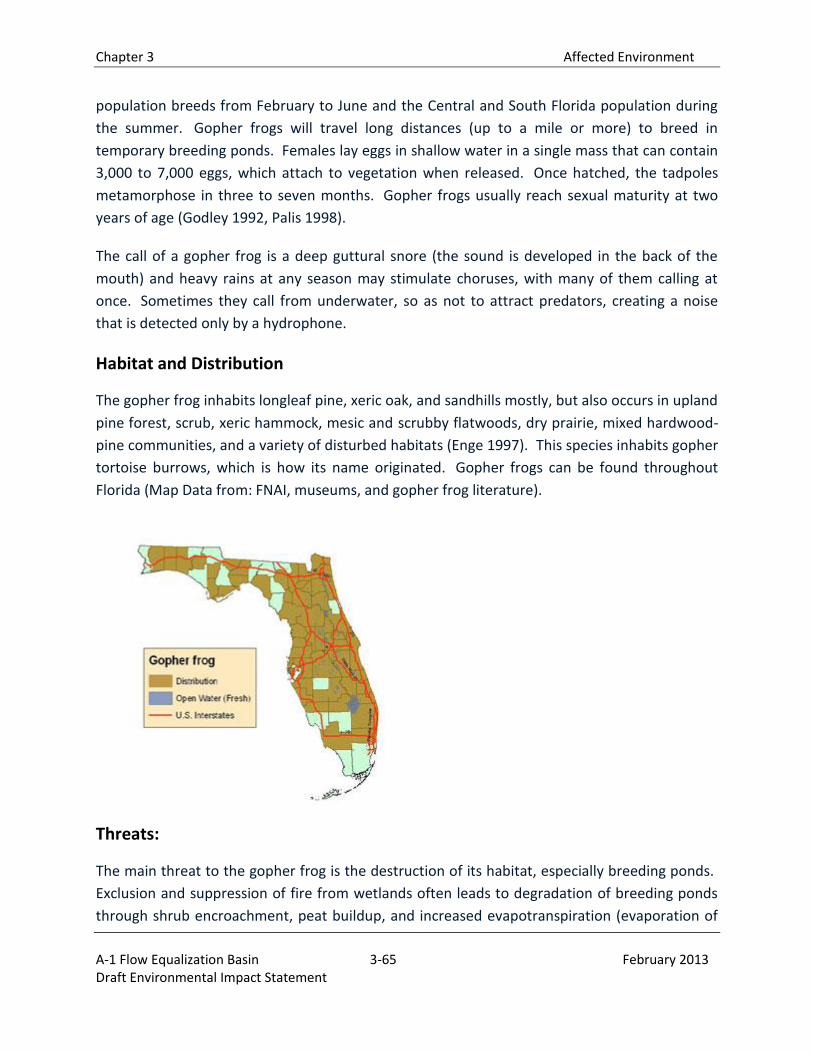
Chapter 3 Affected Environment
A-1 Flow Equalization Basin 3-65 February 2013 Draft Environmental Impact Statement
population breeds from February to June and the Central and South Florida population during
the summer. Gopher frogs will travel long distances (up to a mile or more) to breed in
temporary breeding ponds. Females lay eggs in shallow water in a single mass that can contain
3,000 to 7,000 eggs, which attach to vegetation when released. Once hatched, the tadpoles
metamorphose in three to seven months. Gopher frogs usually reach sexual maturity at two
years of age (Godley 1992, Palis 1998).
The call of a gopher frog is a deep guttural snore (the sound is developed in the back of the
mouth) and heavy rains at any season may stimulate choruses, with many of them calling at
once. Sometimes they call from underwater, so as not to attract predators, creating a noise
that is detected only by a hydrophone.
Habitat and Distribution
The gopher frog inhabits longleaf pine, xeric oak, and sandhills mostly, but also occurs in upland
pine forest, scrub, xeric hammock, mesic and scrubby flatwoods, dry prairie, mixed hardwood-
pine communities, and a variety of disturbed habitats (Enge 1997). This species inhabits gopher
tortoise burrows, which is how its name originated. Gopher frogs can be found throughout
Florida (Map Data from: FNAI, museums, and gopher frog literature).
Threats:
The main threat to the gopher frog is the destruction of its habitat, especially breeding ponds.
Exclusion and suppression of fire from wetlands often leads to degradation of breeding ponds
through shrub encroachment, peat buildup, and increased evapotranspiration (evaporation of
Chapter 3 Affected Environment
A-1 Flow Equalization Basin 3-66 February 2013 Draft Environmental Impact Statement
surface water and release of water vapor) from plants shortening the hydroperiods (LaClaire
2001). Coverage of grassy emergent vegetation decreases and peat buildup may acidify the
water past tolerance levels of the gopher frog (Smith and Braswell 1994). Another threat to
gopher frog populations is the introduction of game and predaceous fish into formerly fish-free
wetlands during natural flooding events. The introduction of these fish causes increased
predation of the gopher frog’s eggs and tadpoles. The gopher frog also faces threats of disease,
such as contraction of the Anuraperkinsus mesomycetozoan (yeast-like) pathogen - an
infectious parasite.
http://myfwc.com/wildlifehabitats/imperiled/profiles/amphibians/gopher-frog/
3.8.3.4.9 Burrowing owl
The diet of the burrowing owl primarily consists of insects; however, they will also feed on
snakes, frogs, small lizards, birds, and rodents. Nesting season occurs between October and
May, with March being the primary time for laying eggs. Nesting occurs in burrows in the
ground that they dig. These burrows will be maintained and used again the following year
(Haug et al. 1993). Females lay up to eight eggs within a one-week period, and they will
incubate the eggs for up to 28 days. Once the white-feathered juveniles are born, it takes two
weeks before they are ready and able to appear out of the burrow. Juveniles will begin learning
how to fly at four weeks, but will not be able to fly well until they are six weeks old. Juveniles
will stay with the parents until they are able to self-sustain at 12 weeks old. Burrowing owls are
different than other owls as they are active during the day time (diurnal) rather than at night
(nocturnal) during breeding season. During the non-breeding season, they become more
nocturnal.
Habitat and Distribution
Burrowing owls inhabit open prairies in Florida that have very little understory (floor)
vegetation. These areas include golf courses, airports, pastures, agriculture fields, and vacant
lots. The drainage of wetlands, although detrimental to many organisms, increases the areas of
habitat for the burrowing owl. The range of the burrowing owl is throughout the peninsular of
Florida in patches and localized areas. Burrowing owls can also be found in the Bahamas
(Florida Natural Areas Inventory 2001).
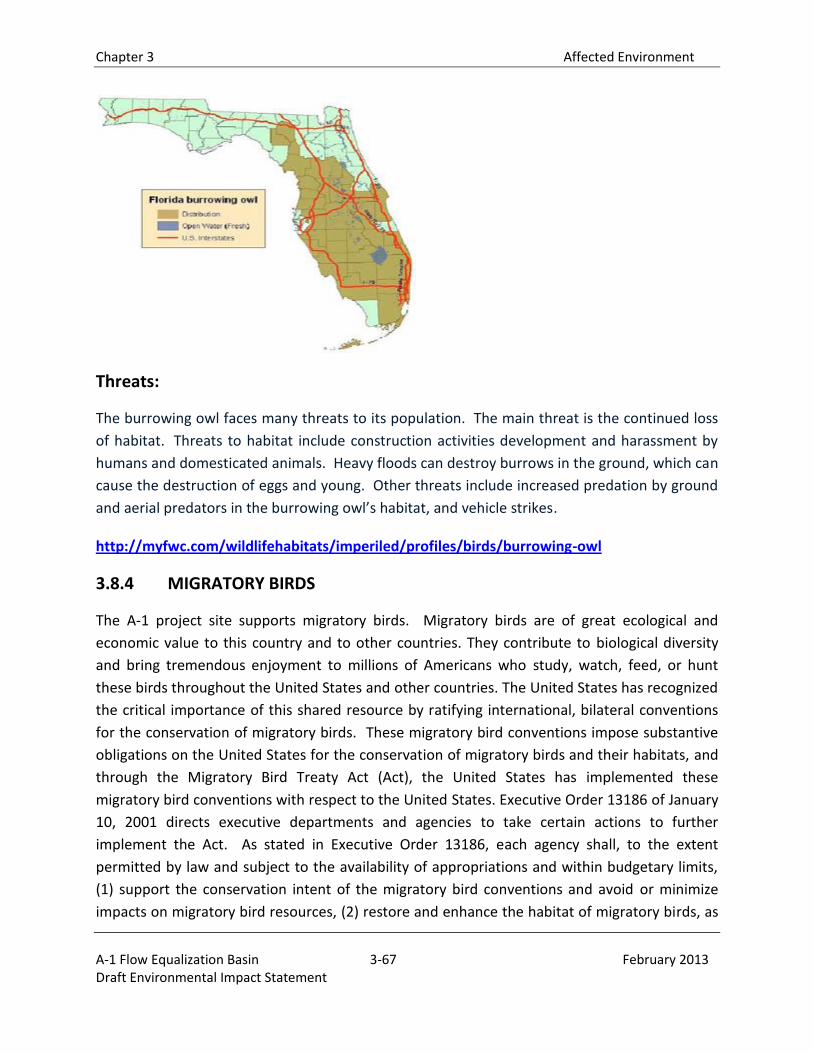
Chapter 3 Affected Environment
A-1 Flow Equalization Basin 3-67 February 2013 Draft Environmental Impact Statement
Threats:
The burrowing owl faces many threats to its population. The main threat is the continued loss
of habitat. Threats to habitat include construction activities development and harassment by
humans and domesticated animals. Heavy floods can destroy burrows in the ground, which can
cause the destruction of eggs and young. Other threats include increased predation by ground
and aerial predators in the burrowing owl’s habitat, and vehicle strikes.
http://myfwc.com/wildlifehabitats/imperiled/profiles/birds/burrowing-owl
3.8.4 MIGRATORY BIRDS
The A-1 project site supports migratory birds. Migratory birds are of great ecological and
economic value to this country and to other countries. They contribute to biological diversity
and bring tremendous enjoyment to millions of Americans who study, watch, feed, or hunt
these birds throughout the United States and other countries. The United States has recognized
the critical importance of this shared resource by ratifying international, bilateral conventions
for the conservation of migratory birds. These migratory bird conventions impose substantive
obligations on the United States for the conservation of migratory birds and their habitats, and
through the Migratory Bird Treaty Act (Act), the United States has implemented these
migratory bird conventions with respect to the United States. Executive Order 13186 of January
10, 2001 directs executive departments and agencies to take certain actions to further
implement the Act. As stated in Executive Order 13186, each agency shall, to the extent
permitted by law and subject to the availability of appropriations and within budgetary limits,
(1) support the conservation intent of the migratory bird conventions and avoid or minimize
impacts on migratory bird resources, (2) restore and enhance the habitat of migratory birds, as
Chapter 3 Affected Environment
A-1 Flow Equalization Basin 3-68 February 2013 Draft Environmental Impact Statement
practicable, (3) prevent or abate the pollution or detrimental alteration of the environment for
the benefit of migratory birds, as practicable, (4) design migratory bird habitat and population
conservation principles, measures, and practices into agency plans and planning processes as
practicable and coordinate with other agencies and nonfederal partners, (5) ensure that agency
plans and actions promote programs of comprehensive migratory bird planning efforts, (6)
ensure environmental analysis of Federal Actions required by NEPA evaluate the effects of
actions on migratory birds with emphasis on species of special concern, (7) provide notice to
the USFWS in advance of conducting an action that is intended to take migratory birds, (8)
minimize the intentional take of species of concern, and (9) identify where unintentional take
reasonable attributable to agency actions is having or is likely to have a measurable negative
effect on migratory bird populations. For a complete list of the requirements in the Executive
Order, please refer to the Presidentail Documents, Federal Register, Volume 66, Number 11
dated January 17, 2001 Responsibilities of Federal Agencies to Protect Migratory Birds.
3.9 CULTURAL, HISTORIC AND ARCHEOLOGICAL RESOURCES
The A-1 project site has been the subject of multiple cultural resource investigations to
determine the presence of cultural, historical and archeological resources. In 2006, the State
Historic Preservation Officer (SHPO) reaffirmed the findings from the December 2002
determination that no historic or cultural resource sites eligible for listing in the National
Register of Historical Places (NRHP) were encountered on the A-1 project site and due to the
site being heavily impacted by sugar cane and sod cultivation practices, no additional cultural
resource investigations are necessary.
Most recently, the State Bureau of Archaeological Research (BAR) on behalf of the SFWMD and
the USACE, conducted a Phase I archaeological survey of 16,593 acres of the EAA A-1 project
area in July 2012, as part of the Central Everglades Planning Project (CEPP). This survey was
intended to locate, identify, delineate, and evaluate cultural resources in advance of proposed
landscape modification. The survey recommended no further archaeological work at the A-1
property at this time. (A Cultural Resource Assessment Survey of the EAA A-1 Property, Palm
Beach County, Florida, Bureau of Archeological Research, Division of Historical Resources,
Department of State, State of Florida, September 2012).
The EAA A-1 survey was undertaken to comply with Section 106 of the National Historic
Preservation Act (NHPA) and Section 267 of the Florida Statutes. Section 106 of NHPA of 1966
(PL89-665, as amended) requires federal agencies to take into account the effects upon historic
properties of projects involving federal funding, federal permitting, or occurring on federal
lands. The Code of Federal Regulations (CFR) Title 36, Chapter VIII, Part 800 (36 CFR 800)
Chapter 3 Affected Environment
A-1 Flow Equalization Basin 3-69 February 2013 Draft Environmental Impact Statement
contains the guidelines for fulfilling the provisions of Section 106. The study evaluated all
potential cultural resources in the project area for eligibility for the NHRP. Cultural resources
include archaeological, architectural, and historical sites and objects. Similarly, Section 267 of
the Florida Statutes requires that “each state agency of the executive branch having direct or
indirect jurisdiction over a proposed state or state-assisted undertaking shall, in accordance
with state policy and prior to the approval of expenditure of any state funds on the
undertaking, consider the effect of the undertaking on any historic property that is included in,
or eligible for inclusion in, the National Register of Historic Places”.
The July 2012 BAR cultural resource assessment survey of the EAA A-1 project area found no
cultural resources that they believed to be eligible for listing in the NHRP. Investigations
included both archival research and fieldwork and were designed to determine the presence of
cultural resources. A search of archives in the Florida Master Site File (FMSF) revealed that
there were no known archaeological sites or historic resources within the project area.
Fieldwork consisted of pedestrian walk-over survey with concurrent ground inspection and
shovel testing to detect possible subsurface archaeological resources. The field methodology
was tailored to the area’s unique environmental conditions. As with other survey
methodologies in the EAA (Carr 1974; Carr et al. 1996; Carr et al. 2000; Marks and Arbuthnot
2008; Smith 2007), investigations were focused on potential tree island locations (extinct or
extant) and other landscape anomalies identified in modern and historic aerial imagery. Field
crews found no cultural materials greater than 50 years old in any of the shovel test pits. The
remains of the Talisman Sugar Mill (8PB15974), an agricultural facility that was constructed in
1962 and demolished in the late 1990s, were recorded.
The BAR concluded and the USACE agrees that the lack of significant (i.e. NRHP eligible) cultural
resources in the EAA A-1 project area is likely because the inhospitable pre-drainage
environment limited opportunities for extensive human settlement. Before drainage, the A-1
project site was in the Sawgrass Plains, a sparsely inhabited landscape that was covered in
sawgrass and typically submerged under 1.5 ft of water (McVoy et al. 2011). Additionally, any
archaeological sites which may have been present, may have been destroyed through the
decades of drainage and agriculture work that resulted in severe demucking. Some areas also
likely lost soil due to oxidation and burning of dry muck due to over-drainage (FWCC 2002:10–
11).
Chapter 3 Affected Environment
A-1 Flow Equalization Basin 3-70 February 2013 Draft Environmental Impact Statement
3.10 TRIBAL RIGHTS
3.10.1 OVERVIEW OF SEMINOLE TRIBE WATER SUPPLY SOURCES
The Seminole Tribe of Florida (Seminole Tribe) has surface water entitlement rights pursuant to
the 1987 Water Rights Compact (Compact) between the Seminole Tribe, the State of Florida,
and the SFWMD (Pub. L. No. 100-228, 101 Stat. 1566 and Chapter 87-292 Laws of Florida as
codified in Section 285.165, F.S.) The Compact contains a series of provisions regarding
establishment of Tribal water rights. Specifically, several "entitlements" to surface water were
created. Additional documents addressing the Water Rights Compact entitlement provisions
have since been executed. These documents include Agreements between the Seminole Tribe
and the SFWMD and a SFWMD Final Order.
According to the Compact, the surface water entitlement for the Big Cypress Reservation is
based on the percentage of water available within the South Hendry County / L-28 Gap Water
Use Basin as the lands of the Big Cypress Reservation are proportional to the total land acreage
within the identified basin. The specific volume of water associated with this entitlement was
quantified in the 1996 Compact Agreement [1996 Agreement (Appendix O)] between the
SFWMD and Seminole Tribe. The 1996 Agreement was precipitated by SFWMD implementation
of the Everglades Construction Project (ECP), as required by Section 373.4592, Florida Statutes.
Implementation of the ECP diverted surface water from the C-139 Basin and C-139 Basin Annex
for treatment, thereby removing a portion of the Seminole Tribe's Big Cypress Reservation
surface water entitlement from direct availability for Tribal use. The SFWMD agreed in the 1996
Agreement to first quantify this entitlement volume and protect the Compact right by providing
replacement water supplies, as a secondary source, to offset the partial diversion of the
entitlement amount. A study was conducted and, with the Seminole Tribe’s concurrence,
quantified the Seminole Tribe's entitlement at 47,000 acre-feet per year to be distributed to the
Reservation in 12 equal monthly amounts of 3,917 acre-feet. The entitlement right is to be
perfected through the annual work plan process. Further, this entitlement volume is to be
delivered primarily from the original entitlement source, the North and West Feeder Canals.
Only when these volumes are insufficient, reliance on the secondary supply source, the G-409,
is appropriate. To accomplish this delivery hierarchy, as well as to appropriately deliver water
to the Big Cypress Reservation, an operational plan was developed and has been consistently
implemented since 2003.
Chapter 3 Affected Environment
A-1 Flow Equalization Basin 3-71 February 2013 Draft Environmental Impact Statement
3.10.2 EXISTING WATER FLOW
Water supply deliveries to the Big Cypress Reservation are made from the North and West
Feeder Canal systems via the G-409 pump station located just west of the northwest corner of
WCA 3A. Sources of water for this pump station include Lake Okeechobee (delivered via the G-
404 pump station), STA 3/4, STA-5, STA-6, Rotenberger and Holey Land WMAs, EAA Runoff, and
WCA 3A. Supplemental flows to the Big Cypress Reservation, when demand is not met by the
primary supply, are provided from the Miami Canal via G404 and G409. Existing conditions for
flows into STA Flow-ways 5-1, 5-2, 5-3, 6-1, and 6-2 are provided from the C139 and C139
Annex Basins. The inflows are currently distributed into the STAs via the L-2/L-3 canal system by
impounding water at G-407 in the vicinity of confusion corner (Figure 3-23). Inflows into the
STAs are treated before discharge into the STA-5/6 discharge canals. The treated flows are
directed to the WCA 3A via the L- 4 and Miami Canals. Any flow that cannot be accommodated
in the STAs is diverted through G406/G407 into the L-4, similar to past operations.
3.10.3 WCA 3A TRIBAL RIGHTS
The Miccosukee Tribe of Indians of Florida (Miccosukee Tribe) holds a perpetual leasehold to an
189,000-acre tract of land within the northwest portion of WCA 3A (Figure 3-24). The purpose
of the lease is to (1) preserve the Leased Area in its natural state for the use and enjoyment of
the Miccosukee Tribe and the general public, (2) to preserve fresh water aquatic wildlife, their
habitat, and (3) to assure proper management of water resources. The Miccosukee Tribe is
allowed to use this land for the purposes of hunting, fishing, frogging, subsistence agriculture,
and other activities that are dependent on wet conditions.
The Seminole Tribe also has rights to lands within WCA 3A. In 1989, 14,720 acres in WCA 3A
were purchased from the Seminole Tribe with funds from the SFWMD and the Conservation
and Recreational Lands (CARL) Program. This tract was added as an amendment to the
Rotenberger Wildlife Management Area lease, which names the FWCC as a lead managing
agency. The compact recognized the special status of the Seminole Tribe by acknowledging
rights and obligations substantially different from those of other Floridian citizens. The
Seminole Tribe has retained non-exclusive rights to utilize the 14,720 acres of land in WCA 3A
to hunt, trap, fish and frog. The Seminole Tribe also has full rights of access to the lands in WCA
3A. This amendment has a perpetual flowage easement granted to the SFWMD for the flowage
and storage of water.
Public Law 93-440 provides that members of the Miccosukee Tribe and the Seminole Tribe shall
be permitted, subject to reasonable regulations established by the Secretary, to continue their
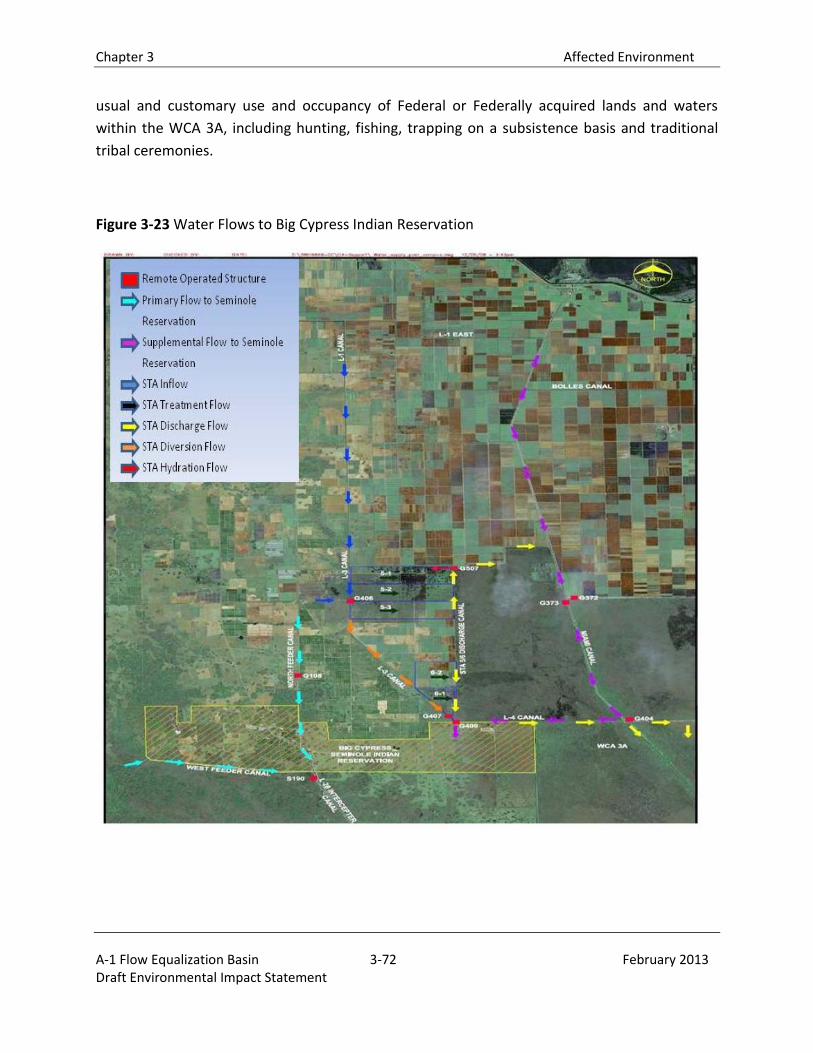
Chapter 3 Affected Environment
A-1 Flow Equalization Basin 3-72 February 2013 Draft Environmental Impact Statement
usual and customary use and occupancy of Federal or Federally acquired lands and waters
within the WCA 3A, including hunting, fishing, trapping on a subsistence basis and traditional
tribal ceremonies.
Figure 3-23 Water Flows to Big Cypress Indian Reservation
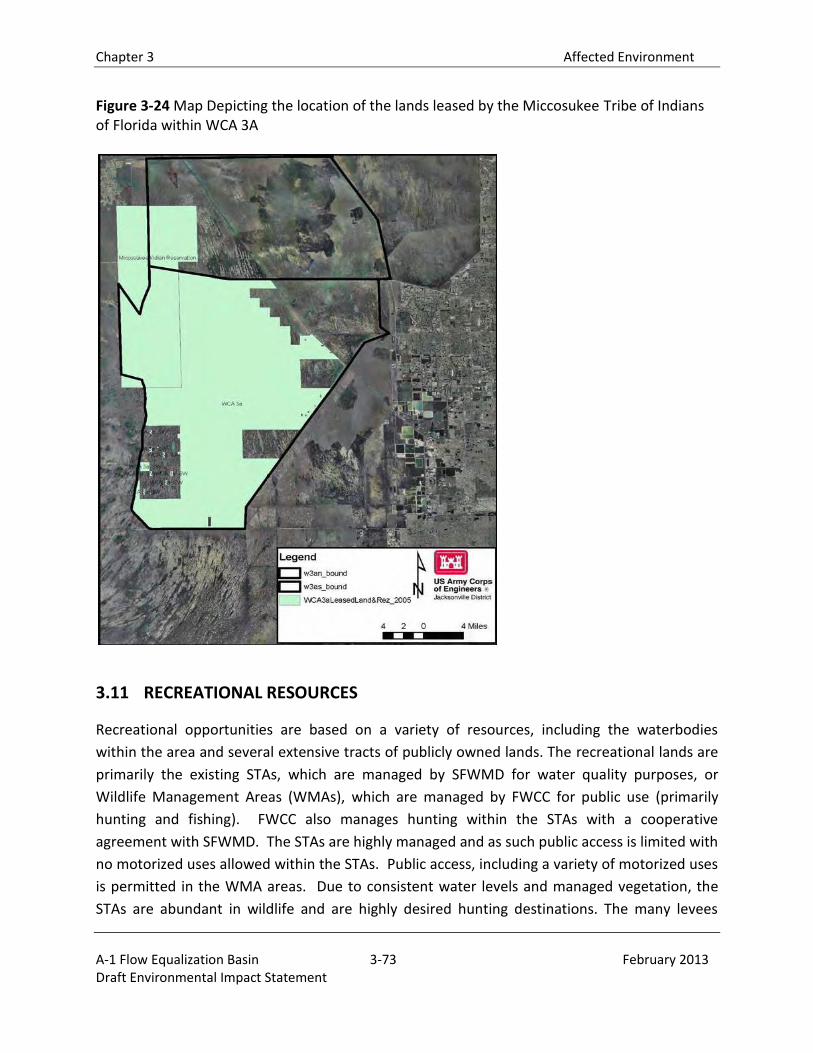
Chapter 3 Affected Environment
A-1 Flow Equalization Basin 3-73 February 2013 Draft Environmental Impact Statement
Figure 3-24 Map Depicting the location of the lands leased by the Miccosukee Tribe of Indians of Florida within WCA 3A
3.11 RECREATIONAL RESOURCES
Recreational opportunities are based on a variety of resources, including the waterbodies
within the area and several extensive tracts of publicly owned lands. The recreational lands are
primarily the existing STAs, which are managed by SFWMD for water quality purposes, or
Wildlife Management Areas (WMAs), which are managed by FWCC for public use (primarily
hunting and fishing). FWCC also manages hunting within the STAs with a cooperative
agreement with SFWMD. The STAs are highly managed and as such public access is limited with
no motorized uses allowed within the STAs. Public access, including a variety of motorized uses
is permitted in the WMA areas. Due to consistent water levels and managed vegetation, the
STAs are abundant in wildlife and are highly desired hunting destinations. The many levees
Chapter 3 Affected Environment
A-1 Flow Equalization Basin 3-74 February 2013 Draft Environmental Impact Statement
within the STAs allow hiking, biking and limited vehicle access whereas the WMAs are vast
without internal levees and are accessed with airboats and tracked vehicles. Overall the STAs
and WMAs offer the public a variety of recreational activities that can include hunting, fishing,
camping, wildlife observation, interpretation, hiking, bicycling, canoeing, and air boating. The
recreational areas within the study area are discussed below.
3.11.1 PROJECT SITE
Currently the project site does not offer any recreational use as it is not open to the public.
3.11.2 STORMWATER TREATMENT AREAS 2 AND 3/4
Hunting is permitted in STA 2 and STA 3/4 and bird watching is allowed in STA 3/4. Recreational
plans developed for the STAs ensure that permitted recreational uses are consistent with the
primary STA goal of improving water quality.
The STA 3/4 recreational facility, known as the Harold A. Campbell Public Use Area, is located
within the footprint of STA 3/4, between the Griffin Rock Pits and Cell 2B. The location of the
public use area minimizes public access past the STA’s water control structures and data
equipment. The Harold A. Campbell Public Use Area includes a vehicle barrier gate, road
improvements, a boat ramp, asphalt parking area, an information kiosk (sheltered),
landscaping, a multi-purpose bridge, and a composting toilet. The public has access to a 4-mile
loop trail during daylight hours on designated days. The boat ramp allows 7-day access during
daylight hours to the external canals of STA 3/4 and those canals along the south side of the L-5
levee for a total of 27 miles of fishable canals. FWCC manages waterfowl and alligator hunting
in STA 3/4 and STA 2. STA 2 provides access from US Highway 27 through to the WCA 2 and
allows fishing along this route. A boat ramp and parking area are located on the east at the
shared boundary of the WCA 2 for access into the L-6 Canal.
3.11.3 WATER CONSERVATION AREAS 2A AND 3A
The Everglades-Francis S. Taylor WMA includes WCAs 2A, 2B, and 3A and is located
immediately southeast and south of the EAA. The Everglades-Francis S. Taylor WMA is
separated from adjacent areas by water control levees and canals, and its hydrology is highly
managed. Its 671,831 acres of primarily Everglades marsh buffers ENP and Big Cypress National
Preserve from agriculture in the EAA. The main recreational activities within the WMA include
hunting, fishing, frogging and air-boating in the interior areas. The levees and canals also
provide opportunities for fishing, frogging, hiking, biking, and wildlife viewing. Common access
to the western area of WCA 2A and the L-6 Canal between the S6 and S7 pump stations is
Chapter 3 Affected Environment
A-1 Flow Equalization Basin 3-75 February 2013 Draft Environmental Impact Statement
through the southern portion of STA 2 across the sportsman’s crossing. Access to WCA 3 occurs
along the north and south boundaries at multiple locations, but the prime access is on the east
at Broward County’s Holiday Park. The Miccosukee Tribe and the Seminole Tribe also maintain
rights to land within WCA 3A. The Tribes have rights to use this land for the purposes of
hunting, fishing, frogging, subsistence agriculture, and other activities.
3.11.4 HOLEY LAND WILDLIFE MANAGEMENT AREA
Currently, state agencies (FWCC, SFWMD, and FDEP) are developing an updated management
plan to address goals and objectives for restoration of the Holey Land. Recreation includes
hunting, fishing, camping, frogging, hiking, and biking. The Holey Land Restoration project that
began in 1991 increased the hydroperiod in this WMA. In response, the primary recreational
use in the Holey Land changed from hunting deer and feral hog to fishing in perimeter canals
and hunting waterfowl (USACE and SFWMD 2006).
3.12 AESTHETICS
The A-1 project site is composed of lands that were historically used for sugar cane farming,
with the occasional rotational crop of rice or corn. The site is currently vacant and fallow; the
majority of the project lands were formerly part of the EAA A-1 Reservoir project, which was
partially constructed before construction was halted due to budgetary and other issues.
Construction was halted in 2006 and much of the land has reverted to natural wetland
characteristics since that time.
The visual landscape of the STAs and WCAs is overwhelmingly flat. Landscape features include
typical canals, levees and prairie wetland communities. The STAs and WCAs offer opportunities
for observation of migratory game birds during winter months. Although some of the
marshlands have been degraded in visual quality by over-flooding and loss of tree islands, other
areas, such as the south-central region of WCA 3A, still preserve good examples of original,
undisturbed Everglades’ communities, with a mosaic of tree islands, wet prairies, sawgrass
expanses, and deeper sloughs. From the elevated viewpoint of the Eastern Perimeter Levee
system, the view westward to the marshes is panoramic, though mostly homogenous.
3.13 FLOOD PROTECTION
Runoff from the EAA is collected and routed to the WCAs for flood control (SFWMD 2004). The
flood storage capacity of the WCAs is essential to flood control in the EAA.
Chapter 3 Affected Environment
A-1 Flow Equalization Basin 3-76 February 2013 Draft Environmental Impact Statement
3.14 HAZARDOUS AND TOXIC WASTE
Although the project site is no longer in active agriculture use, the past farming activities could
have resulted in contamination on the site. Phase I and Phase II environmental site
assessments (ESAs) provide a comprehensive overview of the properties and identify point
sources including chemical storage and mixing areas, agrochemical and petroleum storage
tanks, refueling and maintenance areas, and residual agrochemicals and soil addenda in
cultivated areas.
The Phase I and Phase II ESAs identified three tracts of land with potential to contain hazardous
and/or toxic waste (Figure 3-25). These tracts are:
Woerner Farm 3 – Tract No. 100-0039
Talisman South Ranch Eastern 1/3rd – Tract #100-104
Cabassa Farm – Tract #100-105
Woerner Farm 3- Tract # 100-0039
The Woerner Farm 3 property, which is located north of the A-1 project site consists of
approximately 1,000 acres of land, which was utilized as a sod farm from 1981 until 1996 when
sugarcane was added. The following assessments and investigations were conducted for the
Woerner Farm 3:
A Phase I Environmental Site Assessment - November 1994 and January 1998
Phase II ESA investigation - February 1999
Supplemental investigations – February 2000 and March 2001
Three areas of concern were identified which required additional assessments and/or
corrective actions (Figure 3-26). In 2005, over 1,880 tons of toxaphene impacted soils were
excavated from the cultivated area. A limited soil excavation of pesticide and petroleum
impacted soils was conducted at the former shed on the Woerner tract. In addition 130 tons of
petroleum impacted soils were excavated from the main pump station. An Environmental Risk
Assessment (ERA) was formulated and site specific cleanup target goal of 5.2 mg/kg was
proposed for toxaphene. The ERA was reviewed by the USFWS and recommendations were
made to the SFWMD to (1) scrape the entire Woerner property and dispose of soil, (2) move
the north border of the reservoir south, off of the Woerner property, and (3) conduct additional
sampling. Based on these options, the SFWMD has avoided the subject area of concern. The
Woerner Farm 3 site was resampled in 2012 to determine the levels of toxaphene. Four out of
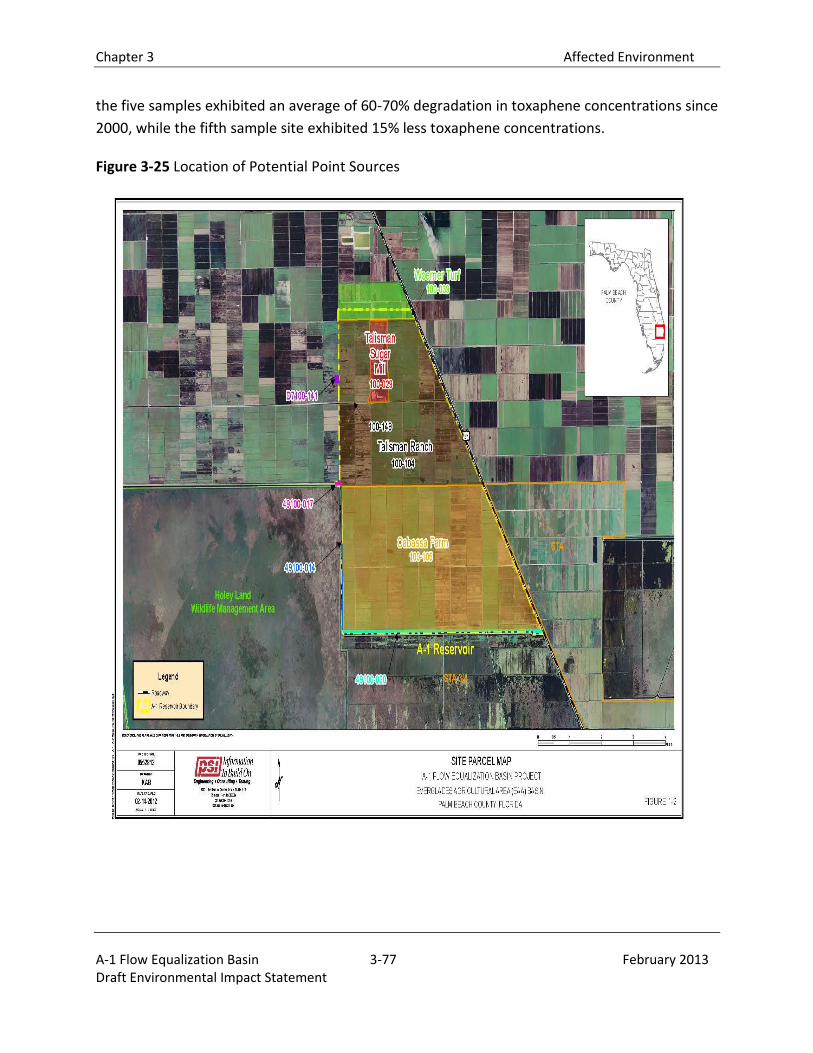
Chapter 3 Affected Environment
A-1 Flow Equalization Basin 3-77 February 2013 Draft Environmental Impact Statement
the five samples exhibited an average of 60-70% degradation in toxaphene concentrations since
2000, while the fifth sample site exhibited 15% less toxaphene concentrations.
Figure 3-25 Location of Potential Point Sources
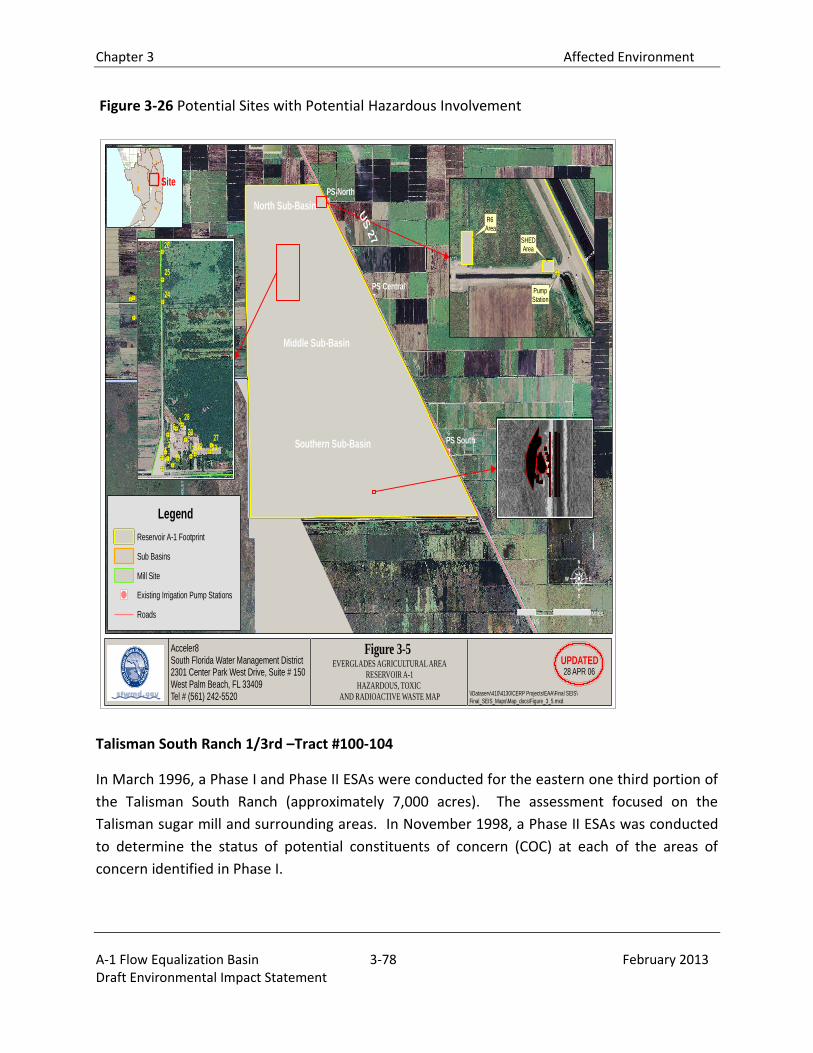
Chapter 3 Affected Environment
A-1 Flow Equalization Basin 3-78 February 2013 Draft Environmental Impact Statement
Figure 3-26 Potential Sites with Potential Hazardous Involvement
Talisman South Ranch 1/3rd –Tract #100-104
In March 1996, a Phase I and Phase II ESAs were conducted for the eastern one third portion of
the Talisman South Ranch (approximately 7,000 acres). The assessment focused on the
Talisman sugar mill and surrounding areas. In November 1998, a Phase II ESAs was conducted
to determine the status of potential constituents of concern (COC) at each of the areas of
concern identified in Phase I.
L-18
L-19
HOLEYLAND SEEPAGE CANAL
HO
LE
YL
AN
D D
IST
RIB
UT
ION
CA
US 27
Legend
Reservoir A-1 Footprint
Sub Basins
Mill Site
Existing Irrigation Pump Stations
Roads
UPDATED28 APR 06
Acceler8 South Florida Water Management District2301 Center Park West Drive, Suite # 150West Palm Beach, FL 33409Tel # (561) 242-5520
Figure 3-5EVERGLADES AGRICULTURAL AREA
RESERVOIR A-1
HAZARDOUS, TOXIC
AND RADIOACTIVE WASTE MAP \\Dataserv\410\4130\CERP Projects\EAA\Final SEIS\
Final_SEIS_Maps\Map_docs\Figure_3_5.mxd
0 1 20.5Miles
Site
North Sub-Basin
Middle Sub-Basin
Southern Sub-Basin
PS North
PS Central
PS South
US
27
3
21
28
27
26
25
24
232221
20
1918
16
PumpStation
SHEDArea
R6 Area
US
27

Chapter 3 Affected Environment
A-1 Flow Equalization Basin 3-79 February 2013 Draft Environmental Impact Statement
Based on the Phase I and Phase II ESAs, 11 areas of COC were detected in soil, groundwater,
sediment, or surface water at concentrations exceeding regulatory cleanup target levels or
guidance concentrations. Transference of ownership of each of the Exclusion Areas was
deferred until a Site Rehabilitation Completion Order (SRCO) for each Exclusion Area was issued
by the Florida Departmetn of Environmental Protection (FDEP). The list of Exclusion Areas
included:
Five pump stations
Two pesticide mix load areas
A former labor camp and crop-duster landing strip
A former borrow pit/agricultural landfill
The former sugar processing mill
The surface water management areas adjacent to the sugar mill
These areas were primarily impacted with organochlorine pesticides (e.g.,
dichlorodiphenyltrichloroethane (DDT), petroleum products, and arsenic). An assessment and
remediation on all of the Exclusion Areas on behalf of Talisman Sugar Corp. and the St. Joe
Company was performed. The cleanup objectives for each Exclusion Area within the proposed
project footprint were based on the proposed end land use for water storage areas. As such,
cleanup target levels were chosen to be protective of potential ecological receptors which are
likely to inhabit the area once a project is constructed. For protection of wildlife, the clean up
target levels for most of the chemicals found on the Talisman property are more stringent than
the cleanup standards for human health. Therefore, a cleanup to ecological standards is also
inherently protective of agricultural workers during the interim period prior to construction as
well as construction workers.
FDEP issued SRCOs for the majority of the Exclusion Areas. These parcels can be conveyed
immediately with no restrictions. On the remaining parcels, the remediation work has been
completed to the satisfaction of the FDEP; the FDEP has issued memoranda of technical
concurrence. However, a deed restriction was necessary in order to convey the property to
SFWMD.
The cleanup of the mill site involved assessment and remediation of a number of point source
discharge areas. Areas of concern at the mill site included numerous leaking petroleum storage
tanks, pesticide and/or arsenic impacted soils in the sediments of two drainage canals, an ash
pit, and a water storage retention area, and metals-impacted soils adjacent to several building
slabs.
Chapter 3 Affected Environment
A-1 Flow Equalization Basin 3-80 February 2013 Draft Environmental Impact Statement
In general, the petroleum impacted areas were handled through excavation and on-site
treatment of soils in ex-situ bioremediation piles. Once the treatment was verified by
confirmation sampling, the treated soils were returned to their respective excavations.
Approximately 16,000 cubic yards of petroleum impacted soil was excavated, treated and
backfilled.
The canals and surface depressions at the mill were covered with a two foot layer of clean soil.
The cover is intended to prevent exposure of potential receptor species to these sediments.
Pesticide and arsenic impacted soil was also excavated from other areas of concern at the mill
site and consolidated in the ash pit. The ash pit was a low lying excavated area that accepted
effluent from the boilers. The ash in the pit was lightly impacted with heavy metals and
polynuclear aromatic hydrocarbons (PAHs). Additional soils from other areas of concern were
also filled into the pit and the ash pit was covered with two feet of clean soil to prevent future
exposure.
These three areas within the mill site where contaminated soils have been left and capped will
also require restrictions on excavation activities. These parcels are identified as the South Rock
Canal, the Ash Pit, and the Waste Lake Discharge Ditch. An additional area of capped, impacted
soil is present approximately three miles west of the mill at the former borrow pit/agricultural
landfill. These areas contain pesticide, PAH, and metal impacted soils which are buried beneath
a clean soil cover. The excavation restrictions are necessary to prevent disturbance of these
areas. These areas have been surveyed by a professional land surveyor and the coordinates
have been provided to SFWMD to ensure that no disturbance of these areas occurs.
In summary, all of the physical assessment and remediation intended by SFWMD has been
completed on all of the Exclusion Area parcels and all of the technical documents relating to the
cleanup have been reviewed and accepted by FDEP. A remaining outstanding activity is to
record the appropriate deed restrictions on a few of the parcels. Once this activity is
completed, it is expected that the FDEP will issue SRCO’s on the remaining parcels and all of the
parcels can be conveyed to SFWMD. No additional assessment, corrective actions, or closures
are required on this property.
Cabassa Farm –tract #100-105
The Cabassa Farm property consists of approximately 9,700 acres. This property was
historically used for the cultivation of sugarcane while the far southeast portion used for rice
cultivation. A Phase I and Phase II ESAs were conducted in February and March 1999,
respectively. The Phase I and Phase II ESAs identified four areas of concern that required
additional assessment and/or corrective actions. A Contamination Ecological Risk Assessment
Chapter 3 Affected Environment
A-1 Flow Equalization Basin 3-81 February 2013 Draft Environmental Impact Statement
and Corrective Action Plan were prepared in January 2002 for this property. Four hundred and
fourteen tons of arsenic and copper impacted soil from the maintenance area and extensive
soil sampling were conducted in the cultivated crop area using USFWS and SFWMD sampling
protocol. Results of the updated ERA concluded that the residual concentrations of pesticides,
copper, and zinc were not a threat to representative fish and wildlife species. USFWS and FDEP
concurred with SFWMD’s recommendation for No further Action (NFA) for the equipment
maintenance area, cane loading/equipment staging area and the cultivated crop area. In 2003,
assessments, corrective actions, and closure activities associated with the pump stations were
conducted and received NFAs from FDEP for each of the pump stations. No additional
assessment, corrective actions, or closures are required on this property.
3.15 CLIMATE
The subtropical climate of South Florida, with its distinct wet and dry seasons, high rate of
evapotranspiration, and climatic extremes of floods, droughts, and hurricanes, represents a
major physical driving force that sustains the Everglades while creating water supply and flood
control issues in the agricultural and urban segments.
Seasonal rainfall patterns in South Florida resemble the wet and dry season patterns of the
humid tropics more than the winter and summer patterns of temperate latitudes. Of the 53
inches of rain that South Florida receives on average annually, 75 percent falls during the wet
season months of May through October. During the wet season, thunderstorms that result
from easterly trade winds and land-sea convection patterns occur almost daily. Wet season
rainfall follows a bimodal pattern with peaks during May through June and September through
October. Tropical storms and hurricanes also provide major contributions to wet season rainfall
with a high level of interannual variability and low level of predictability. During the dry season
(November through April), rainfall is governed by large-scale winter weather fronts that pass
through the region approximately weekly. However, due to the variability of climate patterns
(La Nina and El Nino), dry periods may occur during the wet season and wet periods may occur
during the dry season. High evapotranspiration rates in South Florida roughly equal annual
precipitation. Recorded annual rainfall in South Florida has varied from 37 to 106 inches, and
interannual extremes in rainfall result in frequent years of flood and drought.
Greenhouse gasses produced on the project site as a result of past rock mining and agriculture
are primarily carbon dioxide, while other gasses include methane, nitorous oxide, and
chloroflourocarbons. According to EPA’s 2009 Inventory of U.S. Greenhouse Gas Emissions and
Sinks: 1990-2007, “Executive Summary,” “the primary greenhouse gas emitted by human
activities in the United States was CO2 [carbon dioxide], representing approximately 85.4
Chapter 3 Affected Environment
A-1 Flow Equalization Basin 3-82 February 2013 Draft Environmental Impact Statement
percent of total greenhouse gas emissions” (EPA 2009). The carbon dioxide produced on the A-
1 project site is prodiced from onsite hauling, offsite hauling by truck and rail, and rock quarry
equipment.
3.16 COST
The SFWMD has incurred costs with the previous construction from the EAA A-1 Reservoir.
These are defined as sunk costs (costs already incurred) for the land and initial earthwork that
was conducted and is currently $180,000. The SFWMD also conducts routine vegetative
maintenance and maintains measures that prohibit public access on the site.
3.17 ENVIRONMENTAL JUSTICE
Under Executive Order 12898, Federal agencies are responsible for identifying and addressing
potential disproportionately high and adverse human health and environmental effects on
minority and low-income populations. Minority persons are those who identify themselves as
Hispanic or Latino, Asian, Black or African American, American Indian or Alaska Native, Native
Hawaiian or Other Pacific Islander, or multiracial (with at least one race designated as a
minority race under Council on Environmental Quality (CEQ) guidelines (CEQ 1997). Persons
whose income is below the Federal poverty threshold are designated as low income.
Disproportionately high and adverse human health effects occur when the risk or rate of
exposure to an environmental hazard for a minority or low-income population is significant (as
defined by the National Environmental Policy Act [NEPA]) and appreciably exceeds the risk or
exposure rate for the general population or for another appropriate comparison group (CEQ
1997). A disproportionately high environmental impact that is significant (as defined by NEPA)
refers to an impact or risk of an impact on the natural or physical environment in a low-income
or minority community that appreciably exceeds the environmental impact on the larger
community. Such effects may include ecological, cultural, human health, economic, or social
impacts. An adverse environmental impact is an impact that is determined to be both harmful
and significant (as defined by NEPA).
For the environmental justice analysis for this EIS, the project area was examined. The project
area is composed of the EAA, which is composed mainly of agricultural lands.
3.18 NATURAL OR DEPLEATABLE RESOURCES
The A-1 project site has been previously utilized for sugar cane and sod farming, but currently
the site is not being farmed. Remnant agricultural and remnant infrastructure still exists
Chapter 3 Affected Environment
A-1 Flow Equalization Basin 3-83 February 2013 Draft Environmental Impact Statement
throughout the site including agricultural ditches and degraded roads. As a result of permitted
construction activities to construction the A-1 Reservoir, the SFWMD has excavated rock
material on the project site. Limestone, composed of the mineral calcite, is the primary rock
formation which is appropriate for use in building materials and as aggregate for road beds.