Embed Size (px)
Citation preview

SummaryMany of the 2.9 billion workers across the globe are exposed to haz-ardous risks at their workplaces. This chapter examines the disease andinjury burden produced by selected occupational risk factors: occupa-tional carcinogens, airborne particulates, noise, ergonomic stressors andrisk factors for injuries. Owing primarily to lack of data in developingcountries, we were unable to include important occupational risks forsome cancers, reproductive disorders, dermatitis, infectious diseases,ischaemic heart disease, musculoskeletal disorders (MSDs) of the upperextremities, and other conditions such as workplace stress. Mesothe-lioma and asbestosis due to asbestos exposure, silicosis and coal workers’pneumoconiosis are almost exclusively due to workplace exposure, butlimitations in global data precluded a full analysis of these outcomes.
The economically active population (EAP) aged ≥15 years, whichincludes people in paid employment, the self-employed, and those whowork to produce goods and services for their own household consump-tion, were considered the group at risk of exposure to occupationalhazards. Both formal and informal sectors of employment are includedin the EAP, but child labour was excluded. Exposure was quantifiedbased on the economic sector (where people do the work) and on occu-pation (what people do). Our sources of data to delineate categories ofexposed workers included economic databases and publications of theInternational Labour Organization (ILO) and the World Bank and thepublished scientific literature. For most risk factors the workers weregrouped into high- and low-exposure categories, and the exposed pop-ulation was distributed by age, sex and subregion.1 Risk estimates forthe occupational hazards were obtained from the published epidemio-logical literature, particularly from studies of large populations, reviewsand meta-analyses when available.
The occupational risk factors in our study accounted for an estimated37% of back pain, 16% of hearing loss, 13% of chronic obstructive
Chapter 21
Selected occupational risk factors
Marisol Concha-Barrientos,Deborah Imel Nelson, Timothy Driscoll,N. Kyle Steenland, Laura Punnett,Marilyn A. Fingerhut, Annette Prüss-Üstün,James Leigh, SangWoo Tak and Carlos Corvalan

pulmonary disease (COPD), 11% of asthma, 8% of injuries, 9% of lungcancer and 2% of leukaemia. These work-related risks caused 775000deaths worldwide in 2000. There were five times as many deaths in malesas in females (647000 vs 128000). The leading occupational cause of death among the six risk factors was unintentional injuries (41%) followed by COPD (40%) and cancer of the trachea, bronchus or lung(13%). Workers who developed outcomes related to the occupationalrisk factors lost about 22 million years of healthy life. By far the maincause of years of healthy life lost (measured in disability-adjusted lifeyears [DALYs]), within occupational diseases, was unintentional injurieswith 48% of the burden. This was followed by hearing loss due to occu-pational noise (19%) and COPD due to occupational agents (17%).Males experienced almost five times greater loss of healthy years(DALYs) than females. Low back pain and hearing loss have in commonthe fact that they do not directly produce premature mortality, but theycause substantial disability and have multiple consequences for the indi-vidual and society, particularly for workers suffering the outcomes at anearly age.
The major source of uncertainty in our analysis was characterizingexposure, which was based solely on economic subsectors and/or occu-pations and involved a large number of extrapolations and assumptions.High-quality exposure data are lacking, especially in developing coun-tries, and European and American exposure estimates were thus appliedin many instances in developing regions. This extrapolation could havesubstantial impact on the accuracy of analysis for the developing regionsif exposures, as usually occur, vary from place to place and over time.Diseases with long latency (e.g. cancers) are more susceptible to theassumptions and extrapolations. In addition to problems produced bythe length of the latency period, the magnitude of the excess risk mayvary depending on the age of the person when exposure began, the dura-tion and strength of exposure and other concomitant exposures. Theturnover of workers is another issue that affects both exposure and riskassessment. Sources of uncertainty in hazard estimates (relative risk andmortality rates) include variations determined from the literature (onceagain caused by the use of different exposure proxies), extrapolations toregions with different working conditions, the application to females ofrisk measures from male cohorts, and the application of the same rela-tive risk values to all age groups (e.g. carcinogens). Restricting the analy-sis to persons aged ≥15 years excludes the quantification of child labour.The exclusion of children in the estimation was due to the wide varia-tion in the youngest age group for which countries reported economicactivity rates (EARs). In addition to inconsistent data on EARs for chil-dren, there were virtually no data available on their exposure to occu-pational risk factors or the relative risks of such exposures. Specific,focused research on children is needed to quantify the global burden ofdisease due to child labour and the resulting implications.
1652 Comparative Quantification of Health Risks

1. IntroductionThroughout the world, most adults—and many children—spend muchof their waking hours at work. Work provides a number of economicand other benefits. At the same time, people at work face a variety ofhazards owing to chemicals, biological agents, physical factors, adverseergonomic conditions, allergens, a complex network of safety risks, andmany and varied psychosocial factors. In addition to injuries, more than100 occupational diseases have been classified according to the tenthrevision of the International Classification of Diseases and RelatedHealth Problems (ICD-10). Broadly, these include respiratory, muscu-loskeletal, cardiovascular, reproductive, neurotoxic, skin and psychologi-cal disorders, hearing loss and cancers.
Of the wide variety of work-related exposures, only the most wide-spread are evaluated here. Other criteria for selection of risk factorsinclude adequacy of exposure information and the applicability of healthoutcome data to all regions of the globe, and the inclusion of the rele-vant health outcomes in the global burden of disease (GBD) database ofdiseases and injuries.
Exposure to occupational hazards can adversely affect the humanbody. Adverse effects range from asymptomatic physiological and bio-chemical changes to symptoms of illness, to diagnosed diseases and,finally, to death. For some risk factors there is a very clear connectionbetween the exposure and the disease. For example, the primary routeof exposure to airborne particulates, gases and vapours is inhalation,whereby these agents gain access to the respiratory system and are eitherdeposited (in the case of particulates) or enter the circulatory system(gases and vapours). Many risk factors cause more than one type ofoutcome of interest. For example, exposure to asbestos can result inmalignant conditions of the lung and the pleura, malignant conditionsof the peritoneum, and nonmalignant conditions of the lung (asbestosis).Some exposures, such as occupational noise, are well characterized.Others have not been well characterized or are multi-faceted, but thecondition they cause is clear (such as occupational injuries).
Following a general description of methods and data sources, indi-vidual sections provide details of specific aspects of methodology andresults for each of the selected occupational health risk factors that wereanalysed: occupational carcinogens, occupational airborne particulates,occupational noise, occupational ergonomic stressors and occupationalrisk factors for injuries.
In this study, the term “occupational risk factor” is defined as a chem-ical, physical, biological or other agent that may cause harm to anexposed person in the workplace and is potentially modifiable. Figure21.1 shows the selected risk factors along with related health outcomes.Owing to complex etiology and lack of data, a different approach wasdeveloped for some conditions such as asthma and low back pain, using
Marisol Concha-Barrientos et al. 1653

occupation as a proxy for exposure to the causative agents. The utilityof this work as a risk-based framework has thus been limited.
1.1 Excluded exposures and outcomes
No effects specific to the hazards associated with child labour areaddressed in this report owing to a lack of data. Other excluded risks oroutcomes include respiratory diseases other than COPD and asthma;some infectious diseases; less widespread cancers and carcinogens (e.g.bladder cancer and cancer of the liver); MSDs such as carpal tunnel syn-drome; intentional injuries in the workplace; organ and systemic diseasesresulting from occupational exposure to solvents, pesticides and heavymetals such as lead or mercury; maternal and perinatal conditions result-ing from occupational exposures; skin disorders, including dermatitis,dermatosis and melanoma; ischaemic heart disease and other outcomesassociated with work-related stress.
Malignant mesothelioma of the pleura and peritoneum is virtuallyuniquely due to asbestos exposure. Occupational dusts can also result in
1654 Comparative Quantification of Health Risks
Figure 21.1 Relationship between occupational risk factors andoutcomesa
Occupational carcinogens (arsenic, asbestos, beryllium, cadmium, chromium,
diesel exhaust, nickel, silica)
CANCER Trachea, bronchus or lung cancer Leukaemia Mesothelioma
Low back pain
Silica AsbestosCoal dust
Noise
Ergonomic stressors (heavy lifting, vibration)
Risk factors for injuries
Pneumoconiosis
Hearing loss
Injuries (unintentional)
Agents leading to COPD COPD
Asthmagens Asthma
a Only selected relationships were quantified.

nonmalignant respiratory diseases other than asthma and COPD. Themost important of these are silicosis, asbestosis and coal workers’ pneu-moconiosis, which are caused by exposure to silica, asbestos and coaldust, respectively. While evidence for a causal relationship is strong, lackof data on accumulated exposure, especially in developing countries,restricted the ability to provide a detailed assessment of attributable mor-tality and disease burden for these outcomes. Preliminary estimates areprovided in the note under Table 21.62 in Section 7.
Because of lack of available data and difficulties in quantification, itwas not possible to conduct a global quantitative analysis for the healthconsequences of stress at work. Overall, the evidence indicates that inci-dence of stress-related cardiovascular disease is likely to be higher in theblue-collar occupations when the following factors are present: restricteddiscretion, shiftwork (particularly nightshift), effort-reward imbalance,high demands, poor psychosocial work environment, social isolation,physical inactivity or occupational violence. These risk factors may beinteractive. Nurminen and Karjalainen (2001) estimated for Finland anattributable fraction of 16.9% (18.9% for men and 9.1% for women) forischaemic heart disease due to the combined occupational risk factors ofshiftwork, noise, and exposure to engine exhaust and environmentaltobacco smoke. For ischaemic heart disease, Steenland et al. (2003) usedan attributable fraction of 6–18% for individuals in the United States ofAmerica aged 24–64 years, based on the combined effects of noise, jobstrain (stress), shiftwork and environmental tobacco smoke. Occupationaldermatitis accounts for about 10% of all occupational disease in theUnited States (Emmett 2002) but exposure data are lacking at global level.
Although there were adequate global data to analyse the risks tohealth care workers from contaminated sharps (e.g. syringe needles andscalpels), the full analysis has been omitted from this chapter. Sincehealth care workers make up only 0.6% of the global population, thecontribution to hepatitis B, hepatitis C and HIV/AIDS infections on aglobal level was close to zero. However, health care workers are at highrisk of preventable infection from bloodborne pathogens, owing to occu-pational exposure to infected blood and body fluids.
1.2 Choice of theoretical-minimum-risk exposure distributions
For some occupational hazards, a theoretical minimum exposure of zerois not possible, as there is some low-level environmental exposure. Twooccupational risk factors (carcinogens and airborne particulates) involveworkplace exposure at concentrations higher than the environmental or background levels of these substances. For noise, the theoreticalminimum was defined as less than 80 dBA, a level found not to have anincreased risk of causing hearing loss (NIOSH 1998). For the other riskfactors (ergonomic stressors and work-related risk factors for injuries),a category of workers with the lowest risks was identified as the com-
Marisol Concha-Barrientos et al. 1655

parison group for occupational categories of workers with higher risks.Thus, the theoretical minimum risk corresponds to “no occupationalexposure above levels found in the defined comparison group”. Selec-tion of a defined comparison group provides a realistic basis for a theo-retical minimum, but it does not establish the lowest rate of adverseoutcome that could ever be experienced. While it is not expected thatoccupational exposures will be eliminated in the foreseeable future, it ispossible to control exposures through recognized industrial hygiene prac-tices. Engineering controls (including prevention, substitution of materi-als, process automation, enclosure, process elimination, isolation ofworkers and process change) constitute effective methods of minimizingexposures (Burton 1997). Administrative controls (such as education andtraining, work practice controls, worker rotation, maintenance andhousekeeping) provide another means of risk reduction.
1.3 Data sources
A systematic assessment of the literature was carried out to identifystudies on occupational exposures and health outcomes. This includedsearching Medline, occupational health and safety databases such asOSHROM and NIOSHTIC and databases of various organizations;reviewing relevant references cited in publications identified through theinitial literature search and of references cited in these secondary refer-ences; communicating with relevant experts; and seeking other informa-tion recommended by referees following the initial review of the draftmanuscript. PubMed was searched using keywords for exposures andhealth outcomes, including (separately and in combination, with no limiton year of publication): exposure, occupational, cancer, carcinogen,silica, silicosis, benzene, asbestos, asbestosis, pneumoconiosis and devel-oping country. Names of regions (e.g. Africa, Asia) and specific countrieswere also used as keywords. A systematic search was conducted usingOvid Healthstar and the former HealthSTAR databases, covering theperiod 1975–2001. Keywords included: asbestos; asthmagens; chronicobstructive lung disease; cancer and diesel exhaust; arsenic; benzene andleukaemia; ionizing radiation and leukaemia; back (for low back pain);injury; accidents; ergonomics; and hearing impairment and noise.
Studies of large populations, reviews and meta-analyses were specifi-cally sought. Reports and publications were critically assessed to deter-mine their methodology, validity and the characteristics of the populationstudied.
1.4 Estimating risk factor levels
In general, since the types of risk factor to which workers are exposedare primarily influenced by where the work is performed (economicsector) and the type of work they do (occupation), the assessment of proportion of population exposed in each subregion was based on(Figure 21.2):
1656 Comparative Quantification of Health Risks

• economic sector distribution (total nine sectors), used for carcinogensand agents leading to COPD) (Equation 1);
• occupational distribution (occupation within economic sector) (totalseven occupations), used for asthmagens, noise and ergonomic stres-sors (Equation 2); and
• exposure could not be estimated for injury risk factors, and thus esti-mates of disease burden were made based on the reported rates of theoutcome (injury mortality) rather than on exposure.
(1)
(2)
where
PEP(r,g,a) = proportion of the population occupationally exposed toa specific risk factor in that subregion, by sex and age,at low or high level
PEP r,g,a EAR r,g,a OT r
EPF r PW oc r,g i PEW oc r,g i
( ) = ( ) ¥ ( )
¥ ( ) ( )( ) ¥ ( )( )(=Âi 1
7
PEP r,g,a EAR r,g,a OT r
EPF r PW es r,g i PEW es r,g i
( ) = ( ) ¥ ( )
¥ ( ) ( )( ) ¥ ( )( )(=Âi 1
9
Marisol Concha-Barrientos et al. 1657
Figure 21.2 Exposure assessment overview
Population
Economically active population (≥15 years)
Economic subsector (agriculture, mining, etc.)
Percentage of exposed workers Occupation category
Level: background
Level: low
Level: high
Level: background
Level: low
Level: high
Percentage of exposed workers

EAR(r,g,a) = economic activity rate, by subregion, sex and age
OT(r) = occupational turnover, if applicable, to account for workers exposed in the past, by subregion
EPF(r) = exposure partitioning factor, by subregion, to delineateproportion exposed at low or at high levels
PW(es(r,g)i) = proportion of the population working in economic sub-sector (i), by subregion and sex
PEW(es(r,g)i) = proportion of workers in economic subsector (i) with ex-posure to the specific risk factor, by subregion and sex
PW(oc(r,g)i) = proportion of the population working in occupationalcategory (i), by subregion and sex
PEW(oc(r,g)i) = proportion of workers in occupational category (i) withexposure to the specific risk factor, by subregion and sex
The differences between the two equations are the term PW(es(r,g)i)in Equation 1, which is used when exposure data are available by eco-nomic sector, and the term PW(oc(r,g)i) in Equation 2, which is usedwhen exposure data are available by occupational category. Occupa-tional turnover (OT), defined as “the rate of replacement of workers dueto departures from the workplace”, was utilized for carcinogens becausehealth effects due to these risk factors occur many years after exposure(latency) and it was therefore necessary to know how many persons hadbeen exposed in the past to these risk factors. The effects of noise,ergonomic stressors and risk factors for injuries are relatively immedi-ate; latent effects were therefore not a consideration for these risk factors.Additional detail on each term is provided below in the text, and is also summarized in Table 21.1.
The primary data sources used for the exposure assessment and thedetermination of some of the risk measures (see Table 21.2) included:the World Bank, ILO, the European Union carcinogen exposure(CAREX) database, published literature on prevalence and level of expo-sure to occupational risk factors, and published literature on epidemiol-ogy of health outcomes linked to occupational risk factors, as cited inthe relevant sections for each risk factor.
ECONOMIC ACTIVITY RATE
EAR is defined as the proportion of the economically active population(EAP) among the overall population. EAR was calculated for each regionand sex in persons aged ≥15 years, and used to estimate the proportionof the population potentially exposed to occupational risks. EAR pro-vides the most comprehensive accounting of persons who may beexposed to occupational risks, as it includes people in paid employment,the self-employed, and people who work to produce goods and services
1658 Comparative Quantification of Health Risks

Marisol Concha-Barrientos et al. 1659Ta
ble
21.1
Sum
mar
y of
det
erm
inan
ts o
f po
pula
tion
expo
sure
to
occu
patio
nal r
isk
fact
ors
Term
Com
men
tsAp
plica
tion
Prim
ary
data
sou
rces
EAP
Econ
omic
ally
act
ive
popu
latio
n is
cal
cula
ted
by a
pplic
atio
n of
the
EA
R t
oU
sed
for
inju
ries
ILO
(20
02a)
the
natio
nal p
opul
atio
n
EAR
Ec
onom
ic a
ctiv
ity r
ate,
calc
ulat
ed a
s th
e EA
P in
eac
h ag
e gr
oup
com
pare
d U
sed
in e
xpos
ure
asse
ssm
ents
of
all
ILO
(20
02a)
to t
he n
umbe
r of
peo
ple
in t
hat
age
grou
p,m
ales
and
fem
ales
≥15
yea
rsri
sk f
acto
rs
PW(e
s)Pr
opor
tion
wor
king
,i.e
.fra
ctio
n of
EA
P in
eco
nom
ic s
ecto
r.D
ata
on
Use
d fo
r ca
rcin
ogen
s,se
lect
ed
Wor
ld B
ank
(200
1)di
stri
butio
n of
EA
P in
to t
hree
eco
nom
ic s
ecto
rs (
agri
cultu
re,i
ndus
try,
airb
orne
par
ticul
ates
(ag
ents
lead
ing
serv
ice)
or
nine
eco
nom
ic s
ubse
ctor
s.C
ount
ry-le
vel d
ata
wer
e w
eigh
ted
to C
OPD
)by
wor
king
-age
pop
ulat
ion
to d
evel
op s
ubre
gion
al a
vera
ges
PW(o
c)Pr
opor
tion
wor
king
,i.e
.fra
ctio
n of
EA
P in
occ
upat
iona
l cat
egor
y.U
sed
for
asth
mag
ens,
nois
e,IL
O (
1995
a);W
orld
Ban
k (2
001)
Cou
ntry
-leve
l dat
a fo
r ab
out
31 c
ount
ries
wer
e w
eigh
ted
by w
orki
ng-a
ge
ergo
nom
ic s
tres
sors
po
pula
tion
to d
evel
op s
ubre
gion
al a
vera
ges.
Ow
ing
to la
ck o
f co
untr
y-le
vel
data
,EM
R-B
was
bas
ed o
n EM
R-D
dat
a,EU
R-C
was
bas
ed o
n EU
R-B
dat
a an
d W
PR-A
was
bas
ed o
n A
MR
-A d
ata
PEW
Prop
ortio
n ex
pose
d w
orki
ng,i
.e.f
ract
ion
of p
opul
atio
n w
orki
ng in
PE
W(e
s):c
arci
noge
nsFI
OH
(19
99);
Kau
ppin
en e
t al
.(20
00)
econ
omic
sec
tor
(or
in a
n oc
cupa
tiona
l cat
egor
y) w
ith e
xpos
ure
to r
isk
PEW
(es)
:sel
ecte
d ai
rbor
neFI
OH
(19
99);
Kau
ppin
en e
t al
.fa
ctor
.Ow
ing
to d
ata
limita
tions
,dat
a fr
om d
evel
oped
cou
ntri
es w
ere
part
icul
ates
(ag
ents
lead
ing
(200
0);K
orn
et a
l.(1
987)
;USE
IA
usua
lly a
pplie
d to
dev
elop
ing
coun
trie
s,ve
rifie
d w
here
pos
sibl
e by
dat
a to
CO
PD)
(200
1)on
spe
cific
ris
k fa
ctor
s fr
om s
peci
fic c
ount
ries
PEW
(oc)
:sel
ecte
d ai
rbor
ne
Kar
jala
inen
et
al.(
2002
);K
ogev
inas
pa
rtic
ulat
es (
asth
mag
ens)
et a
l.(1
999)
PEW
(oc)
:noi
seN
IOSH
(19
98)
PEW
(oc)
:erg
onom
ic s
tres
sors
Leig
h an
d Sh
eetz
(19
89)
EPF
Expo
sure
par
titio
ning
fac
tor,
i.e.p
ropo
rtio
n of
PEW
with
low
- or
hig
h-le
vel
Car
cino
gens
,sel
ecte
d ai
rbor
ne
NIO
SH (
1998
,199
9,20
00a)
;Pea
rce
expo
sure
to
risk
fac
tor
part
icul
ates
,noi
se
et a
l.(1
994)
;Yin
et
al.(
1987
)
OT
Occ
upat
iona
l tur
nove
r fa
ctor
.Use
d on
ly fo
r ri
sk f
acto
rs fo
r w
hich
late
nt
Car
cino
gens
K
.Ste
enla
nd,p
erso
nal
effe
cts
mus
t be
con
side
red
(car
cino
gens
,sel
ecte
d ai
rbor
ne p
artic
ulat
es).
A
com
mun
icat
ion,
2002
fact
or o
f 4
was
est
imat
ed o
n th
e ba
sis
of p
ublis
hed
data
on
labo
ur t
urno
ver
rate
s,pu
blis
hed
coho
rt d
ata
and
mod
ellin
g of
coh
orts
with
var
ious
mea
n le
ngth
s of
exp
osur
e.H
ighe
r va
lue
used
for
spec
ific
regi
ons
for
coal
min
ing

for their own household consumption. According to ILO (2002b), themajority of those who work in the informal sector are included in the“employed” category, and the remainder are in the “unemployed” category; thus, the informal sector workers are included in this analysis.At the same time, persons in precarious or contingent employment oftenface an increased risk of occupational health and safety hazards, whichare not quantified here (Quinlan 2002). The use of EAR for persons aged≥15 years excludes children under 15 who work.
Estimates and projections of EAP were developed by ILO by apply-ing estimates and projections of activity rates, by sex and age group, tothe population estimates and projections assessed by the United Nations(ILO 1996). ILO estimates and projections of economic activity are takenprimarily from population censuses and/or sample surveys carried outbetween 1975 and 1994. ILO also takes data from specific publicationsby national, interregional and/or international institutions.
Country-level data from the ILO electronic database were used todevelop subregion-specific EARs for ages 15 years and above, for malesand females (Table 21.3). EARs were estimated for 60–69-year olds byusing data for 60–64-year olds. Data for people aged ≥65 years were
1660 Comparative Quantification of Health Risks
Table 21.2 Key sources, data supplied and special characteristics of thesources used to estimate exposure
Source Data supplied Comments
ILO (1995a, 2000, 2002b) Employment in economic Collected by national EAP sectors and subsectors, and surveys. Differences among in occupations within economic and within countries (e.g.sectors; EARs by age and sex applicable ages, time period for selected countries covered) limit international
comparability
World Bank (2001) Distribution of EAP (males and Based on ILO datafemales) in agriculture, industry and services; participation of females in the EAP
FIOH (1999); Kauppinen Proportion of the working Applicable to A subregions,et al. (2000) population with occupational extrapolated to B, C, D
exposure to carcinogens in and E subregionsthe European Union, by economic sector and subsector,at the 3-digit classification level
EIA (2001) Country-level data on coal production
ILO (1995b) Country-level data on number of coal miners
NIOSH (1991, 1998); Data on noise exposure of Applicable to A subregions,USDHHS (1986) American workers extrapolated to B, C, D
and E subregions

applied to the 70–79 age group. The ≥80 age group was estimated atone half of the rate for the ≥65 age group (by comparison with country-level data, which is reported by some countries for elderly workers) (ILO 2001).
PROPORTION OF THE POPULATION WORKING IN AN ECONOMIC SECTOR OR
OCCUPATIONAL CATEGORY
The distinction between “where people work”, i.e. economic sector and“what they do”, i.e. occupation, is important in exposure characteriza-tion. For example, within the economic subsector of manufacturing there
Marisol Concha-Barrientos et al. 1661
Table 21.3 Economic activity rates by subregion, sex and age group
Age group (years)
Subregiona Sex 15–29 30–44 45–59 60–69 70–79 ≥80 Total ≥15
AFR-D Male 0.77 0.97 0.95 0.85 0.65 0.33 0.85Female 0.50 0.61 0.62 0.48 0.28 0.14 0.53
AFR-E Male 0.78 0.97 0.95 0.86 0.66 0.33 0.86Female 0.64 0.72 0.69 0.54 0.36 0.18 0.65
AMR-A (95%) Male 0.70 0.93 0.87 0.50 0.13 0.07 0.73Female 0.64 0.81 0.71 0.32 0.07 0.04 0.59
AMR-B Male 0.78 0.97 0.89 0.66 0.33 0.17 0.82Female 0.46 0.53 0.39 0.20 0.07 0.04 0.42
AMR-D Male 0.71 0.98 0.96 0.86 0.61 0.31 0.82Female 0.38 0.48 0.39 0.29 0.17 0.09 0.39
EMR-B (90%) Male 0.66 0.97 0.92 0.74 0.45 0.23 0.79Female 0.33 0.37 0.26 0.18 0.09 0.05 0.31
EMR-D (40%) Male 0.73 0.97 0.94 0.76 0.44 0.22 0.82Female 0.37 0.43 0.37 0.25 0.12 0.06 0.37
EUR-A Male 0.66 0.96 0.84 0.35 0.05 0.03 0.68Female 0.59 0.74 0.56 0.14 0.02 0.01 0.47
EUR-B Male 0.72 0.96 0.80 0.41 0.22 0.11 0.74Female 0.56 0.77 0.59 0.23 0.12 0.06 0.54
EUR-C Male 0.72 0.97 0.89 0.30 0.11 0.06 0.74Female 0.61 0.94 0.74 0.17 0.05 0.03 0.58
SEAR-B Male 0.74 0.98 0.94 0.73 0.44 0.22 0.83Female 0.55 0.70 0.65 0.44 0.21 0.11 0.58
SEAR-D (95%) Male 0.77 0.98 0.95 0.72 0.53 0.27 0.85Female 0.45 0.57 0.50 0.32 0.16 0.08 0.47
WPR-A Male 0.67 0.97 0.95 0.69 0.30 0.15 0.76Female 0.57 0.70 0.67 0.36 0.13 0.07 0.52
WPR-B (90%) Male 0.81 0.98 0.92 0.61 0.29 0.15 0.84Female 0.77 0.89 0.67 0.29 0.09 0.05 0.71
a When data were not available for all countries, the percentage of the regional working agepopulation (≥15 years) represented by data is indicated. Some very small countries, e.g. Grenada,were not included in these calculations.
Source: ILO (2002a).

are people who work as production workers, but also people who workas clerical or sales people (Table 21.4). EAP was used for injuries. EAPby economic sector and subsector was used for carcinogens and agentsleading to COPD, because available data do not distinguish exposuresby occupational category within economic sectors. For asthmagens, noiseand ergonomic stressors, the analyses were conducted on the basis ofexposure by occupational category within economic sectors.
The approach used here is based on the International Standard Indus-trial Classification of All Economic Activities (ISIC), an economic clas-sification system of the United Nations, which organizes all economicactivities by economic sectors and relevant subgroupings (ILO 1987; UN 2000). The ISIC system is used almost universally by national andinternational statistical services to categorize economic activity, andtherefore allowed us to make global comparisons. Table 21.4 illustratesthe ISIC classification scheme of economic sectors, economic subsectorsand occupational categories that were used to estimate exposures toworkers in this project. We did not subdivide agriculture into economicsubsectors.
Economic sector
For each subregion, a weighted proportion of working men and women(EAP) in each of the three economic sectors was constructed (Table 21.5)(World Bank 2001, data from 1990 and 1996–1998). Economic sectoremployment data were used to subdivide the number of workers inindustry into the economic subsectors of mining, manufacturing, elec-tricity (and other utilities) and construction. In a similar manner, the datafor the service sector were subdivided into the economic subsectors of trade, transport, finance and services. The agriculture sector was notsubdivided.
1662 Comparative Quantification of Health Risks
Table 21.4 Illustration of the ISIC classification system used in exposureassessment
Occupational categoriesEconomic Economic sector subsectors Professional Administration Clerical Sales Service Agriculture Production
Agriculture
Industry MiningManufacturingElectricalConstruction
Services TradeTransportFinanceServices
Source: ILO 1987.

Marisol Concha-Barrientos et al. 1663
Tabl
e 21
.5EA
P di
stri
butio
n in
eco
nom
ic s
ecto
rs a
nd s
ubse
ctor
s,by
sub
regi
on a
nd s
ex
Indu
stry
Serv
ices
Subr
egio
naSe
xAg
ricul
ture
Min
ing
Man
ufac
turin
gEl
ectr
icity
Cons
truc
tion
Trad
eTr
ansp
ort
Fina
nce
Serv
ices
Sum
AFR
-D (
20%
)M
ale
0.55
0.01
0.09
0.01
0.04
0.06
0.04
0.03
0.16
1.00
Fem
ale
0.68
0.00
0.05
0.00
0.01
0.06
0.03
0.02
0.16
1.00
AFR
-E (
20%
)M
ale
0.55
0.01
0.09
0.01
0.04
0.05
0.03
0.03
0.18
1.00
Fem
ale
0.65
0.00
0.03
0.00
0.00
0.05
0.02
0.02
0.22
1.00
AM
R-A
(95
%)
Mal
e0.
050.
010.
210.
010.
090.
210.
060.
100.
261.
00Fe
mal
e0.
020.
000.
090.
000.
010.
230.
030.
140.
471.
00
AM
R-B
Mal
e0.
200.
010.
150.
040.
080.
100.
050.
250.
121.
00Fe
mal
e0.
120.
000.
120.
000.
010.
140.
010.
050.
551.
00
AM
R-D
(70
%)
Mal
e0.
070.
010.
160.
010.
110.
180.
070.
090.
301.
00Fe
mal
e0.
030.
000.
120.
000.
000.
310.
010.
060.
461.
00
EMR
-B (
5%)
Mal
e0.
150.
010.
160.
030.
110.
150.
080.
050.
271.
00Fe
mal
e0.
090.
000.
090.
000.
010.
200.
050.
090.
471.
00
EMR
-D (
20%
)M
ale
0.45
0.00
0.11
0.01
0.07
0.30
0.00
0.03
0.02
1.00
Fem
ale
0.68
0.00
0.10
0.01
0.01
0.20
0.00
0.00
0.01
1.00
EUR
-A
Mal
e0.
060.
010.
270.
010.
110.
010.
000.
050.
481.
00Fe
mal
e0.
050.
000.
150.
000.
020.
010.
010.
120.
641.
00
cont
inue
d

1664 Comparative Quantification of Health Risks
Tabl
e 21
.5EA
P di
stri
butio
n in
eco
nom
ic s
ecto
rs a
nd s
ubse
ctor
s,by
sub
regi
on a
nd s
ex (
cont
inue
d)
Indu
stry
Serv
ices
Subr
egio
naSe
xAg
ricul
ture
Min
ing
Man
ufac
turin
gEl
ectr
icity
Cons
truc
tion
Trad
eTr
ansp
ort
Fina
nce
Serv
ices
Sum
EUR
-B (
70%
)M
ale
0.29
0.02
0.20
0.02
0.08
0.07
0.04
0.07
0.20
1.00
Fem
ale
0.44
0.00
0.16
0.01
0.01
0.03
0.01
0.04
0.30
1.00
EUR
-C (
35%
)M
ale
0.21
0.04
0.14
0.03
0.15
0.05
0.20
0.12
0.06
1.00
Fem
ale
0.16
0.03
0.12
0.02
0.04
0.12
0.24
0.12
0.15
1.00
SEA
R-B
(30
%)
Mal
e0.
460.
010.
120.
010.
070.
140.
060.
010.
131.
00Fe
mal
e0.
450.
000.
150.
000.
010.
220.
010.
010.
151.
00
SEA
R-D
(80
%)
Mal
e0.
530.
020.
130.
020.
030.
010.
060.
040.
171.
00Fe
mal
e0.
800.
010.
100.
000.
010.
000.
000.
020.
061.
00
WPR
-A
Mal
e0.
050.
000.
240.
010.
130.
170.
100.
090.
211.
00Fe
mal
e0.
060.
000.
170.
000.
040.
270.
040.
110.
311.
00
WPR
-B (
95%
)M
ale
0.44
0.03
0.14
0.01
0.05
0.09
0.06
0.02
0.16
1.00
Fem
ale
0.40
0.01
0.12
0.01
0.01
0.17
0.06
0.06
0.17
1.00
aW
hen
data
wer
e no
t av
aila
ble
for
all c
ount
ries
,the
per
cent
age
of t
he r
egio
nal w
orki
ng a
ge p
opul
atio
n (≥
15 y
ears
) re
pres
ente
d by
dat
a is
indi
cate
d.So
me
very
sm
all c
ount
ries
,e.
g.G
rena
da,w
ere
not
incl
uded
in t
hese
cal
cula
tions
.
Not
e:A
FR-D
and
AFR
-E (
com
bine
d),E
MR
-B,E
MR
-D a
nd S
EAR
-D d
ata
are
base
d on
199
0 em
ploy
men
t da
ta f
rom
the
Wor
ld B
ank
wor
ld d
evel
opm
ent
indi
cato
rs,a
s EA
P da
ta w
ere
very
limite
d.A
ll ot
hers
are
tak
en f
rom
199
6–19
98 W
orld
Ban
k EA
P da
ta.S
ubre
gion
al a
vera
ges
wer
e ca
lcul
ated
usi
ng c
ount
ry v
alue
s w
eigh
ted
by t
he w
orki
ng-a
ge p
opul
atio
n.

Occupational category
Regional tables of occupation within economic sector distributions wereconstructed using the number of employed people by occupation andeconomic sector. For comparison purposes, data were obtained from onesource (ILO 1995a). For a subregion with only one country represented,the distribution of occupation within economic sector was assumed torepresent the regional employment patterns. Where more than onecountry was represented, a weighted average was constructed. Wherethere were no data for the subregion, patterns for the most similar subregion were applied (EMR-B based on EMR-D, EUR-C based onEUR-B and WPR-A based on AMR-A). Because of limited data on occu-pational distribution by sex within an economic sector, the same distri-bution (i.e. proportional division) was applied within a subregion to ages15 and above, and to males and females. The A subregions had higherproportions of EAP in the professional, managerial and administrativecategories, while the B, C, D and E subregions had proportionally moreworkers in the production categories.
PROPORTION OF WORKERS IN AN ECONOMIC SECTOR OR OCCUPATIONAL
CATEGORY WITH EXPOSURE
Worldwide data on worker exposure are limited. Therefore, severalassumptions were made, validated where possible, to establish the pro-portion of workers exposed to a specific risk factor within an economicsector (PEW). More detail is presented in the sections on specific riskfactors.
EXPOSURE PARTITIONING FACTOR (EPF)
In order to partition into high and low exposure groups those workersexposed to carcinogens, we chose the United States Occupational Healthand Safety Administration (OSHA) Permissible Exposure Levels (PELs).For most carcinogens we were then able to estimate the risks for the lowand high exposure groups from the literature.
The OSHA PELs state a level of the agent that can never be exceededin the workplace (usually based on eight-hour time-weighted averageexposures), and these have had the force of law in the United States asmaximum limits of exposure since the creation of OSHA in 1971. Similaroccupational exposure limits (OELs) have been promulgated as law bymany countries, particularly in the A subregions, and as recommenda-tions by professional expert groups. It is generally considered that a long-term mean exposure in a “minimally controlled” work environment willbe in the range 0.3–0.5 times the PEL (Hewett 1996). For example, theAmerican Industrial Hygiene Association suggests that a typical long-term average exposure may be one third of an eight-hour PEL (Roach1992).
Marisol Concha-Barrientos et al. 1665

A different approach was used for asthmagens and agents leading toCOPD. The actual disease-causing exposures themselves, within theseoccupations, are either generic (e.g. dust) or too numerous to be useful(e.g. there are over 200 known asthmagens). In both instances there wereno international data on the number of workers exposed, which dictatedthe approach of using occupations or economic subsectors. For asthma,different relative risks were available for eight large occupational groups,while for COPD we partitioned the overall relative risk for the exposedpopulation into high and low relative risks, and assigned these to dif-ferent economic subsectors according to Korn et al. (1987).
OCCUPATIONAL TURNOVER (OT)
Cancers and lung diseases have long latency periods and once the diseaseprocess has begun the worker continues to be at risk, even after expo-sure ceases. This means that persons who were exposed in the past mustbe considered as ever-exposed, even if they are currently working in non-exposed jobs or have retired. Furthermore, OT increases the number ofpersons ever exposed to an occupational risk. This approach was con-sistent with cohorts represented in the epidemiological studies fromwhich relative risks were taken. The OT factor was not utilized in esti-mating the numbers of workers exposed to noise, ergonomic stressors orrisk factors leading to occupational injuries, as these risk factors do nothave latent effects. No turnover was estimated for asthma and COPDowing to a lack of sufficient information on the applicability to studiesin which relative risk was measured. Table 21.6 presents data from theliterature on annual OT rates in various countries and industriesthroughout the world, organized by subregion. These reports did notindicate if employees were new to the job or to the industry, althoughseveral studies were at the company level, indicating that the worker wasnew to the company. Therefore, to account for previously unexposedworkers entering jobs with carcinogen or dust exposures, an annualturnover rate (ATR) of 10% was selected for all subregions.
An adjustment factor (noted as OT) to account for annual turnoverin jobs with exposure to occupational carcinogens was determined asfollows:
Computation of adjustment factor to correct for occupationalturnover (OT)
(3)
where
Pt = the proportion who have ever been occupationally exposed,during a period of 40 years, still living
Adjustment factor, OT P P
original workers new workers deaths original workers
P P ATR t mortality rate P P ATR t P
t 0
0 0 0 0 0
== + -[ ]= + ¥ ¥[ ] - ( ) + ¥ ¥( )([ ]{ }
1666 Comparative Quantification of Health Risks

Marisol Concha-Barrientos et al. 1667
Tabl
e 21
.6Tu
rnov
er r
ates
in v
ario
us in
dust
ries
and
cou
ntri
es
Annu
al t
urno
ver
Coun
try
or a
rea
Basis
of
mea
sure
men
tra
te (
ATR)
Com
men
tsSo
urce
A s
ubre
gio
nsIt
aly
Met
al—
mec
hani
cal e
ngin
eeri
ng13
.4%
Indu
stry
leve
l,ba
sed
on 2
729
Luci
fora
(19
98)
indu
stry
obse
rvat
ions
Ital
y26
%To
tal w
orke
r tu
rnov
er r
ate,
incl
udin
g Lu
cifo
ra (
1998
)ac
cess
ion
and
sepa
ratio
n
Spai
nBa
sque
Indu
stri
al p
rodu
ctio
n 3%
65 fi
rms—
cite
d as
low
rat
eJo
hnso
n an
d W
hyte
(19
77)
coop
erat
ive
(man
ufac
turi
ng)
Uni
ted
Stat
esR
esta
uran
t in
dust
ry50
0%8
sout
hern
res
taur
ants
Butle
r an
d Tw
addl
e (1
979)
Uni
ted
Stat
esG
arm
ent
man
ufac
turi
ng14
0%15
3 fe
mal
e w
orke
rs a
t a
sing
le p
lant
in
Koc
h an
d R
hode
s (1
981)
the
sout
h-w
est
Uni
ted
Stat
esO
ne in
ters
tate
tru
ckin
g fir
m40
%Ex
pect
ed r
ate
for
1997
—tr
uck
driv
ers
EIU
(19
97a)
Uni
ted
Stat
esC
alifo
rnia
Silic
on V
alle
y,on
e fin
anci
al fi
rm25
%So
ftw
are
serv
ices
gro
upEI
U (
1997
f)
Uni
ted
Stat
esN
ew M
exic
oSt
ate-
wid
e su
rvey
by
New
25
% p
er q
uart
er,r
angi
ngA
gric
ultu
re r
ates
sho
w g
reat
est
Mof
fett
(20
02)
Mex
ico
Dep
artm
ent
of L
abor
,fr
om 2
9% in
agr
icul
ture
se
ason
al v
aria
tion
Janu
ary–
Mar
ch 2
001
to 1
5% in
pub
lic
adm
inis
trat
ion
B s
ubre
gio
nsBr
azil
Braz
ilian
labo
ur m
arke
t47
%
Cite
d as
hig
her
than
mos
t m
arke
ts fo
r EI
U (
1997
b)w
hich
dat
a ar
e av
aila
ble
cont
inue
d

1668 Comparative Quantification of Health Risks
Tabl
e 21
.6Tu
rnov
er r
ates
in v
ario
us in
dust
ries
and
cou
ntri
es (
cont
inue
d)
Annu
al t
urno
ver
Coun
try
or a
rea
Basis
of
mea
sure
men
tra
te (
ATR)
Com
men
tsSo
urce
Chi
naFo
reig
n In
vest
men
t En
terp
rise
,Su
ppor
t st
aff
med
ian
EIU
(19
96a)
key
man
ager
s an
d te
chni
cian
sra
te,7
%,u
p to
>50
%;
mid
dle
man
agem
ent
med
ian
rate
4%
,up
to>3
5%
Chi
naO
ne m
anuf
actu
rer
of s
pun
40%
(19
92–1
993)
Turn
over
red
uctio
ns d
ue t
o es
tabl
ishm
ent
EIU
(19
96b)
poly
este
r21
% (
1994
)of
hou
sing
pro
gram
me
17%
(19
95)
7% (
expe
cted
for
1996
)
Chi
naFo
reig
n In
vest
men
t En
terp
rise
11.8
% (
1999
)St
aff
turn
over
var
ies
wid
ely
by s
ubre
gion
,13
.4%
(20
01)
indu
stry
and
typ
e of
ent
erpr
ise
EIU
(20
01a,
2002
)
Chi
na Hon
g K
ong
Spec
ial
Expa
tria
te t
each
ers,
2000
25%
EIU
(20
01c)
Adm
inis
trat
ive
Reg
ion
East
ern
Car
ibbe
anIn
form
atic
s fir
ms
2%C
ited
as lo
w r
ate
EIU
(19
97d)
East
ern
Euro
peSe
curi
ty p
erso
nnel
16
0%EI
U (
1998
)
Lao
Peop
le’s
Dem
ocra
ticV
ient
iane
Uni
vers
ity C
olle
geH
alf
of s
taff
have
Im
prov
ed o
win
g to
sta
ff tr
aini
ngEI
U (
1997
c)R
epub
lic2-
year
ten
ure,
aver
age
else
whe
re is
3 m
onth
s
Rep
ublic
of
Kor
eaN
atio
nal l
evel
3%C
ited
as lo
w r
ate
EIU
(19
97e)
D s
ubre
gio
nsIn
dia
Man
ager
sM
inim
um 1
0% e
stim
ated
Mos
tly fo
reig
n-in
vest
ed v
entu
res
EIU
(19
95)
Indi
aO
ne c
ompu
ter
man
ufac
ture
r9%
(19
94)
200
empl
oyee
sEI
U (
1995
)
E s
ubre
gio
nsU
gand
aU
gand
a R
ailw
ay C
orpo
ratio
n 15
%A
nnua
l em
ploy
ee t
urno
ver
rate
EIU
(20
01b)
(mid
-199
0s)

Marisol Concha-Barrientos et al. 1669
P0 = the proportion who are occupationally exposed at time t=0
ATR = turnover/year, taken as 0.10
t = time, taken as 40 years, a typical working lifetime
mortality = 20% of total cohort, based on published death rates of about5 deaths per thousand over a period of 40 years (Minino andSmith 2001).
Equation 3 results in an adjustment factor of OT= 4 to correct foroccupational turnover over a 40-year period with a median exposureduration of 10 years.
In addition to knowing the numbers of workers exposed to agentswith latent health effects, in some cases it was also useful to know theduration of exposure to agents with latent effects for outcomes for whichthe risks were based on cumulative exposure. Cohort modelling was conducted to determine the typical duration of exposure (K. Steenland,personal communication, 2002). This modelling assumed that peopleworked for a maximum of 40 years, that 10% of the workers werereplaced each year, and that 20% died over the 40-year period. Expo-sure durations were randomly selected from a log-normal distribution.Persons were also randomly assigned a starting age at entry between 20and 45 years, and were assumed to retire at age 65 years if they had notalready left the cohort by that age. A steady-state working populationwas produced by using a log-normal distribution for exposure with ageometric mean of 9 years. Using this, the mean length of exposure (inyears) at the end of 40 years could be estimated (by age) for all personsever exposed in the cohort. The average estimated length of exposure,as shown in Table 21.7, was 9.8 years, which is consistent with data ona wide range of cohorts presented in the published literature (Steenlandet al. 1991a, 1991b, 2001b).
1.5 Risk factor–disease relationship
Risk measures (relative risks or mortality rates) for the health outcomesresulting from exposure to the risk factors considered in this study weredetermined primarily from peer-reviewed, published studies. Adjust-ments were made, as appropriate, to account for differences in levels ofexposure, exposure duration and/or age, sex and subregion.
• For carcinogens leading to cancer of the lung, trachea or bronchus,and for leukaemogens, composite values were taken from the litera-ture and adapted to exposure patterns in the various subregions.
• For asthma, the relative risks for different occupations were takenfrom Karjalainen et al. (2002), with the exception of work in agri-culture, for which the relative risk was taken from Kogevinas et al.(1999).

• For COPD, the relative risks for different economic subsectors weretaken from Korn et al. (1987).
• For noise, relative risks of noise-induced hearing loss were calculatedfrom data on hearing loss in workers with different levels of noiseexposure in the United States (NIOSH 1998).
• The relative risks of low back pain, given employment in differentoccupational categories, were taken from Leigh and Sheetz (1989).
• Owing to heterogeneity of factors leading to occupational injuries, relative risks could not be extrapolated from one setting to another.As a result, the mortality rates for workers exposed to risk factorsleading to injuries were estimated for different subregions fromvarious sources, including Laborsta (ILO 2001).
2. Occupational carcinogensThe International Agency for Research on Cancer (IARC 2002) has classified 150 chemical or biological agents or exposure situations asknown or probable human carcinogens. IARC has classified 87 agents,mixtures or exposure circumstances as Group 1 (carcinogenic tohumans), including various chemical compounds, pharmaceuticals andbacterial and viral infections. Many are encountered in occupational set-tings, e.g. asbestos and cadmium. An additional 63 agents, mixtures orexposure circumstances have been classified as Group 2A (probably car-cinogenic to humans). Those with occupational significance includediesel fumes and benzidine-based dyes (IARC 2001). Although IARCclassifies agents according to their overall carcinogenicity, specific sitesare also considered.
Work-related malignant conditions can arise from a large variety ofoccupational exposures. However, the main groups of conditions are relatively few—lung cancer and leukaemia. The exposures selected forassessment in this study were based on how common they may be, the
1670 Comparative Quantification of Health Risks
Table 21.7 Exposure duration after 40 years in model cohort
Age group (years) Number Total exposure (years) Average exposure (years)
15–29 12 50 4.2
30–44 86 575 6.7
45–59 117 1182 10.1
60–69 105 1195 11.4
70–79 53 618 11.7
≥80 19 234 12.3
All ages 392 3854 9.8

risk arising from exposure, the strength of evidence and the availabilityof data. Table 21.8 shows the definition of each of the chemical andphysical agents, along with the related cancer.
The analysis included relevant Group 1 and 2A carcinogens, with thefollowing exceptions.
• Tetrachloroethylene and trichloroethylene, both classified in Group2A, were not included as carcinogens because the evidence for canceris weak.
• The aromatic amines and dyes, including 2-naphthylamine, benzidine-based dyes, benzidine and 4,4’-methylenebis(2-chloroaniline) (alsoknown as MOCA) were excluded owing to lack of data for develop-ing countries.
• Occupational carcinogens with extremely limited exposures (e.g. bis-chloromethyl ether, also known as BCME) were not included.
• Compounds for which exposure estimates were not available from theCAREX database (e.g. soot, xenylamine, 4-nitrobiphenyl and poly-cyclic aromatic hydrocarbons) were not included.
• Although radon is an IARC Group I carcinogen with large estimatedexposures, it was excluded from consideration owing (i) to worldwidedifferences in naturally occurring radon emissions, (ii) to wide variations in climate and construction methods, which substantially affect the concentration of radon retained in buildings, and (iii) to difficulties in separating occupational and nonoccupational radonexposures.
Other conditions have insufficient relevant exposure data, insufficientrisk data or insufficient number of cases worldwide to allow them to beusefully included. These conditions include:
• bladder cancer (aromatic amines, benzidine dyes, MOCA);
• liver (vinyl chloride);
• nasal cavity and middle ear (hardwood dust, chromium VI com-pounds, nickel compounds);
• bone and articular cartilage (ionizing radiation);
Marisol Concha-Barrientos et al. 1671
Table 21.8 Occupational carcinogens and health outcomes
Occupational carcinogen Outcome
Arsenic, asbestos, beryllium, cadmium, chromium, diesel exhaust, Cancer of the trachea,nickel, silica bronchus or lung
Benzene, ethylene oxide, ionizing radiation Leukaemia

• skin (arsenic, by-products of distillation, ionizing radiation); and
• lung cancer due to passive smoking in the workplace.
2.1 Exposure variable and theoretical-minimum-riskexposure
Exposure was divided into three categories: background, low and high.The occupational risk factors for cancer involve workplace exposure, atconcentrations higher than background level, to various chemical andphysical agents that are known to cause malignant neoplasms. Thus, thetheoretical minimum risk corresponds to “no occupational exposure tophysical, chemical or biological agents or other factors above back-ground levels”.
2.2 Estimating risk factor levels
The general exposure assessment methodology was described earlier.This assessment was based on the distribution of the EAP by economicsubsector, because the primary exposure data sources used in this analy-sis organized carcinogen exposure data by economic subsector (Equa-tion 1). The regional distributions of workers into economic subsectorswere adjusted by data on the carcinogens to which people in the variouseconomic subsectors were exposed. As described earlier, an adjustmentfactor of 4 was used to account for turnover in jobs with exposure tooccupational carcinogens.
The primary data source on work-related exposure to carcinogens foreach economic subsector (PEW(es(r,g)i) in Equation 1) is the CAREXdatabase (FIOH 1999), which presents data on the number of workersin the European Union exposed to 139 carcinogens (IARC Group 1, 2Aand selected 2B agents) at levels above background in 1990–1993. Table21.9 lists the CAREX data for the carcinogens in our study. These esti-mates were based on national workforce data and exposure prevalenceestimates from Finland and the United States, adjusted for the economicstructure of each country, then refined by national experts.
It was assumed that the proportion of workers exposed to a particu-lar carcinogen in a specific economic subsector was constant throughoutthe world. To check the validity of this assumption, the literature wassearched for estimates of the number of workers exposed to silica. Silicawas chosen as an indicator because there are more data on silica avail-able for developing countries than on other carcinogens. This searchyielded a range of study types, from rough estimates (Zou Changqi etal. 1997) to studies in which air concentrations were measured in work-places (Yin et al. 1987). Estimates of the number of workers exposed tosilica in China, Thailand and Viet Nam, and to benzene in China, werecompared to the number of persons employed in that country, either ina specific economic sector or overall. The results obtained were com-pared with CAREX data. With a few exceptions, the estimated fraction
1672 Comparative Quantification of Health Risks

Marisol Concha-Barrientos et al. 1673
Tabl
e 21
.9M
ean
prop
ortio
ns o
f w
orke
rs e
xpos
ed t
o se
lect
ed c
arci
noge
ns,b
y ec
onom
ic s
ecto
r an
d su
bsec
tor,
in t
he
Euro
pean
Uni
on
Carc
inog
enAg
ricul
ture
Min
ing
Man
ufac
turin
gEl
ectr
ical
Cons
truc
tion
Trad
eTr
ansp
ort
Fina
nce
Serv
ices
Silic
a0.
0037
20.
2304
90.
0232
70.
0141
50.
1886
00.
0001
70.
0047
60.
0000
20.
0006
1
Cad
miu
m0.
0000
00.
0000
00.
0048
70.
0028
70.
0029
10.
0000
20.
0006
50.
0000
00.
0004
7
Nic
kel
0.00
000
0.02
025
0.01
680
0.00
352
0.00
047
0.00
007
0.00
003
0.00
000
0.00
043
Ars
enic
0.00
054
0.00
072
0.00
400
0.00
148
0.00
134
0.00
006
0.00
000
0.00
002
0.00
011
Chr
omiu
m0.
0000
00.
0034
60.
0207
90.
0040
90.
0023
70.
0001
70.
0037
00.
0000
00.
0022
5
Die
sel f
umes
0.00
646
0.21
970
0.01
110
0.03
358
0.05
816
0.00
485
0.13
438
0.00
000
0.00
914
Bery
llium
0.00
000
0.00
055
0.00
207
0.00
070
0.00
004
0.00
002
0.00
011
0.00
000
0.00
003
Asb
esto
s0.
0124
80.
1024
80.
0059
00.
0170
20.
0520
30.
0029
20.
0068
40.
0001
60.
0028
4
Benz
ene
0.00
100
0.00
200
0.00
300
0.00
100
0.00
100
0.01
000
0.00
500
0.00
000
0.02
000
Ioni
zing
rad
iatio
n0.
0000
00.
0110
00.
0000
00.
0340
00.
0000
00.
0000
00.
0040
00.
0000
00.
0000
0
Ethy
lene
oxi
de0.
0001
20.
0013
70.
0006
00.
0000
60.
0002
70.
0000
00.
0000
20.
0000
00.
0005
7
Sour
ce:
Cal
cula
ted
from
CA
REX
(FI
OH
199
9).

1674 Comparative Quantification of Health Risks
of workers exposed to silica was equal to or higher in these countriesthan indicated by CAREX (Juengprasert 1997; T. Nguyen, personal com-munication, 2001; NIEHS 1999; Phan Hong Son et al. 1999; Yin et al.1987; Zou Changqi et al. 1997). For example, the proportion of workersexposed to silica in manufacturing in Viet Nam is 3.7%, compared tothe CAREX estimate of 2.3%.
It was assumed that, within a given economic subsector, both maleand female workers and younger and older workers had the same prob-ability of exposure. For example, if 2.3% of people working in manu-facturing were exposed to silica, it was assumed that 2.3% of males and2.3% of females working in manufacturing were exposed to silica, youngand old alike. There were, however, fewer females working in manufac-turing, so that at the population level the proportion of females withexposure to silica was lower than that of males.
There are few data on the distribution of exposure monitoring values,which are needed to accurately estimate the proportion of workersexposed to above or below a specific value (EPF(r) in Equation 1). There-fore, the demarcation between low and high exposure was establishedas the PELs enforced by OSHA. Some reasons for selecting the PELs aspartitioning values include the following.
• Exposure data for the United States are often reported based on “com-pliance with” or “exceeding” the PELs.
• The risks corresponding to low or high exposure have been linked tothe PELs.
• As cancers have long latency periods, the exposures of concern haveoccurred several decades in the past. The OSHA PELs for many car-cinogens have not changed since their adoption in 1971, allowing astable benchmark for comparison (Table 21.10).
The peer-reviewed literature was searched for studies that includedproportions of workers exposed above and below particular levels. Thereare many reports of exposures to contaminants in the literature, and evenon the distribution of exposures at low and high levels in developedcountries. However, there are few data on distribution of exposure valuesfor developing countries. A summary of the major sources used to decidehow to partition exposure values for carcinogens for the B, C, D and Esubregions is presented in Tables 21.11 and 21.12 for benzene andmetals, respectively.
The following data were used to partition exposure for A subregions:
• Finnish data (Partanen et al. 1995), indicating 11–94% exposed above0.2 mg/m3 respirable silica in a range of industries;
• NIOSH (1999) estimates of proportions of workers exposed abovethe PELs of 4% (asbestos) and 13.6% (silica); and

Marisol Concha-Barrientos et al. 1675
Table 21.10 OSHA permissible exposure levels (PELs) for carcinogens
Chemical/physical agent PEL Source Comment
Arsenic Inorganic: 10mg/m3 OSHA, 29 CFR 1910.1018 Effective 1978Organic: 0.5mg/m3 OSHA, 29 CFR 1910.1000, Effective 1971
Table Z-1
Asbestos Varieda
Benzene 10ppm OSHA, 29 CFR 1910.1000, Effective 1971Table Z-2
1ppm OSHA, 29 CFR 1910.1028 Effective 1987
Beryllium 2mg/m3 OSHA, 29 CFR 1910.1000, Effective 1971Table Z-2
Cadmium Fume: 0.1mg/m3 OSHA, 29 CFR 1910.1000, Effective 1971Table Z-2
Dust: 0.2mg/m3 OSHA, 29 CFR 1910.1000, Effective 1971Table Z-2
5mg/m3 29 CFR 1910.1027 Effective 1992
Chromium Chromic acid and OSHA, 29 CFR 1910.1000, Effective 1971chromates: 0.1mg/m3 Table Z-2 (ceiling)Chromium metal: OSHA, 29 CFR 1910.1000, Effective 19711 mg/m3 Table Z-1
Diesel exhaust NA
Ethylene oxide 1ppm OSHA, 29 CFR 1910.1047 Effective 1984
Ionizing Rems/calendar OSHA, 29 CFR 1910.1096, Effective 1974radiation quarter: whole Table G-18
body, 1.25; hands,forearms, feet,ankles, 18.75;skin, 7.5
Nickel Metal, insoluble and OSHA, 29 CFR 1910.1000, Effective 1971soluble compounds: Table Z-11 mg/m3
Silica Respirable OSHA, 29 CFR 1910.1000, Effective 1971.quartz: (10mg/m3)/ Table Z-3 For 100% silica dust,(per cent SiO2 + 2) this is equivalent to
0.1 mg/m3. Halve thisvalue for cristobaliteand tridymite
NA Not applicable.a As shown in this table, most of the PELs have not changed since they were put in place. However,
there were considerable changes in the United States PEL for asbestos during the years ofinterest to the current analysis, with a level before 1972 of 12 fibres/ml before the first OSHA-issued PEL in 1972 decreasing, through several steps, to 0.1 fibres/ml in 1994 (Martonik et al.2001; Nelson 1997).
Source: USDOL OSHA (2002a).

1676 Comparative Quantification of Health Risks
Table 21.11 Occupational exposure to benzene in developing countries
Country Industry Concentration Year (or year reported)
Egypt Rubber coating 0–74mg/m3 (1986)
Turkey Shoemaking 48–96mg/m3 1970672 mg/m3 (maximum level)
India Petrol pump 4.5mg/m3 (mean) 1991
China Various: paint, 0.06–850mg/m3 (1987)chemical, varnish works, shoemaking
Brazil Steel workers 960–3200mg/m3 per day (1993)Petrochemical 140mg/m3, maximum of (1993)
personal samples
Source: Pearce et al. (1994).
Table 21.12 Occupational exposures to metals in developing countries
Country Industry Concentration Year (or year reported)
China Tin mine Arsenic: 0.42mg/m3, mean 1952Arsenic: 0.01mg/m3 1980s
China Cadmium refining Cadmium: 0.04–0.074mg/m3 1970s
Singapore Storage battery factory Cadmium: 0.13–58.3mg/m3, 1980geometric means of three sets of samples
China Chromate production 0.02–21.3mg/m3 1960s–19800.55mg/m3, mean (1989)
Source: Pearce et al. (1994).
• NIOSH (2000b) data on miners, indicating silica exposures above thePEL for 8% of coal mine samples, 16% of metal mine samples, 9%of stone mine samples and 8% of sand and gravel facility samples.
For the B, C, D and E subregions, important evidence includes:
• Chinese data (Dosemeci et al. 1995), indicating roughly three quar-ters of samples above 0.1 mg/m3 respirable silica;
• a study of a South African brickworks (Myers et al. 1989), in which45% of presented sample values were above 0.1 mg/m3 and roughlytwo thirds and four fifths of samples in medium and dusty areas,respectively, were above 0.1mg/m3 respirable silica;
• a study of a South African pottery (Rees et al. 1992), where roughlythree quarters of samples that included silica analysis were above theThreshold Limit Value (TLV); and

• the Chinese benzene study (Yin et al. 1987), in which 35% of over50000 workplaces had concentrations at or above 40 mg/m3, in com-parison to the current OSHA PEL of 3.2mg/m3 for benzene, and inwhich the benzene concentration in 86% of 141 shoe factories wasabove 25mg/m3.
Based on these data, partition factors for carcinogen exposures weredetermined for the A and for the B, C, D and E subregions, as shown inTable 21.13.
LUNG CARCINOGENS
The proportions of the population exposed to the occupational lung car-cinogens included in the study (Table 21.8) are shown in Tables 21.14and 21.16 by subregion, age, sex and level of exposure.
LEUKAEMOGENS
The proportions of the population exposed to occupational leukae-mogens (Table 21.8) are presented in Table 21.15 by subregion, age, sexand level of exposure.
2.3 Risk factor–disease relationships
Relative risk estimates were used for lung carcinogens and leukae-mogens. Table 21.17 summarizes the chemical or physical agent, the spe-cific cancer and the key data sources that provided evidence of the linkbetween the two. These review studies assessed risk measures for themain sites of occupational cancer, including the lung (which, for the pur-poses of this study, includes the trachea, bronchus and lung), thehaematopoietic system (represented in this study by leukaemia) andmalignant mesothelioma.
Relative risks for lung cancer and leukaemia were taken from studiesof cohorts of workers with variable exposure durations and intensities,variable periods from the last exposure and variable lengths of follow-up. They therefore compare exposed with unexposed groups. In prepar-ing relative risk estimates for exposure outcomes of interest, severalassumptions were made:
Marisol Concha-Barrientos et al. 1677
Table 21.13 Exposure partition factors for carcinogens for the A and forthe B, C, D and E subregions
Proportion of exposed workers with Proportion of exposed workers withSubregion low exposures (at or below the PEL) high exposures (above the PEL)
A 0.90 0.10
B, C, D and E 0.50 0.50

1678 Comparative Quantification of Health Risks
Table 21.14 Proportions of the population exposed to lung carcinogensby subregion, age, sex and level of exposure
Age group (years)
Subregion Sex Exposure level 15–29 30–44 45–59 60–69 70–79 ≥80
AFR-D Male Background 0.837 0.837 0.837 0.837 0.837 0.837Low 0.082 0.082 0.082 0.082 0.082 0.082High 0.082 0.082 0.082 0.082 0.082 0.082
Female Background 0.934 0.934 0.934 0.934 0.934 0.934Low 0.033 0.033 0.033 0.033 0.033 0.033High 0.033 0.033 0.033 0.033 0.033 0.033
AFR-E Male Background 0.839 0.839 0.839 0.839 0.839 0.839Low 0.080 0.080 0.080 0.080 0.080 0.080High 0.080 0.080 0.080 0.080 0.080 0.080
Female Background 0.929 0.929 0.929 0.929 0.929 0.929Low 0.035 0.035 0.035 0.035 0.035 0.035High 0.035 0.035 0.035 0.035 0.035 0.035
AMR-A Male Background 0.802 0.802 0.802 0.802 0.802 0.802Low 0.178 0.178 0.178 0.178 0.178 0.178High 0.020 0.020 0.020 0.020 0.020 0.020
Female Background 0.936 0.936 0.936 0.936 0.936 0.936Low 0.058 0.058 0.058 0.058 0.058 0.058High 0.006 0.006 0.006 0.006 0.006 0.006
AMR-B Male Background 0.793 0.793 0.793 0.793 0.793 0.793Low 0.103 0.103 0.103 0.103 0.103 0.103High 0.103 0.103 0.103 0.103 0.103 0.103
Female Background 0.951 0.951 0.951 0.951 0.951 0.951Low 0.024 0.024 0.024 0.024 0.024 0.024High 0.024 0.024 0.024 0.024 0.024 0.024
AMR-D Male Background 0.761 0.761 0.761 0.761 0.761 0.761Low 0.119 0.119 0.119 0.119 0.119 0.119High 0.119 0.119 0.119 0.119 0.119 0.119
Female Background 0.961 0.961 0.961 0.961 0.961 0.961Low 0.019 0.019 0.019 0.019 0.019 0.019High 0.019 0.019 0.019 0.019 0.019 0.019
EMR-B Male Background 0.760 0.760 0.760 0.760 0.760 0.760Low 0.120 0.120 0.120 0.120 0.120 0.120High 0.120 0.120 0.120 0.120 0.120 0.120
Female Background 0.963 0.963 0.963 0.963 0.963 0.963Low 0.019 0.019 0.019 0.019 0.019 0.019High 0.019 0.019 0.019 0.019 0.019 0.019
EMR-D Male Background 0.840 0.840 0.840 0.840 0.840 0.840Low 0.080 0.080 0.080 0.080 0.080 0.080High 0.080 0.080 0.080 0.080 0.080 0.080
Female Background 0.955 0.955 0.955 0.955 0.955 0.955Low 0.023 0.023 0.023 0.023 0.023 0.023High 0.023 0.023 0.023 0.023 0.023 0.023

Marisol Concha-Barrientos et al. 1679
Table 21.14 Proportions of the population exposed to lung carcinogensby subregion, age, sex and level of exposure (continued)
Age group (years)
Subregion Sex Exposure level 15–29 30–44 45–59 60–69 70–79 ≥80
EUR-A Male Background 0.802 0.802 0.802 0.802 0.802 0.802Low 0.179 0.179 0.179 0.179 0.179 0.179High 0.020 0.020 0.020 0.020 0.020 0.020
Female Background 0.937 0.937 0.937 0.937 0.937 0.937Low 0.057 0.057 0.057 0.057 0.057 0.057High 0.006 0.006 0.006 0.006 0.006 0.006
EUR-B Male Background 0.779 0.779 0.779 0.779 0.779 0.779Low 0.111 0.111 0.111 0.111 0.111 0.111High 0.111 0.111 0.111 0.111 0.111 0.111
Female Background 0.920 0.920 0.920 0.920 0.920 0.920Low 0.040 0.040 0.040 0.040 0.040 0.040High 0.040 0.040 0.040 0.040 0.040 0.040
EUR-C Male Background 0.654 0.654 0.654 0.654 0.654 0.654Low 0.173 0.173 0.173 0.173 0.173 0.173High 0.173 0.173 0.173 0.173 0.173 0.173
Female Background 0.801 0.801 0.801 0.801 0.801 0.801Low 0.099 0.099 0.099 0.099 0.099 0.099High 0.099 0.099 0.099 0.099 0.099 0.099
SEAR-B Male Background 0.798 0.798 0.798 0.798 0.798 0.798Low 0.101 0.101 0.101 0.101 0.101 0.101High 0.101 0.101 0.101 0.101 0.101 0.101
Female Background 0.922 0.922 0.922 0.922 0.922 0.922Low 0.039 0.039 0.039 0.039 0.039 0.039High 0.039 0.039 0.039 0.039 0.039 0.039
SEAR-D Male Background 0.805 0.805 0.805 0.805 0.805 0.805Low 0.098 0.098 0.098 0.098 0.098 0.098High 0.098 0.098 0.098 0.098 0.098 0.098
Female Background 0.934 0.934 0.934 0.934 0.934 0.934Low 0.033 0.033 0.033 0.033 0.033 0.033High 0.033 0.033 0.033 0.033 0.033 0.033
WPR-A Male Background 0.745 0.745 0.745 0.745 0.745 0.745Low 0.230 0.230 0.230 0.230 0.230 0.230High 0.026 0.026 0.026 0.026 0.026 0.026
Female Background 0.914 0.914 0.914 0.914 0.914 0.914Low 0.078 0.078 0.078 0.078 0.078 0.078High 0.009 0.009 0.009 0.009 0.009 0.009
WPR-B Male Background 0.769 0.769 0.769 0.769 0.769 0.769Low 0.115 0.115 0.115 0.115 0.115 0.115High 0.115 0.115 0.115 0.115 0.115 0.115
Female Background 0.875 0.875 0.875 0.875 0.875 0.875Low 0.063 0.063 0.063 0.063 0.063 0.063High 0.063 0.063 0.063 0.063 0.063 0.063

1680 Comparative Quantification of Health Risks
Table 21.15 Proportions of the population exposed to leukaemogens bysubregion, age, sex and level of exposure
Age group (years)
Subregion Sex Exposure level 15–29 30–44 45–59 60–69 70–79 ≥80
AFR-D Male Background 0.980 0.980 0.980 0.980 0.980 0.980Low 0.010 0.010 0.010 0.010 0.010 0.010High 0.010 0.010 0.010 0.010 0.010 0.010
Female Background 0.989 0.989 0.989 0.989 0.989 0.989Low 0.005 0.005 0.005 0.005 0.005 0.005High 0.005 0.005 0.005 0.005 0.005 0.005
AFR-E Male Background 0.979 0.979 0.979 0.979 0.979 0.979Low 0.010 0.010 0.010 0.010 0.010 0.010High 0.010 0.010 0.010 0.010 0.010 0.010
Female Background 0.984 0.984 0.984 0.984 0.984 0.984Low 0.008 0.008 0.008 0.008 0.008 0.008High 0.008 0.008 0.008 0.008 0.008 0.008
AMR-A Male Background 0.973 0.973 0.973 0.973 0.973 0.973Low 0.025 0.025 0.025 0.025 0.025 0.025High 0.003 0.003 0.003 0.003 0.003 0.003
Female Background 0.970 0.970 0.970 0.970 0.970 0.970Low 0.027 0.027 0.027 0.027 0.027 0.027High 0.003 0.003 0.003 0.003 0.003 0.003
AMR-B Male Background 0.980 0.980 0.980 0.980 0.980 0.980Low 0.010 0.010 0.010 0.010 0.010 0.010High 0.010 0.010 0.010 0.010 0.010 0.010
Female Background 0.977 0.977 0.977 0.977 0.977 0.977Low 0.011 0.011 0.011 0.011 0.011 0.011High 0.011 0.011 0.011 0.011 0.011 0.011
AMR-D Male Background 0.967 0.967 0.967 0.967 0.967 0.967Low 0.016 0.016 0.016 0.016 0.016 0.016High 0.016 0.016 0.016 0.016 0.016 0.016
Female Background 0.979 0.979 0.979 0.979 0.979 0.979Low 0.010 0.010 0.010 0.010 0.010 0.010High 0.010 0.010 0.010 0.010 0.010 0.010
EMR-B Male Background 0.969 0.969 0.969 0.969 0.969 0.969Low 0.015 0.015 0.015 0.015 0.015 0.015High 0.015 0.015 0.015 0.015 0.015 0.015
Female Background 0.984 0.984 0.984 0.984 0.984 0.984Low 0.008 0.008 0.008 0.008 0.008 0.008High 0.008 0.008 0.008 0.008 0.008 0.008
EMR-D Male Background 0.984 0.984 0.984 0.984 0.984 0.984Low 0.008 0.008 0.008 0.008 0.008 0.008High 0.008 0.008 0.008 0.008 0.008 0.008
Female Background 0.995 0.995 0.995 0.995 0.995 0.995Low 0.003 0.003 0.003 0.003 0.003 0.003High 0.003 0.003 0.003 0.003 0.003 0.003

Marisol Concha-Barrientos et al. 1681
Table 21.15 Proportions of the population exposed to leukaemogens bysubregion, age, sex and level of exposure (continued)
Age group (years)
Subregion Sex Exposure level 15–29 30–44 45–59 60–69 70–79 ≥80
EUR-A Male Background 0.968 0.968 0.968 0.968 0.968 0.968Low 0.029 0.029 0.029 0.029 0.029 0.029High 0.003 0.003 0.003 0.003 0.003 0.003
Female Background 0.973 0.973 0.973 0.973 0.973 0.973Low 0.024 0.024 0.024 0.024 0.024 0.024High 0.003 0.003 0.003 0.003 0.003 0.003
EUR-B Male Background 0.978 0.978 0.978 0.978 0.978 0.978Low 0.011 0.011 0.011 0.011 0.011 0.011High 0.011 0.011 0.011 0.011 0.011 0.011
Female Background 0.983 0.983 0.983 0.983 0.983 0.983Low 0.009 0.009 0.009 0.009 0.009 0.009High 0.009 0.009 0.009 0.009 0.009 0.009
EUR-C Male Background 0.982 0.982 0.982 0.982 0.982 0.982Low 0.009 0.009 0.009 0.009 0.009 0.009High 0.009 0.009 0.009 0.009 0.009 0.009
Female Background 0.981 0.981 0.981 0.981 0.981 0.981Low 0.009 0.009 0.009 0.009 0.009 0.009High 0.009 0.009 0.009 0.009 0.009 0.009
SEAR-B Male Background 0.980 0.980 0.980 0.980 0.980 0.980Low 0.010 0.010 0.010 0.010 0.010 0.010High 0.010 0.010 0.010 0.010 0.010 0.010
Female Background 0.985 0.985 0.985 0.985 0.985 0.985Low 0.008 0.008 0.008 0.008 0.008 0.008High 0.008 0.008 0.008 0.008 0.008 0.008
SEAR-D Male Background 0.979 0.979 0.979 0.979 0.979 0.979Low 0.011 0.011 0.011 0.011 0.011 0.011High 0.011 0.011 0.011 0.011 0.011 0.011
Female Background 0.995 0.995 0.995 0.995 0.995 0.995Low 0.003 0.003 0.003 0.003 0.003 0.003High 0.003 0.003 0.003 0.003 0.003 0.003
WPR-A Male Background 0.975 0.975 0.975 0.975 0.975 0.975Low 0.023 0.023 0.023 0.023 0.023 0.023High 0.003 0.003 0.003 0.003 0.003 0.003
Female Background 0.979 0.979 0.979 0.979 0.979 0.979Low 0.019 0.019 0.019 0.019 0.019 0.019High 0.002 0.002 0.002 0.002 0.002 0.002
WPR-B Male Background 0.978 0.978 0.978 0.978 0.978 0.978Low 0.011 0.011 0.011 0.011 0.011 0.011High 0.011 0.011 0.011 0.011 0.011 0.011
Female Background 0.980 0.980 0.980 0.980 0.980 0.980Low 0.010 0.010 0.010 0.010 0.010 0.010High 0.010 0.010 0.010 0.010 0.010 0.010

1682 Comparative Quantification of Health Risks
Table 21.16 Proportions of the population exposed to asbestos bysubregion, age, sex and level of exposure
Age group (years)
Subregion Sex Exposure level 15–29 30–44 45–59 60–69 70–79 ≥80
AFR-D Male Background 0.961 0.961 0.961 0.961 0.961 0.961Low 0.019 0.019 0.019 0.019 0.019 0.019High 0.019 0.019 0.019 0.019 0.019 0.019
Female Background 0.978 0.978 0.978 0.978 0.978 0.978Low 0.011 0.011 0.011 0.011 0.011 0.011High 0.011 0.011 0.011 0.011 0.011 0.011
AFR-E Male Background 0.961 0.961 0.961 0.961 0.961 0.961Low 0.020 0.020 0.020 0.020 0.020 0.020High 0.020 0.020 0.020 0.020 0.020 0.020
Female Background 0.975 0.975 0.975 0.975 0.975 0.975Low 0.012 0.012 0.012 0.012 0.012 0.012High 0.012 0.012 0.012 0.012 0.012 0.012
AMR-A Male Background 0.973 0.973 0.973 0.973 0.973 0.973Low 0.025 0.025 0.025 0.025 0.025 0.025High 0.003 0.003 0.003 0.003 0.003 0.003
Female Background 0.991 0.991 0.991 0.991 0.991 0.991Low 0.008 0.008 0.008 0.008 0.008 0.008High 0.001 0.001 0.001 0.001 0.001 0.001
AMR-B Male Background 0.966 0.966 0.966 0.966 0.966 0.966Low 0.017 0.017 0.017 0.017 0.017 0.017High 0.017 0.017 0.017 0.017 0.017 0.017
Female Background 0.992 0.992 0.992 0.992 0.992 0.992Low 0.004 0.004 0.004 0.004 0.004 0.004High 0.004 0.004 0.004 0.004 0.004 0.004
AMR-D Male Background 0.965 0.965 0.965 0.965 0.965 0.965Low 0.017 0.017 0.017 0.017 0.017 0.017High 0.017 0.017 0.017 0.017 0.017 0.017
Female Background 0.994 0.994 0.994 0.994 0.994 0.994Low 0.003 0.003 0.003 0.003 0.003 0.003High 0.003 0.003 0.003 0.003 0.003 0.003
EMR-B Male Background 0.963 0.963 0.963 0.963 0.963 0.963Low 0.018 0.018 0.018 0.018 0.018 0.018High 0.018 0.018 0.018 0.018 0.018 0.018
Female Background 0.994 0.994 0.994 0.994 0.994 0.994Low 0.003 0.003 0.003 0.003 0.003 0.003High 0.003 0.003 0.003 0.003 0.003 0.003
EMR-D Male Background 0.962 0.962 0.962 0.962 0.962 0.962Low 0.019 0.019 0.019 0.019 0.019 0.019High 0.019 0.019 0.019 0.019 0.019 0.019
Female Background 0.985 0.985 0.985 0.985 0.985 0.985Low 0.008 0.008 0.008 0.008 0.008 0.008High 0.008 0.008 0.008 0.008 0.008 0.008

Marisol Concha-Barrientos et al. 1683
Table 21.16 Proportions of the population exposed to asbestos bysubregion, age, sex and level of exposure (continued)
Age group (years)
Subregion Sex Exposure level 15–29 30–44 45–59 60–69 70–79 ≥80
EUR-A Male Background 0.971 0.971 0.971 0.971 0.971 0.971Low 0.026 0.026 0.026 0.026 0.026 0.026High 0.003 0.003 0.003 0.003 0.003 0.003
Female Background 0.991 0.991 0.991 0.991 0.991 0.991Low 0.008 0.008 0.008 0.008 0.008 0.008High 0.001 0.001 0.001 0.001 0.001 0.001
EUR-B Male Background 0.962 0.962 0.962 0.962 0.962 0.962Low 0.019 0.019 0.019 0.019 0.019 0.019High 0.019 0.019 0.019 0.019 0.019 0.019
Female Background 0.982 0.982 0.982 0.982 0.982 0.982Low 0.009 0.009 0.009 0.009 0.009 0.009High 0.009 0.009 0.009 0.009 0.009 0.009
EUR-C Male Background 0.949 0.949 0.949 0.949 0.949 0.949Low 0.025 0.025 0.025 0.025 0.025 0.025High 0.025 0.025 0.025 0.025 0.025 0.025
Female Background 0.975 0.975 0.975 0.975 0.975 0.975Low 0.013 0.013 0.013 0.013 0.013 0.013High 0.013 0.013 0.013 0.013 0.013 0.013
SEAR-B Male Background 0.959 0.959 0.959 0.959 0.959 0.959Low 0.020 0.020 0.020 0.020 0.020 0.020High 0.020 0.020 0.020 0.020 0.020 0.020
Female Background 0.981 0.981 0.981 0.981 0.981 0.981Low 0.010 0.010 0.010 0.010 0.010 0.010High 0.010 0.010 0.010 0.010 0.010 0.010
SEAR-D Male Background 0.959 0.959 0.959 0.959 0.959 0.959Low 0.021 0.021 0.021 0.021 0.021 0.021High 0.021 0.021 0.021 0.021 0.021 0.021
Female Background 0.978 0.978 0.978 0.978 0.978 0.978Low 0.011 0.011 0.011 0.011 0.011 0.011High 0.011 0.011 0.011 0.011 0.011 0.011
WPR-A Male Background 0.967 0.967 0.967 0.967 0.967 0.967Low 0.030 0.030 0.030 0.030 0.030 0.030High 0.003 0.003 0.003 0.003 0.003 0.003
Female Background 0.988 0.988 0.988 0.988 0.988 0.988Low 0.011 0.011 0.011 0.011 0.011 0.011High 0.001 0.001 0.001 0.001 0.001 0.001
WPR-B Male Background 0.955 0.955 0.955 0.955 0.955 0.955Low 0.022 0.022 0.022 0.022 0.022 0.022High 0.022 0.022 0.022 0.022 0.022 0.022
Female Background 0.974 0.974 0.974 0.974 0.974 0.974Low 0.013 0.013 0.013 0.013 0.013 0.013High 0.013 0.013 0.013 0.013 0.013 0.013

• that relative risks are the same for men and women;
• that relative risk values are constant with age; and
• that the relative risks apply equally to the risk of developing the malig-nant condition (incident cases) and to the risk of dying from the con-dition (fatal cases); where relative risk values were based on diseaseincidence studies, the incidence ratio was comparable to the corre-sponding mortality risk ratio.
Steenland et al. (1996) estimated for the United States the relative riskof exposure to nine lung carcinogens (arsenic, asbestos, beryllium,cadmium, chromium, diesel fumes, nickel, silica and radon). They didnot consider agents to which relatively few workers were exposed(BCME, coke oven and coal gasification fumes and soot) and they didnot consider smoking, beyond the selection where possible of relativerisk factors that had been adjusted for smoking. Combined relative riskvalues (ranging from 1.31 to 3.69) were calculated for all but radon,using inverse variance and a random-effects model and relying on major cohort studies of the specific agents. The authors estimated that9000–10000 men and 900–1900 women develop lung cancer annuallyin the United States owing to past exposure to occupational carcinogens(except radon). This would account for approximately 9% of lung cancerdeaths in males and 2% in females, or 0.5% of all deaths annually inthe United States.
Steenland et al. (2003) examined the population-attributable risk(PAR) from several studies (including Steenland et al. 1996). Theyapplied the PAR to deaths occurring in 1997 in the United States to deter-mine occupational deaths from lung cancer, among other outcomes. Theauthors determined a PAR for lung cancer in the range 6.1–17.3% formen and 2% for women. For overall cancer they determined a PAR of7–19% for men and 11% for women. For leukaemia, a combined PARfor men and women of 0.8–2.8% was calculated.
Nurminen and Karjalainen (2001) estimated the proportion of fatal-ities related to occupational factors in Finland. The average number ofexposed workers in Finland was estimated from census data by sex, age,occupation and industry, and the FINJEM national job-exposure matrix.
1684 Comparative Quantification of Health Risks
Table 21.17 Examples of sources used to assess the risk factor–diseaserelationship for selected occupational carcinogens
Selected risk factor Health outcome Examples of key sources of evidence of causality
Lung carcinogens Cancer of the trachea, Nurminen and Karjalainen (2001); Steenlandbronchus or lung et al. (1996, 2003)
Leukaemogens Leukaemia Lynge et al. (1997); BEIR V (1990); IARC (1997)

Marisol Concha-Barrientos et al. 1685
Relative risks were obtained from a review of epidemiological studies,focusing on risk estimates that were most valid for the Finnish exposurecircumstances. The attributable fraction methodology was used to determine the proportion of deaths in the population attributable tooccupational factors. The authors reported that 30% of deaths due tooccupational disease in Finland in 1996 were caused by cancer. Occu-pational lung cancer accounted for 0.9% of all deaths. They attributed24% of cancer of the bronchus and lung (29% for men and 5.3% forwomen) to occupational exposure to combined risk factors. The attri-butable fractions for urinary cancer were 10.3% overall—14.2% formen and 0.7% for women. Combined occupational risk factors resultedin 10.9% (18.5% for males, 2.5% for females) of leukaemia deaths beingattributed to occupational exposures, the majority (17.8% and 2.3%,respectively) from electrical occupations, in contrast to 0.7% and 0.2%,respectively, from benzene. An average of 71.3% (90% for males, 25%for females) of malignant mesothelioma was attributed to occupation.
The three review papers described above (Nurminen and Karjalainen2001; Steenland et al. 1996, 2003) provided summary measures, orinformation that can be used to determine summary measures, of rela-tive risk for one or more of the main agents and outcomes of interest.The study by Nurminen and Karjalainen (2001) focused on Finland, andpreferentially used studies based in Scandinavia or thought to be mostrelevant to Finland. Most of its relative risk estimates relate to lungcancer, with attributable fractions presented for leukaemia. The paperby Steenland et al. (1996), although focused on the United States, wasmore inclusive of studies of suitable quality. The other paper by Steen-land et al. (2003) provided information on relative mortality risks similarto the first (1996) paper. All papers provided similar summary measuresof relative risk for lung cancers, but the Steenland et al. (1996) resultswere used preferentially because they are generally based on a broaderrange of studies. However, the Steenland paper provided informationonly on lung cancer. Table 21.18 gives a summary of the risk measuresfor each of the carcinogens and the relevant outcomes. The basis forthese risk estimations is described in more detail below.
LUNG CANCER
The evidence for substance-specific relative risk values, which were usedto calculate the overall relative risk for the eight lung carcinogens, isbriefly discussed below, relying heavily on the review paper by Steenlandet al. (1996). The data in the paper provide a summary relative risk of1.6 for occupational exposure to the set of lung carcinogens consideredhere.
Smoking is the main important potential confounder of lung cancer,and potentiates the effect of some exposures (notably with asbestos andlung cancer). In this analysis, where possible, studies were used that pro-duced risk estimates for lung cancer after controlling for smoking.

1686 Comparative Quantification of Health Risks
Tabl
e 21
.18
Sum
mar
y of
ris
k m
easu
res
(rel
ativ
e ri
sk a
nd m
orta
lity
rate
s) fo
r oc
cupa
tiona
l car
cino
gens
Hea
lth o
utco
me
Risk
mea
sure
Estim
ate
and
95%
con
fiden
ce in
terv
al (
CI)
Com
men
tsPr
imar
y da
ta s
ourc
es
Can
cer
of t
he t
rach
ea,
Rel
ativ
e ri
sk
Low
exp
osur
e:1.
22 (
1.09
–1.3
5) t
o 1.
32 (
1.17
–1.4
8)C
ompo
site
rel
ativ
e ri
sk b
ased
St
eenl
and
et a
l.(1
996)
bron
chus
and
lung
Hig
h ex
posu
re:1
.79
(1.5
9–1.
97)
to 1
.93
(1.7
1–2.
16)
on in
divi
dual
rel
ativ
e ri
sk o
f ar
seni
c,as
best
os,b
eryl
lium
,ca
dmiu
m,c
hrom
ium
,die
sel
exha
ust,
nick
el a
nd s
ilica
Leuk
aem
iaR
elat
ive
risk
Low
exp
osur
e:1.
67 (
1.51
–2.0
0) t
o 1.
93 (
1.76
–2.1
7)C
ompo
site
rel
ativ
e ri
sk b
ased
BE
IR V
(19
90);
IAR
C (
2000
);
Hig
h ex
posu
re:3
.06
(2.6
4–3.
80)
to 3
.86
(3.4
8–4.
32)
on in
divi
dual
rel
ativ
e ri
sk o
f Ly
nge
et a
l.(1
997)
;be
nzen
e,io
nizi
ng r
adia
tion
Stee
nlan
d et
al.
(200
3)an
d et
hyle
ne o
xide

Arsenic
Arsenic is accepted as a Group 1 carcinogen (IARC 1980, 1987a). Thesix principal epidemiological studies (covering nearly 18000 workers)reviewed by Steenland et al. (1996) indicated a combined relative risk of3.69, with a range of 1.31–15.2 reported for individual studies and aclear dose–response relationship. The lowest relative risk arose from astudy in which exposures mostly ranged from 7 to 13mg/m3, comparedto the OSHA level of 10mg/m3 (Enterline et al. 1987). Excess cancers inother studies were probably due to high exposures that occurred largelyin the past. A combined relative risk of 3.69 (95% CI 3.06–4.46) wasdetermined by the Steenland et al. (1996) review, whereas 3.2 was usedby Nurminen and Karjalainen (2001).
Asbestos
Both serpentine and amphibole asbestos have been shown to cause lungcancer in humans, with a clear dose–response relationship and a synergybetween asbestos and tobacco (Lee 2001). Over 100 cohort studies andmany case-referent studies, plus animal and cellular studies, provideample evidence for causation. In six cohort studies of nearly 6000asbestosis patients, the standardized mortality rate ranged from 3.5 to9.1, with a combined relative risk of 5.9. In 20 studies of over 100000asbestos workers, the standardized mortality rate ranged from 1.04 forchrysotile workers to 4.97 for amosite workers, with a combined rela-tive risk of 2.00. It is difficult to determine the exposures involvedbecause few of the studies reported measurements, and because it is aproblem to convert historical asbestos measurements in millions of dustparticles per cubic foot to gravimetric units. Nevertheless, little excesslung cancer is expected from low exposure levels. These studies havebeen the subject of several reviews (IARC 1977; IPCS 1998; Nurminenand Karjalainen 2001; Steenland et al. 1996). The main papers provideda range of relative risks (1.04–7.4), with summary relative risks of 2.0(Steenland et al. 1996) and 2.3 (Nurminen and Karjalainen 2001) citedin the two most recent reviews. The lower value (2.0, 95% CI1.90–2.11), which is based on a wider range of studies, is accepted forthis analysis.
Beryllium
Beryllium is an IARC Group 1 carcinogen (IARC 1993), although epidemiological evidence is rather limited. A standardized mortality ratefor lung cancer of 2.0 was determined from a registry cohort of 689women and men (Steenland and Ward 1991), and an overall standard-ized mortality rate of 1.24 was found in a study of 9225 male workersfrom seven beryllium plants (1.49 at plants with higher exposure) (Wardet al. 1992). Steenland et al. (1996) utilized a smoking-adjusted relativerisk of 1.49 (no 95% CI reported), based on a beryllium plant with highexposures.
Marisol Concha-Barrientos et al. 1687

1688 Comparative Quantification of Health Risks
Cadmium
Cadmium is an IARC Group 1 carcinogen (IARC 1993). The best epi-demiological evidence of its relationship to lung cancer comes from acohort study by Stayner et al. (1992), although the evidence for car-cinogenicity is stronger in animals and has recently been questioned inhumans (Jarup and Nordberg 1998). The most recent follow-up studysuggests a relative risk of 1.49 (95% CI 0.96–2.22) (Steenland et al.1996). Nurminen and Karjalainen (2001) used 1.2, based on a Scandinavian study.
Chromium
Chromium is an IARC Group 1 carcinogen (IARC 1990a). There isample epidemiological evidence of its causal association with lung cancer,with many cohort studies showing a dose–response relationship. Basedon the largest and best designed studies of chromium productionworkers, producers of chromate paints and chromate plating workers,the overall relative risk is 2.78 (95% CI 2.47–3.52) (Steenland et al.1996). Nurminen and Karjalainen (2001) used a lower relative risk of1.4 from a hospital-based case-referent study.
Diesel exhaust
Polycyclic aromatic hydrocarbons comprise the main components ofdiesel exhaust, which contains a mixture of substances. Diesel exhausthas been accepted as a Group 2A carcinogen (IARC 1989) and wasscheduled for further review in 2001. Owing to limitations in exposureassessment to diesel exhaust, human epidemiology has been difficult toconduct. However, cohort studies and meta-analyses confirm a relation-ship between diesel exhaust exposure and lung cancer, with summary relative risks in the range 1.3–1.5 (Bhatia et al. 1998; Lipsett and Campleman 1999). Based on six relatively consistent recent studies withgood documentation of exposure to diesel exhaust, in which the numberof cases ranged from 50 to 1256, Steenland et al. (1996) determined acombined relative risk of 1.31 (95% CI 1.13–1.44), and Nurminen andKarjalainen (2001) used the same estimate.
Nickel
Nickel is an IARC Group 1 carcinogen (IARC 1990a). Based on data from the 1990 report of the International Committee on NickelCarcinogenesis in Man (ICNCM 1990), Steenland et al. (1996) calcu-lated a combined relative risk of 1.56 (95% CI 1.41–1.73). Nurminenand Karjalainen (2001) used an estimate of 1.4 based on a Finnish study.
Silica
On the basis of detailed reviews, silica has been classified as an IARCGroup 1 carcinogen (IARC 1987b, 1997). Several cohort studies in silica-

exposed and silicosis patients showed a dose–response relationshipbetween silica exposure and lung cancer relative risk, and this was con-firmed by meta-analyses and a pooled study (Steenland and Sanderson2001). Animal and cellular studies provided supporting evidence. Con-troversy remains as to whether silicosis is a necessary precursor for thedevelopment of lung cancer, but this does not affect the underlying statusof silica as a carcinogen (Checkoway 2000; Hnizdo and Sluis-Cremer1991; Soutar et al. 2000). Steenland et al. (1996) based their combinedrelative risk of 1.33 (95% CI 1.21–1.45) on 13 large cohort andcase–control studies of silica-exposed workers. These studies includedgranite workers, stone workers, pottery workers, brick workers, goldminers and diatomaceous earth miners, and covered a range of workersgenerally numbering from almost 1000 to over 5000. Half of the studiescontrolled for smoking. Nurminen and Karjalainen (2001) used a slightlyhigher estimate of 1.4.
Combined estimates
A common methodology, similar to that used by Steenland et al. (1996)and Nurminen and Karjalainen (2001), was used in this analysis for alllung carcinogens, in that occupational exposure to carcinogens was esti-mated and applied to relative risk estimates to enable the determinationof attributable fractions. A mean relative risk of 1.63 was determinedfor eight lung carcinogens (not including radon), using data reported bySteenland et al. (1996). This was done by calculating a weighted averageof the substance-specific relative risks, and weighting the substance-spe-cific relative risks by the proportion of workers exposed to each sub-stance to determine a mean relative risk for workers exposed to the eightlung carcinogens. This was done separately for each subregion, using theproportion of workers in each subregion exposed to specific agents toweight the relative risk for each of the agents. However, the resultingaverage relative risks were not clearly different from each other (all wereclose to 1.6).
In addition, to estimate an uncertainty range for the initial mean rel-ative risk, a weighted average was calculated of the lower and upper95% CI values of the relative risk reported for each substance (exceptberyllium, for which there were no estimated CI). These values (not tobe confused with the partitioned relative risk values for low- and high-level exposure) were within 15% of the mean relative risk values. Thisis demonstrated for the AMR-A subregion (Table 21.19).
To produce relative risk estimates for low and high exposure, it wasnecessary to partition the mean relative risks into values that correspondto low- and high-level exposure. A mean relative risk (of 1.6) was deter-mined for the United States. Based on the estimates of 90% of Ameri-can workers exposed at or below about one fifth of the PEL values and10% exposed at or above the PEL values, and an estimate of the Amer-ican population-attributable fraction of lung cancer due to occupation
Marisol Concha-Barrientos et al. 1689

of 9% (Steenland et al. 1996), the mean relative risk of 1.6 was parti-tioned into a relative risk of 1.3 for low-level exposure to lung carcino-gens, and 1.9 for high-level exposure. The United States ratios of thelower (1.3/1.6) and the higher (1.9/1.6) relative risks to the average relative risk were then applied to the average relative risks estimated foreach subregion to produce estimated relative risks at low and high expo-sures for each subregion. In the same manner, upper and lower 95% CIwere produced for these relative risks, based on the limits estimated forthe average relative risks. The results of this process are shown in Table 21.20.
LEUKAEMIA
Leukaemia has been linked to exposure to benzene, ionizing radiationand ethylene oxide, all of which are IARC Group 1 carcinogens (IARC2001; WHO 1999). There is also some evidence that exposure to low-frequency electric fields may be leukaemogenic (Nurminen and Karjalainen 2001; WHO 2001). However, as this physical agent has notbeen included in CAREX, it has been excluded from this study.
Benzene
The causal relationship between leukaemia and benzene is well recog-nized, including data from cohort studies in China and the United Statescovering workers in chemical plants, refineries, machine production, andtextile and cloth factories. Excesses of nonlymphocytic, myelogenous andacute myeloid leukaemias occurred. There is also limited evidence in
1690 Comparative Quantification of Health Risks
Table 21.19 Lung cancer relative risk, substance-specific and weightedaverage, for the AMR-A subregion
Carcinogen Combined relative riska (95% CI) Proportion of workers exposed
Silica 1.33 (1.21–1.45) 0.0248
Cadmium 1.49 (0.96–2.22) 0.0015
Nickel 1.56 (1.41–1.73) 0.0039
Arsenic 3.69 (3.06–4.46) 0.0011
Chromium 2.78 (2.47–3.52) 0.0055
Diesel fumes 1.31 (1.13–1.44) 0.0217
Beryllium 1.49 0.0005
Asbestos 2.00 (1.90–2.11) 0.0094
Totalb 1.59 (1.41–1.77)
a Derived from major epidemiological studies.b Weighted summary relative risk, weighted by the proportion of workers exposed to each
contributing carcinogen.
Source: Steenland et al. (1996).

mammals (Hayes et al. 1997; IARC 1990b). A recent review (Lynge et al. 1997) provides a low-exposure relative risk of 2.0 (95% CI1.8–2.2) and a high-exposure relative risk of 4.0 (3.6–4.4).
Ionizing radiation
The causal relationship between ionizing radiation and leukaemia is wellrecognized. There is consistency across numerous studies, strong associ-ation between exposure and outcome, and evidence of a dose–responsegradient. Excess leukaemia has been observed in survivors of the atomicexplosions at Hiroshima and Nagasaki, and also among patients med-ically treated with X-rays or g-rays. The risk of leukaemia increases overfivefold at sufficiently high doses (BEIR V 1990; IARC 2000; ICRP1991). Models describing risk have been proposed as: Linear RR model1+5.5 _ dose in Sv, quadratic RR=1+0.24 dose+0.27 dose2 (dose in Sv)(BEIR V 1990). Relative risks of 1.22 (1.07–1.70) for low exposure and1.57 (1.18–2.88) for high exposure are accepted as the best availableestimates (BEIR V 1990; IARC 2000).
Ethylene oxide
Workers have exposure to ethylene oxide either as a sterilant or as achemical intermediary or final product. In a study in the United States,
Marisol Concha-Barrientos et al. 1691
Table 21.20 Weighted summary relative risks for lung cancer for allsubregions
Low exposure High exposure
Combined relative riska Combined relative riska
Subregion Summary relative riska (95% CI) (95% CI)
AFR-D 1.61 1.31 (1.17–1.45) 1.91 (1.72–2.11)
AFR-E 1.62 1.32 (1.18–1.45) 1.92 (1.72–2.12)
AMR-A 1.59 1.29 (1.14–1.44) 1.88 (1.67–2.11)
AMR-B 1.58 1.28 (1.14–1.42) 1.87 (1.67–2.08)
AMR-D 1.56 1.26 (1.13–1.41) 1.85 (1.64–2.05)
EMR-B 1.56 1.26 (1.13–1.40) 1.85 (1.64–2.05)
EMR-D 1.61 1.31 (1.18–1.45) 1.92 (1.72–2.10)
EUR-A 1.62 1.32 (1.17–1.48) 1.93 (1.71–2.16)
EUR-B 1.59 1.29 (1.15–1.44) 1.89 (1.69–2.10)
EUR-C 1.50 1.22 (1.09–1.35) 1.79 (1.59–1.97)
SEAR-B 1.58 1.28 (1.15–1.42) 1.88 (1.68–2.07)
SEAR-D 1.61 1.31 (1.17–1.45) 1.91 (1.70–2.09)
WPR-A 1.57 1.27 (1.13–1.42) 1.86 (1.65–2.08)
WPR-B 1.58 1.28 (1.14–1.42) 1.87 (1.67–2.07)
a Weighted summary relative risk, weighted by the proportion of workers exposed to each contributingcarcinogen in each subregion.

ethylene oxide used as a sterilant was associated with lymphaticleukaemia and non-Hodgkin’s lymphoma, with a rate ratio of 1.2 esti-mated for 45-year exposure to 1ppm. Other studies in Sweden and theUnited Kingdom of Great Britain and Northern Ireland showed non-significant excesses of these cancers. Of six studies of chemical plantworkers (two in Sweden and one each in Germany, Italy, the UnitedKingdom and the United States), two found significant excesses, twofound nonsignificant excesses and two found expected rates (IARC1997). Relative risk was found to range from 1.1 to 3.5 (Steenland et al.2003).
An approach similar to that used for lung carcinogens was applied to the leukaemogens. The separate relative risks for the development ofleukaemia arising from exposures to the main relevant occupational car-cinogens were combined into single summary relative risks, one for lowexposure and one for high exposure. This was done separately for eachsubregion, using the exposure prevalence of the workforce in each sub-region to weight the exposure-specific risks. However, the resultingaverage relative risks were not clearly different from each other. CI wereestimated in the same manner, weighting the estimated CI for benzeneand ionizing radiation (there were no estimated CI for ethylene oxide).Unlike lung cancer, the low- and high-exposure relative risks were avail-able for each exposure, and these were directly incorporated into low-and high-exposure summary measures through the weighting process.An example of this approach is shown in Table 21.21, using the WPR-B subregion. The results of this approach for each subregion are shownin Table 21.22.
1692 Comparative Quantification of Health Risks
Table 21.21 Leukaemia relative risk, substance-specific and weightedaverage, for the WPR-B subregion
Low exposure High exposure
Combined relative riska Combined relative riska Proportion of Carcinogen (95% CI) (95% CI) workers exposed
Benzene 2.0 (1.8–2.2) 4.0 (3.6–4.4) 0.0051
Ionizing radiation 1.22 (1.07–1.7) 1.57 (1.18–2.88) 0.0010
Ethylene oxide 1.1 3.5 0.0003
Totalb 1.84 (1.68–2.12) 3.60 (3.20–4.16)
a Derived from major epidemiological studies.b Weighted summary relative risk, weighted by the proportion of workers exposed to each contributing
carcinogen.

ESTIMATES OF RISK REVERSIBILITY
There are limited data on risk reversibility from occupational exposureto carcinogens. The studies from which the estimated risks arise arebased on cohorts of people exposed for different periods of time, fol-lowed up for various periods of time and with various periods of timebetween exposure cessation and follow-up, with follow-up periodsvarying between zero (still exposed) and many decades. Therefore, mostof the absolute and relative risks produced by the studies already dependon whatever change in risk might occur once exposure ceases. However,some indication of the extent of risk reduction that might occur is givenby a recent paper by Peto et al. (2000), which examined changes in therisk of developing lung cancer as a result of stopping smoking. The studyestimated that, compared to the risk in persons who continued to smoke,the risk of lung cancer in males declined to about 0.66 within 10 years,to 0.44 between 10 and 20 years, to 0.2 between 20 and 30 years, andto 0.1 after 30 years.
3. Occupational airborne particulatesThere are a vast number of respiratory conditions that can arise directlyor indirectly from work. However, estimating exposures, risks and attrib-
Marisol Concha-Barrientos et al. 1693
Table 21.22 Weighted summary relative risks for leukaemia for allsubregions
Low exposure High exposure
Subregion Combined relative riska (95% CI) Combined relative riska (95% CI)
AFR-D 1.88 (1.72–2.15) 3.73 (3.34–4.24)
AFR-E 1.89 (1.73–2.15) 3.75 (3.37–4.25)
AMR-A 1.91 (1.74–2.16) 3.80 (3.41–4.28)
AMR-B 1.77 (1.61–2.07) 3.38 (2.98–4.01)
AMR-D 1.91 (1.74–2.16) 3.78 (3.39–4.27)
EMR-B 1.87 (1.70–2.13) 3.66 (3.26–4.19)
EMR-D 1.89 (1.72–2.15) 3.73 (3.33–4.23)
EUR-A 1.93 (1.76–2.17) 3.86 (3.48–4.32)
EUR-B 1.83 (1.67–2.11) 3.57 (3.18–4.13)
EUR-C 1.67 (1.51–2.00) 3.06 (2.64–3.80)
SEAR-B 1.89 (1.73–2.15) 3.76 (3.37–4.26)
SEAR-D 1.81 (1.65–2.10) 3.51 (3.11–4.09)
WPR-A 1.90 (1.73–2.15) 3.77 (3.38–4.26)
WPR-B 1.84 (1.68–2.12) 3.60 (3.21–4.16)
a Weighted summary relative risk, weighted by the proportion of workers exposed to each contributingcarcinogen in each subregion.

utable proportions is not possible for many of these on an international(or even national) scale, because of lack of appropriate data sources.Therefore, only the more important of the work-related respiratory con-ditions, in terms of the total number of cases or the risks arising fromexposure, are included here. All of these arise from exposure to partic-ulates. Malignant respiratory disease is not included here because it isdescribed in section 2.
Nonmalignant respiratory disease arises as a result of the exposureof workers to airborne agents, mostly in the form of particulates ordusts.2 The primary route of exposure is inhalation, whereby these agentsgain access to the respiratory system and are either deposited (in the caseof dusts) or enter the circulatory system. For some exposures, there is avery clear connection between the exposure and the disease (for example,silicosis is only caused by exposure to silica). Some exposures cause morethan one type of disease, and even more than one type of respiratorydisease. For example, asbestos can result in malignant conditions of thelung and the pleura (the inside lining of the chest), malignant conditionsof the peritoneum (the inside lining of the abdomen) and nonmalignantconditions of the lungs (asbestosis and COPD). Other exposures havenot been well characterized, but are believed to result in certain condi-tions (such as some forms of occupational asthma).
3.1 Exposure variable
CAUSATIVE AGENTS OF ASTHMA
Asthma, which is a narrowing of the upper respiratory passages result-ing in difficult breathing and wheezing, has both nonoccupational andoccupational causes. Many hundreds of occupational agents, includingsome inorganic and organic dusts, have been associated with occupa-tional asthma (Balmes et al. 2003; Chan-Yeung and Malo 1994; Venables and Chan-Yeung 1997). Biological agents include grains, flours,plants and gums, fur, feathers and other animal parts, insects and fungi,drugs and enzymes and various types of wood. Chemical agents includechlorofluorocarbons, alcohols, metals and their salts, and welding fumes(CCOHS 1997). These agents are found in a variety of workplaces,including food and natural products processing, animal handling facili-ties, manufacturing and construction.
It would not be possible to conduct exposure assessments and toobtain relative risk data for all the factors contributing to this importantoccupational disease, especially since they often occur in combination.We therefore used occupation as a proxy for exposure to agents that areassociated with occupational asthma. The basis for this approach wasthe work of Karjalainen et al. (2001, 2002), who conducted extensiveepidemiological studies of the entire Finnish workforce and developedrelative risks for specific occupations. A similar but less extensive studybased in 12 industrialized countries was also used (Kogevinas et al.
1694 Comparative Quantification of Health Risks

1999). Relative risks were applied to these occupational data to produceestimates of the number of deaths due to work-related asthma.
CAUSATIVE AGENTS OF COPD
The causative agents of COPD are non-specific dust and fumes, withdusts showing a more consistent relationship than fumes (Becklake1989). Because of a lack of worldwide data on the prevalence of occu-pational exposure to dusts and their combinations, work in specific eco-nomic subsectors was used as a surrogate for dust exposure. Relativerisks were applied to these workforce data to produce estimates of thenumber of deaths from COPD arising from work-related exposures.
3.2 Estimating risk factor levels
The general exposure assessment methodology was described earlier.Occupation was used for asthma (Equation 2) and economic sector forCOPD (Equation 1). The theoretical minimum risk corresponds to nooccupational exposure above background levels to airborne particulatesor other agents that cause nonmalignant respiratory disease.
AGENTS CAUSING ASTHMA
The proportion of the total population with occupational exposure toasthmagens was estimated using Equation 2. Estimates were made foreach occupational category by determining the proportion of the popu-lation working in occupations that matched as closely as possible tothose identified by Karjalainen et al. (2001, 2002) and for which rela-tive risk values were provided (Table 21.23). Those not working andthose employed in administration were together considered to be thenonexposed reference category (relative risk=1). These calculations weredone separately for men and women for each subregion of the world.Relative risks and the proportions exposed by occupational categorywere applied across all age groups from age 15 to ≥80 years.
Table 21.24 summarizes the age-adjusted distribution of the labourforce into occupations matching the categories for which relative riskswere identified by Karjalainen et al. (2002).
AGENTS CAUSING COPD
It is not possible to estimate the proportion of the world’s populationexposed to the large number of agents identified in occupation-specificand agent-specific studies. Community-based studies have therefore beenpreferred. The most common exposure in these studies is exposure todust and/or gas/fumes (e.g. Korn et al. 1987; Kryzanowski et al. 1986;Xu et al. 1992). Unfortunately, there are also no data to estimate theproportion of the world’s workers exposed to dust and/or gas/fumes. Thestudy by Korn et al. (1987) provides a link between self-reported expo-sure to dust (current and past exposure) and some categories of economicactivity3 among the currently employed. Categories of economic activity
Marisol Concha-Barrientos et al. 1695

1696 Comparative Quantification of Health Risks
Tabl
e 21
.23
Com
pari
son
of F
inni
sh o
ccup
atio
nal c
ateg
orie
s w
ith 1
968
ISIC
cod
es
Finn
ish
1968
cl
assifi
catio
naD
escr
iptio
nEx
ampl
esa,
bIS
ICc
Des
crip
tion
Exam
ples
Com
men
ts
1A
dmin
istr
ativ
e,N
o ex
ampl
es g
iven
2A
dmin
istr
ativ
e an
d G
over
nmen
t of
ficia
ls,
Com
bine
Cat
egor
ies
2 m
anag
eria
l and
m
anag
eria
l wor
kers
man
ager
s (u
pper
leve
l)an
d 3
(ISIC
) fo
r al
l cl
eric
al w
orke
rs3
Cle
rica
l and
rel
ated
O
ffice
man
ager
s,ec
onom
ic s
ubse
ctor
sw
orke
rsgo
vern
men
t w
orke
rs,
secr
etar
ies,
book
keep
ers,
stoc
k cl
erks
0Te
chni
cal,
phys
ical
En
gine
ers,
med
ical
0/
1Pr
ofes
sion
al,t
echn
ical
Sc
ient
ists
,tec
hnic
ians
,U
se C
ateg
ory
0/1
(ISIC
) fo
r sc
ienc
e,so
cial
pe
rson
nel,
child
car
e an
d re
late
d w
orke
rsen
gine
ers,
med
ical
and
al
l eco
nom
ic s
ubse
ctor
ssc
ienc
e,hu
man
istic
give
rs,r
elig
ious
and
re
late
d w
orke
rs,
and
artis
tic w
orke
rsso
cial
wor
kers
m
athe
mat
icia
ns,t
each
ers,
relig
ious
wor
kers
,art
ists
2Sa
les
wor
kers
Who
lesa
le a
nd r
etai
l 4
Sale
s w
orke
rsW
orki
ng p
ropr
ieto
rs,
Use
Cat
egor
y 4
(ISIC
) fo
rde
aler
s,ot
her
sale
s w
orke
rssa
les
man
ager
s,sa
les
all e
cono
mic
sub
sect
ors
wor
kers
,ins
uran
ce a
gent
s
3A
gric
ultu
re,
Farm
ers
and
man
ager
ial
6A
gric
ultu
ral,
anim
al
Farm
man
ager
s an
d U
se C
ateg
ory
6 (IS
IC)
fore
stry
,w
orke
rs in
agr
icul
ture
,hu
sban
dry
and
fore
stry
supe
rvis
ors,
agri
cultu
re
for
all e
cono
mic
sub
sect
ors
com
mer
cial
fish
ing
fore
stry
and
hor
ticul
ture
,w
orke
rs,fi
sher
men
,an
d an
imal
hus
band
ry
agri
cultu
ral a
nd
hunt
ers
wor
kers
,for
estr
y ho
rtic
ultu
ral w
orke
rs,
wor
kers
,fish
erm
enan
imal
hus
band
ry w
orke
rs
4M
ine
and
quar
ry
Min
ers,
quar
rym
en
Use
Cat
egor
y 7/
8/9
for
wor
kers
min
ing
econ
omic
sub
sect
or

Marisol Concha-Barrientos et al. 1697
cont
inue
d
5Tr
ansp
ort
and
Roa
d tr
ansp
ort
wor
kers
and
U
se C
ateg
orie
s 7/
8/9
in
com
mun
icat
ions
su
perv
isor
s,tr
ansp
ort
serv
ice
ISIC
in t
rans
port
eco
nom
ic
w
orke
rsw
orke
rs,p
osta
l ser
vice
s an
d su
bsec
tor
(see
bel
ow);
cour
iers
,eng
ine
room
cre
ws,
does
not
incl
ude
mot
or v
ehic
le a
nd t
ram
dri
vers
,co
mm
unic
atio
ns w
orke
rsra
ilway
and
sta
tion
pers
onne
l,te
leph
one
switc
hboa
rd
oper
ator
s,ne
wsp
aper
del
iver
y w
orke
rs,o
ffice
rec
eptio
nist
s,m
esse
nger
s
6/7
Man
ufac
turi
ng a
nd
Wor
kers
in t
he fo
llow
ing
7/8/
9Pr
oduc
tion
and
rela
ted
Prod
uctio
n su
perv
isor
s,U
se C
ateg
orie
s 7/
8/9
in a
ll re
late
d w
orke
rsin
dust
ries
:tex
tiles
;sm
eltin
g,w
orke
rs,t
rans
port
m
iner
s,qu
arry
men
;ec
onom
ic s
ubse
ctor
s ex
cept
m
etal
lurg
ical
and
foun
dry;
iron
eq
uipm
ent
oper
ator
s w
orke
rs in
met
al,w
ood,
min
ing
and
tran
spor
tan
d m
etal
war
e;el
ectr
ical
;an
d la
bour
ers
chem
ical
s,te
xtile
s,w
ood;
pain
ting
and
lacq
ueri
ng;
food
and
bev
erag
es,
othe
r co
nstr
uctio
n;fo
od a
nd
toba
cco,
leat
her,
ston
e,be
vera
ge;c
hem
ical
pro
cess
ing;
rubb
er,p
aper
and
pa
ckin
g an
d w
rapp
ing;
stat
iona
ry
cons
truc
tion
indu
stri
es,
engi
ne a
nd m
achi
ne;d
ock
labo
urer
s,m
achi
ne
and
war
ehou
se;o
ther
man
ual
oper
ator
s,el
ectr
icia
ns,
mat
eria
l han
dler
s 7/
8/9
Spec
ific
tran
spor
t eq
uipm
ent
oper
ator
s:m
otor
veh
icle
dri
vers
,bu
s,tr
uck
and
tram
dr
iver
s

1698 Comparative Quantification of Health Risks
Tabl
e 21
.23
Com
pari
son
of F
inni
sh o
ccup
atio
nal c
ateg
orie
s w
ith 1
968
ISIC
cod
es (
cont
inue
d)
Finn
ish
1968
cl
assifi
catio
naD
escr
iptio
nEx
ampl
esa,
bIS
ICc
Des
crip
tion
Exam
ples
Com
men
ts
8Se
rvic
e w
ork
Fire
fight
ers
and
polic
e,w
atch
5
Serv
ice
wor
kers
Hot
el m
anag
ers,
cook
s,U
se C
ateg
ory
5 (IS
IC)
for
and
secu
rity
gua
rds,
cook
s,w
aite
rs,h
ouse
keep
ers,
all e
cono
mic
sub
sect
ors
hous
ekee
pers
,dom
estic
ca
reta
kers
,bea
uty
wor
kers
,bui
ldin
g ca
reta
kers
op
erat
ors,
firefi
ghte
rs,
and
clea
ners
,hyg
iene
and
po
lice
beau
ty o
pera
tors
,lau
nder
ers,
dry
clea
ners
and
pre
sser
s
aSo
urce
:Kar
jala
inen
et
al.(
2001
).b
Sour
ce:K
arja
lain
en e
t al
.(20
02).
cSo
urce
:UN
(20
00).

Marisol Concha-Barrientos et al. 1699
Tabl
e 21
.24
Prop
ortio
n of
the
pop
ulat
ion
in o
ccup
atio
nal c
ateg
orie
s ba
sed
on e
xpos
ure
to a
gent
s ca
usin
g as
thm
a,by
sub
regi
onan
d se
x
Prop
ortio
n ex
pose
d by
occ
upat
ion
Subr
egio
nSe
xBa
ckgr
ound
Adm
inist
ratio
nTe
chni
cal
Sale
sAg
ricul
tura
lM
inin
gTr
ansp
ort
Man
ufac
turin
gSe
rvice
s
AFR
-DM
ale
0.15
950.
0498
0.05
620.
0513
0.46
120.
0081
0.02
890.
1342
0.05
10Fe
mal
e0.
4645
0.02
490.
0303
0.03
240.
3551
0.00
120.
0145
0.04
820.
0288
AFR
-EM
ale
0.15
100.
0524
0.06
180.
0447
0.46
620.
0082
0.02
190.
1377
0.05
63Fe
mal
e0.
3498
0.03
600.
0497
0.03
280.
4171
0.00
100.
0114
0.05
470.
0475
AM
R-A
Mal
e 0.
2746
0.19
710.
1080
0.08
750.
0327
0.00
350.
0196
0.19
400.
0830
Fem
ale
0.40
790.
1772
0.12
230.
0789
0.01
340.
0005
0.00
800.
0928
0.09
91
AM
R-B
Mal
e0.
1896
0.11
240.
0794
0.06
650.
1592
0.00
770.
0310
0.22
250.
1317
Fem
ale
0.58
230.
0662
0.06
710.
0410
0.05
310.
0013
0.00
320.
0878
0.09
79
AM
R-D
Mal
e0.
1785
0.18
940.
0346
0.09
120.
0521
0.00
200.
0386
0.31
150.
1021
Fem
ale
0.61
100.
1033
0.01
980.
0466
0.01
190.
0001
0.00
260.
1328
0.07
19
EMR
-BM
ale
0.21
340.
1042
0.14
990.
0854
0.11
940.
0046
0.04
090.
2072
0.07
49Fe
mal
e0.
6903
0.05
230.
0866
0.04
430.
0293
0.00
010.
0101
0.04
630.
0407
EMR
-DM
ale
0.18
050.
0419
0.04
900.
1742
0.35
840.
0014
0.00
000.
1465
0.04
80Fe
mal
e0.
6303
0.01
100.
0105
0.05
090.
2427
0.00
020.
0000
0.04
010.
0142
cont
inue
d

1700 Comparative Quantification of Health Risks
Tabl
e 21
.24
Prop
ortio
n of
the
pop
ulat
ion
in o
ccup
atio
nal c
ateg
orie
s ba
sed
on e
xpos
ure
to a
gent
s ca
usin
g as
thm
a,by
sub
regi
onan
d se
x (c
ontin
ued)
Prop
ortio
n ex
pose
d by
occ
upat
ion
Subr
egio
nSe
xBa
ckgr
ound
Adm
inist
ratio
nTe
chni
cal
Sale
sAg
ricul
tura
lM
inin
gTr
ansp
ort
Man
ufac
turin
gSe
rvice
s
EUR
-AM
ale
0.32
270.
1176
0.21
450.
0252
0.04
200.
0040
0.00
000.
1934
0.08
07Fe
mal
e0.
5296
0.09
420.
1889
0.01
310.
0254
0.00
080.
0033
0.07
330.
0713
EUR
-BM
ale
0.25
930.
0747
0.06
800.
0400
0.21
330.
0136
0.02
260.
2490
0.05
95Fe
mal
e0.
4624
0.04
530.
0552
0.01
310.
2352
0.00
200.
0041
0.13
790.
0449
EUR
-CM
ale
0.27
000.
0946
0.05
320.
0317
0.15
360.
0212
0.10
970.
2239
0.04
21Fe
mal
e0.
4269
0.08
180.
0542
0.05
120.
0919
0.01
380.
1041
0.12
390.
0522
SEA
R-B
Mal
e0.
1756
0.05
990.
0482
0.07
290.
3664
0.00
510.
0336
0.19
300.
0452
Fem
ale
0.42
400.
0397
0.03
680.
0812
0.24
870.
0013
0.00
320.
1244
0.04
07
SEA
R-D
Mal
e0.
1502
0.06
450.
0550
0.01
500.
4634
0.01
490.
0392
0.15
350.
0444
Fem
ale
0.52
980.
0134
0.01
250.
0028
0.37
810.
0026
0.00
000.
0509
0.00
98
WPR
-AM
ale
0.24
470.
2058
0.10
230.
0787
0.03
360.
0014
0.03
400.
2270
0.07
23Fe
mal
e0.
4795
0.14
100.
0832
0.07
550.
0281
0.00
020.
0094
0.11
180.
0713
WPR
-BM
ale
0.16
000.
1023
0.06
550.
0454
0.36
590.
0194
0.03
700.
1399
0.06
45Fe
mal
e0.
2901
0.09
280.
0588
0.07
530.
2812
0.00
660.
0290
0.09
250.
0738
Not
e:Se
e al
so T
able
21.
26.

Marisol Concha-Barrientos et al. 1701
among the currently employed are available worldwide, and can providea broad approximation to the proportion of the world’s population withcurrent or past exposure to dust and/or gas/fumes. We based our esti-mates of exposed populations on data on employment in economicsectors of agriculture, industry and service from the World Bank (2001),supplemented by data from ILO (2000) on employment in economicactivities. The proportions of the population with occupational exposureat medium and high levels to agents causing COPD were estimated usingEquation 1.
Korn et al. (1987) defined as low-exposed those in finance, as medium-exposed those in the manufacture of non-durable goods, transport, util-ities and the wholesale and retail trades, and as highly exposed those inthe manufacture of durable goods, agriculture, mining and construction.Exposure was to “dusts” and to “gases”, without these being furtherdefined. We adopted these categories with some modification to accountfor our lack of data on the type of manufacturing industry and for thefact that agriculture in developed and developing countries probablyinvolves different types of exposure to respirable dust. Lacking data thatwould have permitted us to divide manufacturing into medium and highpotential for dust exposure, we have classified it as having potentiallyhigh dust exposure, given that in much of the world manufacturinginvolves more dust exposure than is typical in the United States wherethe Korn et al. study (1987) was done (Chien et al. 2002; Gomes et al.2001). We have defined as nonexposed those not in the workforce andthose in utility trade, finance and services. Those in agriculture, manu-facturing and transportation were defined as having low exposure, whilethose in mining and construction were defined as having high exposure.Many workers in the medium and highly exposed economic activities arein fact not exposed to dusts, but on the whole the proportions in theseindustries are taken to represent the approximate proportion of thoseever exposed to low and high levels of dusts in the general population.In Korn et al. (1987), the proportion of workers currently employed inthe medium- and high-exposure industries listed above correspondedapproximately to the proportion of those reporting ever having beenoccupationally exposed to dust in that study. This approach was fol-lowed in our study, in which it was assumed that the number of cur-rently employed in specific industries corresponds roughly to the numberever occupationally exposed to dusts. The proportion exposed in differ-ent economic activities in each subregion was adjusted to account for anaverage labour force participation among the currently exposed in thatsubregion, which was applied across all ages. The results are presentedin Table 21.25.

1702 Comparative Quantification of Health Risks
Table 21.25 Proportion of the population exposed to agents causingCOPD, by subregion, sex and level of exposure
Proportion ever exposed
Subregion Exposure level Male Female
Background 0.3722 0.5920AFR-D Low 0.5086 0.3776
High 0.1192 0.0305
Background 0.3744 0.5386AFR-E Low 0.5051 0.4365
High 0.1204 0.0249
Background 0.6879 0.9056AMR-A Low 0.0879 0.0314
High 0.2242 0.0630
Background 0.5653 0.8908AMR-B Low 0.2336 0.0553
High 0.2011 0.0539
Background 0.6465 0.9337AMR-D Low 0.1253 0.0169
High 0.2281 0.0494
Background 0.5829 0.9256EMR-B Low 0.2007 0.0441
High 0.2164 0.0303
Background 0.5818 0.7780EMR-D Low 0.2204 0.1776
High 0.1978 0.0444
Background 0.6819 0.8965EUR-A Low 0.0565 0.0253
High 0.2616 0.0781
Background 0.5096 0.6598EUR-B Low 0.2636 0.2469
High 0.2268 0.0933
Background 0.4312 0.6463EUR-C Low 0.3273 0.2409
High 0.2415 0.1128
Background 0.4190 0.6694SEAR-B Low 0.4112 0.2384
High 0.1698 0.0922
Background 0.3965 0.5723SEAR-D Low 0.4822 0.3869
High 0.1213 0.0408
Background 0.5994 0.8387WPR-A Low 0.1200 0.0531
High 0.2806 0.1082
Background 0.3700 0.5244WPR-B Low 0.4474 0.3807
High 0.1826 0.0949

Marisol Concha-Barrientos et al. 1703
3.3 Risk factor–disease relationships
ASTHMA
Occupational asthma is a condition characterized by variable airflowlimitation or bronchial hyper-responsiveness related to workplace expo-sure. However, the precise definition of occupational asthma has beenwidely debated. The most controversial issue concerns whether onlyimmunologically-mediated asthma should be considered to be occupa-tional asthma or whether asthma arising as result of workplace expo-sure to irritants, or exacerbation of pre-existing asthma by workplaceirritants, should also be considered in the definition (Lombardo andBalmes 2000; Malo and Chan-Yeung 2001; Wagner and Wegman 1998).Recently, consensus seems to have been reached in favour of a broad definition (American Thoracic Society review: Balmes et al. 2003). Abroader approach has been supported by others (Blanc and Toren 1999;Karjalainen et al. 2001; Kogevinas et al. 1999; Milton et al. 1998; Torenet al. 1999), and recent studies of occupational asthma have tended touse a more inclusive approach (Karjalainen et al. 2001, 2002; Milton etal. 1998).
Occupational asthma is probably the most common work-related res-piratory disorder in industrialized countries (Kogevinas et al. 1999), andis either stable (Singh and Davis 2002) or increasing in incidence (Sears1997). Many hundreds of occupational agents, including some inorganicand organic dusts, have been associated with occupational asthma(Balmes et al. 2003; Chan-Yeung and Malo 1994; Venables and Chan-Yeung 1997).
Until recently, there has been limited information on the total risk ofdeveloping asthma from workplace exposure. The United States magni-tude of mortality study (Steenland et al. 2003) estimated that about 5%of mortality from nonmalignant work-related respiratory disease wasdue to asthma. Studies of substance-specific risks have helped to identifyor implicate particular substances as likely causative agents (e.g. Monsoet al. 1998), but these studies have generally focused on agents thoughtto be sensitizers, and usually on only a limited number of these. Theyare therefore not useful for determining the true extent of asthma occur-ring as a result of work-related exposure. Several population-basedstudies have partially rectified this problem (Karjalainen et al. 2001,2002; Kogevinas et al. 1996, 1999; Ng et al. 1994; Toren 1996; Torenet al. 1999), focusing on occupation-specific rather than substance-specific risks because of the plethora of potential causative exposures andthe difficulty in characterizing them. These studies provided measures ofrelative risk and/or population-attributable fractions. Recent studies inFinland have estimated population-attributable fractions for occupa-tional asthma of 18% (Nurminen and Karjalainen 2001) and of 17%(for women) and 29% (for men) (Karjalainen et al. 2002). A compre-hensive review undertaken before these two Finnish studies found a

median value for population-attributable fraction of 9% for all relevantstudies, and a median value of 15% for the highest-quality studies (Blancand Toren 1999). The American Thoracic Society (Balmes et al. 2003)has recently reviewed the literature and estimated that approximately15% of asthma is attributable to occupational exposure, based largelyon studies in developed countries.
Of these studies, only that by Karjalainen et al. (2001, 2002) providesuseable risk information to cover the whole workforce, while that byKogevinas et al. provides useful information for agriculture. The studyby Karjalainen et al. (2001, 2002) was a longitudinal study over 13 yearscovering the entire Finnish population, and provided relative risks for alarge number of broad occupational categories. In that study, asthmawas defined by the occurrence of clinically diagnosed asthma (n=49575)during the follow-up period; national medical records were linked tocensus data on an individual’s occupation. The study population wascomposed of all those currently employed, aged 25–59 years at baseline,without prior history of asthma. Relative risks were calculated by com-paring the occupation-specific incidence to the incidence of occupationalasthma in administrative, managerial and clerical workers, whose riskwas assumed to be similar to the background population risk. The rel-ative risks were adjusted for age, and separate risks were available formales and females, although these were very close to each other and cer-tainly within the limits of random variation. The study by Kogevinas etal. (1999) was a cross-sectional study of asthma involving 15000 peoplein 12 European countries. In both studies, relative risks of asthma mor-bidity were assumed to apply for asthma mortality. This assumption islikely to be reasonable in most circumstances, but may lead to someunderestimation or overestimation of asthma mortality, depending onwhether exposure results in asthma incidence or exacerbation.
The approach used here was based on the work of Karjalainen et al.(2001, 2002). The work by Kogevinas et al. (1999) was also used forthe relative risk of asthma due to occupational exposure in agriculture.While the Finnish study was large, prospective and covered all occupa-tions, there was concern that Finnish exposures within specific occupa-tions might be atypical of the rest of the world. In particular, this wasconsidered likely to be true for agriculture, since Finnish agriculturemight involve more indoor work where the relative risks for asthma wererelatively high. Therefore the Kogevinas et al. results were used for agri-culture since they were believed to be more generalizable to agriculturein the rest of the world, especially the developing world.
We assumed that the relative risk of asthma morbidity owing toemployment in occupational categories was approximately equal to therelative risks of asthma mortality. Those not working and thoseemployed in administration were together considered to be the nonex-posed reference category (relative risk=1). These calculations were doneseparately for men and women for each subregion of the world. Rela-
1704 Comparative Quantification of Health Risks

tive risks and the proportions exposed by occupational category wereapplied across all age groups from age 15 to ≥80 years. The relative risksby occupation are shown in Table 21.26.
CHRONIC OBSTRUCTIVE PULMONARY DISEASE (COPD)
Tobacco smoking is clearly the most important risk factor, but manywork-related exposures have been demonstrated to cause COPD (Hen-drick 1996). A recent United States study estimating the magnitude ofmortality due to occupational exposure (Steenland et al. 2003) used anestimate of 14% for the population-attributable fraction for COPD dueto occupational dust exposure (based on a community study of severeCOPD) (Korn et al. 1987), and found that COPD represented 87% ofall fatal work-related nonmalignant respiratory disease, although someof the other types of respiratory disease may have been underestimated.A review of Finnish data also used a population-attributable fraction of14% for men (and 5% for women) (Nurminen and Karjalainen 2001), and a similar figure (15%) was recently used in a review by theAmerican Thoracic Society (Balmes et al. 2003).
As for asthma, difficulties arise from the vast array of definite, prob-able and possible causes of work-related COPD. The role of smoking,particularly in causing possible confounding effects, makes interpreta-tion of studies difficult. Apparently significant individual differences in susceptibility, and uncertainty about pathological mechanisms, alsocause problems. This area has been the subject of several reviews (Attfieldand Wagner 1998; Balmes et al. 2003; Becklake 1989, 1994; Hendrick1996; NIOSH 1996; Oxman et al. 1993), some covering all exposuresand some concentrating on mineral dusts.
As a result of difficulties in characterizing all the likely causative occu-pational exposures, few published papers provide information that com-
Marisol Concha-Barrientos et al. 1705
Table 21.26 Relative risks for occupational asthma by original occupationand economic subsector, and sex, age-adjusted
Relative risk Relative risk Occupation (males) (females) Source
Background 1.00 1.00 Non-working population, used as reference
Administration 1.00 1.00 Karjalainen et al. (2002), also used as reference
Technical 1.05 1.06 Karjalainen et al. (2002)
Sales 1.14 1.13 Karjalainen et al. (2002)
Agricultural 1.41 1.41 Kogevinas et al. (1999)
Mining 1.95 1.00 Karjalainen et al. (2002)
Transport 1.31 1.22 Karjalainen et al. (2002)
Manufacturing 1.56 1.33 Karjalainen et al. (2002)
Services 1.53 1.41 Karjalainen et al. (2002)

prehensively describes the risk of developing COPD as a result of work.The paper by Korn et al. (1987) has been used in this analysis, as it pro-vides relative risk information covering all workplace exposures. Thisstudy (the methods of which were described in more detail in an earlierstudy by Ferris et al. 1979) used data from a random sample of whiteadults aged 25–74 years from six United States cities and their sur-rounding areas (8515 people were included in the final sample). The def-inition of COPD was FEV1/FVC <0.6, representing reasonably severedisease. Logistical regression analyses were undertaken, determining theodds ratios for various respiratory conditions and controlling for age,sex, current and lifetime smoking history and city of residence. Theseodds ratios for COPD morbidity from Korn et al. (1987) were assumedto apply to COPD mortality.
The study by Korn et al. (1987) provides a strict definition of COPDand relative risks for both men and women, and was based on a largenumber of participants. This study was therefore used as the basis of therelative risk and attributable fraction estimates presented here. Relativerisks for COPD prevalence were used as an approximation of the rela-tive risks for COPD mortality.
Korn et al. (1987) found relative risks of COPD of 1.62 for men and1.24 for women for a history of exposure to dusts. We partitioned theserelative risks into high- and low-exposure categories, and also usedslightly different relative risks for low exposure in developed and developing countries. In developing countries the great majority of low-exposure employment is in agriculture, where much dust is non-respirable. In developed countries much of the exposure in the low cat-egories is in industries other than agriculture, where a higher percentageof dust exposure may be respirable and toxic. It was assumed that therelative risks applied across all age categories. The estimated relativerisks are shown in Table 21.27.
RISK REVERSIBILITY
As for carcinogens, there are limited data on risk reversibility. The studiesfrom which the estimated risks arise are based on cohorts of people
1706 Comparative Quantification of Health Risks
Table 21.27 Annual risks of COPD mortality
Developed countriesDeveloping countries (AMR-A, EUR-A, WPR-A)
Relative risk Men Women Men Women
Nonexposed 1.0 1.0 1.0 1.0
Low 1.2 1.1 1.4 1.2
High 1.8 1.4 1.8 1.4
Source: Korn et al. (1987).

exposed for different periods of time, followed up for various periods oftime and with various periods of time between exposure cessation andfollow-up, with follow-up periods varying between zero (still exposed)and many decades. Therefore, most of the absolute and relative risksproduced by the studies are already dependent on whatever change inrisk might occur once exposure ceases. Indications of risk reversibilityfor COPD may be obtained from the literature on smoking.
4. Occupational noiseNoise is a common occupational hazard. The unit for sound (noise) level,whether measuring noise exposure or hearing loss, is the decibel (dB).Noise exposure levels as used in this document have the unit dBA.4
Noise-induced hearing loss is reported in dBHL. There is variability inthe literature in the use of the terms to describe hearing ability. As usedhere, hearing loss refers to a decline in an individual’s hearing ability.Hearing impairment refers to the effect of hearing loss on the individ-ual’s ability to function. The U.S. National Institute for OccupationalSafety and Health (NIOSH) uses the term “material hearing impair-ment”5 to describe a hearing loss greater than 25dB, and most occupa-tional studies refer to 25dBHL. The WHO definition used in this studyis hearing loss greater than or equal to 41dBHL. Therefore, extrapola-tions were made from the occupational studies to fit the requirements ofthe WHO study.
4.1 Exposure variable
The exposure variable used in this analysis is a direct measure of the riskfactor, i.e. occupational exposure to noise, which is the causative agentof noise-induced hearing loss. As global data on the frequency of occur-rence, duration and intensity of noise exposure do not exist, it was necessary to model this exposure for workers employed in various occu-pational categories. The theoretical minimum is based on expected back-ground levels of noise, and consistency with national and internationalstandards. Most experts agree that levels below 80 dBA would result inminimal risk of developing hearing loss.
For workers in various occupational categories, three levels of expo-sure were estimated:
• minimum exposure, less than 85dBA;
• moderately high noise, ≥85–90dBA; and
• high noise, >90dBA.
The choice of these levels was based on the recommended exposurelimits (RELs) for occupational noise exposure around the world. In mostdeveloped countries the REL is 85dBA as an eight-hour time-weightedaverage without hearing protection. In the United States the PEL is
Marisol Concha-Barrientos et al. 1707

90dBA for an eight-hour day, although a hearing conservation pro-gramme is required for all employees exposed above 85dBA for an eight-hour day. In developing countries, the REL is usually 90dBA(Ahmed et al. 2001; Alidrisi et al. 1990; Hernandez-Gaytan et al. 2000;Hessel and Sluis-Cremer 1987; Osibogun at al 2000; Shaikh 1996; Sriwattanatamma and Breysse 2000).
Although the theoretical minimum exposure to noise was determinedto be 80dBA, it was not possible to estimate frequency of exposure byoccupational category to occupational noise between 80 and 85dBA.Therefore, persons with occupational exposure <85 dBA were includedwith the background population.
4.2 Estimating risk factor levels
DATA SOURCES
Potentially useful studies were identified using the various approachesdescribed in section 1. The key terms used were “occupational noise”and “occupational hearing impairment”. Relevant studies were identi-fied by critically appraising the references obtained. This included con-sideration of the approaches to selection, measurement, analysis andcontrol of confounding. Potential confounders of noise-induced hearingloss include nonoccupational exposure to noise, undocumented occupa-tional noise levels, use of personal protective equipment, use of somemedicines, and outer- and middle-ear pathology. Recent review articleswere used where available, and the main articles were obtained andappraised.
The main reason for excluding studies was that they did not containdata appropriate for determining risk of noise-induced hearing loss.Problems included an inappropriate (for this purpose) exposure mea-surement (such as reporting for only one or a few occupational groupsor tasks); inappropriate (for this purpose) outcome measurement (suchas dB per year loss with age or no data as to the number of cases vs totalpopulation); poorly characterized exposure or self-reported hearing loss;and inadequate control of confounding.
In the United States, about 9 million workers are exposed to time-weighted average sound levels of 85dBA and above (Simpson and Bruce1981, quoted in Suter 2000), and about 10 million have noise-inducedhearing loss >25dB (USDOL OSHA 2002b). About 17% of American“production workers” are exposed to average noise levels at or above85dBA (NIOSH 1998). In the European Union, 28% of workers sur-veyed reported that for at least 25% of the time they were occupation-ally exposed to noise loud enough to cause them to raise their voicesduring conversation (corresponding to approximately 85–90dBA)(EASHW 2000). The highest percentages of exposed workers werereported for mining, quarrying, manufacturing and construction. Aus-tralia compensates about 10000 people each year for noise-induced
1708 Comparative Quantification of Health Risks

hearing loss; evidence indicates that only one third of workers with noise-induced hearing loss file compensation claims (NOHSC 1993). Summarystatistics on noise exposure are not available for most industrializing andnonindustrialized countries. However, most published reports indicatethat average noise exposure levels are well above the recommended occupational level in many industrialized countries, which is generallyestablished at 85–90dB for an eight-hour work day (Suter 2000;WHO/FIOSH 2001).
Information on noise exposures and noise-induced hearing loss indeveloping countries is given in Table 21.28. These studies are charac-terized by high occupational noise exposure levels, and many reporthearing losses in exposed workers. The authors generally recommendedengineering controls and hearing conservation programmes, includinghearing protection, indicating that hearing protection is not widely used. Seventeen studies conducted in 12 countries in South America,Africa and Asia reported noise levels in a wide range of workplaces,including mining and the manufacture of food, fabrics, printed materials, metal products, drugs and watches. Most studies providedranges of sound levels, with the lowest reported noise levels often below80dBA and the upper levels always above 90dBA. All the studies thatexamined the hearing ability of workers revealed increased rates ofhearing impairment in noise-exposed workers compared to nonexposedcontrols.
EXPOSURE ESTIMATION
Occupational exposure to elevated noise levels depends on a variety offactors, including (i) occupation and industry and (ii) workplace-specificfactors such as type of facility and process, raw materials, machinery,tools, the existence of engineering and work practice controls, and the existence, condition and use of personal protective devices. Thusexposure assessment was conducted using the occupational categoryapproach (Equation 2), modified to reflect different noise exposures inoccupations in different economic subsectors.
Our estimation of the proportion of workers in each occupational cat-egory with exposure to noise at or above 85dBA (PEW(oc(r,g)i)) wasbased on United States data on the prevalence of noise exposure at orabove 85dBA among production workers in nine economic subsectors(NIOSH 1998; USDHHS 1986) (see Table 21.29).
The prevalence values among production workers were calculatedfrom the US National Occupational Exposure Survey conducted during1981–1983 (NIOSH 1998), which estimated the number of productionworkers exposed to noise at or above 85dBA, by economic subsector.All other prevalence values were estimated by us, based on the NIOSHvalues for production workers. The value of 0.20 calculated for pro-duction workers in agriculture was extrapolated to all agriculturalworkers in all economic subsectors. Similarly, the value of 0.12 for
Marisol Concha-Barrientos et al. 1709

1710 Comparative Quantification of Health Risks
Tabl
e 21
.28
Stud
ies
of n
oise
exp
osur
es a
nd h
eari
ng im
pair
men
t in
sel
ecte
d de
velo
ping
cou
ntri
es
Coun
try
or a
rea
Facil
ity/jo
bSo
und
leve
lsH
earin
g lo
ssN
otes
Sour
ce
Braz
ilR
otog
ravu
re p
rint
ing
Con
tinuo
us n
oise
leve
ls
Som
e 49
% o
f 12
4 w
orke
rsM
orat
a et
al.
(199
7)w
orke
rsfr
om 7
1 to
93
dBA
expo
sed
to n
oise
and
org
anic
solv
ents
had
hea
ring
loss
(>25
dB)
in t
he h
igh
freq
uenc
ies,
sign
ifica
ntly
ass
ocia
ted
with
age
Egyp
t R
oad
traf
fic p
olic
emen
A
vera
ge 9
7dB
A w
ithA
bout
20-
dB lo
ss a
t al
l fre
quen
cies
Kam
al e
t al
.(19
89)
in C
airo
horn
s,85
with
out;
97co
mpa
red
to o
ffice
pol
icem
enat
rai
lway
cro
ssin
gs
Egyp
tTe
xtile
fac
tory
78–9
1dB
A in
woo
lC
ompa
red
to n
onex
pose
d H
eari
ng im
pair
men
t w
as
Mos
elhi
et a
l.(1
979)
sort
ing
and
com
bing
co
ntro
ls,w
orke
rs e
xpos
ed t
o de
fined
as
aver
age
of le
ft
units
<85
dBA
had
onl
y 1%
incr
ease
in
and
righ
t ea
r th
resh
olds
he
arin
g im
pair
men
t af
ter
12 y
ears
.at
0.5
,1 a
nd 2
kHz,
In w
orke
rs e
xpos
ed t
o >8
5dB
A
>25
dBth
e in
crea
sed
risk
was
9.6
%
Hon
g K
ong
Five
indu
stri
es:w
eavi
ng,
L eq
(8-h
our
time-
wei
ghte
dC
ompa
red
to c
ontr
ols,
No
evid
ence
was
foun
dEv
ans
and
Min
g SA
Rbo
ttlin
g,m
etal
wor
king
,av
erag
e,dB
A):
wea
ving
no
ise-
expo
sed
wor
kers
had
for
any
ethn
ic d
iffer
ence
s(1
982)
spin
ning
,air
port
102;
bott
ling
94;m
etal
si
gnifi
cant
ly h
ighe
r th
resh
olds
inbe
twee
n w
este
rn g
roup
sw
orki
ng 9
6;sp
inni
ng 9
7;m
ost
age
grou
ps a
nd in
all
five
and
Can
tone
se C
hine
se,
airp
ort
80–9
0in
dust
ries
,clo
sely
mat
chin
gei
ther
in g
ener
al h
eari
ngpr
edic
ted
valu
esab
ility
or
in r
espo
nse
tolo
ng-t
erm
noi
se e
xpos
ure
Indi
aH
eavy
eng
inee
ring
Ran
ged
from
83–
116
dBA
.M
ean
hear
ing
thre
shol
d:40
Hea
ring
impa
irm
ent
was
Raj
a an
d G
angu
ly
indu
stry
:mac
hine
At
sele
cted
wor
k si
tes:
cont
rols
4–2
4dB
;53
mac
hine
sho
ppr
ogre
ssiv
e w
ith a
ge fo
r(1
983)
shop
and
pre
ss d
ivis
ions
pres
s 94
–110
;mac
hine
empl
oyee
s 14
–40
dB;6
0 pr
ess
all g
roup
s.U
se o
f he
arin
gsh
op 8
3–92
;fou
ndry
em
ploy
ees
19–7
0dB
prot
ectio
n w
as
86–1
16re
com
men
ded

Marisol Concha-Barrientos et al. 1711
cont
inue
d
Indi
aTe
xtile
mill
wea
vers
102–
104
dBA
120
wea
vers
,exp
osed
1–1
5 ye
ars.
Bhat
tach
arya
et
al.
In t
he a
ge r
ange
30–
34 y
ears
,(1
981)
med
ian
thre
shol
d of
aud
ibili
ty in
the
righ
t/le
ft e
ar w
as 5
5/55
com
pare
d to
15/
15 fo
r co
ntro
ls;
for
35–3
9-ye
ar o
lds
the
thre
shol
dw
as 6
0/55
com
pare
d to
15/
15 fo
rco
ntro
ls
Indi
aD
rug
and
phar
mac
eutic
alN
oise
leve
ls in
dB
A:
—A
utho
rs r
ecom
men
ded
Bhat
tach
arya
et
al.
com
pany
ferm
enta
tion
100–
105;
engi
neer
ing
cont
rols
and
(199
0)ai
r co
mpr
esso
r 95
–102
;he
arin
g co
nser
vatio
nam
mon
ia c
ompr
esso
rpr
ogra
mm
e,in
clud
ing
use
93–9
7;pr
imar
y ai
r fil
ter
of h
eari
ng p
rote
ctio
n10
4–10
6.N
ight
shi
ftle
vels
wer
e 1–
3dB
Ahi
gher
Indi
aW
atch
fac
tory
inM
axim
um n
oise
leve
ls—
Muk
herj
ee e
t al
.Ba
ngal
ore
rang
ed f
rom
74
in(1
995)
asse
mbl
y to
99
dBA
inth
e di
esel
gen
erat
orro
om
Nig
eria
Car
ass
embl
y 94
–108
dBH
eari
ng t
hres
hold
s of
165
wor
kers
Ole
ru e
t al
.(19
90)
wer
e si
gnifi
cant
ly h
ighe
r th
anno
nexp
osed
con
trol
s,an
dco
rrel
ated
sig
nific
antly
with
empl
oym
ent
dura
tion

1712 Comparative Quantification of Health Risks
Tabl
e 21
.28
Stud
ies
of n
oise
exp
osur
es a
nd h
eari
ng im
pair
men
t in
sel
ecte
d de
velo
ping
cou
ntri
es (
cont
inue
d)
Coun
try
or a
rea
Facil
ity/jo
bSo
und
leve
lsH
earin
g lo
ssN
otes
Sour
ce
Nig
eria
Text
ile w
orke
rs in
five
Con
tinuo
us n
oise
leve
lsH
eari
ng t
hres
hold
s of
61
No
hear
ing
prot
ectio
nO
leru
(19
80)
fact
orie
s in
Lag
osof
95–
115
dBA
nois
e-ex
pose
d w
orke
rs w
ere
wor
n.Ex
pose
d w
orke
rssi
gnifi
cant
ly h
ighe
r th
an 9
0di
d no
t di
spla
y 40
00-H
zno
nexp
osed
con
trol
s.A
fter
7no
tch,
and
the
shap
e of
year
s of
em
ploy
men
t,ex
pose
dth
e au
diog
ram
saw
asw
orke
rs lo
st 2
–12
dB p
er y
ear,
conv
ex u
pwar
ds,
com
pare
d to
0.6
–1.8
dB p
er y
ear
indi
catin
g lo
wer
loss
es a
tin
con
trol
s th
e m
iddl
e fr
eque
ncie
s.(T
ypic
al a
udio
gram
s w
ithno
ise-
indu
ced
hear
ing
loss
disp
lay
a co
nvex
dow
nwar
ds s
hape
,in
dica
ting
high
er lo
sses
at
the
mid
dle
freq
uenc
ies)
Paki
stan
Poly
este
r fib
re p
lant
Ave
rage
noi
se le
vels
:—
Typi
cal e
xpos
ure
is 4
8Sh
aikh
(19
96)
filam
ent
take
-up
unit
hour
s pe
r w
eek
in
93.2
dBA
;tex
turi
zing
uni
tth
ese
area
s.A
utho
r94
.8dB
A;c
ompr
esso
rre
com
men
ded
engi
neer
ing
hous
e 99
.5dB
Aco
ntro
ls a
nd h
eari
ngco
nser
vatio
n,in
clud
ing
use
of h
eari
ng p
rote
ctio
n
Saud
i Ara
bia
78 f
acto
ries
pro
duci
ng86
% e
xcee
ded
85dB
A,
—N
one
of t
he f
acto
ries
Alid
risi
et
al.(
1990
)fo
od,c
hem
ical
s,pl
astic
s,at
leas
t in
par
t of
the
prac
tised
noi
se p
rote
ctio
nm
etal
s,pa
per
and
othe
rfa
ctor
y.In
12%
all
of t
hepr
oduc
tsfa
ctor
y ex
ceed
ed 8
5dB
A
Sing
apor
eA
udio
met
ric
test
ing
ofN
oise
dos
imet
ry o
n 46
127
case
s of
NID
iden
tified
fro
mA
utho
r st
ated
tha
t N
IDTa
y (1
996)
nois
e-ex
pose
d w
orke
rsof
the
se c
ases
sho
wed
a19
85–1
994.
On
aver
age,
afte
r 24
is t
he le
adin
g oc
cupa
tiona
lis
man
dato
ry in
mea
n tim
e-w
eigh
ted
year
s of
exp
osur
e,th
e m
ean
dise
ase
in S
inga
pore
,with
Sing
apor
e.M
ost
case
sex
posu
re o
f 90
dBA
hear
ing
thre
shol
d at
1,2
and
>5
00 n
ew c
ases
per
yea
rof
noi
se-in
duce
d3
kHz
was
62
dB

Marisol Concha-Barrientos et al. 1713
deaf
ness
(N
ID)
are
inth
ose
empl
oyed
insh
ippi
ng a
nd m
etal
man
ufac
turi
ng,t
here
mai
nder
in t
rans
port
,qu
arry
ing
and
othe
rm
anuf
actu
ring
Sout
h A
fric
aG
old
min
ing
Aut
hors
quo
ted
a no
ise
Hea
ring
impa
irm
ent
was
defi
ned
Use
of
hear
ing
prot
ectio
nH
esse
l and
Slu
is-
(cro
ss-s
ectio
nal s
urve
ysu
rvey
in w
hich
the
as a
vera
ge h
eari
ng lo
ss o
f >2
5dB
incr
ease
d fr
om 1
3% in
Cre
mer
(19
87)
of 2
667
wor
kers
inm
ajor
ity o
f un
derg
roun
dfo
r 50
0,10
00 a
nd 2
000
Hz,
with
1979
to
17%
in 1
982
Joha
nnes
burg
)an
d su
rfac
e go
ld m
inin
g5
times
wei
ghtin
g of
bet
ter
ear.
occu
patio
ns w
ere
Non
e of
the
min
ers
<22
year
sex
pose
d ab
ove
85dB
Aha
d he
arin
g im
pair
men
t,ri
sing
prog
ress
ivel
y to
22%
of
thos
e ≥5
8ye
ars
old
Suda
nC
otto
n gi
nnin
g99
–107
dB—
New
ly m
echa
nize
d fa
cilit
yK
hoga
li (1
970)
Uni
ted
Ara
b Te
xtile
indu
stry
Ave
rage
of
98dB
in92
% (
60/7
3) o
f w
orke
rs e
xpos
edA
udio
met
ric
test
met
hods
Now
eir
et a
l.(1
968)
Rep
ublic
(El-M
ehal
la E
l-Kob
ra)
1200
–480
0 H
z ra
nge;
upto
noi
se fo
r ≥1
0 ye
ars
in w
eavi
ngno
t de
scri
bed;
hear
ing
to 1
03dB
Ade
part
men
ts h
ad m
ean
hear
ing
impa
irm
ent
not
defin
edim
pair
men
t of
60
dB c
ompa
red
to20
dB fo
r co
ntro
l gro
up
Zam
bia
Cop
per
min
es (
base
d“C
ontin
uous
noi
se”
100
min
ers
test
ed a
udio
met
rica
lly.
No
hear
ing
prot
ectio
nO
biak
o (1
979)
on a
utho
r’s e
xper
ienc
esO
f th
ose
with
ove
r 20
yea
rs,2
3%w
orn
by m
iner
sas
ear
,nos
e an
d th
roat
wer
e co
mpl
etel
y de
afsp
ecia
list
in Z
ambi
anco
pper
bel
t in
1975
–197
7)
—N
o da
ta.
aM
easu
rem
ent
of h
eari
ng lo
ss u
sing
an
audi
omet
er t
hat
prod
uces
sou
nds
at s
peci
fic f
requ
enci
es a
nd s
ound
pre
ssur
e le
vels
.The
hea
ring
thr
esho
ld le
vel i
s a
func
tion
of f
requ
ency
,in
dica
ting
how
a p
erso
n he
ars
at a
giv
en t
ime.

production workers in transportation was extrapolated to all sales andservice workers. The value for professional, administrative and clericalworkers was extrapolated from 0.02 indicated for production workersin business services. The remaining value, 0.05 for professional, admin-istrative and clerical workers in agriculture, mining, manufacturing, elec-tricity and construction, was based on expert judgement.
The prevalence values were then partitioned into moderately high andhigh noise exposures, i.e. ≥85–90dBA and >90dBA, to estimate the pro-portions of workers exposed to moderately high and high levels of noise(EPF(r), exposure partitioning factor). Data from the United States(USDHHS 1986), taken from the 1981 Occupational Safety and HealthAdministration Final Regulatory Analysis for the Hearing Conserva-tion Amendment, provide the distribution of noise exposure of over nine million American production workers (see Table 21.30). Of the 6063000 production workers with exposure at or above 85dBA, slightlyover half (3407000 or 56%) were exposed above 90dBA. The dis-tribution of noise exposure levels among workers exposed over 90dBAwas also used to determine that 95dBA is a reasonable level of noise toestimate risks among the workers in the high-exposure group (>90dBA).
The partitioning of workers by occupational category and noise levelwas assigned as follows, based on data in Table 21.30. Among produc-tion workers exposed at or above 85 dBA, half were considered to beexposed at ≥85–90dBA and half exposed at >90dBA. (Note that thesepartitioning values do not consider the use of personal protective equip-ment.) Of the agricultural workers and sales and service workers exposedat or above 85dBA it was assumed, based on expert judgement, thatapproximately 70% are exposed at ≥85–90dBA and 30% at >90dBA.
1714 Comparative Quantification of Health Risks
Table 21.29 Prevalence of noise exposure ≥85dBA
Economic Occupational category
subsector Professional Administrative Clerical Sales Service Agriculture Productiona
Agriculture 0.05 0.05 0.05 0.12 0.12 0.20 0.20
Mining 0.05 0.05 0.05 0.12 0.12 0.20 0.85
Manufacturing 0.05 0.05 0.05 0.12 0.12 0.20 0.22
Electricity 0.05 0.05 0.05 0.12 0.12 0.20 0.15
Construction 0.05 0.05 0.05 0.12 0.12 0.20 0.18
Trade 0.02 0.02 0.02 0.12 0.12 0.20 0.13
Transport 0.02 0.02 0.02 0.12 0.12 0.20 0.12
Financeb 0.02 0.02 0.02 0.12 0.12 0.20 0.02
Services 0.02 0.02 0.02 0.12 0.12 0.20 0.03
a Source: NIOSH (1998).b Based on 1.5% of workers exposed to noise in “business services”.

Marisol Concha-Barrientos et al. 1715
All professional, administrative and clerical workers with noise exposureat or above 85dBA were assumed to be at the ≥85–90-dBA level. Tables21.31 and 21.32 present the distribution of noise exposure levels amongworkers in the A subregions by occupational category within economicsectors.
In the absence of global data, it was assumed that the same propor-tion of workers in these occupational categories in the developing countries would be exposed to noise levels at or above 85dBA (B, C, D,and E subregions). Given the rarity of hearing conservation programmesin the developing subregions, it was assumed that 5% of productionworkers would be exposed in the ≥85–90dBA category and 95% in the>90dBA category (as opposed to 50/50 for the A subregions). Addi-tionally, because mechanization is not widespread for D and E subre-gions, the majority (95%) of the agricultural workers exposed at orabove 85dBA were assigned to the ≥85–90-dBA level. Assignment of all
Table 21.30 Distribution of 9368000 United States production workerswho had noise exposure levels of 80dBA or greater
Noise-exposure level (dBA) Number of workers
80–85 3305000
86–90 2656000
91–95 1936000
96–100 965000
>100 506000
Total >85 6063000
Total >90 3407000
Source: USDOL OSHA 1981, cited in NIOSH (1991).
Table 21.31 Prevalence of noise exposure 85–90dBA in A subregions
Economic Occupational category
subsector Professional Administrative Clerical Sales Service Agriculture Production
Agriculture 0.05 0.05 0.05 0.09 0.09 0.14 0.10
Mining 0.05 0.05 0.05 0.09 0.09 0.14 0.43
Manufacturing 0.05 0.05 0.05 0.09 0.09 0.14 0.11
Electricity 0.05 0.05 0.05 0.09 0.09 0.14 0.08
Construction 0.05 0.05 0.05 0.09 0.09 0.14 0.09
Trade 0.02 0.02 0.02 0.09 0.09 0.14 0.07
Transport 0.02 0.02 0.02 0.09 0.09 0.14 0.06
Finance 0.02 0.02 0.02 0.09 0.09 0.14 0.01
Services 0.02 0.02 0.02 0.09 0.09 0.14 0.02

other occupational categories was the same as for the A subregions.Tables 21.33–21.36 reflect the different partitioning for the B + C andD + E subregions.
Table 21.37 presents the proportions of workers exposed to moder-ately high and to high noise levels by subregion, age and sex. The pro-portions of males exposed to these noise levels were consistently higher than those of females, owing both to higher rates of participationin the labour force and to higher rates of females working in the servicessector.
4.3 Risk factor–disease relationships
High noise levels in the workplace may cause elevated blood pressure,sleeping difficulties, annoyance and stress. Excessive noise can interfere
1716 Comparative Quantification of Health Risks
Table 21.32 Prevalence of noise exposure >90dBA in A subregions
Economic Occupational category
subsector Professional Administrative Clerical Sales Service Agriculture Production
Agriculture 0 0 0 0.03 0.03 0.06 0.10
Mining 0 0 0 0.03 0.03 0.06 0.43
Manufacturing 0 0 0 0.03 0.03 0.06 0.11
Electricity 0 0 0 0.03 0.03 0.06 0.08
Construction 0 0 0 0.03 0.03 0.06 0.09
Trade 0 0 0 0.03 0.03 0.06 0.07
Transport 0 0 0 0.03 0.03 0.06 0.06
Finance 0 0 0 0.03 0.03 0.06 0.01
Services 0 0 0 0.03 0.03 0.06 0.02
Table 21.33 Prevalence of noise exposure 85–90dBA in B and Csubregions
Economic Occupational category
subsector Professional Administrative Clerical Sales Service Agriculture Production
Agriculture 0.05 0.05 0.05 0.09 0.09 0.14 0.01
Mining 0.05 0.05 0.05 0.09 0.09 0.14 0.04
Manufacturing 0.05 0.05 0.05 0.09 0.09 0.14 0.01
Electricity 0.05 0.05 0.05 0.09 0.09 0.14 0.04
Construction 0.05 0.05 0.05 0.09 0.09 0.14 0.01
Trade 0.02 0.02 0.02 0.09 0.09 0.14 0.01
Transport 0.02 0.02 0.02 0.09 0.09 0.14 0.01
Finance 0.02 0.02 0.02 0.09 0.09 0.14 0.00
Services 0.02 0.02 0.02 0.09 0.09 0.14 0.00

with communications in the workplace, resulting in property damage or personal injury. Tinnitus6 and temporary threshold shift7 may also occur. However, the most serious effect is irreversible hearingimpairment, resulting from damage to the delicate hearing mechanismsof the inner ear. Noise-induced hearing loss typically begins in the fre-quency range (pitch) of human voices and thus interferes with spokencommunication.
Noise-induced hearing loss is caused by exposure to loud noises, suchas those produced by woodworking equipment, chain saws, heavymachinery, gunfire, aircraft or amplified music. Permanent hearing lossfrom exposure to noise may happen quite early and an audiometricnotch, or initial loss at or around 4000Hz, may be noticeable within six
Marisol Concha-Barrientos et al. 1717
Table 21.34 Prevalence of noise exposure >90dBA in B and Csubregions
Economic Occupational category
subsector Professional Administrative Clerical Sales Service Agriculture Production
Agriculture 0.00 0.00 0.00 0.03 0.03 0.06 0.19
Mining 0.00 0.00 0.00 0.03 0.03 0.06 0.81
Manufacturing 0.00 0.00 0.00 0.03 0.03 0.06 0.21
Electricity 0.00 0.00 0.00 0.03 0.03 0.06 0.14
Construction 0.00 0.00 0.00 0.03 0.03 0.06 0.17
Trade 0.00 0.00 0.00 0.03 0.03 0.06 0.12
Transport 0.00 0.00 0.00 0.03 0.03 0.06 0.11
Finance 0.00 0.00 0.00 0.03 0.03 0.06 0.02
Services 0.00 0.00 0.00 0.03 0.03 0.06 0.03
Table 21.35 Prevalence of noise exposure 85–90dBA in D and Esubregions
Economic Occupational category
subsector Professional Administrative Clerical Sales Service Agriculture Production
Agriculture 0.05 0.05 0.05 0.09 0.09 0.19 0.01
Mining 0.05 0.05 0.05 0.09 0.09 0.19 0.04
Manufacturing 0.05 0.05 0.05 0.09 0.09 0.19 0.01
Electricity 0.05 0.05 0.05 0.09 0.09 0.19 0.01
Construction 0.05 0.05 0.05 0.09 0.09 0.19 0.01
Trade 0.02 0.02 0.02 0.09 0.09 0.19 0.01
Transport 0.02 0.02 0.02 0.09 0.09 0.19 0.01
Finance 0.02 0.02 0.02 0.09 0.09 0.19 0.00
Services 0.02 0.02 0.02 0.09 0.09 0.19 0.00
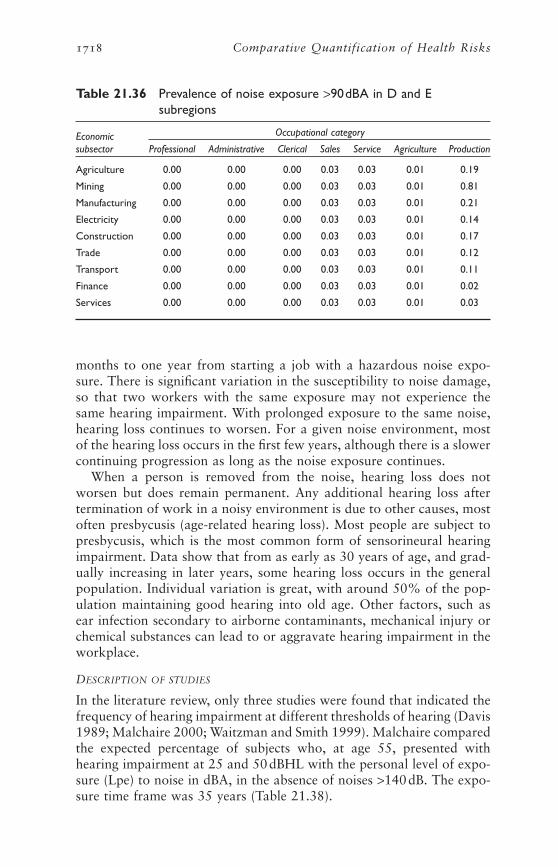
months to one year from starting a job with a hazardous noise expo-sure. There is significant variation in the susceptibility to noise damage,so that two workers with the same exposure may not experience thesame hearing impairment. With prolonged exposure to the same noise,hearing loss continues to worsen. For a given noise environment, mostof the hearing loss occurs in the first few years, although there is a slowercontinuing progression as long as the noise exposure continues.
When a person is removed from the noise, hearing loss does notworsen but does remain permanent. Any additional hearing loss aftertermination of work in a noisy environment is due to other causes, mostoften presbycusis (age-related hearing loss). Most people are subject topresbycusis, which is the most common form of sensorineural hearingimpairment. Data show that from as early as 30 years of age, and grad-ually increasing in later years, some hearing loss occurs in the generalpopulation. Individual variation is great, with around 50% of the pop-ulation maintaining good hearing into old age. Other factors, such asear infection secondary to airborne contaminants, mechanical injury orchemical substances can lead to or aggravate hearing impairment in theworkplace.
DESCRIPTION OF STUDIES
In the literature review, only three studies were found that indicated thefrequency of hearing impairment at different thresholds of hearing (Davis1989; Malchaire 2000; Waitzman and Smith 1999). Malchaire comparedthe expected percentage of subjects who, at age 55, presented withhearing impairment at 25 and 50dBHL with the personal level of expo-sure (Lpe) to noise in dBA, in the absence of noises >140dB. The expo-sure time frame was 35 years (Table 21.38).
1718 Comparative Quantification of Health Risks
Table 21.36 Prevalence of noise exposure >90dBA in D and Esubregions
Economic Occupational category
subsector Professional Administrative Clerical Sales Service Agriculture Production
Agriculture 0.00 0.00 0.00 0.03 0.03 0.01 0.19
Mining 0.00 0.00 0.00 0.03 0.03 0.01 0.81
Manufacturing 0.00 0.00 0.00 0.03 0.03 0.01 0.21
Electricity 0.00 0.00 0.00 0.03 0.03 0.01 0.14
Construction 0.00 0.00 0.00 0.03 0.03 0.01 0.17
Trade 0.00 0.00 0.00 0.03 0.03 0.01 0.12
Transport 0.00 0.00 0.00 0.03 0.03 0.01 0.11
Finance 0.00 0.00 0.00 0.03 0.03 0.01 0.02
Services 0.00 0.00 0.00 0.03 0.03 0.01 0.03

Marisol Concha-Barrientos et al. 1719
Table 21.37 Proportions of the working-age population occupationallyexposed to different noise levels, by sex and subregion
Exposure Age group (years)
Subregion Sex level 15–29 30–44 45–59 60–69 70–79 ≥80
AFR-D Male <85dBA 0.87 0.84 0.84 0.86 0.89 0.9585–90dBA 0.09 0.12 0.11 0.10 0.08 0.04
>90dBA 0.04 0.04 0.04 0.04 0.03 0.01
Female <85dBA 0.92 0.90 0.90 0.92 0.96 0.9885–90dBA 0.07 0.09 0.09 0.07 0.04 0.02
>90dBA 0.01 0.01 0.01 0.01 0.01 0.00
AFR-E Male <85dBA 0.87 0.84 0.84 0.86 0.89 0.9585–90dBA 0.09 0.12 0.11 0.10 0.08 0.04
>90dBA 0.04 0.04 0.04 0.04 0.03 0.02
Female <85dBA 0.92 0.90 0.90 0.92 0.96 0.9885–90dBA 0.07 0.08 0.08 0.07 0.04 0.02
>90dBA 0.01 0.01 0.01 0.01 0.01 0.00
AMR-A Male <85dBA 0.92 0.90 0.90 0.91 0.93 0.9785–90dBA 0.05 0.06 0.06 0.06 0.04 0.02
>90dBA 0.03 0.04 0.04 0.03 0.02 0.01
Female <85dBA 0.96 0.95 0.95 0.96 0.98 0.9985–90dBA 0.03 0.03 0.03 0.03 0.01 0.01
>90dBA 0.01 0.01 0.01 0.01 0.01 0.00
AMR-B Male <85dBA 0.90 0.87 0.88 0.89 0.91 0.9685–90dBA 0.05 0.06 0.06 0.05 0.04 0.02
>90dBA 0.06 0.07 0.07 0.06 0.05 0.02
Female <85dBA 0.95 0.94 0.94 0.95 0.97 0.9985–90dBA 0.03 0.03 0.04 0.03 0.02 0.01
>90dBA 0.02 0.03 0.03 0.02 0.01 0.01
AMR-D Male <85dBA 0.91 0.89 0.89 0.90 0.93 0.9685–90dBA 0.03 0.04 0.04 0.04 0.03 0.01
>90dBA 0.05 0.07 0.07 0.06 0.05 0.02
Female <85dBA 0.95 0.94 0.94 0.96 0.97 0.9985–90dBA 0.02 0.03 0.03 0.02 0.01 0.01
>90dBA 0.03 0.03 0.03 0.02 0.01 0.01
EMR-B Male <85dBA 0.91 0.88 0.89 0.90 0.92 0.9685–90dBA 0.04 0.05 0.05 0.04 0.03 0.02
>90dBA 0.05 0.07 0.07 0.06 0.05 0.02
Female <85dBA 0.96 0.95 0.95 0.96 0.98 0.9985–90dBA 0.02 0.03 0.03 0.02 0.01 0.01
>90dBA 0.02 0.02 0.02 0.02 0.01 0.01
EMR-D Male <85dBA 0.88 0.85 0.85 0.86 0.90 0.9585–90dBA 0.09 0.11 0.11 0.10 0.07 0.04
>90dBA 0.04 0.04 0.04 0.04 0.03 0.02
Female <85dBA 0.91 0.89 0.89 0.92 0.95 0.9885–90dBA 0.07 0.09 0.09 0.07 0.04 0.02
>90dBA 0.02 0.02 0.02 0.02 0.01 0.00
EUR-A Male <85dBA 0.92 0.90 0.90 0.91 0.93 0.9785–90dBA 0.05 0.06 0.06 0.06 0.04 0.02
>90dBA 0.03 0.04 0.04 0.03 0.02 0.01
continued

1720 Comparative Quantification of Health Risks
Table 21.37 Proportions of the working-age population occupationallyexposed to different noise levels, by sex and subregion(continued)
Exposure Age group (years)
Subregion Sex level 15–29 30–44 45–59 60–69 70–79 ≥80
Female <85dBA 0.96 0.96 0.95 0.97 0.98 0.9985–90dBA 0.03 0.03 0.03 0.02 0.01 0.01
>90dBA 0.01 0.01 0.01 0.01 0.01 0.00
EUR-B Male <85dBA 0.88 0.85 0.85 0.87 0.90 0.9585–90dBA 0.05 0.06 0.06 0.05 0.04 0.02
>90dBA 0.07 0.09 0.09 0.08 0.06 0.03
Female <85dBA 0.93 0.91 0.91 0.93 0.96 0.9885–90dBA 0.04 0.05 0.05 0.04 0.02 0.01
>90dBA 0.03 0.04 0.04 0.03 0.02 0.01
EUR-C Male <85dBA 0.88 0.85 0.85 0.87 0.90 0.9585–90dBA 0.04 0.05 0.05 0.04 0.03 0.02
>90dBA 0.08 0.10 0.10 0.09 0.07 0.04
Female <85dBA 0.93 0.92 0.92 0.94 0.96 0.9885–90dBA 0.02 0.03 0.03 0.02 0.01 0.01
>90dBA 0.04 0.05 0.05 0.04 0.02 0.01
SEAR-B Male <85dBA 0.88 0.84 0.84 0.87 0.91 0.9585–90dBA 0.06 0.08 0.08 0.06 0.04 0.02
>90dBA 0.06 0.08 0.08 0.07 0.05 0.03
Female <85dBA 0.92 0.88 0.88 0.91 0.96 0.9885–90dBA 0.05 0.08 0.08 0.05 0.02 0.01
>90dBA 0.04 0.04 0.04 0.03 0.02 0.01
SEAR-D Male <85dBA 0.87 0.79 0.80 0.84 0.88 0.9485–90dBA 0.09 0.15 0.15 0.11 0.08 0.04
>90dBA 0.04 0.05 0.05 0.05 0.04 0.02
Female <85dBA 0.91 0.94 0.95 0.96 0.98 0.9985–90dBA 0.07 0.04 0.03 0.02 0.01 0.01
>90dBA 0.02 0.02 0.02 0.02 0.01 0.00
WPR-A Male <85dBA 0.92 0.90 0.90 0.92 0.96 0.9885–90dBA 0.04 0.06 0.06 0.04 0.02 0.01
>90dBA 0.03 0.04 0.04 0.03 0.03 0.01
Female <85dBA 0.95 0.94 0.94 0.96 0.97 0.9985–90dBA 0.03 0.04 0.04 0.03 0.02 0.01
>90dBA 0.02 0.02 0.02 0.01 0.01 0.00
WPR-B Male <85dBA 0.87 0.84 0.84 0.86 0.89 0.9585–90dBA 0.06 0.08 0.08 0.07 0.05 0.03
>90dBA 0.07 0.08 0.08 0.07 0.06 0.03
Female <85dBA 0.93 0.91 0.91 0.93 0.96 0.9885–90dBA 0.04 0.05 0.05 0.04 0.02 0.01
>90dBA 0.03 0.04 0.04 0.03 0.02 0.01

Marisol Concha-Barrientos et al. 1721
Table 21.38 Expected percentages of workers with hearing loss of >25dB or >50dB after 35 years of exposure, by personallevel of exposure
Personal exposure (dBA)
Hearing loss 85 90 92 94 97 98 99 100
50dB 4 5 7 9 15 18 21 26
25dB 29 36 40 46 59 65 70 75
Source: Malchaire (2000).
Waitzman and Smith (1999) analysed data from the United StatesHealth Examination Survey (1960–1961) and the National Health and Nutrition Examination Survey (NHANES I, 1971–1975). Hearing loss was rated by a scheme developed by Klockhoff et al. (1974). TheKlockhoff analysis used four hearing loss levels (Slight, Moderate,Severe1, Severe2), which were related in this analysis to the standardhearing impairment scales by using typical noise-induced hearing losscurves. The categories developed by Klockhoff et al. were based on thefrequencies used in the National Health Examination Survey (500, 1000,2000, 3000, 4000 and 6000 Hz), and the NHANES I study (500, 1000,2000 and 4000 Hz). As an example of this conversion procedure, the cri-teria of Klockhoff et al. for slight hearing loss were based on a 30-dB lossat 4000Hz. Using audiometric data presented by Klockhoff et al. (1974),we estimated the equivalent hearing losses for each category as follows:
• Slight: >21dBHL
• Moderate: >38dBHL
• Severe1: >41dBHL
• Severe2: >50dBHL
Waitzman and Smith reported odds ratios calculated by multivariateregressions for two age groups for workers in construction, manufac-turing/mining and other subsectors (see Table 21.39). Blue-collar con-struction workers experienced between 2 and >3.5 times the riskexperienced by white-collar workers in “other industries”. The patternof their hearing loss at normal speech frequencies significantly disruptedtheir ability to communicate.
Davis (1989) reported on the prevalence of hearing loss as a functionof age in the adult population of Great Britain. Audiometric analyses onadults ranging in age from 17 to ≥80 years were conducted in four cities.Hearing impairment was reported for >25, >45 and >65dBHL. Davisfound a “significant” level of hearing loss (>25dBHL) in 16% of theadult population (17–≥80 years).

Several studies were found that presented relative risk estimates byspecific occupation. The risk estimates were higher than those deter-mined in this analysis for exposed workers, as they focused on occupa-tions with generally high noise exposures. These studies were based inCanada (Hessel 2000), Germany (Arndt et al. 1996) and Great Britain(Palmer et al. 2001) (see Table 21.40).
In Germany, a prevalence ratio for hearing loss of 1.5 was found inconstruction workers vs white-collar employees. Hearing impairmentwas defined as the sum of thresholds at 2000, 3000 and 4000Hz greaterthan 105dB at least in one ear. Hessel (2000), in a similar study inCanada, found that construction workers (with the exception of boiler-makers) had a lower prevalence of hearing loss than the Germans. Also,prevalence of hearing impairment in the comparison group in Canadawas lower than in Germany. According to the author, the differencesfound may be due to the year of the study. The Canadian study wascarried out 7–9 years later than the German study, and there may havebeen lower occupational noise levels and/or use of personal hearing pro-tection. These potentially confounding factors were not described in theGerman study.
In contrast to the Canadian and German studies, prevalence ratiosdetermined in Great Britain were based on self-reported hearing impair-ment. Prevalence of “ever employed in a noisy job” was comparedagainst “never exposed in a noisy job”. A noisy place was defined as one“where there was a need to shout to be heard”. The questions used todefine hearing impairment were modelled on those used in the Institute
1722 Comparative Quantification of Health Risks
Table 21.39 Odds ratios from logistic multivariate regressions on audiometricmeasures of hearing loss, by age group
Ages 25–44 years Ages 45–65 years
Type of Slight Moderate Severe 1 Severe 2 Slight Moderate Severe 1 Severe 2worker/industry >21dB >38dB >41dB >50dB >21dB >38dB >41dB >50dB
White collarConstruction 0.85 0.00 0.00 0.00 2.50 2.17 1.68 2.18
Manufacturing/ 0.91 1.45 1.17 1.14 1.02 1.43 0.98 1.25mining
Other industry 1.00 1.00 1.00 1.00 1.00 1.00 1.00 1.00groups
Blue collarConstruction 2.79 3.50 2.34 2.65 3.08 3.54 1.98 2.38
Manufacturing/ 2.01 3.03 1.94 2.40 2.33 1.86 1.88 1.90mining
Other industry 1.38 2.42 1.92 1.95 1.84 1.94 1.40 1.69groups
Source: Waitzman and Smith (1999).

Marisol Concha-Barrientos et al. 1723
Tabl
e 21
.40
Prev
alen
ce r
atio
of
occu
patio
nal n
oise
-indu
ced
hear
ing
impa
irm
ent
in a
vaila
ble
stud
ies
Coun
try
Refe
renc
eD
efini
tion
of h
earin
g im
pairm
ent
Occ
upat
ion
Prev
alen
ce r
atio
95%
CI
Can
ada
(Edm
onto
n)H
esse
l (20
00)
Gre
ater
tha
n 10
5dB
hea
ring
Plum
bers
2.91
—lo
ss a
t 2,
3,4
kHz
(cor
resp
onds
Boile
rmak
ers
3.88
—to
>35
dBH
L)El
ectr
icia
ns1.
46—
Ger
man
yA
rndt
et
al.(
1996
)G
reat
er t
han
105
dB h
ealin
gC
arpe
nter
s1.
771.
48–2
.12
loss
at
2,3,
4kH
z (c
orre
spon
dsU
nski
lled
wor
kers
1.75
1.47
–2.0
9to
>35
dBH
L)Pl
umbe
rs1.
491.
19–1
.85
Pain
ters
1.2
0.96
–1.4
9Pl
aste
rers
1.29
1.05
–1.5
9O
vera
ll1.
51.
29–1
.82
Gre
at B
rita
inPa
lmer
et
al.(
2001
)Se
vere
:wea
ring
a h
eari
ng a
idM
ale
2.9
—or
hav
ing
grea
t di
fficu
lty in
bot
hFe
mal
e1.
8—
ears
on
hear
ing
conv
ersa
tion
ina
quie
t ro
om >
45dB
HL
Mod
erat
e an
d w
orse
:rep
orte
dM
ale
3.6
—m
oder
ate
diffi
culty
in h
eari
ngFe
mal
e2.
9—
conv
ersa
tion
in a
qui
et r
oom
equi
vale
nt t
o 45
dBH
L
—N
o da
ta.

1724 Comparative Quantification of Health Risks
of Hearing Research national survey of hearing, in which those whoreported moderate or worse hearing impairment were found to have amean hearing loss of 45dBHL. The mean hearing loss of 45dBHL issimilar to the cut-off of 41dBHL used by WHO and the Global Burdenof Disease study, whereas the cut-off used in the German and Canadianstudies corresponded to slight hearing impairment (>35dBHL).
NIOSH, in a re-analysis of the data from its Occupational Noise andHearing Survey (Prince et al. 1997) derived excess risk8 estimates with amodel that used the average of 1000, 2000, 3000 and 4000Hz and ahearing loss >25dBHL. We used this information to develop excess riskestimates for workers exposed at 85–90dBA (defined by us as moder-ately high exposure) and >90dBA (defined by us as high noise exposure,equivalent to 95dBA). To estimate excess risks for workers exposed tomoderately high noise, we used the observed exposure–response rela-tionships developed by NIOSH (1998) for workers of different ages whowere exposed at 80, 85 and 90dBA for various numbers of years. Thedata show that at any noise level, hearing impairment increases with ageand/or length of exposure. Also, the highest risk is found at the highestlevels of exposure. Prince et al. (1997) found a small increase in excessrisk in workers exposed to 80–84dBA vs a <80dBA control group;however, these risk estimates are imprecise owing to the low numbers ofworkers in the study exposed to noise at these levels.
NIOSH (1998) also provides two data points of excess risk forworkers exposed at 95dBA for prolonged periods. Table 21.41 illustratesour estimation of excess risk of material hearing impairment at >25dBHL for workers exposed at 95dBA, based on these two datapoints. The excess risk value of 38.3% at 95dBA for a 65-year-oldworker after 10 or more years of exposure was taken from NIOSH(1998), Appendix Table IV. In addition, an excess risk value of 19.5%was taken from the table for 30-year-old workers exposed to noise at 95dBA and for a duration of exposure of 5–10 years. The values for 30-, 40- and 50-year olds with >10 years of exposure were interpolatedusing the ratios of change of hearing loss with age at 90dBA betweeneach age group in Table 21.41. All calculations of NIOSH exposure–response relationships were based on material hearing impairment at >25dBHL and were adjusted by us to reflect noise-induced hearing lossat ≥41dBHL.
The International Organization for Standardization (ISO) has alsodeveloped procedures for estimating hearing loss due to noise exposure.Their most recent model (referred to as the “1990-ISO model”) and the1997 NIOSH model (NIOSH 1998) are reasonably similar. Table 21.42summarizes the excess risk estimates developed separately by NIOSHand ISO for material hearing impairment >25dBHL caused by occupa-tional noise exposure.

EXTRAPOLATING FROM RISKS AT >25 dBHL TO RISKS AT ≥41 dBHL
Occupational hearing loss is usually denoted as >25 dBHL but WHO uses≥41dBHL as a cut-off point to estimate prevalence of hearing loss. There-fore, extrapolations were made from studies of occupational risks at >25dBHL to estimate risk to workers of hearing loss at 41dBHL orgreater. Data from the USDOL OSHA 1981 Final Regulatory Analysisfor the Hearing Conservation Amendment (NIOSH 1991) provided ameans of adjusting the various reports based on material hearing impair-ment >25dBHL to >40dBHL, a level of hearing loss assumed for thisproject to be equivalent to the WHO definition of ≥41dBHL. As pre-sented in Table 21.43, OSHA estimated the number of workers withvarious levels of hearing loss or impairment. The number of expected
Marisol Concha-Barrientos et al. 1725
Table 21.42 NIOSH and ISO estimated excess risk of incurring materialhearing impairment (>25dBHL at 1, 2, 3 and 4kHz) over a40-year working lifetime and at various average noiseexposures
Excess risk (%)
Average daily noise exposure (dBA) ISO NIOSH
90 17 25
85 6 8
80 1 1
Source: NIOSH (1998).
Table 21.41 Excess risk estimates for material hearing impairment >25dBHL, by age and duration of exposure
Excess risk (%)
Average daily exposure (dBA) Age 30 Age 40 Age 50 Age 60
5–10 years of exposure95a (estimated) 19.5
90 5.4 9.7 14.3 15.9
85 1.4 2.6 4 4.9
80 0.2 0.4 0.6 0.8
>10 years of exposure95a (estimated) 24 31 38 38.3
90 10.3 17.5 24.1 24.7
85 2.3 4.3 6.7 7.9
80 0.3 0.6 1 1.3
a Estimates for 95 dBA were developed from NIOSH 1998 using methods described in the text.
Source: NIOSH (1998).

cases (based on hearing levels of a nationwide sample of adults in U.S.Public Health Service hearing surveys) was subtracted to derive thenumber of excess cases at various levels of hearing loss or impairment inUnited States production workers (OSHA 1981, reported in NIOSH1991).
Using the data in Table 21.43, a factor to correct excess risk data at>25dBHL to WHO’s excess risk at ≥41 dBHL was determined as a ratioof the number of excess cases at >40dB divided by the number of excesscases at >25dBHL; i.e. 473000 divided by 1060000 yields a ratio of0.446. This correction factor of 0.446 was used to correct excess risk at>25dBHL from the reported excess risk in Table 21.42 to the excess riskat ≥41dBHL as presented in Table 21.44. As no additional data wereavailable, the hearing impairment of production workers at >40dBHLwas assumed to be equivalent to the WHO definition of hearing loss of41dBHL or greater used in this project.
Excess risk estimates for hearing impairment at ≥41dBHL are pre-sented in Table 21.45. They were generated by applying the same cor-rection factor of 0.446 to Table 21.41.
RELATIVE RISK ESTIMATION FOR NOISE INDUCED HEARING LOSS AT ≥41dBHL
The relative risk values were extrapolated using the following formula:
1726 Comparative Quantification of Health Risks
Table 21.43 Hearing levels (dBHL) of 9368000 United States productionworkers with noise exposure levels of ≥80dBA
Hearing threshold level(1, 2 and 3 kHz) Cumulative cases Expected cases Excess cases
>15dB (mild hearing loss) 3735000 (40%) 2111000 (23%) 1624000 (17%)
>25dB (material hearing impairment) 2025000 (22%) 965000 (10%) 1060000 (11%)
>40dB (moderate to severe hearing 718000 (8%) 245000 (3%) 473000 (5%)impairment)
Source: USDOL OSHA, 1981, cited in NIOSH (1991).
Table 21.44 Estimated excess risk of incurring hearing impairment at 41dBHL or greater over a 40-year working lifetime and atvarious average noise exposures
Excess risk (%)
Average daily noise exposure (dBA) ISO NIOSH
90 7.6 11.2
85 2.7 3.6
80 0.4 0.4

Excess risk is defined in this study as “the percentage of workers witha hearing impairment in an occupationally noise-exposed population,minus the percentage who would normally incur such impairment fromaging in an unexposed population”. The expected risk is the prevalencefor the general unexposed population. While the NIOSH document pro-vides the excess risk of the exposed population, the expected risk is notreported by NIOSH. Data from Davis (1989) estimates prevalence as afunction of age in the adult population of Great Britain. The averageprevalence for both ears for a noise-induced hearing loss of >45dBHLwas calculated by us for the general population, using the data fromDavis (1989) and the methods described above to adjust NIOSH datafor noise-induced hearing loss at >25dBHL to generate Table 21.45. Theresults are reported in Table 21.46.
In our study, relative risks for the age groups 0–4 and 5–14 years werenot estimated, as occupational risks are not present and/or data areunavailable on levels or length of exposure. In the calculation of excessrisk, the age group 15–29 years was assigned the lowest excess risk valueof 8.7 in Table 21.45 for age 30 with 5–10 years of exposure. For thecategory of workers with moderately high noise exposure (85–90dBA),the excess risk estimate is the geometric mean of the excess risk estimatesfor 85dBA and 90dBA for each age group (see Table 21.45).
The older age groups (30–44 years, 45–59 years, etc.) did not neatlyfit the age categories in Table 21.45, so worker-population-weightedaverages were constructed for excess risk values at the required ages. Forexample, the excess risk estimate for the age group 30–44 years, at 85–90dBA, was calculated by first taking the geometric mean of the excess risk
Relative risk excess risk expected risk= + ( )1
Marisol Concha-Barrientos et al. 1727
Table 21.45 Estimated excess risk for hearing impairment at ≥41dBHL,by age and duration of exposure
Excess risk (%)
Average daily exposure (dBA) Age 30 Age 40 Age 50 Age 60
5–10 years of exposure95 8.7
90 2.4 4.3 6.4 7.1
85 0.6 1.2 1.8 2.2
80 0.1 0.2 0.3 0.4
>10 years of exposure95 10.7 13.8 16.9 17.0
90 4.6 7.8 10.7 11.0
85 1.0 1.9 3.0 3.5
80 0.1 0.3 0.4 0.6

estimates at 85 and 90dBA, for people with >10 years of exposure inthe 30- and 40-year-old categories. These values were then weighted bythe worker population in the age groups 30–39 and 40–44 years. In asimilar procedure, the prevalence values in Table 21.46 for the generalpopulation were adjusted to the same age groups. Relative risks for theage groups 70–79 years and ≥80 years were calculated from figures inPrince et al. (1997) and the prevalence data from Davis (1989). Table21.47 presents the relative risks by age group and level of exposure.
RISK REVERSIBILITY
It was assumed that risk reversibility following exposure removal wasimmediate. In other words, for those previously exposed who have notdeveloped noise-induced hearing loss yet, the risk is removed after expo-sure removal (no new cases). Those with the condition, however, willcontinue to be affected by it.
5. Occupational ergonomic stressorsThe physical ergonomic features of work that are most frequently citedas risk factors for MSDs include a rapid pace of work and repetitivemotion patterns; insufficient recovery time; heavy lifting and other force-ful manual exertions; non-neutral body postures (either dynamic or
1728 Comparative Quantification of Health Risks
Table 21.46 Prevalence of hearing loss at >45dBHL for the generalpopulation of Great Britain
Age group (years) Prevalence
17–30 1.25
31–40 1.90
41–50 4.75
51–61 6.40
61–70 9.35
71–80 16.55
≥81 25.35
Source: Davis (1989).
Table 21.47 Relative risks by age group and level of exposure
Age group (years)
Level 15–29 30–44 45–59 60–69 70–79 ≥80
<85dBA 1.00 1.00 1.00 1.00 1.00 1.00
85–90dBA 1.96 2.24 1.91 1.66 1.12 1.00
>90dBA 7.96 5.62 3.83 2.82 1.62 1.00

static); mechanical pressure concentrations; vibration (both segmentaland whole-body); and low temperature. For the present analysis, the riskfactor is exposure to the combination of occupational exposures that areimplicated in the etiology of low back pain, including physical stressorsand possibly psychosocial or work organization features as well.
5.1 Exposure variable
Assessing the fraction of back pain disorders that can be attributed tooccupation requires that an indicator be identified that can be measuredon a global scale and that can also be matched with data on known exposure–risk relationship(s). The various reviews of low back pain epi-demiology have implicated an overlapping set of occupational exposures,such as lifting, forceful movements, awkward postures, whole-bodyvibration and perhaps psychosocial stressors. However, such exposuresare rarely assessed in surveillance activities on a large scale, and thusdata are not available for risk assessment calculations at the global level.
In contrast, low back pain (and other MSD morbidity) is commonlyreported by broad industrial or occupational groupings. Thus, eventhough occupation is a less precise indicator of risk than a specific exposure, its widespread availability in administrative data sets and someepidemiological studies makes it useful in this context. Some epidemio-logical studies have also provided sufficient data to relate back pain tothe same occupational categories. Occupation was therefore consideredas a proxy for specific risk factors. The exposure variable is an occupa-tional category with its assigned level of risk (low, medium or high rateof low back pain). This method thus required the assumption that thedistribution of the combined individual risk factors is similar within eachoccupational group across geographical regions. This argument appliesto psychosocial as well as physical exposures.
Given that differences can occur within occupations, the assumedhomogeneity of occupational groups in their total exposure to ergonomicrisk factors implies that differences in exposure among occupations aresubstantially larger than differences among workers within the occupa-tion. Although this assertion appears self-evident, only a few investiga-tors to date have examined it explicitly. Burdorf (1992) evaluated thehomogeneity of the exposure to postural load on the back within andamong four occupational groups, and reported that the exposure vari-ability within occupational groups was small compared with differencesamong groups. The estimated contribution of the variance for posturalload between occupational groups was the largest source of variance.Hollman et al. (1999) and Paquet et al. (1999) have similarly shown that,even within one subsector (health care and construction, respectively),differences in ergonomic exposures among jobs can be large relative tothe variability within jobs. These studies provide strong evidence insupport of the approach taken in this analysis. Although the literatureis less conclusive regarding their effects, to the extent that any specific
Marisol Concha-Barrientos et al. 1729

ergonomic factor is etiologically important it is assumed to be internal-ized in the relative risks by occupation. At the same time, specific analy-ses at the national or local level could increase the precision by assessingspecific physical risk factors at the workplace.
5.2 Theoretical minimum risk
For low back pain, “theoretical minimum risk” is considered to repre-sent the level of disease that would occur in the population if all exces-sive physical workload were abated by effective implementation ofergonomic control measures. While interventions to reduce ergonomicstressors have not yet been widely implemented on a global scale, studiesare available from selected settings demonstrating the great potential ofexposure (and disease) reduction in this area. Certain interventions haveshown that removal of ergonomic stressors can practically lead to theremoval of back pain (or its reduction to negligible levels), which justi-fies the choice of theoretical minimum. For example, in jobs where theentire work activity consists of manually handling materials, liftingequipment can successfully reduce both the biomechanical exposure tothe lower back and the risk of low back disorders (Marras et al. 2000).
Westgaard and Winkel (1997) reviewed 89 studies on ergonomic inter-vention studies, of which 20 were classified as mechanical exposure inter-ventions and 32 as production system interventions. Most mechanicalexposure interventions target the ergonomic exposure level directly,through redesign of the work station and work methods. The reviewersconcluded that in work situations whose mechanical exposure level isinitially high, a reduction in the level of mechanical exposure may bebeneficial for musculoskeletal health. For comparison, several other riskfactors considered in this chapter have not yet shown that interventionscan have such highly effective results when applied to selected popula-tion groups.
Since occupation represents a proxy for the composite of etiologicalexposures, rather than being the exposure per se, it is not necessary thatpersons leave one occupation for another in order to achieve the theo-retical minimum risk. Reduction in relative risk would occur throughimproved job design to reduce exposures within each occupational cat-egory. The number of individuals working in each category could remainconstant, even though the nature of the risk in each category wouldchange.
5.3 Estimating risk factor levels
Since data were not available worldwide on the prevalence of specificergonomic exposures, occupations were grouped here by their risk oflow back pain. Thus, for this outcome, estimation of risk factor levels isnot independent of the levels of disease assigned to them in the next step(see section 5.4). The exposure assessment by occupation was utilized,as described in the Introduction. Using managers and professionals as a
1730 Comparative Quantification of Health Risks

baseline for comparison, epidemiological studies have indicated that cler-ical and sales workers have a slightly elevated risk, operators and serviceworkers have a moderate risk, and farmers have the highest risk of lowback pain (see section 5.4 for details).
The basic approach was to determine economic activity by subregion,age and sex, and then to determine the distribution of the working pop-ulation in the various occupational categories. As each occupational cat-egory was assigned a single relative risk factor (based on methodologydescribed below), it was not necessary to partition exposures into “high”or “low” levels.
The estimates of occupations with risk of low back pain were basedon the published literature. The 1968 International Standard Classifica-tion Codes for Occupations utilizes the term “production workers”,whereas the epidemiological studies refer to “operators”. Based on theliterature, we made the following assignments.
• Background exposure: professional and administrative workers
• Low exposure: clerical and sales workers
• Moderate exposure: operators (production workers) and service workers
• High exposure: farmers
The non-working population is not considered in this analysis, and isattributed the same relative risk as the background exposure category. Itis likely that younger workers are represented more often in the pro-duction occupations, and that older workers have more opportunities tomove into management and administration positions.
As seen from Table 21.48, the majority of the working-age popula-tion is employed in occupations with exposure to factors linked to lowback pain. Males have higher exposure in general, owing to higher ratesof participation in the labour force. Exposures are higher for men in theless developed subregions, owing to a higher proportion of workers inagriculture than in the more developed subregions.
5.4 Risk factor–disease relationships
Pain in the soft tissues of the back is extremely common among adults.In the United States, the National Arthritis Data Workgroup reviewednational survey data showing that each year some 15% of adults reportfrequent back pain or pain lasting more than two weeks (Lawrence etal. 1998). Back pain is widespread in many countries, and is associatedwith substantial financial costs and loss of quality of life. In Canada,Finland and the United States, more people are disabled from workingas a result of MSDs—especially back pain—than from any other groupof diseases (Badley et al. 1994; Pope et al. 1991; Riihimäki 1995a).MSDs also constitute a major proportion of all registered and/or
Marisol Concha-Barrientos et al. 1731

1732 Comparative Quantification of Health Risks
Table 21.48 Proportions of the working-age population occupationallyexposed to different levels of ergonomic stressor, by sexand subregion
Exposure Age group (years)
Subregion Sex category 15–29 30–44 45–59 60–69 70–79 ≥80
AFR-D Male Background 0.29 0.11 0.13 0.22 0.40 0.70Low 0.09 0.11 0.10 0.09 0.07 0.04Moderate 0.20 0.25 0.25 0.22 0.17 0.09High 0.42 0.53 0.52 0.46 0.35 0.18
Female Background 0.53 0.42 0.41 0.55 0.73 0.87Low 0.05 0.06 0.06 0.05 0.03 0.01Moderate 0.09 0.11 0.11 0.08 0.05 0.02High 0.34 0.41 0.42 0.32 0.19 0.09
AFR-E Male Background 0.29 0.12 0.14 0.22 0.40 0.70Low 0.08 0.10 0.10 0.09 0.07 0.03Moderate 0.20 0.25 0.25 0.22 0.17 0.09High 0.42 0.53 0.52 0.47 0.36 0.18
Female Background 0.41 0.34 0.37 0.50 0.67 0.83Low 0.06 0.07 0.07 0.05 0.04 0.02Moderate 0.11 0.13 0.12 0.10 0.06 0.03High 0.41 0.46 0.44 0.35 0.23 0.12
AMR-A Male Background 0.49 0.33 0.37 0.64 0.91 0.95Low 0.18 0.24 0.23 0.13 0.03 0.02Moderate 0.29 0.39 0.36 0.21 0.05 0.03High 0.03 0.04 0.04 0.02 0.01 0.00
Female Background 0.58 0.47 0.53 0.79 0.95 0.98Low 0.19 0.24 0.21 0.09 0.02 0.01Moderate 0.22 0.28 0.24 0.11 0.02 0.01High 0.01 0.02 0.02 0.01 0.00 0.00
AMR-B Male Background 0.32 0.16 0.23 0.43 0.71 0.86Low 0.15 0.19 0.17 0.13 0.06 0.03Moderate 0.37 0.46 0.43 0.32 0.16 0.08High 0.15 0.19 0.17 0.13 0.06 0.03
Female Background 0.63 0.57 0.69 0.84 0.94 0.97Low 0.10 0.12 0.09 0.04 0.02 0.01Moderate 0.21 0.24 0.18 0.09 0.03 0.02High 0.06 0.07 0.05 0.03 0.01 0.00
AMR-D Male Background 0.41 0.19 0.20 0.29 0.49 0.75Low 0.15 0.21 0.20 0.18 0.13 0.06Moderate 0.39 0.55 0.53 0.48 0.34 0.17High 0.04 0.06 0.06 0.05 0.04 0.02
Female Background 0.70 0.62 0.69 0.77 0.86 0.93Low 0.09 0.11 0.09 0.07 0.04 0.02Moderate 0.20 0.26 0.21 0.16 0.09 0.05High 0.01 0.01 0.01 0.01 0.01 0.00
EMR-B Male Background 0.48 0.23 0.27 0.41 0.64 0.82Low 0.15 0.22 0.21 0.17 0.10 0.05Moderate 0.27 0.40 0.38 0.31 0.19 0.09High 0.10 0.15 0.14 0.11 0.07 0.03

Marisol Concha-Barrientos et al. 1733
continued
Table 21.48 Proportions of the working-age population occupationallyexposed to different levels of ergonomic stressor, by sexand subregion (continued)
Exposure Age group (years)
Subregion Sex category 15–29 30–44 45–59 60–69 70–79 ≥80
Female Background 0.77 0.74 0.82 0.87 0.94 0.97Low 0.10 0.11 0.08 0.05 0.03 0.01Moderate 0.10 0.12 0.08 0.06 0.03 0.01High 0.03 0.04 0.02 0.02 0.01 0.00
EMR-D Male Background 0.32 0.10 0.13 0.29 0.59 0.80Low 0.19 0.25 0.24 0.20 0.11 0.06Moderate 0.17 0.23 0.22 0.18 0.10 0.05High 0.32 0.43 0.41 0.33 0.19 0.10
Female Background 0.64 0.59 0.64 0.76 0.88 0.94Low 0.06 0.07 0.06 0.04 0.02 0.01Moderate 0.05 0.06 0.05 0.04 0.02 0.01High 0.24 0.28 0.24 0.16 0.08 0.04
EUR-A Male Background 0.58 0.38 0.46 0.78 0.97 0.98Low 0.11 0.16 0.14 0.06 0.01 0.00Moderate 0.27 0.40 0.35 0.14 0.02 0.01High 0.04 0.06 0.05 0.02 0.00 0.00
Female Background 0.67 0.59 0.69 0.92 0.99 0.99Low 0.11 0.14 0.11 0.03 0.00 0.00Moderate 0.19 0.23 0.18 0.04 0.01 0.00High 0.03 0.04 0.03 0.01 0.00 0.00
EUR-B Male Background 0.36 0.15 0.29 0.64 0.80 0.90Low 0.10 0.13 0.11 0.06 0.03 0.01Moderate 0.33 0.45 0.37 0.19 0.10 0.05High 0.21 0.28 0.23 0.12 0.06 0.03
Female Background 0.51 0.32 0.48 0.80 0.89 0.95Low 0.05 0.07 0.05 0.02 0.01 0.01Moderate 0.20 0.27 0.21 0.08 0.04 0.02High 0.25 0.34 0.26 0.10 0.05 0.03
EUR-C Male Background 0.35 0.13 0.20 0.73 0.90 0.95Low 0.11 0.14 0.13 0.04 0.02 0.01Moderate 0.39 0.52 0.48 0.16 0.06 0.03High 0.15 0.20 0.19 0.06 0.02 0.01
Female Background 0.47 0.18 0.35 0.85 0.96 0.98Low 0.13 0.20 0.15 0.04 0.01 0.01Moderate 0.31 0.48 0.38 0.09 0.03 0.01High 0.10 0.15 0.12 0.03 0.01 0.00
SEAR-B Male Background 0.32 0.09 0.13 0.33 0.59 0.80Low 0.11 0.14 0.13 0.10 0.06 0.03Moderate 0.25 0.33 0.32 0.25 0.15 0.07High 0.33 0.44 0.42 0.32 0.20 0.10
Female Background 0.49 0.36 0.40 0.60 0.81 0.90Low 0.11 0.13 0.13 0.08 0.04 0.02Moderate 0.16 0.21 0.19 0.13 0.06 0.03High 0.24 0.30 0.28 0.19 0.09 0.05

1734 Comparative Quantification of Health Risks
Table 21.48 Proportions of the working-age population occupationallyexposed to different levels of ergonomic stressor, by sexand subregion (continued)
Exposure Age group (years)
Subregion Sex category 15–29 30–44 45–59 60–69 70–79 ≥80
SEAR-D Male Background 0.29 0.10 0.13 0.34 0.51 0.76Low 0.06 0.08 0.08 0.06 0.04 0.02Moderate 0.23 0.29 0.28 0.21 0.16 0.08High 0.42 0.53 0.52 0.39 0.29 0.14
Female Background 0.57 0.45 0.52 0.69 0.85 0.92Low 0.01 0.02 0.01 0.01 0.00 0.00Moderate 0.06 0.08 0.07 0.04 0.02 0.01High 0.36 0.46 0.40 0.26 0.13 0.06
WPR-A Male Background 0.51 0.29 0.30 0.49 0.78 0.89Low 0.16 0.24 0.23 0.17 0.07 0.04Moderate 0.30 0.43 0.42 0.31 0.13 0.07High 0.03 0.04 0.04 0.03 0.01 0.01
Female Background 0.59 0.50 0.52 0.74 0.91 0.95Low 0.16 0.20 0.19 0.10 0.04 0.02Moderate 0.21 0.26 0.25 0.13 0.05 0.02High 0.03 0.04 0.04 0.02 0.01 0.00
WPR-B Male Background 0.27 0.11 0.17 0.45 0.74 0.87Low 0.13 0.16 0.15 0.10 0.05 0.02Moderate 0.25 0.30 0.28 0.19 0.09 0.04High 0.35 0.43 0.40 0.27 0.13 0.06
Female Background 0.30 0.20 0.39 0.74 0.92 0.96Low 0.17 0.20 0.15 0.07 0.02 0.01Moderate 0.22 0.25 0.19 0.08 0.03 0.01High 0.30 0.35 0.27 0.11 0.04 0.02
compensable work-related diseases in many countries, representing a third or more of all registered occupational diseases in the UnitedStates, the Nordic countries and Japan (Bernard 1997; Pope et al. 1991;Vaaranen et al. 1994).
Guo et al. (1995) estimated that 65% of cases of low back pain in theUnited States are attributable to occupational activities. To date, therehave been no other published estimates of the fraction of back pain(specifically) in the total population that is occupationally induced.However, low back pain was identified by the Pan American HealthOrganization as one of the top three occupational health problems to betargeted by surveillance within the WHO Region of the Americas (Choiet al. 2001).
Among MSDs caused by occupational ergonomic stressors, only lowback pain is currently a separate category in the GBD database and couldbe assessed. For purposes of this chapter, low back pain is defined as allpain in the back that is not secondary to another disease or injury cause(such as cancer or a motor vehicle accident). This includes disk prob-

Marisol Concha-Barrientos et al. 1735
lems (displacement, rupture), sciatica and other sources of back pain.Cervical spine problems, such as neck pain or neck torsion problems, areexcluded. This category of conditions is considered equivalent to whatothers have termed non-traumatic MSDs affecting the lower back.
In the epidemiological literature, MSDs of the back are often definedon the basis of pain reported on interview, usually with standardizedstudy criteria referring to time of onset, frequency and/or severity of pain.Physical examinations have sometimes been used to supplement ques-tionnaires, particularly to help localize the symptoms reported on inter-view and to rule out other causes of those symptoms. However, animportant proportion of epidemiologically relevant (exposure-related)back disorders are negative on physical examination (e.g. Punnett et al.1991) as well as on X-ray (e.g. Riihimäki et al. 1990). Most cases of lowback pain cannot be diagnosed by objective criteria and are typically des-ignated idiopathic or non-specific (Frank et al. 1995; Riihimäki 1991,1995b), even if there are findings on examination or severe symptomsand loss of function.
It is difficult to measure directly the validity of questionnaire re-sponses, since no consensus exists regarding a single “gold standard”against which all other measurements could be compared. The sensitiv-ity and reliability of physical examination manoeuvres for identifying lowback pain range from good to poor; not all pain results from knownmechanisms for which there is a corresponding objective test (Deyo et al.1992; Viikari-Juntura and Riihimäki 1999). Deyo et al. (1992) suggestedthat as many as 85% of cases of low back pain cannot be diagnosedbecause of the poor performance of examination and imaging tests.
A recent review by NIOSH (Bernard 1997) (see also below) empha-sized that health outcomes defined subjectively should be included in anyconsideration of work-related back disorders. In 24 of the 42 epidemi-ological studies on low back pain reviewed, the health outcome wasdefined by reported symptoms on questionnaires or interview, rangingfrom any back pain to specific symptoms such as those consistent withsciatica. In several studies, MSD cases defined by symptoms alone andthose defined by findings on physical examination have shown verysimilar associations with the ergonomic characteristics of subjects’ jobs.Symptom-based case definitions generally appear to be both unbiasedand more sensitive than those that require documented abnormalities onphysical examination (e.g. Bernard et al. 1993; Punnett 1998; Punnettet al. 1991; Silverstein et al. 1986, 1987).
Other case definitions sometimes used epidemiologically include lowback impairment or disability, typically indicated by reduced ability toperform activities of daily living or occupational tasks, work absenteeismand the seeking of medical care for back pain. Such behavioural mea-sures, however, are less desirable than low back pain per se, because theyare more distal from the direct morbidity and more likely to be affectedby interpersonal variability (e.g. tolerance of pain before seeking medical

attention) or by differences in job demands (e.g. pain of the same sever-ity may cause more low back disability in persons whose jobs are moredemanding).
At the same time, there is a strong correlation between the frequencyof musculoskeletal symptoms by occupation and the frequency ofworkers’ compensation claims and recorded work-related repetitivetrauma disorders in those same occupations (Fine et al. 1986; Silversteinet al. 1997). Outcomes such as days of restricted activity, long-term dis-ability, health care utilization and use of medication are very commonamong people with back pain, indicating the public health importanceand cost of these disorders even when self-reported pain is not confirmedobjectively (Badley et al. 1994, 1995; Guo et al. 1999; Miedema et al.1998; Punnett 1999; Westgaard and Jansen 1992).
Back pain has been defined operationally in various ways in epidemi-ological studies, including both prevalent and incident conditions. Vari-ations in the definition are related to the recall period (e.g. pain now, orwithin the last week or the past year), the frequency or duration (e.g. atleast three times in the past year, or lasting at least one week) and theseverity (e.g. at least a “4” on a 7-point pain intensity scale), amongothers. Even among studies that use similar definitions, prevalence esti-mates can vary substantially (Loney and Stratford 1999). However, forthe purpose of evaluating the exposure–response relationship, as long ascomparisons are made within a study population that has been evalu-ated with a consistent case definition, estimates of relative risk do notappear to be greatly affected (Ozguler et al. 2000).
EVIDENCE OF CAUSALITY
The evidence on low MSDs, including back pain, in relation to work-place factors has been thoroughly reviewed by NIOSH (Bernard 1997).The National Research Council, with the Institute of Medicine, has alsopublished a comprehensive review of the evidence on MSDs in the work-place (National Research Council 2001). Strong or sufficient evidencewas found for a number of risk factors at the workplace to be associ-ated with back pain (Table 21.49). The National Research Councilreport (2001) summarized ranges of risk estimates for specific occupa-tional stressors (Table 21.50).
In addition to these two comprehensive reviews from the UnitedStates, numerous other authors from Europe, Asia and Canada reviewedthe same epidemiological literature or variously defined subsets, andmost reached similar conclusions (e.g. Burdorf and Sorock 1997; Franket al. 1996; Garg 1992; Hagberg et al. 1995; Hales and Bernard 1996;Hoogendoorn et al. 1999; Hulshof et al. 1987; Jensen 1988; Jin et al.2000; Johanning et al. 1991; Lagerström et al. 1998; Nachemson andJonsson 2000; Riihimäki 1991, 1995a; Viikari-Juntura 1997; Wikstromet al. 1994). For example, in a systematic literature review that focusedon 28 cohort and three case–control studies of highest methodological
1736 Comparative Quantification of Health Risks

quality, Hoogendoorn et al. (1999) found strong evidence for manualmaterial handling, bending and twisting and whole-body vibration asrisk factors for back pain. They found moderate evidence for patienthandling and heavy physical work, and no evidence for standing or walking, sitting, sporting activities and total leisure-time physicalactivity. Specific psychological stressors, supported by weaker evidence,were reviewed by Burdorf and Sorock (1997), and are shown in Table21.51.
Some of the results of these reviews on specific stressors were obtainedfrom studies that were conducted within various occupational groups,such as operators, mine workers, dentists, office workers and nurses. Theevidence presented above implies that preventive interventions reducingthe exposure to these risk factors would decrease the occurrence of backdisorders considerably, even within an occupation.
Marisol Concha-Barrientos et al. 1737
Table 21.49 Rating of evidence for causal relationships between specificoccupational stressors and back disorders according to theNIOSH review
Strength of evidence Specific stressor
Strong evidencea Lifting and forceful movementsWhole-body vibration
Evidenceb Awkward posturesHeavy physical work
Insufficient evidencec Static work postures
Evidence of no effectd Other stressors
a Strong evidence. A causal relationship is shown to be very likely between intense or long-durationexposure to the specific risk factor(s) and MSD of the back when the epidemiological criteria ofcausality are used. A positive relationship has been observed between exposure to the specificrisk factor and MSD of the back where chance, bias and confounding factors could be ruled outwith reasonable confidence in at least several studies.
b Evidence. Some convincing epidemiological evidence shows a causal relationship when theepidemiological criteria for causality for intense or long-duration exposure to the specific riskfactor(s) and MSD of the back are used. A positive relationship has been observed betweenexposure to the specific risk factor and MSD of the back in studies in which chance, bias andconfounding factors are not the likely explanation.
c Insufficient evidence. The available studies are of insufficient number, quality, consistency orstatistical power to permit a conclusion regarding the presence or absence of a causal association.
d Evidence of no effect. Adequate studies consistently show that the specific workplace risk factor isnot related to development of MSD of the back.
Note: In this review, 42 epidemiological studies were selected on the basis of the following criteria: (i)exposed and reference populations were well defined; (ii) MSDs of the back were measured bywell defined, explicit criteria determined before the study; (iii) exposure was evaluated so thatsome inference could be drawn regarding repetition, force, extreme joint position, static loadingor vibration and lifting tasks; (iv) study participation of more than 70%. Thirty studies used across-sectional design and five a prospective cohort, four were case–control studies and twowere retrospective cohorts. Full descriptions of these studies appear in Table 6-6 of the NIOSHreview. Criteria for causality were based on strength of association, consistency, specificity ofeffect or association, temporality, exposure–response relationship and coherence of evidence.
Source: Bernard (1997).

Furthermore, there is sufficient evidence on biomechanical risk factorsto conclude that many cases of low back pain could be prevented byworkplace changes. For example, Marras et al. (2000) showed thatlifting equipment and other engineering controls had demonstrableeffects on lowering both biomechanical exposure to the lower back (com-pressive force, torque, etc.) and reported rates of low back disorders in36 repetitive manual material handling jobs at 16 different companies.
1738 Comparative Quantification of Health Risks
Table 21.50 Summary of epidemiological studies with risk estimates ofnull and positive associations of work-related risk factorsand the occurrence of back disorders
Risk estimate expressed in relativerisk or odds ratio Attributable
Null associationa Positive association fraction (%)
Range of Range ofWork-related risk factor Nb odds ratio Nb odds ratio Nb Range
Manual material handling 4 0.90–1.45 24 1.12–3.54 17 11–66
Frequent bending and 2 1.08–1.30 15 1.29–8.09 8 19–57twisting
Heavy physical load 0 NA 8 1.54–3.71 5 31–58
Static work posture 3 0.80–0.97 3 1.30–3.29 3 14–32
Repetitive movements 2 0.98–1.20 1 1.97 1 41
Whole-body vibration 1 1.10 16 1.26–9.00 11 18–80
NA Not applicable.a Confidence intervals of the risk estimates included the null estimate (1.0). In only 12 of 16 null
associations was the magnitude of risk estimate presented.b Number of associations presented in the epidemiological studies.
Source: National Research Council (2001).
Table 21.51 Summary of epidemiological studies on associationsbetween specific occupational psychological risk factors andthe occurrence of back disorders
Risk estimate Attributable fraction
Specific risk factor Na Range Na Range (%)
Mental stress 4 1.30–2.08 4 23–44
Job dissatisfaction 5 1.39–2.40 4 21–41
Work pace 1 1.12 NA NA
Monotonous work 5 1.25–2.34 4 20–44
NA Not applicable.a Number of associations presented in the epidemiological studies.
Source: Burdorf and Sorrock (1997).

The reviews by the National Research Council (2001), Westgaard andWinkel (1997) and Frank et al. (1996) each cited a number of welldesigned studies that identified opportunities to prevent risk of low backpain by reducing exposure to biophysical and psychosocial factors. Toillustrate the improvements that can be obtained by reducing ergonomicstressors at work, selected interventions and their impact are shown inTable 21.52. Certain interventions have practically completely removedergonomic stressors from the workplace.
Despite this extensive literature, some still dispute the importance ofthese factors, especially in relation to nonoccupational causes (e.g. Battieand Bigos 1991; Nachemson 1999; Waddell 1991). There are probablyseveral interrelated reasons for the continuing controversy, many ofwhich have been discussed by others (Frank et al. 1995, 1996; Viikari-Juntura and Riihimäki 1999). The available epidemiological evidencestill consists largely of cross-sectional and retrospective case–controlinvestigations. With regard to assessment of morbidity, the use of self-reported symptoms for end-points has also generated discussion, asdescribed above. Sparse longitudinal data leave important gaps in knowl-edge concerning latency of effect, natural history, prognosis and poten-tial for selection bias in employed populations (e.g. the “healthy workereffect”). Few studies have attempted systematically to describe these fea-tures of back disorders in populations with defined levels of exposure toergonomic stressors. Specific, quantitative comparisons of conclusionsbased on prevalence and incidence data within the same population arerare, and knowledge is still sparse as to the factors that predict recoveryor persistence among workers who continue in their jobs after the onsetof a disorder. No study has been identified that compares current andformer workers with reference to both prior MSD morbidity and expo-sure status.
In addition, there are many known or suspected nonoccupational riskfactors; some study populations have not provided enough statisticalpower to address potential confounding and effect modification of expo-sure–response relationships. Exposure assessment has often been limited,with too few exposures characterized to rule out confounding, or the useof crude exposure indicators leading to potential misclassification andunreliable conclusions. Attempts to partition risk between physical andpsychosocial domains have obscured the overlap between the two and the distinction between preventable and nonpreventable risk factors(Bongers et al. 1993; MacDonald et al. 2001; Volinn and Punnett 2001;Volinn et al. 2001).
In the light of these issues, it is important to restate that the issue isnot whether all back disorders are caused by work; there is a clear consensus that this is not the case. Nevertheless, most investigators andreviewers have concluded, equally clearly, that a large proportion of backdisorders among persons with high exposure to ergonomic stressors atwork could be prevented by reducing those exposures.
Marisol Concha-Barrientos et al. 1739

1740 Comparative Quantification of Health Risks
Tabl
e 21
.52
Sele
cted
inte
rven
tion
stud
ies
on o
ccup
atio
nal e
rgon
omic
str
esso
rs a
nd r
educ
tion
of o
ccur
renc
e of
low
bac
k pa
in
Job
title
/act
ivity
Inte
rven
tion:
engi
neer
ing/
adm
inist
rativ
e co
ntro
lO
utco
me
Stud
ya
Nur
sing
ass
ista
nts
(in t
wo
Intr
oduc
tion
of w
alki
ng b
elts
,mec
hani
cal h
oist
s an
dBa
ck in
jury
inci
denc
e re
duce
d fr
om
Gar
g an
d O
wen
(19
94)
nurs
ing
hom
e un
its)
show
er c
hair
s83
to
42 p
er 1
00 f
ull-t
ime
equi
vale
nts
[Ex.
26-1
415]
Poul
try
proc
essi
ng e
mpl
oyee
sIn
trod
uctio
n of
wor
ksta
tion
anal
ysis
and
red
esig
n,Ba
ck in
jury
rat
es d
eclin
ed f
rom
4.4
to
Stua
rt-B
uttle
(19
94)
incl
udin
g al
teri
ng h
eigh
ts o
f pr
oduc
ts,p
rovi
ding
3.0
per
200
000
hour
s[E
x.26
-104
5]w
orks
tand
s,an
d in
stal
ling
tank
tilt
ers
to r
educ
em
anua
l han
dlin
g
Offi
ce f
urni
ture
man
ufac
turi
ngSc
isso
r lif
ts in
stal
led
to a
id in
pac
kagi
ng fi
le c
abin
ets
Back
inju
ries
cut
by
50%
LaBa
r (1
991)
asse
mbl
y w
orke
rsof
diff
eren
t si
zes;
smal
l-ass
embl
y w
orks
tatio
ns[E
x.26
-107
8]al
tere
d to
elim
inat
e tw
istin
g an
d be
ndin
g du
ring
liftin
g
Met
al c
astin
gs,u
npac
king
Cra
tes
mod
ified
by
addi
ng g
ates
at
each
end
and
Back
inju
ries
ass
ocia
ted
with
thi
s O
xenb
urgh
(19
94)
oper
atio
nin
stal
ling
scis
sors
lift
to
lift
crat
es;c
hang
es m
ade
inop
erat
ion
elim
inat
ed[E
x.26
-104
1]th
e w
ay c
astin
gs w
ere
stac
ked
in t
he c
rate
s to
pe
rmit
wor
kers
’ arm
s to
rem
ain
clos
e to
the
bod
y w
hile
unp
acki
ng
Palle
tizin
g op
erat
ion
Scis
sors
lift
tab
le w
ith t
urnt
able
top
s in
stal
led
Five
out
of
six
back
inju
ries
elim
inat
edBe
nson
(19
87)
alon
gsid
e ea
ch p
acki
ng s
tatio
n[E
x.26
-106
2]
Lam
p m
anuf
actu
ring
Add
ition
of
vacu
um h
oist
;red
uced
equ
ipm
ent
Back
and
upp
er e
xtre
mity
dis
orde
rsC
arre
au a
nd B
esse
tt (
1991
)he
ight
;red
uced
box
siz
e an
d w
eigh
t;in
trod
uctio
nel
imin
ated
in t
he la
st fo
ur y
ears
[Ex.
26-1
071]
of b
ack
awar
enes
s pr
ogra
mm
e fo
r em
ploy
ees
Unp
acki
ng c
ar p
arts
Plyw
ood
shee
ts m
odifi
ed t
o re
duce
wei
ght
and
Back
inju
ries
ass
ocia
ted
with
thi
s O
xenb
urgh
(19
91)
perm
it th
em t
o sl
ide
mor
e ea
sily
in t
he g
roov
esop
erat
ion
elim
inat
ed[E
x.26
-104
1]

Marisol Concha-Barrientos et al. 1741
Man
ual h
andl
ing
of b
ulk
Man
ual l
iftin
g el
imin
ated
by
inst
alla
tion
of s
ciss
ors
No
back
inju
ries
in t
he t
hree
yea
rs
Oxe
nbur
gh (
1991
)pa
per
lift;
trol
ley
runn
ers
repl
aced
by
rolle
r be
arin
gs t
hat
sinc
e m
odifi
catio
ns m
ade
[Ex.
26-1
041]
en
able
the
pap
er t
o be
load
ed o
nto
the
scis
sors
lif
t w
ithou
t m
anua
l lift
ing
Rai
lway
rep
airm
enSt
orag
e of
too
ls a
nd m
ater
ials
off
the
grou
ndLo
w b
ack
inju
ries
and
lost
wor
k da
ysM
cMah
an (
1991
)be
twee
n kn
ee a
nd s
houl
der
heig
ht;w
inch
es t
o lif
tel
imin
ated
[Ex.
26-1
083]
and
hand
le h
eavy
equ
ipm
ent;
rede
sign
ed w
ork
tabl
es,t
rolle
ys a
nd c
arts
to
mor
e ea
sily
han
dle
trai
n ca
r pa
rts
Nur
sing
,hos
pita
lC
hang
es in
pro
cedu
res
for
mov
ing
patie
nts,
Back
inju
ry r
ates
red
uced
by
25%
in 1
8G
arg
and
Doc
kery
(19
95)
man
oeuv
ring
car
ts a
nd e
quip
men
t,us
ing
gall
mon
ths
sinc
e pr
ogra
mm
e im
plem
ente
d[E
x.26
-109
5]bl
adde
r bo
ards
,wal
king
on
wet
floo
rs,a
cces
sing
pow
er o
utle
ts
Vid
eo d
ispl
ay t
erm
inal
Red
uctio
n of
key
ing
to n
o m
ore
than
five
hou
rsLo
w b
ack
pain
red
uced
fro
m 8
.3%
to
[Ex.
500-
41-1
15]
oper
ator
spe
r da
y an
d ev
alua
tion
of n
ew c
hair
s;ne
w c
hair
sze
ro b
etw
een
Nov
embe
r 19
90 a
nd
inst
alle
d in
Feb
ruar
y 19
91Fe
brua
ry 1
993
Fore
stry
wor
kers
Fore
st t
ract
or s
eats
:spr
ing
tens
ion
and
incl
inat
ion
Red
uctio
n of
low
bac
k pa
in a
mon
g fo
rest
Perk
io-M
akel
a an
d R
iihim
äki
adju
stm
ent;
acce
ssor
y lu
mba
r su
ppor
t pr
ovid
edtr
acto
r dr
iver
s:24
of
50 d
rive
rs fo
und
(199
7)th
e lu
mba
r su
ppor
t be
nefic
ial
aA
ll ex
hibi
t nu
mbe
rs r
efer
to
mat
eria
ls in
USD
OL
OSH
A (
2000
).
Sour
ce:
Lahi
ri e
t al
.(20
02).

1742 Comparative Quantification of Health Risks
OTHER OUTCOMES
Although the present analysis was limited to low back pain, the evidenceon MSDs caused by occupational ergonomic stressors is broader. MSDsaffecting the neck and the upper and lower limbs result from the samerisk factors as are implicated in low back pain. For example, in a studyof over 10000 manufacturing employees, the effect of “greater physicaldemands” of the job on low-back musculoskeletal injuries (relative riskof 1.6, 95% CI 1.2–2.1) was only slightly higher than that for all othermusculoskeletal injuries combined (relative risk of 1.4, 95% CI 1.1–1.7)(Tsai et al. 1992). De Zwart et al. (1997), studying over 7300 men inthe Netherlands, found higher prevalences of shoulder disorders amongemployees in heavy physical work (e.g. heavy lifting and frequent stoop-ing) and steeper increases over four years than among employees in lessphysically demanding jobs. The magnitude of these effects was verysimilar to those for low back injuries. The work-relatedness of upper andlower extremity MSDs has been discussed extensively, again by Euro-pean as well as North American reviewers (e.g. Armstrong et al. 1993;Bernard 1997; Bongers et al. 1993; Buckle and Devereaux 1999;Hagberg et al. 1995; National Research Council 2001; Sluiter et al.2000).
Also excluded here are other types of health effects related toergonomic stressors, such as acute workplace injuries, cardiovasculardisease, mental health and adverse reproductive effects (Punnett 2002).Thus, the total impact of excessively strenuous work activities on mor-bidity and related quality of life is greater than that estimated in this riskassessment.
HAZARD ESTIMATES
Data sources
For the purposes of this analysis, studies were sought that compared therisk of low back pain among broad occupational groups (defined simi-larly to the economic subsectors explained above) and comprehensivelyenough to cover the range of paid occupations. Smaller, more specificstudies limited to relatively narrow occupational groups (e.g. nurses,dock workers, drivers) were checked for consistency with the larger datasets. Studies where the reference groups were also engaged in substan-tial physical activity (e.g. house painters) were excluded. The most recentliterature (1997–2001) was searched for exposure data and exposure–risk relationships, and published statistics of national occupationalhealth and safety institutes were consulted.
In addition to this systematic search, a number of reviews and studieswere identified to provide evidence supporting the selected approach.Search strategies were described in the Introduction. Medline wassearched for articles more recent than 1985, using any of the keywordsback pain, back disorder, back or musculoskeletal combined with any of

the following: occupation, occupational, workplace, work, workers, riskfactors, risk.
Description of literature
The studies specifically referred to in this section are summarized in Table 21.53.
The report of the National Research Council (2001) stated that theoccupations with the highest risk among men were construction labour-ers, carpenters and industrial truck and tractor equipment operators,while among women they were nursing aides/orderlies/attendants,licensed practical nurses, maids and janitor/cleaners. Other high-riskoccupations were hairdressers and automobile mechanics, oftenemployed in small businesses or self-employed. No rates were listedagainst occupations in the report. The report stated that the highest-riskindustries for men were lumber and building material retailing, crudepetroleum and natural gas extraction and sawmills/millwork. Amongwomen, the highest-risk industries were nursing and personal care facil-ities, beauty shops and motor vehicle equipment and manufacturing. Norates were listed for industries in the report.
Leigh and Sheetz (1989) measured low back pain on the basis of anational survey and a self-reported statement regarding “trouble withback or pain during the last year”. They estimated relative risks by com-paring the outcome frequency among occupational groups, using man-agers as a reference group (Table 21.54). This chapter places great weighton this study, because it was relatively large (1404 participants) com-pared to many others, it covered a comprehensive sample of occupations,and the results were adjusted for potential confounding variables. Oneimportant limitation, however, is that the multivariate analyses simulta-neously included two ratings of physical exposure, socioeconomic statusand occupational title. Since physical exposure is hypothesized to be theprimary pathway through which occupational differences are mani-fested, these analyses would certainly lead to an underestimation of theeffect of occupation on MSDs.
Although operators and service workers have very similar relativerisks, it is common that intervention strategies differ among these occu-pational settings. For that reason, the relative risks and exposure assess-ments for those two occupational groups are presented separatelythroughout this analysis.
Within the limits of the available literature, the results of the Leighand Sheetz analyses appear to be generally consistent with other reportedrelative risk values (Table 21.55). Since many other studies used officeworkers or other sedentary occupations as the reference group, it isappropriate to adjust the Leigh and Sheetz findings for comparative pur-poses. This can be done by dividing the relative risks for categories 3, 4,and 5 by 1.38 (the relative risk for clerical or sales work), in order toestimate a relative risk with clerical jobs as the reference group. The new
Marisol Concha-Barrientos et al. 1743

Tabl
e 21
.53
Key
stu
dies
and
rev
iew
s on
wor
k-re
late
d ba
ck p
ain
Stud
y po
pula
tion
(sou
rce)
or
liter
atur
e re
view
edPo
pula
tion
size
Out
com
e m
easu
red/
repo
rted
Mag
nitu
de o
r re
lativ
e ris
kCo
mm
ents
Refe
renc
e
Revie
ws
Back
pai
n in
rel
atio
n to
hea
vy42
stu
dies
,eva
luat
edBa
ck p
ain
(mul
tiple
H
eavy
phy
sica
l wor
k:a
1.0–
12.1
Lite
ratu
re r
evie
w:
Bern
ard
(199
7)ph
ysic
al w
ork,
liftin
g an
d fo
rcef
ul
acco
rdin
g to
4 c
rite
ria
defin
ition
s am
ong
the
Lift
ing
and
forc
eful
mov
emen
ts:a
0.9–
10.7
etio
logi
cal s
tudi
esm
ovem
ents
,non
-neu
tral
pos
ture
s,fo
r m
etho
dolo
gica
l qua
lity
stud
ies)
Non
-neu
tral
pos
ture
s:1.
2–10
.7an
d/or
who
le-b
ody
vibr
atio
n:St
atic
wor
k po
stur
es:0
.8–2
4.6
Belg
ium
,Fin
land
,Ita
ly,Ja
pan,
Who
le-b
ody
vibr
atio
n:1.
0–39
.5N
ethe
rlan
ds,R
ussi
an F
eder
atio
n,C
oncl
usio
ns:“
stro
ng e
vide
nce”
for
Swed
en,U
SAca
usal
rel
atio
nshi
p w
ith li
ftin
g an
dw
hole
-bod
y vi
brat
ion;
“evi
denc
e”fo
r ca
usal
rel
atio
nshi
p w
ith a
wkw
ard
post
ure
and
heav
y ph
ysic
al w
ork
Impo
rtan
t ri
sk f
acto
rs fo
r35
epi
dem
iolo
gica
l stu
dies
Back
dis
orde
rs (
mul
tiple
M
anua
l mat
eria
ls h
andl
ing:
1.12
–3.0
7Ill
ustr
atio
n on
indi
vidu
al r
isk
Burd
orf
and
wor
k-re
late
d ba
ck d
isor
ders
,pu
blis
hed
from
198
0 to
de
finiti
ons
amon
g th
e Fr
eque
nt b
endi
ng a
nd t
wis
ting:
1.29
–8.0
9fa
ctor
s,su
ch a
s ag
e,sm
okin
gSo
rock
(19
97)
and
stre
ngth
of
the
asso
ciat
ion
1996
stud
ies)
Hea
vy p
hysi
cal l
oad:
1.54
–3.7
1an
d ed
ucat
ion
betw
een
the
cons
iste
nt r
isk
Stat
ic w
ork
mov
emen
t:1.
30–3
.29
fact
ors
and
back
dis
orde
r w
ere
Rep
etiti
ve m
ovem
ent:
1.97
iden
tified
Who
le-b
ody
vibr
atio
n:1.
47–9
.00
Men
tal s
tres
s:1.
30–2
.08
Job
satis
fact
ion:
1.39
–2.4
0Pa
ce o
f w
ork:
1.21
Job
deci
sion
latit
ude
or m
onot
onou
sw
ork:
1.25
–2.3
4C
oncl
usio
n:lif
ting
or c
arry
ing
load
s,w
hole
-bod
y vi
brat
ion
and
freq
uent
bend
ing
and
twis
ting
cons
iste
ntly
asso
ciat
ed w
ith w
ork-
rela
ted
back
diso
rder
.Job
dis
satis
fact
ion
and
low
job
deci
sion
latit
ude
also
impo
rtan
t

cont
inue
d
Inte
nsiv
e an
d sy
stem
atic
rev
iew
31 p
ublic
atio
ns in
Dut
ch,
Incl
usio
n cr
iteri
a (h
ealth
Stro
ng e
vide
nce
for
man
ual m
ater
ial
Cro
ss-s
ectio
nal s
tudi
esH
ooge
ndoo
rn e
t al
.on
phy
sica
l loa
d du
ring
wor
k or
Engl
ish,
Fren
ch a
ndou
tcom
e):b
ack
pain
bas
edha
ndlin
g,be
ndin
g an
d tw
istin
g,an
dw
ere
excl
uded
(199
9)le
isur
e tim
e as
ris
k fa
ctor
s fo
rG
erm
anon
sym
ptom
s or
sig
ns o
fw
hole
-bod
y vi
brat
ion
as r
isk
fact
ors.
back
pai
n.Li
tera
ture
sou
rces
:no
n-sp
ecifi
c ba
ck p
ain,
Mod
erat
e ev
iden
ce fo
r pa
tient
Med
line
(196
6–19
97),
Emba
sese
lf-re
port
ed o
r m
easu
red
hand
ling
and
heav
y ph
ysic
al w
ork.
(198
8–19
97),
Psyc
lit (
1974
–199
7),
(via
sic
k le
ave,
med
ical
No
evid
ence
for
stan
ding
or
wal
king
,N
IOSH
TIC
,CIS
DO
C a
ndco
nsul
tatio
n,tr
eatm
ent
and
sitt
ing,
spor
ts a
nd t
otal
leis
ure-
time
HSE
LIN
E (1
977–
1997
) an
ddi
sabi
lity
due
to b
ack
pain
,ph
ysic
al a
ctiv
itySp
ortd
iscu
s (1
949–
1997
)et
c.)
Rev
iew
of
stud
ies
of w
ork-
rela
ted
16 e
pide
mio
logi
cal s
tudi
esO
ccur
renc
e of
wor
k-re
late
dPr
eval
ence
rat
ios:
Sugg
estio
n of
pot
entia
llyJin
et
al.(
2000
)lo
w b
ack
pain
in C
hina
am
ong
sele
cted
;qua
lity
incl
usio
n/lo
w b
ack
pain
(m
ultip
leBe
ndin
g an
d tw
istin
g:2.
0–8.
5gr
eate
r ex
posu
re in
Chi
na’s
liter
atur
e is
sued
fro
m 1
983
toex
clus
ion
crite
ria
wer
ede
finiti
ons
amon
g th
e st
udie
s)St
atic
pos
ture
:1.5
–14.
3w
ork
envi
ronm
ent
and
1997
appl
ied;
all s
tudi
es in
clud
edW
hole
-bod
y vi
brat
ion:
1.9–
5.5
pote
ntia
l sys
tem
atic
bia
sw
ere
cros
s-se
ctio
nal
Back
pai
n (m
ultip
le d
efini
tions
“l
inka
ges
… b
etw
een
exte
rnal
load
sLi
tera
ture
rev
iew
:etio
logi
cal,
Nat
iona
l Res
earc
h
amon
g th
e st
udie
s),m
uscl
ean
d bi
omec
hani
cal l
oadi
ng o
f th
eex
peri
men
tal a
nd in
terv
entio
nC
ounc
il (2
001)
activ
ity,t
issu
e lo
ad a
nd t
issu
esp
ine,
biom
echa
nica
l loa
ding
and
stud
ies
dam
age
inte
rnal
tol
eran
ces
of t
he s
pine
,and
inte
rnal
tol
eran
ces
and
outc
omes
(from
pai
n th
roug
h di
sabi
lity)
are
wel
l est
ablis
hed…
The
lite
ratu
rere
latin
g to
cau
sal f
acto
rs in
wor
k-re
late
d lo
w b
ack
diso
rder
s is
cohe
rent
and
pro
vide
s am
ple
evid
ence
on
how
adv
erse
wor
ksi
tuat
ions
can
lead
to
them
.”(p
p.35
7–35
8)
Syst
emat
ic li
tera
ture
rev
iew
of
NA
Back
pai
n (m
ultip
le d
efini
tions
2–4
times
hig
her
rate
s of
bac
k pa
inC
ompa
riso
n of
low
-inco
me
Volin
n (1
997)
artic
les
publ
ishe
d in
Eng
lish,
amon
g th
e st
udie
s);p
oint
in h
igh-
inco
me
than
in lo
w-in
com
ean
d hi
gh-in
com
e co
untr
ies
1980
–199
5,25
mos
t po
pulo
uspr
eval
ence
of
low
bac
k pa
in/
coun
trie
s.W
ithin
low
-inco
me
coun
trie
san
nual
or
lifet
ime
inci
denc
eco
untr
ies,
rate
s ar
e hi
gher
am
ong
urba
n th
an a
mon
g ru
ral p
opul
atio
ns

Tabl
e 21
.53
Key
stu
dies
and
rev
iew
s on
wor
k-re
late
d ba
ck p
ain
(con
tinue
d)
Stud
y po
pula
tion
(sou
rce)
or
liter
atur
e re
view
edPo
pula
tion
size
Out
com
e m
easu
red/
repo
rted
Mag
nitu
de o
r re
lativ
e ris
kCo
mm
ents
Refe
renc
e
Orig
inal
stu
dies
Cur
rent
ful
l-tim
e em
ploy
ees
at5
903
empl
oyee
sBa
ck o
r jo
int
pain
;bac
k pa
in35
.4%
rep
orte
d ba
ck o
r jo
int
pain
Adj
uste
d fo
r ag
e,se
x an
d Bu
rchfi
el e
t al
.on
e si
te o
f la
rge
chem
ical
>30
days
;vis
it to
phy
sici
an fo
rdu
ring
the
pas
t ye
ar,5
.3%
bac
k pa
inet
hnic
ity(1
992)
man
ufac
turi
ng c
ompa
ny,U
SA,
back
pai
nla
stin
g >3
0 da
ys;m
anag
ers
and
1987
–198
9te
chni
cian
s ha
d hi
ghes
t pr
eval
ence
sof
bac
k pa
in >
30 d
ays
Ran
dom
sam
ple
of r
etir
ed99
3 pe
ople
in t
otal
(62
6O
steo
artic
ular
dis
orde
rs:
Incr
ease
d fr
eque
ncy
of o
steo
artic
ular
Sign
ifica
ntly
hig
her
Der
rien
nic
et a
l.w
orke
rs li
ving
in t
he P
aris
are
a,in
firs
t su
rvey
in 1
982–
1983
,pr
esen
ce o
f pa
in w
ith/
pain
dur
ing
the
5 ye
ars
betw
een
the
freq
uenc
ies
of o
steo
artic
ular
(199
3)m
embe
rs o
f a
supp
lem
enta
ry46
4 in
sec
ond
surv
ey in
with
out
rest
rict
ed jo
int
two
inte
rvie
ws;
from
52%
to
65%
inpa
in fo
r w
omen
tha
n m
enin
terp
rofe
ssio
nal r
etir
emen
t19
87–1
988)
mov
emen
t fo
r at
leas
t 6
men
and
72%
to
82%
in w
omen
in b
oth
inte
rvie
ws
pens
ion
fund
m
onth
s be
fore
inte
rvie
wA
sig
nific
ance
incr
ease
in f
requ
ency
of
ost
eoar
ticul
ar p
ain
for
thos
e ex
pose
d to
hea
vy w
eigh
ts a
nd
awkw
ard
post
ures
(fr
om 6
8% t
o 77
%
and
56%
to
76%
,res
pect
ivel
y)
Prob
abili
ty s
ampl
e of
tot
al30
074
wor
kers
Back
pai
n ev
ery
day
for
aN
atio
nal e
stim
ate
of b
ack
pain
:22.
4G
uo e
t al
.(19
95,
wor
king
pop
ulat
ion
in U
SA,1
988
wee
k or
mor
e du
ring
12
mill
ion
case
s an
d a
prev
alen
ce o
f19
99)
mon
ths
befo
re in
terv
iew
17.6
% in
198
865
% o
f ca
ses
wer
e at
trib
utab
le t
ooc
cupa
tiona
l act
iviti
esT
he r
isk
was
hig
hest
for
cons
truc
tion
labo
urer
s am
ong
mal
es (
prev
alen
ce22
.6%
) an
d nu
rsin
g ai
des
amon
gfe
mal
es (
18.8
%)
Ran
dom
sam
ple:
all s
mal
l and
60 o
f 6
076
fact
orie
s;63
1Lu
mba
r pa
in d
iagn
osed
by
Buffi
ng w
orke
rs,o
pera
tors
and
Josh
i et
al.(
2001
)m
ediu
m-s
ized
fac
tori
es li
sted
wor
kers
sel
ecte
d ra
ndom
lym
edic
al p
ract
ition
eras
sem
bly
wor
kers
had
hig
hest
pai
nw
ith L
abou
r D
epar
tmen
t in
from
60
fact
orie
spr
eval
ence
s (3
0.4%
,28.
7% a
ndD
elhi
,Ind
ia27
.2%
,res
pect
ivel
y)

cont
inue
d
Wor
kers
’ com
pens
atio
n cl
aim
s32
947
4 cl
aim
s fo
r ba
ck
Com
pens
atio
n cl
aim
s fil
ed fo
r Ba
ck in
jury
con
stitu
tes
19.3
%Pe
rcen
tage
of
wor
kers
Kle
in e
t al
.(19
84)
for
back
inju
ries
in 2
6 st
ates
inju
ries
back
inju
ry o
r st
rain
s/sp
rain
sof
com
pens
atio
n cl
aim
s in
26
empl
oyed
in 2
6 st
ates
in(a
mon
g 1
705
674
wor
kers
’st
ates
1979
,obt
aine
d fr
om 1
970
com
pens
atio
n cl
aim
s),a
llC
onst
ruct
ion
and
min
ing
indu
stri
esce
nsus
wor
kers
em
ploy
ed in
26
stat
es,
have
larg
est
inci
denc
e:1.
6 an
d 1.
5U
SA,1
979
clai
ms/
100
wor
kers
,res
pect
ivel
yO
ccup
atio
ns w
ith t
he la
rges
tin
cide
nce
com
pare
d to
tot
alw
orke
rs:m
isce
llane
ous
labo
urer
s12
.3 c
laim
s/10
0 w
orke
rs,g
arba
geco
llect
ors
11.1
cla
ims/
100
wor
kers
Dia
gnos
ed lo
w b
ack
pain
cas
es,
1316
6 lo
w b
ack
pain
A
ccid
enta
l low
bac
k pa
inTr
ansp
ort
occu
patio
ns:8
cas
es p
erN
atio
nal s
urve
y da
taK
uwas
him
a et
al.
amon
g al
l em
ploy
ed p
erso
ns in
case
sca
used
by
the
actio
n of
a10
000
wor
kers
(199
7)Ja
pan,
1986
and
198
8su
dden
forc
e;re
quir
edC
onst
ruct
ion:
4 ca
ses
per
1000
0ab
senc
e of
≥4
days
wor
kers
Sale
s/se
rvic
e:0.
5 ca
ses
per
1000
0w
orke
rsM
inin
g an
d ca
rgo
hand
ling:
13.9
and
12.3
cas
es p
er 1
000
0 w
orke
rs
Prob
abili
ty s
ampl
e of
Uni
ted
959
wor
king
mal
es a
ndLo
w b
ack
pain
:exp
erie
nce
of1-
year
low
bac
k pa
in p
ast
prev
alen
ce:
Hea
lth o
utco
me
did
not
Leig
h an
d Sh
eetz
St
ates
wor
kers
em
ploy
ed ≥
2045
5 w
orki
ng fe
mal
estr
oubl
e w
ith b
ack
or s
pine
in19
.4%
mal
es,2
0.7%
fem
ales
dist
ingu
ish
betw
een
uppe
r(1
989)
ho
urs
a w
eek,
1972
–197
3pa
st y
ear
Rel
ativ
e ri
sk:f
arm
ers
5.17
,ope
rato
rsan
d lo
wer
bac
k pa
in2.
39,s
ervi
ce 2
.67,
cler
ical
1.3
8O
ver-
adju
stm
ent
by in
clud
ing
com
pare
d to
man
ager
s an
dso
cioe
cono
mic
sta
tus,
prof
essi
onal
soc
cupa
tion
and
phys
ical
ris
kR
elat
ive
risk
for
high
job
dem
ands
:1.6
8fa
ctor
s in
sam
e m
ultiv
aria
tean
alys
es
Thr
ee r
ando
m s
ampl
es o
f th
e7
544
peop
leA
ny b
ack
pain
in p
ast
30O
dds
ratio
s of
bac
k pa
in:2
.1 in
Res
ults
adj
uste
d fo
r ag
e,Le
ino-
Arj
as e
t al
.Fi
nnis
h po
pula
tion,
20–6
4 ye
ars
days
/bac
k pa
in in
pas
t 12
farm
ers,
1.8
in m
anua
l wor
kers
,1.7
heig
ht,m
arita
l sta
tus,
smok
ing,
(199
8)of
age
,198
8–19
90m
onth
sin
ent
repr
eneu
rs,1
.4 in
low
erbo
dy m
ass
inde
x,ph
ysic
alw
hite
-col
lar
wor
kers
activ
ity,m
enta
l dis
tres
s
Wor
kers
at
8 al
umin
ium
pla
nts
in5
654
peop
leO
ne-y
ear
prev
alen
ce o
fO
dds
ratio
for
low
bac
k sy
mpt
oms
Adj
uste
d fo
r se
x,w
eigh
t,M
orke
n et
al.
Nor
way
,199
8m
uscu
losk
elet
al s
ympt
oms
byam
ong
oper
ator
vs
offic
e w
orke
rs:
heig
ht,s
mok
ing,
and
(200
0)St
anda
rdiz
ed N
ordi
c1.
8 (r
ange
1.5
–2.1
)no
nocc
upat
iona
l phy
sica
lQ
uest
ionn
aire
activ
ity

Tabl
e 21
.53
Key
stu
dies
and
rev
iew
s on
wor
k-re
late
d ba
ck p
ain
(con
tinue
d)
Stud
y po
pula
tion
(sou
rce)
or
liter
atur
e re
view
edPo
pula
tion
size
Out
com
e m
easu
red/
repo
rted
Mag
nitu
de o
r re
lativ
e ris
kCo
mm
ents
Refe
renc
e
Act
ive
wor
kers
fro
m 4
725
peop
leSi
x de
finiti
ons
of lo
w b
ack
Prev
alen
ce o
f lo
w b
ack
pain
var
ied
Ove
r-ad
just
men
t by
incl
udin
gO
zgul
er e
t al
.oc
cupa
tiona
l sec
tors
(of
fice,
pain
(pa
in o
r di
scom
fort
in a
from
8%
to
45%
acc
ordi
ng t
o th
ebo
th o
ccup
atio
n an
d ph
ysic
al(2
000)
hosp
ital,
war
ehou
se,a
irpo
rtlu
mba
r ar
ea in
the
pre
viou
sca
se d
efini
tion
risk
fac
tors
in m
ultiv
aria
tere
gist
ratio
n),F
ranc
e,19
916
mon
ths/
pain
at
leas
t on
eC
arry
ing
heav
y lo
ads
and
bend
ing
anal
yses
;als
o ad
just
ed fo
rda
y/pa
in >
30 d
ays/
inte
nsity
of
post
ures
sho
wed
con
sist
ently
hig
hse
x,ag
e an
d bo
dy m
ass
inde
xpa
in a
bove
3/p
hysi
cian
vis
it/od
ds r
atio
s (1
.88–
2.14
) fo
r m
ost
trea
tmen
t fo
r lo
w b
ack
pain
)lo
w b
ack
pain
defi
nitio
ns
All
back
dis
orde
rs r
epor
ted
to95
ass
embl
y w
orke
rs w
ithBa
ck c
ases
:wor
kers
who
Expo
sed
wor
kers
:84%
Adj
uste
d fo
r ag
e,se
x an
dPu
nnet
t et
al.
clin
ic in
one
aut
omob
ile a
ssem
bly
back
dis
orde
rs (
case
s) a
ndso
ught
med
ical
att
entio
n fo
rBe
ndin
g an
d tw
istin
g (1
00%
vs
0%):
spor
ts a
ctiv
ity(1
991)
plan
t (r
efer
ents
fro
m s
ame
124
with
out
(ref
eren
ts)
“new
” ba
ck d
isor
ders
dur
ing
odds
rat
io 8
.09
(ran
ge 1
.5–4
4.0)
prod
uctio
n de
part
men
ts)
a 10
-mon
th p
erio
dLi
ftin
g (>
44.5
New
tons
/min
):od
dsra
tio 2
.2 (
rang
e 1.
0–4.
7)
Empl
oyed
per
sons
in W
ashi
ngto
nA
ppro
xim
atel
y 1.
23 m
illio
nW
orke
rs’ c
ompe
nsat
ion
clai
ms
Rat
es b
y in
dust
ry s
ecto
r ra
nged
Surv
eilla
nce
data
Silv
erst
ein
et a
l.St
ate,
USA
,199
0–19
98fu
ll-tim
e eq
uiva
lent
wor
kers
for
nont
raum
atic
sof
t tis
sue
from
43.
5 to
280
.0 p
er 1
000
0(2
002)
per
year
diso
rder
s of
the
bac
kfu
ll-tim
e eq
uiva
lent
s
Popu
latio
n-ba
sed
surv
ey o
f ap
prox
382
9 pe
ople
Rep
orte
d sy
mpt
oms:
low
bac
kC
urre
nt lo
w b
ack
pain
:33%
of
Adj
uste
d fo
r ag
e,se
x,Sk
ovro
n et
al.
9.9
mill
ion
adul
ts (
15 y
ears
or
pain
,his
tory
of
low
bac
k pa
in,
popu
latio
nla
ngua
ge,r
esid
ence
,soc
ial
(199
4)ol
der)
,Bel
gium
,199
1 fir
st lo
w b
ack
pain
and
dai
lyW
ork
diss
atis
fact
ion
asso
ciat
ed
clas
s an
d jo
b sa
tisfa
ctio
nlo
w b
ack
pain
with
low
bac
k pa
in h
isto
ry (
odds
ratio
>2.
4)
Full-
time
regu
lar
wor
kers
in S
hell
1035
0 pe
ople
Low
-bac
k in
jury
(IC
D-9
CM
,Ph
ysic
ally
dem
andi
ng jo
bs h
ave
Job
title
use
d to
iden
tify
Tsa
i et
al.(
1992
)O
il C
ompa
ny’s
man
ufac
turi
ng72
2,72
4)re
lativ
e ri
sk o
f 1.
57 fo
r lo
w b
ack
pote
ntia
l for
incr
ease
dfa
cilit
ies
betw
een
1987
and
198
9,in
jury
and
1.3
5 fo
r no
n-lo
w b
ack
phys
ical
dem
and
at w
ork
USA
mus
culo
skel
etal
inju
rySm
okin
g an
d ov
erw
eigh
t sh
owed
high
rel
ativ
e ri
sks
(1.5
4 an
d 1.
42,
resp
ectiv
ely)
NA
Not
app
licab
le.
aR
ange
of
effe
cts
for
stud
ies
that
met
at
leas
t on
e cr
iteri
on fo
r ep
idem
iolo
gica
l qua
lity.

values would be 1.73, 1.93 and 3.75, respectively. Keeping in mind thatthese estimates represent the average values for the entire occupationalcategory, it can be seen that the other studies cited fall within the CIs,with very few exceptions, and in fact generally have similar point esti-mates (Table 21.55).
The only study that can directly and numerically be compared to thatof Leigh and Sheetz (1989) is that by Leino-Arjas et al. (1998). However,the only value corresponding directly to one of the categories of Leighand Sheetz is that for farmers. The relative risk is lower (2.13) than theone put forward by Leigh and Sheetz (5.17), which may reflect betterworking conditions for farmers in Finland. For this analysis we there-fore used the average of these two results (see below).
Also available are administrative statistics from several countries onthe number of cases of back conditions. These are generally compiledfrom employers’ surveys or compensation statistics and typically reportlower rates than those assessed by population surveys. Rates for certainoccupations, as compared to managers and professionals, can be esti-mated on the basis of these statistics. Table 21.56 summarizes adminis-trative workplace statistics on conditions involving the back, based onreports by employers in the United States of work-related injuries(Bureau of Labor Statistics 2001) and compensation statistics of the Aus-tralian workforce (National Occupational Health and Safety Commis-sion 2001) and of the German national workforce (Bundesverband derBetriebskrankenkassen 2001).
All three of these data sets show higher risks for occupations otherthan managers and professionals, although the point estimates varysomewhat. None of these frequency estimates is adjusted for potentialconfounding variables. The incidents assessed in the first two data setsare limited to cases that have been recognized as work-related cases andinvolve behaviour such as absence from work or filing a claim againstthe employer. In contrast, the German study sought to assess the healthstatus of the population more comprehensively and these data are
Marisol Concha-Barrientos et al. 1749
Table 21.54 Relative risks of low back pain for occupational groups, withmanagers and professionals as the reference group
Occupational activity Relative risk (95% CI)
Managers and professionals 1.0 (NA)
Clerical or sales worker 1.38 (0.85–2.25)
Operators 2.39 (1.09–5.25)
Service workers 2.67 (1.26–5.69)
Farmers 5.17 (1.57–17.0)
NA Not applicable.
Source: Based on data from Leigh and Sheetz (1989).

1750 Comparative Quantification of Health Risks
Table 21.55 Relative risks of occupational groups by exposure level
Source
Occupation Leigh and Bongers Bovenzi Burdorf Johanning Magnusson(exposure Sheetz Astrand et al. and Betta et al. Hildebrandt et al. et al.category) (1989)a (1987)b (1990)b (1994)b (1993)b (1995)b (1991)b (1996)b
Managers and 1.00/NAprofessionals
ProfessionalsManagersTeachers
Clerical or sales 1.38/1.00workers
Office workers 1.00 1.00 1.00 1.00 1.00(sedentary)
Clerks 1.00Air force 1.00
officersCivil servantsSales
Operators 2.39/1.73 3.90Construction
labourersManual workers 2.28Pilots and 9.00
aircrewDrivers (bus, 1.83–5.49 2.51 1.32 1.55–2.10
truck,tractor)
Crane 3.29operators
Dock workersPlumbers 1.32CarpentersTechniciansAssembly,
packing, foodprocessing
Automobile mechanics
Maintenance
Service workers 2.67/1.93Airport
registration workers
Hospital workers
Warehouse workers
Stock handlers,baggers
Janitors,cleaners
WaitressesNurses
Farmers 5.17/3.75
NA Not applicable.a Relative risks used in estimation of global burden of disease. The second set of relative risk values was
estimated using clerical/sales jobs as the reference group, for the purpose of comparison with other studies.

Marisol Concha-Barrientos et al. 1751
Source
Partridge Guo Leino-Arjas and Riihimäki Riihimäki Videman Burchfiel Ozguler Joshi et al. Morken et al.
Duthie et al. et al. et al. et al. et al. et al. (1995)c et al. (1998) (1968)b (1989)b (1994)b (1990)b (1992) (2000) (2001) [female] (2000) (male)
1.00
1.001.80
[1.2]
1.00 1.00 1.00 0.89 1.00 1.00 1.00 1.35
1.001.10
1.0–1.5 1.40 1.10 1.83 1.802.10
3.60 1.49 1.84
2.90 2.00
1.271.70
1.50 2.101.20 1.59
1.73
1.80
1.59 1.70
1.030.86
1.13
0.54
1.70
[2.0]
[1.6][1.5]
1.80 2.13
b Cited in Bernard (1997).c Compared to all male or female workers.

therefore likely to be more comparable to those reported by Leigh andSheetz. The values are, in fact, relatively close except for agriculturalworkers.
Given that the study by Leigh and Sheetz (1989) best fits the formatrequired for this analysis, and the supporting evidence displaying verysimilar quantitative values, the proposed exposure categories and attrib-uted relative risks are displayed in Table 21.57. The value for farmers isprovided by an average of the relative risks for farmers in the Leigh and
1752 Comparative Quantification of Health Risks
Table 21.56 Relative risks of occupational conditions involving the backby occupational title, compared to managers andprofessionals, from national surveillance data
Relative risk for back conditions
Occupational activitya USAb Australiac Germanyd
Managers and professionals 1.0 1.0 1.0
Tradespeople — 5.5 —
Clerks — 1.1 1.5
Technical, sales and administrative support 2.2 — —
Sales and service workers — 2.2 2.9
Service workers 7.4 — —
Operators 9.1 — 2.4
Farmers, fishermen and forestry workers 4.3 — 3.6
Operators and farmers — 8.8 —
— No data.a Owing to the different reporting schemes, some rows (occupational activities) represent the sum of
several other rows.b Bureau of Labor Statistics (2001), nonfatal occupational injuries and illnesses involving days away from
work, for injuries involving the back.c National Occupational Health and Safety Commission (2001), conditions affecting the upper and lower
back.d Bundesverband der Betriebskrankenkassen (2001), musculoskeletal illnesses of the lower back.
Table 21.57 Exposure categories and relative risks of low back pain foroccupational groups selected for this analysis, with managersand professionals as the reference group
Exposure category Relative risk 95% CI Occupational activity
Background 1.0 NA Managers and professionals
Low 1.38 0.85–2.25 Clerical and sales workers
Moderate 2.53 1.09–5.69 Operators and service workers
High 3.65 1.57–17.0 Farmers
NA Not applicable.
Source: Exposure level adapted from Leigh and Sheetz (1989).

Sheetz (5.17) and Leino-Arjas et al. (2.13) studies, resulting in a relativerisk of 3.65. The CI, however, remains the same, because the CI fromthe Leigh and Sheetz study (1.57–17.0) includes the CI provided byLeino-Arjas et al. (1.6–2.9) and is wider, which is probably a truer rep-resentation of the statistical uncertainty of this estimate.
Methodological quality of the literature
Many of the reviews cited above used systematic criteria to evaluate thepotential for selection bias, information bias and confounding in the indi-vidual investigations. Several of them identified the methodologicallystronger studies and relied primarily or exclusively on those to draw con-clusions about the strength of the evidence.
Potential confounding by nonoccupational factors such as sex, age,anthropometry, smoking, heredity and general medical history wasextensively investigated in the great majority of studies cited above. Allof the studies on which NIOSH relied most heavily, as being rigorousand methodologically sound, controlled for multiple potential con-founding variables, permitting the conclusion that physical job factorscause low back pain independently of other factors. Burdorf and Sorock’s(1997) review also summarized the associations between low back painand specific occupational exposures, and relied more heavily on datawith adjustment for important covariates. For example, Smedley et al.(1995) adjusted for age, height and nonmusculoskeletal symptoms (theonly nonoccupational factors associated with low back pain—see below)in their analysis of low back pain and patient handling demands amongfemale nurses. Tsai et al. (1992) examined the effect of greater vs less physical demands in the job, adjusting for six nonoccupationalcovariates.
Leigh and Sheetz (1989) adjusted for sex, race, education, height andsmoking. In addition, they included terms for occupation and for phys-ical effort and repetitive work; this means that the effect of occupationis likely to be underestimated, since the primary intermediate variable(physical effort) was also included. There is also a great deal of discus-sion in the epidemiological literature about the mechanisms of the effectof socioeconomic status (see below). It could easily be argued that theinclusion of terms for education also results in overadjustment, since alower level of education is strongly associated with employment in“unskilled” jobs with higher physical exposures and is likely to act atleast in part through such limited job opportunities.
Ozguler et al. (2000) analysed multiple low back pain case definitions.The same set of covariates was examined for each one, and all thosenonoccupational factors (sex, age, obesity, psychosomatic “well-being”)that were associated with low back pain were kept in the model. Likethat of Leigh and Sheetz, this study overadjusted the estimates for occu-pation, because exposure variables such as carrying heavy loads andbending posture were entered in addition to the occupation indicators.
Marisol Concha-Barrientos et al. 1753

Many investigators have treated socioeconomic status and sex aspotential confounding variables that require adjustment in statisticalanalysis of MSD etiology. However, to the extent that these factors actthrough or are surrogates for working conditions, both physical and psy-chosocial, such analyses may in fact serve to obscure the role of thoseexposures. Both the incidence and the severity of low back pain showan inverse gradient with socioeconomic status (blue collar vs white collarjobs, income, education level) in both men and women (Bergenudd andNilsson 1988; Broersen et al. 1996; Heistaro et al. 1998).
It seems highly plausible that a large part of the gradient of socioe-conomic status in MSDs is due to differences in the work performed,since jobs with lower socioeconomic status consistently involve morephysically strenuous and repetitive work (Behrens et al. 1994; Hollmanet al. 1999). In a large study of metal working employees, psychosocialconditions at work and physical load were generally correlated with eachother and were worse for blue-collar than for white-collar employees, aswell as for women compared with men (Leino and Hänninen 1995). Ineach of these subgroups, adverse working conditions predicted the devel-opment or worsening of MSDs over a 10-year follow-up period. Theeffect of social class was not explained by “lifestyle” factors such assmoking, leisure-time physical activity, body mass index, alcohol con-sumption or marital status (Leino-Arjas et al. 1998).
Sex differences
Sex is also often described as a “risk factor” for MSDs. In the greatmajority of studies relied on here, either the population was restrictedto one sex or relative risks were adjusted for sex. However, in moststudies of low back pain the prevalence was the same or only slightlyhigher in men than in women (e.g. Behrens et al. 1994; Guo et al. 1995;Morken et al. 2000; Tsai et al. 1992). Skovron et al. (1994) found ahigher prevalence among men than among women aged 20–49 years,whereas from 50 years of age the prevalence in women graduallyincreased relative to that in men. Thus sex is not a strong risk factor forlow back pain in any case, and confounding of these effect estimates isnot of concern.
Women and men typically experience qualitatively and quantitativelydifferent working conditions (Punnett and Herbert 2000). Women areoverrepresented in “light”, monotonous jobs that require precise, repet-itive hand motions with less latitude for decision-making. Men are moreoften found in jobs with heavy whole-body workload, such as manualmaterials handling. In general, once job assignments and the consequentoccupational exposures are taken into account, sex differences becomenegligible (Punnett and Herbert 2000).
1754 Comparative Quantification of Health Risks

Estimates of risk reversibility
Although no explicit studies have been carried out on low back painattributed to occupational factors before retirement, it has been assumedthat leaving the job would reduce the risk of back pain. The burden ofwork-related back pain would diminish gradually once the theoreticalminimum exposure was reached. Since the theoretical minimum is zero,no new cases would arise. However, morbidity from past exposure mightpersist or worsen after retirement (Derriennic et al. 1993; Holte et al.2000; Sobti et al. 1997).
Derriennic et al. (1993) defined a closed cohort of retirees from mixedoccupations in France, with an average elapsed period of six years fromretirement (at age 63) to the baseline survey. A follow-up survey wasconducted after five years. Joint pain was reported by 29% of men and42% of women at baseline. At 11 years post-retirement, the attributablerisk was even higher among men, although it decreased in womenbecause of the high prevalence of joint pain among unexposed persons(Table 21.58).
In summary, there are few or no epidemiological data on whether ornot new back disorders develop after leaving work that can be attrib-uted to ergonomic stressors in previously high-exposed (vs low-exposed)workers. Thus, we have assumed the work-related incidence to be zeroafter retirement from paid employment. However, we do have the highimpact of interventions on exposed workers, which supports a reversibil-ity of 100%. This means that the incidence of low back pain is zero forchronic and acute cases of low back pain after exposure ceases. However,chronic low back pain will continue (i.e. the incidence will be zero, butthose who have already developed it will continue to experience it).
Marisol Concha-Barrientos et al. 1755
Table 21.58 Prevalence and attributable risk of joint pain at 6 and 11years after retirement, among workers with prior exposureto “heavy physical work”
Interview 1 (after 6 years) Interview 2 (after 11 years)
MenExposed 58% 75%Unexposed 49% 57%Attributable risk 15.5% 24.0%
Women Exposed 87% 91%Unexposed 68% 79%Attributable risk 21.8% 13.2%
Source: Derriennic et al. (1993).

Extrapolation of risk factor–disease relationships from one subregion to another
Because occupational group was used as an indicator of the average levelof combined risk factors for low back pain within each occupation, dif-ferences in distribution of risk factors that might exist within occupa-tions or between countries are an important consideration. Risk ratiosamong occupations vary somewhat from one country to another. Thiscould be due to differences in distributions of risk factors for low backpain, or regional or cultural divergences in symptom reporting. Thesediscrepancies become even more difficult to interpret when the compar-isons are made between developing and developed countries. Unfortu-nately, the data are sparse regarding cross-national differences, both inexposure distributions (within similar types of job) and in reporting oflow back pain.
One important element is the extent to which ergonomic interventionshave been implemented in the various countries or regions. Althoughthere are insufficient data to quantify the extent of effective ergonomicprogrammes in each region, it is generally true that occupational healthand safety legislation, enforcement and adaptation of engineering con-trols (ergonomic changes) tend to be more widespread in developedcountries, especially in northern Europe followed by North America. Ifthis is correct, then application of occupation-specific relative risks fromdeveloped countries (e.g. Leigh and Sheetz 1989) to developing countrieswould produce conservative estimates.
Similarly, it would be easy to assume that, because of mechanizationand other changes in production technology, more developed countrieswould typically have fewer ergonomic stressors in the same type of workthan developing countries, even without intention to reduce ergonomicstressors. For example, Bao et al. (1997) compared shoulder-neckergonomic exposures in a Chinese and a Swedish assembly line work-place. The Swedish workplace had a better ergonomic workstationdesign and was better balanced, as well as less sensitive to productionirregularities, than the Chinese workplace. The Swedish operators wereless exposed to awkward postures during work.
However, in contrast to the general assumption that low back painrates should be higher in low-income than in high-income countries, asystematic review by Volinn (1997) showed 2–4 times higher ratesamong Belgian, German and Swedish general populations than amongsouthern Chinese, Philippine, Indonesian and Nigerian farmers. Men-tioning that the prevalence of low back pain is higher in the urban pop-ulations of low-income countries, and sharply higher in enclosedworkshops in low-income countries compared to low-income rural pop-ulations, Volinn suggested that low back pain might be associated withurbanization and rapid industrialization, which imply more repetitivemovements and loss of control over work pace and scheduling. Theauthor noted that interpretation of the findings requires consideration of
1756 Comparative Quantification of Health Risks

the methodological quality of population surveys, such as sampling pro-cedure, formulation of questions, procedures for administration of thesurvey, and nonresponse bias.
Little information on risk of low back pain by occupation is availablefrom developing countries, in particular studies that would pass thequality criteria of the NIOSH or National Research Council reviews.One summary of the literature from China (Jin et al. 2000) reported riskfactors for back pain similar to those reported in developed countries.However, in a comparison of the effect estimates for specific risk factors,the authors found slightly higher prevalence odds ratios (POR) inChinese low back pain studies than other studies (Table 21.59). Alter-native explanations would include unmeasured confounding or effectmodification. Studies on occupational back pain performed in develop-ing countries do generally report prevalences of back pain within speci-fied occupations, but without comparing them to a reference group(Chiou and Wong 1992; Chiou et al. 1994; Joshi et al. 2001; Kumar etal. 1999; Muruka 1998; Omokhodion et al. 2000; Toroptsova et al.1995; Yip 2001). Prevalences were generally high for the studied groups,but the lack of comparison to reference groups did not allow conversioninto relative risk information, which was necessary for this analysis.
In summary, plausible arguments can be and have been advanced in favour of low back pain rates in specific occupational groups (farmers, factory workers, etc.) being both higher and lower in develop-ing countries compared with developed countries, but the available datapermit neither confirmation of this nor quantification of the differencesin risk.
6. Occupational risk factors for injuriesWorkplace injuries are a common hazard for workers. Deaths due tooccupational injuries are defined as any potentially avoidable death due
Marisol Concha-Barrientos et al. 1757
Table 21.59 Comparison of ranges of effect estimates for selected riskfactors for low back pain in some working populations ofChina, India and the Russian Federation
China, India, Russian Federation Developed countriesa
Risk factor Studies (n) POR range Studies (n) POR range
Bending and twistingb 4 3.1–16.5 9 1.3–8.1
Static posturec 5 2.0–19.9 3 1.3–3.3
Whole-body vibrationa 4 2.5–14.2 14 1.5–9.0
Heavy manual lifting 2c 1.4 ~ 3.5 9 1.5 ~ 3.1
a Data taken from National Research Council (2001).b Data taken from Jin et al. (2000) (China).c Summary of data from Ory et al. (1997) (India) and Toroptsova et al. (1995) (Russian Federation).

to an external cause resulting from an exposure related to the person’swork. The definition excludes death during commuting to or from theworkplace. Workers travelling for work purposes are included.
Data in developed countries indicate that differential risks for injuryexist by sector, being highest in agriculture and production, less in salesand service, and lowest in professional, administrative and clericalsectors. But similar data are unavailable for developing countries. At thesame time, occupational registries provide some indication of injury out-comes—vs risk factor exposure—which can be used to assess the mor-tality associated with occupational factors. Applying the fatality ratesdue to occupational injuries per 100 000 insured workers (Table 21.60)to the number of persons in the EAP, as defined earlier in the chapter,gives an indication of total deaths from injuries among workers. Therates reported here for fatal injuries were reported in most countries onlyfor insured populations. Thus, we made the assumption that the samerates applied to all in the EAP, whether or not they were insured, despitesome evidence that fatality rates are higher in uninsured populations(Dror 2001; Forastieri 1999; Loewenson 1998). Unfortunately, there isa lack of adequate data on work-related injuries in developing countriesto make it possible to generate plausible rates for economic sectors by age, sex and subregion. Mortality outcomes were distributed in thesame age pattern as reported in the United States for unintentionalinjuries.
Because no risk factor exposure is defined in this approach, the coun-terfactual risk (e.g. theoretical minimum risk level) was defined based onthe outcome rather than risk factor exposure. To approximate the safestworking conditions observed where all avoidable injury hazards are con-trolled by effective preventive measures, we chose the injury fatality rateof 0.1 (per 100 000 workers) in the age group 16–17 years and in theoccupation category “service” from the National Traumatic Occupa-tional Fatalities surveillance system for the United States for the period1980–1995 (Marsh and Layne 2001).
6.1 Outcomes considered
The outcomes considered were unintentional injuries, which includemotor vehicle accidents, poisonings, falls, fires, drownings and the cate-gory “other unintentional injuries”. Other unintentional injuries com-prise exposure to inanimate mechanical forces, exposure to mechanicalforces, other accidental threats to breathing, exposure to electric current,radiation and extreme ambient air temperature and pressure, contactwith venomous animals and plants, exposure to forces of nature andaccidental exposure to other and unspecified factors. Homicide at theworkplace was not assessed owing to a complete lack of data from devel-oping countries. To estimate the impact of the disability produced bynonfatal injuries, years lived with disability (YLD) were estimated using
1758 Comparative Quantification of Health Risks

Marisol Concha-Barrientos et al. 1759
Table 21.60 Fatality rates due to occupational injuries (per 100000insured workers) by country and year
Fatality rate Country Year(s) per 100000 Source
Australia 1982–1984 8.06 Harrison et al. (1989)1998–1999 4.0 Worker’s Compensation Cases
(NOSHC 2002)
Austria 1998 5.3 ILO (2000)
Bolivia 1995 3.7 PAHO/WHO (1998)
Brazil 1995 13.3 PAHO/WHO (1998)
Canada 1970–1997 8.79 Human Resources Development Canada (2000)
China 1997 11.1 Kam Lam (2000) 1991–1997 9.1 (1991–1997); Xia et al. (2000)
11.5 (1997)
Costa Rica 1996 10.5 PAHO/WHO (1998)
Cuba 1996 4.2 PAHO/WHO (1998)
Czech Republic 1999 4.2 ILO (2000)
Denmark 1999 2 ILO (2000)
Dominican Republic 1996 6.3 PAHO/WHO (1998)
El Salvador 1996 4.7 PAHO/WHO (1998)
European Union 1998 5.03 Dupre (2001)
Finland 1997 3.1 ILO (2000)
Ireland 1999 4.21 ILO (2000)
Jamaica 1996 11.8 PAHO/WHO (1998)
Jordan 1980–1993 25.5 Atallah et al. (1998)
Mexico 1996 10.4 PAHO/WHO (1998)
Namibia 1998/1999 25 Amweelo (2000)
New Zealand 1985–1994 5.03 Feyer et al. (2001)
Panama 1996 14.5 PAHO/WHO (1998)
Peru 1996 190 PAHO/WHO (1998)
Philippines 1999 11 National Statistics Office Philippines (2000)
Poland 1999 4.5 ILO (2000)
Slovenia 1998 4 ILO (2000)
Singapore 2000 10.82 Singapore Government (2000)
Spain 2000 9.2 Ministerio de Trabajo y Asuntos Sociales (2002)
Sweden 1998 1.7 ILO (2000)
Thailand 1999 11.48 ILO (2000)
United Kingdom 1998 0.8 ILO (2000)
United States 1980–1995 4.25 NIOSH (2000a)
Venezuela 1997 0.58 ILO (2000)

the same attributable fractions as for mortality (age and sex) (i.e. it wasassumed that an occupational injury had the same likelihood of beingfatal as injuries caused by other factors).
6.2 Underreporting
Conventional sources of data on fatal injuries at work are compensationregistries, insurance companies, death certificates and autopsy reportsbased on mortuary records. Data from compensation registries andinsurance companies underestimate the magnitude of fatal injuries, eitherbecause they do not cover some sectors of the workforce or because theyrefer only to successful claims. To improve the accuracy of the reportingof fatal injuries at work, many countries gather data from differentsystems and data sources (death certificates, insurance companies, labourinspectorates, coroners’ files, medical examiners’ files) or develop spe-cific projects. Wide disparities exist regarding the accuracy of thesesources in identifying fatal injuries at work.
Despite the usefulness of the death records, data from the UnitedStates reveal that such records identify only between 67% and 90% offatal injuries at work. A similar underreporting (72.3%) has been foundin the Mortality Registry of Tuscany in Italy (Chellini et al. 2002). Theonly study in a developing country that analysed underreporting showedthat 28% of occupational fatalities in Cape Town, South Africa had notbeen reported in terms of statutory regulations (Lerer and Myers 1994).The level of underreporting increases to between 78% and 85% in ruralareas (Schierhout et al. 1997). On the other hand, special registries alsounderreport; the National Fund for Occupational Diseases in Italy, forexample, has a reporting rate of only 56.4% (Chellini et al. 2002).
To our knowledge, the most accurate system currently in place thatuses multiple data sources to identify and classify work-related injuriesis in the United States. Data are gathered from death certificates in twosurveillance systems: the National Traumatic Occupational FatalitySystem (NTOF) of NIOSH and in the Bureau of Labor Statistics CFOIsystem. Thus it would appear that the United States has fairly completerecords of occupational deaths due to injury (CDC 2001). Although,owing to paucity of data, we did not use the estimates of underreport-ing to calculate the rates of fatal injuries due to risks at work, this doesindicate likely underestimation.
7. ResultsTables 21.61–21.63 present the overall attributable fractions, mortalityand burden of disease for the selected occupational risk factors consid-ered here.
In total, occupational risk factors considered here were responsible for775000 deaths worldwide in 2000. There were five times as many deathsin males as in females: 647000 vs 128000. The leading occupational
1760 Comparative Quantification of Health Risks

Marisol Concha-Barrientos et al. 1761
Table 21.61 Attributable fractions (%) for the disease burden due tooccupational exposure
Risk factor Outcome Males Females Total
Ergonomic stressors Low back pain 41 32 37
Noise Hearing Loss 22 11 16
Agents leading to COPD COPD 18 6 13
Asthmagens Asthma 14 7 11
Risk factors for injuries Unintentional injuries 12 2 8
Beryllium, cadmium, chromium, Trachea, bronchus or 10 5 9diesel exhaust, nickel, arsenic, lung cancerasbestos, silica
Benzene, ethylene oxide, Leukaemia 2 2 2ionizing radiation
Table 21.62 Deaths (000s) due to occupational exposurea
Total
% total from occupational
Risk factor Outcome Males Females Deaths risk factors
Agents leading to COPD COPD 240 78 318 41
Risk factors for injuries Unintentional injuries 291 19 310 40
Beryllium, cadmium, Trachea, bronchus or 88 14 102 13chromium, diesel lung cancerexhaust, nickel, arsenic,asbestos, silica
Asthmagens Asthma 23 15 38 5
Benzene, ethylene oxide, Leukaemia 4 3 7 1ionizing radiation
Total 647 128 775 100
a Asbestos exposure is the most important cause of mortality from mesothelioma. Cause-of-deathstatistics coded in ICD-10 allow direct estimation of the total number of mesothelioma deaths. Usingthis method, recent studies suggest that each year there are about 700 malignant mesothelioma deathsin Australia (Leigh and Driscoll 2003), 700 in Japan (Furuya et al. 2003), 2600 in the United States (Priceand Ware 2004), and 4000 in Europe (Peto et al. 1999). A large proportion of these deaths areundoubtedly caused by asbestos exposure, primarily work-related. Combining estimates of asbestosexposure in all 14 subregions with hazards obtained from these studies would result in an estimate ofmore than 40 000 mesothelioma deaths caused by asbestos exposure in the world. Of these preliminaryestimates, about 9000 occur in developed countries (AMR-A, EUR and WPR-A), 9 000 in SEAR-D, and16 000 in WPR-B. These estimates are subject to uncertainty, especially in developing countries whereICD-10 cause-of-death data and detailed data on history of asbestos exposure are not available. Thesepreliminary estimates are currently undergoing further refinement by authors. Preliminary estimates alsoindicate that there may have been approximately 9000 deaths from silicosis, 7000 deaths from asbestosisand 14 000 deaths from coal workers’ pneumoconiosis as a result of exposure to occupational dusts(silica, asbestos and coal dust) in 2000.

1762 Comparative Quantification of Health Risks
Table 21.63 DALYs (000s) due to occupational exposure
Total
% total from occupational
Risk factor Outcome Males Females DALYs risk factors
Risk factors for injuries Unintentional injuries 9779 718 10496 48
Noise Hearing Loss 2788 1362 4150 19
Agents leading to COPD COPD 3020 713 3733 17
Asthmagens Asthma 1110 511 1621 7
Beryllium, cadmium, Trachea, bronchus or 825 144 969 4chromium, diesel lung cancerexhaust, nickel, arsenic,asbestos, silica
Ergonomic stressors Low back pain 485 333 818 4
Benzene, ethylene oxide, Leukaemia 66 35 101 0ionizing radiation
Total 18073 3816 21889 100.0
cause of death was COPD (41%) followed by unintentional injuries(40%) and trachea, bronchus or lung cancer (13%). Workers who devel-oped outcomes related to occupational risk factors lost about 22 millionyears of healthy life. By far the main cause of years of healthy life lost,within occupational diseases, was unintentional injuries (with 48% ofthe burden). This was followed by hearing loss due to occupational noise(19%) and COPD due to occupational agents (17%). Among the occu-pational factors analysed in this study, these three conditions accountedfor 84% of years of healthy life lost. DALYs were almost five timesgreater in males than in females. Low back pain and hearing loss havein common the fact that they do not directly produce premature mor-tality, but substantial disability. This feature differentiates these condi-tions from the others analysed in the study. Results for specific riskfactors are provided below.
7.1 Carcinogens
Tables 21.64–21.68 summarize the attributable fractions, mortality andburden of disease for the occupational carcinogens considered here.
For lung cancer, the attributable fraction varied from 5% in AMR-Ato 14% in EUR-C, with overall attributable fractions for lung cancerestimated to be 10% for men and 5% for women (9% overall). Forleukaemia, estimates of the attributable fraction varied from 1% inEMR-D to 3% in several subregions. There were estimated to be approx-imately 7000 deaths from leukaemia each year, with a much more evenproportion between males and females than was seen for lung cancer,although approximately two thirds of the DALYs are due to male cases.

Marisol Concha-Barrientos et al. 1763
Table 21.64 Attributable fractions for lung cancer and leukaemia diseaseburden caused by workplace exposure
Lung cancer Leukaemia
Subregion Males Females Total Males Females Total
AFR-D 9 4 7 3 1 2
AFR-E 9 4 7 3 2 3
AMR-A 6 2 5 3 3 3
AMR-B 11 3 8 2 2 2
AMR-D 12 2 8 3 2 3
EMR-B 12 2 9 3 2 2
EMR-D 9 3 7 2 1 1
EUR-A 7 2 6 3 3 3
EUR-B 12 4 10 3 2 3
EUR-C 15 9 14 2 2 2
SEAR-B 10 4 9 2 2 2
SEAR-D 11 4 9 2 0 2
WPR-A 8 3 6 2 2 2
WPR-B 12 7 10 2 2 2
World 10 5 9 2 2 2
Table 21.65 Deaths (000s) from lung cancer and leukaemia caused byworkplace exposure
Lung cancer Leukaemia
Subregion Males Females Total Males Females Total
AFR-D 1 0 1 0 0 0
AFR-E 1 0 1 0 0 0
AMR-A 7 2 8 0 0 1
AMR-B 4 0 4 0 0 0
AMR-D 0 0 0 0 0 0
EMR-B 1 0 1 0 0 0
EMR-D 1 0 1 0 0 0
EUR-A 11 1 12 1 0 1
EUR-B 6 0 6 0 0 0
EUR-C 12 1 14 0 0 0
SEAR-B 3 0 3 0 0 0
SEAR-D 11 1 12 0 0 1
WPR-A 3 0 4 0 0 0
WPR-B 27 7 34 1 1 2
World 88 14 102 4 3 7

1764 Comparative Quantification of Health Risks
Table 21.67 Age-specific attributable fractions, deaths and DALYs forlung cancer and leukaemia, males
Age group (years)
15–29 30–44 45–59 60–69 70–79 80–89 All ages
Attributable fractions (%)Lung cancer 11 11 10 10 10 9 10Leukaemia 3 3 3 3 3 3 2
Deaths (000s)Lung cancer 0 3 20 30 26 8 88Leukaemia 1 1 1 1 1 0 4
DALYs (000s)Lung cancer 10 76 306 279 136 18 825Leukaemia 29 13 11 7 4 1 66
Table 21.66 DALYs (000s) due to lung cancer and leukaemia caused byworkplace exposure
Lung cancer Leukaemia
Subregion Males Females Total Males Females Total
AFR-D 6 1 7 2 1 3
AFR-E 9 2 11 4 2 6
AMR-A 53 13 65 4 3 7
AMR-B 34 4 38 4 4 8
AMR-D 2 0 2 2 1 2
EMR-B 10 1 11 2 1 3
EMR-D 14 2 16 3 1 4
EUR-A 89 9 99 6 4 10
EUR-B 60 5 65 3 2 5
EUR-C 127 14 140 2 2 4
SEAR-B 32 3 34 3 2 5
SEAR-D 109 11 120 10 1 11
WPR-A 23 3 26 1 1 2
WPR-B 257 76 333 19 11 30
World 825 144 969 66 35 101
For each condition, deaths were predominantly among older persons upto 79 years, whereas DALYs tended to be highest in the younger agegroups.
7.2 Nonmalignant respiratory diseases
Tables 21.69–21.74 summarize the attributable fractions, mortality anddisease burden for asthma and COPD risk factors, each estimated asdescribed earlier.

Marisol Concha-Barrientos et al. 1765
Table 21.68 Age-specific attributable fractions, deaths and DALYs forlung cancer and leukaemia, females
Age group (years)
15–29 30–44 45–59 60–69 70–79 80–89 All ages
Attributable fractions (%)Lung cancer 5 5 5 5 4 4 5Leukaemia 2 3 3 3 3 3 2
Deaths (000s)Lung cancer 0 1 3 4 4 2 14Leukaemia 0 0 0 0 1 1 3
DALYs (000s)Lung cancer 3 19 52 41 25 4 144Leukaemia 10 8 8 4 3 1 35
Table 21.69 Attributable fractions (%) for mortality from asthma andCOPD caused by workplace exposure
Asthma COPD
Subregion Males Females Total Males Females Total
AFR-D 21 15 18 16 5 11
AFR-E 23 18 20 16 5 11
AMR-A 15 9 11 18 3 11
AMR-B 20 8 13 17 3 11
AMR-D 19 7 13 15 2 9
EMR-B 18 5 12 17 2 11
EMR-D 20 10 16 17 3 11
EUR-A 16 7 11 19 4 13
EUR-B 22 14 18 19 6 14
EUR-C 21 12 18 21 6 16
SEAR-B 23 14 18 18 6 13
SEAR-D 23 14 18 16 5 11
WPR-A 17 9 13 21 5 16
WPR-B 22 16 19 19 7 12
World 21 13 17 18 6 12
It was estimated that 38000 deaths (23000 men and 15000 women)and 1.6 million DALYs result from occupational asthma each year. One quarter to one third of the asthma deaths and DALYs occurred in SEAR-D. The attributable fraction for mortality from asthma varied between subregions from 11% in AMR-A and EUR-A to 20% in AFR-E, with worldwide attributable fractions estimated to be 21%for men and 13% for women (17% overall). The overall attributable

1766 Comparative Quantification of Health Risks
Table 21.71 Numbers of deaths (000s) from asthma and COPD causedby workplace exposure
Asthma COPD
Subregion Males Females Total Males Females Total
AFR-D 1 1 2 4 1 6
AFR-E 2 1 3 5 1 7
AMR-A 0 0 1 12 2 14
AMR-B 1 0 1 8 1 9
AMR-D 0 0 0 0 0 0
EMR-B 0 0 0 1 0 1
EMR-D 2 1 2 7 1 8
EUR-A 1 1 1 16 2 18
EUR-B 1 1 2 5 1 7
EUR-C 2 1 3 12 2 15
SEAR-B 2 2 4 8 1 9
SEAR-D 7 5 12 47 13 60
WPR-A 1 0 1 3 0 4
WPR-B 3 3 6 109 52 161
World 23 15 38 240 78 318
Table 21.70 Attributable fractions (%) for burden of disease (DALYs) forasthma and COPD caused by workplace exposure
Asthma COPD
Subregion Males Females Total Males Females Total
AFR-D 11 7 10 16 5 11
AFR-E 13 9 11 16 5 12
AMR-A 9 4 7 18 3 11
AMR-B 12 4 8 17 3 10
AMR-D 11 3 7 13 1 7
EMR-B 11 2 7 17 2 12
EMR-D 14 6 10 17 3 11
EUR-A 11 4 8 19 4 12
EUR-B 15 8 12 19 6 13
EUR-C 18 8 14 21 6 14
SEAR-B 16 9 13 18 6 13
SEAR-D 17 10 13 16 5 11
WPR-A 12 5 9 21 5 14
WPR-B 15 9 12 19 7 14
World 14 7 11 18 6 13

Marisol Concha-Barrientos et al. 1767
Table 21.72 DALYs (000s) from asthma and COPD caused by workplaceexposure
Asthma COPD
Subregion Males Females Total Males Females Total
AFR-D 63 27 90 43 10 53
AFR-E 84 56 141 57 12 69
AMR-A 37 15 51 147 21 168
AMR-B 98 27 125 115 17 132
AMR-D 16 4 19 6 0 6
EMR-B 18 3 21 20 1 20
EMR-D 74 27 100 75 13 87
EUR-A 41 14 55 176 29 205
EUR-B 30 13 43 75 19 94
EUR-C 32 9 41 135 34 169
SEAR-B 44 26 70 90 21 111
SEAR-D 310 166 476 552 149 701
WPR-A 23 9 33 44 9 53
WPR-B 241 115 356 1485 378 1862
World 1110 511 1621 3020 713 3733
Table 21.73 Age-specific mortality attributable fractions, deaths andDALYs for asthma and COPD, males
Age group (years)
15–29 30–44 45–59 60–69 70–79 80–89 All ages
Attributable fractions (%)Asthma 23 23 23 22 22 21 21COPD 17 18 18 18 18 19 18
Deaths (000s)Asthma 3 4 6 4 4 2 23COPD 0 3 29 56 91 62 240
DALYs (000s)Asthma 670 228 144 43 20 5 1110COPD 88 564 992 710 517 149 3020
fraction for asthma morbidity plus mortality was about two thirds of that for mortality, reflecting the fact that globally a great deal ofasthma occurs at younger ages and is nonfatal and nonoccupational inorigin.
For COPD mortality, the attributable fraction varied between subre-gions from 9% in AMR-D to 16% in EUR-C and WPR-A (Table 21.69).

Worldwide attributable fractions for COPD were estimated to be 18%for men and 6% for women (12% overall). Overall attributable frac-tions (based on DALYs and reflecting mortality and morbidity) were verysimilar to the mortality-based fractions (see Tables 21.69 and 21.70).The estimated number of deaths is almost an order of magnitude higherfor COPD than for asthma, with an estimated 318000 deaths (240000men and 78000 women) and 3.7 million DALYs resulting from occu-pational COPD each year. Half of the COPD deaths and half of theDALYs occurred in WPR-B, owing in part to the large population of thesubregion, high background COPD mortality rates and the relativelyhigh employment in mining.
For both asthma and COPD, males predominated. Compared tofemales, males had nearly 50% higher attributable fraction for asthmamortality and three times that for COPD mortality. The ratio was abouttwo for disease burden. Similar ratios were seen for the estimatednumbers of deaths and DALYs due to these conditions. Asthma deathswere fairly evenly spread among all age groups from 30 to 79 years ofage, whereas DALYs predominantly involved persons aged 30–59 years.For COPD, the majority of deaths occurred in persons aged ≥60 years,whereas DALYs were more evenly spread among all age groups from 30 to 79 years of age (see Tables 21.73 and 21.74).
7.3 Noise
Occupational noise-induced hearing loss accounted for more than fourmillion DALYs, all of them produced by the disability associated withhearing loss (YLD). Worldwide, the burden of hearing loss attributed tooccupational noise is 16%, ranging between 7% in WPR-A and 21% inWPR-B. By sex, the effects of exposure to occupational noise are largerfor males than for females in all subregions (Table 21.75). Attributablefractions are related to age group and sex in all subregions. Males usually
1768 Comparative Quantification of Health Risks
Table 21.74 Age-specific mortality attributable fractions, deaths andDALYs for asthma and COPD, females
Age group (years)
15–29 30–44 45–59 60–69 70–79 80–89 All ages
Attributable fractions (%)Asthma 13 14 14 13 13 12 13COPD 6 5 5 6 6 6 6
Deaths (000s)Asthma 2 3 4 2 2 2 15COPD 0 1 6 13 28 30 78
DALYs (000s)Asthma 228 95 81 28 15 5 511COPD 45 133 149 152 166 69 713

experience greater exposure to noise at work than females, owing to dif-ferences in occupational categories, economic sectors of employment andworking lifetime. In this study, the attributable fraction decreased withage group after 30–44 years, indicating the heavy impact of occupationalnoise on the burden of hearing loss at younger ages (Table 21.76). The30–44-year age group accounted for the highest number of DALYs andthe 70–79-year age group for the lowest (1673000 vs 32000).
Table 21.77 provides estimates of the number of DALYs (in thou-sands) produced by occupational noise-induced hearing loss by subre-gion in the year 2000. Overall, four million DALYs were lost owing tonoise-induced hearing loss. SEAR-D and WPR-B accounted for more
Marisol Concha-Barrientos et al. 1769
Table 21.75 Attributable fractions of occupational noise-induced hearingloss, by sex and subregion
Subregion Males Females All
AFR-D 23 11 17
AFR-E 23 12 18
AMR-A 12 5 9
AMR-B 19 9 15
AMR-D 18 9 14
EMR-B 20 9 15
EMR-D 20 13 16
EUR-A 13 5 9
EUR-B 24 13 19
EUR-C 24 13 18
SEAR-B 23 16 19
SEAR-D 24 9 16
WPR-A 9 6 7
WPR-B 26 15 21
World 22 11 16
Table 21.76 Attributable fractions (%) and DALYs (000s) for occupational noise-induced hearing loss, by age group
Age group (years)a
15–29 30–44 45–59 60–69 70–79 Total
Males Females Males Females Males Females Males Females Males Females Males Females All
Attributable 29 16 29 16 21 11 13 6 3 1 22 11 16fraction
DALYs 425 206 1 144 530 925 482 271 136 23 9 2 788 1 362 4 151
a AF was set to zero for ≥80.

1770 Comparative Quantification of Health Risks
Table 21.78 Attributable fraction and DALYs of low back pain due tooccupational ergonomic stressors, by sex and subregion
AF (%) DALYs (000s)
Subregion Males Females All Males Females All
AFR-D 36 29 33 21 16 37
AFR-E 36 31 33 25 20 45
AMR-A 35 25 30 17 10 27
AMR-B 41 23 33 32 15 47
AMR-D 34 18 27 4 2 6
EMR-B 31 12 22 9 3 12
EMR-D 36 25 31 25 16 41
EUR-A 34 22 29 21 11 32
EUR-B 43 37 40 18 12 30
EUR-C 45 36 41 21 14 34
SEAR-B 43 34 39 26 19 46
SEAR-D 43 34 38 111 78 189
WPR-A 38 27 33 9 5 14
WPR-B 44 38 41 146 110 256
World 41 32 37 485 333 818
Table 21.77 DALYs (000s) due to occupational noise-induced hearingloss, by sex and subregion
Subregion Males Females All
AFR-D 109 49 157
AFR-E 127 60 186
AMR-A 92 31 123
AMR-B 122 43 165
AMR-D 15 6 20
EMR-B 60 21 81
EMR-D 142 88 230
EUR-A 117 47 164
EUR-B 92 50 142
EUR-C 136 92 228
SEAR-B 219 185 404
SEAR-D 799 303 1101
WPR-A 26 22 48
WPR-B 735 365 1100
World 2788 1362 4151

than half of the years of healthy life lost (1.1 million each in SEAR-Dand WPR-B). Males lost twice the number lost by females (2788000 vs1362000).
7.4 Ergonomic factors
The attributable fractions for low back pain ranged from 22% to 41%among the subregions (Table 21.78). Differences by age group were quitesmall, and the attributable fractions for the total working population(ages 15–65 years) were rather consistent. In most geographical regions,women have a lower attributable burden of low back pain than men,although the difference is most pronounced in the eastern Mediterraneanregion and the less developed countries in the Americas.
Occupational ergonomic stressors caused 818000 DALYs due to lowback pain in 2000 (Table 21.78). Globally, 37% of low back pain wasattributable to occupational causes. The occupational contribution to theburden of low back pain varied relatively little between subregions, with22% being the lowest (EMR-B) and 41% the highest (EUR-C and WPR-B). The attributable fraction in men (41%) was slightly higher than thatin women (32%), which is mainly due to the type of work men perform,involving more vibration, heavy physical loads or handling of materials.
7.5 Risk factors for injuries
Work-related risk factors for unintentional injuries represent 8% of theburden of unintentional injuries. In all regions, the highest attributablefractions were found in males, reflecting the high number of malesexposed to hazardous conditions in the workplace. Overall, the attrib-utable fraction for males was 12% and for women 2%. Occupationalinjuries were responsible for 310000 deaths (291000 males and 19000females).
In 2000, there were 10496000 years of healthy life (DALYs) lostamong exposed workers (Table 21.79). Overall, males lost about 90%of healthy life years owing to unintentional injuries at work.
8. DiscussionWe have attempted to estimate the burden of disease due to selectedoccupational risk factors by considering exposure, rather than the
Marisol Concha-Barrientos et al. 1771
Table 21.79 Summary results describing the global burden ofoccupational injuries
Measure Males Females Total
Attributable fraction for disease burden (%) 12 2 8
Deaths (000s) 291 19 310
DALYs (000s) 9779 718 10496

common actuarial approach. In this study, a methodology based on theEAP, economic sectors and subsectors and occupational categories wasdeveloped to quantify the exposure. Assignment of exposure (low/high)within these categories allowed us to make estimations about the amountof exposure to a given risk factor or groups of risk factors causing anoutcome. The dominant source of uncertainty in this analysis was char-acterizing exposure, which was solely based on economic subsectorsand/or occupations and involved a large number of extrapolations and assumptions. High-quality exposure data are lacking, especially indeveloping countries, and European and American exposure estimateswere thus applied in many instances in developing regions (B, C, D andE subregions). This extrapolation could have substantial impact on theaccuracy of analysis for the developing regions if exposures, as usuallyoccur, vary from place to place and over time. Diseases with long latency (e.g. cancers) are those that are more susceptible to the assump-tions and extrapolations. In addition to problems produced by the length of the latency period, the magnitude of the excess risk may varydepending on the age of the person when exposure began, the durationand strength of exposure and other concomitant exposures. The turnoverof workers is another problem that affects both exposure and risk assessment.
The accuracy of the exposure data is fairly coarse because exposuresvary greatly within an occupation. This indirect estimation of exposuremay cause misclassification of the true exposure situation. The propor-tions of exposed workers with high exposure in the A and in the B, C,D and E subregions were less than the published data would indicate.This may be partly because the published literature often focuses onindustries and/or occupations with high exposure, but may also indicatean underestimation of true exposure.
Sources of uncertainty in hazard estimates (relative risk and mortal-ity rates) include variations determined from the literature (once againcaused by the use of different exposure proxies), extrapolations toregions with different working conditions, the application to females ofrisk measures from male cohorts, and the application of the same rela-tive risk values to all age groups (e.g. carcinogens).
Restricting the analysis to persons aged ≥15 years excludes the quan-tification of child labour. The exclusion of children in the estimation wasdue to the wide variation in the youngest age group for which countriesreported EARs. In addition to inconsistent data on EARs for children,there was virtually no data available on their exposure to occupationalrisk factors or the relative risks of such exposures. Specific, focusedresearch on children is needed to quantify the global burden of diseasedue to child labour and the resulting implications.
Owing to lack of global data, we could not analyse occupational con-tributions to the global burden of infectious diseases, cardiovascular dis-
1772 Comparative Quantification of Health Risks

orders, MSDs of the upper extremities, skin disorders and other condi-tions with recognized occupational etiologies.
8.1 Occupational carcinogens
For each condition, deaths were predominantly in older persons up to79 years, whereas DALYs tended to be highest in the younger age groups.The estimated overall attributable fractions for lung cancer of 10% formen and 5% for women (9% overall) are similar to those from a recentUnited States study, based on a review of relevant studies, in which theattributable fraction for lung cancer was estimated to be between 6%and 17% for men, and to be about 2% for women (Steenland et al.2003). A similar Finnish study used estimates of 29% (men) and 5%(women) but these included a contribution from environmental tobaccosmoke, which the study estimated to be about 2% or 3% (Nurminenand Karjalainen 2001). (The United States study did not include any con-tribution from environmental tobacco smoke, but separately estimatedthe contribution of workplace environmental tobacco smoke to be 5.7%[Steenland et al. 2003]).
The estimated 2% attributable fraction for leukaemia compares with0.8–2.8% for the United States (Steenland et al. 2003) and 18% (men)and 2% (women) for Finland (Nurminen and Karjalainen 2001). Thehigher Finnish estimate seems to arise from the inclusion of occupationalexposure to electromagnetic fields, from the reliance on different studiesfor relative risk estimates, and from the exposure patterns in the Finnishpopulation.
8.2 Nonmalignant respiratory diseases
Many of the issues relevant to a discussion of the results for particulatesare also relevant to carcinogens, and were discussed in detail under thatrubric. The estimated attributable fractions for asthma mortality of 21%for men and 13% for women (17% overall) are similar to those fromtwo recent reviews, both of which found an occupational attributablefraction of 15% (Balmes et al. 2003; Blanc and Toren 1999). The Finnishstudy on which most of the occupational relative risk estimates used inthis study were based had higher estimates for men (29%) and women(17%) (Karjalainen et al. 2002), but these estimates are based on Finnishworkforce patterns, which are likely to differ from those in most othercountries.
Estimates of the attributable fraction for COPD mortality variedbetween subregions from 9% to 16%. The overall value of 12% is veryclose to the few published estimates of occupational attributable frac-tion for COPD of 14% in the United States (Steenland et al. 2003, basedon Korn et al. 1987), 14% for men and 5% for women in Finland (Nurminen and Karjalainen 2001) and 15% in a recent review by theAmerican Thoracic Society (Balmes et al. 2003).
Marisol Concha-Barrientos et al. 1773

8.3 Noise
Occupational noise-induced hearing loss accounted for more than fourmillion DALYs, all of them produced by the disability associated withhearing loss (YLD). Worldwide, the burden attributed to occupationalnoise is 16%, ranging between 7% in WPR-A and 21% in WPR-B. Bysex, the effects of exposure to occupational noise are larger for malesthan for females in all subregions. The attributable fraction decreasedwith age group after 30–44 years, indicating the heavy impact of occu-pational noise on the burden of hearing loss at younger ages.
In addition to causing irreversible hearing loss, high noise levels in theworkplace cause elevated blood pressure, sleeping difficulties, annoyanceand stress. Our findings indicate that occupational noise has multipleconsequences, both for the individual and for society, and particularlyfor those suffering hearing loss at young ages. Most occupational noiseexposure can be minimized by the use of engineering controls to reducethe generation of noise at its source, within complete hearing loss pre-vention programmes that include noise assessment, audiometric moni-toring of workers’ hearing, appropriate use of hearing protectors andworker education.
8.4 Ergonomic factors
Human capacity for work depends on many functions and attributes:body size, muscle strength, aerobic fitness, sensory perception and cog-nitive capacity. Features of the work environment that do not accom-modate these needs may produce physical or psychosocial stressors onthe human system. Work features that have received attention becauseof their adverse health effects include heavy manual handling and othertypes of strenuous work, and awkward body postures.
For this analysis, the exposure variable was work in an occupationalcategory with its assigned level of risk (low, medium or high rate of lowback pain). This exposure variable is the “proxy” for the combinationof occupational exposures found in the specified occupation that areimplicated in the etiology of low back pain.
Occupational ergonomic stressors caused 818000 DALYs from lowback pain in 2000. The attributable fractions of low back pain rangedfrom 22% to 41% among subregions, with the global fraction amount-ing to 37%. The African countries had the highest attributable fractionof low back pain for all age groups analysed. Fractions of 40% or abovewere reached in EUR-B and EUR-C and in SEAR-B. The attributablefraction in men (41%) was slightly higher than that in women (32%),which is mainly due to the type of work men perform, involving morevibration, heavy physical load or material handling. Subregional varia-tions reflect differences in occupational types and exposure. Over half ofthe working population in AFR-D and AFR-E was employed in agricul-ture. In contrast, about one third of the working populations in the AMR
1774 Comparative Quantification of Health Risks

and EUR subregions were employed in production occupations (“oper-ators”) and another large fraction (40% or more) in professional, salesand clerical jobs. In general, males are more exposed than femalesbecause they constitute a higher proportion of the labour force. In theless developed subregions, males are generally more exposed because ofthe higher proportions of workers in formal agriculture than in the devel-oped subregions. The proportion of females in the labour force was par-ticularly low in EMR-B and EMR-D.
The available literature demonstrates the feasibility and benefits ofworkplace ergonomic interventions (training and engineering controls)that have been implemented by employers in numerous economic sectors.Effective abatement measures include redesigning workstations to elim-inate the need for bending and twisting; installing material or patienthoists and other lifting devices; a greater variety of work tasks, to avoidrepetitively loading the same body tissues; and improving the mechani-cal isolation of seating to reduce transmission of whole-body vibration.Training programmes are most effective when they address job design,target supervisory and management personnel along with the manuallabour force, and take place in a setting where workers are empoweredto utilize the knowledge imparted. In general, the coordination of mul-tiple activities—workstation improvements, training, enhanced medicalsurveillance and management—within an intervention programmeappears to be the most effective. This is consistent with the conclusionsof Shannon et al. (1996, 1997) that lower injury rates are associated withworkplace characteristics such as general workforce empowerment andtop management’s active leadership, together with delegation of decision-making authority regarding occupational safety.
8.5 Risk factors for injuries
To our knowledge, this is the first study to estimate attributable fractionsof work-related risk factors for unintentional injuries within the overallburden of DALYs. Lack of data on exposure did not allow a risk basedapproach and the estimates were based on occupational injury registries.This will limit the applicability of these estimates to preventive purposeswhich are based on exposure. Our findings show that the overall attrib-utable fraction of 9% reported in this study is above the upper range ofvalues reported by Chen et al. (2001) in the United States. Chen et al.reported an overall attributable fraction of 3.8%, varying between 1.5%in Arizona and 9.8% in Alaska. The difference in the findings betweenthe two studies is explained by the heavy burden of mortality in theDALY estimation in developing countries, especially when deaths occurin younger populations.
Our findings understate the importance of the impact of occupationalrisk factors leading to injuries in the overall burden of disease due toinjuries. A major factor in the underestimation was our use of data froman insured population from one country. There is some evidence that
Marisol Concha-Barrientos et al. 1775

mortality can be greater in uninsured populations, but in the absence of consistent evidence, a similar mortality in the insured and uninsuredpopulations was assumed (Dror 2001; Forastieri 1999; Loewenson1998). Lerer and Myers (1994) found that 28% of occupational fatali-ties in Cape Town, South Africa, were not reported despite a statutoryrequirement to do so. Using this fraction, we may have missed about 100000 occupational injury deaths due to underreporting. Also, we didnot estimate the injury mortality due to intentional injuries such as homi-cides in the workplace, owing to the lack of data from developing coun-tries. However, current evidence shows that intentional injuries must bepresent in such countries; thus the lack of an estimation of deaths due tothis cause increases the degree of underestimation of the number of deathsdue to injuries (e.g. by approximately 4% in Australia and New Zealand).
Analysis of the full contribution of injuries at work within the overallburden of injuries requires indicators that measure not only mortalitybut also morbidity. In some countries and regions, with constant orslightly decreasing mortality patterns, it has been observed that thedecline in mortality is balanced by an increase in the severity of injuriesand morbidity, especially long-lasting or permanent disabilities (CDC2001; Guerrero et al. 1999). In these cases, evaluation of the effective-ness of preventive measures is also hampered.
Injuries are largely preventable by improvements to make work saferand healthier. Engineering controls, administrative policies, health andsafety information and education to promote safety-conscious attitudesand behaviour are needed. Surveillance data must be developed toprovide the basis for targeting preventive measures towards high-riskgroups of workers. The distribution of burden by type of external causeof mortality has allowed the developed countries to focus on preventiveactions at work, resulting in a reduction in injury rates over time. Similaranalysis and preventive actions in other countries could greatly reduceinjuries at the workplace.
8.6 Conclusion
The aim of this study was to estimate the attributable fractions ofselected occupational exposures. The risk factors were selected accord-ing to the availability of data, the strength of evidence linking the occu-pational exposure and the outcome, and the amount of risk arising fromthe exposure. An important feature of these risk factors and the result-ing disease burden is their concentration among the working population,especially those in high-risk occupations and sectors. Hazards at work-places and the resulting illness and injury are understood most accuratelyin the formal sector, and even there much undercounting occurs. Theburden in the informal sector in developing countries, where large pro-portions of the population work, is high and largely lacks description.Neither household and family agricultural work by women nor child
1776 Comparative Quantification of Health Risks

labour were addressed in our study. Due primarily to lack of data indeveloping countries, we were unable to include important occupationalrisks for infectious diseases, dermatitis, reproductive disorders, somecancers, ischaemic heart disease, musculoskeletal disorders of the upperextremities, and other conditions such as workplace stress.
The estimated burden of occupational risk factors can be diminishedby improving working conditions, as many examples from differentcountries have shown. Work-related diseases are largely preventable. Forexample, many dusty activities can be made safer by using wet methods,thus reducing workers’ exposures to silica. Work surfaces can be adjustedto a worker’s height, thereby reducing suffering from low back pain. Substituting safe chemicals for known carcinogens can prevent manycancers. A change of process can reduce noise levels, thus protectingworkers’ hearing. Attention to electrical safety or machine guarding caneliminate tragic injuries at the workplace.
9. Projections of future exposureIn the next 50 years, the population of the developing regions willsteadily rise, whereas that of more developed regions is expected tochange little because fertility levels will remain below replacement level(UN 2001). There will also be differences in growth rates between the
Marisol Concha-Barrientos et al. 1777
Table 21.80 Expected rate of growth of the economically activepopulation between 2000 and 2010, by sex and subregion
Growth rate
Subregion Males Females
AFR-D 0.33 0.38
AFR-E 0.27 0.25
AMR-A 0.08 0.12
AMR-B 0.17 0.27
AMR-D 0.27 0.45
EMR-B 0.32 0.66
EMR-D 0.31 0.53
EUR-A –0.35 0.03
EUR-B –0.26 0.16
EUR-C 0.00 0.00
SEAR-B 0.17 0.24
SEAR-D 0.21 0.27
WPR-A –0.03 0.04
WPR-B 0.11 0.11
Source: ILO (2002a).

sexes. A negative growth rate among economically active males isexpected to occur between 2000 and 2010 in developed regions such asEurope, while comparable female rates will continue increasing in most of the regions, including the developed ones (ILO 2002a) (Table21.80).
The expected changes in the world population will affect the EAP aswell as the median age of workers (Fullerton and Toosi 2001). Thesechanges in the characteristics of the working population will be accom-panied by a different distribution of employment in the economic sectors(agriculture, industry and services). Currently, the service sector of manyeconomies is growing at a fast rate, while the agricultural sector is rapidlydeclining in developing countries and remains at a stable low level indeveloped countries. It is expected that these different patterns of growthwithin the economic sectors will continue in the coming years. More-over, the expected changes will affect the distribution of occupationswithin an economic sector. In developed countries in which a change inthe structure of the economy has been observed, there has been a shiftin the proportion of workers from the “production” category in favourof professional, managerial, clerical and sales occupations.
9.1 Exposure estimation for the years 2010, 2020 and 2030
As mentioned above, the EAP by economic sector was used to estimatethe working population exposed to some risk factors, including car-
1778 Comparative Quantification of Health Risks
Table 21.81 Projected EARs for the year 2010by sex and subregion
Subregion Males Females
AFR-D 0.84 0.55
AFR-E 0.85 0.64
AMR-A 0.7 0.59
AMR-B 0.8 0.45
AMR-D 0.81 0.44
EMR-B 0.78 0.39
EMR-D 0.81 0.42
EUR-A 0.57 0.47
EUR-B 0.69 0.56
EUR-C 0.75 0.59
SEAR-B 0.82 0.62
SEAR-D 0.84 0.48
WPR-A 0.71 0.52
WPR-B 0.81 0.68
Source: ILO (2002a).

cinogens, while occupational category within a sector was used forothers, including noise and ergonomic stressors. Therefore, to project theexposed population for the years 2010, 2020 and 2030 a three-step pro-cedure was followed: (i) the EAP was estimated; (ii) the EAP was dis-tributed among economic sectors; and, where needed, (iii) occupationalcategories were distributed within the economic sectors.
EAP ESTIMATION
To obtain the EAP for the year 2010, we multiplied the overall popula-tion (2010) by the EARs by subregion for the year 2010 as estimated byILO (See Table 21.81). Then, in the absence of other data, the same EARby subregion was used for the years 2020 and 2030 to generate the EAP(see Equation 4). Calculations were restricted to persons aged ≥15 yearsby sex and subregion, thus allowing regional patterns to be preserved.
(4)
where
EAP15+j = economically active population ≥15 years, j=year (2010,2020, 2030)
EAP EAR for each age group
Population for each age group
15 j 2010
i
+ = ≥([¥ ≥( ))]
 15
15
Marisol Concha-Barrientos et al. 1779
Table 21.82 Projected distribution of EAP by subregion in 2010, 2020and 2030
2010 2020 2030
Subregion EAP % total EAP % total EAP % total
AFR-D 151300284 4.6 199904691 5.4 260126023 6.3
AFR-E 181011306 5.5 232504879 6.3 300771980 7.3
AMR-A 176129373 5.4 191817362 5.2 201632376 4.9
AMR-B 218574298 6.7 251138963 6.8 278348992 6.8
AMR-D 35233802 1.1 43360108 1.2 51164255 1.2
EMR-B 67730185 2.1 82896189 2.2 98826530 2.4
EMR-D 165776470 5.1 214302617 5.8 269408795 6.5
EUR-A 172528633 5.3 171619225 4.6 165811266 4.0
EUR-B 110565142 3.4 118115432 3.2 123452320 3.0
EUR-C 125923283 3.8 118343637 3.2 112001074 2.7
SEAR-B 173799078 5.3 196214683 5.3 213861114 5.2
SEAR-D 663743911 20.3 784531784 21.1 885891293 21.5
WPR-A 77452109 2.4 76367545 2.1 72515258 1.8
WPR-B 952086321 29.1 1030847264 27.8 1086544112 26.4
Total 3271854196 100.0 3711964378 100.0 4120355388 100.0

1780 Comparative Quantification of Health Risks
Populationi = population year 2010, 2020, 2030
EAR = economic activity rate, year 2010
The EAP will increase steadily towards 2010, 2020 and 2030, but theamount of the increase and the patterns are somewhat different betweendeveloped and developing countries, as well as among countries havinga similar degree of development. The percentage distribution of the EAPby subregion reflects the growth of the overall population, with greatergrowth in developing countries. WPR-B and SEAR-D will contribute49.4% of global EAP in the year 2010, whereas developed subregionswill contribute only 13.1% (Table 21.82).
EAP DISTRIBUTION AMONG ECONOMIC SECTORS FOR 2010, 2020 AND 2030
The basic approach to estimating the EAP among economic sectors wasto use regression analysis to identify the relationship between the distri-bution of the economic sectors and the projected years of interest. Thedependent variables (proportion of EAP employed in agriculture, indus-try or services) were separately compared to the independent variabletime,10 using the following model:
(5)
where
PEAPA ln a Y bT= ( ) + ln
Figure 21.3 Projected distribution of the agricultural sector by year andsubregion, 2010, 2020 and 2030
0.0
0.1
0.2
0.3
0.4
0.5
0.6
2010 2020 2030
EA
P in
agr
icul
ture
(%
)
AFR-D AFR-E AMR-A AMR-B AMR-D
EMR-B EMR-D EUR-A EUR-B EUR-C
SEAR-B SEAR-D WPR-A WPR-B

PEAPA = proportion of EAP in agriculture (similarly, PEAPI andPEAPS for industry, or service) in Year T
YT = Time (Year T)
The slope factors and intercepts obtained by regression analysis, usingthe EAP proportion by economic subsector for the years 1990–2000,were then used to estimate the proportion of the EAP for the years 2010,2020 and 2030, separately for each economic subsector. We did notinclude economic development (e.g. measured as GDP per capita) as anadditional variable in the analysis, assuming that previous trends capturethe effects of trends in GDP. Given the economic and social factors thatdetermine occupational distributions, the changes in the EAP in thefuture are subject to behavioural decisions by individuals, policy deci-sions in home countries and abroad, and developments in education. Theproject distribution of EAP among economic sectors showed differentpatterns among different subregions. As an example, Figure 21.3 pre-sents the distribution of EAP in agriculture.
OCCUPATIONAL CATEGORIES ADJUSTMENT
No data were available to develop trends for employment in occupa-tional categories in 2010, 2020 and 2030. Therefore, proportions of exposed workers within occupational categories were adjusted according to the distribution pattern of the year 2000, adjusted only forthe new proportions employed within economic sectors in the year ofinterest.
Notes1 See preface for an explanation of this term.
2 Dusts are technically defined as dry particle aerosols produced by mechanicalprocesses such as breaking, grinding and pulverizing (Johnson and Swift1997). Particle sizes range from less than 1 mm to over 100 mm. The smallerparticles present a greater hazard, as they remain airborne longer and are morelikely to enter the respiratory tract. Dusts may be organic (e.g. grain dust) orinorganic (e.g. silica, asbestos and coal dust).
3 Economic activities comprise agriculture, mining, manufacturing, utilities,construction, trade, transport, finance and services.
4 dBA is the unit of sound pressure level in decibels that has been A-weighted,i.e. measured with an A-weighted sound level meter. Sound levels measured indBA have been widely used to evaluate occupational and environmental expo-sures because of the good correlations between the “A” scale and humanhearing ability at different frequencies, hearing damage and environmentalannoyance.
5 The average of the hearing threshold levels for both ears that exceeds 25dBat 1000, 2000, 3000 and 4000Hz.
Marisol Concha-Barrientos et al. 1781

6 Tinnitus is noise originating in the ear rather than in the environment. Thenoise may be a buzzing, ringing, roaring, whistling, humming or hissing in theears. Ringing in the ears is an extremely common phenomenon experiencedby up to a third of the adult population at one time or another.
7 A temporary increase in the threshold of hearing for an ear caused by expo-sure to high-intensity noise.
8 The percentage of workers with a hearing impairment in an occupationallynoise-exposed population, after subtracting the percentage in an unexposedpopulation who would normally incur such impairment owing to ageing.
9 Year was the predictor of the data.
ReferencesAhmed HO, Dennis JH, Badran O et al. (2001) Occupational noise exposure
and hearing loss of workers in two plants in eastern Saudi Arabia. Annals ofOccupational Hygiene, 45:371–380.
Alidrisi M, Jamil ATM, Jiffry MSA, Jefri MA, Erturk F (1990) Evaluation ofnoise stresses in Jeddah Industrial State. Journal of Environment Science andHealth, A25:873–896.
Amweelo M (2000) Accident prevention in Namibia. African Newsletter onOccupational Health and Safety 10(1).
Armstrong TJ, Buckle P, Fine LJ et al. (1993) A conceptual model for work-related neck and upper-limb musculoskeletal disorders. Scandinavian Journalof Work, Environment and Health, 19:73–84.
Arndt V, Rothenbacher D, Brenner H et al. (1996) Older workers in the con-struction industry: results of a routine health examination and a five-yearfollow-up. Occupational and Environmental Medicine, 53:686–691.
Astrand NE (1987) Medical, psychological, and social factors associated withback abnormalities and self reported back pain: a cross sectional study ofmale employees in a Swedish pulp and paper industry. British Journal ofIndustrial Medicine, 44:327–336.
Atallah ZR, Jamous LW, AbuDhaise BA, Alwash RH (1998) Fatal occupationalinjuries in Jordan during the period 1980 through 1993. Safety Science,28:177–187.
Attfield M, Wagner G (1998) Respiratory disease in coal miners. In: Environ-mental and occupational medicine, 3rd edn. Rom W, ed. Little, Brown andCo., Boston, MA.
Badley EM, Rasooly I, Webster GK (1994) Relative importance of muscu-loskeletal disorders as a cause of chronic health problems, disability, andhealth care utilization: findings from the 1990 Ontario Health Survey. TheJournal of Rheumatology, 21:505–514.
Badley EM, Webster GK, Rasooly I (1995) The impact of musculoskeletal disorders in the population: are they just aches and pain? Findings from the1990 Ontario Health Survey. The Journal of Rheumatology, 22:733–739.
1782 Comparative Quantification of Health Risks

Balmes J, Becklake M, Blanc P et al. (2003) American Thoracic Society statement on occupational contribution to the burden of airway disease.American Journal of Respiratory and Critical Care Medicine, 167:787–797.
Bao S, Winkel J, Mathiassen SE, Shahnavan H (1997) Interactive effect ofergonomics and production engineering on shoulder-neck exposure: a casestudy of assembly work in China and Sweden. International Journal of Indus-trial Ergonomics, 20:75–85.
Battie MC, Bigos SJ (1991) Industrial back pain complaints: a broader perspec-tive. Orthopedics Clinics of North America, 22:273–282.
Becklake M (1989) Occupational exposures: evidence for a causal associationwith chronic obstructive pulmonary disease. American Review of RespiratoryDisease, 140:S85–91.
Becklake MR (1994) Symptoms and pulmonary functions as measures of morbidity. Annals Occupational Hygiene, 38:569–580, 418.
Behrens V, Seligman P, Cameron L et al. (1994) The prevalence of back pain,hand discomfort, and dermatitis in the U.S. working population. AmericanJournal of Public Health, 84:1780–1785.
BEIR V (1990) Health effects of exposure to low levels of ionizing radiation:BEIR V. Committee on the biological effects of ionizing radiation. NationalAcademy Press, Washington, DC.
Bergenudd H, Nilsson B (1988) Back pain in middle age: occupational work loadand psychologic factors: an epidemiologic study. Spine, 13:58–60.
Bernard BP, ed. (1997) Musculoskeletal disorders and workplace factors: a crit-ical review of epidemiologic evidence for work-related musculoskeletal dis-orders of the neck, upper extremity, and low back. CDC/NIOSH, Cincinnati,OH.
Bernard BP, Sauter SL, Petersen M et al. (1993) Health hazard evaluation report:Los Angeles Times. (NIOSH Report No. 90-013-2277). Cincinnati, OH.
Bhatia R, Lopipero P, Smith A (1998) Diesel exhaust exposure and lung cancer.Epidemiology, 9:84–91.
Bhattacharya SK, Saiyed HN, Roy A, Chatterjee SK (1981) Hearing acuity inweavers of a textile mill. Indian Journal of Medical Research, 74:779–785.
Bhattacharya SK, Tripathi SR, Kashyap S (1990) Heat and noise problems in afirm in a drug and pharmaceutical firm in India. Industrial Health,28:203–207.
Blanc P, Toren K (1999) How much adult asthma can be attributed to occupa-tional factors? American Journal of Medicine, 107:580–587.
Bongers PM, de Winter CR, Kompier MAJ et al. (1993) Psychosocial factors atwork and musculoskeletal disease. Scandinavian Journal of Work, Environ-ment and Health, 19:297–312.
Bongers PM, Hulshof CTJ, Dijkstra L, Boshuizen HC, Groenhout HJM, ValkenE (1990) Back pain and exposure to whole body vibration in helicopter pilots.Ergonomics, 33:1007–1026.
Marisol Concha-Barrientos et al. 1783

Bovenzi M, Betta A (1994) Low-back disorders in agricultural tractor driversexposed to whole-body vibration and postural stress. Applied Ergonomics,25:231–241.
Broersen JPJ, de Zwart BCH, Dijk F et al. (1996) Health complaints and workingconditions experienced in relation to work and age. Occupational and Envi-ronmental Medicine, 53:51–57.
Buckle PW, Devereaux J (1999) Work-related neck and upper limb musculoske-letal disorders. European Agency for Safety and Health at Work, Luxembourg.
Bundesverband der Betriebskrankenkassen (2001) Krankheitsartenstatistik1997. (Internet communication of 20 September 2001 at:http://de.osha.eu.int/statistics/bkk/index.stm).
Burchfiel CM, Boice JA, Stafford BA, Bond GG (1992) Prevalence of back painand joint problems in a manufacturing company. Journal of OccupationalMedicine, 34:129–134.
Burdorf A (1992) Sources of variance in exposure to postural load on the backin occupational groups. Scandinavian Journal of Work, Environment andHealth, 18:361–367.
Burdorf A, Naaktgeboren B, deGroot HC (1993) Occupational risk factors forlow backpain among sedentary workers. Journal Occupational Medicine,35:1213–1220.
Burdorf A, Sorock G (1997) Positive and negative evidence of risk factors forback disorders. Scandinavian Journal of Work, Environment and Health,23:243–256.
Bureau of Labor Statistics (2001) Safety and health statistics. Office of Safety,Health and Working Conditions. U.S. Department of Labor. (Internet Com-munication of 10 September 2001 at: http://stats.bls.gov/oshhome.htm).
Burton, DJ (1997) Chapter 31. General methods for the control of airbornehazards. In: The industrial environment—its evaluation and control. Di NardiS, ed. AIHA, Fairfax, VA.
Butler S, Twaddle S (1979) Turnover in the restaurant industry: a structuralexplanation. Mid-South Sociological Association. Sociological Abstracts,27(4).
CCOHS (1997) OSH answers. Canadian Centre for Occupational Health andSafety. Available at http://www.ccohn.ca/oshanswers/diseases.
CDC (2001) Non-fatal occupational injuries and illnesses treated in hospitalemergency departments—Unites States 1998. Centers for Disease Control andPrevention. Journal of the American Medical Association, 285:2443–2444.
Chan-Yeung M, Malo J (1994) Aetiological agents in occupational asthma. Euro-pean Respiratory Journal, 7:346–371.
Checkoway (2000) Epidemiological evidence on the carcinogenicity of silica:factors in scientific judgement: letter. Annals of Occupational Hygiene,44:483–487.
Chellini E, Baldasseroni A, Giovannetti L, Zoppi O (2002) A survey on fatalwork accidents based on mortality registry data: results of the Tuscany study
1784 Comparative Quantification of Health Risks

on INAIL and RMR cases in the period 1992–1996. Epidemiologia e Pre-venzione, 26:11–17.
Chen W, Zhuang Z, Attfield MD et al. (2001) Exposure to silica and silicosisamong tin miners in China: exposure-response analyses and risk assessment.Occupational and Environmental Medicine, 58:31–37.
Chien V, Chai S, Hai D et al. (2002) Pneumoconiosis among workers in a Viet-namese refractory brick facility. American Journal of Industrial Medicine,42:397–402.
Chiou, WK, Wong MK (1992) Epidemiology of low back pain in the nurses ofChang Gung Memorial Hospital. Chang Gung Medical Journal, 15: 64–71.
Chiou WK, Wong MK, Lee YH (1994) Epidemiology of low back pain in Chinesenurses. International Journal of Nursing Studies, 31:361–368.
Choi BCK, Tennassee LM, Eijkemans GJM (2001) Developing regional work-place health and hazard surveillance in the Americas. Pan American Journalof Public Health, 10: 376–381.
Davis AC (1989) The prevalence of hearing impairment and reported hearingdisability among adults in Great Britain. International Journal of Epidemiol-ogy, 18:911–917.
de Zwart BCH, Broersen JP, Frings-Dresen MHW, van Dijk FJH (1997) Repeatedsurvey on changes in musculoskeletal complaints relative to age and workdemands. Occupational and Environmental Medicine, 54:793–799.
Derriennic F, Iwatsubo Y, Monfort C et al. (1993) Evolution of osteoarticulardisorders as a function of past heavy physical work factors: longitudinalanalysis of 627 retired subjects living in the Paris area. British Journal ofIndustrial Medicine, 50:851–860.
Deyo RA, Rainville J, Kent D (1992) What can the history and physical examination tell us about low back pain? Journal of the American MedicalAssociation, 268:760–765.
Dosemeci M, McLaughlin JF, Chen J-Q et al. (1995) Historical total and res-pirable silica dust exposure levels in mines and pottery factories in China.Scandinavian Journal of Work, Environment and Health, 2:S39–43.
Dror DM (2001) Reinsurance of health insurance for the informal sector. Bulletin of the World Health Organization, 79:672–678.
Dupre D (2001) Accidents at work in the EU 1998–1999. EUROSTAT (Theme 3-16/2001). Statistics in Focus, Population and Social Conditions,Luxembourg.
EASHW (2000) Monitoring the state of occupational safety and health in theEuropean Union—pilot study. European Agency for Safety and Health atWork. Luxembourg.
EIA (2001) Energy Information Administration, U.S. Department of Energy, International Energy Database, January 2001, available atwww.eia.doe.gov/emeu/iea/coal.html.
EIU (1995) Business operations report, India, 4th quarter, 1995. Shortage ofmanagers. Economist Intelligence Unit. Available at http://www.eiu.com.
Marisol Concha-Barrientos et al. 1785

EIU (1996a) China hand. Ch. 13. Human resources: knowing why staff leave,1 Sept. Economist Intelligence Unit. Available at http://www.eiu.com.
EIU (1996b) China labour: unemployed reluctant to trade welfare for work. Country view, 27 Nov. Economist Intelligence Unit. Available athttp://www.eiu.com.
EIU (1997a) 28 February. Economist Intelligence Unit. Available athttp://www.eiu.com.
EIU (1997b) Brazil regulations: rules eased on loans for exporters. Country alert,6 May. Economist Intelligence Unit. Available at http://www.eiu.com.
EIU (1997c) Business operations report, Laos. Importance of training: trainingbreeds staff loyalty, 26 Jun. Economist Intelligence Unit. Available athttp://www.eiu.com.
EIU (1997d) Caribbean industry: region seeks to lure informatics firms. Countryalert, 2 Jul. Economist Intelligence Unit. Available at http://www.eiu.com.
EIU (1997e) Country commerce South Korea. Human resources. Overview, 1Jul. Economist Intelligence Unit. Available at http://www.eiu.com.
EIU (1997f) USA industry: Silicon Valley survey—of mice & men. Country view,1 Apr. Economist Intelligence Unit. Available at http://www.eiu.com.
EIU (1998) Business operations report Eastern Europe. Business services: background checks on security personnel essential, 16 March.
EIU (2001a) Country commerce China. Human resources. Overview, 28 Feb.Economist Intelligence Unit. Available at http://www.eiu.com.
EIU (2001b) Country forecast Africa. AIDS/Africa: labour costs are set toincrease substantially, 14 May. Economist Intelligence Unit. Available athttp://www.eiu.com.
EIU (2001c) Country profile Hong Kong. Resources and infrastructure: educa-tion, 1 Jul. Economist Intelligence Unit. Available at http://www.eiu.com.
EIU (2002) Country commerce China. Human resources. Overview, 28 Feb.Economist Intelligence Unit. Available at http://www.eiu.com.
Emmett EA (2002) Occupational contact dermatitis I: incidence and return towork pressures. American Journal of Contact Dermatitis, 13:30–34.
Enterline P, Marsh G, Esmen N, Henderson V, Callahan C, Paik M (1987) Someeffects of cigarette smoking arsenic, and SO2 on mortality among US coppersmelter workers. Journal of Occupational Medicine, 29:831–838.
Evans WA, Ming HY (1982) Industrial noise-induced hearing loss in Hong Kong:a comparative study. Annals of Occupational Hygiene, 25:63–80.
Ezenwa A (2001) A study of fatal injuries in Nigerian factories. OccupationalMedicine, 51:485–489.
Ferris BG Jr, Speizer FE, Spengler JD et al. (1979) Effects of sulfur and respirableparticles on human health: methodology and demography of populations instudy. American Review of Respiratory Disease, 120:767–779.
Feyer AM, Williamson AM, Stout N, Driscoll T, Usher H, Langley JD (2001)Comparison of work related fatal injuries in the United States, Australia, andNew Zealand: method and overall findings. Injury Prevention, 7:22–28.
1786 Comparative Quantification of Health Risks

Fine LJ, Silverstein BA, Armstrong TJ, Anderson CA, Sugano DS (1986) Detec-tion of cumulative trauma disorders of upper extremities in the workplace.Journal of Occupational Medicine, 28:674–678.
FIOH (1999) CAREX database. Finnish Institute of Occupational Health. Avail-able at http://www.ocuphealth.fi/internet/english.
FIOH (2001) CAREX database. Finnish Institute of Occupational Health. Available at http://www.occuphealth.fi/list/data/CAREX.
Forastieri V (1999) Improvement of working conditions and environment in theinformal sector through safety and health measures. International LabourOrganization, Geneva.
Frank JW, Kerr MS, Brooker A-S et al. (1996) Disability resulting from occu-pational low back pain, Part I: What do we know about primary prevention?A review of the scientific evidence on prevention before disability begins.Spine, 21:2908–2917.
Frank JW, Pulcins IR, Kerr MS et al. (1995) Occupational back pain—an un-helpful polemic. Scandinavian Journal of Work, Environment and Health,21:3–14.
Fullerton H, Toosi M (2001) Labor force projections to 2010:steady growth andchanging composition. Monthly Labor Review, 124:21–38.
Furuya S, Natori Y, Ikeda R (2003) Asbestos in Japan. International JournalOccupational Environmental Health, 9:260–265.
Garg A (1992) Occupational biomechanics and low-back pain. OccupationalMedicine: State of the Art Review, 7:609–628.
Gomes J, Lloyd O, Norman N, Pahwa P (2001) Dust exposure and impairmentof lung function at a small iron foundry in a rapidly developing country.Occupational and Environmental Medicine, 58:656–662.
Guerrero JL, Sniezek JE, Sehgal (1999) The prevalence of disability from chronicconditions due to injury among adults ages 18–69 years: United States, 1994.Disability and Rehabilitation, 21:187–192.
Guo H-R, Tanaka S, Cameron LL et al (1995) Back pain among workers in theUnited States: national estimates and workers at high risk. American Journalof Industrial Medicine, 28:591–602.
Guo H-R, Tanaka S, Halperin WE, Cameron LL (1999) Back pain prevalence inU.S. industry and estimates of lost workdays. American Journal of PublicHealth, 89:1029–1035.
Hagberg M, Silverstein BA, Wells RP et al., eds (1995) Work-related muscu-loskeletal disorders (WMSD): a handbook for prevention. Taylor and Francis.London.
Hales TR, Bernard BP (1996) Epidemiology of work-related musculoskeletal dis-orders. Orthopedic Clinics of North America, 27:679–709.
Harrison JE, Frommer MS, Ruck EA, Blyth FM (1989) Deaths as a result ofwork-related injury in Australia, 1982–1984. Medical Journal of Australia,50:118–125.
Marisol Concha-Barrientos et al. 1787

Hayes R, Yin S, Dosemeci M et al. (1997) Benzene and the dose-related inci-dence of hematologic neoplasms in China. Chinese Academy of PreventiveMedicine—National Cancer Institute Benzene Study Group. Journal of theNational Cancer Institute, 89:1065–1071.
Heistaro S, Vartiainen E, Heliövaara M et al. (1998) Trends of back pain ineastern Finland, 1972–1992, in relation to socioeconomic status and behav-ioral risk factors. American Journal of Epidemiology, 148:671–682.
Hendrick DJ (1996) Occupational and chronic obstructive pulmonary disease(COPD). Thorax 51:947–955.
Hernandez-Gaytan SI, Santos-Burgo AC, Becker-Meyer JP, Macias-Carrillo C,Lopez-Cervantes M (2000) Prevalence of hearing loss and correlated factorsin a cement plant. Salud Publica de Mexico, 42:106–111.
Hessel P (2000) Hearing loss among construction workers in Edmonton, Alberta,Canada. Journal of Occupational and Environmental Medicine, 42:57.
Hessel PA, Sluis-Cremer GK (1987) Hearing loss in white South African gold-miners. South African Medical Journal, 71:364–367.
Hewett P (1996) Interpretation and use of occupational exposure limits forchronic disease agents. Occupational Medicine: State of the Art Reviews,11:561–590.
Hildebrandt VH (1995) Back pain in the working population: prevalence ratesin Dutch trades and professions. Ergonomics, 38:1283–1298.
Hnizdo E, Sluis-Cremer G (1991) Silica exposure, silicosis, and lung cancer: a mortality study of South African gold miners. British Journal IndustrialMedicine, 48:53–60.
Hollman S, Klimmer F, Schmidt K-H et al. (1999) Validation of a questionnairefor assessing physical work load. Scandinavian Journal of Work, Environ-ment and Health, 25:105–114.
Holte HH, Tambs K, Bjerkedal T (2000) Manual work as predictor for disabil-ity pensioning with osteoarthritis among the employed in Norway1971–1990. International Journal of Epidemiology, 29:487–494.
Hoogendoorn WE, van Poppel MNM, Bongers PM, Koes BW, Bouter LM (1999) Physical load during work and leisure time as risk factors for backpain. Scandinavian Journal of Work, Environment and Health, 25:387–403.
Hulshof CTJ, Veldhuijzen van Zanten B (1987) Whole-body vibration and low-back pain: a review of epidemiologic studies. International Archives ofOccupational and Environmental Health, 59:205–220.
Human Resources Development Canada (2000) Surveys until 2000. Avail-able at http://www.hrdc-drhc.gc.ca/hrib/hrp-prh/ssd-des/english/glossary/survey.shtml.
IARC (1977) Asbestos. (Monograph 14.) International Association of Cancer Registries, Lyon.
IARC (1980) Some metals and metallic compounds. (Monograph 23.) Interna-tional Association of Cancer Registries, Lyon.
1788 Comparative Quantification of Health Risks

IARC (1987a) Overall evaluations of carcinogenicity: an updating of IARC.(Monographs 1–42, Supplement 7.) International Association of Cancer Registries, Lyon.
IARC (1987b) Silica and some silicates. (Monograph 42.) International Associ-ation of Cancer Registries, Lyon.
IARC (1989) Diesel and gasoline engine exhausts and some nitroarenes. (Monograph 46.) International Association of Cancer Registries, Lyon.
IARC (1990a) Chromium, nickel and welding. (Monograph 49.) InternationalAssociation of Cancer Registries, Lyon.
IARC (1990b) Cancer. IARC Scientific Publications. International Associationof Cancer Registries, Lyon.
IARC (1993) Beryllium, cadmium, mercury, and exposures in the glass manufacturing industry. (Monograph 58.) International Association ofCancer Registries, Lyon.
IARC (1997) Silica, some silicates, coal dust and para-aramid fibrils. (Monograph 68.) International Association of Cancer Registries, Lyon.
IARC (2000) Ionizing radiation, part 1: X- and gamma (g)-radiation, and neu-trons. (Monograph 75.) International Association of Cancer Registries, Lyon.
IARC (2001) Overall evaluation of carcinogenicity to humans. InternationalAssociation of Cancer Registries, Lyon. Available athttp://193.51.164.11/monoeval/crthall.html.
IARC (2002) IARC Monographs Programme on the Evaluation of CarcinogenicRisks to Humans. Available at http://193.51.164.11.
ICNCM (1990) Report of the International Committee on Nickel Carcinogene-sis in Man. Scandinavian Journal of Work, Environment and Health,16:1–84.
ICRP (1991) Recommendations of the International Commission on Radiolog-ical Protection. (ICRP Publication No. 60. Vol 21:1–3.) International Com-mission on Radiological Protection, Oxford.
ILO (1987) Resolutions adopted by the International Conference of Labour Statisticians. Annex 1. Major, sub-major, minor and unit group titles. International Labour Organization. Available at http://www.ilo.org/public/english/bureau/stat/download/res/isco.pdf.
ILO (1995a) Yearbook of labour statistics 1995, 54th issue. InternationalLabour Organization, Geneva.
ILO (1995b) Sectoral activities programme, recent developments in the coal-mining industry, coal mines committee, 13th session, Report I. InternationalLabour Organization, Geneva.
ILO (1996) ILO Yearbook of labour statistics 1996, 55th issue. InternationalLabour Organization, Geneva.
ILO (2000) Yearbook of labour statistics, 59th issue. International Labour Organization, Geneva.
ILO (2001) Laborsta, the labour statistics database. International Labour Organization. Available at http://laborsta.ilo.org/.
Marisol Concha-Barrientos et al. 1789

ILO (2002a) Economically active population 1950–2010, 4th edn, rev. 2.International Labour Organization, Geneva.
ILO (2002b) The International Labor Conference, Report VI. Decent work andthe informal economy. International Labour Organization. Geneva.
IPCS (1998) Chrysotile asbestos. Environmental health criteria 203. Interna-tional Programme on Chemical Safety, Geneva.
Jarup L, Nordberg G (1998) Cancer. In: Health effects of cadmium exposure: areview of the literature and a risk estimate. Jarup L, Berglund M, Elinder CG,Nordberg G, Vahter M, eds. Scandinavian Journal Work, Environment andHealth, 24:34–36.
Jensen RC (1988) Epidemiology of work-related back pain. Topics Acute CareTrauma Rehabilitation, 23:1–15.
Jin K, Sorock GS, Courtney T et al (2000) Risk factors for work-related lowback pain in the People’s Republic of China. International Journal of Occu-pational and Environmental Health, 6:26–33.
Johanning E (1991) Back disorders and health problems among subway trainoperators exposed to whole-body vibration. Scandinavian Journal of WorkEnvironment and Health, 17:414–419.
Johanning E, Wilder D, Landrigan P (1991) Whole-body vibration exposure insubway cars and review of adverse health effects. Journal of OccupationalMedicine, 33:605–612.
Johnson AG, Whyte WF (1977) The Mondragon system of worker productioncooperatives. Industrial and Labor Relations Review, 31:18–30.
Johnson D, Swift D (1997) Sampling and sizing particles. In: The occupationalenvironment—its evaluation and control. Di Nardi SR, ed. The AmericanIndustrial Hygiene Association, Fairfax, VA.
Joshi TK, Menon KK, Kishore J (2001) Musculoskeletal disorders in industrialworkers of Delhi. International Journal of Occupational and EnvironmentalHealth, 7:217–222.
Juengprasert W (1997) Towards elimination of silicosis in Thailand. Mineraldusts and prevention of silicosis. Asian-Pacific Regional Network on Occu-pational Safety and Health Information (ASIA-OSH), 4(2).
Kam Lam TF (2000) Occupational safety and health in China. Asian labourupdate. Available at http://www.amrc.org.hk/alu/Alu39/013906.htlm.
Kamal AA, Eldamati SE, Faris F (1989) Hearing threshold of Cairo traffic police-men. International Archives of Occupational and Environmental Health,61:543–545.
Karjalainen A, Kurppa K, Martikanen R, Karjalainen J, Klaukka T (2002) Explo-ration of asthma risk by occupation -extended analysis of an incidence studyof the Finnish population. Scandinavian Journal of Work, Environment andHealth, 28:49–57.
Karjalainen A, Kurppa K, Martikanen R, Klaukka T, Karjalainen J (2001) Workis related to a substantial portion of adult-onset asthma incidence in theFinnish population. American Journal of Respiratory Critical Care Medicine,164:565–568.
1790 Comparative Quantification of Health Risks

Kauppinen T, Toikkanen J, Pedersen D et al. (2000) Occupational exposure to carcinogens in the European Union. Occupational and Environmental Medicine, 57:10–18
Khogali M (1970) Industrial health problems of developing countries. 1.1. Typesof risk and their prevention. Journal of Tropical Medicine and Hygiene,73:269–274.
Klein BP, Jensen RC, Sanderson LM (1984). Assessment of workers’ compensa-tion claims for back strains/sprains. Journal of Occupational Medicine,26:443–448.
Klockhoff I, Drettner B, Svedberg A (1974) Computerized classification of the results of screening audiometry in groups of persons exposed to noise.Audiology, 13:326–334.
Koch JL, Rhodes, SR (1981) Predictors of turnover of female factory workers.Journal of Vocational Behavior, 18:145–161.
Kogevinas M, Antó JM, Soriano JB, Tobias A (1996) The risk of asthma attributable to occupational exposures: a population-based study in Spain.American Journal of Respiratory Critical Care Medicine, 154:137–143.
Kogevinas M, Anto JM, Sunyer J, Tobias A, Kromhout H, Burney P (1999) Occu-pational asthma in Europe. The Lancet, 353:1750–1754.
Korn RJ, Dockery DW, Speizer FE, Ware JH, Ferris BG Jr (1987) Occupationalexposures and chronic respiratory symptoms: a population based study.American Review of Respiratory Disease, 136:298–304.
Krzyzanowski M, Jedrychowski W, Wysocki M (1986) Factors associated with the change in ventilatory function and the development of chronicobstructive pulmonary disease in a 13-years follow-up of the Cracow study.American Review of Respiratory Disease, 134:1011–1019.
Kumar A, Varghese M, Mohan D, Mahajan P, Gulati P, Kale S (1999) Effect ofwhole-body vibration on the low back. Spine, 24:2506–2515.
Kuwashima A, Aizawa Y, Nakamura K, Taniguchi S, Watanabe M (1997)National survey on accidental low back pain in workplace. Industrial Health,35:187–193.
Lagerström M, Hansson T, Hagberg M (1998) Work-related low back problemsin nursing. Scandinavian Journal of Work, Environment and Health, 24:449–464.
Lahiri S (2002) Analysis of cost-effectiveness of interventions to reduce low backpain as a consequence of occupational ergonomic stressors. World HealthOrganization, Geneva.
Lawrence RC, Helmick CG, Arnett FC et al. (1998) Estimates of the prevalenceof arthritis and selected musculoskeletal disorders in the United States. Arthri-tis and Rheumatism, 41:778–799.
Lee P (2001) Relation between exposure to asbestos and smoking jointly and therisk of lung cancer. Occupational and Environmental Medicine, 58:145–153.
Leigh J, Driscoll T (2003) Malignant mesothelioma in Australia, 1945–2002.International Journal Occupational Environmental Health, 9:206–217.
Marisol Concha-Barrientos et al. 1791

Leigh JP, Sheetz RM (1989) Prevalence of back pain among full-time UnitedStates workers. British Journal of Industrial Medicine, 46:651–657.
Leino PI, Hänninen V (1995) Psychosocial factors at work in relation to backand limb disorders. Scandinavian Journal of Work, Environment and Health,21:134–142.
Leino-Arjas P, Hanninen K, Puska P (1998) Socioeconomic variation in back andjoint pain in Finland. European Journal of Epidemiology, 14:79–87.
Lerer LB, Myers JE (1994) Application of two secondary documentary sourcesto identify the underreporting of fatal occupational injuries in Cape Town,South Africa. American Journal of Industrial Medicine, 26:521–527.
Lipsett M, Campleman S (1999) Occupational exposure to diesel exhaust and lung cancer: a meta-analysis. American Journal of Public Health,89:1009–1017.
Loewenson R (1998) Health impact of occupational risks in the informal sectorin Zimbabwe. International Journal of Occupational and EnvironmentalHealth, 4:264–274.
Lombardo LJ, Balmes JR (2000) Occupational asthma: a review. Environmen-tal Health Perspectives, 8:S697–704.
Loney P, Stratford P (1999) The prevalence of low back pain in adults: a method-ological review of the literature. Physical Therapy, 79:384–396.
Lucifora C (1998) The impact of unions on labour turnover in Italy: evidencefrom establishment level data. International Journal of Industrial Organiza-tion, 16:353–376.
Lynge E, Anttila A, Hemminki K (1997) Organic solvents and cancer. CancerCauses and Control, 8:406–419.
MacDonald LA, Karasek RA, Punnett L, Scharf T (2001) Covariation betweenworkplace physical and psychosocial stressors: evidence and implications foroccupational health research and prevention. Ergonomics, 44:696–718.
Magnusson ML, Pope MH, Wilder DG,Areskoug B (1996) Are occupationaldrivers at an increased risk for developing musculoskeletal disorders? Spine,6:710–717.
Malchaire J (2000) Strategy for prevention and control of the risks due to noise.Occupational and Environmental Medicine, 57:361–369.
Malo J, Chan-Yeung (2001) Occupational asthma. Journal of Allergy and Clinical Immunology, 108:317–328.
Marras WS, Allread DL, Burr DL, Fathallah FA (2000). Prospective validationof low-back disorder risk model and assessment of ergonomic interventionsassociated with manual materials handling tasks. Ergonomics, 43:1866–1886.
Marsh SM, Layne LA (2001) Fatal injuries to civilian workers in the UnitedStates, 1980–1995 (National profile). Department of Health and Human Ser-vices. National Institute for Occupational Safety and Health (DHHS/NIOSH)2001-129. Available athttp://www.cdc.gov/niosh/NTOF2000/2001129.htlm.
1792 Comparative Quantification of Health Risks

Martonik JF, Nash E, Grossman E (2001) The history of OSHA’s asbestos rule-makings and some distinctive approaches that they introduced for regulatingoccupational exposure to toxic substances. American Industrial HygieneAssociation Journal, 62:208–217.
Miedema HS, Chorus AMJ, Wevers CWJ, van der Linden S (1998) Chronicityof back problems during working life. Spine, 23:2021–2029.
Milton DK, Solomon DM, Roseillo RA, Herrick RF (1998) Risk and incidenceof asthma attributable to occupational exposure among HMO members.American Journal of Industrial Medicine, 33:1–10.
Minino AM, Smith BL (2001) Deaths: preliminary data for 2000. National VitalStatistics Reports, 49:1–40.
Ministerio de Trabajo y Asuntos Sociales (2002) [Ministry of Labour and Social Affairs (2002)] Gabinete de Comunicación. Información Estadística.[Communications Bureau. Statistical Information.] Available at http://www.mtas.es/. Informe de Resultados España [Report of results forSpain].
Moffett M (2002) New Mexico labor market dynamics. Labor market review,special article. New Mexico Department of Labor, February. Available athttp://www3.state.nm.us/dol/dol_lmrsa6.htm.
Monso E, Munoz-Rino F, Izquierdo J et al. (1998) Occupational asthma in thecommunity: risk factors in a western Mediterranean population. Archives ofEnvironmental Health, 53:93–98.
Morata TC, Fiorini AC, Fischer FM et al. (1997) Toluene-induced hearing lossamong rotogravure printing workers. Scandinavian Journal of Work, Envi-ronment and Health, 23:289–298.
Morken T, Moen B, Riise T et al (2000) Prevalence of musculoskeletal symp-toms among aluminum workers. Occupational Medicine, 50:141–421.
Moselhi M, El-Sadik YM, El-Dakhakhny A (1979) A six-year follow up studyfor evaluation of the 85 dBA safe criterion for noise exposure. AmericanIndustrial Hygiene Association Journal, 40:424–426.
Mukherjee A K, Nag DP, Kakde Y, Prakash MN, Rao SR (1995) Noise levelmonitoring in a watch factory in Bangalore. Indian Journal of Industrial Medicine, 41:42–44.
Muruka AO (1998) Age, height and duration in of service in relation to backpain among tea pickers in Kenya. African Newsletter for Occupational Healthand Safety, 8(3). Accessed at http://www.occuphealth.fi/e/info/anl/398/ inMay 2002.
Myers JE, Lewis P, Hofmeyr W (1989) Respiratory health of brickworkers inCape Town, South Africa: background, aims, and dust exposure determina-tions. Scandinavian Journal of Work, Environment and Health, 15:180–187.
Nachemson A (1999) Back pain: delimiting the problem in the next millennium.International Journal of Law and Psychiatry, 22:473–490.
Nachemson A, Jonsson E, eds (2000) Neck and back pain: the scientific evidenceof causes, diagnosis, and treatment. Lippincott, Williams and Wilkins,Philadelphia, PA.
Marisol Concha-Barrientos et al. 1793

National Research Council (2001) Musculoskeletal disorders and the workplace:low back and upper extremities. Panel on musculoskeletal disorders and theworkplace. Commission on Behavioral and Social Sciences and Education,National Research Council and Institute of Medicine. National AcademyPress, Washington, DC. (also accessed at http://www.nap.edu/openbook).
National Statistics Office Philippines (2000) Proceedings of the seminar on theILO project on occupational injuries, 6 December. National Statistics Office,Manila.
Nelson DI (1997) Risk assessment in the workplace. In: The occupational envi-ronment—its evaluation and control. Di Nardi SR, ed. The American Indus-trial Hygiene Association, Fairfax, VA.
Ng TP, Hong CY, Goh LG, Wong ML, Koh KT, Ling SL (1994) Risks of asthmaassociated with occupations in a community-based case-control study. Amer-ican Journal of Industrial Medicine, 25:709–718.
NIEHS (1999) United States. A world-class program. National Institute on Environmental Health Sciences. Environmental Health Perspectives, 107(7).Available at http://ehpnet1.niehs.nih.gov/docs/1999/107-7/niehsnews.html.
NIOSH (1991) NIOSH publications on noise and hearing. Perspectives in diseaseprevention and health promotion, leading work-related diseases andinjuries—United States. Noise-induced Loss of Hearing, July. National Insti-tute for Occupational Safety and Health, Washington, DC.
NIOSH (1996) Violence in the workplace: risk factors and prevention strategies.National Institute for Occupational Safety and Health (NIOSH-CDC),Cincinnati, OH. Available at http://www.cdc.gov/niosh/violpr.htlm.
NIOSH (1998) Criteria for a recommended standard: occupational noise expo-sure. Revised criteria 1998. National Institute for Occupational Safety andHealth, Cincinnati, OH. Available at http://www.cdc.gov/niosh/98-126.html.
NIOSH (1999) Work-related lung disease surveillance report 1999. U.S. Depart-ment of Health and Human Services, National Institute for OccupationalSafety and Health, Washington, DC.
NIOSH (2000a) Worker health chartbook, 2000. NIOSH-CDC. US Departmentof Health and Human Services, National Institute for Occupational Safetyand Health, Washington, DC.
NIOSH (2000b) Injuries, illnesses, and hazardous exposures in the mining indus-try, 1986–1995: a surveillance report. (No. 2000-117.) National Institute forOccupational Safety and Health, Washington, DC.
NOHSC (1993) National code of practice for management and protection ofhearing at work (NOHSC:2009.) National Occupational Health and SafetyCommission, Australia. Available at http://www.nohsc.gov.au/OHSInformation/NOHSCPublications/fulltext/docs/h3/19.htm.
NOHSC (2001) National Occupational Health and Safety Commission, Australia. Available at http://www.nohsc.gov.au.
NOHSC (2002) Statistics. National Occupational Health and Safety Commis-sion, Australia. Available at http://www.nohsc.gov.au/statistics/default.htm.
1794 Comparative Quantification of Health Risks

Noweir MH, El-Dakhakhny AA, Valic F (1968) Exposure to noise in the textileindustry of the U.A.R. American Industrial Hygiene Association Journal,29:541–546.
Nurminen M, Karjalainen A (2001) Epidemiologic estimate of the proportion offatalities related to occupational factors in Finland. Scandinavian JournalWork, Environment and Health, 27:161–213.
Obiako MN (1979) Deafness and the mining industry in Zambia. East AfricanMedical Journal, 56:445–449.
Oleru UG (1980) Comparison of the hearing levels of Nigerian textile workersand a control group. American Industrial Hygiene Association Journal,41:283–287.
Oleru UG, Ijaduola GTA, Sowho EE (1990) Hearing thresholds in an auto assem-bly plant: prospects for hearing conservation in an [sic] Nigerian factory.International Archives of Occupational and Environmental Health,62:199–202.
Omokhodion FO, Umar US, Ogunnowo BE (2000) Prevalence of low back painamong staff in a rural hospital in Nigeria. Occupational Medicine,50:107–110.
Ory FG, Rahman FU, Katagade V, Shukla A, Burdorf A (1997) Respiratory disorders, skin complaints, and low-back trouble among tannery workers in Kanpur, India. American Industrial Hygiene Association Journal, 58:740–746.
Osibogun A, Igweze IA, Adeniran LO (2000). Noise-induced hearing loss amongtextile workers in Lagos Metropolis. The Nigerian Postgraduate MedicalJournal, 7:104–111.
Oxman A, Muir D, Shannon H, Stock S, Hnizdo E, Lange H (1993) Occupa-tional dust exposure and chronic obstructive pulmonary disease. A system-atic overview of the evidence. American Review of Respiratory Disease,148:38–48.
Ozguler A, Leclerc A, Landre M, Pietri-Taleb F, Niedhammer I (2000) Individ-ual and occupational determinants of low back pain according to various def-initions of low back pain. Journal of Epidemiology and Community Health,54:215–220.
PAHO/WHO (1998) Informe del proyecto sistematización de datos básicos sobresalud de los trabajadores en países de las Américas—Agosto [Report of theproject: systematisation of basic data of health of workers in LAC countries—August]. División del Ambiente y Salud [Division for Environment andHealth]. Pan American Health Organization/World Health Organization.
Palmer K, Pannett B, Griffin M (2001) Occupational exposure to noise andhearing difficulties in Great Britain. (Contract Report 361/2001.) Universityof Southampton for the Health and Safety Executive, Southhampton.
Paquet VL, Punnett L, Buchholz BO (1999) An evaluation of manual materialshandling in highway construction work. International Journal of IndustrialErgonomics, 24:431–444.
Marisol Concha-Barrientos et al. 1795

Partanen T, Jaakkola J, Tossavainen A (1995) Silica, silicosis and cancer inFinland. Scandinavian Journal of Work, Environment and Health, 2:S84–86.
Partridge REH, Duthie JJR (1968) Rheumatism in dockers and civil servants: acomparison of heavy manual and sedentary workers. Annals of RheumaticDiseases, 27:559–568.
Pearce N, Matos E, Vainio H, Boffetta P, Kogevinas M (1994) Occupationalcancer in developing countries. (IARC Scientific Publications No. 129) Lyon.
Perkio-Makela M, Riihimäki H (1997) Intervention on seat adjustment amongdrivers of forest tractors. International Journal of Industrial Ergonomics,19:231–237.
Peto R, Darby S, Deo H, Silcocks P, Whitley E, Doll R (2000). Smoking, smokingcessation, and lung cancer in the UK since 1950: combination of national statistics with two case-control studies. British Medical Journal, 321:323–329.
Peto J, Decarli A, La Vecchia C, Levi F, Negri E (1999) The European mesothe-lioma epidemic. British Journal of Cancer, 79:666–672.
Phan Hong Son, Tran Ngoc Lan, Le Van Trung et al. (1999) Use geographicalinformation system to identify risk for silicosis and planning strategies forprevention, July, 1999. Funded by the Fogarty International Center, NIH.Washington, DC.
Pope MH, Andersson GBJ, Frymoyer JW, Chaffin DB, eds (1991) Occupationallow back pain: assessment, treatment and prevention. Mosby-Year Book, Inc.,St. Louis, MO.
Price B, Ware A (2004) Mesothelioma trends in the United States: an updatebased on surveillance, epidemiology, and End Results program. Data for 1973through 2003. American Journal of Epidemiology, 159:107–112.
Prince MM, Stayner LT, Smith RJ, Gilbert S J (1997) A re-examination of riskestimates from the NIOSH Occupational Noise and Hearing Survey (ONHS). Journal of the Acoustic Society of America, 101:950–963.
Punnett L (1998) Ergonomic stressors and upper extremity disorders in vehiclemanufacturing: cross-sectional exposure-response trends. Occupational andEnvironmental Medicine, 55:414–420.
Punnett L (1999) The costs of work-related musculoskeletal disorders in auto-motive manufacturing. New Solutions: A Journal of Environmental andOccupational Health Policy, 9:403–426.
Punnett L (2002) Ergonomics and public health. Oxford textbook of publichealth. 4th edn. Oxford University Press, Oxford.
Punnett L, Fine LJ, Keyserling WM, Herrin GD, Chaffin DB (1991) Back disor-ders and non-neutral trunk postures of automobile assembly workers. Scan-dinavian Journal of Work, Environment and Health, 17:337–346.
Punnett L, Herbert R (2000) Work-related musculoskeletal disorders: is there agender differential, and if so, what does it mean? In: Women and health.Goldman MB, Hatch MC, eds. Academic Press. San Diego, CA.
1796 Comparative Quantification of Health Risks

Quinlan M (2002) Workplace health and safety effects of precarious employ-ment. In the Global Occupational Health Network Newsletter, Issue No. 2.World Health Organization, Geneva.
Raja S, Ganguly G (1983) Impact of exposure to noise on the hearing acuity ofemployees in a heavy engineering industry. Indian Journal of MedicalResearch, 78:100–113.
Rees D, Cronje R, du Toit RSJ (1992) Dust exposure and pneumoconiosis in aSouth African pottery. 1. Study objectives and dust exposure. British Journalof Industrial Medicine, 49:459–464.
Riihimäki H (1991) Low-back pain, its origin and risk indicators. ScandinavianJournal of Work, Environment and Health, 17:81–90.
Riihimäki H (1995a) Back and limb disorders. In: Epidemiology of work relateddiseases. McDonald C, ed. BMJ Publishing Group, London.
Riihimäki H (1995b) Hands up or back to work- future challenges in epidemi-ologic research on musculoskeletal diseases. Scandinavian Journal of Work,Environment and Health, 21:401–403.
Riihimäki H, Mattsson T, Zitting AJ et al. (1990) Radiographically detectabledegenerative changes of the lumbar spine among concrete reinforcementworkers and house painters. Spine, 15:114–119.
Riihimäki H, Tola S, Videman T, Hänninen K (1989) Low-back pain and occu-pation: a cross-sectional questionnaire study of men in machine operating,dynamic physical work, and sedentary work. Spine, 14:204–209.
Riihimäki H, Viikari-Juntura E, Moneta G, Kuha J, Videman T, Tola S (1994)Incidence of sciatic pain among men in machine operating, dynamic physicalwork and sedentary work. Spine, 19:138–142.
Roach S (1992) Health risks from hazardous substances at work—assessment,evaluation and control. Pergamon Press, New York.
Schierhout GH, Midgley A, Myers JE (1997) Occupational fatality under-reporting in rural areas of the Western Cape Province, South Africa. SafetyScience, 25:113–122.
Sears MR (1997) Descriptive epidemiology of asthma. The Lancet, 350:S1–4.
Shaikh GH (1996) Noise problem in a polyester fiber plant in Pakistan. Indus-trial Health, 34:427–431.
Shannon HS, Mayr J, Haines T (1997) Overview of the relationship betweenorganizational and workplace factors and injury rates. Safety Science,26:201–17.
Shannon HS, Walters V, Lewchuk W et al. (1996) Workplace organizational cor-relates of lost-time accident rates in manufacturing. American Journal ofIndustrial Medicine, 29:258–268.
Silverstein BA, Fine LJ, Armstrong TJ (1986) Hand wrist cumulative trauma dis-orders in industry. British Journal of Industrial Medicine, 43:779–784.
Silverstein BA, Fine LJ, Stetson DS (1987) Hand-wrist disorders among invest-ment casting plant workers. The Journal of Hand Surgery, 12A:838–844.
Marisol Concha-Barrientos et al. 1797

Silverstein BA, Stetson DS, Keyserling WM, Fine LJ (1997) Work-related mus-culoskeletal disorders: comparison of data sources for surveillance. AmericanJournal of Industrial Medicine, 31:600–608.
Silverstein BA, Viikari-Juntura E, Kalat J (2002) Use of a prevention index toidentify industries at high risk for work-related musculoskeletal disorders of the neck, back, and upper extremity in Washington state, 1990–1998.American Journal of Industrial Medicine, 41:149–169.
Simpson M, Bruce R (1981) Noise in America: the extent of the noise problem.(EPA Report No. 550/9-81-101). Environmental Protection Agency, Washington, DC.
Singapore Government (2000) Statistics Singapore—statistical resources—statis-tical classifications—Singapore standard classification (SSOC), online portalavailable at http://www.gov.sg.
Singh N, Davis GS (2002) Review: occupational and environmental lung disease.Current Opinions on Pulmonary Medicine, 8:117–125.
Skovron ML, Szpalski M, Nordin M, Melot C, Cukier D (1994) Socioculturalfactors and back pain: A population-based study in Belgian adults. Spine,19:129–137.
Sluiter JK, Rest KM, Frings-Dresen MHW (2000) Criteria document for evalu-ation of the work-relatedness of upper extremity musculoskeletal disorders.SALTSA Joint Programme for Working Life Research in Europe and Acade-mic Medical Center, University of Amsterdam, Amsterdam.
Smedley J, Egger P, Cooper C, Coggon D (1995) Manual handling activities andrisk of low back pain in nurses. Occupational and Environmental Medicine,52:160–3
Sobti A, Cooper C, Inskip H et al. (1997) Occupational physical activity andlong-term risk of musculoskeletal symptoms: a national survey of post officepensioners. American Journal of Industrial Medicine, 32:76–83.
Soutar C, Robertson A, Miller B, Searl A, Bignon J (2000) Epidemiological evi-dence on the carcinogenicity of silica: factors in scientific judgement. Annalsof Occupational Hygiene, 44:3–14.
Sriwattanatamma P, Breysse P (2000) Comparison of NIOSH noise criteria andOSHA hearing conservation criteria. American Journal of Industrial Medi-cine, 37:334–338.
Stayner L, Smith R, Thun M, Schnorr T, Lemen R (1992) A dose response analy-sis and quantitative assessment of lung cancer risk and occupational cadmiumexposure. Annals of Epidemiology, 2:177–194.
Steenland K, Beaumont J, Elliot L (1991a) Lung cancer in mild steel welders.American Journal of Epidemiology, 133:220–229.
Steenland K, Burnett C, Ward E, Lalich N, Hurrell J (2003) Dying for work: themagnitude of US mortality from selected causes of death associated with occu-pation. American Journal of Industrial Medicine, 43:461–482.
Steenland K, Loomis D, Shy C, Simonsen N (1996) Review of occupational lungcarcinogens. American Journal of Industrial Medicine, 29:474–490.
1798 Comparative Quantification of Health Risks

Steenland K, Sanderson W (2001) Lung cancer among industrial sand workersexposed to crystalline silica. American Journal of Epidemiology, 53:695–703.
Steenland K, Sanderson W, Calvert GM (2001b) Kidney disease and arthritis ina cohort study of workers exposed to silica. Epidemiology, 12:405–412.
Steenland K, Stayner L, Greife A et al. (1991b) Mortality among workersexposed to ethylene oxide. New England Journal of Medicine, 324:1402–1407.
Steenland K, Ward E (1991) Lung cancer incidence among patients with beryl-lium disease: A cohort mortality study. Journal of the National Cancer Insti-tute, 83:1380–1385.
Suter A (2000) Standards and regulations. In: The noise manual, 5th edn, BergerEH, Royster LH, Rozster JD, Driscoll DP, Layne M, eds. American IndustrialHygiene Association, Fairfax, VA.
Tay P (1996) Severe noise-induced deafness: a 10-year review of cases. Singa-pore Medical Journal, 37:362–364.
Toren K (1996) Self-reported rate of occupational asthma in Sweden 1990–1992.Occupational and Environmental Medicine, 53:757–761.
Toren K, Balder B, Brisman J et al. (1999) This risk of asthma. European Res-piratory Journal, 13:496–501.
Toroptsova NV, Benevolenskaya LI, Karyakin AN, Sergeev IL, Erdesz S (1995)“Cross/sectional” study of low backpain among workers at an industrialenterprise in Russia. Spine, 20:328–332.
Tsai SP, Gilstrap EL, Cowles SR, Waddell LC, Ross CE (1992) Personal and jobcharacteristics of musculoskeletal injuries in an industrial population. Journalof Occupational Medicine, 34:606–612.
UN (2000) International standard industrial classification of all economic activities (ISIC). Third revision. United Nations publication(St/ESA/STAT/SER.M/4/Rev.3). United Nations, New York.
UN (2001)World population prospects. The 2000 revision highlights. Popula-tion Division. Department of Economic and Social Affairs, United Nations,New York.
USDHHS (1986) Perspectives in disease prevention and health promotion,leading work-related diseases and injuries—United States. Morbidity andMortality Weekly Report, 35(12). (Noise-induced Loss of Hearing. Reprintedin USDHHS 1991, NIOSH Publications on Noise and Hearing.)
USDOL OSHA (2000) Docket for the Federal Register. (Vol. 65, No. 220.) U.S.Department of Labor, Occupational Safety and Health Administration, Wash-ington, DC.
USDOL OSHA (2002a) Permissible exposure limits, codified at 29 CFR1910.1000. U.S. Department of Labor, Occupational Safety and HealthAdministration. Available at http://www.osha.gov/SLTC/pel/index.html.
USDOL OSHA (2002b) Noise and hearing conservation. U.S. Department ofLabor, Occupational Safety and Health Administration. Available athttp://www.osha-slc.gov/SLTC/noisehearingconservation/index.html
Marisol Concha-Barrientos et al. 1799

USEIA (2001) U.S. Energy Information Administration, U.S. Department of Energy, International Energy Database. Accessed January 2001 atwww.eia.doe.gov/emeu/iea/coal.html.
Vaaranen V, Vasama M, Toikkanen J et al. (1994) Occupational diseases inFinland l993. Institute of Occupational Health, Helsinki.
Venables KM, Chang-Yeung M (1997) Occupational asthma. The Lancet,349:1465–1469.
Videman T, Nurminen M, Troup JDG (1990) Lumbar spine pathology in cadav-eric material in relation to history of back pain, occupation, and physicalloading. Spine, 15:728–740.
Viikari-Juntura E (1997) The scientific basis for making guidelines and standardsto prevent work-related musculoskeletal disorders. Ergonomics,40:1097–1117.
Viikari-Juntura E, Riihimäki H (1999) New avenues in research on muscu-loskeletal disorders. Scandinavian Journal of Work, Environment and Health,25:564–568.
Volinn E (1997) The epidemiology of low back pain in the rest of the world. Areview of surveys in low-and middle-income countries. Spine, 22:1747–1754.
Volinn E, Punnett L (2001) Point of view. Spine, 26:1902–1903.
Volinn E, Spratt KF, Magnusson M, Pope MH (2001) The Boeing prospectivestudy and beyond. Spine, 26:1613–1622.
Waddell G (1991) Low back disability: a syndrome of Western civilization. Neu-rosurgery Clinics of North America, 2:719–738.
Wagner GR, Wegman DH (1998) Occupational asthma: prevention by defini-tion. American Journal of Industrial Medicine, 33:427–429.
Waitzman N, Smith K (1999) Unsound conditions: work-related hearing loss inconstruction, 1960–75. The Center to Protect Worker’s Rights. CPWR Pub-lications, Washington, DC.
Ward E, Okan A, Ruder A, Fingerhut M, Steenland K (1992) A mortality studyof workers at seven beryllium processing plants. American Journal of Indus-trial Medicine, 22:885–904.
Westgaard RH, Jansen T (1992) Individual and work related factors associatedwith symptoms of musculoskeletal complaints: I. A quantitative registrationsystem. British Journal of Industrial Medicine, 49:147–153.
Westgaard RH, Winkel J (1997) Ergonomic intervention research for improvedmusculoskeletal health: a critical review. International Journal of IndustrialErgonomics, 20:463–500.
WHO (1999) International statistical classification of diseases and related healthproblems (ICD-10) in occupational health. Karjalainen A, ed. Protection ofthe Human Environment, Occupational and Environmental Health Series,(WHO/SDE/OEH/99.11). World Health Organization, Geneva.
WHO (2001) Electromagnetic fields and public health: extremely low frequencyfields and cancer. (Fact Sheet No. 263). World Health Organization, Geneva.Available at http://www.who.int/inf-fs/en/fact263.html.
1800 Comparative Quantification of Health Risks

WHO/FIOSH (2001) Occupational exposure to noise: evaluation, preventionand control. Goelzer B, Hansen CH, Sehrndt GA, eds. On behalf of WHO by the Federal Institute for Occupational Safety and Health (FIOSH),Dortmund.
Wikstrom B-O, Kjellberg A, Landstrom U (1994) Health effects of long-termoccupational exposure to whole-body vibration: a review. InternationalJournal of Industrial Ergonomics, 14:273–292.
World Bank (2001) World development indicators 2001. Available athttp://worldbank.com.
Xia Z, Courtney TK, Sorock GS, Zhu J, Fu H, Liang Y, Christiani DC (2000)Fatal occupational injuries in a new development area in the People’s Repub-lic of China. Occupational and Environmental Medicine, 42: 917–922.
Xu X, Christiani DC, Dockery DW et al. (1992) Exposure-response relationshipsbetween occupational exposures and chronic respiratory illness: a commu-nity-based study. American Review of Respiratory Disease, 146:413–418.
Yin SN, Li Q, Liu Y, Tian F, Du C, Jin C (1987) Occupational exposure tobenzene in China. British Journal of Industrial Medicine, 44:192–195.
Yip YB (2001) A study of work stress, patient handling activities and the risk oflow back pain among nurses in Hong Kong. Journal of Advanced Nursing,36:794–804.
Zou Changqi, Gao Yun, Ma Qingyan (1997) Pneumoconiosis in China: current situation and countermeasures. Mineral dusts and prevention of silicosis, 4(2) September 1997. Asian-Pacific Regional Network on Occupational Safety and Health Information (ASIA-OSH). Available athttp://www.ilo.org/public/english/region/asro/.
Marisol Concha-Barrientos et al. 1801