Embed Size (px)
Citation preview
Chapter 21 New Method for Analytical Photovoltaic Parameters Identification: Meeting Manufacturer's Datasheet for Different Ambient Conditions
Javier Cubas, Santiago Pindado and Carlos de Manuel
Abstract At present, photovoltaic energy is one of the most important renewable energy sources. The demand for solar panels has been continuously growing, both in the industrial electric sector and in the private sector. In both cases the analysis of the solar panel efficiency is extremely important in order to maximize the energy production. In order to have a more efficient photovoltaic system, the most accurate understanding of this system is required. However, in most of the cases the only information available in this matter is reduced, the experimental testing of the photovoltaic device being out of consideration, normally for budget reasons. Several methods, normally based on an equivalent circuit model, have been developed to extract the I-V curve of a photovoltaic device from the small amount of data provided by the manufacturer. The aim of this paper is to present a fast, easy, and accurate analytical method, developed to calculate the equivalent circuit parameters of a solar panel from the only data that manufacturers usually provide. The calculated circuit accurately reproduces the solar panel behavior, that is, the I-V curve. This fact being extremely important for practical reasons such as selecting the best solar panel in the market for a particular purpose, or maximize the energy extraction with MPPT (Maximum Peak Power Tracking) methods.
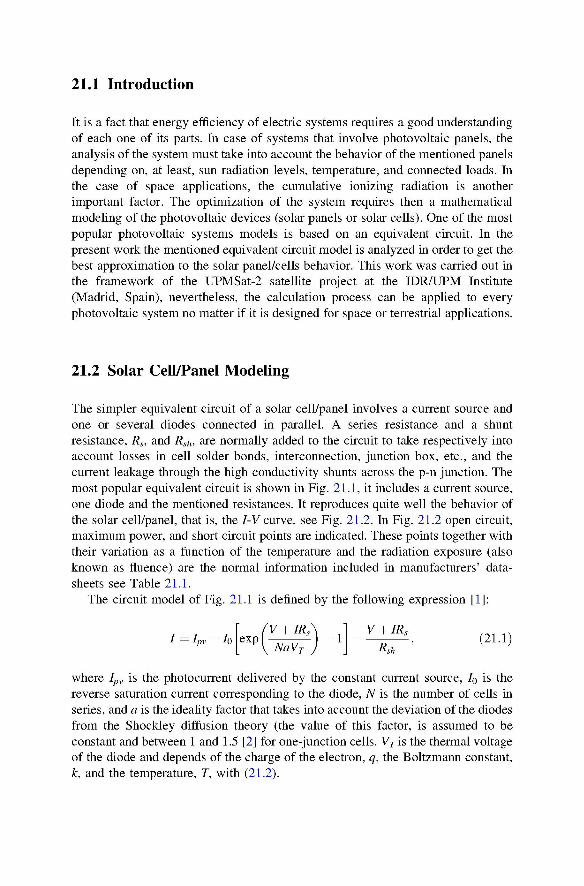
21.1 Introduction
It is a fact that energy efficiency of electric systems requires a good understanding of each one of its parts. In case of systems that involve photovoltaic panels, the analysis of the system must take into account the behavior of the mentioned panels depending on, at least, sun radiation levels, temperature, and connected loads. In the case of space applications, the cumulative ionizing radiation is another important factor. The optimization of the system requires then a mathematical modeling of the photovoltaic devices (solar panels or solar cells). One of the most popular photovoltaic systems models is based on an equivalent circuit. In the present work the mentioned equivalent circuit model is analyzed in order to get the best approximation to the solar panel/cells behavior. This work was carried out in the framework of the UPMSat-2 satellite project at the IDR/UPM Institute (Madrid, Spain), nevertheless, the calculation process can be applied to every photovoltaic system no matter if it is designed for space or terrestrial applications.
21.2 Solar Cell/Panel Modeling
The simpler equivalent circuit of a solar cell/panel involves a current source and one or several diodes connected in parallel. A series resistance and a shunt resistance, Rs, and Rsu, are normally added to the circuit to take respectively into account losses in cell solder bonds, interconnection, junction box, etc., and the current leakage through the high conductivity shunts across the p-n junction. The most popular equivalent circuit is shown in Fig. 21.1, it includes a current source, one diode and the mentioned resistances. It reproduces quite well the behavior of the solar cell/panel, that is, the I-V curve, see Fig. 21.2. In Fig. 21.2 open circuit, maximum power, and short circuit points are indicated. These points together with their variation as a function of the temperature and the radiation exposure (also known as fluence) are the normal information included in manufacturers' datasheets see Table 21.1.
The circuit model of Fig. 21.1 is defined by the following expression [1]:
i i i\ fV + IR>\ i / = / p v - / o ^ e x p ( ^ - ) - l
where Ipv is the photocurrent delivered by the constant current source, I0 is the reverse saturation current corresponding to the diode, N is the number of cells in series, and a is the ideality factor that takes into account the deviation of the diodes from the Shockley diffusion theory (the value of this factor, is assumed to be constant and between 1 and 1.5 [2] for one-junction cells. VVis the thermal voltage of the diode and depends of the charge of the electron, q, the Boltzmann constant, k, and the temperature, T, with (21.2).
V + IR,
R sh (21.1)
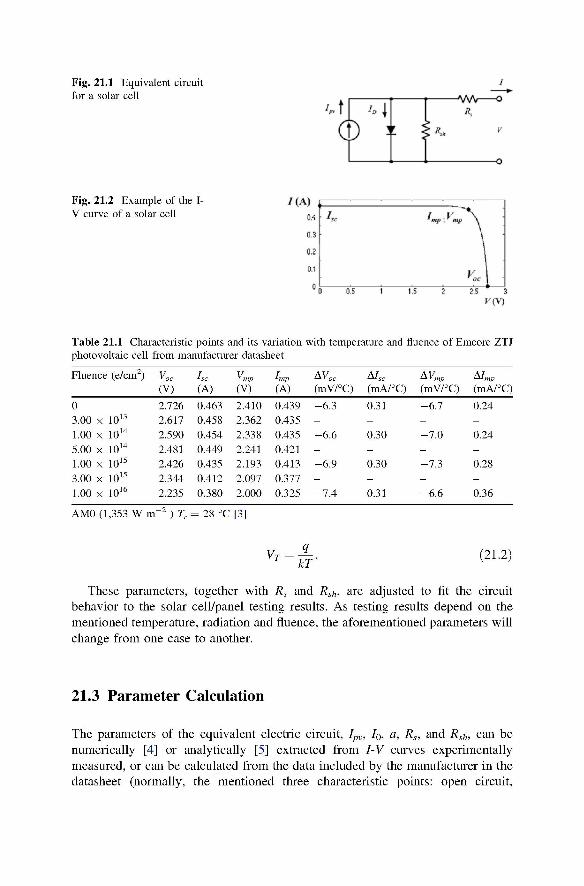
Fig. 21.1 Equivalent circuit for a solar cell u
0 M -AAA/ o
Fig. 21.2 Example of the I-V curve of a solar cell
i ' CA l x
0 3
CS
0.1
0 ) 0.5 1.5
\ J
K\ 2 25 3
f ( V )
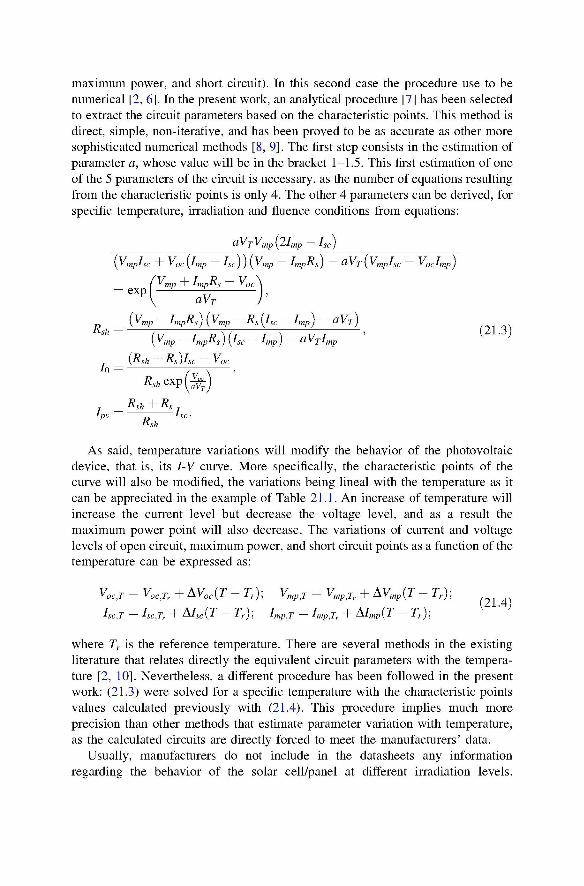
Table 21.1 Characteristic points and its variation with temperature and fiuence of Emcore ZTJ photovoltaic cell from manufacturer datasheet
Fiuence (e/cm2)
0 3.00 x 10¹³
1.00 x 10¹⁴
5.00 x 10¹⁴
1.00 x 10¹⁵
3.00 x 10¹⁵
1.00 x 10¹⁶
V„c
(V)
2.726 2.617 2.590 2.481 2.426 2.344 2.235
he (A)
0.463 0.458 0.454
0.449 0.435 0.412 0.380
v ' nip (V)
2.410 2.362 2.338 2.241 2.193 2.097 2.000
*mp
(A)
0.439 0.435 0.435 0.421 0.413 0.377 0.325
AVoc
(mV/°C)
-6 .3
--6 .6
--6 .9
--7 .4
A/sc
(mA/°C)
0.31
-0.30
-0.30
-0.31
AVmp
(mV/°C)
-6 .7
--7 .0
--7 .3
--6 .6
A/mp
(mA/°C)
0.24
-0.24
-0.28
-0.36
AM0 (1,353 W irT2 ) Tr = 28 °C [3]
Vr JL kT'
(21.2)
These parameters, together with Rs and Rsh, are adjusted to fit the circuit behavior to the solar cell/panel testing results. As testing results depend on the mentioned temperature, radiation and fiuence, the aforementioned parameters will change from one case to another.
21.3 Parameter Calculation
The parameters of the equivalent electric circuit, Ipv, I0, a, Rs, and Rsh, can be numerically [4] or analytically [5] extracted from I-V curves experimentally measured, or can be calculated from the data included by the manufacturer in the datasheet (normally, the mentioned three characteristic points: open circuit,
maximum power, and short circuit). In this second case the procedure use to be numerical [2, 6]. In the present work, an analytical procedure [7] has been selected to extract the circuit parameters based on the characteristic points. This method is direct, simple, non-iterative, and has been proved to be as accurate as other more sophisticated numerical methods [8, 9]. The first step consists in the estimation of parameter a, whose value will be in the bracket 1-1.5. This first estimation of one of the 5 parameters of the circuit is necessary, as the number of equations resulting from the characteristic points is only 4. The other 4 parameters can be derived, for specific temperature, irradiation and fluence conditions from equations:
&*T*mp\^mp *-sc)
\*mp'-sc i Voc\lmp *sc J J \ * mp ^mp^sj ^ *T \ *mp'-sc *oc'-mpj
'V + / R — V , v mp i 1mp1Ys v "<
= exp | — — aV, T
u \ *mp l-mpK-s J yV mp Ks\*sc *-mp) ClVfJ
sh= (V -I R)(I -I ) - aVrl ' ( 2 L 3 )
y v mp 1mplvs) y-sc 1mpJ "- v 11m
h =
-mp
(Rsh + Rs)ISc — Voc
Rsh ex-P aV]
j _ Rsh +RS j Lnv „ ls<
Ksh *pv
As said, temperature variations will modify the behavior of the photovoltaic device, that is, its I-V curve. More specifically, the characteristic points of the curve will also be modified, the variations being lineal with the temperature as it can be appreciated in the example of Table 21.1. An increase of temperature will increase the current level but decrease the voltage level, and as a result the maximum power point will also decrease. The variations of current and voltage levels of open circuit, maximum power, and short circuit points as a function of the temperature can be expressed as:
VOC,T = Voc,Tr + AVoc(T - TV); VmPiT = VmPiTr + AVmp(T - TV);
*sc,T *sc,Tr i L\1SC\1 *-r)> lmp,T ^mp,Tr > {\lmp\l *-r)>
where TV is the reference temperature. There are several methods in the existing literature that relates directly the equivalent circuit parameters with the temperature [2, 10]. Nevertheless, a different procedure has been followed in the present work: (21.3) were solved for a specific temperature with the characteristic points values calculated previously with (21.4). This procedure implies much more precision than other methods that estimate parameter variation with temperature, as the calculated circuits are directly forced to meet the manufacturers' data.
Usually, manufacturers do not include in the datasheets any information regarding the behavior of the solar cell/panel at different irradiation levels.
However, it is known that the I-V curve is essentially invariant with intensity in ranges around one solar constant. On the other hand, temperature affects Isc linearly and Voc exponentially, whereas Rs remains not affected for temperature variations [11]. Those conditions, once simulated using an equivalent circuit, lead to the following expression [2]:
Ipv,G = Ipv,Gr 7 T , (21.5)
where G is the irradiance on the cell/solar panel, Ipv G is the photocurrent delivered by the current source of the equivalent circuit, and Gr and IpVrar are the reference values.
The radiation exposure or fluence radiation is translated into a degradation of the photovoltaic system performances. Obviously, the fluence modifies the characteristic points of the I-V curve, as it can be observed in the example of Table 21.1. However, in this case the variation is not linear, and normally is not easy to interpolate using the manufacturers' data. Additionally, fluence radiation degradation is a slow process that will take months or years to affect visibly the operation of the cell. For this reason it seems reasonable to calculate separately the circuit parameters for each one of the fluence levels specified in the manufacturers' datasheets (see Table 21.1), and apply the proper one for each stage of the mission.
21.4 Example of Application, LTSpice Model
In this Section, the method explained above is applied in the performance analysis of a commercial solar cell, Emcore ZTJ, for every irradiance and temperature condition, using LTSpice models fitted to the experimental data from the manufacturer (see Table 21.1). Although, the mentioned analysis is carried out for zero fluence, it can be easily reproduced for different levels of radiation exposure (see other fluence levels in Table 21.1).
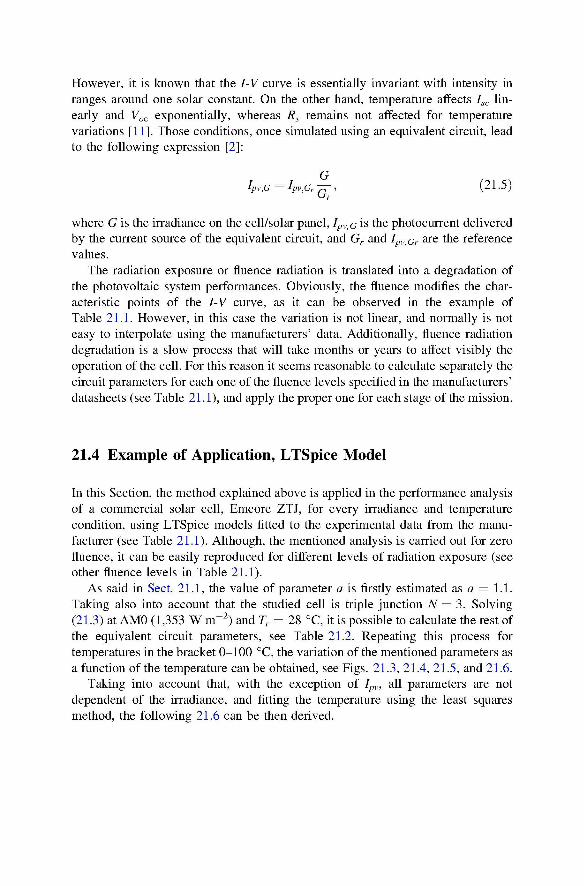
As said in Sect. 21.1, the value of parameter a is firstly estimated as a = 1.1. Taking also into account that the studied cell is triple junction N = 3. Solving (21.3) at AMO (1,353 W m"2) and Tr = 28 °C, it is possible to calculate the rest of the equivalent circuit parameters, see Table 21.2. Repeating this process for temperatures in the bracket 0-100 °C, the variation of the mentioned parameters as a function of the temperature can be obtained, see Figs. 21.3, 21.4, 21.5, and 21.6.
Taking into account that, with the exception of Ipv, all parameters are not dependent of the irradiance, and fitting the temperature using the least squares method, the following 21.6 can be then derived.
Table 21.2 Parameters of equivalent circuit of Emcore ZTJ
N
3
a
1.1
Ipv (A)
0.463
/o(A)
6.80 x 10~15
RS(Q)
6.09 x 10~2
Rsh
284.4
AMO (1,353 W irT2 ) Tr = 28 °C
Fig. 21.3 Calculated RS(T) and polynomial regression
0.075
0.07 •
~ 0.065
[ ] 5
u.:55
R5m
Calculated Values ofRs
-Polynomial regression ?
20 40 50
/ 7
, /
fin i[..]
Fig. 21.4 Calculated RSh(T) and polynomial regression
550 r
500 •
450 •
400 •
350
300
250
%, m
•
• Calculated Values of J ^ *
~J /
• •
?' ta 60 TTO
f..l 100
Fig. 21.5 Calculated Ipv(T) and polynomial regression
0.49
n . ; =
< 0.47
0 46
0.45 : • ]
Um Calculated Va lues I
- Polynomial regression
4 0 SO E: i [ ]
X if: L
2£
2
ten • Calculaled Values cf L
Polynomial regression
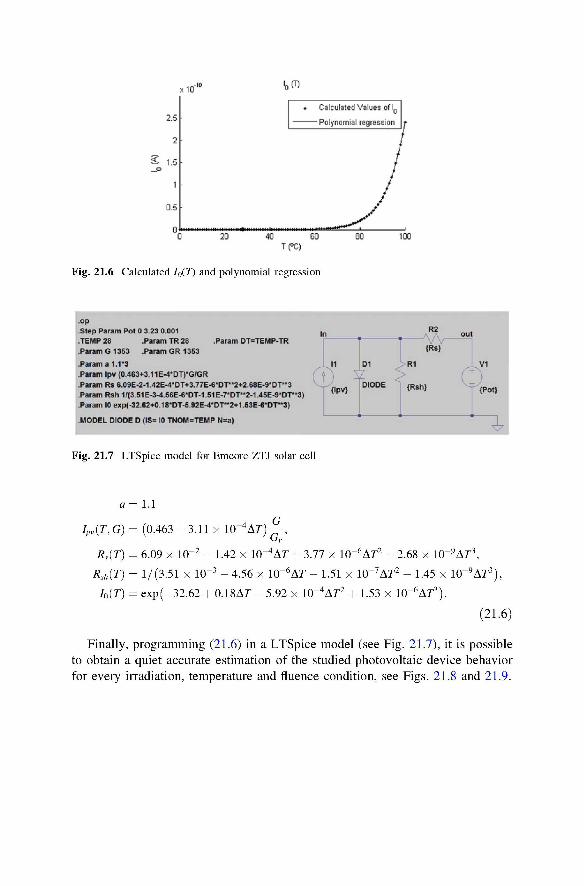
Fig. 21.6 Calculated IQ(T) and polynomial regression
op Step Param Pot 0 3.23 0.001 .TEMP 28 .Param TR 28 .Param DT=TEMP-TR .Param G 13S3 .Param GR 1353 .Param a 1.1*8 .Param Ipv (0.463+3 11E-4-DT)-G<GR .Param Rs 6.09E-2-1.42E-4*OT+3.77E-«*DT"2+2,68E-9'DT"3 .Param Rsh 1/(3.51E-3J!.5GE-6*OT-1.51E-7*DT**2-1.45E-9*DT**3) .Param 10 eip(-32 62+0.18*DT-5 92E -4*DT"2+1.53E-6*DT"3)
MODEL DIODE D (IS= 10 TNOM=TEMP N=a)
Fig. 21.7 LTSpice model for Emcore ZTJ solar cell
a= 1.1
( r , G) = (0.463 3.11 x W^AT) Gr'
RS(T) = 6.09 x 10~2 - 1.42 x 10"4Ar + 3.77 x lO^Ar2 + 2.68 x 10~9Ar3,
Rsh{T) = 1/(3.51 x 10"3 -4.56 x W'6AT-1.51 x l (T7Ar2- 1.45 x 10"9Ar3),
I0{T) = exp(-32.62 + 0.18A7/-5.92 x 10"4Ar2+ 1.53 x 10"6Ar3).
(21.6)
Finally, programming (21.6) in a LTSpice model (see Fig. 21.7), it is possible to obtain a quiet accurate estimation of the studied photovoltaic device behavior for every irradiation, temperature and fluence condition, see Figs. 21.8 and 21.9.
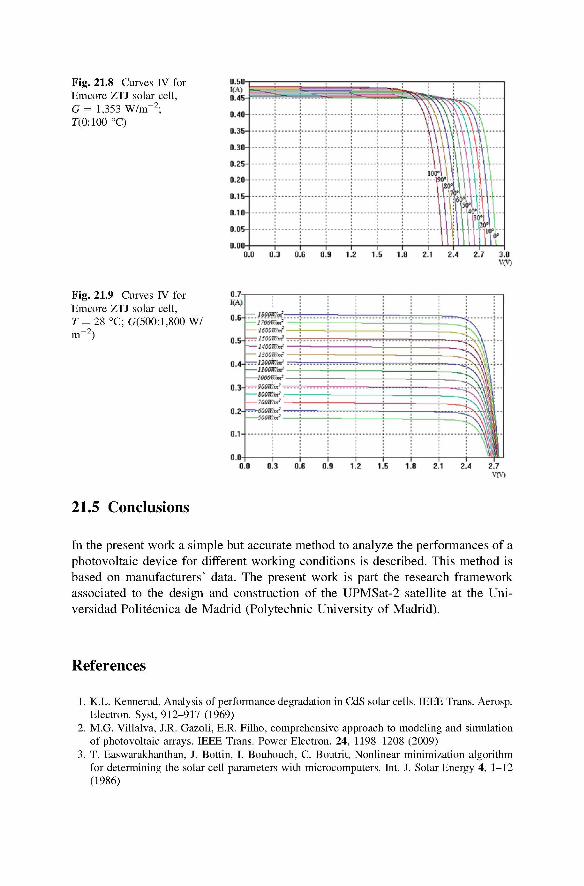
Fig. 21.8 Curves IV for Emcore ZTJ solar cell, G = 1,353 W/rrT2; r(0:100 °C)
Fig. 21.9 Curves IV for Emcore ZTJ solar cell, T = 28 °C; G(500:l,800 W/ m-2)
a./ [(A;
[15-
u.-i-
[1.3-
(1,1-
[)
r : ^ v \
— ^ A W V
D 0,1 o.n
,...,... : : i
! 0,9
"" T "
: : :
! i_? 1.F
l 1,0
; I
?-1 2 A 2.7 -TV)
21.5 Conclusions
In the present work a simple but accurate method to analyze the performances of a photovoltaic device for different working conditions is described. This method is based on manufacturers' data. The present work is part the research framework associated to the design and construction of the UPMSat-2 satellite at the Uni-versidad Politecnica de Madrid (Polytechnic University of Madrid).
References
K.L. Kennerud, Analysis of performance degradation in CdS solar cells. IEEE Trans. Aerosp. Electron. Syst, 912-917 (1969) M.G. Villalva, J.R. Gazoli, E.R. Filho, comprehensive approach to modeling and simulation of photovoltaic arrays. IEEE Trans. Power Electron. 24, 1198-1208 (2009) T. Easwarakhanthan, J. Bottin, I. Bouhouch, C. Boutrit, Nonlinear minimization algorithm for determining the solar cell parameters with microcomputers. Int. J. Solar Energy 4, 1-12 (1986)

4. J.C.H. Phang, D.S.H. Chan, J.R. Phillips, Accurate analytical method for the extraction of solar cell model parameters. Electron. Lett. 20, 406^-08 (1984)
5. W. Xiao, W.G. Dunford, A. Capel, in A Novel Modeling Method for Photovoltaic Cells. 2004 IEEE 35th Annual Power Electronics Specialists Conference (IEEE Cat. No.04CH37551) (2004), pp. 1950-1956 )
6. J. Cubas, S. Pindado, M. Victoria, On the analytical approach for modeling photovoltaic systems behavior. J. Power Sources 247, 467^-74 (2014)
7. W. Gong, Z. Cai, Parameter extraction of solar cell models using repaired adaptive differential evolution. Sol. Energy 94, 209-220 (2013)
8. A. Askarzadeh, A. Rezazadeh, Parameter identification for solar cell models using harmony search-based algorithms. Sol. Energy 86, 3241-3249 (2012)
9. S. Lineykin, in Five-Parameter Model of Photovoltaic Cell Based on STC Data And Dimensionless. 2012 IEEE 27th Convention of Electronical and Electronics Engineers in Israel (2012), pp. 1-5
10. H.S. Rauschenbach, Solar Cell Array Design Handbook, The Principles and Technology of Photovoltaic Energy Conversion. (Van Nostrand Reinhold Co, New York, 1980)
11. Emcore: ZTJ photovoltaic cell (2011), www.emcore.com