Embed Size (px)
Citation preview


Women workers build transparent noses forA-20 attack bombers during World War II.
Courtesy of National Archives atCollege Park, Maryland.
Chapter 2
Work

The majority of the male labor force shifted from materialextraction to material processing to working with
people and information.
Throughout history, most men were engaged in primary occupations such asfarming or fishing, while a few craftsmen made artifacts and a handful of priests,scribes, and officials worked with their heads rather than their hands. TheIndustrial Revolution broke that pattern, transforming millions of farmers into fac-tory workers. In Great Britain, the first country to industrialize, factory workersoutnumbered farm workers by 1840. In the United States, a comparable shift inthe occupational balance occurred shortly after 1900. This shift from the primaryoccupations of material extraction to the secondary occupations of material pro-cessing continued for more than half a century. By 1970, the proportion of thelabor force engaged in primary occupations had declined to less than 5 percent.
The subsequent shift from secondary work with tools and materials to tertiary workwith information and people, already under way in 1900, gathered momentumthroughout the century and by 1970, more men held white-collar than blue-collarjobs. The proportion of the male labor force employed in tertiary occupations—professional, technical, managerial, clerical, and service work—more than tripledduring the century, from 21 percent in 1900 to 58 percent in 1998.
An upgrading within each of these categories became apparent after 1960, when theratio of upper white-collar occupations (professionals, managers, officials, techni-cians) to lower white-collar occupations (mostly clerks and salesmen) increased sig-nificantly, as did the ratio of upper manual occupations (craftsmen and skilledartisans) to lower manual occupations (machine operators and laborers).
The long-term shift from digging, riveting, and hammering to filling out forms,negotiating agreements, and writing software continued unabated. Even instraightforward industrial production, computerization expanded the need foradministrative activities while minimizing the demand for physical labor. Blue-collar workers were increasingly found at desks rather than workbenches.
24 The First Measured Century

0%
10%
20%
30%
40%
50%
60%
1900 1920 1940 1960 1980 2000
Secondary occupations(craftsmen, foremen, operatives, laborers, repairers, truck drivers, etc.)
Primary occupations(farmers, fishermen, forestry workers, miners, etc.)
Tertiary occupations(professional, technical and kindred workers; managers, officials, and proprietors; clerical and sales workers; service workers; etc.)
1998 = 58%
1998 = 38%
1998 = 4%
1900 = 21%
1900 = 42%
1900 = 38%
Men’s OccupationsPercentage of male workers employed in each economic sector
Work 25

The decline of the farm population reflects a long process ofattrition driven by huge technical advances in agriculture.
During the first half of the century, the number of farms in the United States did notchange markedly. Thus, the number of farms at midcentury—5.4 million—was onlyslightly lower than the 5.7 million farms that were operating in 1900. But from 1950to 1997, when the last Census of Agriculture of the century was published, the num-ber of farms—and farm operators—declined sharply, from 5.4 million to 1.9 million.
The principal cause of this reduction was the rapid improvement of agriculturalproductivity as new methods and machinery were introduced. From 1900 to 1997,the yield of wheat per acre tripled, while the time required to cultivate an acre ofwheat decreased from more than two weeks to about two hours. At the same time,the yield of corn per acre increased fivefold, while the time required to cultivate anacre of corn declined from thirty-eight hours in 1900 to two hours in 1997.
These gains in productivity were the result of several kinds of technologicaladvances, jointly applied. Tractors began to replace horses for planting and harvest-ing soon after 1900. Their speed, power, and efficiency increased from year to year.By about 1950, tractors wholly replaced the horses, donkeys, and mules that hadserved farmers for millennia. Chemical fertilizers and pesticides, unknown in 1900,accounted for about 5 percent of farm production costs in 1950 and about 20 per-cent by the end of the century. At the same time, the agricultural experiment stationsof the grain-producing states worked continuously to improve the hardiness andyield of crops by selection, hybridization, and, later, genetic engineering.
Large-scale farmers were better able than small-scale farmers to take advantage ofthese new methods and superior products as they became available. They werealso better able to protect their farms from the vagaries of temperature and rain-fall that beset all farming operations. Unable to compete, many small-scale farm-ers were forced to give up their farms. In addition, many less efficient farmerswere pushed off the land during the periodic crises brought on by droughts,floods, high interest rates, and price fluctuations. Others left the farms to pursuejob opportunities that emerged in rural areas as industrial and commercial enter-prises decentralized. As a result of these trends, between 1950 and 1998, thenumber of Americans employed in agriculture declined by 53 percent, while thesize of the average farm more than doubled.
At the end of the century, the surviving farm operators were a distinctive popu-lation—overwhelmingly white (98 percent), male (92 percent), and middle-agedor older (their average age was fifty-four). The great majority had lived on thefarms they owned and operated for ten years or more. But only about half of themworked full-time at farming; the others also had jobs in town.
26 The First Measured Century

0
1
2
3
4
5
6
7
1900 1920 1940 1960 1980 2000
1997 = 1.9
1900 = 5.7
Farm OperatorsMillions
Work 27

Even in blue-collar occupations, men’s work becamecleaner, less strenuous, and much safer.
Occupational safety improved significantly throughout the American economy.In coal mining and railroading, two of the most dangerous occupations in theUnited States, total work accidents declined precipitously during the century.Work injuries showed a similar trend in most other occupations.
At the beginning of the century, men still loaded hundred-pound pigs of iron intoboxcars without any kind of mechanical assistance. Frederick Taylor, the fatherof scientific management, became famous by teaching them how to do it faster.Serious injuries were routine.
The factories of that era were typically dark, cluttered, poorly ventilated, andfilthy. Men worked in searing heat at furnace doors and in icy drafts a few yardsaway. At the end of the day, covered with grease and grime, they returned tohomes that had no running water.
In the course of the century, more men found white-collar jobs, and the physicalconditions of blue-collar work got better in every way. These improvements weredriven primarily by changes in production technology. Workers were moved far-ther from harm and given much better protection when they were close to dan-ger. Forklifts and conveyors took over the heavy lifting. Safety devices wereadded to every type of machinery. Factories were cleaned up and air-conditioned.Automatic monitoring systems were installed to warn of dangerous conditions.
Other factors that influenced the decline of industrial accidents were the expansionof tort liability, which exposed the makers and owners of industrial equipmentinvolved in accidents to expensive litigation; the inclusion of workplace safety as abargaining issue with unions; and government-imposed safety regulations.
28 The First Measured Century

0
1,000
2,000
3,000
4,000
5,000
1900 1920 1940 1960 1980 2000
Mines
Railroads
1900 = 1,489
1907 = 4,534
1997 = 93
1997 = 32
Employee Fatalities: Coal Mines and RailroadsAnnual Number Killed at Work
Work 29

Propelled by advances in technology, the ratio of engineersto population increased steadily. The comparable ratio for
lawyers and physicians, however, remained largelyunchanged until 1970, when it began to rise markedly.
The supply of engineers per thousand population increased in every decade,driven by technological progress and increasingly complex production processes.Most engineers were middle-level employees of large enterprises. At the end ofthe century, a bachelor’s degree was still sufficient for licensing in many engi-neering specialties.
The relative supply of lawyers was more responsive to trends in social policy thanto technological progress. Because requirements for entry were raised during thefirst half of the century and the size of law schools was effectively restricted, theratio of lawyers to population was slightly lower in 1970 than in 1900. The num-ber of lawyers per thousand population nearly tripled between 1970 and 1998,however, largely in response to the widening role of governments and a boom inlitigation.
The relative supply of physicians declined early in the century, primarily as a con-sequence of the 1910 Flexner Report, which brought reform to the standards andcurricula of U.S. medical schools and closed marginal schools. As a result, thenumber of physicians per thousand population remained almost unchanged from1920 to 1970. Licensing requirements continued to be raised until certificationin some specialties involved eight or more years of formal training. Most physi-cians were independent practitioners. The restriction of supply in the face ofincreasing demand gave physicians the highest average incomes of any occupa-tional group. Such restrictive policies were largely abandoned after 1970 inresponse to public pressure, as well as massive new funding from the Medicareand Medicaid programs (see page 152).
30 The First Measured Century

0
1
2
3
4
5
6
7
8
1900 1920 1940 1960 1980 2000
Engineers
Lawyers
Physicians
1998 = 7.6
1998 = 3.5
1998 = 2.7
1900Physicians = 1.7Lawyers = 1.4Engineers = 0.5
Engineers, Lawyers, and Physicians Per thousand population
Work 31

The proportion of American men who were in thelabor force declined.
The labor force participation rate of adult men gradually decreased from 86 per-cent in 1900 to 75 percent in 1998. The century’s peak labor force participationrate—88 percent—occurred during World War II.
The decline in labor force participation was most conspicuous for men aged sixty-five and older. Two of every three were working or looking for work in 1900. By1998, only one of six was so engaged. The decline was steep and steady, and itwas well under way before the introduction of Social Security and subsequentexpansion of private pension plans. This precipitous decline ended in the late1980s, but whether this portends an increase in the labor force participation ofmen aged sixty-five and older was still not clear at the end of the century.
The withdrawal of younger men from the labor force can be traced to a variety offactors, including the following: (1) increased involvement in full-time highereducation; (2) the availability of income support for people with mild disabilities;(3) military and civil service pensions awarded after relatively short service; (4)early retirement from corporate employment; (5) illicit gains in the drug tradeand other criminal activities; and (6) a wider distribution of investment income.
Education, marriage, and race had striking effects on labor force participationrates. Only 7 percent of male college graduates under sixty-five were out of thelabor force in 1998, compared with 25 percent of men in the same age group whohad not finished high school. Married men of any age were more likely to be inthe labor force than single, divorced, or widowed men. Black men had a lower-than-average participation rate, but Hispanic men had a higher-than-average rate.
32 The First Measured Century

Work 33
0%
25%
50%
75%
100%
1900 1920 1940 1960 1980 2000
All ages
Ages 65+
1900 = 63%
1998 = 17%
1998 = 75%
1900 = 86%
The Shortening of Men’s Working LivesPercentage of adult men in the labor force

Daily and weekly work hours declined until World War II, butannual work hours continued to decline moderately
throughout the century.
In 1890, the typical factory work schedule was ten hours a day, six days a week,for a total of sixty hours. Thereafter, it fell steadily, reaching thirty-five hours perweek in 1934. Expecting this trend to continue, most observers anticipated theadvent of a twenty-hour workweek. It never happened. The average factory work-week climbed to forty-five hours at the peak of production during World War II,declined to forty hours after the war, and remained at that level until the early1980s, when it began to inch upward. By 1999, the average manufacturingemployee worked about forty-two hours per week.
The hours of office workers were slightly shorter and much more comfortable in1900. While factory workers ate lunch at their machines, office workers came inlater and went home for a long lunch at midday. Saturday became a half-day forboth groups after 1920 and disappeared from most work schedules around 1960.Office workers continued to come in later and work shorter hours throughout thecentury.
Retail store employees always had heavier-than-average schedules. Thirteen-hourworkdays were common in retail stores in the early years of the century. At theend of the century, retail employees worked shorter hours, but they were oftenrequired to work on weekends and holidays.
Unlike weekly and daily hours, annual work hours continued to decline slowlybecause of longer vacations, more sick and parental leave, and time off for obli-gations such as voting, jury duty, and military reserve service.
Average work hours are calculated for full-time or full-time-equivalent workersand do not include the steadily increasing numbers of part-time and seasonalworkers or multiple jobholders. Taken together, these workers constituted abouta third of the U.S. labor force at the end of the century.
34 The First Measured Century

3 0
3 5
4 0
4 5
5 0
5 5
1900 1920 1940 1960 1980 2000
1900 = 53 hours/week
1999 = 42 hours/week
World War II
Great Depression
Work Hours in ManufacturingAverage hours per week for full-time workers
Work 35
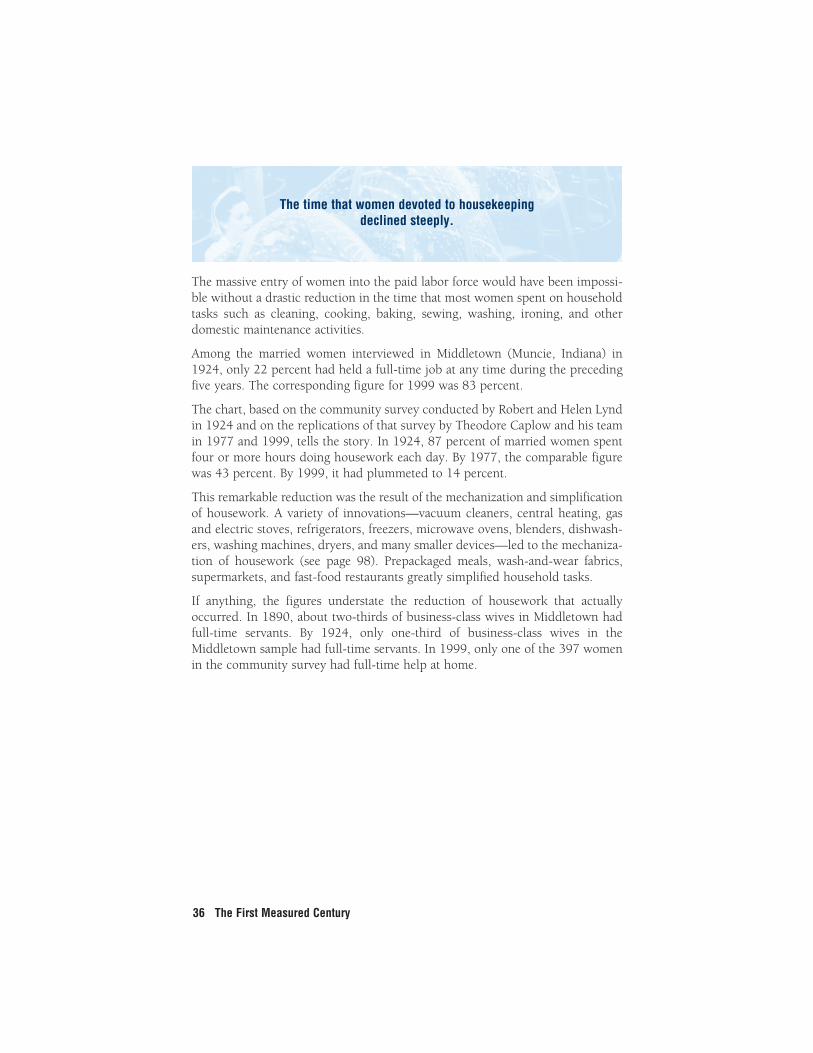
The time that women devoted to housekeepingdeclined steeply.
The massive entry of women into the paid labor force would have been impossi-ble without a drastic reduction in the time that most women spent on householdtasks such as cleaning, cooking, baking, sewing, washing, ironing, and otherdomestic maintenance activities.
Among the married women interviewed in Middletown (Muncie, Indiana) in1924, only 22 percent had held a full-time job at any time during the precedingfive years. The corresponding figure for 1999 was 83 percent.
The chart, based on the community survey conducted by Robert and Helen Lyndin 1924 and on the replications of that survey by Theodore Caplow and his teamin 1977 and 1999, tells the story. In 1924, 87 percent of married women spentfour or more hours doing housework each day. By 1977, the comparable figurewas 43 percent. By 1999, it had plummeted to 14 percent.
This remarkable reduction was the result of the mechanization and simplificationof housework. A variety of innovations—vacuum cleaners, central heating, gasand electric stoves, refrigerators, freezers, microwave ovens, blenders, dishwash-ers, washing machines, dryers, and many smaller devices—led to the mechaniza-tion of housework (see page 98). Prepackaged meals, wash-and-wear fabrics,supermarkets, and fast-food restaurants greatly simplified household tasks.
If anything, the figures understate the reduction of housework that actuallyoccurred. In 1890, about two-thirds of business-class wives in Middletown hadfull-time servants. By 1924, only one-third of business-class wives in theMiddletown sample had full-time servants. In 1999, only one of the 397 womenin the community survey had full-time help at home.
36 The First Measured Century

0%
87%
43%
14%13%
45%
53%
12%
33%
0%
25%
50%
75%
100%
1924 1977 1999
4 hours or more
2–3 hours
One hour or less
Daily Housework in MiddletownPercentage of Middletown housewives in each category
Work 37

Married women entered the paid labor force inlarge numbers.
In 1900, only 6 percent of married women worked outside the home, usuallywhen their blue-collar husbands were unemployed. Among wives with childrenat home, very few worked at all. Almost half of single women held jobs, but theyusually stopped working when they married or, at the latest, when they got preg-nant, and most never worked for pay again. About a third of widowed anddivorced women worked, typically out of economic necessity. Never-marriedwomen with children were virtually unknown.
The labor force participation rate of single women peaked in World War II andthen declined as large numbers of them pursued higher education. The sharpjump in their work force participation in 1967 is a statistical artifact reflecting anincrease in the defined minimum age of the labor force from fourteen to sixteenyears old. In the early 1970s, the labor force participation rate of single womenbegan a steady rise to nearly 70 percent by 1998 (see chart at upper left).
The labor force participation rate of widowed, divorced, and separated womenremained fairly stable until 1940, when it began a gradual rise to nearly 50 per-cent (see chart at upper right). These women were considerably older on averagethan those in the other three groups, and many had income sources such as sur-vivors’ benefits or alimony payments.
The steady movement of married women into the labor force began around 1920,spiked during World War II, and never abated (see chart at lower left). In 1998,more than 60 percent of all married women living with their husbands workedfor pay outside the family home. Their labor force participation was only slightlylower than that of single women and considerably higher than that of widowed,divorced, and separated women.
Data on the labor force participation of married women with children under agesix go back only to 1950, but the rise since then has been sharp (see chart atlower right). Their labor force participation rate increased more than fivefold,from 12 percent in 1950 to 64 percent in 1998, helping to create an entire indus-try of paid day care in the process.
38 The First Measured Century

0%
25%
50%
75%
1900 1920 1940 1960 1980 2000
Single
World War II 1998 = 69%
1900 = 44%
Single
0%
25%
50%
75%
1900 1920 1940 1960 1980 2000
World War II
1998 = 61%
1900 = 6%
Married
0%
25%
50%
75%
1900 1920 1940 1960 1980 2000
1998 = 64%
1950 = 12%
Married, with Children under Age 6
0%
25%
50%
75%
1900 1920 1940 1960 1980 2000
1900 = 33%
1998 = 49%
Widowed, Divorced, or Separated
Widowed, Divorced, or Separated
Labor Force Participation of WomenPercentage of each group in labor force
Work 39

Attitudes toward the employment of married women shiftedfrom strong disapproval to equally strong approval.
In 1936, a Gallup poll asked a national sample, “Should a married woman earnmoney if she has a husband capable of supporting her?” By overwhelming majori-ties, both men and women said she should not. In 1972 and later years, theGeneral Social Survey asked an almost identical question: “Do you approve or dis-approve of a married woman earning money in business or industry if she has ahusband capable of supporting her?” By overwhelming majorities, both men andwomen approved.
Although the questions were the same, the context of the responses changed. Inthe early part of the century, as the Lynds’ Middletown studies demonstrate, theincome of a married man was ordinarily adequate to support his family at theaccustomed level of his occupational class. Women, moreover, carried an enor-mous burden of housework (see page 36). At that time, the employment ofwomen was associated with lower family status. The wives of business and pro-fessional men rarely worked outside the home. But the intermittent unemploy-ment of factory workers, even in prosperous times, forced their wives to take jobsoutside the home when their husbands were idle. A woman who worked whileher husband was employed was often thought to be taking the job of anotherfamily’s breadwinner.
By the end of the century, the situation had changed dramatically. Except for menin the top professions, the income of a married man was ordinarily not adequateto support a family at the usual level of his occupational class. The burden ofhousework had been substantially reduced. Many women received educationappropriate to professional work and expected to work even after they marriedand had children. The employment of women ceased to be associated with lowerfamily status, and became the modal pattern in middle-income families and wide-spread in upper-income families.
40 The First Measured Century

0%
25%
50%
75%
100%
1900 1920 1940 1960 1980 2000
Disapprove
Approve
1936 = 82% 1996 = 83%
1996 = 17%1936 = 18%
Attitudes toward Married Women Working Percentage of respondents
Work 41

The concentration of working women in a fewoccupations diminished as they found employment
throughout the economy.
In 1900, three out of four working women were engaged in domestic service,farming, or factory work, particularly in the nation’s textile mills and shoe facto-ries. A third of working women were domestic servants. Teaching and nursingwere the only professions generally open to women; female managers and offi-cials were rare.
During the first half of the century, the concentration of women in farming anddomestic service was replaced by a new concentration in clerical and sales jobs,still poorly paid but more comfortable and respected. The proportion of womenin factory work declined from a quarter to less than a fifth of the female laborforce.
By the end of the century, farming, domestic service, and factory work hadbecome less important for working women. The largest number of women werestill in the traditional female occupations of clerical work, sales, teaching, andnursing, but an almost equal number had found more diversified employmentthroughout the economy.
Women constituted about half of all managers, administrators, and officials in theeconomy; nearly half of college teachers; more than half of psychologists andaccountants; and more than a fourth of lawyers and physicians. Although cir-cumstances were changing at the end of the century, men still predominated inthe upper reaches of these occupations.
42 The First Measured Century

8%
35%
37%
0%
20%
40%
60%
1900 1950 1998
47%
10%
3%
0%
20%
40%
60%
1900 1950 1998
Farming and Domestic Work
Work 43
Women’s OccupationsPercentage of the female labor force
Farming and Domestic Work
Pro essions
20%
52%
36%
0%
20%
40%
60%
1900 1950 1998
Clerical and Sales Work Teaching, Nursing, and OtherProfessions
Factory Work
25%
19%
8%
0%
20%
40%
60%
1900 1950 1998
Factory Work

Women and blacks were represented only marginally in law,medicine, and engineering until 1970, when they began to
move into these influential professions.
At the beginning of the century, only about one of twenty physicians, one of ahundred lawyers, and one of a thousand engineers were female. After 1970, how-ever, women flooded into law schools and medical schools, and many movedfrom the lower rungs of those professions into more prestigious specialties. Evenin engineering, the number of women increased dramatically. By 1998, womenconstituted 29 percent of lawyers, 26 percent of physicians, and 11 percent ofengineers.
In 1940, the earliest year for which reliable information about the racial compo-sition of individual occupations is available, there were approximately four thou-sand black physicians, one thousand black lawyers, and three hundred blackengineers in the entire country.
After the civil rights revolution of the 1960s, the situation changed somewhat.There were proportionately fewer black physicians in 1970 than in 1940, butthree times as many lawyers and twelve times as many engineers. Still, they con-stituted less than 2 percent of their respective professions, and the doctors andlawyers served primarily black clienteles.
Between 1970 and 1997, however, black representation in medicine, law, andengineering roughly doubled. Equally important, most black physicians treatedpatients of all racial and ethnic backgrounds, and many black engineers workedfor large firms. Some black lawyers still served mostly black clients, but manyothers did not.
At the end of the century, the proportions of women and blacks among studentspreparing for medicine, law, and engineering were higher than among activepractitioners. As a result, the post-1970 trends were set to continue for manyyears to come. The sharp growth of Hispanic and Asian-American representationin the major professions, which occurred later than for women and blacks, willalso persist far into the next century.
44 The First Measured Century

e ce tage o eac p o ess o
0%
10%
20%
30%
1900 1920 1940 1960 1980 2000
Physicians
Lawyers
Engineers
1900Physicians = 6%Lawyers = 1%Engineers = 0.01%
1998Physicians = 26%Lawyers = 29%Engineers = 11%
Work 45
Female Physicians, Lawyers, and EngineersPercentage of each profession
Percentage o each pro ession
0%
2%
4%
6%
1900 1920 1940 1960 1980 2000
Physicians
Lawyers
Engineers
1998Physicians = 4.9%Lawyers = 4.0%Engineers = 4.1%
1940Physicians = 2.4%Lawyers = 0.5%Engineers = 0.1%
Black Physicians, Lawyers, and EngineersPercentage of each profession

The unemployment rate fluctuated with the business cycleand military manpower needs.
In the first half of the century, the unemployment rate oscillated from a low of1.4 percent in 1918–1919 to a peak of 24.9 percent in 1933 and then to anotherlow of 1.2 percent in 1944. After 1950, these fluctuations became less severe asthe business cycle moderated (see page 244).
Before and after the Great Depression, unemployment was largely a blue-collaraffliction. Nearly two-thirds of the male factory workers in a sample of Middletownfamilies interviewed by the Lynds had at least one spell of unemployment duringthe first nine months of 1924. None of the white-collar employees in the samplehad that experience.
At the end of the century, blue-collar workers had about twice the unemploy-ment risk of white-collar workers. Within the white-collar group, sales and cler-ical personnel had about twice the risk of managers.
Education, race, and age generated differences as well. High school dropouts hadabout twice the unemployment risk of high school graduates, who in turn hadabout twice the risk of college graduates. Blacks had about twice the risk ofwhites. Men younger than age twenty-four had about twice the risk of men olderthan twenty-four. These relative differences tended to persist even as the rate ofunemployment fluctuated.
46 The First Measured Century

0%
5%
10%
15%
20%
25%
1900 1920 1940 1960 1980 2000
1900 = 5%
2000 = 4.1%
Great Depression
World War II
Vietnam War
World War I
Unemployment RateUnemployed persons as percentage of the civilian labor force
Work 47

The unionized share of the labor force peaked in midcentury.The union base moved from the private to the public sector.
The unionized share of the work force quadrupled from 1900 to 1920 despiteheavy legal restraints on union activities. It peaked after World War I and thendeclined steadily until the advent of the New Deal. The National Labor RelationsAct of 1935 legalized collective bargaining and installed orderly procedures fororganizing unions. The immediate result was the recruitment of millions of newunion members. They constituted about a quarter of the civilian labor force from1950 to 1970. After 1970, the unionized portion of the labor force declinedsteadily.
The incidence of strikes followed a less regular but roughly parallel trend. From1945 to 1970, hundreds of major strikes involving a substantial share of the laborforce occurred every year. The strikes of recent years involved no more than two-hundredths of 1 percent of the labor force in any given year.
In the heyday of organized labor, union strength was concentrated in heavyindustry, construction, mining, and railroading. In the latter decades of the cen-tury, the biggest unions represented government workers such as teachers, postalemployees, police officers, and garbage collectors, although pockets of strengthstill survived in the private sector. At the end of the century, about half of all gov-ernment employees were unionized, compared with only one in ten workers inthe private sector.
The decline in the unionized share of the labor force can be traced to many fac-tors. The federal government effectively addressed important union issues byassuming much of the responsibility for workplace safety, creating and enforcingwage and hour rules, offering incentives for worker training, requiring notice ofplant closings, providing a public pension system, and supervising private pen-sion plans. Public distrust of unions grew in response to scandals that connectedunions to organized crime. But the most important sources of the decline in theunionized portion of the work force are probably rooted in fundamental changesin the world and U.S. economies. These include the globalization of the labormarket, along with the continual restructuring of U.S. enterprises throughautomation, mergers, downsizing, outsourcing, expanded fringe benefits, and theextensive use of part-time and temporary workers.
48 The First Measured Century

0%
10%
20%
30%
1900 1920 1940 1960 1980 2000
1900 = 3%
1998 = 12%
The Rise and Decline of Labor UnionsUnion members as percentage of the civilian labor force
Work 49