Embed Size (px)
Citation preview
`
18
CHAPTER 2 : THE EXTERNAL SECTOR
Summary
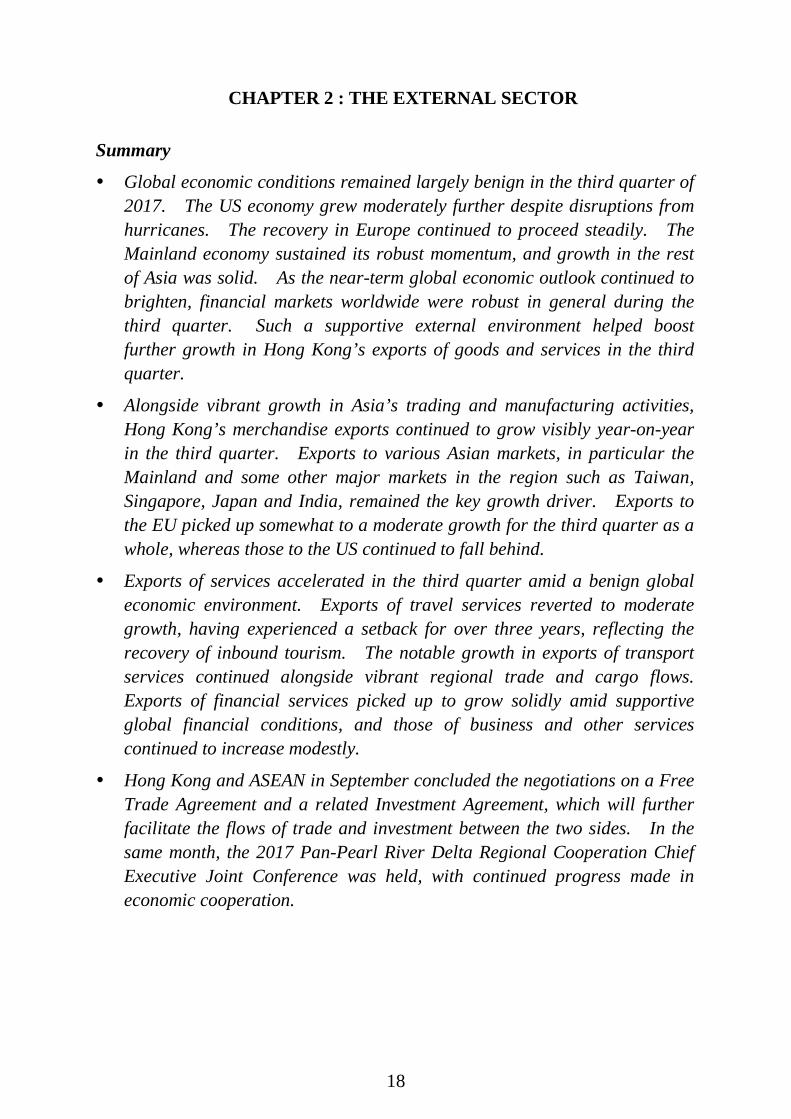
Global economic conditions remained largely benign in the third quarter of 2017. The US economy grew moderately further despite disruptions from hurricanes. The recovery in Europe continued to proceed steadily. The Mainland economy sustained its robust momentum, and growth in the rest of Asia was solid. As the near-term global economic outlook continued to brighten, financial markets worldwide were robust in general during the third quarter. Such a supportive external environment helped boost further growth in Hong Kong’s exports of goods and services in the third quarter.
Alongside vibrant growth in Asia’s trading and manufacturing activities, Hong Kong’s merchandise exports continued to grow visibly year-on-year in the third quarter. Exports to various Asian markets, in particular the Mainland and some other major markets in the region such as Taiwan, Singapore, Japan and India, remained the key growth driver. Exports to the EU picked up somewhat to a moderate growth for the third quarter as a whole, whereas those to the US continued to fall behind.
Exports of services accelerated in the third quarter amid a benign global economic environment. Exports of travel services reverted to moderate growth, having experienced a setback for over three years, reflecting the recovery of inbound tourism. The notable growth in exports of transport services continued alongside vibrant regional trade and cargo flows. Exports of financial services picked up to grow solidly amid supportive global financial conditions, and those of business and other services continued to increase modestly.
Hong Kong and ASEAN in September concluded the negotiations on a Free Trade Agreement and a related Investment Agreement, which will further facilitate the flows of trade and investment between the two sides. In the same month, the 2017 Pan-Pearl River Delta Regional Cooperation Chief Executive Joint Conference was held, with continued progress made in economic cooperation.
`
19
Goods trade Total exports of goods 2.1 The global economic environment was largely sanguine in the third quarter, rendering support to trading and manufacturing activities in Asia. Many Asian economies continued to see sizeable growth in their merchandise exports in the third quarter. In a similar vein, Hong Kong’s merchandise exports (comprising re-exports and domestic exports) grew visibly further by 6.0% year-on-year in real terms(1) in the third quarter, slightly faster than the 5.8% growth in the preceding quarter. 2.2 The global economy sustained moderate growth in the third quarter. The US economy grew moderately further in the third quarter despite disruptions from hurricanes. In the euro area, the economic recovery sustained. The economic progress attained in these two economies paved the way for their central banks to reduce monetary stimuli. The Federal Reserve announced in September to kick-start the scaling back of its balance sheet. It also kept the approach of gradual interest rate hikes unchanged. Separately, in October, the European Central Bank announced to reduce its monthly pace of net asset purchases (see Box 2.1 for analysis on the monetary policies in major advanced economies). In Asia, the Mainland economy maintained its strong growth momentum in the third quarter, being on track to exceed its official annual growth target of around 6.5% this year. Meanwhile, many other Asian emerging economies attained notable growth, and the performance of higher-income economies in the region also remained solid. As the near-term outlook for the global economy improved, financial markets worldwide were generally robust during the third quarter, with many overseas stock markets hitting new highs. The International Monetary Fund in October revised up its global economic growth forecast for 2017 to 3.6%, picking up from 3.2% in 2016. 2.3 As global demand continued to strengthen, industrial activities in the Asian region expanded further, thereby boosting trade flows of raw materials, semi-manufactures and capital goods in the region in the third quarter. As a trading and logistics centre in the region, Hong Kong benefitted visibly from this development, with exports to various Asian markets once again providing the main growth impetus.

`
20
Table 2.1 : Total exports of goods, re-exports and domestic exports (year-on-year rate of change (%))
Total exports of goods
Re-exports Domestic exports
In value terms
In real terms(a)
Change in prices
In value terms
In real terms(a)
Change in prices
In value terms
In real terms(a)
Change in prices
2016 Annual -0.5 1.4 -1.7 -0.4 1.5 -1.7 -8.5 -7.0 -1.4
Q1 -6.8 -4.2 (-4.7) -2.6 -6.7 -4.0 (-4.7) -2.6 -15.2 -12.1 (-2.4) -3.2 Q2 -1.2 1.4 (6.1) -2.2 -0.9 1.6 (6.3) -2.2 -16.8 -14.7 (-2.7) -2.1 Q3 -0.2 1.8 (1.0) -1.6 -0.2 1.8 (0.9) -1.6 -2.0 -0.1 (8.2) -1.1 Q4
5.5 5.9 (3.8) -0.5 5.6 6.0 (3.9) -0.5 0.9 -0.7 (-3.8) 0.9
2017 Q1 10.3 8.8 (-0.4) 1.6 10.4 8.8 (-0.4) 1.6 4.9 1.8 (1.9) 3.0 Q2 7.4 5.8 (1.0) 1.6 7.5 5.9 (1.1) 1.6 1.7 -0.6 (-6.3) 2.2 Q3 8.0 6.0 (*) 1.9 8.1 6.1 (*) 1.9 -1.9 -2.7 (4.6) 1.7
Notes : ( ) Seasonally adjusted quarter-to-quarter rate of change. (*) Change within ±0.05%. (a) The growth rates here are not strictly comparable with those in the GDP accounts in
Table 1.1, due to differences in coverage. Figures in Table 1.1 are compiled based on the change of ownership principle in recording goods sent abroad for processing and merchanting under the standards stipulated in the System of National Accounts 2008.
2.4 Re-exports(2), the mainstay of overall merchandise exports and accounting for 98.9% of total exports by value, recorded 6.1% year-on-year growth in real terms in the third quarter, picking up somewhat from 5.9% in the preceding quarter. Domestic exports, constituting only the remaining 1.1% of total exports, declined by 2.7% year-on-year in real terms in the third quarter, following a slight decline of 0.6% in the preceding quarter.

`
21
Notes : Total exports of goods as depicted refer to the year-on-year rate of change in real terms, while total import demand in Hong Kong’s major markets as depicted refers to the year-on-year rate of change in US dollar terms in the aggregate import demand in Asia, the United States and the European Union taken together.
(#) Import demand figure for the third quarter of 2017 is based on statistics for July and
August 2017.
-20
-15
-10
-5
0
5
10
15
20
Q12012
Q12013
Q12014
Q12015
Q12016
Q12017
-10
-5
0
5
10
Total import demand inHong Kongʼs
major markets #(RHS)
Hong Kongʼs total exports
of goods (LHS)
Diagram 2.1 : Merchandise exports continued to grow visibly from a year earlier in the third quarter of 2017
Year-on-year rate of change (%) Year-on-year rate of change (%)
Notes : (*) “Selected Asian economies” include the Mainland of China, Hong Kong, Singapore,
Korea, Taiwan, Japan, Indonesia, Malaysia, Thailand and the Philippines. (^) The trade flows were measured by the sum of the individual economies’ exports of
goods to the other nine economies within the “selected Asian economies”. (#) Trade figures for the United States, the European Union and “selected Asian economies”
for the third quarter of 2017 are based on the information available as of early November 2017.
Q1 2009 Q1 2010 Q1 2011 Q1 2012 Q1 2013 Q1 2014 Q1 2015 Q1 2016 Q1 2017-40
-20
0
20
40
60
US and EU goods imports#
Selected Asian economies' goods exports to the world*#
Trade flows among selected Asian economies*^#
Hong Kong's goods exports to Asia
Year-on-year rate of change in US dollar terms (%)
Diagram 2.2: Intra-regional trade remained vibrant amid global demand revival

`
22
Box 2.1
Recent developments in monetary policies in major advanced economies and their implications
In the wake of the global financial crisis, central banks in major advanced economies cut interest rates aggressively and deployed various unconventional monetary policy tools to support the economy and to fight deflation risks. Among major advanced economies, the US took the lead in returning to a more sustainable recovery path. The improvement in the euro-area economy has also become more entrenched recently. Alongside different degrees of narrowing in output gaps (Chart 1a), their central banks have started tapering or unwinding some former monetary policy stimuli. This note briefly reviews recent monetary policy developments in major advanced economies and their implications.
In the US, the output gap narrowed to -1% of potential GDP in 2014. With sustained moderate economic growth, output gap closed and hovered around zero in recent years. More impressively, the labour market showed visible improvement. Cumulatively, over 16 million jobs have been added to the economy since end-2009, bringing down the unemployment rate from a peak of 10.0% in October 2009 to 6.7% in December 2013 and further to 4.2% in September 2017. Yet, core inflation fell in recent months and stayed below the US Federal Reserve’s (the Fed) inflation target (Chart 1b).
Notes: (*) The output gaps (the difference between actual output and potential output) were estimated by the
International Monetary Fund (IMF) in its World Economic Outlook Database, October 2017. (^) Core inflation rate in the US refers to the year-on-year change in personal consumption expenditure
price index excluding food and energy. In Japan, it refers to CPI inflation excluding energy and fresh food. In the euro area, it refers to CPI inflation excluding energy, food, alcohol and tobacco.
-2.0
-1.5
-1.0
-0.5
0.0
0.5
1.0
1.5
2.0
2.5
3.0
3.5
Jan-07 Jan-09 Jan-11 Jan-13 Jan-15 Jan-17
US
Euro area
Japan
Chart 1b: Inflation remained low but deflation risks had generally receded
-8
-6
-4
-2
0
2
4
2007 2009 2011 2013 2015 2017
US
Euro area
Japan
Output gap* (% to potential GDP) Core inflation rate^ (%)Affected by Japan's sales tax hike in April 2014
Chart 1a: Output gaps of major advanced economies are closing, especially in 2016 and 2017
Against this backdrop, the Fed led the monetary policy normalisation process, tapering asset purchases during 2014. After concluding its asset purchase program in October 2014, the Fed started to raise interest rates in December 2015, cumulatively four times of 25 basis points each since then. As the gradual interest rate uplift had been well underway, it began scaling back its balance sheet in October 2017, marking another milestone in its monetary policy normalisation. The previous note “The US Federal Reserve’s balance sheet normalisation” published in the Half-yearly Economic Report 2017 discussed the Fed’s plan announced in June and its implications. The current execution plan is the same as the one announced previously.

`
23
Box 2.1 (Cont’d)
The recovery in the euro-area economy has been bumpier. The economy relapsed into recession during 2012-2013 amid the European debt crisis. Deflation risks loomed large in 2014. Against this backdrop, the European Central Bank (ECB) successively introduced various monetary accommodation measures (Chart 2), eventually putting forward negative interest rate policy in June 2014 and announcing the expanded asset purchase programme (APP) in January 2015. The ECB’s asset size “held for monetary policy purposes” swelled quickly since 2015.
Sources: The ECB (consolidated balance sheet) and Bloomberg.
0
1,000
2,000
3,000
4,000
5,000
6,000
Jan-07 Jan-08 Jan-09 Jan-10 Jan-11 Jan-12 Jan-13 Jan-14 Jan-15 Jan-16 Jan-17
Chart 2 : The ECB has launched a wide range of measures to fight against deflation risks
Held for monetary policy purposes Loans to euro area credit institutions
Gold and gold receivables Claims on non-residents
Rest of the assets Total assets
ECB's asset holding (€ billion)
APP announced at €60 billion per
month
Three-year longer-term refinancing
operations (LTRO) announced
First series of Targeted
LTRO (TLTRO)
announced
APP slowed to €60 billion per month
Outright Monetary
Transactions announced
APP stepped up to €80 billion per
month + TLTRO2
announced
Fixed-rate full allotment policy
(FRFA)
Covered Bond Purchase
Programme (CBPP1)
Securities Markets
Programme CBPP2
In recent quarters, economic recovery in the euro area has become more entrenched, with widespread improvement in the region. Consumer price inflation, though still below ECB’s target, stayed positive since June 2016 and went up generally, pointing to largely receded deflation risks. As a result, the ECB moderated the net asset purchases under the APP to €60 billion per month from April 2017. In October 2017, the ECB announced to continue the APP at least until the end of September 2018, but the monthly pace of the net asset purchases will be moderated further to €30 billion from January 2018.
These two central banks are not alone among major advanced economies in reducing former monetary stimuli. The Bank of Canada has raised interest rates twice since July 2017, its first set of moves in seven years. In the UK, the Bank of England (BOE) raised its Bank Rate by 25 basis points to 0.50% in its November 2017 meeting, the first interest rate increase since 2007. This came notwithstanding persistent uncertainties from the ongoing Brexit-related negotiations, as recent inflation indicators overshot the BOE’s target and unemployment rate fell to the lowest in decades.

`
24
Box 2.1 (Cont’d)
Comparatively, the Bank of Japan (BOJ) took a more cautious approach, as recent economic improvement has yet to gain a firm foothold and inflation continued to stay well below target. At the end of October 2017, the BOJ left short-term interest rate target unchanged at -0.1%, and kept 10-year Japanese Government Bond yield target unchanged at more or less zero under the “yield curve control”, thereby sticking to its ultra-loose policy stance. On asset purchase, the accompanying statement indicated that it would be maintained more or less at an annual pace of 80 trillion yen, though the actual pace of balance sheet expansion appeared somewhat slower than that in the recent past(1).
In sum, most central banks in major advanced economies have entered a phase of reducing or unwinding former monetary stimuli. These unconventional monetary policies held their historical significance, by bringing down government bond yields(2) and borrowing costs to stimulate demand, and by creating a more favourable economic environment for proceeding structural reforms. Yet, the exact effects of these unconventional tools in boosting real output are hard to quantify(3), and whether they have increased asset market bubble risks is still subject to debate. In any case, the marginal benefits of these monetary stimuli should have diminished, given that policy rates were already extremely low, and balance sheets of many major central banks have ballooned to unprecedented scale (Chart 3). Some analysts even worried that the purchase of government bonds by some central banks are approaching upper limits.
Sources: CEIC, the Fed, the ECB (consolidated balance sheet) and the BOJ. Note: (*) The asset sizes of the Fed, ECB and BOJ are denominated in their own currencies. In the case of
October 2017, the asset sizes were based on information available as of late October 2017, and the corresponding percentages to GDP were computed by using seasonally-adjusted annualised nominal GDP for the US in the third quarter of 2017, and using the sums of nominal GDP from the third quarter of 2016 to the second quarter of 2017 in the cases of the euro area and Japan.
488
291
463
0
100
200
300
400
500
600
2007 2009 2011 2013 2015 Oct-17
Fed
ECB
BOJ
Asset size* (Index, end-2007 = 100)
Chart 3: Balance sheets of many major central banks have ballooned to unprecedented scale
23
40
96
0
20
40
60
80
100
120
2007 2009 2011 2013 2015 Oct-17
Fed
ECB
BOJ
Asset size* (% to GDP)
(1) On BOJ’s balance sheet, asset holding categorised as “Japanese Government Securities: Bonds” amounted to 408.9 trillion yen as of 20 October 2017, around 63 trillion yen higher than that of 345.6 trillion yen as of 20 October 2016. This calculation does not take “treasury discount bills” into account.
(2) Andrade, Breckenfelder, De Fiore, Karadi and Tristani (2016), “The ECB’s asset purchase programme: an early assessment”, ECB working paper, September, summarised evidences of quantitative easing programmes’ impacts on 10-year government bond yields there by different researchers.
(3) Borio, Zabai (2016), “Unconventional monetary policies: a re-appraisal”, Bank for International Settlements Working Papers No 570, July, outlined the debate on large-scale asset purchases’ impacts on output and inflation by different researchers.
`
25
Box 2.1 (Cont’d)
Moreover, as reckoned by the IMF in its Global Financial Stability Report in October 2017(4), monetary accommodation by the major central banks, if prolonged, could encourage higher leverage or additional risk taking in search of higher yields, in essence building up higher financial risks for the medium term. The impact could spread beyond advanced economies through capital flows. For example, the IMF’s model estimated that the US monetary policy accommodation was the dominant driver of portfolio inflows to emerging markets since 2010, and unwinding of these stimuli could reduce the flows in the years to come(4). In an adverse scenario where capital flows reverse abruptly, emerging market economies with weaker fundamentals could face pressure. Moreover, market concerns about tightening global financial conditions, if heightened, could possibly translate into a re-pricing of risks and asset prices gyrations, undermining the ongoing global economic recovery.
Thus far, the impacts of tapering monetary stimuli on global economic growth have been muted. In part, these actions have taken place at times of strength, where major advanced economies are in synchronised improvement. Moreover, monetary policy normalisation in these economies are widely anticipated to take place only at a gradual pace. In the US, for example, the amount of securities that would be rolled off in the first twelve months has been capped around 7% of the Fed’s total securities holdings as of end-September 2017 according to the announced plan. The policy statement in November 2017 indicated that interest rate hikes in the period ahead will remain gradual. In the euro area, the ECB in its policy statement in October 2017 stated that policy rates would remain at their present levels for an extended period of time, well past the horizon of the net asset purchases. Moreover, the principal payments from maturing securities purchased under the APP would be reinvested for an extended period of time after the end of its net asset purchases.
Yet, with possible policy actions by major central banks, the global monetary environment has turned more complicated and could change quickly. From a risk management perspective, it is important to bear in mind that the paces of monetary normalisation in major advanced economies are not on a pre-set course. Any unexpected actions could possibly tip off a less benign scenario. Moreover, under the Linked Exchange Rate System, Hong Kong’s interest rates will eventually rise alongside the US counterpart if US rate hikes continue. Hence, although Hong Kong has a sound financial system and strong fundamentals to navigate the ups and downs of the global economy, the Government will continue to closely monitor the global monetary developments and their possible ramifications on the local economy.
(4) Global Financial Stability Report October 2017 published by the IMF, Link:
https://www.imf.org/en/Publications/GFSR/Issues/2017/09/27/global-financial-stability-report-october-2017. The IMF’s model estimated the impacts of four factors on cumulative portfolio flows to emerging market since 2010, including the change in assets on the Fed’s balance sheet size, market expectations of federal funds rates, global risk appetite and emerging market domestic factors. It showed that the former two measuring US monetary policy accommodation were the key drivers during the period.
`
26
Table 2.2 : Total exports of goods by major market (year-on-year rate of change in real terms (%))
2016 2017 Annual Q1 Q2 Q3 Q4 Q1 Q2 Q3 Mainland of China 2.2 -5.6 2.0 2.7 8.5 9.3 3.9 6.0 United States -1.9 -4.8 -1.4 0.2 -1.9 3.4 1.1 -0.5 European Union -0.7 -2.6 3.8 -0.4 -3.2 3.0 1.3 5.0 Japan -2.3 -3.3 -6.6 -1.1 1.7 7.5 12.0 10.8 India 17.6 15.8 28.0 15.8 12.1 40.1 53.8 9.9 Vietnam -4.8 -2.1 -8.0 -9.8 0.7 10.8 11.9 6.8 Taiwan 19.0 -2.9 17.1 27.5 31.5 44.3 23.0 14.7 Singapore 5.9 -0.4 -1.6 7.7 18.3 -1.2 3.9 11.7 Korea 1.5 -14.0 3.2 6.7 11.2 15.3 -2.8 -1.5 Overall* 1.4 -4.2 1.4 1.8 5.9 8.8 5.8 6.0
Note : (*) The growth rates here are not strictly comparable with those in the GDP accounts in
Table 1.1. Figures in Table 1.1 are compiled based on the change of ownership principle in recording goods sent abroad for processing and merchanting under the standards stipulated in the System of National Accounts 2008.
India$117.9 billion
(4.2%)
Singapore$45.4 billion
(1.6%)Taiwan
$66.4 billion(2.4%)
Korea$41.7 billion
(1.5%) Japan$93.6 billion
(3.3%)
EU$251.6 billion
(8.9%)United States$241.3 billion
(8.6%)
Vietnam$57.4 billion
(2.0%)Rest of Asia$155.3 billion
(5.5%)
Q12012
Q12013
Q12014
Q12015
Q12016
Q12017
-10
-5
0
5
10
15
Total exports to Asia
Total exports to non-Asia
Total exports toall markets
Year-on-year rate of change in nominal terms (%)
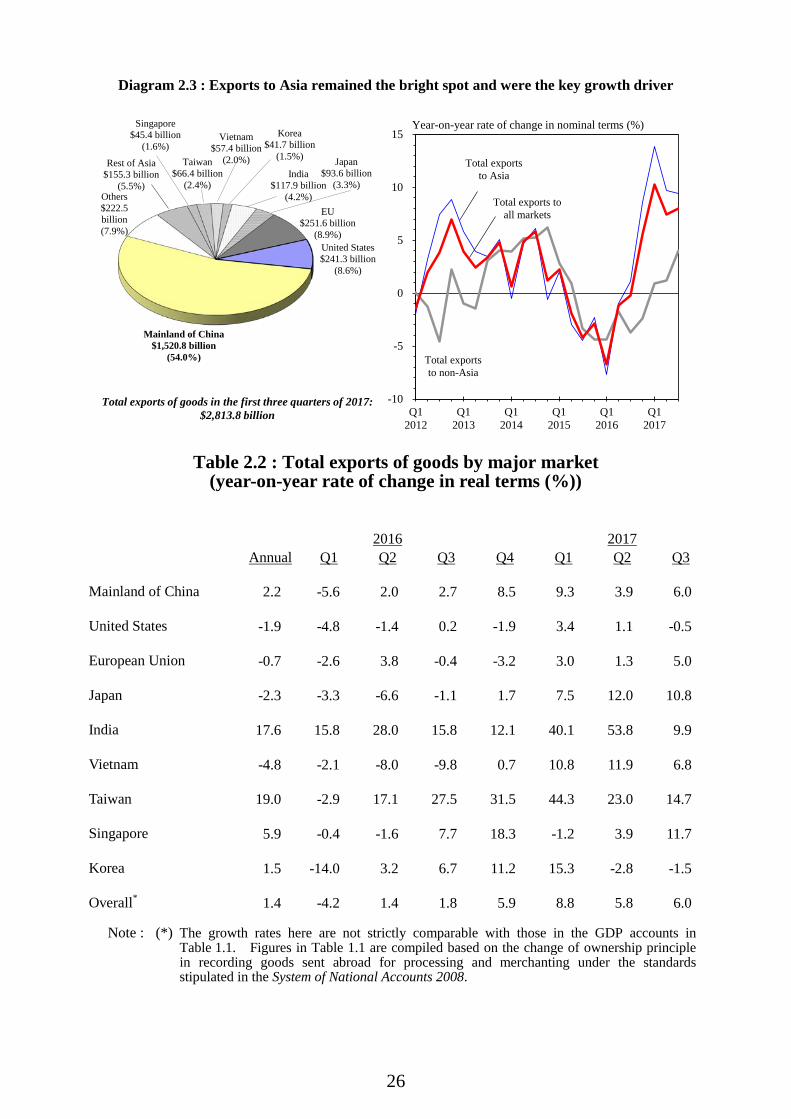
Diagram 2.3 : Exports to Asia remained the bright spot and were the key growth driver
Others$222.5 billion(7.9%)
Mainland of China$1,520.8 billion
(54.0%)
Total exports of goods in the first three quarters of 2017: $2,813.8 billion
`
27
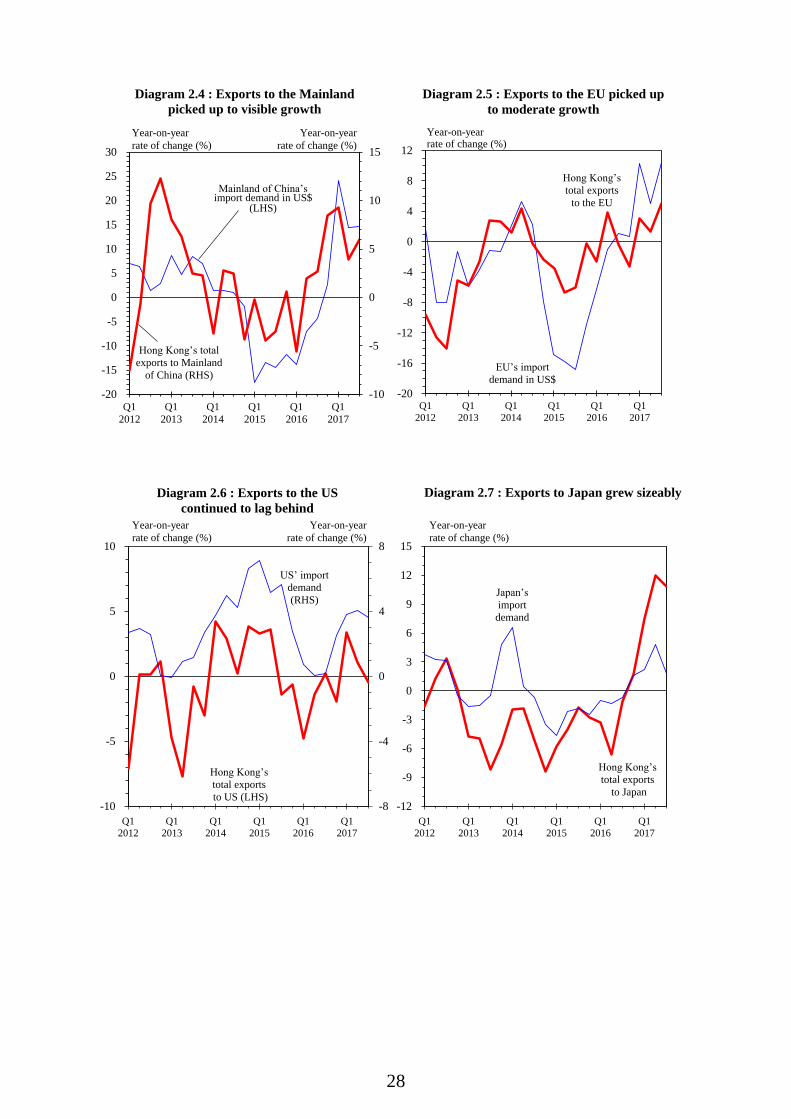
2.5 Analysed by major market on a year-on-year comparison in real terms, the Asian markets continued to provide the major growth impetus to overall merchandise exports in the third quarter, as intra-regional trade in Asia remained vibrant. Specifically, exports to the Mainland picked up to show visible growth. Exports to Taiwan, Singapore and Japan all recorded double-digit growth and those to India also grew notably, while those to Korea fell at a slower pace. 2.6 Exports to other major advanced markets were mixed in performance. Exports to the US continued to lag behind, falling slightly in the third quarter. On the other hand, exports to the EU picked up somewhat to moderate growth for the third quarter as a whole, mainly thanks to a surge in September. In particular, exports to several major markets in the EU such as Germany and the Netherlands showed notable growth, while exports to the UK reverted to a decline amid the lingering Brexit negotiations.
`
28
Q12012
Q12013
Q12014
Q12015
Q12016
Q12017
-20
-16
-12
-8
-4
0
4
8
12Year-on-year rate of change (%)
Hong Kongʼs total exports
to the EU
-10
-5
0
5
10
15
Q12012
Q12013
Q12014
Q12015
Q12016
Q12017
-20
-15
-10
-5
0
5
10
15
20
25
30
Hong Kongʼs total exports to Mainland
of China (RHS)
Year-on-year rate of change (%)
Mainland of Chinaʼsimport demand in US$
(LHS)
Year-on-year rate of change (%)
Diagram 2.4 : Exports to the Mainland picked up to visible growth
EUʼs import demand in US$
Diagram 2.5 : Exports to the EU picked up to moderate growth
-8
-4
0
4
8
Q12012
Q12013
Q12014
Q12015
Q12016
Q12017
-10
-5
0
5
10
Year-on-yearrate of change (%)
Hong Kongʼstotal exportsto US (LHS)
USʼ import demand (RHS)
Year-on-year rate of change (%)
Diagram 2.6 : Exports to the US continued to lag behind
-12
-9
-6
-3
0
3
6
9
12
15
Q12012
Q12013
Q12014
Q12015
Q12016
Q12017
-12
-9
-6
-3
0
3
6
9
12
15
Year-on-yearrate of change (%)
Hong Kongʼstotal exports
to Japan
Japanʼs import demand
Diagram 2.7 : Exports to Japan grew sizeably

`
29
Q12012
Q12013
Q12014
Q12015
Q12016
Q12017
-30
-15
0
15
30
45
60
Hong Kongʼstotal exports to
India
Year-on-year rate of change (%)
Indiaʼsimport demand
in US$-30
-20
-10
0
10
20
30
40
50
Q12012
Q12013
Q12014
Q12015
Q12016
Q12017
-12
-8
-4
0
4
8
12
16
20
Year-on-year rate of change (%)
Hong Kongʼs total exports to Taiwan
(RHS)
Year-on-year rate of change (%)
Taiwanʼsimport demand(LHS)
Diagram 2.8 : Exports to India grew notably Diagram 2.9 : Exports to Taiwan grew briskly
HK$ / NT$(LHS)
Q12012
Q12013
Q12014
Q12015
Q12016
Q12017
-25
-20
-15
-10
-5
0
5
10
15
20
25Year-on-year rate of change (%)
Hong Kongʼstotal exports to Korea
Koreaʼs import demand
in US$
Diagram 2.10 : Exports to Korea declined at a slower pace
Q12012
Q12013
Q12014
Q12015
Q12016
Q12017
-25
-20
-15
-10
-5
0
5
10
15
20
25 Year-on-year rate of change (%)
Hong Kongʼstotal exports to
Singapore
Singaporeʼsimport
demand in US$
Diagram 2.11 : Exports to Singapore picked up visibly
`
30
Box 2.2
Recent developments on the Mainland’s monetary environment and financial stability
Positioned as the nation’s southern gateway, the economic and financial ties between Hong Kong and the Mainland are getting increasingly close. The monetary environment and financial stability in the Mainland hence could have a bearing on our economy. This article briefly analyses a series of selected macroeconomic and monetary indicators, with the aim of giving an overview of the monetary policy pursued by the Mainland authorities and their efforts in containing financial risks so far in 2017.
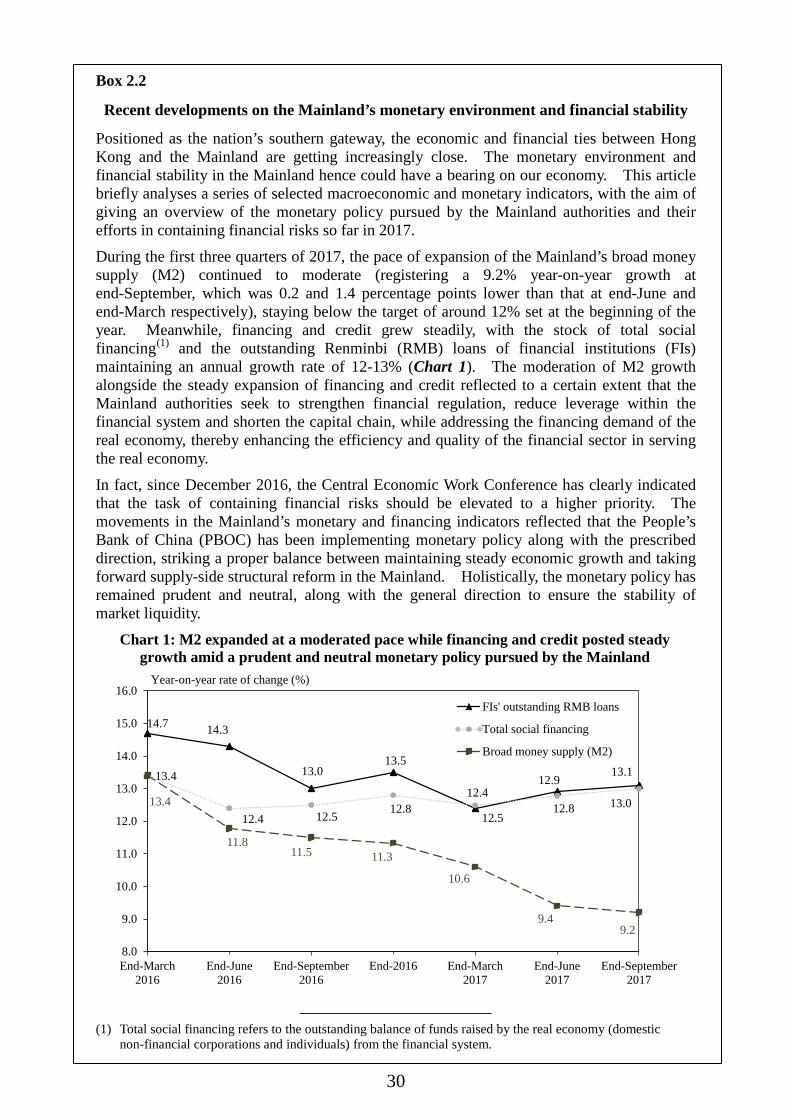
During the first three quarters of 2017, the pace of expansion of the Mainland’s broad money supply (M2) continued to moderate (registering a 9.2% year-on-year growth at end-September, which was 0.2 and 1.4 percentage points lower than that at end-June and end-March respectively), staying below the target of around 12% set at the beginning of the year. Meanwhile, financing and credit grew steadily, with the stock of total social financing(1) and the outstanding Renminbi (RMB) loans of financial institutions (FIs) maintaining an annual growth rate of 12-13% (Chart 1). The moderation of M2 growth alongside the steady expansion of financing and credit reflected to a certain extent that the Mainland authorities seek to strengthen financial regulation, reduce leverage within the financial system and shorten the capital chain, while addressing the financing demand of the real economy, thereby enhancing the efficiency and quality of the financial sector in serving the real economy.
In fact, since December 2016, the Central Economic Work Conference has clearly indicated that the task of containing financial risks should be elevated to a higher priority. The movements in the Mainland’s monetary and financing indicators reflected that the People’s Bank of China (PBOC) has been implementing monetary policy along with the prescribed direction, striking a proper balance between maintaining steady economic growth and taking forward supply-side structural reform in the Mainland. Holistically, the monetary policy has remained prudent and neutral, along with the general direction to ensure the stability of market liquidity.
Chart 1: M2 expanded at a moderated pace while financing and credit posted steady growth amid a prudent and neutral monetary policy pursued by the Mainland
14.7 14.3
13.013.5
12.412.9
13.113.4
12.4 12.5 12.812.5
12.8 13.013.4
11.811.5 11.3
10.6
9.49.2
8.0
9.0
10.0
11.0
12.0
13.0
14.0
15.0
16.0
End-March2016
End-June2016
End-September2016
End-2016 End-March2017
End-June2017
End-September2017
FIs' outstanding RMB loans
Total social financing
Broad money supply (M2)
Year-on-year rate of change (%)
(1) Total social financing refers to the outstanding balance of funds raised by the real economy (domestic non-financial corporations and individuals) from the financial system.
`
31
Box 2.2 (Cont’d)
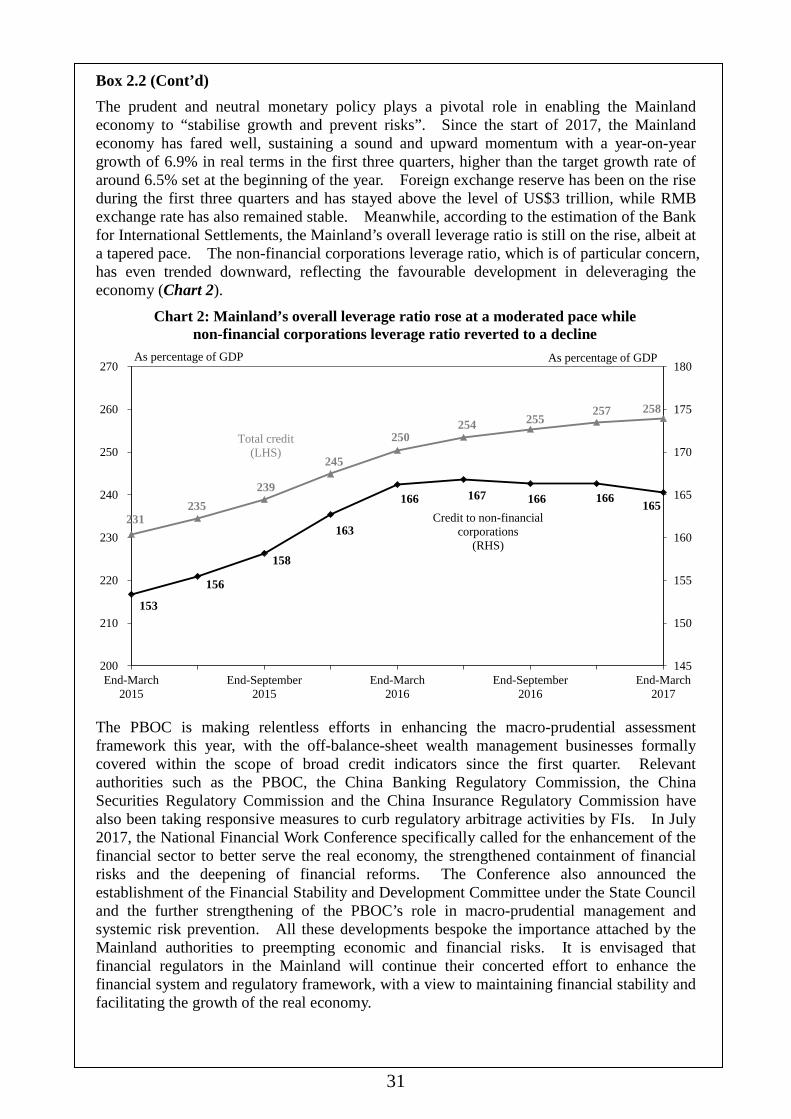
The prudent and neutral monetary policy plays a pivotal role in enabling the Mainland economy to “stabilise growth and prevent risks”. Since the start of 2017, the Mainland economy has fared well, sustaining a sound and upward momentum with a year-on-year growth of 6.9% in real terms in the first three quarters, higher than the target growth rate of around 6.5% set at the beginning of the year. Foreign exchange reserve has been on the rise during the first three quarters and has stayed above the level of US$3 trillion, while RMB exchange rate has also remained stable. Meanwhile, according to the estimation of the Bank for International Settlements, the Mainland’s overall leverage ratio is still on the rise, albeit at a tapered pace. The non-financial corporations leverage ratio, which is of particular concern, has even trended downward, reflecting the favourable development in deleveraging the economy (Chart 2).
Chart 2: Mainland’s overall leverage ratio rose at a moderated pace while non-financial corporations leverage ratio reverted to a decline
231235
239
245
250254 255
257 258
153
156
158
163
166 167 166 166 165
145
150
155
160
165
170
175
180
200
210
220
230
240
250
260
270
End-March2015
End-September2015
End-March2016
End-September2016
End-March2017
Total credit(LHS)
As percentage of GDP As percentage of GDP
Credit to non-financial corporations
(RHS)
The PBOC is making relentless efforts in enhancing the macro-prudential assessment framework this year, with the off-balance-sheet wealth management businesses formally covered within the scope of broad credit indicators since the first quarter. Relevant authorities such as the PBOC, the China Banking Regulatory Commission, the China Securities Regulatory Commission and the China Insurance Regulatory Commission have also been taking responsive measures to curb regulatory arbitrage activities by FIs. In July 2017, the National Financial Work Conference specifically called for the enhancement of the financial sector to better serve the real economy, the strengthened containment of financial risks and the deepening of financial reforms. The Conference also announced the establishment of the Financial Stability and Development Committee under the State Council and the further strengthening of the PBOC’s role in macro-prudential management and systemic risk prevention. All these developments bespoke the importance attached by the Mainland authorities to preempting economic and financial risks. It is envisaged that financial regulators in the Mainland will continue their concerted effort to enhance the financial system and regulatory framework, with a view to maintaining financial stability and facilitating the growth of the real economy.
`
32
Box 2.2 (Cont’d)
In September 2017, the PBOC announced the implementation of a targeted reserve requirement ratio (RRR) cut policy(2) for FIs with loans reaching a certain proportion in the inclusive finance area. The differentiated required reserve ratios, as enabled by the targeted cut, will encourage FIs to increase credit availability for inclusive finance, so as to step up support for the relatively weak sectors of the Mainland economy and conform with the nation’s development direction to encourage entrepreneurship and innovation. This clearly reflects the key support of the monetary policy to economic restructuring, transformation and upgrading. For the rest of 2017, a prudent and neutral monetary policy as well as ongoing enhancements to the regulatory regime will continue to provide an environment conducive to risk prevention. To ensure the stable development of the economy, the Mainland authorities will closely monitor both the domestic and external economic environments, stay vigilant to the financing conditions of the real economy and make use of various monetary policy instruments to ensure the stability of liquidity. With the opportunities brought about by the Belt and Road Initiative and the Guangdong-Hong Kong-Macao Bay Area, as well as the continued sound and stable development of the Mainland’s financial system, Hong Kong stands to benefit significantly from its role as the nation’s international financial centre and offshore RMB business hub.
(2) The targeted RRR cut policy will be implemented starting from 2018. For commercial banks with
outstanding loans or new loans in the inclusive finance area reaching 1.5% or 10% of the total loans in the previous year, an RRR cut of 0.5 or 1.5 percentage point(s) will be applied respectively. The inclusive finance businesses cover loans to small and micro enterprises with credit line for a single client below RMB 5 million, operating loans to businesses established by self-employed individuals and small and micro enterprise owners, loans to farmer households, guaranteed loans to new businesses, loans to those registered in poverty document, student loans, etc. The PBOC estimated that the policy could cover all of the large- and medium-sized commercial banks, about 90% of city commercial banks and about 95% of non-county rural commercial banks.

`
33
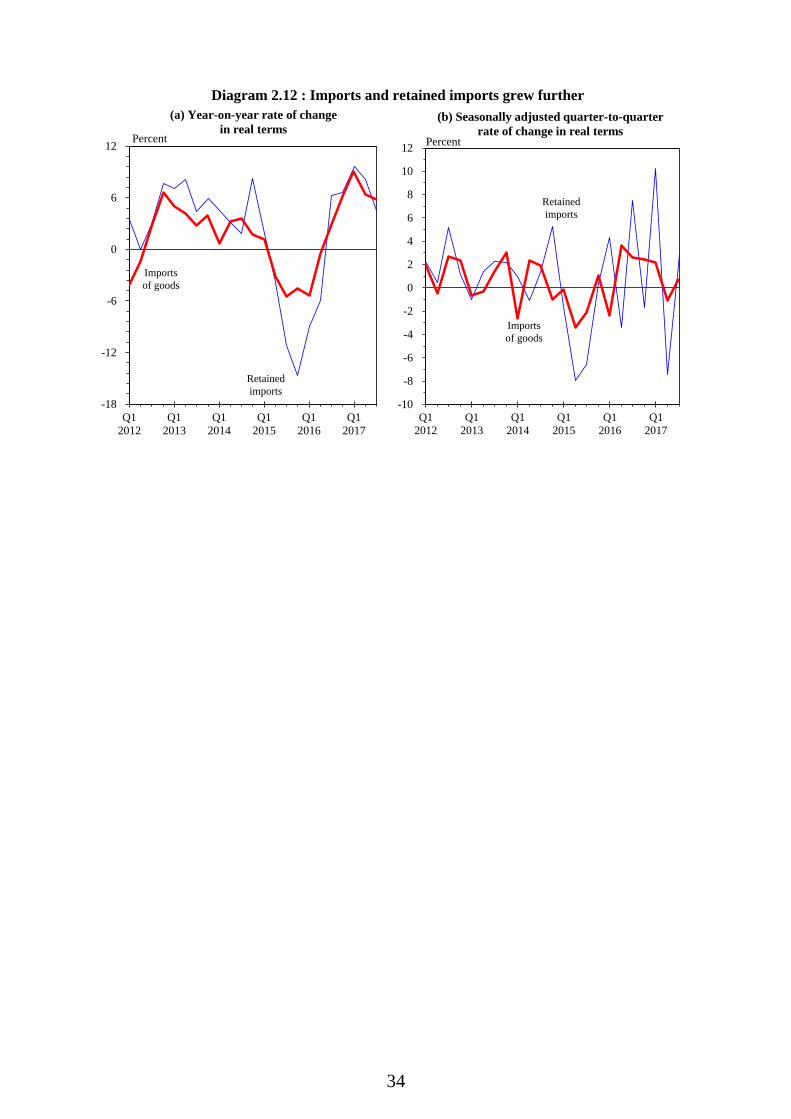
Imports of goods 2.7 Imports of goods grew further by 5.8% year-on-year in real terms in the third quarter, following the 6.4% growth in the second quarter. Imports for subsequent re-exports also grew at a broadly similar pace in the third quarter. The remaining part, retained imports, referring to the imports for local use, which accounted for around one-quarter of total imports, grew by 4.5% year-on-year in real terms in the third quarter, mirroring continued expansion of domestic demand in the same period.
Table 2.3 : Imports of goods and retained imports
(year-on-year rate of change (%))
Imports of goods
Retained imports(a)
In value terms
In real terms(+)
Change in prices
In value terms
In real terms
Change in prices
2016 Annual
-0.9 1.0 -1.7 -4.1 -0.6 -3.2
Q1 -8.2 -5.4 (-2.4) -2.8 -13.5 -8.9 (4.6) -5.0 Q2 -3.2 -0.5 (3.6) -2.6 -10.6 -6.0 (-3.7) -5.2 Q3 1.2 2.9 (2.6) -1.4 4.1 6.3 (7.6) -2.1 Q4
5.6 6.2 (2.4) -0.1 4.0 6.6 (-1.8) -0.6
2017 Q1 10.7 9.0 (2.2) 1.6 11.6 9.7 (10.2) 1.5 Q2 8.2 6.4 (-1.1) 1.8 10.4 8.1 (-7.4) 2.5 Q3 7.7 5.8 (0.7) 1.9 6.3 4.5 (2.9) 2.3 Notes : (a) Based on the results of the Annual Survey of Re-export Trade conducted by the
Census and Statistics Department, re-export margins by individual end-use category are estimated and adopted for deriving the value of imports retained for use in Hong Kong.
(+) The growth rates here are not strictly comparable with those in the GDP accounts in Table 1.1. Figures in Table 1.1 are compiled based on the change of ownership principle in recording goods sent abroad for processing and merchanting under the standards stipulated in the System of National Accounts 2008.
( ) Seasonally adjusted quarter-to-quarter rate of change.
`
34
Q12012
Q12013
Q12014
Q12015
Q12016
Q12017
-18
-12
-6
0
6
12 Percent
Retainedimports
Importsof goods
(a) Year-on-year rate of changein real terms
Q12012
Q12013
Q12014
Q12015
Q12016
Q12017
-10
-8
-6
-4
-2
0
2
4
6
8
10
12 Percent
(b) Seasonally adjusted quarter-to-quarterrate of change in real terms
Retainedimports
Importsof goods
Diagram 2.12 : Imports and retained imports grew further

`
35
Services trade Exports of services
2.8 Amid the benign global economic environment, exports of services accelerated to grow by 3.7% year-on-year in real terms in the third quarter, up from the 2.6% growth in the preceding quarter. Exports of travel services reverted to moderate growth after a setback for over three years, reflecting the recovery of inbound tourism. Exports of transport services grew notably alongside vibrant regional trade and cargo flows. Exports of financial services picked up to show solid growth amid supportive global financial conditions, while those of business and other services stayed on a modest expansion path.
Financial services
$117.4 billion(19.8%)
Business and other services $115.3 billion
(19.4%)
Q12012
Q12013
Q12014
Q12015
Q12016
Q12017
-10
-5
0
5
10Percent
Diagram 2.14 : Exports of services picked up in growth, with a strong quarter-to-quarter rebound
Diagram 2.13 : Travel, transport and financial services are the major service components
within exports of services
Exports of services in the first three quarters of 2017:$594.1 billion
Transport $177.6 billion
(29.9%)
Seasonally adjustedquarter-to-quarter
rate of change in real terms
Travel $183.9 billion
(30.9%)
Year-on-yearrate of changein real terms
`
36
Table 2.4 : Exports of services by major service group (year-on-year rate of change in real terms (%))
Exports
of services
Of which :
Transport
Travel(a)
Financial services
Business and other services
2016 Annual
-3.2 2.2 -8.6 -3.7 -1.0
Q1 -5.4 (-1.0) -2.0 -13.1 0.1 -2.6 Q2 -6.2 (-0.6) -1.1 -8.9 -15.1 -0.7 Q3 -2.5 (1.8) 2.5 -8.1 -1.7 -1.1 Q4
1.2 (1.1) 9.6 -4.0 -0.2 0.2
2017 Q1 2.8 (0.6) 9.2 -1.1 2.4 0.9 Q2 2.6 (-1.0) 8.2 -1.9 2.9 0.5 Q3 3.7 (2.8) 7.0 1.8 4.1 0.6
Notes : Figures are compiled based on the change of ownership principle in recording goods sent
abroad for processing and merchanting under the standards stipulated in the System of National Accounts 2008.
(a) Comprising mainly inbound tourism receipts. ( ) Seasonally adjusted quarter-to-quarter rate of change.
Imports of services
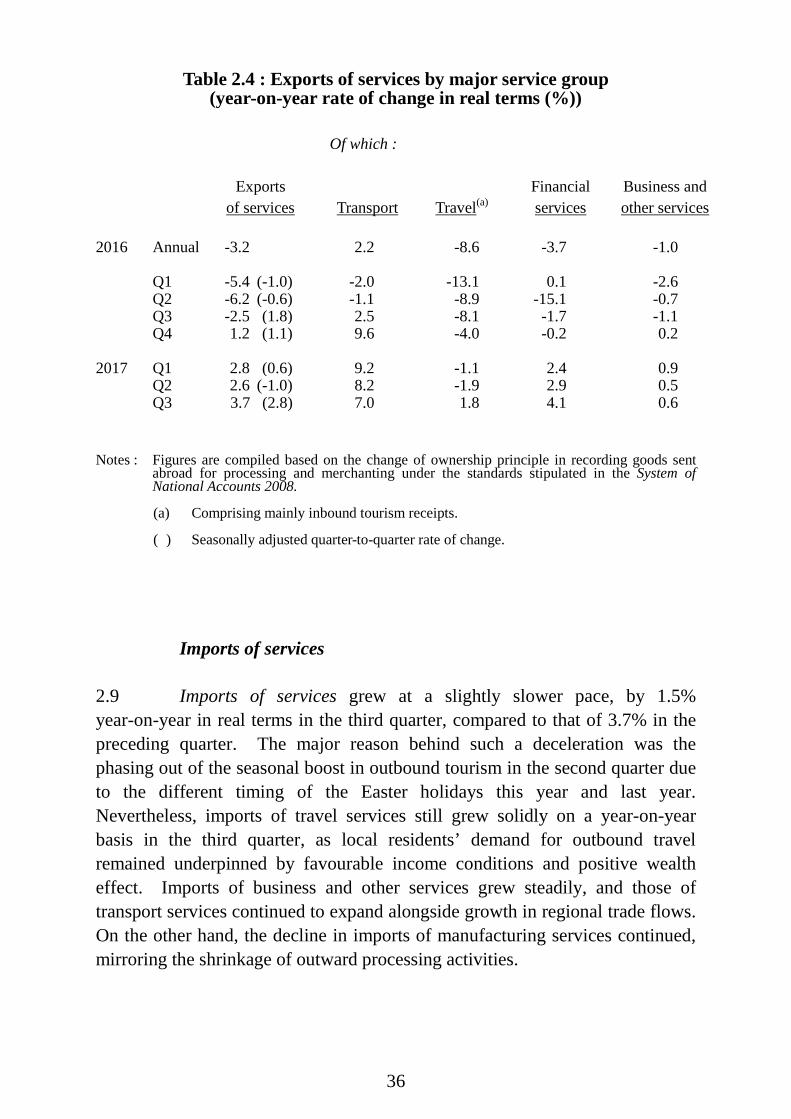
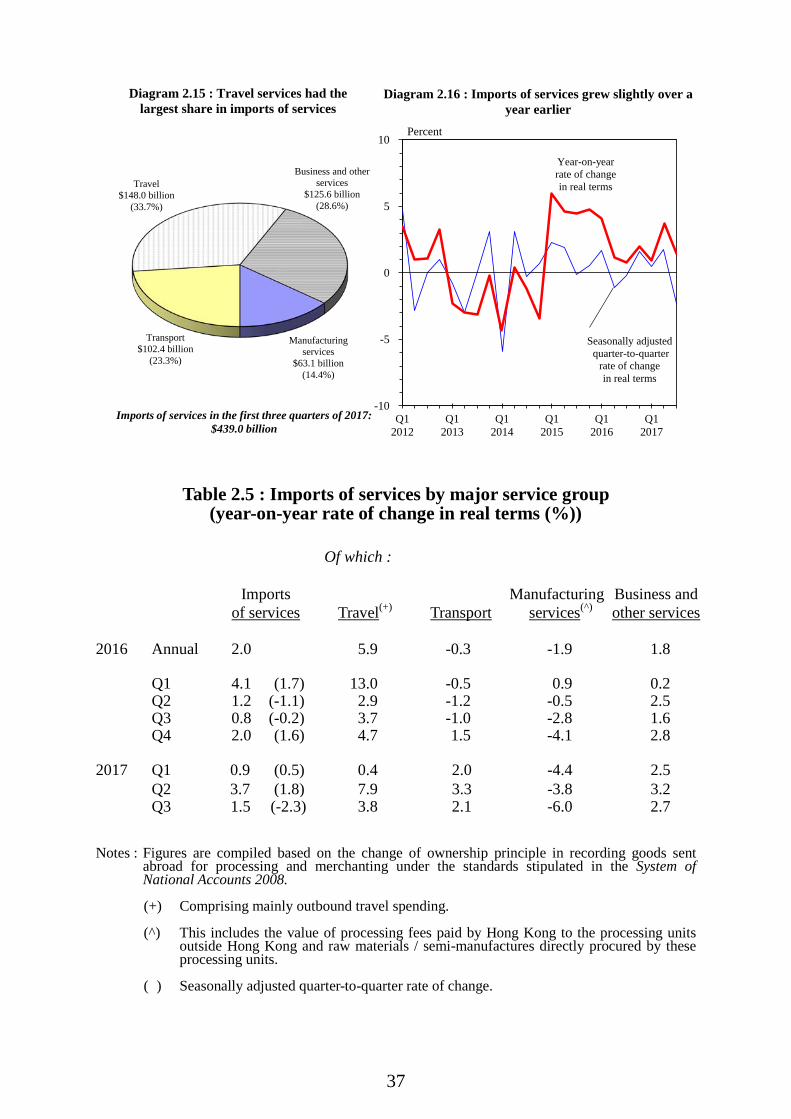
2.9 Imports of services grew at a slightly slower pace, by 1.5% year-on-year in real terms in the third quarter, compared to that of 3.7% in the preceding quarter. The major reason behind such a deceleration was the phasing out of the seasonal boost in outbound tourism in the second quarter due to the different timing of the Easter holidays this year and last year. Nevertheless, imports of travel services still grew solidly on a year-on-year basis in the third quarter, as local residents’ demand for outbound travel remained underpinned by favourable income conditions and positive wealth effect. Imports of business and other services grew steadily, and those of transport services continued to expand alongside growth in regional trade flows. On the other hand, the decline in imports of manufacturing services continued, mirroring the shrinkage of outward processing activities.
`
37
Table 2.5 : Imports of services by major service group (year-on-year rate of change in real terms (%))
Of which :
Imports of services
Travel(+)
Transport
Manufacturing
services(^)
Business and other services
2016 Annual
2.0 5.9 -0.3 -1.9 1.8
Q1 4.1 (1.7) 13.0 -0.5 0.9 0.2 Q2 1.2 (-1.1) 2.9 -1.2 -0.5 2.5 Q3 0.8 (-0.2) 3.7 -1.0 -2.8 1.6 Q4
2.0 (1.6) 4.7 1.5 -4.1 2.8
2017 Q1 0.9 (0.5) 0.4 2.0 -4.4 2.5 Q2 3.7 (1.8) 7.9 3.3 -3.8 3.2 Q3 1.5 (-2.3) 3.8 2.1 -6.0 2.7
Notes : Figures are compiled based on the change of ownership principle in recording goods sent
abroad for processing and merchanting under the standards stipulated in the System of National Accounts 2008.
(+) Comprising mainly outbound travel spending. (^) This includes the value of processing fees paid by Hong Kong to the processing units
outside Hong Kong and raw materials / semi-manufactures directly procured by these processing units.
( ) Seasonally adjusted quarter-to-quarter rate of change.
Travel $148.0 billion
(33.7%)
Diagram 2.15 : Travel services had the largest share in imports of services
Q12012
Q12013
Q12014
Q12015
Q12016
Q12017
-10
-5
0
5
10Percent
Diagram 2.16 : Imports of services grew slightly over a year earlier
Year-on-yearrate of changein real terms
Imports of services in the first three quarters of 2017:$439.0 billion
Seasonally adjustedquarter-to-quarter
rate of change in real terms
Business and other services
$125.6 billion(28.6%)
Transport $102.4 billion
(23.3%)
Manufacturing services
$63.1 billion(14.4%)

`
38
Goods and services balance 2.10 Compiled based on the change of ownership principle, the goods deficit widened somewhat in the third quarter from a year earlier, as the nominal growth of goods imports slightly outpaced that of goods exports. With the services surplus more than offset the goods deficit, the combined goods and services account registered a surplus of $35 billion in the third quarter, equivalent to 2.7% of total import value, slightly lower than the corresponding figures in the same quarter of 2016.
Table 2.6 : Goods and services balance
($ billion at current market prices)
Total exports Imports Trade balance
Goods Services
Goods
Services
Goods
Services
Combined
As % of imports
2016 Annual 3,900 767 4,037 578 -136 189 53 1.1 Q1 849 194 892 138 -44 55 12 1.1 Q2 929 177 987 138 -57 39 -18 -1.6 Q3 1,025 196 1,037 148 -12 48 36 3.1 Q4
1,098 200 1,121 153 -24 47 23 1.8
2017 Q1 942 201 1,000 141 -58 60 2 0.2 Q2 993 184 1,062 144 -69 41 -28 -2.3 Q3 1,099 208 1,118 155 -19 54 35 2.7
Notes : Figures are compiled based on the change of ownership principle in recording goods sent
abroad for processing and merchanting under the standards stipulated in the System of National Accounts 2008.
Figures may not add up exactly to the total due to rounding.
`
39
Other developments 2.11 Hong Kong’s economic cooperation and integration with the Mainland continued to deepen. In September, 2017 Pan-Pearl River Delta (PPRD) Regional Cooperation Chief Executive Joint Conference (Joint Conference) was held. During the Joint Conference, the PPRD Regional Customs and Clearance Cooperation Agreement and the PPRD Regional Tourism Union Cooperation Agreement were signed. The Joint Conference provided an interactive platform for government leaders of the PPRD provinces and regions to discuss matters, including taking forward jointly the development of the Guangdong-Hong Kong-Macao Bay Area, Belt and Road Initiative and deepening cooperation in innovation and technology. 2.12 The Government spares no effort in grasping the opportunities arising from the Belt and Road Initiative. In September, the Government and the Hong Kong Trade Development Council jointly organised the Belt and Road Summit, the second in two years, attracting over 3 000 political leaders, policymakers, business leaders and experts in related trades from all over the world. The Government will continue discussion with the Central Authorities, with the aim of entering into an agreement of Hong Kong’s full participation in the Initiative with the National Development and Reform Commission as soon as possible. 2.13 Economic ties between Hong Kong and other major economic partners made further progress. In September, after years of negotiations, Hong Kong and ASEAN concluded a Free Trade Agreement (FTA) and a related Investment Agreement, which will be signed in November. ASEAN is an important trading partner of Hong Kong in both goods and services. The Agreements are comprehensive in scope, encompassing trade in goods, trade in services, investment, economic and technical cooperation and dispute settlement mechanisms. Hong Kong stands to benefit from the FTA and the Investment Agreement, which will further facilitate our access to the ASEAN markets, create new business opportunities and enhance trade and investment flows. In October, an agreement with Switzerland for conducting automatic exchange of financial account information in tax matters (AEOI) was signed, bringing the number of Hong Kong’s AEOI partners to 15. 2.14 In October, the Policy Address was announced, putting forward to strengthen external promotion work by expanding the network of Economic and Trade Offices (ETOs). The Government is planning to set up an ETO in Thailand, the third ETO in ASEAN, after Singapore and Indonesia. The

`
40
addition of an ETO in Thailand will make the ETO network in ASEAN on par with that in the EU. On the enhancement of bilateral ties, the Government will continue to expand our comprehensive avoidance of double taxation agreements network and identify potential negotiation partners, especially countries along the Belt and Road, with a view to expanding the total number of such agreements to 50 over the next few years.
`
41
Box 2.3 The risk of trade protectionism: recent developments
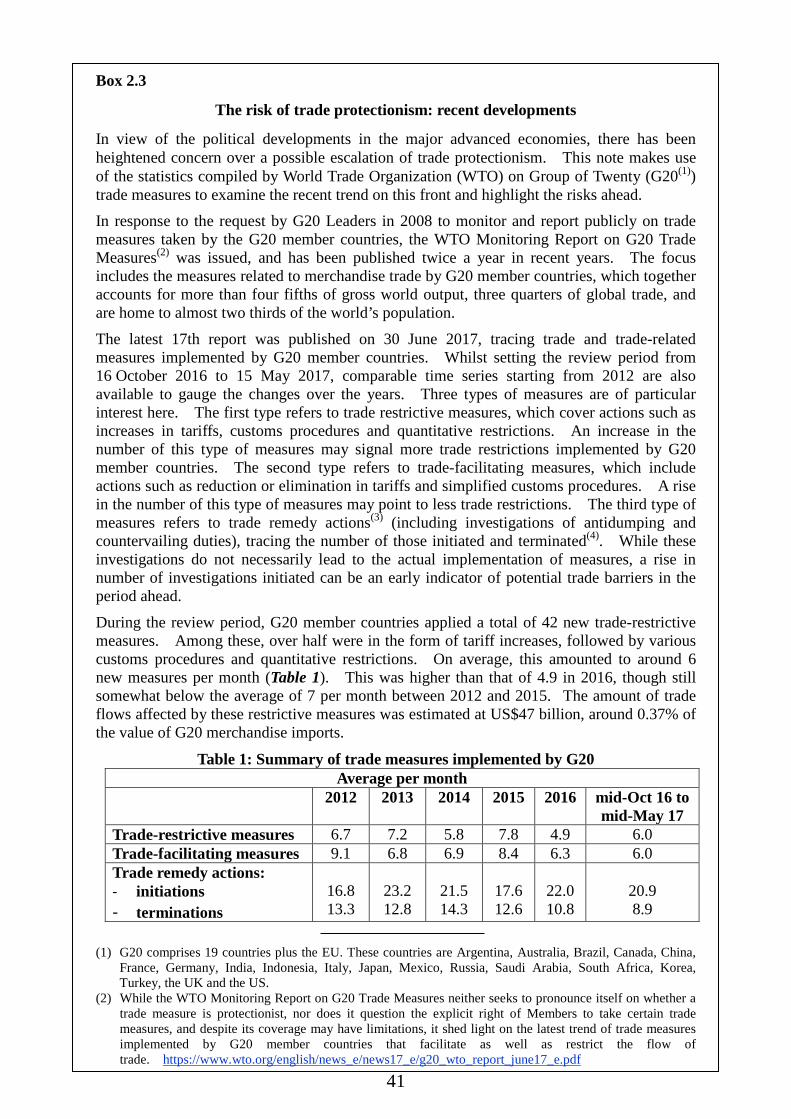
In view of the political developments in the major advanced economies, there has been heightened concern over a possible escalation of trade protectionism. This note makes use of the statistics compiled by World Trade Organization (WTO) on Group of Twenty (G20(1)) trade measures to examine the recent trend on this front and highlight the risks ahead. In response to the request by G20 Leaders in 2008 to monitor and report publicly on trade measures taken by the G20 member countries, the WTO Monitoring Report on G20 Trade Measures(2) was issued, and has been published twice a year in recent years. The focus includes the measures related to merchandise trade by G20 member countries, which together accounts for more than four fifths of gross world output, three quarters of global trade, and are home to almost two thirds of the world’s population.
The latest 17th report was published on 30 June 2017, tracing trade and trade-related measures implemented by G20 member countries. Whilst setting the review period from 16 October 2016 to 15 May 2017, comparable time series starting from 2012 are also available to gauge the changes over the years. Three types of measures are of particular interest here. The first type refers to trade restrictive measures, which cover actions such as increases in tariffs, customs procedures and quantitative restrictions. An increase in the number of this type of measures may signal more trade restrictions implemented by G20 member countries. The second type refers to trade-facilitating measures, which include actions such as reduction or elimination in tariffs and simplified customs procedures. A rise in the number of this type of measures may point to less trade restrictions. The third type of measures refers to trade remedy actions(3) (including investigations of antidumping and countervailing duties), tracing the number of those initiated and terminated(4). While these investigations do not necessarily lead to the actual implementation of measures, a rise in number of investigations initiated can be an early indicator of potential trade barriers in the period ahead.
During the review period, G20 member countries applied a total of 42 new trade-restrictive measures. Among these, over half were in the form of tariff increases, followed by various customs procedures and quantitative restrictions. On average, this amounted to around 6 new measures per month (Table 1). This was higher than that of 4.9 in 2016, though still somewhat below the average of 7 per month between 2012 and 2015. The amount of trade flows affected by these restrictive measures was estimated at US$47 billion, around 0.37% of the value of G20 merchandise imports.
Table 1: Summary of trade measures implemented by G20 Average per month
2012 2013 2014 2015 2016 mid-Oct 16 to mid-May 17
Trade-restrictive measures 6.7 7.2 5.8 7.8 4.9 6.0 Trade-facilitating measures 9.1 6.8 6.9 8.4 6.3 6.0 Trade remedy actions: - initiations - terminations
16.8 13.3
23.2 12.8
21.5 14.3
17.6 12.6
22.0 10.8
20.9 8.9
(1) G20 comprises 19 countries plus the EU. These countries are Argentina, Australia, Brazil, Canada, China, France, Germany, India, Indonesia, Italy, Japan, Mexico, Russia, Saudi Arabia, South Africa, Korea, Turkey, the UK and the US.
(2) While the WTO Monitoring Report on G20 Trade Measures neither seeks to pronounce itself on whether a trade measure is protectionist, nor does it question the explicit right of Members to take certain trade measures, and despite its coverage may have limitations, it shed light on the latest trend of trade measures implemented by G20 member countries that facilitate as well as restrict the flow of trade. https://www.wto.org/english/news_e/news17_e/g20_wto_report_june17_e.pdf

`
42
Box 2.3 (Cont’d) Concurrently, G20 member countries altogether reported 42 new measures implemented in facilitating trade, mostly in the form of eliminated or reduced tariffs, though there are some in the form of simplified customs procedures. On average, 6 new measures were implemented per month during the review period, about the same as the average in 2016. Yet, these facilitating measures were estimated to benefit trade flows valued at US$163 billion, significantly higher than that of restrictive measures at US$47 billion. On trade remedy, 146 initiations were recorded for G20 member countries during the review period, with anti-dumping investigations the most frequent actions. At an average of 20.9 per month, the number of trade remedy initiations declined somewhat compared to the average in 2016. The trade covered by the trade remedy investigations initiated in the review period was estimated to be at US$25 billion, or 0.20% of G20 merchandise imports value. Meanwhile, the monthly average of trade remedy terminations fell and continued to be lower than that of initiations. In sum, the latest statistics did not indicate a visible increase in trade barriers among G20 member countries during the review period. This, coupled with the global economic uptake, has orchestrated a visible upturn in world trade flows so far this year. World trade volume picked up to increase 4.2% year-on-year in the first half of 2017, from the 1.3% growth in 2016. The improving global demand boosted regional trade flows in Asia, including those through Hong Kong. Our merchandise exports increased notably by 6.8% in volume terms in the first nine months, a strong pick-up from the 1.4% increase in 2016. Nevertheless, recent international political developments indicate that the threat of trade protectionism has not dissipated. For example, the renegotiations on North America Free Trade Area (NAFTA) between the US, Canada and Mexico continued, and the target date was extended to the first quarter of 2018 from the end of 2017 as previously scheduled. The US and Korea has also started the process to amend the US-Korea Free Trade Agreement that has been come into force in 2012. Besides, the US Trade Representative in August 2017 formally initiated an investigation of China’s trade practice under Section 301 of the Trade Act of 1974. In Europe, the Brexit negotiations are yet to have meaningful progress, and the possibility of a significant increase in trade barriers between the two parties after Brexit cannot be ruled out. On a positive note, G20 leaders in its communique of Hamburg Summit in July 2017 continued to acknowledge international trade and investment as important engines of world economic growth, productivity and development, and agreed to enhance international cooperation towards inclusive and sustainable global growth. They were committed to keep markets open and fight protectionism, including all “unfair trade practices”, and recognised the need for “legitimate trade defence instruments”. Hong Kong has all along been a staunch supporter of free trade. Indeed, Hong Kong, China is the first WTO Member to join the WTO Trade Facilitation Agreement, the first multilateral agreement concluded since the establishment of the WTO. In September 2017, Hong Kong announced the conclusion of negotiations for a Free Trade Agreement and a related Investment Agreement with ASEAN. Hong Kong strongly supports trade liberalisation via deepening and widening regional economic integration and believes the multilateral trading system to be the most effective safeguard against protectionism.
(3) According to many WTO Members, trade remedy measures are taken to address market distortions
resulting from trade practices in another trading partner. WTO Members are permitted to impose duties to offset what is perceived to be injurious dumping or subsidisation of products exported from one Member to another. Termination means either the termination of the investigation (without imposition of a measure) or elimination of the imposed measure.
(4) WTO Monitoring Report on G20 Trade Measures counted anti-dumping or countervailing investigation involving imports from n countries/customs territories as n investigations. Similarly, a termination of an imposed measure on imports from n countries/customs territories is counted as n terminations.

`
43
Notes : (1) Changes in merchandise exports and imports in real terms are derived by discounting
the effect of price changes from changes in the value of the trade aggregates. Estimates of price changes for the trade aggregates are based on changes in unit values, which do not take into account changes in the composition or quality of the goods traded, except for some selected commodities for which specific price indices are available. The real growth figures reported here are based on the external trade quantum index series compiled using the chain linking approach, which were first released in March 2015 to replace the previous trade index numbers compiled using the Laspeyres method with a fixed base year. The series are not comparable with the real trade aggregates under GDP (reported in Chapter 1) which are compiled based on the change of ownership principle in recording goods sent abroad for processing and merchanting under the standards stipulated in the System of National Accounts 2008. Apart from this, non-monetary gold is recorded as a separate item in the statistics of merchandise trade and not included in the trade aggregates reported in Chapter 2, but is included in the trade aggregates under GDP in accordance to the international compilation standard.
(2) Re-exports are those goods which have previously been imported into Hong Kong and
are subsequently exported without having undergone in Hong Kong any manufacturing processes which change permanently the shape, nature, form or utility of the goods.