Embed Size (px)
Citation preview

1
External Sector Performance – October 2020
Economic Research Department
14 December 2020
The CBSL publishes a ‘Monthly Trade Bulletin’, with further information on merchandise trade performance, which can be viewed at Central Bank of Sri Lanka’s website under Statistics > Economic Indicators > Monthly Trade Bulletin. https://www.cbsl.gov.lk/en/monthly-trade-bulletin
2
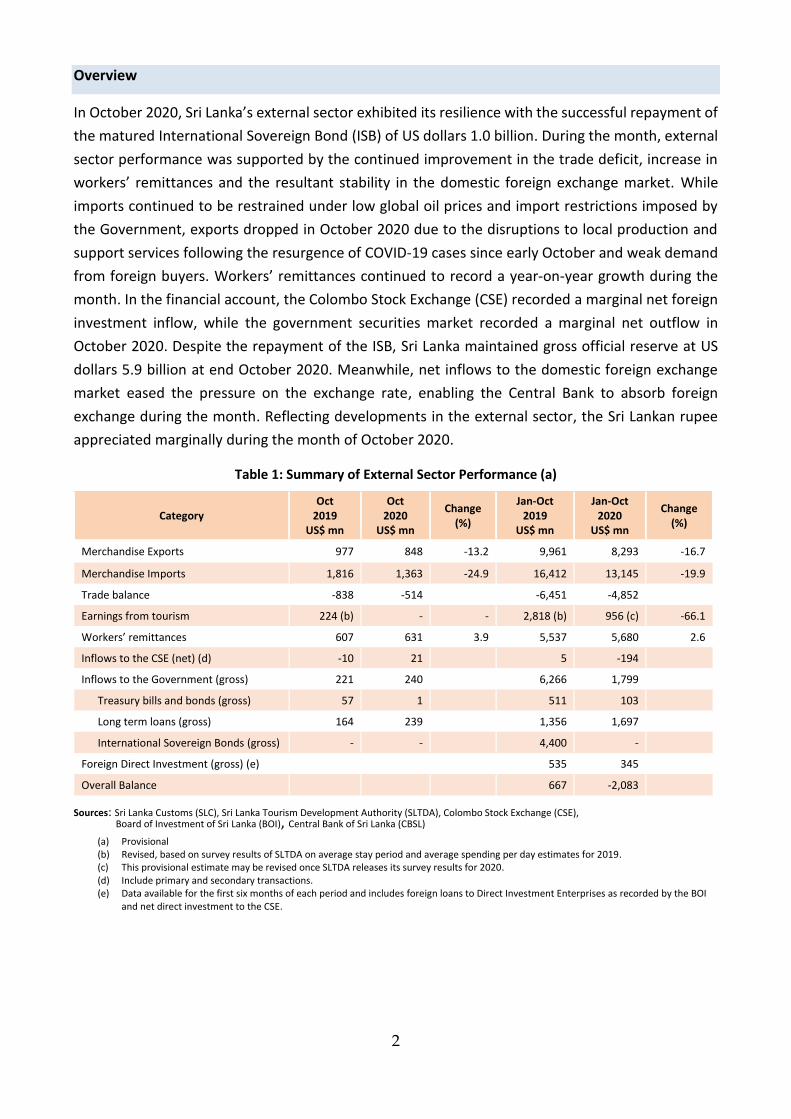
Overview
In October 2020, Sri Lanka’s external sector exhibited its resilience with the successful repayment of
the matured International Sovereign Bond (ISB) of US dollars 1.0 billion. During the month, external
sector performance was supported by the continued improvement in the trade deficit, increase in
workers’ remittances and the resultant stability in the domestic foreign exchange market. While
imports continued to be restrained under low global oil prices and import restrictions imposed by
the Government, exports dropped in October 2020 due to the disruptions to local production and
support services following the resurgence of COVID-19 cases since early October and weak demand
from foreign buyers. Workers’ remittances continued to record a year-on-year growth during the
month. In the financial account, the Colombo Stock Exchange (CSE) recorded a marginal net foreign
investment inflow, while the government securities market recorded a marginal net outflow in
October 2020. Despite the repayment of the ISB, Sri Lanka maintained gross official reserve at US
dollars 5.9 billion at end October 2020. Meanwhile, net inflows to the domestic foreign exchange
market eased the pressure on the exchange rate, enabling the Central Bank to absorb foreign
exchange during the month. Reflecting developments in the external sector, the Sri Lankan rupee
appreciated marginally during the month of October 2020.
Table 1: Summary of External Sector Performance (a)
Category Oct
2019 US$ mn
Oct 2020
US$ mn
Change (%)
Jan-Oct 2019
US$ mn
Jan-Oct 2020
US$ mn
Change (%)
Merchandise Exports 977 848 -13.2 9,961 8,293 -16.7
Merchandise Imports 1,816 1,363 -24.9 16,412 13,145 -19.9
Trade balance -838 -514 -6,451 -4,852
Earnings from tourism 224 (b) - - 2,818 (b) 956 (c) -66.1
Workers’ remittances 607 631 3.9 5,537 5,680 2.6
Inflows to the CSE (net) (d) -10 21 5 -194
Inflows to the Government (gross) 221 240 6,266 1,799
Treasury bills and bonds (gross) 57 1 511 103
Long term loans (gross) 164 239 1,356 1,697
International Sovereign Bonds (gross) - - 4,400 -
Foreign Direct Investment (gross) (e) 535 345
Overall Balance 667 -2,083
Sources: Sri Lanka Customs (SLC), Sri Lanka Tourism Development Authority (SLTDA), Colombo Stock Exchange (CSE),
Board of Investment of Sri Lanka (BOI), Central Bank of Sri Lanka (CBSL)
(a) Provisional (b) Revised, based on survey results of SLTDA on average stay period and average spending per day estimates for 2019. (c) This provisional estimate may be revised once SLTDA releases its survey results for 2020. (d) Include primary and secondary transactions. (e) Data available for the first six months of each period and includes foreign loans to Direct Investment Enterprises as recorded by the BOI
and net direct investment to the CSE.
3
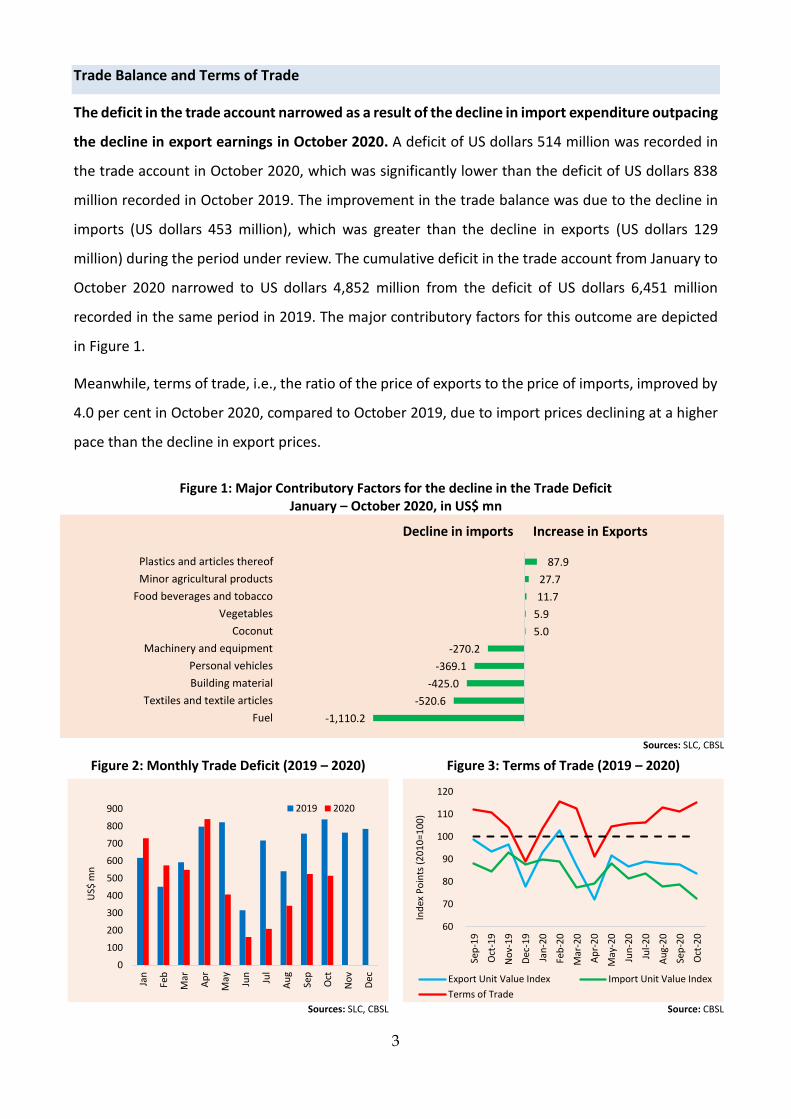
Trade Balance and Terms of Trade
The deficit in the trade account narrowed as a result of the decline in import expenditure outpacing
the decline in export earnings in October 2020. A deficit of US dollars 514 million was recorded in
the trade account in October 2020, which was significantly lower than the deficit of US dollars 838
million recorded in October 2019. The improvement in the trade balance was due to the decline in
imports (US dollars 453 million), which was greater than the decline in exports (US dollars 129
million) during the period under review. The cumulative deficit in the trade account from January to
October 2020 narrowed to US dollars 4,852 million from the deficit of US dollars 6,451 million
recorded in the same period in 2019. The major contributory factors for this outcome are depicted
in Figure 1.
Meanwhile, terms of trade, i.e., the ratio of the price of exports to the price of imports, improved by
4.0 per cent in October 2020, compared to October 2019, due to import prices declining at a higher
pace than the decline in export prices.
Figure 1: Major Contributory Factors for the decline in the Trade Deficit January – October 2020, in US$ mn
Sources: SLC, CBSL
Figure 2: Monthly Trade Deficit (2019 – 2020) Figure 3: Terms of Trade (2019 – 2020)
Sources: SLC, CBSL
Source: CBSL
-1,110.2
-520.6
-425.0
-369.1
-270.2
5.0
5.9
11.7
27.7
87.9
Fuel
Textiles and textile articles
Building material
Personal vehicles
Machinery and equipment
Coconut
Vegetables
Food beverages and tobacco
Minor agricultural products
Plastics and articles thereof
Decline in imports Increase in Exports
0
100
200
300
400
500
600
700
800
900
Jan
Feb
Mar
Ap
r
May Jun
Jul
Au
g
Sep
Oct
No
v
Dec
US$
mn
2019 2020
60
70
80
90
100
110
120
Sep
-19
Oct
-19
No
v-1
9
Dec
-19
Jan
-20
Feb
-20
Mar
-20
Ap
r-2
0
May
-20
Jun
-20
Jul-
20
Au
g-2
0
Sep
-20
Oct
-20
Ind
ex P
oin
ts (
20
10
=10
0)
Export Unit Value Index Import Unit Value Index
Terms of Trade
4
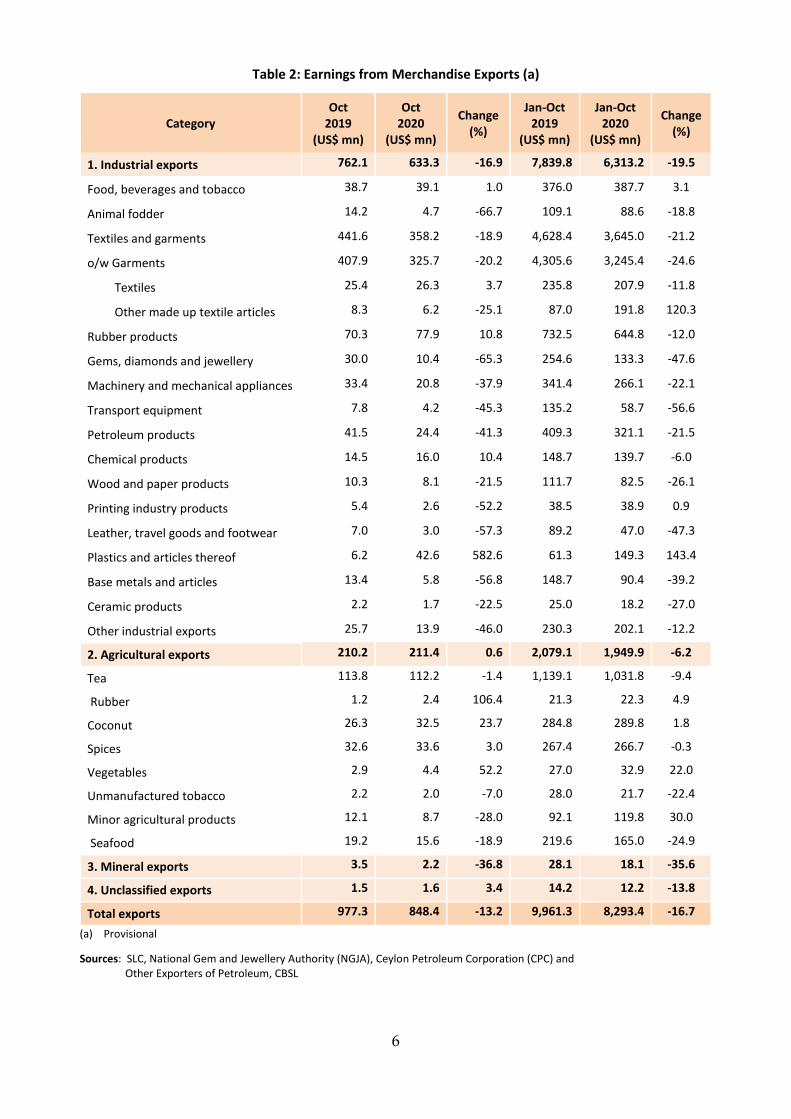
Performance of Merchandise Exports
Earnings from merchandise exports suffered in October 2020 due to the impact of the resurgence
of COVID-19 cases, although exports of agricultural products continued to grow. Earnings from
merchandise exports in October 2020 were lower compared to October 2019 as well as September
2020, due to the sudden outbreak of the second wave of the pandemic that resulted in disruptions
to planned production and support services in the country, especially in the garment industry.
Further, adverse global market conditions for Sri Lanka’s key exports were aggravated by the second
wave of the COVID-19 pandemic experienced by many countries, leading to low demand for exports
of Sri Lanka. As a result, earnings from exports in October 2020 amounted to US dollars 848 million,
which was 13.2 per cent lower than October 2019 and 15.2 per cent lower than September 2020.
Earnings from the export of industrial goods declined by 16.9 per cent in October 2020, on a year-
on-year basis, due to the weakened performance of the textiles and garments, and most of the
smaller sectors, including gems, diamonds and jewellery; petroleum products; and machinery and
mechanical appliances. The export of textiles and garments declined by 18.9 per cent, with reduced
exports to the USA, the EU and other markets. However, export earnings from plastics and articles
thereof and rubber products increased, led by their sub categories related to personal protective
equipment (PPE) products such as plastic clothing articles, surgical and other gloves.
Export earnings from agricultural goods increased marginally by 0.6 per cent in October 2020, on a
year-on-year basis, led by coconut exports (mainly coconut oil and non-kernel products), spices
(mainly cinnamon) and natural rubber. Meanwhile, earnings from tea exports declined by 1.4 per
cent due to the decline in volume of tea exports although unit value increased. Other agricultural
export sectors which registered a decline during the period under review compared to October 2019
included seafood, minor agricultural products (mainly fruits and edible nuts), and unmanufactured
tobacco.
Mineral exports declined by 36.8 per cent in October 2020 compared to October 2019. Exports of
earths and stones such as quartz and granite increased, while exports of graphite powder and natural
sands declined. Further, export of ores and slag such as titanium and zirconium also declined.
The export volume index declined by 2.8 per cent while the unit value index deteriorated by 10.6 per
cent, on a year-on-year basis in October 2020, indicating that the decrease in export earnings was
caused by both lower volumes and lower prices.

5
Figure 4: Monthly Export Performance
Figure 5: Monthly Export Volume Index
Sources: SLC, CBSL Source: CBSL
200
300
400
500
600
700
800
900
1,000
1,100
1,200
Jan
Feb
Mar
Ap
r
May Jun
Jul
Au
g
Sep
Oct
No
v
Dec
US$
mn
2018
2019
2020
40
60
80
100
120
140
160
180
200
Jan
Feb
Mar
Ap
r
May Jun
Jul
Au
g
Sep
Oct
No
v
Dec
Ind
ex P
oin
ts (
20
10
=10
0)
2018
2019
2020
6
Table 2: Earnings from Merchandise Exports (a)
(a) Provisional
Sources: SLC, National Gem and Jewellery Authority (NGJA), Ceylon Petroleum Corporation (CPC) and Other Exporters of Petroleum, CBSL
Category Oct
2019 (US$ mn)
Oct 2020
(US$ mn)
Change (%)
Jan-Oct 2019
(US$ mn)
Jan-Oct 2020
(US$ mn)
Change (%)
1. Industrial exports 762.1 633.3 -16.9 7,839.8 6,313.2 -19.5
Food, beverages and tobacco 38.7 39.1 1.0 376.0 387.7 3.1
Animal fodder 14.2 4.7 -66.7 109.1 88.6 -18.8
Textiles and garments 441.6 358.2 -18.9 4,628.4 3,645.0 -21.2
o/w Garments 407.9 325.7 -20.2 4,305.6 3,245.4 -24.6
Textiles 25.4 26.3 3.7 235.8 207.9 -11.8
Other made up textile articles 8.3 6.2 -25.1 87.0 191.8 120.3
Rubber products 70.3 77.9 10.8 732.5 644.8 -12.0
Gems, diamonds and jewellery 30.0 10.4 -65.3 254.6 133.3 -47.6
Machinery and mechanical appliances 33.4 20.8 -37.9 341.4 266.1 -22.1
Transport equipment 7.8 4.2 -45.3 135.2 58.7 -56.6
Petroleum products 41.5 24.4 -41.3 409.3 321.1 -21.5
Chemical products 14.5 16.0 10.4 148.7 139.7 -6.0
Wood and paper products 10.3 8.1 -21.5 111.7 82.5 -26.1
Printing industry products 5.4 2.6 -52.2 38.5 38.9 0.9
Leather, travel goods and footwear 7.0 3.0 -57.3 89.2 47.0 -47.3
Plastics and articles thereof 6.2 42.6 582.6 61.3 149.3 143.4
Base metals and articles 13.4 5.8 -56.8 148.7 90.4 -39.2
Ceramic products 2.2 1.7 -22.5 25.0 18.2 -27.0
Other industrial exports 25.7 13.9 -46.0 230.3 202.1 -12.2
2. Agricultural exports 210.2 211.4 0.6 2,079.1 1,949.9 -6.2
Tea 113.8 112.2 -1.4 1,139.1 1,031.8 -9.4
Rubber 1.2 2.4 106.4 21.3 22.3 4.9
Coconut 26.3 32.5 23.7 284.8 289.8 1.8
Spices 32.6 33.6 3.0 267.4 266.7 -0.3
Vegetables 2.9 4.4 52.2 27.0 32.9 22.0
Unmanufactured tobacco 2.2 2.0 -7.0 28.0 21.7 -22.4
Minor agricultural products 12.1 8.7 -28.0 92.1 119.8 30.0
Seafood 19.2 15.6 -18.9 219.6 165.0 -24.9
3. Mineral exports 3.5 2.2 -36.8 28.1 18.1 -35.6
4. Unclassified exports 1.5 1.6 3.4 14.2 12.2 -13.8
Total exports 977.3 848.4 -13.2 9,961.3 8,293.4 -16.7
7
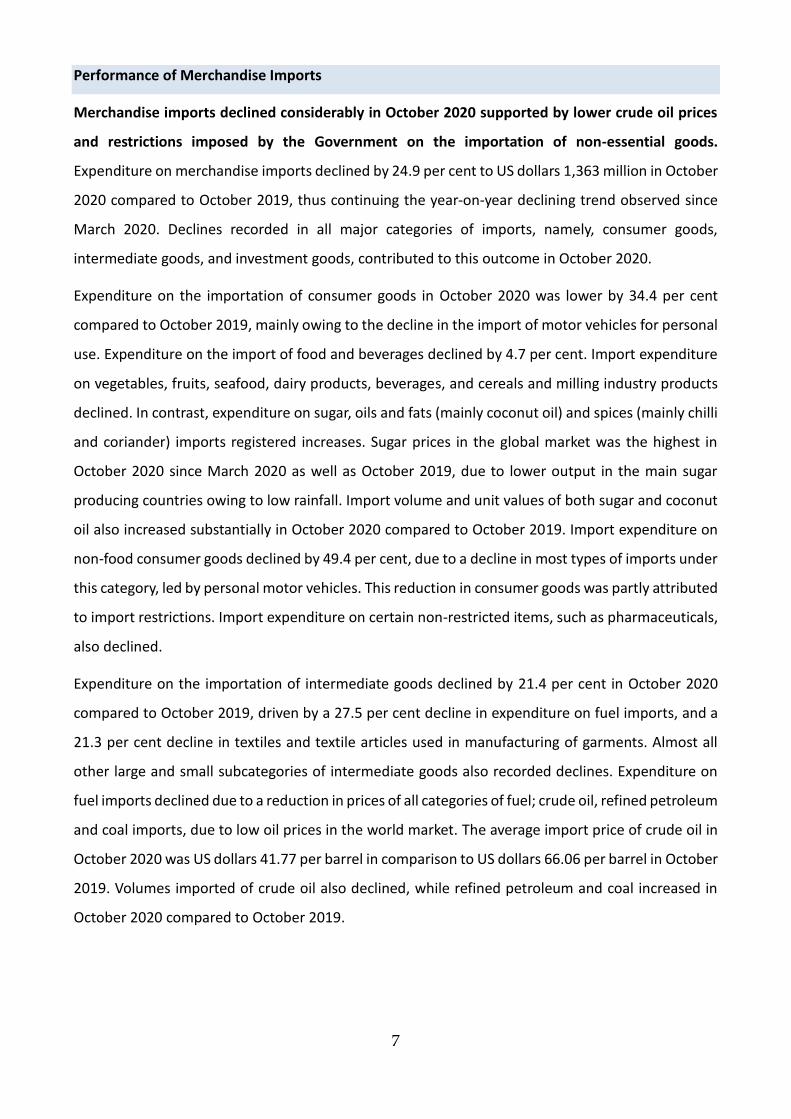
Performance of Merchandise Imports
Merchandise imports declined considerably in October 2020 supported by lower crude oil prices
and restrictions imposed by the Government on the importation of non-essential goods.
Expenditure on merchandise imports declined by 24.9 per cent to US dollars 1,363 million in October
2020 compared to October 2019, thus continuing the year-on-year declining trend observed since
March 2020. Declines recorded in all major categories of imports, namely, consumer goods,
intermediate goods, and investment goods, contributed to this outcome in October 2020.
Expenditure on the importation of consumer goods in October 2020 was lower by 34.4 per cent
compared to October 2019, mainly owing to the decline in the import of motor vehicles for personal
use. Expenditure on the import of food and beverages declined by 4.7 per cent. Import expenditure
on vegetables, fruits, seafood, dairy products, beverages, and cereals and milling industry products
declined. In contrast, expenditure on sugar, oils and fats (mainly coconut oil) and spices (mainly chilli
and coriander) imports registered increases. Sugar prices in the global market was the highest in
October 2020 since March 2020 as well as October 2019, due to lower output in the main sugar
producing countries owing to low rainfall. Import volume and unit values of both sugar and coconut
oil also increased substantially in October 2020 compared to October 2019. Import expenditure on
non-food consumer goods declined by 49.4 per cent, due to a decline in most types of imports under
this category, led by personal motor vehicles. This reduction in consumer goods was partly attributed
to import restrictions. Import expenditure on certain non-restricted items, such as pharmaceuticals,
also declined.
Expenditure on the importation of intermediate goods declined by 21.4 per cent in October 2020
compared to October 2019, driven by a 27.5 per cent decline in expenditure on fuel imports, and a
21.3 per cent decline in textiles and textile articles used in manufacturing of garments. Almost all
other large and small subcategories of intermediate goods also recorded declines. Expenditure on
fuel imports declined due to a reduction in prices of all categories of fuel; crude oil, refined petroleum
and coal imports, due to low oil prices in the world market. The average import price of crude oil in
October 2020 was US dollars 41.77 per barrel in comparison to US dollars 66.06 per barrel in October
2019. Volumes imported of crude oil also declined, while refined petroleum and coal increased in
October 2020 compared to October 2019.
8
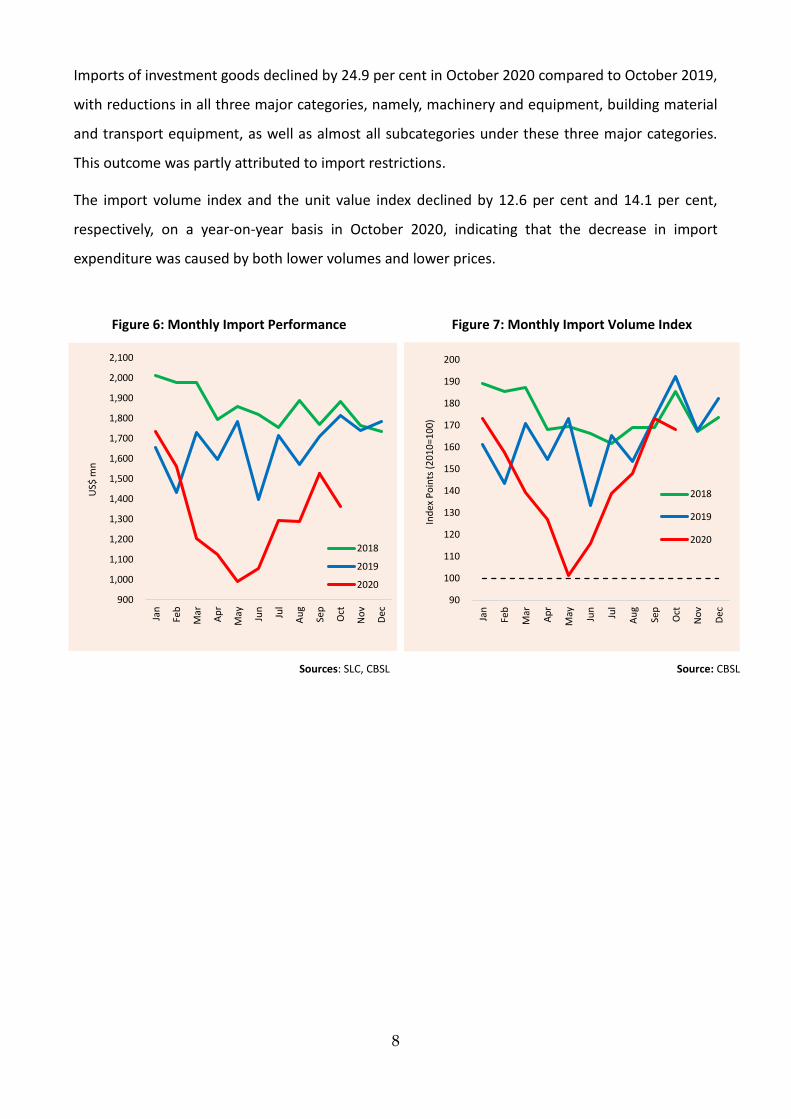
Imports of investment goods declined by 24.9 per cent in October 2020 compared to October 2019,
with reductions in all three major categories, namely, machinery and equipment, building material
and transport equipment, as well as almost all subcategories under these three major categories.
This outcome was partly attributed to import restrictions.
The import volume index and the unit value index declined by 12.6 per cent and 14.1 per cent,
respectively, on a year-on-year basis in October 2020, indicating that the decrease in import
expenditure was caused by both lower volumes and lower prices.
Figure 6: Monthly Import Performance Figure 7: Monthly Import Volume Index
Sources: SLC, CBSL Source: CBSL
900
1,000
1,100
1,200
1,300
1,400
1,500
1,600
1,700
1,800
1,900
2,000
2,100
Jan
Feb
Mar
Ap
r
May Jun
Jul
Au
g
Sep
Oct
No
v
Dec
US$
mn
2018
2019
2020
90
100
110
120
130
140
150
160
170
180
190
200
Jan
Feb
Mar
Ap
r
May Jun
Jul
Au
g
Sep
Oct
No
v
Dec
Ind
ex P
oin
ts (
20
10
=10
0)
2018
2019
2020

9
Table 3: Expenditure on Merchandise Imports (a)
Category Oct
2019 (US$ mn)
Oct 2020
(US$ mn)
Change (%)
Jan-Oct 2019
(US$ mn)
Jan-Oct 2020
(US$ mn)
Change (%)
1. Consumer goods 383.3 251.6 -34.4 3,195.3 2,818.4 -11.8
Food and beverages 128.9 122.8 -4.7 1,138.2 1,271.7 11.7
Cereals and milling industry products 4.0 3.3 -18.2 28.8 27.4 -5.0
Dairy products 25.5 20.3 -20.2 250.4 273.3 9.1
Vegetables (b) 29.6 17.6 -40.7 237.2 280.1 18.1
Seafood 19.0 11.5 -39.7 179.0 164.9 -7.9
Sugar and confectionery 17.5 32.8 87.3 160.2 233.4 45.7
Spices 10.6 11.7 10.5 90.1 106.0 17.7
Other food and beverages 22.7 25.8 13.4 192.5 186.6 -3.0
Non-food consumer goods 254.4 128.7 -49.4 2,057.1 1,546.7 -24.8
Personal vehicles 84.6 0.5 -99.4 651.0 281.9 -56.7
Medical and pharmaceuticals 54.2 51.9 -4.3 453.6 493.6 8.8
Home appliances 19.2 16.8 -12.5 165.7 134.2 -19.0
Clothing and accessories 26.9 12.8 -52.4 230.6 165.9 -28.1
Telecommunication devices 25.9 15.1 -41.6 199.4 210.7 5.7
Household and furniture items 17.7 13.5 -23.6 140.4 118.0 -16.0
Other non-food consumables 26.0 18.1 -30.3 216.4 142.4 -34.2
2. Intermediate goods 1,040.2 817.5 -21.4 9,420.7 7,393.2 -21.5
Fuel 308.3 223.4 -27.5 3,238.8 2,128.6 -34.3
o/w Crude oil 95.0 28.0 -70.5 824.3 479.2 -41.9
Refined petroleum 192.4 172.0 -10.6 2,245.2 1,481.3 -34.0
Coal 20.9 23.4 12.2 169.2 168.1 -0.6
Diamonds, precious stones and metals 19.0 13.5 -28.8 158.1 80.7 -48.9
Textiles and textile articles 277.1 218.1 -21.3 2,404.2 1,883.6 -21.7
Paper and paperboard and articles thereof 46.6 35.0 -24.9 382.7 312.1 -18.4
Agricultural inputs 14.9 14.2 -4.6 155.6 161.8 4.0
Wheat and maize 33.0 24.1 -27.1 266.9 314.1 17.7
Base metals 69.1 63.4 -8.2 477.8 385.4 -19.3
Plastic and articles thereof 61.0 51.8 -15.1 506.1 440.3 -13.0
Chemical products 76.9 71.8 -6.6 698.2 669.9 -4.1
Fertiliser 27.4 22.5 -18.1 194.9 161.5 -17.1
Rubber and articles thereof 24.6 17.4 -29.3 199.5 182.7 -8.4
Mineral products 26.4 11.5 -56.5 185.4 143.5 -22.6
Other intermediate goods 56.1 50.9 -9.2 552.6 529.0 -4.3
3. Investment goods 391.0 293.5 -24.9 3,789.4 2,920.9 -22.9
Machinery and equipment 218.2 183.0 -16.1 2,034.9 1,764.7 -13.3
Building material 133.8 87.5 -34.6 1,277.2 852.2 -33.3
Transport equipment 38.5 22.8 -40.9 471.9 301.3 -36.1
Other investment goods 0.4 0.2 -44.2 5.3 2.6 -50.5
4. Unclassified imports 1.2 0.2 -83.5 6.4 12.4 92.9
Total imports 1,815.7 1,362.8 -24.9 16,411.8 13,145.0 -19.9
Non-fuel imports 1,507.4 1,139.4 -24.4 13,173.0 11,016.4 -16.4
(a) Provisional
(b) Includes lentils, onions, potatoes, leguminous and other vegetables
Sources: SLC, CPC, Lanka IOC PLC, CBSL
10
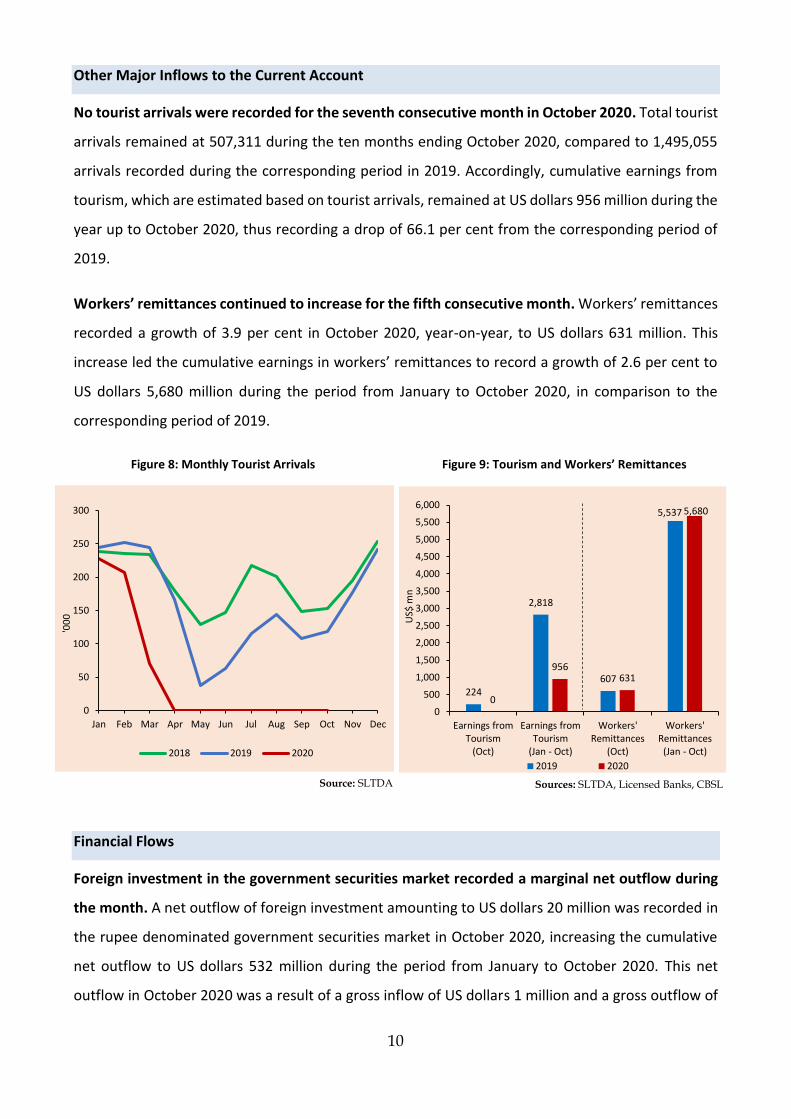
Other Major Inflows to the Current Account
No tourist arrivals were recorded for the seventh consecutive month in October 2020. Total tourist
arrivals remained at 507,311 during the ten months ending October 2020, compared to 1,495,055
arrivals recorded during the corresponding period in 2019. Accordingly, cumulative earnings from
tourism, which are estimated based on tourist arrivals, remained at US dollars 956 million during the
year up to October 2020, thus recording a drop of 66.1 per cent from the corresponding period of
2019.
Workers’ remittances continued to increase for the fifth consecutive month. Workers’ remittances
recorded a growth of 3.9 per cent in October 2020, year-on-year, to US dollars 631 million. This
increase led the cumulative earnings in workers’ remittances to record a growth of 2.6 per cent to
US dollars 5,680 million during the period from January to October 2020, in comparison to the
corresponding period of 2019.
Figure 8: Monthly Tourist Arrivals Figure 9: Tourism and Workers’ Remittances
Financial Flows
Foreign investment in the government securities market recorded a marginal net outflow during
the month. A net outflow of foreign investment amounting to US dollars 20 million was recorded in
the rupee denominated government securities market in October 2020, increasing the cumulative
net outflow to US dollars 532 million during the period from January to October 2020. This net
outflow in October 2020 was a result of a gross inflow of US dollars 1 million and a gross outflow of
Source: SLTDA Sources: SLTDA, Licensed Banks, CBSL
0
50
100
150
200
250
300
Jan Feb Mar Apr May Jun Jul Aug Sep Oct Nov Dec
'00
0
2018 2019 2020
224
2,818
607
5,537
0
956631
5,680
0
500
1,000
1,500
2,000
2,500
3,000
3,500
4,000
4,500
5,000
5,500
6,000
Earnings fromTourism
(Oct)
Earnings fromTourism
(Jan - Oct)
Workers'Remittances
(Oct)
Workers'Remittances
(Jan - Oct)
US$
mn
2019 2020

11
US dollars 21 million. The total outstanding exposure of foreign investment in the rupee
denominated government securities market remained relatively small at US dollars 56 million by end
October 2020.
The CSE recorded foreign investments, on a net basis, while foreign loans to the Government
increased in October 2020. When considering both the primary market and the secondary market,
the CSE recorded a net inflow of US dollars 21 million in October 2020. This inflow was a result of a
large inflow of US dollars 50 million to the primary market while the secondary market recorded a
net outflow of US dollars 29 million during the month. On a cumulative basis, the CSE recorded a net
outflow of US dollars 194 million during the ten months ending October 2020. Meanwhile, long term
loans to the Government recorded a net inflow of US dollars 185 million in October 2020.
International Reserves
Gross official reserves remained at a sufficient level by end October 2020, despite a major debt
repayment by way of settlement of an ISB. The level of gross official reserves amounted to US
dollars 5.9 billion with the repayment of the matured ISB of US dollars 1.0 billion in early October
2020. Gross official reserves were equivalent to 4.2 months of imports. Total foreign assets, which
consist of gross official reserves and foreign assets of the banking sector, amounted to US dollars 8.6
billion at end October 2020, providing an import cover of 6.2 months.
Figure 10: Gross Official Reserves and Reserve Adequacy
Source: CBSL
7.6
6.7
5.9
0
1
2
3
4
5
6
0
1
2
3
4
5
6
7
8
9
10
Jan
-18
Feb
-18
Mar
-18
Ap
r-1
8M
ay-1
8Ju
n-1
8Ju
l-1
8A
ug-
18
Sep
-18
Oct
-18
No
v-1
8D
ec-1
8Ja
n-1
9Fe
b-1
9M
ar-1
9A
pr-
19
May
-19
Jun
-19
Jul-
19
Au
g-1
9Se
p-1
9O
ct-1
9N
ov-
19
Dec
-19
Jan
-20
Feb
-20
Mar
-20
Ap
r-2
0M
ay-2
0Ju
n-2
0Ju
l-2
0A
ug-
20
Sep
-20
Oct
-20
Mo
nth
s o
f Im
po
rts
US$
bn
Gross Official Reserves (Left Axis)
Reserve Adequacy : Months of Imports (Right Axis)
12
Source: CBSL
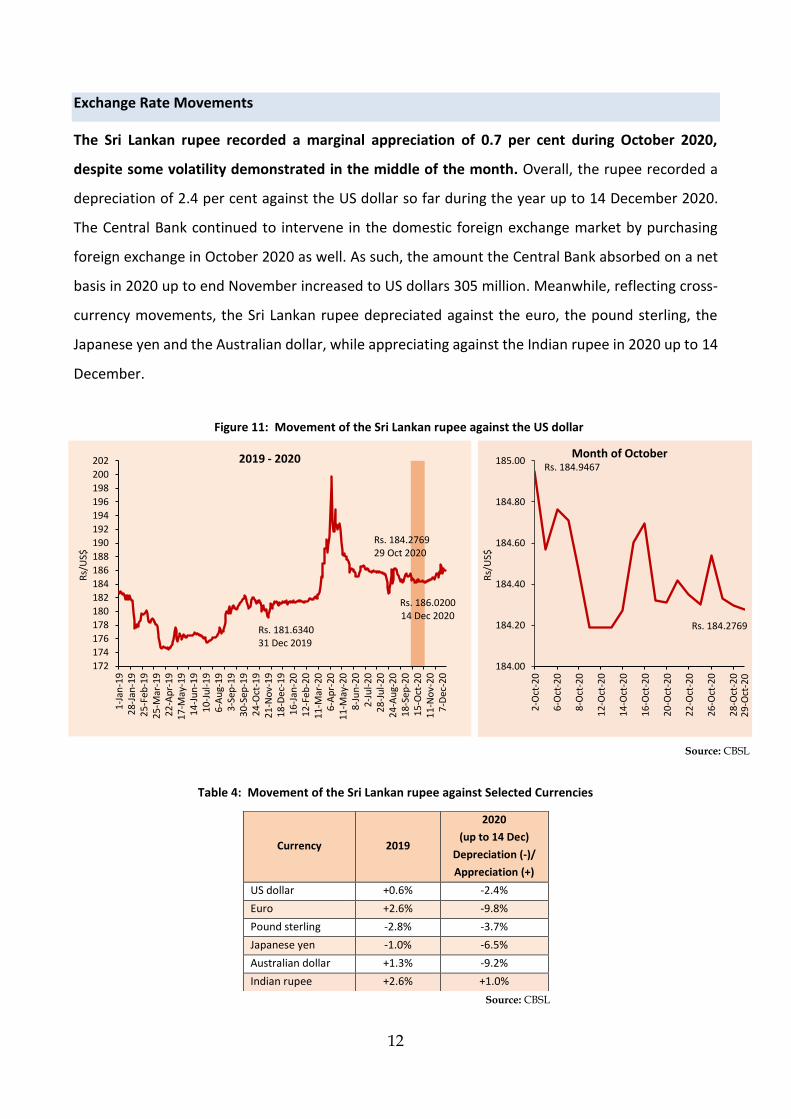
Exchange Rate Movements
The Sri Lankan rupee recorded a marginal appreciation of 0.7 per cent during October 2020,
despite some volatility demonstrated in the middle of the month. Overall, the rupee recorded a
depreciation of 2.4 per cent against the US dollar so far during the year up to 14 December 2020.
The Central Bank continued to intervene in the domestic foreign exchange market by purchasing
foreign exchange in October 2020 as well. As such, the amount the Central Bank absorbed on a net
basis in 2020 up to end November increased to US dollars 305 million. Meanwhile, reflecting cross-
currency movements, the Sri Lankan rupee depreciated against the euro, the pound sterling, the
Japanese yen and the Australian dollar, while appreciating against the Indian rupee in 2020 up to 14
December.
Figure 11: Movement of the Sri Lankan rupee against the US dollar
Table 4: Movement of the Sri Lankan rupee against Selected Currencies
Source: CBSL
Currency 2019
2020
(up to 14 Dec)
Depreciation (-)/
Appreciation (+)
US dollar +0.6% -2.4%
Euro +2.6% -9.8%
Pound sterling -2.8% -3.7%
Japanese yen -1.0% -6.5%
Australian dollar +1.3% -9.2%
Indian rupee +2.6% +1.0%
Rs. 184.9467
Rs. 184.2769
184.00
184.20
184.40
184.60
184.80
185.00
2-O
ct-2
0
6-O
ct-2
0
8-O
ct-2
0
12
-Oct
-20
14
-Oct
-20
16
-Oct
-20
20
-Oct
-20
22
-Oct
-20
26
-Oct
-20
28
-Oct
-20
Rs/
US$
Month of October
29
-Oct
-20
172
174
176
178
180
182
184
186
188
190
192
194
196
198
200
202
1-J
an-1
92
8-J
an-1
92
5-F
eb-1
92
5-M
ar-1
92
2-A
pr-
19
17
-May
-19
14
-Ju
n-1
91
0-J
ul-
19
6-A
ug-
193
-Sep
-19
30
-Sep
-19
24
-Oct
-19
21
-No
v-1
91
8-D
ec-1
91
6-J
an-2
01
2-F
eb-2
01
1-M
ar-2
06
-Ap
r-20
11
-May
-20
8-J
un
-20
2-J
ul-
20
28
-Ju
l-2
02
4-A
ug-
20
18
-Sep
-20
15
-Oct
-20
11
-No
v-2
07
-Dec
-20
Rs/
US$
2019 - 2020
Rs. 186.020014 Dec 2020
Rs. 181.634031 Dec 2019
Rs. 184.2769 29 Oct 2020