Embed Size (px)
Citation preview

Nitrogen Dioxide in the United Kingdom
22
Chapter 2
NOx emissions and emission inventories
Key points
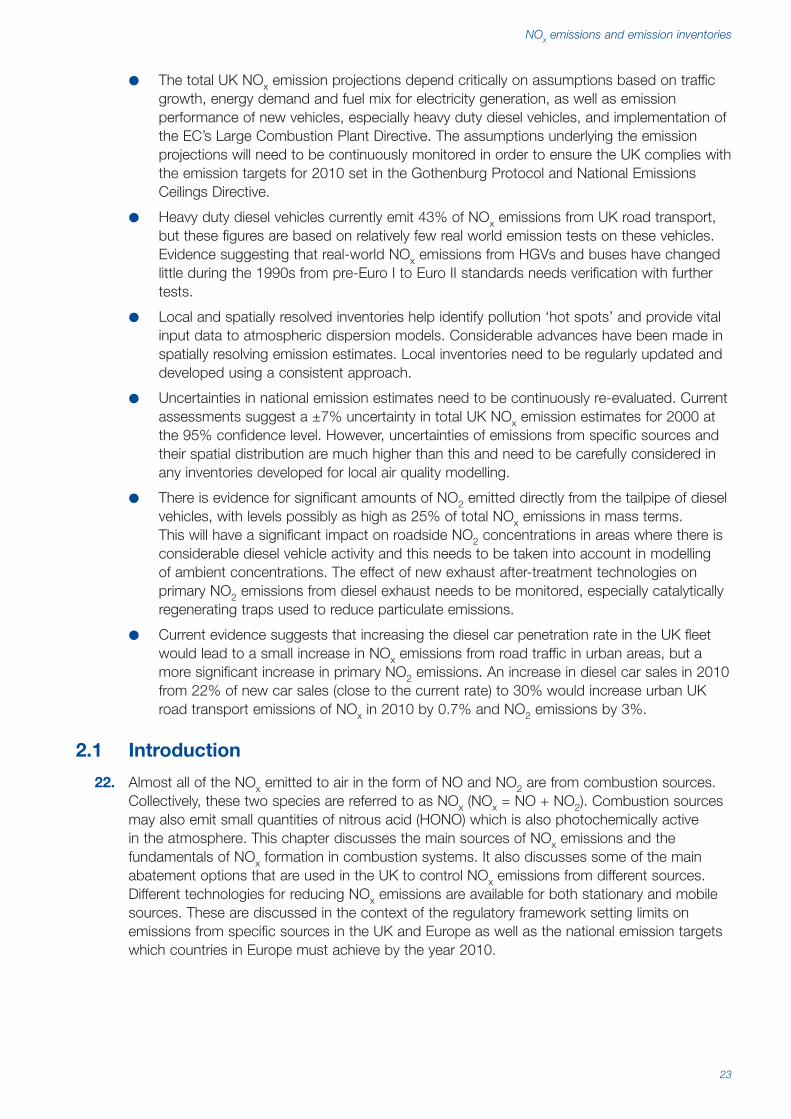
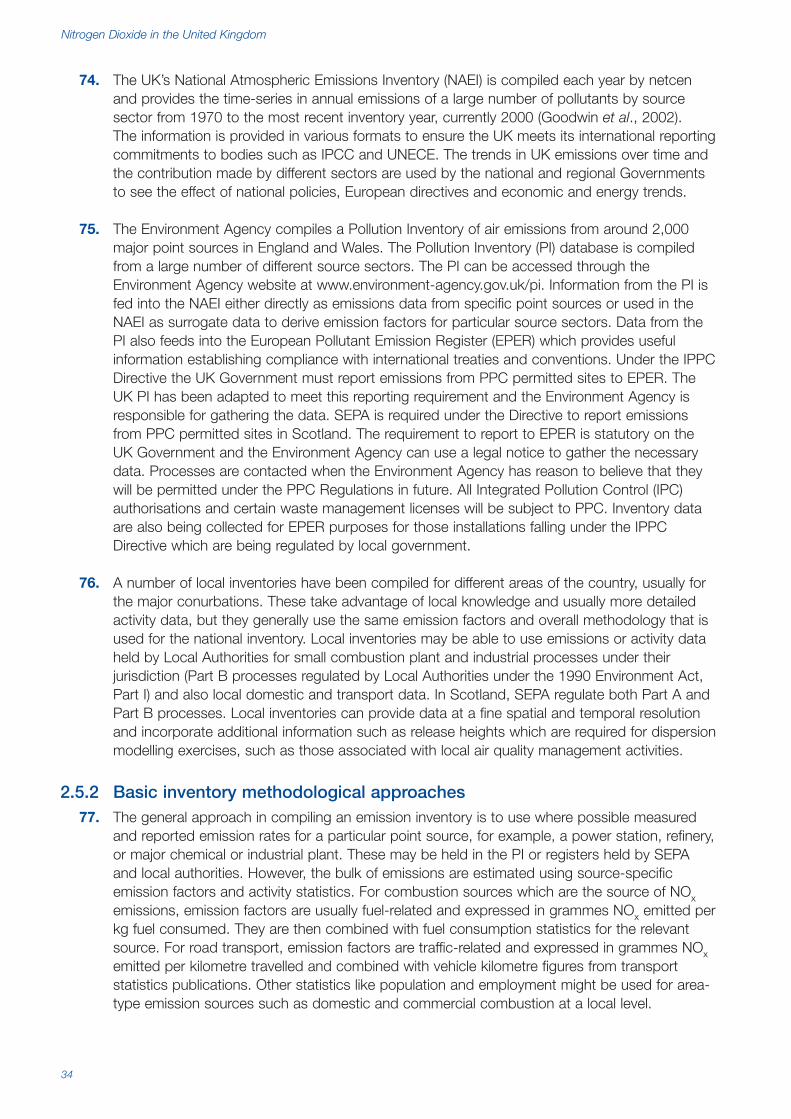
Figure 2.1 shows the time series of NOx emissions in the UK from 1970 projected to 2020.
Figure 2.1 NOx emissions in the UK by source from 1970–2020.
● Emissions of NOx have fallen by 37% from 1990 to 2000. This has been mainly due toreductions in emissions from road transport and public power generation.
● Road transport is the largest source of NOx emissions in the UK, contributing 49% of totalemissions in 2000. However, emissions from road transport have fallen by 34% between1990 and 2000 due to improvements in engine design and fitting of three-way catalyststo petrol cars driven by increasingly tighter European vehicle emission standards.
● The contribution of road transport to NOx emissions in urban areas is generally higher thanthe national average. In London, 68% of NOx emissions come from road transport.
● Total UK NOx emissions are projected to fall by a further 25% from 2000 levels by 2010.This is largely driven by a continuing decline in emissions from road transport as vehiclesmeeting tighter emission standards penetrate the UK fleet.
● Emissions of NOx from road transport in London are predicted to decline by 53% from1999 levels by 2010. This compares with a predicted decline of 49% in emissions fromtotal urban UK road transport emissions over the same period. Little, if any, decline isexpected in emissions from other sources in London.
0
500
1000
1500
2000
2500
3000
1970 1975 1980 1985 1990 1995 2000 2005 2010 2015 2020
NO
x em
issi
ons
(kto
nnes
as
NO
2)
Other
Other transport& machinery
Road transport
Domestic
Industry
Public power
23
● The total UK NOx emission projections depend critically on assumptions based on trafficgrowth, energy demand and fuel mix for electricity generation, as well as emissionperformance of new vehicles, especially heavy duty diesel vehicles, and implementation ofthe EC’s Large Combustion Plant Directive. The assumptions underlying the emissionprojections will need to be continuously monitored in order to ensure the UK complies withthe emission targets for 2010 set in the Gothenburg Protocol and National EmissionsCeilings Directive.
● Heavy duty diesel vehicles currently emit 43% of NOx emissions from UK road transport,but these figures are based on relatively few real world emission tests on these vehicles.Evidence suggesting that real-world NOx emissions from HGVs and buses have changedlittle during the 1990s from pre-Euro I to Euro II standards needs verification with furthertests.
● Local and spatially resolved inventories help identify pollution ‘hot spots’ and provide vitalinput data to atmospheric dispersion models. Considerable advances have been made inspatially resolving emission estimates. Local inventories need to be regularly updated anddeveloped using a consistent approach.
● Uncertainties in national emission estimates need to be continuously re-evaluated. Currentassessments suggest a ±7% uncertainty in total UK NOx emission estimates for 2000 atthe 95% confidence level. However, uncertainties of emissions from specific sources andtheir spatial distribution are much higher than this and need to be carefully considered inany inventories developed for local air quality modelling.
● There is evidence for significant amounts of NO2 emitted directly from the tailpipe of dieselvehicles, with levels possibly as high as 25% of total NOx emissions in mass terms.This will have a significant impact on roadside NO2 concentrations in areas where there isconsiderable diesel vehicle activity and this needs to be taken into account in modellingof ambient concentrations. The effect of new exhaust after-treatment technologies onprimary NO2 emissions from diesel exhaust needs to be monitored, especially catalyticallyregenerating traps used to reduce particulate emissions.
● Current evidence suggests that increasing the diesel car penetration rate in the UK fleetwould lead to a small increase in NOx emissions from road traffic in urban areas, but amore significant increase in primary NO2 emissions. An increase in diesel car sales in 2010from 22% of new car sales (close to the current rate) to 30% would increase urban UKroad transport emissions of NOx in 2010 by 0.7% and NO2 emissions by 3%.
2.1 Introduction
22. Almost all of the NOx emitted to air in the form of NO and NO2 are from combustion sources.Collectively, these two species are referred to as NOx (NOx = NO + NO2). Combustion sourcesmay also emit small quantities of nitrous acid (HONO) which is also photochemically activein the atmosphere. This chapter discusses the main sources of NOx emissions and thefundamentals of NOx formation in combustion systems. It also discusses some of the mainabatement options that are used in the UK to control NOx emissions from different sources.Different technologies for reducing NOx emissions are available for both stationary and mobilesources. These are discussed in the context of the regulatory framework setting limits onemissions from specific sources in the UK and Europe as well as the national emission targetswhich countries in Europe must achieve by the year 2010.
NOx emissions and emission inventories

Nitrogen Dioxide in the United Kingdom
24
23. Emission inventories are an important means of quantifying emissions of NOx from differentsources in different locations. These provide the necessary input data for atmospheric modelspredicting NO2 concentrations and photochemical activity in general at different geographicalscales. Emission inventories are produced at European, national and regional and local levelsusing common methodologies, but using information at different levels of geographical detail.The principles and methodologies behind the inventories compiled in the UK are discussed,with particular attention given to the sources of information used to compile the inventoriesfrom mobile and stationary combustion sources. The time series of NOx emissions in the UKfrom 1970 to 2000 is shown, broken down by emission source sector. This information is vitalfor explaining the trends in emissions over the past 30 years and for directing future policymaking in areas that will affect emissions and air quality in future years.
24. Some of the principles behind the development of spatially resolved local inventories anddifferences that occur with the national emission maps are discussed. The national inventoryfor the UK is currently mapped on a 1x1 km spatial scale. Both this and more detailed localinventories play a key role in local policy making and understanding of ambient concentrationsof NOx and NO2. Local inventories produced for different areas of the UK are discussed, withparticular attention given to the London Atmospheric Emissions Inventory. These play a key rolein local scale modelling of air quality in the UK.
25. It is important to understand the nature and extent of uncertainties in the NOx emissionestimates, both in individual sources and in the overall UK inventory, if the results are to becompared each year and the potential impact of measures to reduce emissions are to beunderstood in terms of their impact on ambient concentrations. A rigorous, quantitativeanalysis of the uncertainties in the overall national emission estimates has been undertakenusing statistical methods. The results will help to prioritise future work by pointing to thoseareas where further information is required to improve the reliability of the inventory.Uncertainties in emission estimates in local areas are of more consequence to local air qualitymodelling of pollutant concentrations and are usually of greater magnitude than theuncertainties in the national emission totals. Consideration is given to the factors influencinguncertainties in modelling the spatial distribution of emissions.
26. Emission projections are used to inform Government policy and to forecast the likelihood ofattaining the UK’s emissions targets for 2010. They are one of the principal drivers in forecastingthe UK’s air pollution climate and achievement of air quality objectives. The UK’s base emissionprojections for NOx take account of current Government policies, European Directives andRegulations on emissions, technology improvements and current understanding of future growthin energy demand, transport and industrial activity. The base projections for UK emissions in2005, 2010, 2015 and 2020 are shown, as well as emissions forecasts for specific urban areaslike London. The UK projections for 2010 are put into context with the country’s emissiontargets set in terms of the National Emissions Ceilings Directive. Road transport is a majorcontributor of NOx emissions in urban areas and illustrative transport scenarios have beenassessed to highlight the sensitivity of projected urban NOx emissions to key transport factors.
27. Combustion sources emit NOx mostly in the form of NO. However, for some sources,especially road vehicles, direct emissions of NO2 appear to be significant. This chapter pointsto evidence for direct NO2 emissions from road vehicles based on tailpipe emissionmeasurements. There may also be evidence for direct emissions of HONO from vehicles.The conditions and technologies that favour NO2 emissions from vehicle exhausts arediscussed. The extent of primary NO2 emissions from other sources such as stationarycombustion has not been considered as no new evidence of these as significant sourcesof primary NO2 has emerged.
25
28. Combustion sources can also emit NOx in the form of nitrous oxide (N2O). This is an inert andrelatively harmless compound which takes no part in ground-level photochemical activity.However, there are concerns over its emissions because it is a potent greenhouse gasimplicated in potential global climatic changes. Some abatement technologies designed toreduce NOx emissions can lead to higher emissions of N2O as a by-product of the NOx controlprocess. This report is not primarily concerned with N2O, but the secondary effects of NOxcontrol measures on emission projections of N2O in the UK are briefly discussed. Similarly, thepossible secondary effects that certain NOx abatement technologies may have on ammonia(NH3) and primary NO2 emissions are also briefly discussed.
2.2 NOx formation in combustion sources
29. Combustion of fossil fuels is by far the dominant source of NOx emissions. There are threemain mechanisms by which NOx is formed in combustion systems (Miller and Bowman, 1989).Thermal-NO and prompt-NO mechanisms produce NOx by the high temperature oxidation ofelemental nitrogen present in the combustion air. Fuel-NO is formed from nitrogen chemicallybound in certain fuels. High temperatures and oxidation-rich conditions generally favour NOxformation in combustion.
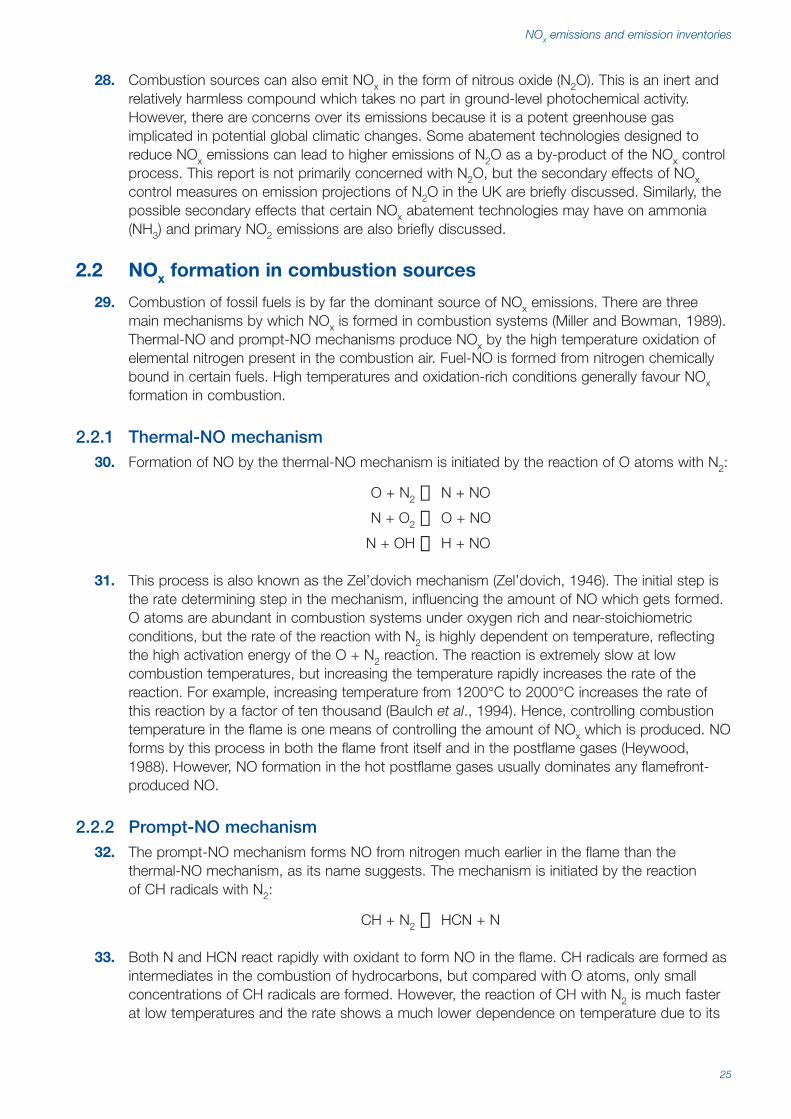
2.2.1 Thermal-NO mechanism30. Formation of NO by the thermal-NO mechanism is initiated by the reaction of O atoms with N2:
O + N2 →N + NO
N + O2 →O + NO
N + OH →H + NO
31. This process is also known as the Zel’dovich mechanism (Zel’dovich, 1946). The initial step isthe rate determining step in the mechanism, influencing the amount of NO which gets formed.O atoms are abundant in combustion systems under oxygen rich and near-stoichiometricconditions, but the rate of the reaction with N2 is highly dependent on temperature, reflectingthe high activation energy of the O + N2 reaction. The reaction is extremely slow at lowcombustion temperatures, but increasing the temperature rapidly increases the rate of thereaction. For example, increasing temperature from 1200°C to 2000°C increases the rate ofthis reaction by a factor of ten thousand (Baulch et al., 1994). Hence, controlling combustiontemperature in the flame is one means of controlling the amount of NOx which is produced. NOforms by this process in both the flame front itself and in the postflame gases (Heywood,1988). However, NO formation in the hot postflame gases usually dominates any flamefront-produced NO.
2.2.2 Prompt-NO mechanism32. The prompt-NO mechanism forms NO from nitrogen much earlier in the flame than the
thermal-NO mechanism, as its name suggests. The mechanism is initiated by the reactionof CH radicals with N2:
CH + N2 →HCN + N
33. Both N and HCN react rapidly with oxidant to form NO in the flame. CH radicals are formed asintermediates in the combustion of hydrocarbons, but compared with O atoms, only smallconcentrations of CH radicals are formed. However, the reaction of CH with N2 is much fasterat low temperatures and the rate shows a much lower dependence on temperature due to its
NOx emissions and emission inventories
Nitrogen Dioxide in the United Kingdom
26
lower activation energy. Hence, they lead to NO being formed earlier in the flame (Miller andBowman, 1989; Fenimore, 1971; Hayhurst and Vince, 1980).
34. Overall, the amount of NO formed by the prompt-NO mechanism is small compared with theamount formed by the thermal-NO route because of the lower abundance of CH radicals in theflame. However, it makes a significant contribution under fuel-rich conditions when higherconcentrations of hydrocarbon radical species like CH are present.
2.2.3 Fuel-NO mechanism35. Certain fuels contain appreciable amounts of nitrogen chemically bound in the fuel. For
example, coal contains 0.5 to 2% nitrogen by weight chemically bound in large heterocycliccompounds with pyridine and pyrrole-type structures and aromatic amines (Solomon andColket, 1978). A fraction of the nitrogen compounds is released into the gas-phase through theprocess of devolatilisation when the coal particles are heated. As they are released, the fuel-nitrogen undergoes rapid pyrolysis to form small nitrogen compounds such as hydrogencyanide (HCN), CN radicals and ammonia (NH3). These species are then rapidly converted toNOx by a complex sequence of reactions involving the small gas-phase radicals (O, OH, H)produced in the main combustion process (Miller and Bowman, 1989). Additional NOx isproduced by heterogeneous oxidation of the nitrogen remaining in the coal char particles(Pershing and Wendt, 1977; Wendt, 1980). Unless combustion conditions are controlled, thefuel-NO mechanism leads to very significant amounts of NOx being formed in the flame. Thenitrogen content of petroleum-based fuels is usually lower then in coal, but varies significantlyfrom less than 0.05% in light distillates (for example, diesel) to 1.5% in some heavy fuel oils.Fuel nitrogen is virtually absent in gaseous fuels. Consequently, the amount of fuel-NOproduced in gas combustion is negligible compared with the amounts produced in coalcombustion.
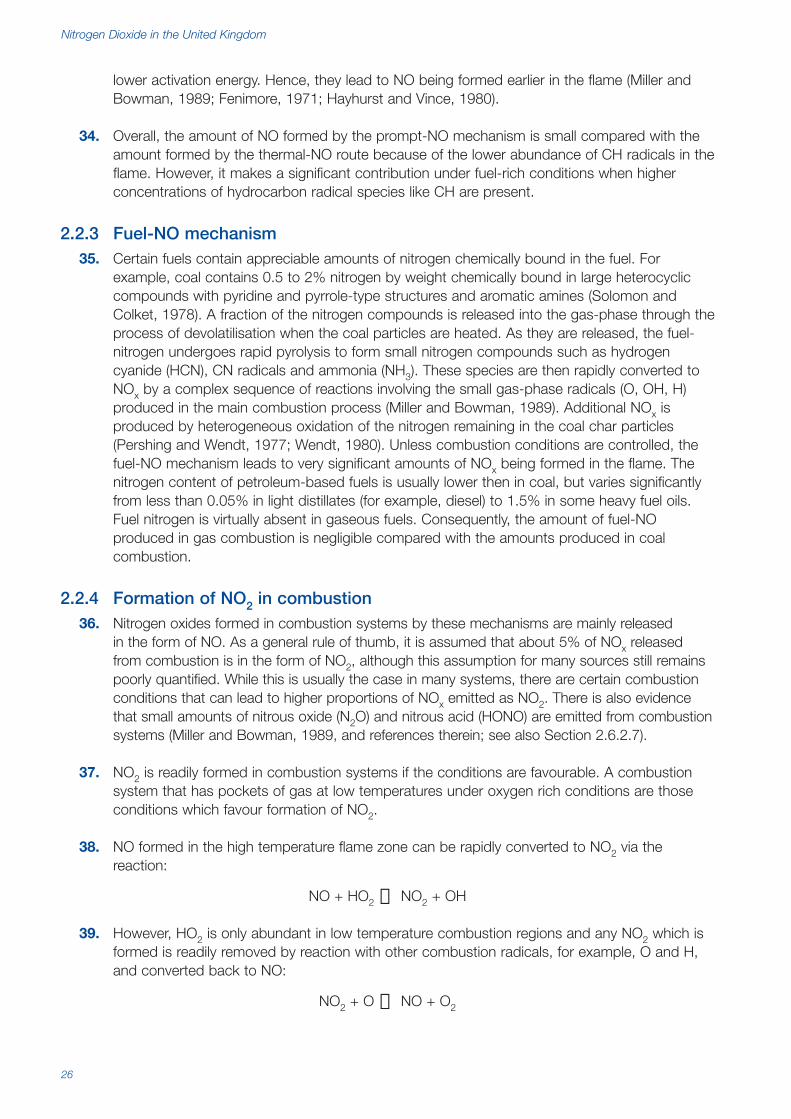
2.2.4 Formation of NO2 in combustion36. Nitrogen oxides formed in combustion systems by these mechanisms are mainly released
in the form of NO. As a general rule of thumb, it is assumed that about 5% of NOx releasedfrom combustion is in the form of NO2, although this assumption for many sources still remainspoorly quantified. While this is usually the case in many systems, there are certain combustionconditions that can lead to higher proportions of NOx emitted as NO2. There is also evidencethat small amounts of nitrous oxide (N2O) and nitrous acid (HONO) are emitted from combustionsystems (Miller and Bowman, 1989, and references therein; see also Section 2.6.2.7).
37. NO2 is readily formed in combustion systems if the conditions are favourable. A combustionsystem that has pockets of gas at low temperatures under oxygen rich conditions are thoseconditions which favour formation of NO2.
38. NO formed in the high temperature flame zone can be rapidly converted to NO2 via thereaction:
NO + HO2 →NO2 + OH
39. However, HO2 is only abundant in low temperature combustion regions and any NO2 which isformed is readily removed by reaction with other combustion radicals, for example, O and H,and converted back to NO:
NO2 + O →NO + O2

27
40. Hence, in combustion systems that are well-mixed, most of the NOx remains as NO. This isgenerally the case for burners and spark-ignition engines. However, in compression-ignitiondiesel engines, combustion does not generally occur in such a well-mixed environment andcooler regions exist which quench the combustion chemistry (Heywood, 1988). Then, NOformed in the flame may react to form NO2, but the conversion of NO2 back to NO isquenched in the cooler regions. It has been previously found that the highest NO2/NO ratiooccurs in a diesel engine at light load, where cooler regions are more widespread. Early engineresearch showed that as much as 30% of NOx is emitted as NO2 from a diesel engine at lowengine speed and light load (Hilliard and Wheeler, 1979). The oxygen rich environment ofcombustion in a diesel engine also aids formation of NO2.
41. If NO concentrations are high in the presence of excess oxygen downstream of the engine orburner in the tailpipe or flue gas, NO2 can be formed by the reaction:
NO + NO + O2 →2 NO2
42. The rate of this reaction is quite slow at the NO concentration levels found in the exhaust pipeand has a weak negative temperature dependence (Atkinson and Lloyd, 1984). To illustrate thispoint, for typical NO concentrations of 500 ppm found in the presence of excess oxygen in thetailpipe of a heavy duty diesel vehicle, it would take at least 5 seconds for 1% of the NO to beconverted to NO2 by this reaction. This is a conservative lower limit on the NO conversion time.It should also be noted that the thermodynamics favours NO over NO2 at higher temperatures.
2.3 Emission sources and regulatory framework
43. The major emission sources of NOx in the UK are combustion for public power generation,combustion in industry and road transport. These were responsible for 82% of all UK NOxemissions in 2000 and it is in these areas where most effort has been undertaken in reducingemissions (Goodwin et al., 2002).
44. Reductions in emissions of NOx from stationary combustion and mobile sources have beendriven by various national regulations and European Directives covering different emissionsources combined with international protocols aimed at achieving emission targets in eachcountry for future years.
45. Emissions from stationary combustion plant in the UK have been regulated under theEnvironmental Protection Act 1990. Integrated Pollution Control (IPC) is a system establishedunder Part I of the Act to control pollution from industry. It applies to Part A processes whichare potentially the most polluting or technologically complex processes in England and Walesand is enforced by the Environment Agency. A parallel, but separate, system of IPC is usedin Scotland and enforced by the Scottish Environment Protection Agency, SEPA. IPC isconcerned with the release of polluting substances to air, land and water. Part B processes,also covered under the Environmental Protection Act, refer to less polluting, less complexprocesses and these are regulated by local government. In Scotland, Part B processes arebeing regulated by SEPA under the Pollution Prevention and Control (Scotland) Regulations2000 (PPC). Although less important in a national context, these processes can be influentialin a local context.
46. Directives regulating emissions from new petrol passenger cars have been around since the1970’s, but these focused on CO and hydrocarbon emissions. It is only since the early 1990’sthat tough standards on NOx emissions from new cars sold in Europe were introduced. Thisfirst came about with EU Directive 91/441/EC which effectively mandated the fitting of three-way catalysts to all new petrol cars to significantly reduce emissions of CO, hydrocarbons and
NOx emissions and emission inventories

Nitrogen Dioxide in the United Kingdom
28
NOx (Official Journal, 1991). This Directive set limits on the sum of hydrocarbon and NOxemissions, rather than NOx itself, but it did lead to very substantial decreases in NOx emissions.Standards for this Directive, frequently referred to as Euro I, were followed by Euro II standardsimplemented by Directive 94/12/EC during the mid-90s. Yet more stringent EU Directives havebeen put in place to reduce NOx emissions further, the most recent of these (98/69/EC) settingemission limits on NOx itself for petrol cars sold after 2000 and then after 2005 (Euro III andEuro IV standards, respectively (Official Journal, 1998)).
47. NOx emissions from diesel vehicles have also been regulated since the early 1990’s (since 1988for heavy duty diesel vehicles). These have been tightened up with the introduction of asuccession of more stringent EU Directives, currently extending to tougher limits on emissionsfrom heavy duty vehicles sold after 2008 (Official Journal, 1999). However, none of theemission reductions required to meet the tighter standards on diesel vehicles have been asdramatic as the 91/441/EC Directive was on petrol cars in the early 1990s.
48. Table 2.1 shows the limit values on NOx, hydrocarbons (HC) and particulate matter (PM) set bythe various Directives for the different vehicle types since 1990. The limit values for each Eurostandard refer to tests over specified vehicle or engine test cycles, some of which havechanged in recent years in order to make the test more representative of the performance ofthe vehicle on real road conditions.
49. As well as regulations on emissions from specific sources, the UK is subject to certain nationalemission targets to be achieved by 2010. In the mid-1990s, the UNECE started negotiatinga multieffect, multipollutant protocol on NOx and related substances. This was aimed ataddressing photochemical pollution, acidification and eutrophication. The Protocol to AbateAcidification, Eutrophication and Ground-Level Ozone was adopted in Gothenburg inDecember 1999, where it was signed by the UK. The Gothenburg Protocol set emissionsceilings for nitrogen and sulphur oxides, ammonia and NMVOCs to be achieved by eachcountry by 2010. The Gothenburg Protocol forms a part of the Convention on Long-RangeTransboundary Air Pollution (UNECE, 1999).
50. Within the EU, the National Emissions Ceilings Directive (NECD) set emissions ceilings for 2010for each Member State for the same four pollutants as in the Gothenburg Protocol (OfficialJournal, 2001). A number of Member States reduced their ceilings somewhat below the levelsincluded in the Protocol. The UK reduced its ceiling for NOx emissions from 1181 ktonnes (asNO2) set in the Gothenburg Protocol to 1167 ktonnes for the NECD.
51. Within the UK, the implementation of the EC’s Large Combustion Plant Directive and otherassociated policy measures have led to a substantial reduction in NOx from power plant andindustrial sources. This, combined with further stringent vehicle emission and fuel qualityDirectives being implemented over the next 10 years, will help the UK towards meeting itsemission target. Integrated Pollution Prevention and Control (IPPC) is a system following theEuropean Community Directive (96/91) which will introduce a more integrated approach tocontrolling pollution from industrial sources across the UK.
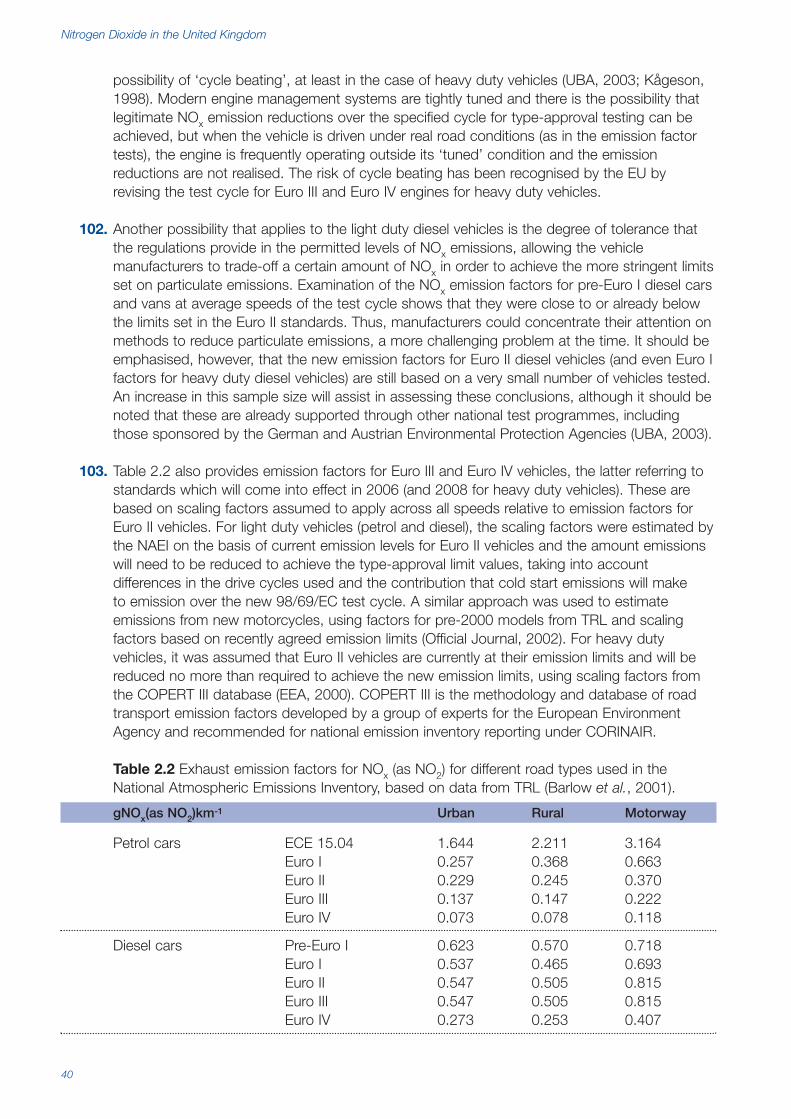
52. Section 2.7 provides a more detailed account of the inventory of NOx emissions in the UK bysector and trends over time. Since 1990, emissions from public power generation, combustionin industry and road transport have been reduced by 49%. In the power generation andindustrial combustion sectors, the reductions have been partially achieved through the switchfrom coal to gas. However, emission abatement technologies in remaining coal plant, gasturbines and road vehicles have made a significant contribution to these emission reductions.

29
NOx emissions and emission inventories
Dire
ctiv
eD
ate
of
imp
lem
enta
tion
Test
cyc
leU
nits
NO
x*H
C*
NO
x+
HC
*P
M*
Pet
rol c
ars
91/4
41/E
EC
Eur
o I
1/7/
1992
EC
E15
+ E
UD
Cgk
m-1
0.97
94/1
2/E
CE
uro
II1/
1/19
97E
CE
15 +
EU
DC
gkm
-10.
5098
/69/
EC
Eur
o III
1/1/
2001
EC
E15
+ E
UD
Cgk
m-1
0.15
0.20
98/6
9/E
CE
uro
IV1/
1/20
06E
CE
15 +
EU
DC
gkm
-10.
080.
10
Die
sel c
ars
91/4
41/E
EC
Eur
o I
1/7/
1992
EC
E15
+ E
UD
Cgk
m-1
0.14
94/1
2/E
CE
uro
II1/
1/19
97ID
IE
CE
15 +
EU
DC
gkm
-10.
700.
08D
IE
CE
15 +
EU
DC
0.90
0.10
98/6
9/E
CE
uro
III1/
1/20
01E
CE
15 +
EU
DC
gkm
-10.
500.
560.
0598
/69/
EC
Eur
o IV
1/1/
2006
EC
E15
+ E
UD
Cgk
m-1
0.25
0.30
0.02
5
Pet
rol v
ans
96/6
9/E
EC
Eur
o II
1/1/
1998
<13
05kg
EC
E15
+ E
UD
Cgk
m-1
0.50
1/1/
1998
1305
– 1
760k
g0.
651/
1/19
98>
1760
kg0.
8098
/69/
EC
Eur
o III
1/1/
2001
<13
05kg
EC
E15
+ E
UD
Cgk
m-1
0.15
0.20
1/1/
2002
1305
– 1
760k
g0.
180.
251/
1/20
02>
1760
kg0.
210.
2998
/69/
EC
Eur
o IV
1/1/
2006
<13
05kg
EC
E15
+ E
UD
Cgk
m-1
0.08
0.10
1/1/
2006
1305
– 1
760k
g0.
100.
131/
1/20
06>
1760
kg0.
110.
16
Die
sel v
ans
93/5
9/E
EC
Eur
o I
1/10
/199
4<
1305
kgE
CE
15 +
EU
DC
gkm
-10.
970.
141/
10/1
994
1305
– 1
760k
g1.
400.
191/
10/1
994
>17
60kg
1.70
0.25
96/6
9/E
EC
Eur
o II
1/1/
1998
<13
05kg
EC
E15
+ E
UD
Cgk
m-1
0.60
0.10
1/1/
1998
1305
– 1
760k
g1.
100.
151/
1/19
98>
1760
kg1.
300.
2098
/69/
EC
Eur
o III
1/1/
2001
<13
05kg
EC
E15
+ E
UD
Cgk
m-1
0.50
0.56
0.05
1/1/
2002
1305
– 1
760k
g0.
650.
720.
071/
1/20
02>
1760
kg0.
780.
860.
1098
/69/
EC
Eur
o IV
1/1/
2006
<13
05kg
EC
E15
+ E
UD
Cgk
m-1
0.25
0.30
0.02
51/
1/20
0613
05 –
176
0kg
0.33
0.39
0.04
1/1/
2006
>17
60kg
0.39
0.46
0.06
Hea
vy-d
uty
91/5
42/E
EC
Eur
o I
1/10
/199
3E
CE
R49
gkW
-1h-
18.
01.
100.
36ve
hicl
es91
/542
/EE
CE
uro
II1/
10/1
996
EC
E R
49gk
W-1
h-1
7.0
1.10
0.15
99/9
6/E
CE
uro
III1/
10/2
001
ES
C +
ELR
gkW
-1h-
15.
00.
660.
10E
TCgk
W-1
h-1
5.0
0.78
0.16
99/9
6/E
CE
uro
IV1/
10/2
006
ES
C +
ELR
gkW
-1h-
13.
50.
460.
02E
TCgk
W-1
h-1
3.5
0.55
0.03
99/9
6/E
CE
uro
IV
(Pt
2)1/
10/2
008
ES
C +
ELR
gkW
-1h-
12.
00.
460.
02E
TCgk
W-1
h-1
2.0
0.55
0.03
*Whe
re n
o da
ta is
sho
wn
no li
mit
valu
es a
pply
to
thes
e po
lluta
nts.
Tab
le 2
.1 E
mis
sion
lim
it va
lues
for
diffe
rent
veh
icle
typ
es in
Eur
ope
sinc
e 19
90. D
ates
of i
mpl
emen
tatio
n re
fer
to n
ew r
egis
trat
ions
.
Nitrogen Dioxide in the United Kingdom
30
2.4 Emission controls and abatement technologies
53. Emissions of NOx from both stationary and mobile combustion sources can be reduced bycareful control of the combustion conditions in the burner or engine and by after-treatment ofthe exhaust gases. Control over the combustion environment usually entails manipulating themixing of fuel and air to affect the temperature and fuel/air ratio in the burner or engine. Theaim is to minimise the formation of NOx in the first place. This is the concept behind theoperation of low-NOx burners for stationary combustion and the effectiveness of exhaust gasrecirculation (EGR) in internal combustion engines. After-treatment of exhaust gases generallyrelies on catalyst technologies to reduce NOx concentrations in the exhaust, although othermethods have been developed which do not involve catalysts.
54. This section provides a brief description of three of the main techniques used to control NOxemissions from combustion sources in the UK. These are low-NOx burners for stationarycombustors and exhaust gas recirculation and three-way catalysts for mobile combustionsources. A description of other technologies showing promise for NOx abatement currentlyavailable and still under development is provided in the Technical Annexe to this chapter(Appendix 1). These include Selective Catalytic Reduction (SCR) methods for NOx reductionin stationary and mobile combustion sources, non-catalytic reduction technologies and NOxtraps for mobile sources.
2.4.1 Emission abatement for stationary combustion sources55. Low-NOx burners work on the principle of staged combustion in which the fuel and air are
mixed in the burner in stages to create regions of different temperature and fuel/air ratio in theflame. Some regions of the flame are fuel-rich and it is here that chemical reactions take placeconverting NO and its precursors to N2.
56. Low-NOx burners have been fitted to all coal-fired power stations in the UK with generatingsets of 500 MW or more. They are currently considered the most cost-effective method ofachieving NOx reduction from existing coal-fired plant, with around 30-60% reduction inemissions being achieved (IEA, 2001). Although after-treatment methods such as SCR andother, non-catalytic processes offer potentially greater NOx reduction efficiencies, the capitaland operating costs of these technologies are considerably higher and there are still someoperational concerns over the lifetime and costs of the catalyst. SCR and other after-treatmentmethods are not operational on a large scale in the UK, but are in commercial use on largecombustion plant overseas, especially in Japan and Germany. Demonstration and full scalesystems are also being installed in US coal-fired plant. These abatement technologies arebelieved to become more economically competitive over longer operating periods (IEA, 2002).
2.4.2 Emission abatement for mobile combustion sources57. Road vehicles are a major source of NOx emissions in the UK. Emissions of NOx are different
for different types and sizes of vehicle and they depend on the type of fuel the vehicle runs on(petrol or diesel) and the load on the engine.
58. In order to achieve increasingly stringent emission standards placed on road vehicles,reductions in NOx emissions have been and continue to be achieved through a combination ofengine design improvements, engine management systems, exhaust after-treatment systemsand on-board diagnostics.

31
59. For petrol vehicles, the main achievements have been through the introduction and refinementof three-way catalyst technology, supplemented by Exhaust Gas Recirculation (EGR). EGRworks by recycling a fraction of the exhaust gases through a control valve from the exhaust tothe engine intake system where it is mixed with fresh fuel-air mixture. EGR gases act as adiluent, thereby reducing the peak flame temperature and hence the rate of NO formation inthe burned gases through the thermal-NO mechanism (Heywood, 1988). Substantialreductions in NOx emissions (60-80%) can be achieved by EGR.
60. Three-way catalysts have been fitted on all new petrol cars and vans sold in Europe since 1992in order to meet the stringent emission standards set in Directive 91/441/EEC. It is effectivelythe only way of meeting the challenge of reducing emissions of CO, hydrocarbons (HC) andNOx from vehicle exhausts simultaneously. A single catalyst bed can reduce NO and oxidiseCO and HC if the fuel/air ratio is maintained close to stoichiometric (i.e. neither fuel or oxygenare in excess). The catalyst effectively brings the exhaust gas composition to a near-equilibriumstate: enough reducing gases are present to reduce NO to N2 and enough O2 to oxidise COand HC to CO2 and H2O. Around 80-90% reduction in NOx emissions have been achieved withthe three-way catalyst. These figures are based on tests on in-service cars under real-worlddrive cycles when the vehicle is at normal operating temperature (Euro II relative to pre-Euro Icars, see Section 2.6.2.1). For the most modern cars, the reductions in emissions may behigher than this, including the time when the vehicle is started cold, thanks to improvementsin the time it takes for the catalyst to warm up to its normal efficiency (see Section 2.6 andTechnical Annexe in Appendix 1). Further details on three-way catalyst technology are givenin the Technical Annexe (Appendix 1).
61. Reductions in NOx emissions are harder to achieve for diesel vehicles, due in part to theoxygen rich regime of the engine. Improved engine design and management systems and EGRhave led to the reductions in emissions seen so far, but exhaust after-treatment methods maybe necessary to achieve further, more stringent standards on diesel exhaust emissions in thefuture. A number of these are being developed (see the Appendix 1).
62. Since the introduction of three-way catalysts, emissions of NOx from petrol cars havedecreased below levels from diesel cars of a similar size. Before this, petrol car emissions ofNOx were rather higher than for diesel cars.
63. In parallel with vehicle technology developments, improvements in the quality of petrol anddiesel fuels have been made. Fuel quality has little effect on emissions itself, but improvements,especially through reductions in the sulphur content, have opened the gate to emergingexhaust emission after-treatment technologies and better catalyst performance. The EUDirective on fuel quality 98/70/EC has driven the improvements being made to the qualityof petrol and diesel fuels sold in the UK.
2.4.3 Formation of NO2 in diesel exhaust after-treatment systems64. After-treatment catalyst systems on diesel exhausts can enhance the proportion of NOx emitted
as NO2. This may be particularly true in an oxidising environment above the catalyst surfacewhere the catalyst may promote the oxidation of NO to NO2.
65. There is also some concern that certain particulate emission abatement devices may increasethe proportion of NOx emitted as NO2. Diesel particulate filters (DPF) are increasingly beingfitted to buses and other heavy duty diesel vehicles and are very much seen as the solution tothe challenge of reducing particulate emissions from these vehicles. There are a number ofdesigns of particulate reduction technologies on the market. The most common of these in theUK are the type that work on the principle of deliberately converting NO in the exhaust stream
NOx emissions and emission inventories

Nitrogen Dioxide in the United Kingdom
32
to NO2 over an oxidation catalyst unit and using the NO2 to oxidise the particulates held on thefilter, thus regenerating the trap. Continuously Regenerating Particulate Traps (CRTs) whichuse these techniques do also lead to a small decrease (5-10%) in NOx emissions, but if noadditional measures are put in place, a greater proportion of the NOx can be expected to beemitted as NO2. Some studies in the U.S. have suggested as much as 50% of NOx emissionsfrom a diesel vehicle with this type of DPF may be emitted as NO2 (CARB, 2002; DaMassa,2002; IDRAC, 2002), although systems there may not be as well optimised.
66. However, this may only be a temporary problem perhaps restricted to retrofit applicationsbecause to comply with tighter Euro IV standards on NOx emissions, manufacturers of newheavy duty diesel engines will need to find ways of reducing total mass of NOx emissionssubstantially. Then, even though the proportion of NOx emitted as NO2 is higher, the totalmass emissions of primary NO2 will be reduced compared with levels from existing vehicles.Furthermore, the proportion emitted as NO2 may depend on duty cycle and could be low atlow speeds (for example, in urban areas) when the exhaust temperature is low and the catalystis not at its working temperature. It is also the case that a number of catalyst optimisation andthermal management strategies exist to minimise the emissions of NO2 from these types ofcatalyst-based diesel particulate filter systems (McKinnon, 2002; IDRAC, 2002). These havereduced levels of NO2 in the exhaust to less than 20% of total NOx emissions. Certain fueladditives may assist in this. With the increasing need to simultaneously reduce both particulateand total NOx emissions from diesel exhausts to comply with tighter emission legislation, somemanufacturers of particulate traps are developing combined CRT/SCR systems. These work onthe principle of using a Selective Catalytic Reduction system with urea injection downstream ofthe CRT unit to reduce NO and NO2 (CARB, 2002; IDRAC, 2002).
67. The 50% figure for the proportion of NOx emitted as NO2 from these types of DPFs based onstudies in the U.S. is almost certainly a ‘worst case’ estimate and figures for CRTs used in theUK may be lower than this where systems are better optimised. However, the lack of data onprimary NO2 emissions from these types of particulate traps does need to be addressedthrough further independent research on in-service vehicles over real-world cycles andoperating conditions. It is understood that the CleanUp programme, run by the Energy SavingTrust to promote and fund grants towards the cost of fitting emission abatement equipmentto commercial and public service vehicles in the UK, is addressing this issue by supportingemission testing programmes that will lead to results in the near future. Other types ofparticulate reduction technologies are not widespread in the UK at the moment, but may showa greater market share in the future. The effectiveness of these and their penetration (and thatof combined NOx reduction technologies) into the UK market will need to be closely monitored.A number of combined particulate and NOx reduction systems for diesel vehicles are becomingavailable or are under development for both original equipment and retrofit applications.
2.4.4 By-product emissions of N2O and NH3
68. It is known that some of the NOx abatement technologies discussed above can lead toincreased emissions of N2O and NH3 formed as by-products of the NOx emission reductionprocess. This is particularly the case for after-treatment systems using catalyst technology.Emissions of N2O and NH3 are not regulated, but there are wider environmental concernsabout the impact that increased emissions of these pollutants will have. N2O is a greenhousegas implicated in global climate change (DETR, 2000a); ammonia plays an important role in thelong range transport of acidifying pollutants and is also involved in formation of secondaryparticulate matter aerosols in the atmosphere (NEGTAP, 2001; APEG, 1999).

33
69. N2O is formed in combustion systems, but is removed rapidly in flames by reaction with smallcombustion radicals (H, O atoms), so under normal conditions, only small amounts of N2O areactually emitted (Miller and Bowman, 1989). However, N2O can be formed on catalyst surfacesas a by-product of the catalyst chemistry that reduces the NOx to N2. N2O can be formed instationary and mobile SCR systems.
70. Cars fitted with three-way catalysts may emit as much as ten times more N2O than carswithout catalysts, leading to a growth in overall emissions from road transport as catalyst carspenetrate the UK fleet (EEA, 2000; Pringent and de Soete, 1989). It is possible that advancedcatalyst systems may address the problem of N2O emissions otherwise increased emissionsfrom the road transport sector in particular will counteract the downward trend in N2Oemissions being achieved with other sectors, for example, industry. There is some evidence tosuggest that the enhanced emissions of N2O from catalyst vehicles occur in just the first fewminutes after engine start up when the catalyst has not yet reached its optimum operatingtemperature. This may be addressed in modern cars (Euro II-IV) equipped with close-coupledcatalyst technologies reducing the time it takes for the catalyst to warm up, thereby reducingemissions of a number of different pollutants at engine start-up.
71. Increased NH3 emissions have also been observed from cars with three-way catalysts. Earlycatalyst cars (Euro I models) may emit as much as 50 times more NH3 than non-catalyst cars(pre-Euro I) (EEA, 2000; Baum et al., 2000; Baum et al., 2001; Färnlund and Kågeson, 1998).Measurements on more recent models (Euro II and III) have suggested a fall in NH3 emissionsprobably due to better engine management systems and catalyst technology, althoughemissions still remain higher than levels for non-catalyst cars (Barlow et al., 2001). Formationof NH3 on the catalyst is a by-product of the NOx reduction mechanism and depends onthe amount of time the engine strays off running at stoichiometric into the fuel rich condition.These are the conditions which favour NH3 formation. Improvements in engine control systemsare significantly reducing the time combustion occurs under fuel rich conditions by narrowingthe width of the fuel/air ratio fluctuations (see Technical Annexe, Appendix 1). This is likelyto lead to further reductions in NH3 emissions from advanced three-way catalyst cars (forexample, Euro IV).
72. SCR deNOx systems use NH3 or a derivative such as urea to reduce NOx emissions instationary combustors and diesel engines (see Technical Annexe, Appendix 1). Withouteffective controls, NH3 slip can occur in the exhaust leading to higher emissions (CONCAWE,1999; Koebel et al., 2000). This has been a concern for urea-based SCR deNOx systemsbeing developed for heavy duty diesel vehicles. However, a combination of NOx sensors withfeedback to carefully meter the amounts of urea being injected and downstream oxidationcatalyst units to oxidise any NH3 slip which does occur are expected to address this problemand prevent any excess NH3 emissions.
2.5 Emission inventories – general principles
2.5.1 General requirements73. Emission inventories provide an estimate of the mass release rate of emissions of NOx
(expressed as tonnes of NO2 equivalent) from different sectors at national, regional and localscales. Inventories are compiled on a regular basis so that trends in emissions can be seen.They also have other applications in that emission estimates provide an essential input into airquality modelling activities.
NOx emissions and emission inventories
Nitrogen Dioxide in the United Kingdom
34
74. The UK’s National Atmospheric Emissions Inventory (NAEI) is compiled each year by netcenand provides the time-series in annual emissions of a large number of pollutants by sourcesector from 1970 to the most recent inventory year, currently 2000 (Goodwin et al., 2002).The information is provided in various formats to ensure the UK meets its international reportingcommitments to bodies such as IPCC and UNECE. The trends in UK emissions over time andthe contribution made by different sectors are used by the national and regional Governmentsto see the effect of national policies, European directives and economic and energy trends.
75. The Environment Agency compiles a Pollution Inventory of air emissions from around 2,000major point sources in England and Wales. The Pollution Inventory (PI) database is compiledfrom a large number of different source sectors. The PI can be accessed through theEnvironment Agency website at www.environment-agency.gov.uk/pi. Information from the PI isfed into the NAEI either directly as emissions data from specific point sources or used in theNAEI as surrogate data to derive emission factors for particular source sectors. Data from thePI also feeds into the European Pollutant Emission Register (EPER) which provides usefulinformation establishing compliance with international treaties and conventions. Under the IPPCDirective the UK Government must report emissions from PPC permitted sites to EPER. TheUK PI has been adapted to meet this reporting requirement and the Environment Agency isresponsible for gathering the data. SEPA is required under the Directive to report emissionsfrom PPC permitted sites in Scotland. The requirement to report to EPER is statutory on theUK Government and the Environment Agency can use a legal notice to gather the necessarydata. Processes are contacted when the Environment Agency has reason to believe that theywill be permitted under the PPC Regulations in future. All Integrated Pollution Control (IPC)authorisations and certain waste management licenses will be subject to PPC. Inventory dataare also being collected for EPER purposes for those installations falling under the IPPCDirective which are being regulated by local government.
76. A number of local inventories have been compiled for different areas of the country, usually forthe major conurbations. These take advantage of local knowledge and usually more detailedactivity data, but they generally use the same emission factors and overall methodology that isused for the national inventory. Local inventories may be able to use emissions or activity dataheld by Local Authorities for small combustion plant and industrial processes under theirjurisdiction (Part B processes regulated by Local Authorities under the 1990 Environment Act,Part I) and also local domestic and transport data. In Scotland, SEPA regulate both Part A andPart B processes. Local inventories can provide data at a fine spatial and temporal resolutionand incorporate additional information such as release heights which are required for dispersionmodelling exercises, such as those associated with local air quality management activities.
2.5.2 Basic inventory methodological approaches77. The general approach in compiling an emission inventory is to use where possible measured
and reported emission rates for a particular point source, for example, a power station, refinery,or major chemical or industrial plant. These may be held in the PI or registers held by SEPAand local authorities. However, the bulk of emissions are estimated using source-specificemission factors and activity statistics. For combustion sources which are the source of NOxemissions, emission factors are usually fuel-related and expressed in grammes NOx emitted perkg fuel consumed. They are then combined with fuel consumption statistics for the relevantsource. For road transport, emission factors are traffic-related and expressed in grammes NOxemitted per kilometre travelled and combined with vehicle kilometre figures from transportstatistics publications. Other statistics like population and employment might be used for area-type emission sources such as domestic and commercial combustion at a local level.

35
78. Section 2.6 describes the methodologies for estimating emissions from specific source sectorsin the national inventory, in most local inventories and in inventories focused on specific localsources (for example, airports).
2.5.3 Spatially resolving emission inventories79. The national emissions inventory for NOx refers to emissions in the whole of the UK over an entire
year. For many sources, the UK inventory is compiled using national fuel consumption andtransport statistics. There will be areas in the country, as well as times of the day and year, wherethe contribution from certain sources (traffic for example) will be higher than indicated proportionallyby the national inventory figures. Emissions from different sources also vary in height of release.
80. Spatially resolved emission estimates are required for ambient NOx and NO2 concentrationmodelling. The development of spatially resolved emission inventories requires informationabout the geographical location of sources as well as an estimate of mass emissions. Thereare two approaches (Figure 2.2) to the generation of spatially resolved emission inventorieswhich have been termed ‘top-down’ and ‘bottom-up’. The ‘bottom-up’ approach provides anestimate of emissions for a particular area by utilising geographical source data with localdatasets and appropriate emission factors. This provides the most reliable indication of themagnitude and spatial distribution of emissions. The ‘top-down’ or pro-rata approach involvesdisaggregating national emission estimations to a local level through the use of geographicaldata and indicators of the proportion of a particular polluting activity occurring in the specifiedregion. It is particularly useful when there is no direct measure of polluting activity available.In practice, individual inventories may make use of both ‘bottom-up’ and ‘top down’methodologies for different source sectors.
Figure 2.2 The ‘top-down’ and ‘bottom-up’ approaches to emission estimation (Lindley et al., 1996).
Nationalemmissions
data
Total regional emissions
Emissions by source
Regionaldata
concerningthe sources
andmagnitude
of pollutingactivity
Emissionfactor
appropriatefor eachpollutingactivity
Source data x emissionsfactor
Regional proportion of UKemissions for each source
Total regional emissions
‘Top-down’ or Pro-rata ‘Bottom-up’
National andregional
indicators ofpolluting
activity foreach source
Nationalemissionsby sourcecategory
Regionalproportionof total UKpolluting
activity foreach source
NOx emissions and emission inventories

Nitrogen Dioxide in the United Kingdom
36
81. Geographical Information Systems (GIS) have become increasing important tools for thedevelopment of spatially resolved emissions inventories and the mapping of national estimates.The use of GIS allows the application of complex emission estimation models to large spatiallyreferenced datasets which can be relatively easily updated and manipulated. GIS technology isalso useful in relation to the presentation or further application of resultant emissions data. Thiscan provide a suitable platform for the generation of spatially resolved emissions data forparticular time periods and the incorporation of contextual data which may be required fordispersion modelling such as stack heights, topography and surface roughness.
82. Vector-based GIS packages lend themselves to emissions inventory development since therepresentation of spatial entities as point, line and polygon (area) features can be readily appliedto a characterisation of pollution sources as stationary (point), mobile (line) and diffuse (area)sources. Area-based representations are also used to make emission estimates for sourceswhere individual treatment is either not desirable due to the quantities of sources and theirrelatively small contribution to overall emissions, such as with domestic combustion sources ornot possible due to a paucity of appropriate spatial or attribute data. Within a GIS, data layers orthemes are generated corresponding to individual sources which can then be aggregated to auniform spatial unit for display or further use (Figure 2.3). The point, line and area representationsmay be used as a direct input to certain dispersion models such as ADMS Urban, which has itsown emissions estimation module operating on a vector based environment.
Figure 2.3 Organisation of point, line and area emission sources in a GIS to produce a spatiallyresolved emission inventory (aric, 2000).
83. Local emission inventories generated from a ‘bottom-up’ approach and national emissionmaps generated from a ‘top-down’ approach should give broadly the same trends in terms ofemissions per square kilometre and the contribution of different sources to total emissions in anarea over the same time period. However, there will inevitably be differences in detail in the

37
results between the two inventory approaches. These differences can result from variations inthe source of spatial data used to represent the location of sources. For some sectors, forexample, emissions from major roads and power stations, the emission maps and localinventories should provide the same emissions in each grid square because both approacheswill use the same source of data, for example, major road traffic flows provided by the DfTtraffic census. However, in deriving the national maps, emissions from some sources in aparticular grid square will be estimated using surrogate data to spatially disaggregate nationalemission totals that might be derived from national fuel consumption data. Examples of this areemissions from domestic combustion, small industrial boilers and traffic on minor roads. In localinventories, detailed data may be available for these sources from local authorities, local trafficsurveys and other local sources. Such detailed knowledge would be impossible to obtain anduse in a consistent manner across the whole of the country when generating the nationalemission maps. Even on major roads which use the same traffic flow data, local inventoriesmay take account of local differences in the age of the fleet from traffic camera information,local speed data or efforts made by local fleet operators (for example, buses) to reduceemissions from their fleet by, for example, retrofitting or engine upgrading.
84. Details of methods used to provide the 1x1 km map of UK NOx emissions and local areainventories are described in Section 2.8 with particular attention given to the inventory forLondon.
2.6 Estimating emissions from different sources
85. The following sections describe the methodologies used for quantifying emissions of NOx inthe UK from each of the main sectors. Further details of the methods used for the nationalinventory can be found in the NAEI annual report (Goodwin et al., 2001) and website atwww.naei.org.uk/index.php. Emission factors for specific sectors can be found in theEmission Factor Database also available on this website.
86. The measurement of NOx and primary NO2 emissions from road vehicles, the influencingfactors and the derivation of emission factors are discussed in detail in this section.
87. Estimating emissions from a specific source at a finer temporal or spatial resolution may requiremore detailed approaches and emissions data to be used than is required for the nationalinventory. Some particular considerations related to this are discussed and examples shownwhere these have been applied to calculating emissions from different transport sectors.
2.6.1 Emissions from stationary combustion sources88. Emissions of NOx from public power generation are based on reported emissions data for
individual power stations provided by the Pollution Inventory and station operators. Theseinclude all power stations running on coal, oil and gas, as well as Municipal Solid Waste. Forthe small amount of electricity generated from other fuels, such as landfill gas, emissions wereestimated from fuel-based emission factors taken from the USEPA’s Compilation of Air PollutionEmission Factors AP-42 (USEPA, 1997) and DTI figures on fuel consumption for this source.
89. Estimates are made of emissions of NOx occurring from combustion in a number of industrialsectors. These include combustion at petroleum refineries, in the manufacture of solid fuels (forexample, coke production), in iron and steel production and for processes in a variety of otherindustries. They are based on reported emissions data for individual plant operations providedby the Pollution Inventory and plant operators and also on fuel consumption data for differentindustries from DTI (DTI, 2002) combined with emission factors for each fuel type. Emissionfactors are taken from several sources, including CORINAIR (1999), USEPA (1997) and IPCC
NOx emissions and emission inventories

Nitrogen Dioxide in the United Kingdom
38
(1997) manuals. Emissions data reported for large combustion plant in Scotland collected bySEPA are also used.
90. NOx emissions from domestic consumption of coal, oil and gas and small boilers in thecommercial and public sector are estimated from DTI fuel consumption data for these sectorsby fuel type (DTI, 2002) and emission factors from USEPA and CORINAIR.
2.6.2 Emissions from road transport91. The importance of road transport as a ground-level source of emissions in urban areas and
the availability of appropriate emissions and transport data has meant that road transportemissions of NOx are relatively well quantified. Exhaust measurement programmes within theUK and elsewhere have been on-going since the late 1960s. With the availability of fairlydetailed traffic and fleet composition data, fairly sophisticated methods can be used toestimate emissions from this sector in contrast to other transport modes.
92. All vehicles and engines entering the UK market are subject to type approval and as part of thisapproval process, engines are required to comply with emission limits (Table 2.1). Compliancewith these limits is established through the measurement of the vehicle (for light-duty vehicles)on a chassis dynamometer where it is driven over a regulated test cycle. The exhaustemissions over this test cycle are sampled using a constant volume sampler (CVS) andanalysed either on a continuous basis, or through the use of bag samples, using conventionalgas analysers. The total emissions recorded over this test cycle are then compared to thelegislative limit value, routinely expressed in gtest-1 or gkm-1. In the case of heavy-duty vehicles,the existing legislative test is conducted on the engine alone, using an engine dynamometer,with the measurement of exhaust emissions at the sum of 13 engine load and speedconditions.
93. A comparison of driving characteristics demonstrates that the legislative test conditions poorlyrepresent existing in-service conditions. In general, these test conditions are characterised by apassive driving style with constant and relatively slow changes in vehicle speed. A comparisonof steady-state and transient driving conditions (rapidly varying speed, load and acceleration),demonstrate that emissions are considerably higher under conditions of transient operation(Joumard et al., 1995). Therefore, emission factors generated through the Type Approvalprocedure are not used within the derivation of standard emission databases used foremission modelling.
94. Emission factors for quantifying real world emissions are generated through the measurementof emissions from a selection of vehicles, driven over a range of real world driving cycles. Eachof these driving cycles or associated sub-cycles are characterised by a specific average speed.It is this average speed that is used as a surrogate for vehicle operation, with emission factorsallocated to a range of average speeds. The results from tests over a range of average speedsmay then be used to derive an average speed-emission relationship. It is this approach thatremains most widely used with average speed-emission curves generated for various vehicletypes, engine sizes, fuel types, legislation classes and pollutants.
95. Emissions of NOx from road transport are derived using these speed-related emission factors.Within the UK, emission factors for vehicles at their normal operating temperature come froma large database of emission measurements held by TRL. These are combined with fleetcomposition and traffic activity data for different years on the national road network providedby DfT. From this, the hot exhaust emissions are derived for each vehicle and road type.
39
96. Emission factors are intended to be representative of the vehicle fleet. Thus the selection of testvehicles routinely attempts to reflect the real fleet composition. This is obviously easier withlarger sample sizes, and indeed large samples can not only reflect the vehicle type, fuel andengine size, but may also reflect various states of maintenance. This level of maintenance isdifficult to assess in smaller samples, and whereas before this level of maintenance was builtinto the basic emission factors (Euro I and earlier), this factor is increasing handled separately.
97. Furthermore, because the emission database is dominated by results from conventionalvehicles, these data will undoubtedly have the lowest uncertainty. For these conventionalvehicles and fuels the repeat measurements of the same vehicle over the legislative test cyclecan vary by approximately ±7% of the mean. For real-world cycles this repeatability can beconsiderably higher (±30% for the new ARTEMIS high speed driving cycle).
98. Vehicles generally emit more when the vehicle is started with the engine cold. This is partly dueto the poor combustion efficiency when the engine is cold and the need to run the engineslightly fuel rich to achieve combustion stability. It is also due to the low efficiency of the three-way catalyst during the time it takes to reach the light-off temperature (see Technical Annexe,Appendix 1). The excess cold start emissions are calculated in the inventory using standardemission equations and vehicle trip start data. Cold start emissions of NOx are relatively minorcompared with hot exhaust emissions. This is not the case for CO and HC where cold startemissions are considerably more important.
2.6.2.1 Exhaust emission factors for NOx
99. Surveys of road vehicle exhaust emission factors are on-going within the UK and elsewhere. Thelast revision to the UK database was undertaken by TRL on behalf of the DfT (Barlow et al., 2001).Historically these emission test programmes have involved relatively large vehicle samples (in excessof 200 vehicles), but more recently this sample size has been reduced, in favour of an increase inthe number of pollutants and conditions analysed. Statistically this can result in an increase in theuncertainty associated with the basic emission factors. The NAEI incorporates the TRL emissionfactor database, but it should be recognised that this database is dominated by test dataassociated with conventional fuels and that the latest revision supplements the existing emissionfactors with data for Euro I and Euro II vehicles. Previously, with the exception of petrol cars,emission factors for these classes of vehicles were estimated based on changes in the emissiondirective’s type-approval limit values. A substantial part of the new measurements of Euro I and EuroII emission factors come from several test programmes funded by DfT and Defra and carried out atUK test laboratories between 1999 and 2001 (Barlow et al., 2001). The measurements were madeon dynamometer test facilities under various simulated real-road drive cycles.
100. Table 2.2 shows NOx emission factors for each class of vehicles calculated from the emissionfactor equations at typical speeds on urban, rural and motorway roads. These emission factorsare currently used in the NAEI. The vehicle types match the traffic activity data that are used inthe national emission calculations.
101. Emissions from future emission classes yet to be introduced, must again be estimated throughan examination of the proposed future legislation and the technical ability to meet these newlimits. This estimation process can result in significant errors for future emissions factors. Thiswas demonstrated with the previous over-estimation of the reduction in NOx emission factorsfor Euro I and II diesel vehicles, when in fact the latest series of tests showed little differencebetween the emission factors for the pre-Euro I, Euro I and Euro II classes of vehicles. In somecases, the Euro I factors were higher than the pre-Euro I factors, or Euro II higher than Euro I,indicating that improved technologies during the 1990’s had delivered little or no benefits toNOx emissions from diesel vehicles. There are two possible explanations for this. One is the
NOx emissions and emission inventories
Nitrogen Dioxide in the United Kingdom
40
possibility of ‘cycle beating’, at least in the case of heavy duty vehicles (UBA, 2003; Kågeson,1998). Modern engine management systems are tightly tuned and there is the possibility thatlegitimate NOx emission reductions over the specified cycle for type-approval testing can beachieved, but when the vehicle is driven under real road conditions (as in the emission factortests), the engine is frequently operating outside its ‘tuned’ condition and the emissionreductions are not realised. The risk of cycle beating has been recognised by the EU byrevising the test cycle for Euro III and Euro IV engines for heavy duty vehicles.
102. Another possibility that applies to the light duty diesel vehicles is the degree of tolerance thatthe regulations provide in the permitted levels of NOx emissions, allowing the vehiclemanufacturers to trade-off a certain amount of NOx in order to achieve the more stringent limitsset on particulate emissions. Examination of the NOx emission factors for pre-Euro I diesel carsand vans at average speeds of the test cycle shows that they were close to or already belowthe limits set in the Euro II standards. Thus, manufacturers could concentrate their attention onmethods to reduce particulate emissions, a more challenging problem at the time. It should beemphasised, however, that the new emission factors for Euro II diesel vehicles (and even Euro Ifactors for heavy duty diesel vehicles) are still based on a very small number of vehicles tested.An increase in this sample size will assist in assessing these conclusions, although it should benoted that these are already supported through other national test programmes, includingthose sponsored by the German and Austrian Environmental Protection Agencies (UBA, 2003).
103. Table 2.2 also provides emission factors for Euro III and Euro IV vehicles, the latter referring tostandards which will come into effect in 2006 (and 2008 for heavy duty vehicles). These arebased on scaling factors assumed to apply across all speeds relative to emission factors forEuro II vehicles. For light duty vehicles (petrol and diesel), the scaling factors were estimated bythe NAEI on the basis of current emission levels for Euro II vehicles and the amount emissionswill need to be reduced to achieve the type-approval limit values, taking into accountdifferences in the drive cycles used and the contribution that cold start emissions will maketo emission over the new 98/69/EC test cycle. A similar approach was used to estimateemissions from new motorcycles, using factors for pre-2000 models from TRL and scalingfactors based on recently agreed emission limits (Official Journal, 2002). For heavy dutyvehicles, it was assumed that Euro II vehicles are currently at their emission limits and will bereduced no more than required to achieve the new emission limits, using scaling factors fromthe COPERT III database (EEA, 2000). COPERT III is the methodology and database of roadtransport emission factors developed by a group of experts for the European EnvironmentAgency and recommended for national emission inventory reporting under CORINAIR.
Table 2.2 Exhaust emission factors for NOx (as NO2) for different road types used in theNational Atmospheric Emissions Inventory, based on data from TRL (Barlow et al., 2001).
gNOx(as NO2)km-1 Urban Rural Motorway
Petrol cars ECE 15.04 1.644 2.211 3.164Euro I 0.257 0.368 0.663Euro II 0.229 0.245 0.370Euro III 0.137 0.147 0.222Euro IV 0.073 0.078 0.118
Diesel cars Pre-Euro I 0.623 0.570 0.718Euro I 0.537 0.465 0.693Euro II 0.547 0.505 0.815Euro III 0.547 0.505 0.815Euro IV 0.273 0.253 0.407

41
gNOx(as NO2)km-1 Urban Rural Motorway
Petrol LGVs Pre-Euro I 1.543 1.783 2.351Euro I 0.361 0.356 0.531Euro II 0.319 0.385 0.567Euro III 0.192 0.231 0.340Euro IV 0.105 0.127 0.187
Diesel LGV Pre-Euro I 1.332 1.254 1.549Euro I 1.035 0.892 1.384Euro II 0.983 0.848 1.315Euro III 0.735 0.634 0.982Euro IV 0.383 0.330 0.512
Rigid HGVs Pre-1988 13.53 13.53 13.5388/77/EEC 6.02 4.96 5.91Euro I 7.63 6.87 7.23Euro II 6.51 5.78 6.02Euro III 4.49 3.99 4.15Euro IV (2006) 3.19 2.83 2.95Euro IV (2008) 1.82 1.62 1.69
Artic HGVs Pre-1988 20.70 20.70 20.7088/77/EEC 16.93 12.93 11.52Euro I 20.25 18.25 19.22Euro II 13.96 12.40 12.91Euro III 9.63 8.56 8.90Euro IV (2006) 6.84 6.08 6.32Euro IV (2008) 3.91 3.47 3.61
Buses Pre-1988 16.74 13.83 13.3688/77/EEC 13.62 5.45 6.13Euro I 10.93 6.18 6.51Euro II 9.78 5.52 5.75Euro III 6.75 3.81 3.97Euro IV (2006) 4.79 2.71 2.82Euro IV (2008) 2.74 1.55 1.61
Mopeds, <50cc, 2st Pre-2000 0.030 0.030 0.030Euro I 0.010 0.010 0.010
Motorcycles, >50cc, 2st Pre-2000 0.032 0.066 0.126Euro I 0.025 0.029 0.052Euro II 0.025 0.029 0.052Euro III 0.006 0.007 0.012
Motorcycles, >50cc, 4st Pre-2000 0.156 0.229 0.385Euro I 0.210 0.279 0.448Euro II 0.210 0.279 0.448Euro III 0.048 0.064 0.103
NOx emissions and emission inventories

Nitrogen Dioxide in the United Kingdom
42
2.6.2.2 Road transport activity data
104. To calculate UK emissions from road transport in the NAEI, the hot exhaust emission factors arecombined with annual UK vehicle kilometre data for different vehicle types on different roads.For Great Britain, vehicle kilometre data are taken from the DfT annual traffic census for thenational road network (DfT, 2002a). Vehicle kilometre data for Northern Ireland are derived fromthe survey by the Transportation Unit, Road Services Headquarters (NI Road Services, 2001).
105. Data are also required on the composition of the fleet for each type of vehicle and the petrol vs.diesel mix for cars and LGVs (light goods vehicles less than 3.5 tonnes). The fleet compositiondata required are the vehicle size mix (engine cc and gross vehicle weight) and the proportionof vehicle kilometres travelled in a year by each Euro standard. The latter is related to the ageprofile of the fleet, using year-of-first registration data from DfT’s vehicle licensing statisticspublished each year (DfT, 2002b). Account is also taken of the fact that newer vehicles travelmore miles in a year than older ones, using survey data from DfT.
106. It is assumed in the NAEI that 5% of cars fitted with three-way catalysts fail each year, but 95%of failed catalysts are repaired after the vehicle is 3 years old and reaches the age of MOTtesting. This failure rate assumption was first adopted for early generation catalyst systems(Euro I) to reflect accidental damage and poisoning of the catalyst system by drivers. However,the application of the 5% failure assumption to more modern and future car models (Euro II-IV)is currently under review, in light of better system durability required as a condition of Type-Approval and advanced on-board diagnostic systems on cars which should be able to detectproblems when they arise. It is indeed the case that although there are no definitive sets ofdata on failure rates, emissions information from MoT test returns and road-side testing, anddata from car leasing companies, equipment suppliers and manufacturers’ warranty returns areall pointing towards lower failure rates (and in some cases much lower) than 5% in recentyears. For catalyst cars, a slow deterioration in emissions with vehicle mileage is taken intoaccount in the NAEI.
107. Further details on the emission calculation methodology are provided in the NAEI report(Goodwin et al., 2001).
2.6.2.3 Cold start emissions
108. The excess emissions that arise when the vehicle is started with its engine cold or below itsoptimum operating temperature are calculated using a method taken from COPERT III. Theprocedure uses equations that take account of the effects of ambient temperature on theexcess emissions and its effect on the distances travelled with the engine cold. The distancestravelled with cold engines also depend on average trip lengths: the shorter the average triplengths are, the greater the contribution of cold start emissions. The method calculates theratio of cold to hot exhaust emissions for light duty vehicles which are used to calculate theoverall cold start emissions from these vehicles. Further details on the methodology used forcold starts are provided in the NAEI report (Goodwin et al., 2001).
2.6.2.4 Emissions from instantaneous operations of road vehicles
109. Modelling and mapping emissions from road transport on a local scale involves simplifying theroad network as a series of line sources subdivided into links (with uniform flows and speeds)and allocating fleet corrected average-speed emission rates in gkm-1. These average speedemission rates are used for simplicity, as it has been considered that the average speed of aroad link may be readily determined. However, this average speed emission factor has actuallybeen a surrogate for vehicle operation, and in reality the emissions would be better described

43
through the use of a number of other variables such as relative positive acceleration and engineload, rather than road speed itself. However, in practice these variables would be extremelydifficult to determine for each vehicle.
110. For pre-Euro I vehicles, the average speed approach appears to be sufficient to simulatevariations in emissions and thus roadside air pollution on a geographic and temporal scale.With the introduction of the three-way catalyst and its associated large reduction in exhaustemissions, the average speed approach appears to be becoming less appropriate.
111. For example, evidence suggests that catalysts tend to exhibit on/off control, and emissionlevels from catalyst-equipped vehicles are much more sensitive to operating conditions thanthose from non-catalyst vehicles. Under particular operating conditions the catalyst may beworking at its maximum efficiency, but for slightly different conditions the conversion efficiencymay be low. For example, measurements by Joumard et al. (1998) have shown that for engineloads (the actual power divided by the maximum power at a given engine speed) greater than75%, instantaneous CO emissions can be 20,000 times higher, and NOx emissions 10 timeshigher, than for lower loads (Figure 2.4). Over an entire motorway driving cycle around 90% ofthe total CO emissions occurred during only 15% of the time.
Figure 2.4 NOx instantaneous emission versus engine speed and load over the motorwayIM modem cycle for a catalyst-equipped light-duty vehicle (Joumard et al., 1998).
112. An examination of instantaneous exhaust emissions against vehicle speed (for a Euro III petrolvehicle) indicates that during the majority of a typical test cycle emissions remain very low, butare subject to substantial elevation when the engine is subjected to changes in engine load,such as gear change events. This type of observation would suggest that the use of anaverage speed based modelling approach in a typical urban street could over-estimate theemissions along the majority of the link, but underestimate them at situations where vehiclesinteract, such as junctions and during conditions characterised by stop-start driving. This hasobvious implications for emissions and subsequent air quality modelling of NO2 concentrationsat specific points near a road junction or areas of congestion.
10
20
50
100
20002500
30003500
40004500
0
1
1
2
2
3
3
NOx (g/kW/h)
% Pmaxengine speed
(rpm)
NOx emissions and emission inventories

Nitrogen Dioxide in the United Kingdom
44
113. Research into the development and use of instantaneous emission models has been on-goingfor many years and includes studies by INRETS, TUEV Rheinland, LAT and TRL within theMODEM project (EU 4th framework project), and more recent studies by the TechnicalUniversity of Graz and EMPA within the ARTEMIS project (EU 5th framework project) andseparate studies by MIT. However, these studies do not fully address the most fundamentalproblem relating to instantaneous emission modelling: it is extremely difficult to measureemissions on a continuous basis with a high degree of precision, and the emissions and fuel-consumption values recorded in the one-second steps might not be successfully allocated tothe associated operating conditions. For example, because of the time required to transportthe exhaust gas to the analysers, and the actual response time of the analysers themselves,the emission signals are delayed relative to the driving cycle. Furthermore, the exhaust gas ismixed in the exhaust system. This results in a general flattening of instantaneous emissionpeaks over a period of more than one second. The dynamics of mixing also depend on the gasflow rate, and the situation is even worse when dilute exhaust gas is being sampled using aCVS (Boulter, 2002).
114. These results have obvious implications for the development of modal emission modelsbased on instantaneous vehicle operation. Therefore, even if modal emission models wereconstructed using raw exhaust measurements, such results indicate that there would clearlybe problems matching an emission signal in any given second to the appropriate speed oracceleration measurement.
115. Clearly, advances in the field of modal emission modelling will not be forthcoming until realisticcontinuous emission data are available. Efforts are now underway to reduce the dynamicdistortion of the emission data (Weilenmann et al., 2001).
116. In summary, it may be concluded that the transfer of instantaneous modelling to real-worldconditions is considerably more complex than that of the average speed approach.
2.6.2.5 Impact of traffic management schemes
117. Much of the progress to date in the control and reduction of the environmental impact of traffichas been through the use of improved vehicle technology and fuels, often prompted byincreasingly stringent legal limits and design standards. In addition, the way in which a vehicleis operated has a significant influence on its environmental performance. Traffic congestion andthe associated driving pattern of stops and starts, accelerations and decelerations can produceexcessive emissions. Thus, traffic management schemes that modify the behaviour of thetraffic, as well as the volume of traffic, can supplement the effects of improving technology.In general traffic management that encourages drivers to drive in a more passive style arebeneficial (Abbot et al., 1995).
118. In the mid-1990s the DfT commissioned a programme of research investigating the linksbetween traffic management and air quality. This programme (TRAMAQ) is on-going, andcomprises a number of inter-related studies largely focusing on urban traffic control (Abbotet al., 1995; Boulter et al., 2001; McCrae et al., 2000).
119. A review of the various traffic management case studies suggests that lower speed limits andtraffic calming schemes usually reduce NOx emissions on the affected roads.
120. The potential of Low Emission Zones (LEZ), restricting access of vehicles in a zone to thosemeeting a certain emission standard, has been assessed for London. An initial study carriedout by TRL on behalf of Westminster Council (Cloke et al., 2000) concluded that restricting

45
HDVs to only those complying with Euro III limits could reduce NOx emissions by up to 20%.A further feasibility study funded by the GLA, Transport for London, Defra and the Associationof London Government has so far considered many of the issues of importance to an LEZ inLondon. These have included: emission change, impact on atmospheric concentrations of NO2and PM10, implementation issues and the cost-effectiveness of any scheme considered. Initialresults from the study (www.london-lez.org) suggest that the benefits of an LEZ in Londonwould be less than those identified in the previous study carried out by TRL. The principalreason for a reduced impact is the use of the latest emissions factors for NOx in the latterstudy, which for diesel vehicles show less benefits for new technologies than previously thought(Barlow et al., 2001). Most of the scenarios considered by the LEZ team have focussed onHGVs, taxis and LGVs, which are almost all diesel-engined.
121. Other traffic management schemes assessed include dedicated bus lanes in Copenhaganwhich were estimated to have reduced NOx emissions by between 5-15%. A pilot study on theintroduction of red-routes within London estimated that NOx emissions would be reduced bybetween 1-3%. Finally, the introduction of variable speed limits on the M25 motorway, whiledemonstrating improvements in CO and CO2 emissions, were judged to have a neutral effecton NOx emissions (Barlow, 1997).
122. Traffic management may only be used to improve air quality if the area of influence of themanagement scheme is large. In the case of NO2, roadside concentrations of NOx are largeand thus the limit on NO2 is not necessarily NOx emissions, but frequently the availability ofoxidant to convert NO to NO2 in the urban atmosphere, as will be discussed later in this report.Therefore, even if traffic management regimes are shown to reduce the emissions of NOx, theresulting impact on NO2 concentrations is always lower (McCrae et. al. 2000).
2.6.2.6 Primary NO2 emissions from road vehicles
123. On behalf of the Highways Agency and DfT, TRL carried out a small investigation to determinethe proportion of NOx emitted as NO2 from a range of road vehicles (Latham et al., 2001;McCrae et al., 2002). In order to determine the proportion of NOx emitted in the form of NO2,a vehicle test matrix was developed to provide a representative sample of vehicles in the UKvehicle fleet. A resulting small sample of eighteen vehicles was subsequently subjected totesting, covering 9 petrol cars, 3 diesel vans, 3 diesel heavy goods vehicles and 3 buses,meeting the pre-Euro I, Euro I or Euro II legislative standards. All testing was undertaken onvehicles taken from the in-service fleet and tested in the ‘as-received’ condition. The study didnot include any diesel vehicles equipped with particulate traps or any other specific exhaustafter-treatment devices.
124. The vehicles were subjected to tests on a chassis dynamometer over a series of legislative andreal world driving cycles, while emissions were recorded on a continuous basis. These includedthe Warren Spring Laboratory (WSL) congested urban, urban, suburban and rural cycles andlegislative 96/69/EC test and for heavy goods vehicles and buses over the simulated 13-modeFIGE cycle followed by the Millbrook bus cycle.
125. For the light duty vehicles (the petrol cars and diesel vans), the study examined for anystatistically significant dependence of the measured NO2/NOx emission ratio on the samplingmethod used; the fuel type (petrol or diesel); average speed of the test cycle; and the emissionstandard of the vehicle. A smaller range of tests was carried out on the heavy duty vehicles.
NOx emissions and emission inventories
Nitrogen Dioxide in the United Kingdom
46
2.6.2.6.1 The measurement techniques and sampling strategy for NO2 emissions
126. The standard legislative method for measuring NOx emissions from vehicles depends on thetype of vehicle being measured. In the case of light-duty vehicles, NOx measurements aremade on diluted exhaust gas, whereas those for heavy-duty engines are made on raw exhaust.In addition, for the NOx measurements from HGVs, the sample may be pre-conditioned bypassing the gas stream to a chiller unit via a heated line, prior to analysis in an unheated NOxanalyser, in order to remove water from the exhaust sample. Alternatively, the legislation alsoallows for the measurement of NOx in a heated NOx analyser, delivered directly through aheated sample line. These various techniques, while not having a significant impact on totalNOx emission, could affect the fraction of NOx that is measured as NO2.
127. Conventionally, NOx emissions are measured using chemiluminescence techniques (seeChapter 4). To achieve continuous measurements of both NO and NOx, using a reducing agentto convert all NOx to NO, requires either a switchable unit or the use of two separate analysers.Either way, the resultant NO2 emissions are subject to a relatively large potential error, since theindirect NO2 measurements are derived through the difference between two concentrations(NOx and NO) of a similar magnitude.
128. Infra-red absorption spectroscopy relies on the principle that different chemical groups absorbradiation at different frequencies. The absorption spectra for NO and NO2 are at differentfrequencies allowing for their direct, independent and continuous measurement, withoutintroducing potential errors derived from the difference of two measurements. Fourier TransformInfrared Spectroscopy (FTIR) and standard chemiluminscence techniques were used tomeasure NO2 in this study.
129. The sampling strategy may have a significant impact on the proportion of NO2 measured in theNOx sample, due to variations in the sample residence times, temperatures, and its subsequentdilution and reaction in the diluent air. Emissions of NO, NO2 and NOx were recorded using fivedifferent sampling and analysis approaches:
● raw exhaust with unheated chemiluminescent analyser,
● raw exhaust gas with heated chemiluminescent analyser,
● diluted exhaust gas with heated chemiluminescent analyser,
● diluted exhaust gas with a heated FTIR analyser, and
● raw exhaust gas with a heated FTIR analyser.
130. Different levels of NO2 detected could be influenced by reaction of NO with O3 in the diluent airand through the slow NO + NO + O2 reaction which would occur to varying degrees in eachsampling regime.
2.6.2.6.2 Emissions from light duty vehicles
131. The NO2/NOx ratios measured for light duty vehicles covered a broad range over the testmatrix covered, with values as low as 0.03 to as high as 0.46. In general, the highest ratioswere found for tests carried out using the raw exhaust with heated chemiluminescent analyserover the congested urban cycle. Figure 2.5 shows the average NO2/NOx ratios measured usingthe different sampling and analysis methods over the various vehicle test cycles.
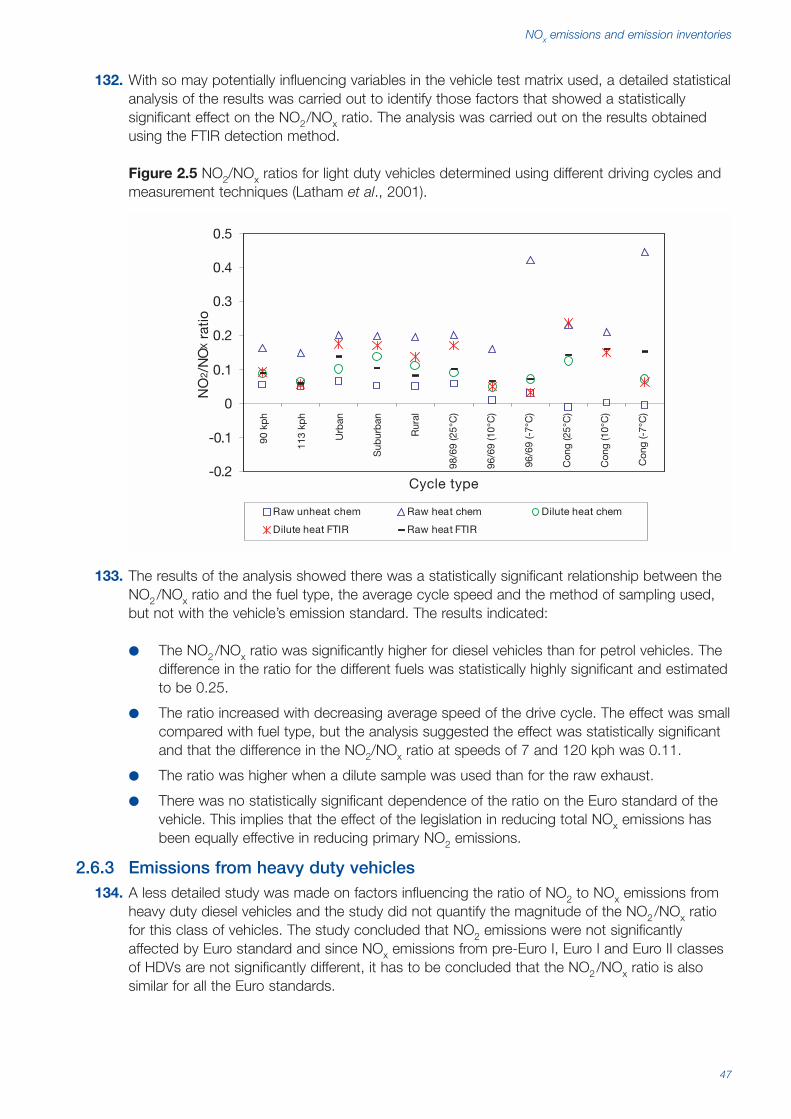
47
132. With so may potentially influencing variables in the vehicle test matrix used, a detailed statisticalanalysis of the results was carried out to identify those factors that showed a statisticallysignificant effect on the NO2/NOx ratio. The analysis was carried out on the results obtainedusing the FTIR detection method.
Figure 2.5 NO2/NOx ratios for light duty vehicles determined using different driving cycles andmeasurement techniques (Latham et al., 2001).
133. The results of the analysis showed there was a statistically significant relationship between theNO2/NOx ratio and the fuel type, the average cycle speed and the method of sampling used,but not with the vehicle’s emission standard. The results indicated:
● The NO2/NOx ratio was significantly higher for diesel vehicles than for petrol vehicles. Thedifference in the ratio for the different fuels was statistically highly significant and estimatedto be 0.25.
● The ratio increased with decreasing average speed of the drive cycle. The effect was smallcompared with fuel type, but the analysis suggested the effect was statistically significantand that the difference in the NO2/NOx ratio at speeds of 7 and 120 kph was 0.11.
● The ratio was higher when a dilute sample was used than for the raw exhaust.
● There was no statistically significant dependence of the ratio on the Euro standard of thevehicle. This implies that the effect of the legislation in reducing total NOx emissions hasbeen equally effective in reducing primary NO2 emissions.
2.6.3 Emissions from heavy duty vehicles134. A less detailed study was made on factors influencing the ratio of NO2 to NOx emissions from
heavy duty diesel vehicles and the study did not quantify the magnitude of the NO2/NOx ratiofor this class of vehicles. The study concluded that NO2 emissions were not significantlyaffected by Euro standard and since NOx emissions from pre-Euro I, Euro I and Euro II classesof HDVs are not significantly different, it has to be concluded that the NO2/NOx ratio is alsosimilar for all the Euro standards.
-0.2
-0.1
0
0.1
0.2
0.3
0.4
0.5
Cycle type
NO
2 /N
OX r
atio
Raw unheat chem Raw heat chem Dilute heat chem
Dilute heat FTIR Raw heat FTIR
90 k
ph
113
kph
Urb
an
Sub
urb
an
Rur
al
98/6
9 (2
5°C
)
96/6
9 (1
0°C
)
96/6
9 (-
7°C
)
Con
g (2
5°C
)
Con
g (1
0°C
)
Con
g (-
7°C
)
NOx emissions and emission inventories
Nitrogen Dioxide in the United Kingdom
48
2.6.4 Conclusions concerning primary NO2 emissions from road vehicles135. The results from this study have to be viewed in the context of the relatively small sample size
investigated. The study has confirmed the higher fraction of NOx emissions as NO2 in theexhausts of diesel vehicles compared with petrol vehicles, but has also indicated theimportance of sampling and measurement method used as well as average speed or drivecycle of the vehicle. Further measurements are needed to define and quantify the averagespeed dependence of the NO2/NOx ratio on all types of vehicles, but especially for heavy dutyvehicles. The speed-dependence noted on emissions from light duty vehicles is significant as itimplies a greater proportion of NOx emitted as NO2 in urban areas, where average speeds arelower, compared with rural areas and motorways. The possible implications this could have onprimary NO2 emissions from slow-moving buses and large HGVs, as well as possibly dieselvans and taxis, in the centre of towns and cities are significant.
136. It is hard to provide a firm and unambiguous value on the NO2/NOx ratio for emissions fromroad vehicles. On the basis of the results from this investigation carried out by TRL, an averagevalue of 0.05 ± 0.03 is suggested for petrol vehicles and an average value of 0.25 ± 0.10 issuggested for diesel vehicles. For diesel vehicles, the value could be higher than this averagevalue in urban areas and lower than this in rural areas and motorways. Further research isrequired to confirm these estimates at different speeds or cycles.
137. The possibility of higher primary NO2 emissions from heavy duty diesel vehicles equippedwith CRTs, relying on the deliberate formation of NO2 in the exhaust for regeneration of theparticulate trap, also needs to be investigated, especially for operation of the vehicles overurban drive cycles.
2.6.2.7 Primary emissions of nitrous acid (HONO) from road vehicles
138. A number of studies have demonstrated that nitrous acid (HONO) is emitted in vehicle exhaustin conjunction with NO and NO2 (for example, Pitts et al., 1984; Kirchstetter et al., 1996;Martinez-Villa, 2001; Kurtenbach et al., 2001). Emissions of HONO have also been quantifiedfrom a diesel-fuelled electric power generator (Gutzwiller et al., 2002). The results of recentstudies are summarised in Table 2.3. The vehicle exhaust studies have been made at roadsidelocations and in road tunnels, and have generally distinguished primary emissions of HONOfrom its secondary formation from subsequent reactions of NO and NO2. The European studiesgenerally indicate that HONO accounts for approximately 0.5–1.0% of emitted NOx. Althoughthis is a small fraction, it is potentially significant from a chemistry point of view, because HONOphotolyses efficiently to generate free radicals, possibly leading to additional NO-to-NO2conversion (see Section 3.3). The measurements of Gutzwiller et al. (2002) indicate a similarproportion of emitted HONO from a diesel-fuelled electric power generator.

49
Table 2.3 Summary of reported information on primary emissions of HONO.
Study HONO/NOx emission index location note(% v/v) (mg HONO)/kg fuel
Kirchstetter et al. 0.29 ± 0.05 – Caldecott tunnel, f(1996) San Francisco Bay,
USA
Martinez-Villa (2001) 1.10 ± 0.09a - Marylebone Rd, London, gUK
Kurtenbach et al. 0.80 ± 0.10 88 ± 18b Kiesbergtunnel, h(2001) 0.53 ± 0.08 115 ± 10c Wuppertal, i
0.66 ± 0.20 94 ± 27d Germany j0.65 ± 0.24 101 ± 37e k
Gutzwiller et al. 0.65 71 Laboratory facility l(2002)
Notesa may include a secondary contribution; b corresponding emissions of 7700 ± 1100 mg NO/kg fuel and 590 ± 80 mg NO2/kg fuel reported ( ➾ 4.7 ± 0.6%v/v primary NO2);c corresponding emissions of 11900 ± 700 mg NO/kg fuel and 2000 ± 200 mg NO2/kg fuel reported ( ➾ 9.8 ± 1.0%v/v primary NO2);d corresponding emissions of 8600 ± 1700 mg NO/kg fuel and <30 mg NO2/kg fuel reported ( ➾ < 0.2% v/vprimary NO2);e corresponding emissions of 9500 ± 1700 mg NO/kg fuel and 860 ± 230 mg NO2/kg fuel reported ( ➾ 5.5 ± 1.5%v/v primary NO2); f >99% petrol vehicles; <0.2% heavy duty trucks;g Measurements took place in October 1999; ca. 10% HGV; h 74.7% petrol cars; 12.3% diesel cars; 6% commercial vans; 6% heavy duty trucks; 1% motorcycles;i MAN truck (diesel) 0-40 km hr-1 over 3500 m; j VW Golf (diesel) 0-40 km hr-1 over 3500 m; k VW Golf (petrol) 0-40 km hr-1 over 3500 m; l Kubota GL-4500s diesel electric generator, maximum load 4.5 kW.
2.6.3 Emissions from aviation and airports139. Emissions from aviation are estimated within a 1000 metre ceiling of takeoff and landing. In the
NAEI, emissions are calculated from the number of aircraft movements at all the British airports(DfT, 2002a) and emission factors expressed as emissions per landing and takeoff cycle. Theemission factors are taken from the local inventory studies carried out for different conurbationsby London Research Centre in the 1990s (discussed in section 2.8.3), with additional aircraftemission factors taken from the 1998 inventory for Heathrow Airport compiled by AEATechnology (Underwood and Walker, 1999).
140. The Heathrow Inventory is an example of a spatially resolved inventory centred on a specificsource. This section focuses on the methods used in the 1998 Heathrow Inventory to calculateemissions from the airport and surrounding area rather than on the results from the inventoryitself. Annual emission rates and their spatial distribution were prepared in a form suitable forinput to an atmospheric dispersion model with a view to estimating the airport contributionto ambient concentrations in the area. It is these rather than the emission figures in their ownright which provide a better measure of the impact of the airport on local air quality. All themodelling and assessments discussed in this report have been based on the 1998 version ofthe Heathrow Inventory, but it should be pointed out that an updated version of the inventoryhas just been completed for 2000 which incorporates a number of significant improvementsto the methodology. However, the 2000 Heathrow Inventory was not made available in timefor this report.
NOx emissions and emission inventories
Nitrogen Dioxide in the United Kingdom
50
141. The Heathrow Inventory covered emissions from the aircraft during the landing and take-off(LTO) cycle up to 1000 m in height, emissions from road traffic on the surrounding roadnetwork, emissions from airside support vehicles and emissions from heating plant used forthe airport.
142. To enable pollutant concentrations at the airport to be calculated by dispersion models, theemissions from all road traffic on the surrounding road network were estimated as these makea contribution to the background concentrations at the airport. However, only a portion of thetraffic is airport-related.
143. Aircraft emissions were estimated from data on the number of aircraft movements during 1998,supplied by Heathrow Airport Ltd and broken down by aircraft type and airline, together withemission factors mainly given in the International Civil Aviation Organisation Engine EmissionsData Bank (ICAO, 1999). Emissions were estimated for eight phases of the LTO cycle:
1) taxi-out;
2) hold;
3) take-off roll;
4) initial climb (i.e. wheels-off to throttleback, assumed to occur at 450 m);
5) climb out (450 m to 1000 m);
6) approach (1000 m to touchdown);
7) landing roll;
8) taxi-in.
144. Emission factors for a given engine type vary with thrust setting. The ICAO database givesemission test results for different engines in service at four thrust settings: 7%, 30%, 85% and100%. In general, each of the LTO cycle phases was assigned one of these thrust settings.A limited amount of information was used on operational procedures where aircraft do not usefull thrust during take-off. It should be noted that emissions data in the ICAO database werenot primarily intended for use in emissions modelling, as they may not be representative of real-world aircraft operations. However, these were the best data available for the HeathrowInventory. There is a paucity of emissions data from aircraft engines operating over real-worldcycles and clearly this is an area that needs attention. Further research is needed into actualaircraft operations, their impact on emissions and into the way aircraft emissions are modelled.
145. Emissions from road traffic on and around the airport were calculated from traffic volumes andspeeds derived from the Heathrow Road Traffic Model (HRTM). This covered both airport- andnon-airport-related traffic. Emissions from road traffic inside and outside the airport perimeterroads were calculated. The traffic model covered an extensive road network on and around theairport including sections of the M4 and M25 (Underwood et al., 1994). The traffic data wereused in conjunction with NAEI road vehicle emission factors.
146. Emissions were spatially distributed in three dimensions by representing different sources aspoint, line and area sources. For aircraft emissions, taxi and hold routes to and from runwaywere used. Emissions for initial climb, climb-out and approach from and to runway werespatially distributed according to representative angles of climb and descent for each aircraftweight category. Road vehicle emissions from free-flowing traffic were distributed on a roadlink-by-link basis as line sources. Car park emissions were treated as area sources.

51
147. A portion of the aircraft and road traffic emissions included in the inventory occur at somedistance horizontally away from the airport. Estimates of annual emission totals for the airporttherefore reflect the fairly arbitrary choice of spatial boundaries used in the inventory, forexample, the extent of the road network covered. The Heathrow Inventory study did produceemission totals by source category for sources designated as ‘airport-related’ even thoughmuch of these occur outside the physical domain of the airport. The 1998 Heathrow Inventoryshowed that over half of the NOx emissions designated as airport-related occur from theaircraft during take-off and landing, but much of this will be at some distance from airportground-level. Around a third of all NOx emissions from the aircraft (including ground-levelemissions from auxiliary power units, engine testing etc, as well as take-off and landing) occurbelow 100 m in height. The remaining two-thirds occur between 100 and 1000 m andcontribute little to ground-level concentrations. Receptor modelling studies based on dispersionmodels and the 3-dimensionally resolved emission inventory show the impact of airportactivities on ground-level NO2 concentrations. Studies have shown that although emissionsassociated with road traffic are smaller than those associated with aircraft, their impact onpopulation exposure at locations around the airport are larger (Farias and ApSimon, 2003).
148. An updated version of the Heathrow emissions inventory has just been compiled by AEATechnology for the 2000 calendar year, using more detailed aircraft activity information. Thenew inventory is based on a number of improvements to the data and methods used whichhave led to a reduction in the estimates of the amount of NOx emitted from aircraft atHeathrow compared with the estimates made in the 1998 inventory. The new inventory hasaccounted for the usage of reduced thrust during take-off more fully than had been possiblefor the 1998 inventory and assumptions about reverse-thrust usage have been updated.Other improvements have included information on Auxiliary Power Unit running times. Theimprovements have led to an overall 38% reduction in the estimate of NOx emissions fromaircraft at Heathrow relative to the estimates made in the 1998 inventory. This reduction wasmade up of a 19% reduction in aircraft emissions at ground-level and 46% reduction inelevated emissions. It should be emphasised that these reductions mark improvements in theinventory estimate due to methodological improvements, not to actual reductions in emissionsover this time period.
2.6.4 Emissions from shipping149. A recent exercise to quantify and map emissions of NOx from shipping across the EU (including
emissions in the North Sea, English Channel, Irish Sea and in-port sources) has beenundertaken by ENTEC for DG Environment for the year 2000 (ENTEC, 2002). This used activitydata from the Lloyds Maritime Intelligence Unit on ship movements and considered seasonalvariations in activity through selecting data for January, April, July and October indicative ofwinter, spring summer and autumn operations. Other sources of information used were: vesselcharacteristics (vessel type, engine size and type), a detailed shipping emission factor databasedeveloped by the Swedish Environmental Research Institute (IVL) (ENTEC, 2002), datareflecting the time spent in port from a questionnaire survey and data on fuel consumption fromfishing vessels, fishing grounds and the size of catches. The study covered all ships greaterthan 500 gross tonnes. Typical NOx emission factors for these vessels currently range from13 to 19 gkWh-1, approximately 3 to 4 times higher than those associated with a Euro IIIheavy-duty road vehicle.
150. Estimates were made using a GIS methodology and the results presented on the 50 x 50 kmEMEP grid. The study showed that two British ports were ranked in the top 10 highest emittersof NOx in the EU, Milford Haven and Immingham, with estimated emissions of 2 ktonnes and1.3 ktonnes, respectivelty, in 2000. Within the ENTEC study area covered (North Sea, Irish Sea,English Channel, Baltic Sea, Black Sea and the Mediterranean), it was estimated that NOx
NOx emissions and emission inventories

Nitrogen Dioxide in the United Kingdom
52
emissions are likely to equal two thirds of land emissions by 2010. The European Union is thusworking with member states to encourage tighter emission standards through the InternationalMaritime Organisation. The model for these proposed emission reductions may already beseen in the Baltic area with fiscal benefits awarded to ships meeting low SOx and NOxstandards. With respect to shipping the dominant technology for NOx reduction is currentlySCR with urea injection, as being developed for heavy duty road diesel engines (see theTechnical Annexe, Appendix 1).
151. In the NAEI, total UK emissions from shipping cover fishing and coastal shipping in UK waters.NOx emissions are estimated from DTI fuel consumption data for this sector and emissionfactors from CORINAIR (1999).
2.6.5 Emissions from rail transport152. Limited information exists for the emissions associated with rail locomotives. In the UK, less
than 50% of the rail network is electrified and thus the use of diesel locomotives is common.With respect to NOx, diesel locomotives have an emission rate of between 6 and 16 gkWh-1.The most recent studies (ARTEMIS) on these emissions have been undertaken by the DanishTechnical University and involve the development of a methodology that attempts toincorporate fundamental physical factors for determining driving resistance of the train as afunction of speed, load and weight. This is subsequently used to calculate the energy requiredto move the train, and propulsion efficiencies are applied for diesel engines and transmissions.Operation is divided into elements in an acceleration-velocity matrix, and the driving resistancecalculated for each condition in the matrix. Based on a distribution function for the frequencyof occurrence of each condition, the total energy consumption of the train for a given drivingpattern is evaluated. Since the frequency of driving conditions is used, the method can beapplied to a wide range of conditions, from a single train on a single route to an entire fleetof trains of a given type averaged over a large geographical scale. In order to facilitate theuse of available operation data, the model can use either temporal or spatial distribution ofthe operating conditions. The results of this method have been favourably compared tomeasurements from a small number of Danish trains (Hickman, 1999).
153. In the NAEI, emissions from railways cover emissions from the stationary combustion of oil andgas by the railway sector and emissions from diesel trains. Emissions from generation of powerconsumed by the railway sector for electric traction is reported under the ‘Public Power’ sector,following emission reporting guidelines. Emissions from stationary combustion are based onemission factors and fuel consumption data for the sector. Emissions from diesel trainsare estimated for Intercity, regional and freight trains using railway kilometre data, gas oilconsumption data for the sector and emission factors for different types of diesel locomotivesused for each type of journey (Goodwin et al., 2001). All the fuel consumption data are fromDTI (2002).
154. The NAEI maps UK emissions from the rail sector according to rail track data. No specific ordetailed inventories of emissions from local rail operations have been generated. Emissionsfrom diesel locomotives represent 0.6% of the total UK inventory of NOx emissions and are notlikely to pose significant urban air quality problems except possibly in the immediate vicinity ofmajor rail terminii. Without improvements in the emission performance of diesel locomotives,it is conceivable that emissions from the rail sector will become a more important issue intransport inter-modal comparisons as emissions from road vehicles continue to decline.However, greater electrification of the rail network will lead to reduced emissions of NOxfrom trains at the point of use.

53
2.6.6 Emissions from other mobile machinery155. Emissions from off-road sources and mobile machinery cover a range of portable or mobile
equipment powered by diesel or petrol engines. They include agricultural and forestryequipment such as tractors and combine harvesters; construction equipment such asbulldozers and excavators; industrial machines such as portable generators, compressors andforklift trucks; aircraft support vehicles; and domestic house and garden equipment such aslawn mowers. In the NAEI, emissions and fuel consumption are estimated from populationand machinery lifetime data from a DETR sponsored survey covering around 70 classes ofmachinery, power rating, load and annual usage data for each class of machinery and emissionfactors (Goodwin et al., 2001; Murrells and Salway, 2000). The emission factors for eachmachinery class mostly come from CORINAIR (1999) and Samaras (1996) and are expressedin g NOx (as NO2).kWh-1. Where possible, the emission estimates are normalised accordingto fuel consumption data available from DTI for certain groups of machinery or estimated fromother surrogate activity factors.
2.6.7 Primary emissions of NO2 from non-road transport combustion sources156. Whilst there is no evidence for significant emissions of primary NO2 from other combustion
sources, the presence of primary NO2 emissions in diesel vehicle exhausts suggests thisshould be verified in certain other key combustion sources where ground-level exposure couldbe significant. For example, it is conceivable that diesel locomotives could emit significantamounts of NOx as primary NO2 while their engines are idling at low load in major rail terminiwhich are often in enclosed spaces. Levels of primary NO2 emitted in domestic burners andcombustion appliances should be monitored to determine whether these sources, which canbe significant sources of total NOx emissions in urban areas, produce significant amounts ofprimary NO2.
2.7 Time series of NOx emissions in the UK
2.7.1 UK emissions of NOx from 1970 to 2000157. The NAEI time series of UK emissions of NOx are shown in Table 2.4 and were depicted in
Figure 2.1. The sector ‘other’ includes combustion in agriculture, waste incineration, but ismainly emissions from small boilers in the commercial and public sector.
158. Based on the 2000 NAEI figures (Goodwin et al., 2002) using the latest vehicle emissionfactors (Table 2.2), road transport is the largest source of NOx emissions in the UK, contributing49% of total emissions. Public power generation is the next largest source, contributing 21% ofUK emissions, followed by industry (14%) and other transport and machinery (10%).
NOx emissions and emission inventories

Nitrogen Dioxide in the United Kingdom
54
Table 2.4 UK emissions of NOx (ktonnes as NO2).
ktonnes NOx 1970 1980 1990 1991 1992 1993 1994 1995 1996 1997 1998 1999 2000
Public power 812 861 781 683 671 567 527 495 449 372 364 338 358
Industry 524 372 337 328 323 319 339 291 283 285 283 266 250
Domestic 62 64 64 71 69 72 69 66 75 69 71 71 72
Road transport 762 978 1286 1257 1208 1141 1111 1063 1062 1020 953 910 844
Other transport & machinery 241 220 220 224 218 212 199 194 204 197 187 176 169
Other 90 73 56 57 53 44 47 46 46 40 38 37 35
TOTAL 2490 2568 2744 2620 2543 2355 2290 2154 2120 1983 1897 1799 1728
Road transport – using old vehicle emission factors 1305 1274 1224 1147 1084 997 956 881 788 716 629
Totals submitted to UNECE 2763 2637 2558 2361 2263 2088 2014 1844 1732 1604 1512
Source: 2000 National Atmospheric Emissions Inventory. The road transport figures and emission totals shown in bold arebased on the latest set of vehicle emission factors which were not available at the time of formal submission of the UK 2000emission estimates to UNECE. The figures shown in italics are based on the old emission factors used for the UK submissionof the 2000 NAEI data.
159. Emissions have fallen steadily since their peak levels in 1989, with a reduction of around 38%since then. The decline has mainly been due to reductions in emissions from road transportand public power generation; these fell by 34% and 54%, respectively, from 1990 to 2000.The reductions in road transport emissions have been mainly due to the penetration of carsfitted with three-way catalysts in the fleet. Emissions from power stations were fairly constantin the 1970s, but have been declining since 1979. In the 1980s this was due to the increaseduse of nuclear power and an increase in average efficiency of thermal power stations. However,since 1988, the electricity generators have adopted a programme of progressively fitting low-NOx burners to their large coal-fired stations. The introduction of modern CCGT plant burningnatural gas in the early 1990s and the decreased share of coal for power generation in favourof gas, further reduced NOx emissions from this sector up until 1999. Emissions of low-NOxgas turbines are lower than those of pulverised coal fired plant even when these are fitted withlow-NOx burners. However, this trend was broken in 2000 when output from coal-fired stationsgrew again at the expense of nuclear power production. Further growth in electricity outputfrom coal-fired stations occurred in 2001, this time at the expense of gas possibly due toincreased price of natural gas supplies.
160. Emissions from industry have declined by 26% since 1990, again mainly due to the decline incoal use in favour of gas.
161. It should be noted that the figures in Table 2.4 are based on the latest vehicle emission factorswhich were not available at the time the 2000 reported version of the National AtmosphericEmissions Inventory (2000 NAEI) was compiled in 2002. Using the new vehicle emission factorsincreased the emission estimates for this sector due to the higher factors for Euro I and Euro IIdiesel vehicles than had been used previously (Section 2.6.2.1). Table 2.4 also shows the roadtransport emission estimates and total UK NOx emissions from 1990 to 2000 that werereported in the 2000 NAEI derived from the old vehicle emission factors (emissions from allother sectors are unchanged).

55
2.7.2 Temporal dependence of NOx emissions162. The emission figures shown in Table 2.4 refer to annual emission rates (ktonnes per year).
Emissions vary with time of day and, for some sectors, with time of year and day of the week.The temporal dependence of emissions of NOx and other O3 precursors has been estimated byJenkin et al. (2000) using the temporal activity profiles for key sectors like road transport andpower generation. For road transport, hourly and daily average traffic flow data were used,taken from the DfT’s Road Traffic Statistics publications. For power generation, hour of day andday of week profiles were based on activity data from the National Grid.
163. The diurnal variation in NOx emissions is particularly significant, reflecting the varying nature ofcombustion activity associated with industrial, domestic and transport activity during the courseof the day. Figure 2.6 shows the annual rates of NOx emissions for each hour of the day brokendown by sector. Emissions rise rapidly between 6 and 9am, remain fairly stable during thecourse of the day and fall off rapidly after 6pm. This diurnal behaviour is mainly because of theincrease in road traffic activity between 6am and 6pm, but increased domestic combustion andpower generation during the day time also contribute to the diurnal emission trends.
164. Emissions tend to be slightly lower in the summer months, owing to a decrease in thecontribution made by space heating. The emissions are substantially lower (20-30%) atweekends compared with weekdays, owing to reduced contributions from a number ofsources, but especially road transport. The results from this study were used by Jenkin et al.(2000; 2002) to model the formation of O3 along trajectories arriving at rural sites in the UKat different days of the week during the conditions of an O3 episode.
Figure 2.6 Diurnal variation in UK NOx emissions (from Jenkin et al. (2000)).
0
20
40
60
80
100
120
1:00
3:00
5:00
7:00
9:00
11:00
13:0
015
:0017
:0019
:0021
:00
23:00
NO
X e
mis
sion
s (k
Ton
ne)
Other sourcesPower generationDomestic combustionIndustry & processesRoad transport
NOx emissions and emission inventories
Nitrogen Dioxide in the United Kingdom
56
2.8 Spatially resolved inventories of NOx emissions
165. The NAEI produces national maps of NOx emissions for the UK. While these will not replacedetailed local inventories, they can provide a valuable basis from which a local inventory can bebuilt and validated. They can also be used in assessments required for national policy making.
166. This section outlines the methods used to map national emissions data from the NAEI. Thereare many examples of local inventories that have been developed for specific areas of the UK,but one of the most recent and comprehensive local inventory is the London AtmosphericEmission Inventory (LAEI). A comparison between mapped estimates of the LAEI and the NAEIis provided in this section as a means of illustrating the effects of the different spatial inventorymodelling approaches. Some indicative examples of the range of other local inventory activityin the UK are provided in this section.
2.8.1 The NAEI 1x1 km UK emission maps for NOx
167. The NAEI national emissions inventory for NOx is mapped over the UK on a 1x1 km grid. Figure2.7 shows the map for UK NOx emissions in 2000. Emissions are represented in tonnes of NOx(as NO2) per 1 km grid square. Details of the methods used for mapping emissions in the NAEIare given in Goodwin et al. (2001).
168. Sectors such as power stations, refineries and large industrial plant can be represented aspoint sources because their locations are known and reported emissions data or data toestimate emissions are available for the plant. Fuel consumption data for individual plants maybe used as a surrogate to distribute national emissions from industrial combustion if emissionsdata are not directly available.
169. Emissions from road transport, rail and shipping are represented by lines where data areavailable, while source sectors such as domestic and commercial combustion are treatedas areas. Emissions from road transport are mapped by treating major and minor roadsseparately. Major roads are treated as line sources using traffic flow data on road links in thenational road network recorded each year. The traffic flow data come from the DfT 3 yearrolling survey and the Annual Traffic Census Report for Northern Ireland. Emissions arecalculated on each link using emission factors, traffic flows for the different vehicle types andaverage speeds appropriate for the road or area type. Emissions are mapped according to theOrdnance Survey grid reference for the road link. Minor roads are treated as area sourcesbecause centralised traffic flow data are not available for these roads. Emissions on minorroads are estimated at a national level and then distributed using surrogates derived from OSminor road maps, land cover data and regional average traffic flows on these types of roads.
170. Emissions from rail are mapped using track and train kilometre data available for each rail link.UK shipping emission totals are distributed according to port areas and routes defined byshipping arrival data from DfT. Aircraft emissions are treated as area sources for the 1x1 kmgrids covering the airports where take-off and landing occurs. The methods incorporate airportemission estimates from the London Research Centre (LRC) urban inventory studies andaircraft emission estimates from the Heathrow Inventory study. The number of aircraftmovements at individual UK airports is used.
171. Emissions from domestic, small industrial and commercial combustion sources and off-roadvehicles and machinery are treated as area sources. National totals for these sectors aredistributed over the UK based on surrogate statistics represented in area grids. Area grids arecompiled from geographical statistical data available on land use, population and employment.

57
172. The emission map shown in Figure 2.7 is available on the NAEI website(www.naei.org.uk/index.php) where the user can extract emissions for a particular area.
173. The frequency distribution of NOx emission values is strongly positively skewed and it isimportant to note that a large fraction (around 30%) of the total emissions of NOx areconcentrated in a few grid squares which contain major combustion-related point sources.Road transport dominates total NOx emissions with around one-third of total NOx emissionsoccurring on major sections of road. Vehicles travelling at high speed contribute most and as aresult the major motorways and primary routes are clearly defined on the map. Conurbationsand city centres show high emissions resulting from large volumes of traffic, residential andcommercial combustion. A combination of relatively high national shipping emission estimatesand relatively few large ports result in significant localised emissions from shipping in port areas.
174. For a particular grid square, the difference in emissions derived from the national map and adetailed local inventory where available give a measure of uncertainty in the UK emission maps.
Figure 2.7 UK NOx emission map from the NAEI.
2000 NOx tonnes/1x1km
0–1
1–10
10–20
20–30
30–40
40–50
50–60
>60
No Data
NOx emissions and emission inventories

Nitrogen Dioxide in the United Kingdom
58
2.8.2 NOx emissions in London175. The London Atmospheric Emissions Inventory (LAEI) was developed for 1999 by the Greater
London Authority with Transport for London (TfL) and King’s College, London (GLA, 2002).Recognising the importance of traffic as a source of emissions in London, this inventory used agreat deal of detailed traffic activity data, but also other London-specific data for the inventorycovering an area within and including the M25.
2.8.2.1 Overview of the London Atmospheric Emissions Inventory
176. The methodology for estimating road transport emissions in the LAEI recognises the importanceof road traffic as a source of air pollution in London. Since, it is known that exceedences of airpollution objectives in London will increasingly be restricted to the near-road environment, theLAEI places considerable importance on the calculation of individual link emissions. It hastherefore been produced primarily with dispersion modellers in mind and as a source of data forair pollution modelling runs in London. London is also unique in the UK in many respects:
● It is the largest urban area in the UK;
● Road traffic emissions are relatively more important than in many other urban areas in theUK;
● London has a unique vehicle stock, for example, TfL buses and taxis;
● There is a considerable amount of information available from which calculations ofemissions can be made.
2.8.2.2 Calculating emissions from traffic in the LAEI
177. Most emphasis has been placed on observed manual counts of traffic in London, since theseare more reliable on a link-by-link basis than traffic models or ad-hoc measurements. However,it is strongly linked with the LTS traffic model to assist with future traffic scenarios for London,for example, redistribution of traffic as a result of road user charging.1 The LAEI uses countdata for 11 different vehicle categories including taxis.
178. The analysis of on-road vehicle age data highlights significant variations in vehicle age by roadtype in London compared to the UK fleet represented in the NAEI model. It was found that inLondon, there is a slightly newer vehicle stock on motorways on average and older vehiclestock on minor roads compared with the national fleet. This was therefore accounted for in theinventory, although the overall effect was very small. Further investigations will take place intothe age profiles of vehicles in London and will be included in future inventories.
179. The LAEI uses the same speed-dependent emission factors as the NAEI, but combines themwith realistic speeds in London. The current inventory uses detailed speed data from actualmeasurements of speed derived from the ‘floating-car’ technique (Roland, 1998).
180. London buses and taxis make an important contribution to traffic flows in London, particularlycentral London, and are therefore important contributors to local NOx emissions. Bus flow data forlinks were provided by DfT, but TfL Buses gave additional vehicle kilometre information (by locationin London) as well as vehicle technology profiles of the TfL bus fleet. The bus vehicle stock wasbroken into two parts, central London (defined by LTS) and other London stock representing allother locations in London. LT bus services were assumed to represent 90% of the bus vehicle
1 This feature is retained because traffic models can be very useful in suggesting the likely future distribution oftraffic, for example, greater growth in outer London compared with central London.

59
kilometres in London (TfL London Buses). Bus vehicle stock was then broken down by Euro classand included those vehicles fitted with an oxidation catalyst or particulate trap.
181. Taxi movements are important in London and particularly central London. Data relating to taxiactivity in London has been analysed from several different sources including count data fromLondon boroughs and specific studies in London concerned with taxi activity. Informationprovided by the Public Carriage Office enabled a specific breakdown of the taxi fleet by Euroclass, the number of alternatively fuelled vehicles in the fleet, and an estimate of vehicle stockturnover year-on-year. An analysis of these data suggested that in central London taxis madeup approximately 20% of the total car plus taxi total. In inner London the proportion wasassumed to be 4% and 1% in outer London.
2.8.2.3 Calculating emissions from non-traffic sources in the LAEI
182. These calculations have mostly been made by the GLA, based on the original LRC inventoryfor London. Some modifications have been made to update these emissions.
183. For Heathrow, the inventory compiled by AEA Technology has been used (Underwood andWalker, 1999). Any overlap in emissions with the rest of the LAEI, i.e. some road emissions,were removed from the Heathrow Inventory. Various simplistic reductions were applied tosome emission sources for future years.
184. Updates were also made to emissions of NOx from natural gas combustion (domestic,commercial and small industrial). These emissions were increased in line with projectedincreases in natural gas use in London. These projections suggest that natural gas usecontinues to increase significantly year-on-year in London.
2.8.2.4 Results from the LAEI in comparison with data for London from the NAEI
185. Table 2.5 shows the amount of NOx emitted in London calculated in the LAEI and thecontribution from road traffic. Also shown are the results from the NAEI UK emission mapsderived by putting a boundary around the M25, so including the same geographical area.The NAEI data refers to emissions in 2000, while the LAEI data is for 1999. It can be seen thatthe LAEI estimates 14% less NOx than the NAEI, but the contribution from road traffic is notso different in each inventory. The LAEI estimates 64.7 kt of NOx are emitted from traffic inLondon (in 1999); the figure from the NAEI is 73.0 kt (in 2000).
Table 2.5 Emissions of NOx in London. Comparison of data from the LAEI and the NAEI.The LAEI data are for 1999; the NAEI data are for 2000. Both inventories are based on thenew vehicle emission factors.
Total emissions % road transport % road transport in London emissions in emissions in UK(ktonnes) London
LAEI 1999 NAEI 2000 LAEI 1999 NAEI 2000 NAEI 2000
NOx 94.7 110.3 68.3 66.2 49
186. However, comparing results from the two inventories is complicated by the fact they refer todifferent years. According to the NAEI, urban UK road transport emissions in 1999 were 7.5%higher than in 2000 due to the lower proportion of vehicles meeting the latest Euro standardsin the fleet. If it is assumed this also applied to London, then the NAEI estimate for NOxemissions from road transport in London in 1999 would be 78.5 kt, an increase of 5.5 kt above
NOx emissions and emission inventories

Nitrogen Dioxide in the United Kingdom
60
2000 levels. If it is also assumed that emissions from other sources are unchanged from 1999to 2000, then an NAEI estimate for total NOx emissions in London in 1999 would be 115.8 kt.The LAEI estimate for 1999 would then be 18% lower than the NAEI estimate. However, thepercentage contribution from road traffic based on the NAEI estimate for 1999 would be67.8%, very close to the LAEI estimate.
187. Given the differences in the inventory approaches, with the LAEI using much more detailedand localised activity data than the NAEI map, the differences in emission estimates are notdisturbing. In both cases, the contribution from road transport is higher in London than it is forthe UK, as would be expected. It is worth noting that the road traffic contribution estimated forLondon of around 68% in 1999, is slightly down on the contribution previously estimated for1996 of around 75% in the inventory developed by London Research Centre (Buckinghamet al., 1998a). Comparing the LAEI and the earlier LRC inventory for London is complicatedby the fact that different vehicle emission factors were used in each inventory. However, asignificant drop in road transport emissions from 1996 to 1999 would have been expected dueto the fleet penetration of newer and cleaner vehicles, accompanied by smaller reductions inemissions from other sources. This would lead to a decline in the traffic contribution to overallNOx emissions in London. The LRC estimate for non-road transport emissions in London in1996 was 36.7 kt compared with the LAEI figure for 1999 of 30.0 kt.
188. The contributions of different sources to emissions in London in 1999 are compared with thecorresponding figures for the UK derived in the NAEI for the same year in Table 2.6. All theestimates are based on the new vehicle emission factors.
Table 2.6 Contribution of sources to NOx emissions in London and the UK in 1999.
% emissions in London % emissions in UK LAEI NAEI
Road transport 68 50
Domestic and 17 6commercial combustion
Industry and public power 8 34
Other transport 6 10
Other 1 0
189. It can be seen that road transport and domestic and commercial combustion make a muchbigger contribution to NOx emissions in London than they do in the UK as a whole, as wouldbe expected in a large conurbation. Industry and public power generation make a muchsmaller contribution to NOx emissions in London than in the UK due to the lack of majorindustrial combustion plant in London. It should be noted though that the LAEI and the NAEImake slightly different definitions in terms of what is classified as ‘commercial’ and ‘industrial’combustion processes, but this does not change the overall pattern of sector contributions toemissions shown in Table 2.6.
190. Figure 2.8 shows the contribution of road transport to total NOx emissions in each grid squarein London in 1999, according to the LAEI. It can be seen how much higher the contributionfrom traffic is to emissions in central London compared with outer parts of London, althoughthe relatively high emissions from important radial roads and the M25 orbital can also beclearly seen.

61
Figure 2.8 NOx emissions from road transport in London (1999).
191. The LAEI also addressed the contribution of traffic to emissions in central and Greater Londonseparately and also the contribution made by different vehicle types. Overall, traffic made asimilar (~60%) contribution to NOx emissions in both central (defined by the inner ring road) andGreater London, but the contribution from different vehicle types was different in each area. Incentral London, buses and taxis made a larger contribution to NOx emissions (~21% and 11%,respectively) than they did in London as a whole (7% and 1%), with a smaller proportion ofemissions coming from cars. The contribution from buses is significant in spite of the fact thatthe bus fleet in London is among the cleanest in the UK. Cars are responsible for nearly a halfof all NOx emissions from road transport in London, with around 40% coming from vans andHGVs. Figures 2.9 and 2.10 summarise the percentage contribution to total emissions byvehicle type in central London and all of London (up to and including the M25).
192. The geographic variation in emissions might have important consequences for how emissionsare expected to reduce. Section 2.6.2.1 showed that NOx emissions from diesel vehicles havebeen declining more slowly with the introduction of the tighter emission standards than hasbeen occurring with petrol vehicles. In central London, where there is a high proportion ofdiesel buses and taxis, the decline in emissions of NOx in this area will not be as significantcompared with other locations in London.
193. Any further emission inventories compiled for London would need to consider the effect of therecently introduced congestion charging scheme on traffic emissions. A report ‘Road ChargingOptions for London: A Technical Assessment’ was published in 2000 and concluded that theoverall air quality benefits from fewer private cars would be offset by the impact of largernumbers of heavy duty vehicles. This assessment would need to be verified using real trafficflow data in the areas effected once the scheme has been operating long enough. Similarly,current work has investigated the potential emission benefits of a London Low Emission Zoneof the type discussed earlier, restricting access to low emitting vehicles (see the London LEZwebsite, www.london-lez.org). However, emission inventories developed for London in thefuture would be able to show the actual benefits a scheme has had on emissions using actualtraffic flow data available once the scheme has been implemented.
NOx emissions t/annum
0 – 10
10 – 30
30 – 50
50 – 100
100 – 200
GLA
NOx emissions and emission inventories
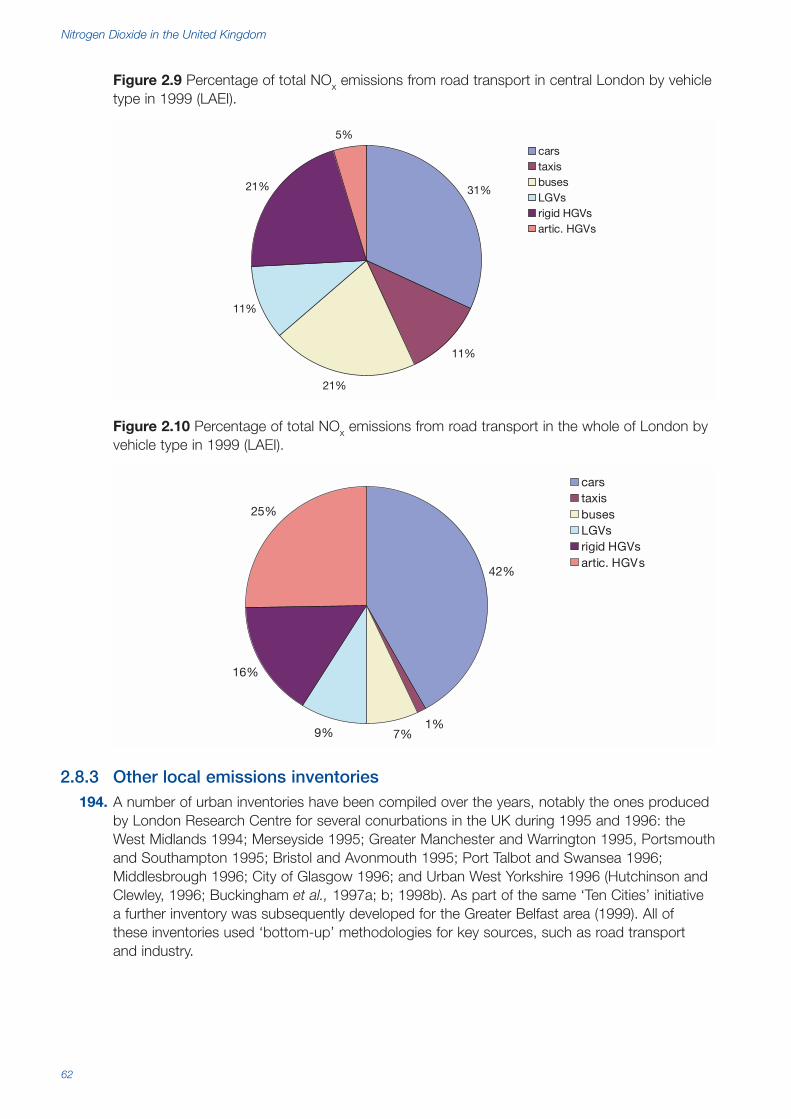
Nitrogen Dioxide in the United Kingdom
62
Figure 2.9 Percentage of total NOx emissions from road transport in central London by vehicletype in 1999 (LAEI).
Figure 2.10 Percentage of total NOx emissions from road transport in the whole of London byvehicle type in 1999 (LAEI).
2.8.3 Other local emissions inventories194. A number of urban inventories have been compiled over the years, notably the ones produced
by London Research Centre for several conurbations in the UK during 1995 and 1996: theWest Midlands 1994; Merseyside 1995; Greater Manchester and Warrington 1995, Portsmouthand Southampton 1995; Bristol and Avonmouth 1995; Port Talbot and Swansea 1996;Middlesbrough 1996; City of Glasgow 1996; and Urban West Yorkshire 1996 (Hutchinson andClewley, 1996; Buckingham et al., 1997a; b; 1998b). As part of the same ‘Ten Cities’ initiativea further inventory was subsequently developed for the Greater Belfast area (1999). All ofthese inventories used ‘bottom-up’ methodologies for key sources, such as road transportand industry.
42%
1%7%9%
16%
25%
carstaxisbusesLGVsrigid HGVsartic. HGVs
31%
11%
21%
11%
21%
5%carstaxisbusesLGVsrigid HGVsartic. HGVs
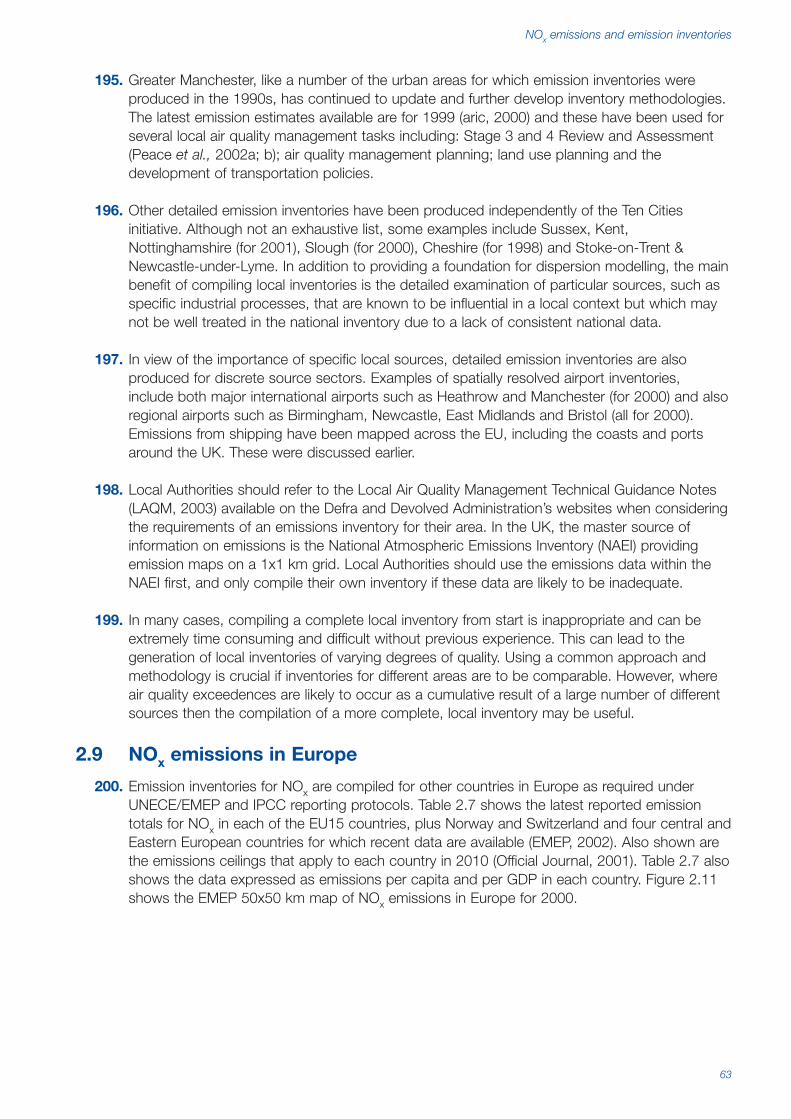
63
195. Greater Manchester, like a number of the urban areas for which emission inventories wereproduced in the 1990s, has continued to update and further develop inventory methodologies.The latest emission estimates available are for 1999 (aric, 2000) and these have been used forseveral local air quality management tasks including: Stage 3 and 4 Review and Assessment(Peace et al., 2002a; b); air quality management planning; land use planning and thedevelopment of transportation policies.
196. Other detailed emission inventories have been produced independently of the Ten Citiesinitiative. Although not an exhaustive list, some examples include Sussex, Kent,Nottinghamshire (for 2001), Slough (for 2000), Cheshire (for 1998) and Stoke-on-Trent &Newcastle-under-Lyme. In addition to providing a foundation for dispersion modelling, the mainbenefit of compiling local inventories is the detailed examination of particular sources, such asspecific industrial processes, that are known to be influential in a local context but which maynot be well treated in the national inventory due to a lack of consistent national data.
197. In view of the importance of specific local sources, detailed emission inventories are alsoproduced for discrete source sectors. Examples of spatially resolved airport inventories,include both major international airports such as Heathrow and Manchester (for 2000) and alsoregional airports such as Birmingham, Newcastle, East Midlands and Bristol (all for 2000).Emissions from shipping have been mapped across the EU, including the coasts and portsaround the UK. These were discussed earlier.
198. Local Authorities should refer to the Local Air Quality Management Technical Guidance Notes(LAQM, 2003) available on the Defra and Devolved Administration’s websites when consideringthe requirements of an emissions inventory for their area. In the UK, the master source ofinformation on emissions is the National Atmospheric Emissions Inventory (NAEI) providingemission maps on a 1x1 km grid. Local Authorities should use the emissions data within theNAEI first, and only compile their own inventory if these data are likely to be inadequate.
199. In many cases, compiling a complete local inventory from start is inappropriate and can beextremely time consuming and difficult without previous experience. This can lead to thegeneration of local inventories of varying degrees of quality. Using a common approach andmethodology is crucial if inventories for different areas are to be comparable. However, whereair quality exceedences are likely to occur as a cumulative result of a large number of differentsources then the compilation of a more complete, local inventory may be useful.
2.9 NOx emissions in Europe
200. Emission inventories for NOx are compiled for other countries in Europe as required underUNECE/EMEP and IPCC reporting protocols. Table 2.7 shows the latest reported emissiontotals for NOx in each of the EU15 countries, plus Norway and Switzerland and four central andEastern European countries for which recent data are available (EMEP, 2002). Also shown arethe emissions ceilings that apply to each country in 2010 (Official Journal, 2001). Table 2.7 alsoshows the data expressed as emissions per capita and per GDP in each country. Figure 2.11shows the EMEP 50x50 km map of NOx emissions in Europe for 2000.
NOx emissions and emission inventories
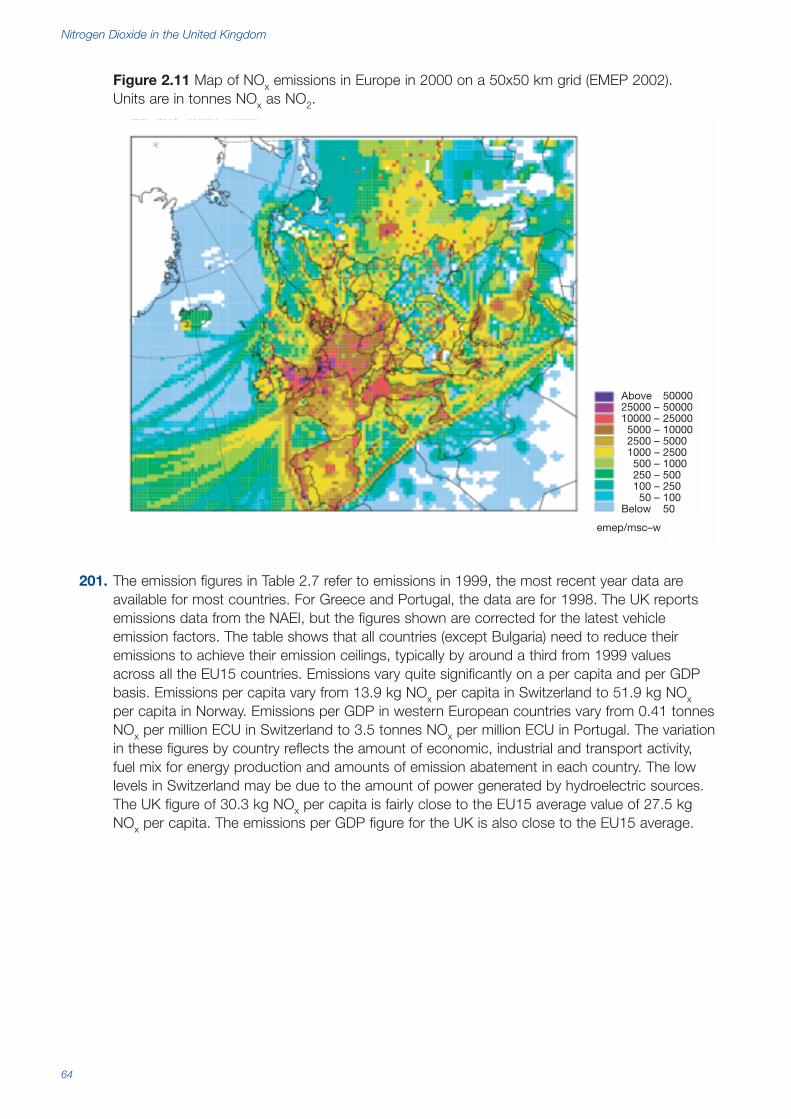
Nitrogen Dioxide in the United Kingdom
64
Figure 2.11 Map of NOx emissions in Europe in 2000 on a 50x50 km grid (EMEP 2002).Units are in tonnes NOx as NO2.
201. The emission figures in Table 2.7 refer to emissions in 1999, the most recent year data areavailable for most countries. For Greece and Portugal, the data are for 1998. The UK reportsemissions data from the NAEI, but the figures shown are corrected for the latest vehicleemission factors. The table shows that all countries (except Bulgaria) need to reduce theiremissions to achieve their emission ceilings, typically by around a third from 1999 valuesacross all the EU15 countries. Emissions vary quite significantly on a per capita and per GDPbasis. Emissions per capita vary from 13.9 kg NOx per capita in Switzerland to 51.9 kg NOxper capita in Norway. Emissions per GDP in western European countries vary from 0.41 tonnesNOx per million ECU in Switzerland to 3.5 tonnes NOx per million ECU in Portugal. The variationin these figures by country reflects the amount of economic, industrial and transport activity,fuel mix for energy production and amounts of emission abatement in each country. The lowlevels in Switzerland may be due to the amount of power generated by hydroelectric sources.The UK figure of 30.3 kg NOx per capita is fairly close to the EU15 average value of 27.5 kgNOx per capita. The emissions per GDP figure for the UK is also close to the EU15 average.
Above 5000025000 – 50000 10000 – 25000 5000 – 10000 2500 – 5000 1000 – 2500 500 – 1000 250 – 500 100 – 250 50 – 100 Below 50
emep/msc–w

65
Table 2.7 Emissions of NOx in Europe
NOx emissions Emissions Emissions Emissions/ % emissions % emissions (ktonnes as NO2) ceilings for per capita GDP (tonnes/ from road from energy in 1999 2010 (ktonnes (kg/capita) million ecu) transport production
as NO2) sector sector
Austria 172 103 21.3 0.87 50 5Belgium 291 176 28.5 1.24 51 12Denmark 210 127 39.6 1.27 33 27Finland 247 170 47.8 2.05 46 13France 1533 810 26.0 1.14 47 9Germany 1637 1051 20.0 0.83 51 15Greece 382 344 36.3 3.26 27 20Ireland 119 65 31.7 1.33 42 33Italy 1486 990 25.8 1.34 50 13Luxembourg 16 11 37.5 0.87 42 1Netherlands 409 260 25.9 1.09 42 12Portugal 381 250 38.2 3.52 43 43Spain 1379 847 35.0 2.44 - -Sweden 261 148 29.5 1.15 42 5United Kingdom 1799 1167 30.3 1.31 51 19
EU 15 10321 6519 27.5 1.29 41 13
Norway 231 156 51.9 1.60 24 12Switzerland 99 79 13.9 0.41 54 1
Bulgaria 203 266 25.3 - 26 31Czech republic 391 286 38.0 - 43 21Hungary 221 198 22.1 - 52 22Poland 953 879 24.7 - 30 28
Emissions data are from EMEP (2002) and are for 1999, except for Greece and Portugal which are for 1998. The figures forthe UK are taken from the NAEI, but corrected for the latest vehicle emission factors.Emissions ceilings for all the EU15 countries are the NECD ceiling levels (Official Journal, 2001). For all other countries, theceilings refer to limits agreed under the Gothenburg Protocol (UNECE, 1999)
202. It is also interesting to look at the breakdown in NOx emissions by sector in each country.These are shown in Table 2.7 for the main sectors of emissions from road transport and energyproduction. Again, there is fairly significant variation in the sectorial split. For most countries inwestern Europe, the contribution made by road transport is in the region 40-50%, althoughthere are some outliers like Denmark, Greece and Norway where the contributions are lower(33%, 27% and 24%, respectively). The contribution from the energy production sector isfar more variable, probably reflecting the fuel mix and levels of emission abatement used forpower generation, as well as variable contributions from other sectors, for example, industrialcombustion. Particularly low contributions to emissions from power generation in Austria andSwitzerland are probably due to the amount of power generated by hydroelectric sources,while low levels in France may reflect the use of nuclear energy for power generation.
2.10 Uncertainties in emission estimates
203. An appreciation of the uncertainties in emission estimates is important for different reasons,depending on the geographical scale of the inventory, detail in the emission sector split andintended application of the inventory results. For a particular area, an inventory is usuallyreported as tonnes emitted over a certain period of time, normally a calendar year. An inventory
NOx emissions and emission inventories
Nitrogen Dioxide in the United Kingdom
66
calculated for more than one year is useful because it demonstrates how emissions have beenchanging over a period of time. Such emission trends demonstrate the effectiveness of nationalor local policies in curbing emissions. However, emissions calculated over more than one yearcan only be interpreted if the uncertainties in the estimates for each year can be understood.For example, emissions calculated for two different years may be different because emissionsreally have changed; or because new sources were found in the inventory for the second yearwhich were missing from the inventory for the first; or because different methodologies wereused in calculating them. An uncertainty analysis would help to demonstrate whether anychanges in emissions between years were significant.
204. In the NAEI, a complete time series of UK emissions from 1970 to the most recent year thatdata are available are calculated each year. In other words, emissions from earlier years arerecalculated each year. This may lead to changes in historic emission estimates due to newemission factors becoming available, new emission calculation methodologies being used orchanges to national activity statistics (for example, fuel consumption) in earlier years being madeby government or industry sources. However, this does mean that emissions calculated for astream of different calendar years in a particular inventory compilation are comparable and theemission trends probably robust. In the NAEI, it is possible that relative changes in emissionseach year shown in a particular year’s inventory are more accurate than the absolute emissionrates in tonnes.
205. Local inventories are generally more difficult to calculate than the national figures because theyhave to rely on different sources of information which are generally more uncertain, incompleteor difficult to obtain. They are not generally calculated every year and emissions in an area ina previous year are not usually recalculated when an inventory for a new year is compiled.Because of this, inventories compiled at different times for a particular area covering differentcalendar years may not be comparable. New sources may be discovered and methodologiesimproved for the more recent inventory. An uncertainty analysis for each inventory would helpto put this into context.
206. The uncertainties in emission estimates need to be quantified at different geographical levelsand different levels of sector detail. The results are required for different purposes. Uncertaintyestimates for the national totals are required for interpreting the effect of national policies onemission trends and for appreciating the emission levels in the context of national emissiontargets and emissions ceilings (for example, the NECD targets).
207. Uncertainties in emissions from individual sectors may be quite different to the overalluncertainties in the national totals, but may still be required when considering the direction ofgovernment policies towards specific sectors, for example, power station emissions, roadtransport emissions and emissions from specific vehicle types.
208. Uncertainties in emissions in local areas are of more consequence to air quality modelling oflocal pollutant concentrations than uncertainties in the national totals and they will usually be ofgreater magnitude. Uncertainties in local inventories are affected by different factors to thoseaffecting uncertainties in the national inventory estimates. For example, the national emissionestimates are often based on national statistics like fuel consumption which are generally quitereliable. Local inventories require more local knowledge on activity drivers, which, while moredetailed, may be considerably more uncertain than national figures. The inventories are alsoaffected by knowledge of emission location and GIS mapping techniques.
209. This section considers levels of uncertainties in the national totals, in individual sectors and inlocal inventories and issues relating to methods for estimating them.

67
2.10.1 Uncertainties in national emission estimates210. Quantifying the uncertainties in the national NOx emission estimates helps to prioritise future
work by pointing to those areas where further information is required to improve the reliabilityof the inventory. The National Atmospheric Emissions Inventory has made a detailed andquantified assessment of the uncertainties in the national emission estimates for NOx andother pollutants in 2000 using a direct simulation approach (Passant, 2003).
211. The procedure used corresponds to the IPCC Tier 2 approach discussed in the Good PracticeGuidance (IPCC, 2000), as well as the Tier 2 method proposed in the draft ‘Good PracticeGuidance for CLRTAP Emission Inventories’, produced for inclusion in the EMEP/CORINAIRGuidebook on Emission Inventories. The same approach has also been applied to the UKgreenhouse gas inventory (Salway et al., 2001) and has been described in detail by Charleset al. (1998).
212. In the approach used, an uncertainty distribution was allocated to each emission factor andeach activity rate. The distribution types used were drawn from a limited set of either uniform,normal, triangular, beta, or log-normal. The parameters such as mean value, standard deviationetc. of the distributions for each emission factor or activity rate were set either by analysing theavailable data on emission factors and activity data or by expert judgement. A calculation wasset up to estimate the emission of each pollutant by sampling individual data values from eachof the emission factor and activity rate distributions on the basis of probability density andevaluating the resulting emission. Using a Monte Carlo type software tool, this process couldbe repeated many times in order to build up an output distribution of emission estimates bothfor individual sources but also for total UK emissions of each pollutant. The mean value foreach emission estimate and the national total was recorded, as well as the standard deviationand the 95% confidence limits.
213. Uncertainties in the emission estimates arise from uncertainty in both the emission factor andactivity rate used in the calculations. In some cases, emission estimates are supplied directlyby process operators or regulators (for example, the Pollution Inventory) and are converted intoan overall emission factor using national activity data. In this case, the uncertainty in the activitydata is ignored and an uncertainty distribution is selected for the emission factor reflecting theuncertainty in the supplied emission estimate. Where this is not known, there is a need toimprove the understanding of uncertainties in emissions data provided directly by industry orregulators.
214. An important assumption made in this statistical approach for estimating uncertainties in nationalemissions is that uncertainties in each source are not correlated. If there are cross-correlations inemission estimates for different sources, the analysis becomes much more complex.
215. Fuel consumption is one of the main activity datasets used. The uncertainties and distributionparameters in these were taken from Salway et al. (2001) and were based on data from DTI.However, the main sources of uncertainty in emission estimates are in the emission factorsused rather than the fuel consumption data. Uncertainty estimates for these are largely basedon expert judgement, guided by the range in emission factors given by literature sources andelsewhere. Industrial trade associations and industrial process operators provided a final sourceof expert opinion. The report by Barlow et al. (2001) provided an indication of the range ofmeasured emission factors for road vehicles.
216. Uncertainties in UK road transport emissions were based on estimated levels of uncertainty inthe emission factor for each category of vehicle and in the vehicle kilometre activity data used.For NOx, the emission factor uncertainties used ranged from 25% for non-catalyst petrol cars
NOx emissions and emission inventories
Nitrogen Dioxide in the United Kingdom
68
to 60% for heavy duty diesel vehicles, all at the 95% confidence level. These largely reflectthe scatter in the emission factor results at different vehicle speeds which were statisticallyinterpreted in the report by Barlow et al. (2001). It is assumed that the vehicles tested arerepresentative of those in the UK fleet. However, the changes in the latest set of vehicleemission factors, discussed in Section 2.6.2.1, from earlier figures that were used in the NAEI,are consistent with the emission factor uncertainty estimates used in this analysis. Uncertaintiesin the national vehicle kilometre figures were estimated to be 5–10% for each vehicle category.Road tunnel exhaust measurements can be used to validate vehicle exhaust emission modelsand provide further insight into levels of uncertainties in road transport emission estimates(Sjodin and Cooper, 2001).
217. As a consequence of the way uncertainties in emissions from different sources overlap andcancel out in this type of statistical procedure, the uncertainty in total UK emissions are smallerthan might be expected from the levels of uncertainties in emission factors and activity data forindividual sources. The analysis gave an overall uncertainty in UK emissions from road transportof 12% (95% confidence limit). For power stations, the overall uncertainty estimate in UKemissions was 10% and for domestic combustion 17%.
218. The overall uncertainty in the annual total for UK NOx emissions (all sources) in 2000 wasestimated to be 7% at the 95% confidence level for the mean value emission figure of 1512ktonnes (using the old vehicle emission factors). The relatively low uncertainty is a result ofstatistical interpretation of the contributions from the main emission sources each withmoderately high uncertainties and a degree of cancelling out.
219. The uncertainty estimate quoted here only refers to uncertainty in the national annual emissiontotals, not to emissions from particular sources. It also does not reflect uncertainties inemissions at a particular time or location. However, it is worth noting that IIASA concluded avery similar level of uncertainty (±10%) in their independently-derived estimate of UK emissionsof NOx using a similar statistical approach (Suutari et al., 2001).
220. Uncertainties in UK emissions for all other air quality pollutants were estimated and found to behigher than the 7% figure for NOx. The exception was for SO2 which had an estimated level ofuncertainty in UK emissions of ±3%.
221. A ‘key source’ analysis was also undertaken following IPCC Tier 2 methodology to identify themajor contributors to inventory uncertainty (Passant, 2003). Key sources will often, but notalways, be those sources which contribute most to national emissions. For NOx, a number ofkey sources were identified. These were:
● Road vehicle emissions
● Domestic and industrial gas consumption
● Cement production
● Use of coal and landfill gas for electricity generation
● Off-road vehicles and machinery
● Gas oil consumption for coastal shipping
● Offshore oil and gas installations
222. The results of the uncertainty analysis apply to the estimates for the year 2000 only. An issue toconsider is that since emissions are believed to be declining from many sectors as a results oflegislation, it is vital that the emission factors and other data used in the NAEI are updated

69
regularly to reflect any reductions in emissions that are occurring. This will require continuousand detailed research be carried out to provide evidence for any reductions, thereby allowingthe emission factors used for the annual NAEI emission estimates to continue being up-to-date. A case in point is the road transport emission factors.
223. The statistical method used in the uncertainty analysis is useful for investigating the likelyimpact of uncertainties in emission estimates. However, it is not helpful for identifying missingsources in the inventory and the impact this has on uncertainties. A few sources of NOxemissions not currently included in the NAEI have been identified in Passant (2003), but noneof these are considered significant. These included emissions from natural and accidental fires;chemical waste incineration; and flares at refineries, chemical sites and landfills. Estimates forthese sources will nevertheless be added to the NAEI over the next few years.
224. The uncertainties in inventories are a reflection of the quality and quantity of data which areobtained when compiling the inventory. The current approach for analysing uncertainty in theinventory allows the most critical parameters to be identified, thus priority areas for researchcan be set and the national inventory improved in the most cost-effective way.
2.10.1.1 Uncertainty in local emission estimates and emission mapping
225. Although there has been some progress in making a quantitative assessment of uncertainty innational emission estimate totals and for individual source categories, the production ofstatistical error estimates on spatially resolved inventories is still problematic. The most robustuncertainty estimates would account for uncertainty in activity data, emission factors, theassumptions required to apply emission factors and the spatial data used to represent sources.There are several aspects of spatial data quality to be taken into account such as positionalaccuracy, logical consistency, completeness and temporal accuracy. As with any other sourceof data, the spatial data that are used in an inventory project will influence the results obtained,for example, through varying road lengths or influencing the accuracy with which sources arelocated. This is particularly important where data are to form an input into dispersion modellingactivities.
226. In addition to classical statistical uncertainty tests, there are various verification techniques thatcan be undertaken to help assess the reliability of inventory data. These include clear andtransparent documentation of data and procedures; basic quality checks through crossreference with other sources; comparison with alternative inventories and ground truthverification. A comparison of two spatially resolved inventories for the Greater Manchester andWarrington areas, one produced by the London Research Centre (Buckingham et al., 1997a)and the other as a research project, indicated broad agreement in overall totals. Despite somemethodological and source data differences, estimates were within ~12% for road transportsources (47.5 ktonnes (LRC) compared to 42.2 ktonnes (Lindley et al., 1996)) and ~21% for allsources (75.4 ktonnes (LRC) compared to 62.3 ktonnes (Lindley et al., 1996)). The nominalbase years were 1995 (LRC) and 1994 (Lindley et al., 1996) which will have accounted forsome of the differences in emission totals and their spatial distribution and it should be notedthat the LRC inventory covered a wider range of sources in total. Figure 2.12 illustrates thedifferences in the spatial distributions of emissions which were found to be due to differencesin spatial data sources, completeness and consistency (Lindley et al., 2000).
227. The comparison between the emission estimates for London from the LAEI and the NAEI mapsalso give a measure of uncertainties in an inventory for a local area based on the inventorytechnique used: ‘top-down’ or ‘bottom-up’. Overall NOx emission estimates for London in theLAEI are 18% lower than the ‘top-down’ estimates of the NAEI for the same inventory year(Section 2.8.2.4).
NOx emissions and emission inventories

Nitrogen Dioxide in the United Kingdom
70
228. One can also consider uncertainty in NOx emissions on individual road links, again using aMonte Carlo analysis, where the range of speeds is taken into account. Consider theuncertainty in emissions for a typical traffic flow of 1000 vehicles per hour along a 1 km lengthof road, with a heavy duty vehicle mix of 10%. To illustrate this and assuming uncertainties invehicle flow, speed and emission factors of ±10%, ±6 kph and ±15-25% (light and heavy-dutyvehicles), respectively, the road link emissions have a calculated uncertainty of ±16% for anaverage speed of 30 kph. For an average speed of 15 kph, the road link emissions have acalculated uncertainty of ±28%. The relative uncertainty in emissions is considerably greaterfor lower vehicle speeds, as expected from the shape of the speed-emission curves whichshow emissions rising steeply at low speeds. This highlights the importance of good vehiclespeed estimates.
229. This simple uncertainty analysis illustrates that the uncertainty in individual road link emissionsis significant when the potential range of vehicle speeds and driving patterns are considered.
Figure 2.12 Comparison of the results from two spatially resolved emissions inventories forGreater Manchester and Warrington (a) London Research Centre (Buckingham et al., 1997a)(b) North West emissions inventory (Lindley et al., 2000).
LegendLRC inventory (Tonnes of NOx)
> 50
30 – 49.9
20 – 29/9
5 – 19.9
< 5
LegendAlternative inventory (Tonnes of NOx)
> 50
30 – 49.9
20 – 29/9
5 – 19.9
< 5
LegendDifference in estimates (Tonnes of NOx)
> 40
20 – 39.9
0 to 19.9
0 to -19.9
-20 to -39.9
< -40
(b) Extract from an alternative local inventory
(c) Difference in estimates at the 1 x 1 km grid square resolution
(a) Local emissions inventory produced by the London Research Centre
0 10 20 30 405
, & $

71
2.11 NOx emission projections
2.11.1 UK emission projections230. The NAEI provides projections in UK emissions of all the major air quality pollutants by source
sector. The projections are based on a number of different activity drivers, the most commonone being fuel consumption forecasts for many of the sectors. Account is also taken ofemissions legislation, fuel quality directives, abatement technology penetration and otherfactors which are likely to affect unit emissions. For road transport, a fairly detailed emissionforecasting approach is used, adopting the latest traffic forecasts reflecting current Governmentpolicies on transport, fleet turnover and the penetration of vehicles meeting the tougherEuropean vehicle emission Directives and the impact these will have on emissions fromin-service vehicles.
231. The national projections are used by the Government to check against progress in achievingagreed emission reductions targets (for example, the National Emissions Ceiling Directive) andalso in development of national strategies and policies. The emission projections are used forlocal air quality Review and Assessments.
2.11.1.1 Assumptions for non-traffic sources
232. For most of the sectors other than road transport, the main activity driver is forecasts in fuelconsumption according to the central growth/high fuel price scenario in Energy Paper 68(EP68), provided by the DTI. These estimates incorporate an assumed growth in economicactivity of about 2.5% per year and the continuation of current trends towards greater use ofnatural gas and cleaner technologies (DTI, 2000). Industrial production activity projections fromEP68 are also taken into account.
233. The projections take account of the impact, on emissions, of abatement in the electricity supplyindustry from EP68, the impact of the Large Combustion Plant Directive and improvements inefficiency in the cement industry and refineries.
2.11.1.2 Assumptions for road transport
234. The base emission projections for road transport are currently from a 2000 base year and arecalculated from a combination of road traffic activity projections and knowledge of theexpected emission characteristics of the vehicle fleet in the future.
235. The changes in emission factors for vehicles in the projections are largely driven by thelegislative emission standards set in the European Directives for Euro III and Euro IV vehiclesapplying to conventional petrol and diesel powered vehicles. This means that no furtherimprovements in new vehicle emissions occur beyond the limits set for introduction in 2006 forlight duty vehicles and 2008 for heavy duty vehicles. In other words, the penetration ofadvanced vehicle types and technologies currently under development, such as fuel cell,hybrids and other electric powered vehicles are not considered in the base projections, neitherare alternative fuels such as CNG.
236. Table 2.2 provided the vehicle emission factors for Euro III and Euro IV vehicles, based onscaling factors assumed to apply across all speeds relative to emission factors for Euro IIvehicles. The basis for these factors was discussed in Section 2.6.2.1. In addition to this, theimpact of current vehicles in the fleet (pre-2000 standards up to Euro II) running on ultra-lowsulphur fuels meeting the 2005 Fuel Quality standards was accounted for. This grade of fuel isalready widely available in the UK, but the effect on NOx emissions (from 500 ppm to 50 ppm
NOx emissions and emission inventories
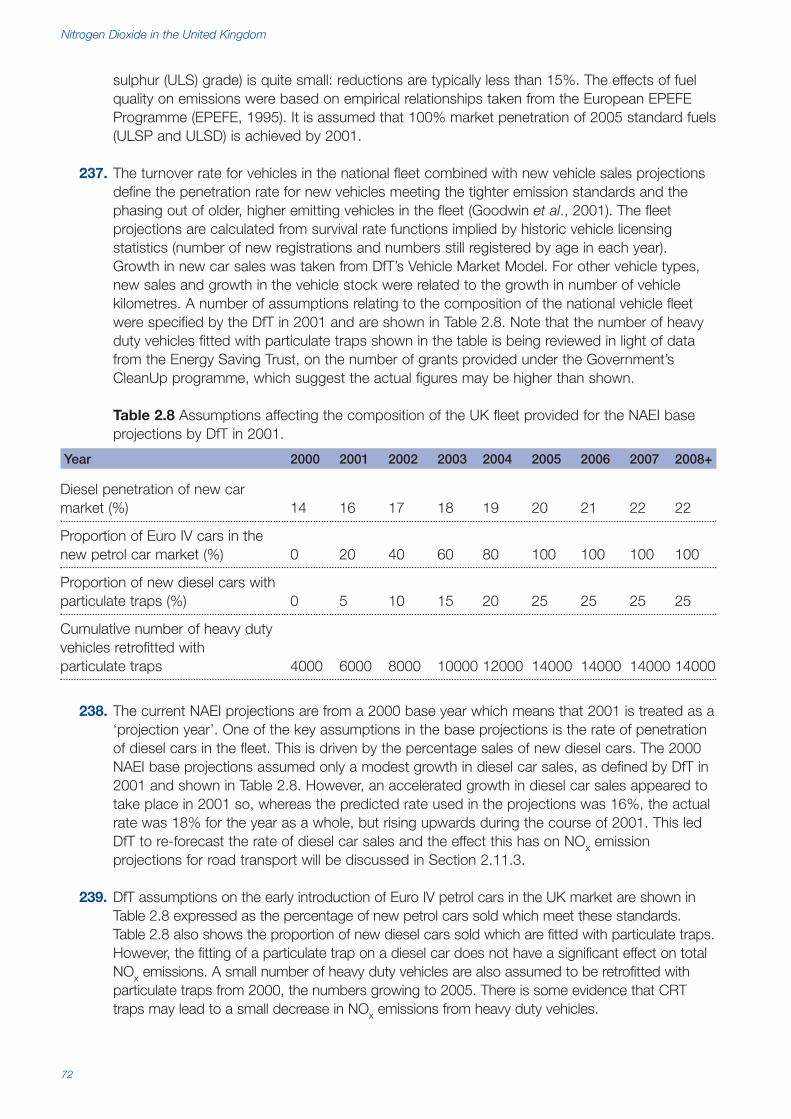
Nitrogen Dioxide in the United Kingdom
72
sulphur (ULS) grade) is quite small: reductions are typically less than 15%. The effects of fuelquality on emissions were based on empirical relationships taken from the European EPEFEProgramme (EPEFE, 1995). It is assumed that 100% market penetration of 2005 standard fuels(ULSP and ULSD) is achieved by 2001.
237. The turnover rate for vehicles in the national fleet combined with new vehicle sales projectionsdefine the penetration rate for new vehicles meeting the tighter emission standards and thephasing out of older, higher emitting vehicles in the fleet (Goodwin et al., 2001). The fleetprojections are calculated from survival rate functions implied by historic vehicle licensingstatistics (number of new registrations and numbers still registered by age in each year).Growth in new car sales was taken from DfT’s Vehicle Market Model. For other vehicle types,new sales and growth in the vehicle stock were related to the growth in number of vehiclekilometres. A number of assumptions relating to the composition of the national vehicle fleetwere specified by the DfT in 2001 and are shown in Table 2.8. Note that the number of heavyduty vehicles fitted with particulate traps shown in the table is being reviewed in light of datafrom the Energy Saving Trust, on the number of grants provided under the Government’sCleanUp programme, which suggest the actual figures may be higher than shown.
Table 2.8 Assumptions affecting the composition of the UK fleet provided for the NAEI baseprojections by DfT in 2001.
Year 2000 2001 2002 2003 2004 2005 2006 2007 2008+
Diesel penetration of new car market (%) 14 16 17 18 19 20 21 22 22
Proportion of Euro IV cars in the new petrol car market (%) 0 20 40 60 80 100 100 100 100
Proportion of new diesel cars with particulate traps (%) 0 5 10 15 20 25 25 25 25
Cumulative number of heavy duty vehicles retrofitted with particulate traps 4000 6000 8000 10000 12000 14000 14000 14000 14000
238. The current NAEI projections are from a 2000 base year which means that 2001 is treated as a‘projection year’. One of the key assumptions in the base projections is the rate of penetrationof diesel cars in the fleet. This is driven by the percentage sales of new diesel cars. The 2000NAEI base projections assumed only a modest growth in diesel car sales, as defined by DfT in2001 and shown in Table 2.8. However, an accelerated growth in diesel car sales appeared totake place in 2001 so, whereas the predicted rate used in the projections was 16%, the actualrate was 18% for the year as a whole, but rising upwards during the course of 2001. This ledDfT to re-forecast the rate of diesel car sales and the effect this has on NOx emissionprojections for road transport will be discussed in Section 2.11.3.
239. DfT assumptions on the early introduction of Euro IV petrol cars in the UK market are shown inTable 2.8 expressed as the percentage of new petrol cars sold which meet these standards.Table 2.8 also shows the proportion of new diesel cars sold which are fitted with particulate traps.However, the fitting of a particulate trap on a diesel car does not have a significant effect on totalNOx emissions. A small number of heavy duty vehicles are also assumed to be retrofitted withparticulate traps from 2000, the numbers growing to 2005. There is some evidence that CRTtraps may lead to a small decrease in NOx emissions from heavy duty vehicles.

73
240. In addition to these, the following assumptions are made concerning the introduction of newvehicle emission standards:
Petrol cars:Euro III (98/69/EC) – 10% in 2000 (balance are Euro II’s)Euro IV (98/69/EC) – as in Table 2.8; balance from 2001 are Euro III
Diesel cars:Euro III (98/69/EC) – 10% in 2000 (balance are Euro II’s). 100% from 1 January 2001 to 2005Euro IV (98/69/EC) – 100% from 1 January 2006
LGVs (petrol and diesel):Euro III (98/69/EC) – 100% from 1 January 2002 (2001 for small LGVs)Euro IV (98/69/EC) – 100% from 1 January 2006
HGVs and buses:EURO III (1999/96/EC) – 100% FROM 1 OCTOBER 2001Euro IV (1999/96/EC) – 100% from 1 October 2006 (standards for NOx introduced in 2 stages,second stage from 1 October 2008)
Motorcycles:97/24/EC – 100% from 1 January 2000
All these assumptions are factored into the fleet composition data.
241. The other key driver in the road transport emission projections is the growth in traffic activity.The growth in UK vehicle kilometres is forecast from 2000 for each vehicle, road and urbanarea type, using separate forecasts for traffic in England, Scotland, Wales and N Ireland.A combination of data sources are used, including the Ten Year Plan for Transport ‘Plan’scenario (DETR, 2000b), the 1997 version of the National Road Traffic Forecasts fromDfT and the Central Scotland Transport Model (CSTM3) from the Scottish Executive.
2.11.1.3 Baseline NOx emission projections for road transport
242. Tables showing UK and urban UK road transport emissions from 1990 to 2025 by vehicle typeare provided in the Technical Annexe to this report (Appendix 1). All the figures are based onthe new vehicle emission factors (not originally used for the 2000 NAEI base inventory, seesection 2.7.1) and are projections from the year 2000.
243. Figure 2.13 demonstrates the trends in urban UK road transport emissions by vehicle type from1970 to 2025. NOx emissions from road transport are expected to continue to decline from2000 until around 2015, due to the penetration of cleaner vehicles of all types in the fleet. After2015, without any further improvements in vehicle emissions beyond those required by theEuro IV standards, emissions start to rise again as the continued growth in traffic starts tooffset the gains achieved by penetration of cleaner vehicles in the fleet. Passenger cars are thedominant source of road transport emissions in 2000 contributing to 49% of road transportemissions nationally and 62% in urban areas. This dominance continues although it is slightlyreduced to 44% of road transport emissions nationally and 57% in urban areas by 2010.
NOx emissions and emission inventories
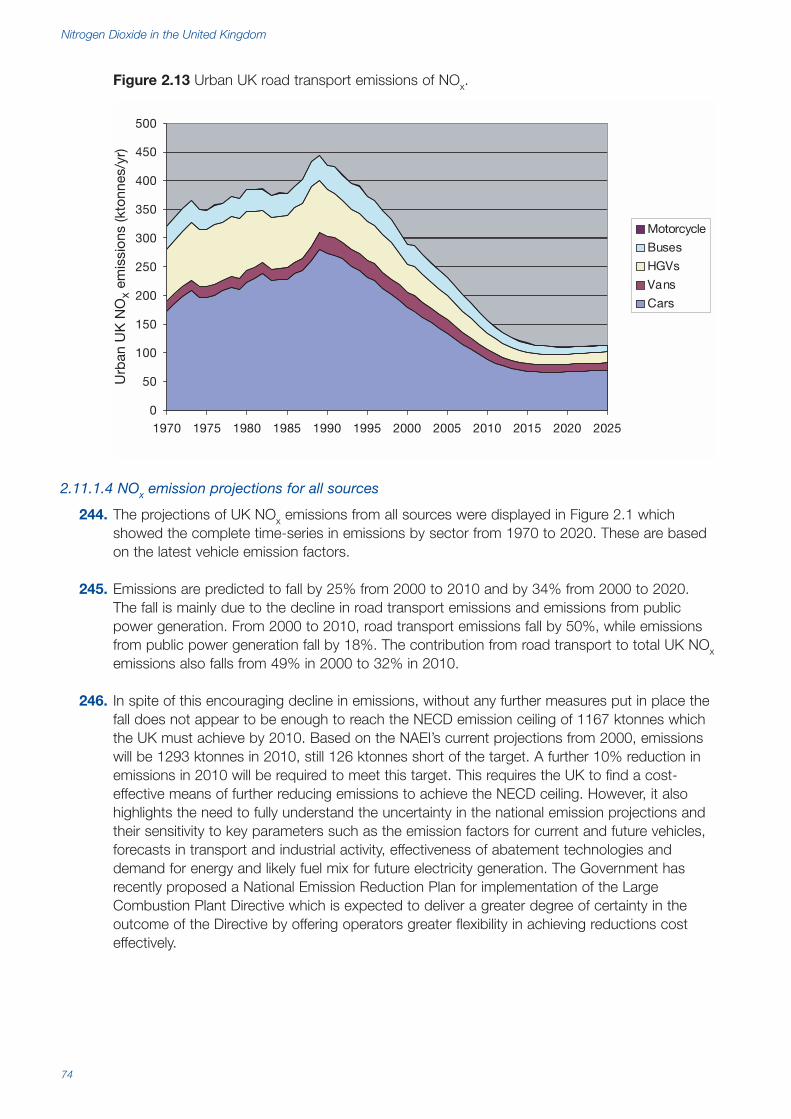
Nitrogen Dioxide in the United Kingdom
74
Figure 2.13 Urban UK road transport emissions of NOx.
2.11.1.4 NOx emission projections for all sources
244. The projections of UK NOx emissions from all sources were displayed in Figure 2.1 whichshowed the complete time-series in emissions by sector from 1970 to 2020. These are basedon the latest vehicle emission factors.
245. Emissions are predicted to fall by 25% from 2000 to 2010 and by 34% from 2000 to 2020.The fall is mainly due to the decline in road transport emissions and emissions from publicpower generation. From 2000 to 2010, road transport emissions fall by 50%, while emissionsfrom public power generation fall by 18%. The contribution from road transport to total UK NOxemissions also falls from 49% in 2000 to 32% in 2010.
246. In spite of this encouraging decline in emissions, without any further measures put in place thefall does not appear to be enough to reach the NECD emission ceiling of 1167 ktonnes whichthe UK must achieve by 2010. Based on the NAEI’s current projections from 2000, emissionswill be 1293 ktonnes in 2010, still 126 ktonnes short of the target. A further 10% reduction inemissions in 2010 will be required to meet this target. This requires the UK to find a cost-effective means of further reducing emissions to achieve the NECD ceiling. However, it alsohighlights the need to fully understand the uncertainty in the national emission projections andtheir sensitivity to key parameters such as the emission factors for current and future vehicles,forecasts in transport and industrial activity, effectiveness of abatement technologies anddemand for energy and likely fuel mix for future electricity generation. The Government hasrecently proposed a National Emission Reduction Plan for implementation of the LargeCombustion Plant Directive which is expected to deliver a greater degree of certainty in theoutcome of the Directive by offering operators greater flexibility in achieving reductions costeffectively.
0
50
100
150
200
250
300
350
400
450
500
1970 1975 1980 1985 1990 1995 2000 2005 2010 2015 2020 2025
Urb
an U
K N
Ox
emis
sion
s (k
tonn
es/y
r)
Motorcycle
Buses
HGVs
Vans
Cars

75
2.11.2 NOx emission projections in specific urban conurbations
2.11.2.1 London
246. The LAEI has been developed to provide projected estimates of NOx emissions in London.
247. A simple approach has been taken to the change in vehicle flows between 1999 and 2004/5,based on information from the GLA. The following traffic growth figures have been assumed:central London 0% per annum, inner London 0.2% per annum and outer London 1% perannum. These growth factors are assumed to apply equally to all vehicle types. Recentinformation from the GLA suggests that all TfL buses will be fitted with particulate traps by2005. The NAEI emission factors are used for forecasting vehicle emissions in the LAEIprojections.
248. Projections of road transport emissions of NOx in London are shown in Figure 2.14. Between1999 and 2010 total NOx emissions from road transport are projected to decrease by 53%.This compares with a decrease of 49% in total urban UK road transport emissions over thesame period according to the NAEI. The most significant decline is for passenger cars (65%reduction). HGV emissions only decline by 43%.
Figure 2.14 Projected emissions of NOx from road transport in London (LAEI).
249. The change in non-road transport sources of NOx is less certain. NOx emissions from thesesources are projected to increase slightly in London between 1999 and 2010, mostly as aresult of a significant increase in natural gas use for domestic premises and commercialbuildings. However, no account has been taken of the potential decrease in NOx emissionsthrough improvements in boiler technology. At present, emission factors for these sources arebased on a single fuel-based factor and it is recognised that refinements are needed for theseemission estimates. In the LAEI projections, emissions at Heathrow are expected to declinesignificantly for non-aircraft emissions, whereas aircraft emissions are assumed to remain at1999 levels. The updated Heathrow emissions inventory currently being compiled by AEATechnology should lead to improved estimates of NOx emissions from Heathrow.
0
10000
20000
30000
40000
50000
60000
70000
1999 2005 2010
Year
NO
X (t
/ann
um)
HGVsLGVsbusestaxiscars and motorcycles
NOx emissions and emission inventories

Nitrogen Dioxide in the United Kingdom
76
2.11.2.2 Greater Manchester
250. An inventory recently completed by Aric for the Greater Manchester Area shows that trafficemissions will continue to dominate in 2005 (Figure 2.15a), with most of these emissions beingdue to goods vehicles rather than cars (Figure 2.15b). Traffic on motorways will account forover 40% of the emissions, with minor roads playing a small role (Figure 2.15c). Interestingly,the car emissions are dominated by vehicles on longer journeys >8 km, with short journeysplaying an insignificant role (Figure 2.15d). These car journey emissions do not include coldstart emissions, which would apply to all categories to some extent. However, the patternwould not be changed significantly, as cold start emissions only represent around 10% of caremissions (Figure 2.15d).
Figure 2.15 Estimated emissions of NOx from the Greater Manchester area in 2005; a) Totalemissions by source, b) traffic emissions by vehicle type, c) traffic emissions on different roadtypes, d) car emissions by journey length and cold start emissions.
2.11.3 Road transport emissions: evaluation of current policies and directives andillustrative projection scenarios
251. The reduction in emissions from road transport that has occurred over the past decade and isexpected to continue over the next decade is as a net result of technology improvementsrequired to meet the European vehicle emissions Directives. Domestic transport policies willalso have had a bearing on recent and future emission trends. The effect of individual policiesand Directives has been evaluated by modelling UK road transport emissions in past and futureyears with the policy or measure excluded. The effect of the measure can be found bydifference with the base projection figures. This procedure can be used, for example, to
Proportion of Traffic
0%
20%
40%
60%
80%
100%
Goods Cars Buses
Proportion of Total Emissions
0%
20%
40%
60%
80%
100%
Traffic Industrial Domestic Other
Proportion of Cars
0%
20%
40%
60%
80%
100%
Cold Starts <3 km 3-8 km >8 km
Proportion of Traffic
0%
20%
40%
60%
80%
100%
Minor Roads<10000 vpd
Major Roads>10000 vpd
Motorways
a
d
b
c
77
demonstrate the effect that the introduction of the three-way catalyst to new petrol cars andvans has made to the emission reductions achieved over the past 10 years. Emissions canalso be further broken down by Euro standard to illustrate the contribution that vehiclesmeeting recent and future standards make to the inventory and how much remains fromolder vehicles in the fleet.
252. Studies of this nature have been carried out previously by netcen on behalf of Defra, as apolicy evaluation exercise on measures to reduce air pollution from road traffic (Bush et al.,2001a). Results are shown in this section from a revised study on a selected number ofmeasures based on the new emission factors.
253. Projected emissions from road transport can be sensitive to the assumptions made about thepenetration of diesel cars in the national fleet. Since the 2000 NAEI projections were compiled,DfT have revised their opinion on the likely growth in diesel car sales in response to a surge insales which took place in 2001. The effect this has on the UK projections of NOx emissionsfrom road transport is shown. In effect, this also amounts to a form of sensitivity analysis, inthis case showing the sensitivity of NOx emissions to diesel car penetration rates.
254. The Air Quality Strategy consultation document published by Defra and the devolvedadministrations in 2001 showed the impact of a number of additional national policy measureson UK PM10 emission projections for road transport (AQS, 2001). These included the fittingof particulate traps to all new diesel vehicles, the early introduction of sulphur-free dieselfuel and a short-term retrofitting programme for older diesel vehicles, targeted at particularconurbations. These are not discussed further in this report, but illustrate the types of nationaltransport measures that can be assessed.
2.11.3.1 The impact of the introduction of the three-way catalyst on NOx emissions from road
transport
255. Emissions from road transport were calculated assuming Euro I standards (91/441/EEC) andbeyond had not been introduced requiring petrol cars and light vans to be fitted with three-waycatalysts. This meant that emission factors for these vehicles were retained at pre-Euro I levels.The effect this would have had on urban UK NOx emissions from road transport is shown inFigure 2.16. All other assumptions remained as for the base case, including the implementationof standards for diesel vehicles (light and heavy duty vehicles). The difference in the results forthis scenario and the base case (i.e. the effect of introducing three-way catalysts) are reflectedby the difference in emissions.
256. Urban UK road transport emissions were reduced by 94 ktonnes (25%) from what they wouldhave been in 2000 had three-way catalysts not been introduced. Without their introduction,NOx emissions would have decreased at a much slower rate. The base inventory suggesturban UK NOx emissions decreased by 32% from 1990 to 2000, but without the introductionof catalysts on petrol cars and vans, this would only have led to a 10% reduction.
257. Figure 2.16 shows the projected effects of having introduced the three-way catalyst and tighterEuro standards on petrol cars and vans. Emissions would continue to decrease at a muchslower rate without catalyst introduction. By 2010, urban UK road transport emissions wouldhave been only 13% less than 1990 levels, whereas a 63% reduction is anticipated with catalystintroduction and the progressive tightening up of emission standards down to Euro IV levels.
NOx emissions and emission inventories

Nitrogen Dioxide in the United Kingdom
78
Figure 2.16 Urban UK road transport emissions of NOx for different Euro standard andtechnology uptake scenarios.
2.11.3.2 The impact of the introduction of Euro III and IV standards for petrol cars on NOx emissions
from road transport
258. Emissions from petrol cars and light vans have been further tightened up with the introductionof Euro III and IV standards. The Directive 98/69/EC requires all new cars and light vans tomeet Euro III standards by January 2001 (2002 for heavier vans) and Euro IV standards byJanuary 2006. Some models already met Euro III standards before 2000 and some car modelsnow on the market already meet Euro IV standards.
259. Emissions were calculated assuming Euro III and IV standards had not been introduced.This meant that emission factors for these vehicles were retained at Euro II levels from 1997onwards. The effect this would have had on urban UK NOx emissions from road transport isshown in Figure 2.16. All other assumptions remained as for the base case, including theimplementation of all the standards for diesel vehicles (light and heavy duty vehicles). Thedifference in the results for this scenario and the base case (i.e. the effect of introducing Euro IIIand IV standards for petrol cars and vans) are reflected by the difference in emissions.
260. Emissions would continue to decrease, but at a slower rate without the introduction of theEuro III and IV standards for these petrol vehicles. By 2010, urban UK road transport emissionswould be only 20% less than 2000 levels, even with all the standards for diesel vehicles up toEuro IV included. It is anticipated that a 46% reduction in urban NOx emissions from roadtransport will actually occur with the introduction of standards for all vehicle types.
2.11.3.3 The impact of the introduction of Euro II – IV standards for heavy duty vehicles on NOx
emissions from road transport
261. Euro II standards for heavy duty diesel vehicles were introduced in 1996. Emissions werecalculated assuming neither Euro II standards nor the successive Euro III and IV standards forDirective 99/96/EC (2001 and 2006) were introduced. This meant that emission factors forthese vehicles were retained at Euro I levels from 1993 onwards. The effect this would havehad on urban UK NOx emissions from road transport is shown in Figure 2.16. All otherassumptions remained as for the base case, including the implementation of all the standards
0
50
100
150
200
250
300
350
400
450
1990 1995 2000 2005 2010 2015 2020
Urb
an U
K N
Ox
emis
sion
s (k
tonn
es)
Base
No TWC
No Euro III, IV petrol
No Euro II, III, IV HDVs

79
for petrol vehicles. The difference in the results for this scenario and the base case (i.e. theeffect of introducing Euro II-IV standards on HDVs) are reflected by the difference in emissions.
262. It can be seen that urban UK road transport emissions were reduced by 9 ktonnes (3%) fromwhat they would have been in 2000 had the Euro II standards not been introduced. The effectof the Euro II standards on HDVs in reducing urban road transport NOx emissions has beensmall during years up to 2000. However, the effect of these and tougher Euro III and IVstandards becomes much more significant in future years. Without these standards, NOxemissions would continue to decrease, but at a slower rate. By 2010, urban UK road transportemissions would be 30% less than 2000 levels, with all the standards for petrol vehicles up toEuro IV included. This compares with the 46% reduction that is actually expected.
2.11.3.4 The impact of higher penetration rates for diesel cars in the new car fleet on NOx and NO2
emissions from road transport
263. DfT have recently revised their opinion on the likely growth in diesel car sales in the UK inresponse to a surge in sales which took place in 2001. Sales were originally forecast to be16% of all new car sales in 2001, but the actual figure was 18% for the year as a whole,growing to a level of around 23% in the early part of 2002.
264. The original growth estimates were designed to reflect the way car manufacturers would meetthe voluntary agreement on CO2 new car emissions by increasing diesel car sales. The recentrapid increase in diesel car sales is thought to be due to new company car taxation rules, butthe view of DfT is that this trend may continue. The view now is that diesel car sales will increaseto 25% in 2003 and increase linearly to 30% by 2010. As diesel cars emit more NOx than petrolcars, this will lead to an increase in the overall emission projection estimates for road transport.
265. The effect of the higher diesel car penetration rate on NOx emissions from traffic was modelledleaving all other assumptions the same. Emission projections were calculated based on thehigh diesel car growth assumption, reaching 30% of sales by 2010, and compared with theoriginal baseline projections assuming a growth to 22% in sales by 2007, remaining constantthereafter (Table 2.8).
266. The amount of increase in urban UK road transport emissions of NOx was found to be small.Urban UK road transport emissions of NOx are increased by 0.7% in 2005 and 0.7% in 2010relative to the baseline projections. The increase in total UK emissions of NOx in 2010 is 3.5ktonnes, or 0.3% relative to the baseline emission projections for all sources.
267. The effect on primary NO2 emissions in urban areas would be more significant, however, if dieselcars emit a higher proportion of NOx as NO2, as suggested in Section 2.6.2.6. On the basis thatdiesel cars emit 25% NOx as NO2 (by mass) and with petrol cars emitting only 5% NOx as NO2,as concluded in Section 2.6.2.6, then increasing the diesel car penetration rate from 22% to30% by 2010 would increase urban road transport emissions of primary NO2 in 2010 by 3%.
268. Sales of diesel cars are currently on average around 35% of all new car sales in otherEuropean countries. The European car industry group ACEA predicts this will rise to 40% ofnew car sales to meet the voluntary agreement on CO2 emissions. DfT consider that withcurrent fuel duty policy, diesel car sales are unlikely to reach this level in the UK. However, in anextreme case where sales of new diesel cars rise to 50% of new car sales by 2010, then urbanUK road transport emissions of NOx in 2010 would increase by 1.2% and primary NO2emissions by 6% compared with the low (22%) penetration rate assumption.
NOx emissions and emission inventories