Embed Size (px)
Citation preview

CHAPTER 2 LITERATURE REVIEW PAGE 86
2.6 GAME THEORY
'Game theory°aI)I players whose
whom has a s 1 concerned with
TVlalyses games|played by! two or more fortunes are interrelated and each of trategy. More specifically, we are dynamic non cp-operative game theory
which involves multi-person decision making; it isdynamic if the is important,,
order in which the decisions are made and it's non co-operative if each
person involved pursues his or her own interests which are partly conflicting with others (Basar & Olsder, 1982,pi). A clear distinction exists between two-player zero sum games and the rest. In zero-sum games the sum of the cost functions of the two players are identically zero. A salient feature of two person zero-sum games that distinguishes them from other games is that they do not allow for any co-operation between players since what one, player gains occurs as a loss to the other player. In non zero-sum games co-operation between players leads to their mutual advantage. Economic models are in general concerned with non zero-sum games.
The concepts of zero-sum and non zero-sum cooperative and hon co-operatiVe game theory are illustrated by Basar & Olsder (1982, p5) by using an example which is presented in a simplified form below.
Assume a mass is positioned at the origin of two perpendicular axes X and Y and that each player can move the mass one unit in any direction. In the first illustration, the objective of playef 1 is to moye the mass as far as possible in the positive X direction while the objective of player 2 is to move the mass in the negative X direction. The

CHAPTER 2 LITERATURE REVIEW PAGE 67
"solution1- to this zero-sum game follows immediately - each player pulls in his favourite direction andii - " - -T> ' '
" the point mass remains at - the origin. Such a jf solution is known as a saddle-point solution*
In the next illustration the game is altered slightly. The objective of player 1 remains to move the mass in the positive X direction but the
, objective of player 2 now becomes to move the massas far as possible in the positive Y direction. In the non co-operative form of the game each player pulls in his favourite direction and the point mass moves to the position X=1 and Y=l. (1;1) Note that once player 1 has chosen to pull in the X direction player 2 has no other better choice but to pull in the Y direction. Any other direction will yield a result worse than Y=l. Hence the pair exhibit an
, equilibrium behaviour, and this kind of solution where one player I, cannot improve his outcome by altering his decision unilaterally is called the Nash equilibrium solution (or Nash solution).
\ '
o In the co-operative |form of the game, the players can significantly impjrove their lots. Suppose each player pulls in a direction of 45° to the X axis. The result would be that the point mass moves Z units in a direction of 45° to the X axis and end up in a position X = 2 cos 45° and Y = 2 sin 45°.Since sin 45° = cos |45° = 0,7 this yields the
\\ ’ • 1 ' 'position X=l,41 and Y=l,41.
This is clearly significantly better for both players but requires co-operation between the players. Note that if player 1 knows that player 2 is moving in the 45° direction, player 1 could still improve his position by moving in the X direction

CHAPTER 2 LITERATURE REVIEW PAGE 8 8' :i - - ' "— — ------- ----- ------- 1 a ---------- — --------------- -------------- -— _ d _ — -
but this would result ih player 2 being significantly worse off. Therefore the strategies Of pulling in the 45° direction cannot be in equilibrium in the non co-operative game since it requires some kind of faith (or even negotiation), and thereby co-operation, on the part of the players!. •> If this is allowed then the 45° strategies -c known nas the ParietO-optimal solution - is a reasonable solution for the game since no other joint decision of the players can improve the performance of at least one of them without degrading the performance of the other.
Over the last 45 years - since its development in 1947 by Von Neumann and Morgenstern (Basar and Olsder, 1982, p3) - the theory of games has been applied to a variety of fields including economics, business and international politics. In the process, game theory has become a specialized and highly mathematical field with a distinctive language and concepts of its own. What follows is a review of some of the game theory applications relating specifically to market share and profitability with the emphasis on the results obtained rather than a detailed, mathematical account of the method used. Interestingly, the Cournot oligopoly analyzed in the previous section
. fulfils the requirements for a Nash equilibrium solution (as do most other oligopoly models). Ih this sense game theory is a linear descendant of the classical oligopoly theories. However, the use of game theory has resulted in determinacy in complex and specialised cases which has far surpassed the classical theories (e.g Dixit 1979; Karnani, 1983; Wernerfelt, 1984).

_ - ' - r:CHAPTER 2 LITERATURE REVIEW PAGE 89- •■■ ' V - ■ : ' 1 -Karnani (1983) used gaihe theory to examine the - ' '' minimum market share required by a firm to remain
viable . Previously Henderson (1979) hypothec!zedthat in a stable market a firm with less than onequarter the share of the largest firm could not bean effective obtftpt'aitor. Karnani (1983, p76) pointsOut| that edondmic theory, on the other hand,postulates a minimum firm size in terms of absolute
n'.r' 1 )r-!: ' ' . ■ 'sise based on consideration of the firms cost structure. It can be argued that economic theory on minimum firm size does not accord well with one's intuition or with factual observation. Relative Size and market share are. often seen as more important than absolute size in determining a firm's viability. Neither the economic theory on firm size nor Henderson's hypothesis takes into account the nature of demand in the industry under analysis. The strategic planning literature suggests that a small firm can be successful if it exploits a market niche (e.g Hamermesh, efc al, 1978). It// is intuitively evident that firm size must ne a function of not only the firm's cost structure and Competitive interaction among the firms, but also of the demand structure of the market. Translated into economic language this means that minimum firm size decreases as scope for product differentiation increases.
Karnani's paper analyses a specific model of oligopolistic competition involving product differentiation, marketing activities, and economics of scale in production. It is shown that at a Nash equilibrium each firm’ must have market share equal to zero or greater than a threshold value.

>
CHAPTER 2 LITERATURE REVIEW , PAGE 90: ' -fi......... ' . ................ ' • ......
„ Minimum share - 1-d for dsl' 1 -t '= 0 for d>l
Where d and t are industry specific factors.
Karnani's model shows that different industries have different minimum, sizes associated with them.
’ Clearly, the lower the value of minimum market share the more feasible it is for a firm to pursue a low market share strategy. For the purpose of this study Karnani's work is important because it lays a finft theoretical foundation for the hypothesis that the effect of market share on profitability is different in different industries or environmental settings.
Wernerfelt (1986) used the logic of game theory to examine the theoretical relationships between market share and profitability. Wernerfelt argues twotheoretical cases, one Which results in unstable market shares and one which results in stable market shares. In the first case Wernerfelt assumes that there is no positive association between market share and profitability in the industry under consideration. Firms are assumed to be identical and, in a hypothetical auction, can buy small units of market share. Each buyer is assumed to buy market share until the marginal return (net present value of long term returns) from higher market share are lower than the price (marginal cost) of that market share. Since all buyers are identical this
I point is the same for all firms and the ultimateprice will be Ouch that each firm gets 1/N of themarket. This is illustrated in figure 2.12.

CHAPTER 2 LITERATURE REVIEW v "■ PAGE 91
EXHIBIT 1Market Share Auction With Decreasing Returns to Market Share
Point beyond which the marginal cost of market share is higher than (Tie marginal return
Costs of buying market share
Returns of having market share
Net profit (returns net of costs of buying market share)
Market f.hare
Fig 2.12 Market share auction with decreasing returns
(Source : Wernerfelfc, 1986, p 6 8 )
in his second case, Wernerfelt examines the more complex situation involving increasing static returns from market share. In a similar auction buyers maximise net profits by having either the whole market or nothing at all. This is clearly a major problem in the analysis as "prices" in the normal sense of the word do not exist.
There is either too much or too little demand and the market does not clear at any single price. Wernerf elt argues tha't, under these conditions the cost of buying market share will depend on a number of factors including the amount of market share already held by a particular firm, and the amount
rs\
\\
CHAPTER 2 LITERATURE REVIEW PAGE 92
held by other filrius, the cost position of all fifms, and the stage in the product life cycle. The price will also depend on the expectations in the market place by one firm regarding the response of the other firms. However equilibrium should have the property, that all players attempting to gain market share would find that the benefits of a change are fewer than the negative consequences.
According to Weiner felt1 (1986, p71) in the long run bigger and smaller firms face- different cost and markup conditions as illustrated in Fig 2.13.
EXHIBIT 6 ,Steady State Prices as Functions of Market Shares
Price
M ... ;
Marginal costs plus optimal
markup it
/ ''Small
firmUnstable Big J „
equilibrium firm * -■ .~ ----- , e___ Eouilibrium
/" ■— price
Optimal markup
/ •■»v Marginal costs
' S r. y— k _ ...
-, Market share
Fig 2.13 Markup as a function of market share.(Source : Wernerfelt, 1986, p72)
The logic behind the relationship shown in fig 2.13 is given by Wernerfelt (p71) as follows :
"The biggest firms will have low marginal costs (because of economics of scale ) but be j,

CHAPTER 2 _ LITERATURE REVIEW " PAGE 93
tempted to charge high markups (because of their .relatively big customer base) . The smaller firm, conversely, will have higher marginal costs and be less tempted to charge high markups. _ Both types of firms should
. price at the long run prof it-maximizing level, which for stable markets will be equal to
o . marginal costs plus a markup. And thisdepends on the size and price sensitivity of the customer base". . '
This logic - while compelling in its own right- is in direct conflict, with the bulk of the marketing literature where "niche"- markets have high markups and in contrast high volume cost leadership strategies require price leadership as well. However, if Wernerfelt logic is accepted then it points to a causal relationship between market share and profit.
"Note that this explanation for a share profit- cost relation in mature industries depicts the profit as a result of the share, which again
I' iis the result of some underlying information cr resource asymmetry. This is different from the conception of profit and share as a result of the same underlying phenomena"
(Wernerfelt, 1986, p72)
As authority for the above statement Wernerfelt draws on an earlier paper (Wernerfelt, 1985) in which the development of an industry is seen as the outcome of a differential game in which market shares flow in response to price differences. It is hypothesized that while all consumers eventually react co price differences, some are slower than

CHAPTER 2 ” '' ■ 1 ’ VLITERATURE REVIEW PAGE 94
others. Thug a firm does not loose all of if sales' by charging a higher price for a limited time. In the presence o£ scale advantages only skewed size distributions can be locally stable steady states. Also, the largest firm need not eventually monopolize the industry.
Wernerfeltr, also draws on another earlier paper(Wernerfelt, 1984) in which a duopoly is analyzed through a differential game in which players set prices as a function of time. The major conclusions from this model are summarized below.
1. The big firm (in a duopoly) Can keep gaining market share in the growthmaximisation game. rv
: 2. Prices decline in a growth maximisationgame.
3. Late in the life cycle - of the- . ' /<unconstrained game', the market share ofthe big firm goes down.
4. If the terminal value of market share is not excessively high then prices increase
? late in the profit maximising game.5. fpEf a firm is financially constrained, it
ksb cu!^x_maximis e growth early in theproduct life cycle and take profits home later.
6 . Only the low price firm engages in awareness advertising to inform, and late in the life cycle it advertises more the smaller it is. r n i
Late yin the life cycle both firms spend the same amount on persuasive advertising and more the more similar they are.

CHAPTER 2 LITERATURE REVIEW — — — -
PAGE 95. /Werner felt (1986) gused this logid to^ predict ^the
equilibrium profit for different market shares, as shown in fig 2.14. 1
EXHIBIT 7Equilibrium Profit fo r D ifferent M arket S h ares , Duopoly
Profit
Stable, asymmetric equilibrium
M onopolyUnstable \ symmetric
equilibrium
MS., 1/2
Fig 2.14 Equilibrium profit for different market shares.
, (Source : Wernerfelt, 1986, p73)
This relationship is interesting in thata) It is ndt linear, and , 7
b) It exhibits increasing profit as share increases, and
c) Causality is implied (as disctiSSedVearlier).
The work by Wernerfelt and Karnani is fairly typical of most game theoretic papers which generally build in economies of scale .and either derive or assume an increasing profit to market share curve (eg Dolan & Jeuland, 1981; Eaton & Ware, 1987; Karnani, 1984) . However, the value of the contribution of game

CHAPTER 2 LITERATURE REVIEW _____
PAGE 96
theory to economics is seen\aS:.disappointing by someauthors. McGee (1988, p95)\ quotes
"One of the great promises of game theory was„ vp fil]/! the broad scientific territory between the models of perfect coftipetition and those of perfect monopoly.... the lack of progress in
„ this area is not due to the unavailability of mathematical tools or an opposition to their
\ use. Rather,...* We simply do not understand1 how these markets function",.i „ ■: ^ v ■ ■ ■ • \
1 ’ - ' - %: Some people may argue that we never could (or should) be able ' to understand and describe in mathematically precise terms the function of these markets because that would deny the existence p f a
- basic human right : the freedom to act in anindividualistic way. Schumacher (1973, p40) put it more strongly : s, „ J
"The great majority of economists are still pursuing the absurd ideal of; making their
V;’1 science" as scientific and precise as physics, as if there were no qualitative difference between mindless atoms and men made in the image of God".
Despite Lie obvious limitation I?^fLied in Schumachers comment, game theory does act as a
. mathematically rigourous foundation upon which broader theories can be based.
2.7 INDUSTRY STUDIES
The strategic planning literature has an abundance of reports on industry studies, case studies and anecdotal evidence which is used by authors to support a particular"argument or "theory. Perhaps

CHAPTER 2 LITERATURE REVIEW PAGE 97
the most prolific writer in this mould is Tom Peters. In his chapter entitled "Rethinking Scale" (Peters, 1992) he draws oh many examples fromvarious industries to make his point for example:
"Big Japanese . companies, with Sony in the lead, are madly shuffling their decks, shifting their emphasis....moving production and clout out of Japan". (pll)
%...... the Fortune 5 0 0..... are madly de -r integrating, selling off bits, subbing anything and everything, marketing subsidiary
v units" '' / ( - \ ' - - '-(p9)
"So 19G0s-style conglomerates bombed in the US. (Nobody disagrees about that). So our
" r, -big companies are splitting up".' v (pio)
"Siemens, in response to the shabby performance of two thirds of its business units packed off 40 000 of its head office staff to front-line jobs in marketing and finance"
' (plO)
"Philips has shed 100 000 jobs in the last 5 years, largely by selling off misfitting b*ts of its portfolio" c
(plO)
Some of these qu'otes are not based on fact or backed, with any research ? but are generalizations made by the author. In other cases, the quote could be backed up by fan in-

CHAPTER 2 LITERATURE REVIEW PAGE 98
depth and extensive research project but sources, references and details of the program are left out on the basis that they woulddetract from the readability of the article.", ft ' : , . - - - - ' " - . V 'It is therefore very difficult fbr a seriousscholar to judge the value of these works andtherefore, reluctantly, one is forced to putmost of this body of literature aside.However to neglect it completely would be anommission and would detract from the Colourand depth of the review. Therefore an attempthas been made , to take some of the t&dre
credible examples of industry studies and case6studies and classify them according to support
or otherwise for the main themes of this research. Table 2.4 gives some examples of industry studies. ! f ^

CHAPTER 2 LITERATURE REVIEW PAGE 99
- T* n
Author Industry:Ti
Low Share- High ProfitEconomicsofScale,
Positive Relation between Market Share and ProfitFruhan (1972) '' Auto /
Computer \ vChain Stores r; V
Ghemawat (1984) Titanium, dioxide _ (1960’s) ',Support
■-n z ;Hamermesh et a l (1978) Can manufacturer /
Computer / =Forest Products /
Page (1979) Gasoline " , '' ✓Lieberman (1989) Chemicals Industry O ito SupportNewton (1983) „ Pharmaceuticals
Food distribution s ;Grain Milling 1 No Support
Shaw & Shaw (1984) Synthetic Fibres SupportSmir1ock (1985) Banking SuperiorEfficiency ✓
Schuster_(l984)' 1 Banking - y ,
Shepherd (1972) Various
TABLE 2.4 Examples of Industry Studies
2 . 8 CONCLUSION (I
A wide range of literature has been reviewed covering decades of - research and based on many different paradigms. The research methodology and approach varies considerably even between authors within the same paradigm. With regard to the main thesis of this research - the causal effect of market share on profitability - no conclusion could be reached. There is a large body of 1' ‘-nrature supporting a causal' relationship between market share and profitability and there is a large body of literature not supporting the relationship. 1 Direct comparisons of zche various studies are difficult

CHAPTER 2 % LITERATURE REVIEW PAGE 100 " . % ' . 'A
" - --- . ' L ' ^ \ - -because of the differences, in approach and methodology.
The conclusion reached is that the relationship between market share and profitability is context specific. The literature cuggosts that in certain contexts there is no causal relationship between market share and profitabilitywhile in other contexts a strong causal relationship exists. It is not(? clear from the literature what variables define these contexts, far less what values imply a context where a strong causal relationship exists and vice versa. Attempts have been made in some of the PIMS studies to define 11 environments" using environmental variables and cluster analysis. These studies have confirmed the context specific nature of the relationship between market share and profitability but the environmental settings are difficult to, apply in a practical sense; • •
The nextchapter gives an overview of the research methodology used which is designed to explore some of these issues. Firstly, different environmental settings are analyzed and, „ thereafter, a fine -grained study into causality is undertaken.

CHAPTER 3 OVERVIEW OF RESEARCH METHODOLOGY PAGE >01
CHAPTER 3 OVERVIEW OF RESEARCH METHODOLOGY
3,1 INTRODUCTION
In chapter .2 the" literature reievant to market share and profitabi 1 ity^was reviewed. The
o main conclusion reached w|as that therelationship between market share andprofitab^Liiy is context specific and that causality may not exist in all contexts. In tqis Chapter the entire research process that was adopted in this study is - previewed, and contrasted and compared to traditional research processes. [f : ^ “ ^ 7
Traditionally, research follows a nui^ber of sequential stages, starting off with the definition of the research problem and ending with the interpretation of results. / Many of, the processes adopted in business research stem from social research where1''* the process has Keen more formally stated. The stages of social research can be formally stated as follows: n " \
. ' o ' ,1. Choosing the research problem and statingthe hypothesis
2. . Formulating the research design
3. Gathering the data
4. Coding and analysing the data
5. Intarpr;eting the results so as to test

CHAPTER 3 OVERVIEW OF RESEARCH METHODOLOGY PAGE 102
the hypothesis. 1
(Bailey, 1982, p 9 )
' Each of the stages is dependent upon the others, and the process is best thought of as circular, as shown in fig,3.1 .
V / .
e aD,UV; mm e
Fig 3.1 Stages in the Research Process (Source : Bailey, 1982; plO) V
3.2 HYBRID METHODOLOGY
The process used in this research did not follow a single'iteration of the traditional research process but employed a hybrid research methodology and at least two iterations of the research cycle.

CHAPTER 3 OVERVIEW OF RESEARCH METHODOLOGY PAGE 103" : ' ' ' ' '
% The concept of a hybrid methodology was put forward by Harrigan (1983) as recommended
, methodology for (Strategy research. The aim of this research is to explore the underlying cause behind the market share/profit
,. relationship end therefore the methodology employed had to have sufficient resolution to
?' , bring out important details about specif ic \ mechanisms in different industries but also X (ideally) %jd io be generalizable so as to be widely applicable. The problem, therefore, f,was to get an appropriate amount of detail
y without sacrificing top much generality. Harrigan (1983, p399? contrasts ffine-grained" methodologies (such as casl H ^ u d i e s andindustry studies) with a"cps^rse-grained" methodologies such • as statistical .studies using the PIMS data base. She points out that
- fine-grained methodologies benefit from the wealth of detail that is generated, which help researchers characterize the complexities of strategy formulation in a particular industry, but which lack generalizability andstatistical rigour.^ The course-grained methodologies, on the other hand, benefit from the genera1 izability, but their- value in strategy research may be limited if causal processes are not explored by other means.
Harrigan proposes a hybrid methodology which combines aspects of coarse and fine-grained methodologies as a means of obtaining anappropriate level of detail, withoutsacrificing generalizabi 1 ity. F That is" the approach that was taken in this research as described below.

CHAPTER 3 OVERVIEW OF RESEARCH METHODOLOGY PAGE 104
3.3 ,PHASES OF THE RESEARCH
The research can conceptually be divided up into 6 phases as shown in table 3.1 below.
r V N t O . Phase Chaoter ♦Stage of Research Methodology- J Literature Review / " 2 1 a ' ' Theory
1 1 Statistical Analysis V 4.5 -• 1.4.5 Coarse-grainedi n Initial Study - 6 ^ 1 2 3 4 5 Fine-grained „ .IV Generalisation 6 : / / 7 ; ! > ' - 1 Theory :V Testing of theory -
r- 8 . 9 2 3 4 Medium-grainedv i Discussion - : x 10 r 5 Theory
*Stage refers to the stages defined by bailey in fig 3.1 Table 3.1 Overview of Research Process
■' - ’ . ' '; v - ' " ' ' ' ' ' "
,, i The phases of the rese£$rch are brieflydescribed below; so as to give a holistic view of the, research process. « g
^ Phase I »x.As can be seen in chapter 2 the literature survey draws from a wide range of disciplines in I order to review - the current state of
: knowledge concerning the relationship betweenn market share and profitability. The main
contributors are PIMS studies, industry and case n studies. Industrial Organisation, Microeconomics and Game Theory. A number ofdifferent paradigms and definitions differ' . . - - ' j' Aacross disciplines. This makes comparisonsdifficult and no firm conclusions / regardingthe causal effect of market share onprofitability could be reached. | The
j) „/ conclusion that was reached was that the

CHAPTER 3 OVERVIEW OP, RESEARCH METHODOLOGY PAGE 105
relationship between market share and profitability is context specific and that in certain contexts or environments the effect of market share could be expected to be' . 'y \significant while in other environments/
■ insignificant. ^ ^ - - ' _ . '
Phase IIThe conclusion f rom phase I ,is used in phase II as theri objective \i for the statistical
r, analysis of an existing data base. First thedata is described and the South African economy put in a global context (chapter 4),
„ then the analysis of the data is reported on(chapter 5) . This is a course-grained study which employs r statistical techniques to analyze over 100 SBUs in order to determine
(i) whether there are environments within which the relation between market share
; and profitability is significantly || different, and
(ii) if so, what defines the environment and which businesses fall into the category
l; where | market share has a significantimpact on profitability.
In terms of Bailey's (1982) stages of research, phase II can be regarded as a
\ complete cycle with the exception of the datacollection and coding which had already been done. The basic’paradigm underlying this part of the research is the "PIMS" paradigm (discussed in section 2 .1 .2 ) which holds that there are generalizable relationships which

CHAPTER 3 OVERVIEW OP RESEARCH METHODOLOGY PAGE 106
can be obtained by analysing , cross-sectional statistical data. The main conclusion obtained from phase II was that there exists
, in the data two fundamentally different" environments; one in which .the effect of
market share on profitability is significant and the other where the effect is insignificant. The environments are defined by the 4 environmental variables in the PIMS LIM model.
Phase III ; CV" T .v " ' In phase III a fine-grained study was mountedinto the businesses in the environment wheremarket share was strongly correlated withprofitability. The logic behind this was thatthis was the environment where market sharewas most important and therefore any marketshare effects would be amplified and thus
„ easily detectable,.- This fine-grained studyrepresents a complete cycle of Bailey's (1982)stages. (Alternatively, phase II and IIIcould be regarded as a single cycle but usinga hybrid methodology). Initially in the study• a PIMS type paradigm was adopted and adetailed „ questionnaire designed forstatistical analysis was prepared v Later,after immense difficulty had been experiencedin administering the questionnaire, a moreflexible approach was adopted. When thebusinesses were identified it was noted thatthey all fell into one industry and thereforethe results obtained would not be directlygeneralizable.

CHAPTER 3 OVERVIEW OF RESEARCH METHODOLOGY PAGE 107
Phase I V ' . . - , ■' % -- /
- " ' : - r 4 '
In phase IV the results obtained in the previous 3 phases were used in conjunction with inductive reasoning to produce a generalized theory. Chapter 7 lays out the generalized theory in terms of propositions
t (based on stated assumptions) which dead totheorems stated in terms of Jiypotheses so as to be testable. The principle used is that the hypotheses are derived from the theory and therefore if the hypotheses are tested and proved to be true, then the theory is
r> accepted. In order to state the theory succinctly the basic concepts are defined
. using terms from :he PIMS. and Industrial Organisation paradigms.
Phase V " ^
.Phase V represents the testing of the hypotheses generated in phase IV. A medium to fine-grained methodology was devised and applied to the businesses in the environment not used in the first study (phase III) . This was risky because, in order to test the hypotheses, data was needed from a range of industries - some where market share 0was important and others- where market share was not important. The businesses in question were in an environment where market share was found not to be important by the coarsegrained study, 'and therefore there was the possibility that the range of results obtained would not be sufficient to test the hypotheses. However this was the only

CHAPTER
*\
1/
3.4
i OVERVIEW OF RESEARCH METHODOLOGY PAGE 108 , \ \ ' - . ' " •
suitable data available and it was felt that the statistical analysis was too coarse to have picked up all the factors influencing market share and profitabilityV There was therefore a high probability that the range of results obtained would be adequate hg,test the hypotheses. In the event this proved to be the case and the hypotheses were tested and found to be true thus proving the theory.
Phase VI _ r • \ ; ■. p
In phase VI the results of the field work and testing in phase, V are discussed and compared with the theory developed in phase IV. The results are viewed holistically and are also compared to some Of.the concepts covered in the literature review. n
GENERALITY OF THE RESEARCH
Phase I of the research was a very brpad and generalized/! review of . the literature pertaining to market share and profitability.Phase II was less general and narrowed theA? " V , - - ,study down to: _____
a) South African businessb) in specific industriesc) 103 SBUs
, Phase III of the1 research was narrower still in that it focused on 10 SBUs in one industry.
In phase IV a generalized theory is proposed based On the findings of the previous phases.

CHAPTER 3 OVERVIEW OF RESEARCH METHODOLOGY PAGE 109
The theory is ° formulated to be generally applicable to all businesses. r ;v
Phase V involves the testing of the, theory using 59 SBUs from a limited number O'jf different industries. ' _ ,
Phase VI discusses the results and puts them in a general framework.
Viewed graphically the research process can be summarised as shown in fig 3.2.
GENERALITY Phases
Fig 3.2 Generality of the research 3.5 PARADIGMS
As discussed in section 3.2 there is no single research paradigm Which dominates this research process. In phase I literature from

CHAPTER 3 OVERVIEW OF RESEARCH METHODOLOGY PAGE 110
T 0 various paradigms is reviewed. Phase II is ^ o dominated-, by "the PIMS paradigm but in phases
V III and V a much more detailed, flexibleapproach is adopted similar to the business policy approach. The theory generalization
] atid discussion (phases IV and VI) is based ono ;; concepts from Industrial Organisation, PIl S
and business policy. , .fm,
The fact that no single naixadigm dominates the research is hot unique tp^this research.
_ Montgomery (1988, p3) summarises the position:
"No doubt many of us have had discussions ^ about the lack of a central research
,-,k paradigm in the strategy area.. Whether . one believes the field should have a
, f paradigm, or not have one, whether onef1. . . . v believes such a paradigm is likely or not
to develop, the observation remains that0the field today does not have a dominant,
unique research paradigm. Aside from efforts to build such a theory, or set of theories, what we can do is explore important strategy questions through paradigms from related disciplines".

CHAPTER 4 DESCRIPTION OP DATA ~ PAGE 111
CHAPTER 4 DESCRIPTION OF THE ENVIRONMENT AND DATA
4.1 INTRODUCTION
The research was conducted in the South African .business environment and the data pertains to the early 1980s. Since it is our intention to contrast the results of this research against similar studies done elsewhere in the world (mostly in the USA)-, it is appropriate to give a brief description, of the development of the South African economy and of some of the macro economic parameters pertaining to the time of data collection.
The^ first part'of this chapter gives a brief review-YY" o .of the theory of developing economies and then the
ii development of the South African economy is reviewed against this theoretical background,. Thereafter the South African economy in the 1980s is reviewedand the data base introduced with a description Of the data collection process aiid a summary of its representation across industries. Finally, the data is 'Compared against PIMS data.
4.2 DEVELOPING ECONOMIES
The stage of development of an economy nas a significant impact On the macro-economic conditions within the country which in turn impacts on the business environment. According to the„literature. (Rostow, 1960; 0' Dowd-, 1978; Myint, 1965) there are stages of economic development which all 'normal' countries go through. The term ' normal' is used to

CHAPTER 4 DESCRIPTION OF DATA PAGE 112
, apply to all countries where there was a substantial peasant population before industrialisation and where the development Of the country is based in industrialisation.
The first stage of development takes place before the point which is called "take-off" Occurs, and is necessary in order to make "takevpff" possible. This is a period of building infrastructure and creating the basic institutions necessary for a modern industrialised state. It is a period of great instability as it involves not only the establishment of new structures, but the breaking down of traditional patterns of society and authority. It is characterised by new and revolutionary ideas and by weak and unstable
" governments and wildly changing policies.
After an indeterminate period of time the country emerges from this twilight period and into the next phase with very different characteristics, _ called „ the "take-off". During this stage, the classes which are determined to pursue industrialisation are now in complete control and are strong enough to govern effectively and in the direction of industrialisation. This period is characterised by a strong, effective, pragmatic government and the disappearance of romantic enthusiasm. >0'Dowd (1978, p30) points out that, the government of the day is almost always a minority government ruling in the interests of a minority. the socio-political changes (and sometimes revolutions) of the previous era, do not liberate1 the masses but merely change the ruling class. ~ The new ruling class imposes harsh conditions on the working classes and restricts consumption of the masses to allow for

CHAPTER 4 DESCRIPTION OF DATA PAGE 113
investment. There is thus a very clear distinction between the rich ruling class and the poor working
' class, for whom there is no possibility at this stage for a decent standard of living. Rostow (I960) calls this the first stage of industrialisation. "
The turning point from the first stage to the second stage comes when the influx of impoverished people from the rural areas ceases to be rapid enough to keep unskilled wages down to subsistence levels. Jobs start to expand faster than they can easily be filled and it becomes necessary to improve the use of unskilled labour by means of training and this in turn means keeping the labour turnover rate down. The expansion of education, improved health services and better housing for workers becomes desirable because workers are in short supply and need to be retained. This is a much more liberal stage.
The third and last stage of development is reached when industrialisation is\yirtually complete. There is no more room for economic development except based oh new inventions, whereas,up ,fo that point it has been mainly a matter of more complete involvement of the population in the use of existing!
. techniques, infrastructures and systems. During this stage, for the first time,, economic progress required that consumption be increased. Thus the emphasis shifts from liberalism to socialism and tends to equalise the distribution of wealth and so increase consumption. This is the exact opposite of the position that existed in the first stage where unequal distribution of wealth served to reduce consumption so as to allow for investment. This fully developed, industrialised stage has its own

CHAPTER 4 " DESCRIPTION OF DATA PAGE 114
unique characteristics and problems which are still evolviiig and being subjected to analysis. For the purposes of this study we Willkregard this as the final stage and dispense withiary further analysis or description. Britain, Swep§n/ Belgium, USA, West Germany and? France are aiB in this stage of development. ,
In South Africa, industrialisation first started with the discovery of diamonds in 1866. , Thisbrought railways and large scale mechanised expertise to South Africa for the first time and initiated a period of social and political turbiilence, covering the Boer Ij'-I'r (1899-1902), and the general strikes of white mine porkers of 1913, 1914 and 1922. During these strikes there was wide scale violence and at one stage police opened fire on the strikers killing fifty. ,n
The start of the first stage of industrialisation proper can be dated back to 1933 when South Africa's National Income growth rate jumped from a low and erratic growth to a steady 4%% per annum, which it maintained for many years. During this period of sustained growth the conditions for the poor were not unusually harsh because South Africa had free access to foreign capital and therefore did not have to fund the growth in the economy by internal savings. There were however the "abnormal" Characteristics of restrictive policies such as an undemocratic constitution, severe restrictions on trade union activities and few or no civil rights for the poor.
The change from the first stage to the second stage of industrialisation started in the late fifties

CHAPTER 4 DESCRIPTION OF DATA PAGE 115. " J" " ■ . .. -
- . - - _ \ with rapid increases in non-white housing, educationand health services. Unskilled and semi-skilledwages started rising rapidly and increasing effortwas put into education and training, andimprovements of social services. , This processcontinued up to the presentf time with reform_Initiatives starting and stopping but generallymaking progress, under the critical eyes of the restof the world. • The major hurdle which must becrossed by South Africa for development to continueis the negotiation and acceptance of the radicalconstitutional reforms which are necessary. Theseconstitutional reforms will have to be of a similarscale to the Second Reform Act in England andPresident Wilson's programme in the United States,which ushered in the period of sustained growth and
’ liberalism of the 1920s in America.
'4- . 3 THE SOOTH AFRICAN ECONOMY IN THE EARLY 80sL L . -——
In March 1980 South Africa was classified by the International Monetary Fund^ as a Non-oil, developing country" and within this classification as a "major exporter of manufactures". This puts it in the same category as Argentina, Brazil, Greece, Hong Kong, Israel, Korea, Portugal, Singapore and Yugoslavia.
Like all developing countries, the management of the inflation rate and the optimisation of the growth rate, are important elements in the South African economy. Compared -tp industrialised countries, South Africa has-had a higher growth rate and a higher inflation
CHAPTER 4 DESCRIPTION OF DATA . PAGS 116
= = = = ='Growth Rate
A (Real change in GDP)Inflation Rate (CPI increase)
Industrialised , Iridus trialisVdYear SA Countries ■ ' SA Cou£ti?£*e ■i-”?11973 3,9 9,4 ; ^ -1974 7,1 0,6 11,7 - , . 1 ^ 4 % ;1975 r 2,2 -0,5 13,51976 1,5 4,9 11,1 _ ; '1977 0 r, 4,0 " 11,3 - -1978 2,9 4, 0„ 10,9 6,3' . \ '^1979 4,1 3,6 13,2 : - 3,6..' ,'1980 , 7,8 1,3 13,8 11,71981 5,1 ' ^ 1 , 1 - " 15,2 9,3' .1982 -0,9 0,3 14,7 6,91983 -2,2 3,02 12,2 3,7
| 1984 5,23 3,92 11,7 3,9 r1985 , 1,36 3,12 16,2 f 3,9 r1986 1,07 2,17 18,6 - 1,7_
9Average
I— — J2,63 2,62 13,1 7,8
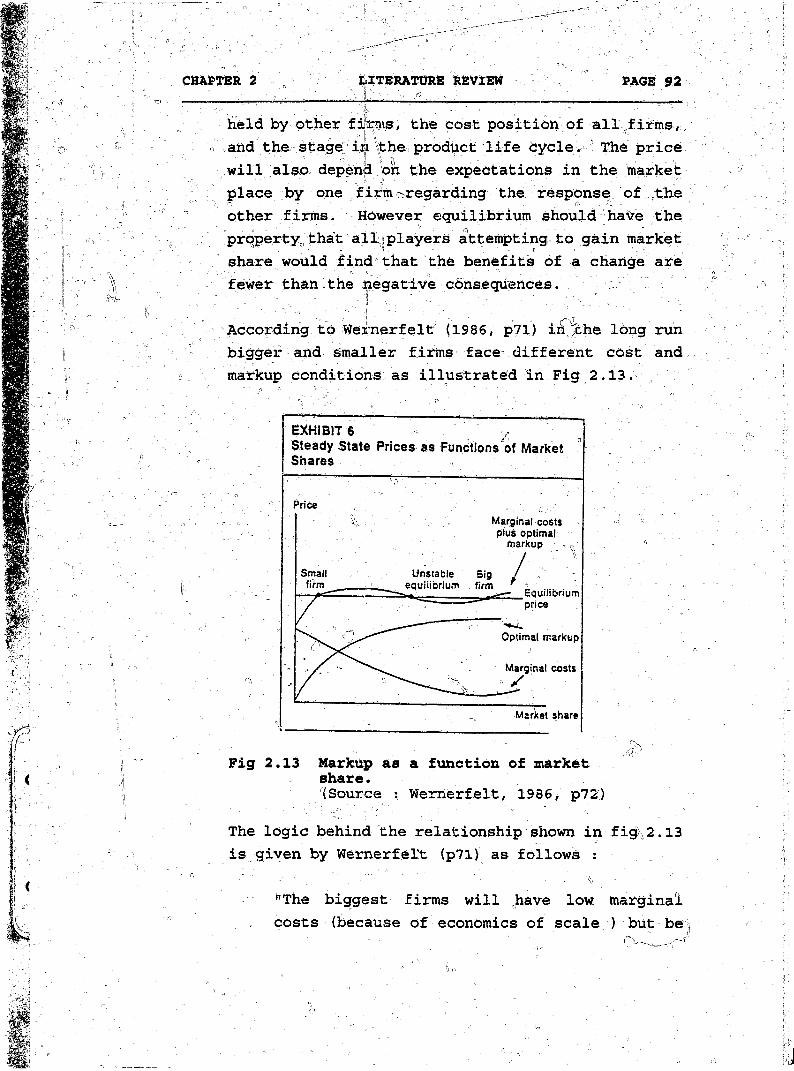
Table 4 .1 - Comparison of Growth' and Inflation Rates(Sources : International Monetary Fund arid SA Reserve Bank) ’ " % ,' o-
rate over the past 10 to 15 years. The table below shows growth and inflation rates for South Africa against the average of 5 industrialised countries.
Another feature of developing economies according to Myint (1967) is the financial dualism which exists. This dualism comes from a blending of the previous third world peasant economy based on agriculture with the first world industrialised sector of the economy. This leads to an uneven distribution of personal income and a concentration of wealth. In a study in South Africa in 1982, reported by de Wet (1987) more than 50 per cent of the total income was received by less than 2 0 per cent of households, and more than 30 per cent by less than 1 0 per cent of households, Wi.ile the poorer 30 per cent of households received less than 1 0 per cent of theincome. Also due to this financial dualism therejj 1 _ :exists substantial unemployment: despite the

CHAPTER 4 DESCRIPTION OF DATA PAGE 117
~ relatively high growth in the country. Maasdorp (1978, pl44) reported unemployment in South Africa at 11,1% of the economically active pdpul at ion. The S concentration of economic power in the hands of a small nupber of major economic players, leading in turn to, reduced competition. ^
Clearly, there are structural differences between a developing, economy like that of South Africa and an industrialised economy like that of the USA. Also, j it is common cause that • the environment effects
“ strategy formulation and implementation, .olt is therefore likelyythat South African businesses will differ in both strategic posture and capital structure whin compared to businesses in industrialised countries.
4.4 INTRODUCTION TO THE DATA BASE
The data that was - used in the analysis was a data base consisting of 103 Business Units that had been collected by two researchers in 1983/84. The data was collected . during extensive consulting assignments with the companies concerned and hence represented an in-depth analysis of the strategies of these companies. , -
The format of the data is approximately the same as that of the PIMS Limited Information Model with two
" exceptions which will be discussed later. Only cross-sectional data was available with each Business Unit having only a single year's data on record. The year that was covered is from the period 1982/83/84 depending on the company's year- end and the availability of the data.
CHAPTER 4 DESCRIPTION OF DATA PAGE 118
All the companies that contributed to the data base c were:companies that were operating in South Africa
during the 1982/83 period although could have been part of multi-national organisations. The rest of this chapter is devoted to a brief description of the data and some comparisons of the data with similar USA data. ' This is not meant to bd a
: comprehensive statistical comparison to be used to; justify generalisation of results across:
geographical boundariesf but merely a descriptive overview of some of the characteristics and features in the South African data which are different to what might be expected from work done in other countries. ‘ ^
4.5 INDUSTRY REPRESENTATION
There are 103 Business Units represented in the data base and they are drawn from different industries in
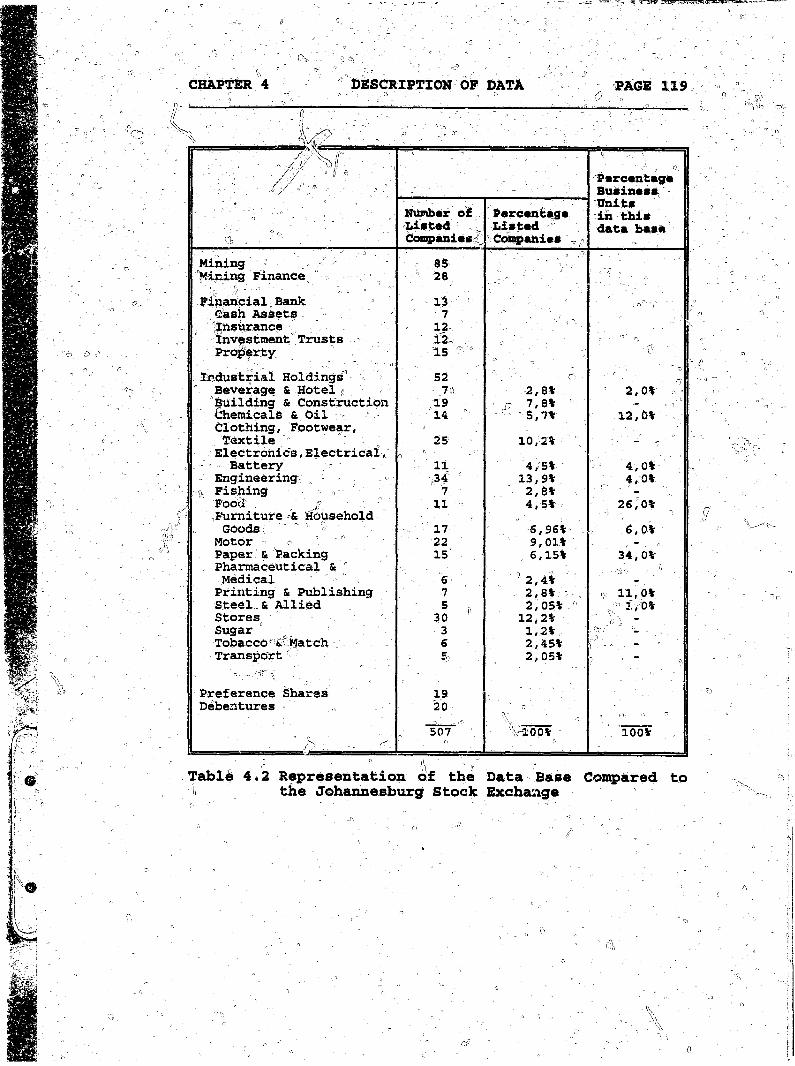
V , the South African economy. The sample was not drawnusing any specific sampling technique, but was determined? by the "random" selection of Companies for consulting work. The result is that some industries are more heavily represented than others. To give some dimension to this bias, a comparison was done against the percentage of listed operating companies, on the Johannesburg Stock Exchange at approximate1y the same time. Table 4.2 represents the number of companies in each sector expressed as a percentage of the total number of industrial operating companies and is compared to similar figures for business units in the data base.
CHAPTER 4 DESCRIPTION OP DATA PAGE 119
' V ; ,
% - . - =
PercentageBusinessUnits in this data base
Number ofListedCongpanies
Percentage Listed Companies ^
Mining 85Mining Finance '' 28Financial Bank 13
Slash Assets 7insurance 12Investment Trusts 12 . ;‘Property 15 °
Industrial Holdings' - 52 T)Beverage & Hotel f) . , 70 2,8% 2,0%Building & Construction 19 » n 7,8% ' — f;Chemicals & Oil 14 ” v - 5,7% 12,0%Clothing, Footwear,
I Textile 25 10,2%Electronics,Electrical,Battery 11 4,5% 4,0%
Engineering ^ 34 ’ 13,9% , 4,0%i:s Fishing 7 2,8%- Fooii ; ^ 11 4,5% , 26,0%furniture & Household
Goods 17 5,96% 6,0%Motor - o 22 9,01%Paper & Packing 15 6,15% 34,0%
- Pharmaceutical s "Medical 6 ? 2,4%Printing & Publishing 7 2,8% n , o %Steel,, & Allied 5 2,05% i, o%Stores 30 12,2%Sugar 3 1,2%Tobacco i- Match 6 2,45%Transporti- ’ 5 2,05%
Preference Shares 19Debentures 20
: V ■ ' ' n507 '■ 100% 100%
Table 4.2 Representation of the Data Base Compared to 11 the Johannesburg Stock Exchange

CHAPTER 4 DESCRIPTICit OF DATA PAGE 120C_ - ; ; n _ ;; V • ^ , -;
4:6 THE FORMAT OP THE DATA F i _
CT\ ' % " /' n ' ' :The drta is presented in the same format as the PlMS, Limited Information Model as described by, for example, Abell & Hammond (1979) . The data was
o collected strictly in accordance with the^requirements of the Strategic Planning. Institute forthe collection of PIMS Limited Information data.Appendix II gives the details ,of the data sheet used and the SPI worksheet used for detailed calculatiohi Definitions of all variables used in the PIMS? LIM model are -given in Abell and Hammond (1979, pp 271
& 346), and detailed definitions of market share and- profitability are given in Appendix JX., Appendix I
gives a brief discussion of the validity of the PIMS approach. There are two differences in the format of the data presented in this report compared to PIMS, which are as follows: ' “ f
1. Relative Price (item No. 4 has been left out completely)
2. . Customer concentration. The standard PIMSc(Limited Information n Model) variable for measuring this is defined as the percentage of customers that account for 50% of sales. ’ In the data presented in this report , the measure of customer concentration is defined as the number of customers that account for 50% of
„ sales. (The full PIMS model has both\\ . measures).
The above changes were made by the Strategic Planning Institute as a refinement of the Limited Information Model after the date of
CHAPTER 4 DESCRIPTION OF DATA PAGE 121■ -~v " • : : H , ~ - r ^ ' •
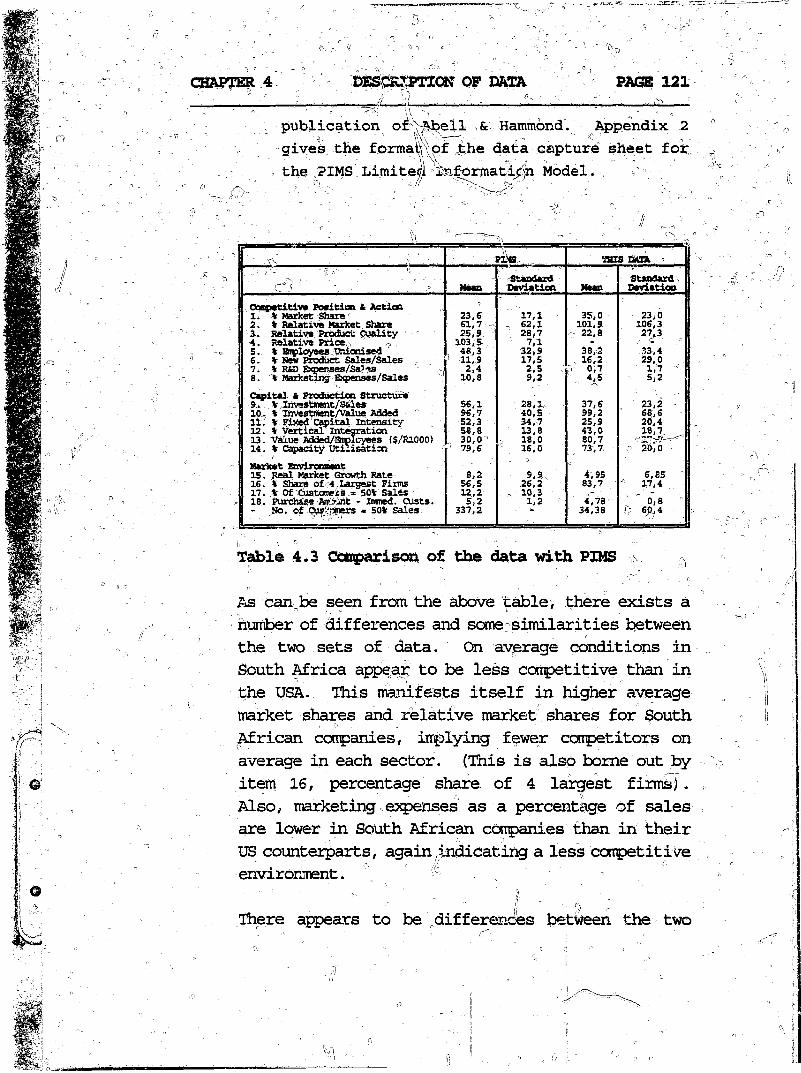
publication of^bell & Hammond. Appendix 2 gives the format of .the data capture sheet for the PIMS Limited SBformatijjin Model.
Tx. ’ nW-■ PIMS, ■mrs dAXA
- Mean -StandardDeviation Mean Standard - Deviation, Oonpetitiiw Position t Action1. % Market Share2. % Relative Market Share3. Relative Product Quality4. Relative Price-,5. % Biployees Unionised6. tr New Product Sales/Sales7. % RID Expenses/Sa’ .s8. V Marketing Expenses/Sales
23.661.7 -- 25,9103,5 . 48,3
10.8
28,77.1
1.1
35,0101,922,838,2
, 16,2 V 0,7
4'5
23.0 106,3,2V33,429.01,1 '
Capital 6 Production Structure9. % Invesbnent/Salea 10- % Investment/Value Added11. t Fixed Capital Intensity12. t Vertical Integration13. Value Added/Employees ($/R1000)14. % Capacity Utilisation
56,196.7 52,356.8
„ 30.079,6
28,1-40,5
' 111
37.6 99,2 25,9 43,080.773.7
23,268,620,418,7 _ f 20,0
Market Environment15. Real Market Growth Rate16. » Share of c4-Largest Firms17. * Of Customers - 50% Sales18. Purchase Aiv>irit - lamed. Ousts. No. of Cus'rtmers » 50% Sales
si;!i f337,2
9,926,2-
4,95 83,7 -4,7834,38
6,85 " 17,4; " o,860,4
Table 4.3 Comparison of the data with PTMS .
As can be seen from the above table, there exists a number of differences and some similarities between the two sets of data. On average conditions in South Africa appear to be less competitive than in the USA. This manifests itself in higher average market shares and relative market shares for South African companies, implying fewer competitors on average in each sector. (This is also borne out by item 16, percentage share of 4 largest firms). Also, marketing expenses as a percentage of sales are lower in South African companies than in their US counterparts, again indicating a less competitive environment. ^
" I ') " :There appears to be differences between the two

CHAPTER 4 DESCRIPTION OF DATA PAGE 122
countries in the way technology is rused. R&D expenses in UiSocarpanies are high compared to South Africa whereas the sales of new products are lower. This could perhaps be explained by the fact that South African companies largely import technology and do not^ conduct fundamental research on a large scale. The result is they are able to introduce a relatively high level of new products while spending relatively less on R&D (clearly. South African companies would have to pay mo^e royalties than US companies if this were true). C
The capital structure of the companies in the different countries are predictably different. The difference in items 9 (Investment/Sales) and 11 (Fixed Capital Intensity) show that South African companies are less capital intensive (and therefore, presumably, more labour intensive) than US companies. ,
This difference was to be expected, considering the differences in socio-economic conditions between the two countries. It is interesting to note that South African - firms appear to be less vertically integrated than US companies.
/

CHAPTER 5 STATISTICAL ANALYSIS PAGE 123- — — - ; ' : ■ ;
CHAPTER 5 STATISTICAL ANALYSIS OP THE DATA
5.1 INTRODUCTIONThis chapter starts with a definition of what is meant by the 1 importance of market share' and then goes on to describe the environmental variables included in the data coase. Section 5.2 describes the initial cluster analysis that was done using 9
variables (4 environmental variables and 5 capital structure variables) . The initial analysis was done in a fairly loose and unconstrained way, and capital structure variables were included initially to see whether they would add any colour .or understanding to the analysis. The result of the cluster analysis showed that the importance of market share was distinctly different in each of the two main clusters (environments) created.
Section 5.3 describes the detailed analysis that was done, where the same 9 variables were used, except this time the variables were standardised and factor analysis applied before clustering , which is the correct (more rigorous) method of analysis. The result of this procedure was that the differences (in the importance of market share) that had been present in the previous clusters disappeared completely. Clearly, in the initial analysis, one particular variable (or a particular combination of variables) had been dominating the cluster analysis (probably by virtue of having a range much greater than the other variables) . To identify which variable(s) was (were) dominating the analysis (so that the differences obtained in the initial analysis could be explored, which was the objective

CHAPTER 5 STATISTICAL ANALYSIS PAGE 124 - /' ' . ■ - , ~ ' ~
of the exercise) a factorial design was adopted where each variable and each combination was tested separately. Only the 4 environment variables were used in the analysis because, strictly speaking, only the environmental variables should have been use&x in the previous analysis, but the statistical tools used could easily accommodate mbre variables and it was thought likely that the extra variables would give extra understanding. In the factorial design .where each.. variable and combination of Variables was tested separately (using cluster analysis) the number of variables was cut down to the ^minimum in order to limit the number of combinations. Using this procedure the variable causing the initial clustering was isolated and analyzed.
5.1.1 The Objectives of the Analysis1 ' X. . . 1 ■' . . . "
The objective of the statistical analysis of the data was to determine, whether there are any environmental factors or conditions which affect the relationship between market share and profitability. Specifically, whether there are some environments where market share is highly correlated with
i profitability and other environments where there is Vio significant correlation between market share and profitability. Also, if this is the case, what are the factors which define these environments and which are the environments where market share is relatively most important?
Before proceeding with the analysis, the term "importance of market share" needs to be defined and quantified. Within the context of this study, market share is deemed to be important for strategy

CHAPTER 5 STATISTICAL ANALYSIS PAGE 125
formulation purpose a if the following condi tidhs are sahiefied:' 'Y " - /. - .
' v Y " :-- i ; : , ^ •? (a) Market share has a significant, (positive)affect on profitability.
(b) The scatter of observations about the trend is not"so_. large as to completely swamp the trend.
(c) There is a causal influence of market share on n profitability, even ifn this is indirectly achieved via a third factor (e.g. advantages of scale) as long as the causal link Is not broken. i.e. Higher market shat#;: implies larger advantages of scale which Implies higher, Q return on investment. '
In conducting the statistical analysis of the data only the first two conditions were considered. ^ Although there have . been many innovative applications of path analysis and other methods to deduce causality in PINS and other data, (e.g. Alwin
„ and Hauser, 1975; Duncan, 1971; Oliva, Day andDesarbo, 1987) the limited number of data points available eliminated these methods. Therefore, at this stage no attempt was made to infer Causality and this was left to a finer grained methodology in
? the next phase of the study. Also, for the remainder of this study, only linear analysis is used. The exclusive use of linear analysis to model the relationship between market share and profitability
. was justified on the following bases:
1 . All serious previous studies thjat analyzedcross-sectional data used line/ir analysis.This includes Bain, 1951; Shepherd, 1972;

CHAPTER 5 STATISTICAL ANALYSIS PAGE 126~ - V ' -________ JL;
Buzzell efc al, 1975; Buzzel.1 and Wiersema, 1981; Phillips et al, 1993 and many Others.
t2. Some authors have ' proposed a non-linearrelationship between market share and profitability. The most notable^, of these is Porter (1980) who claims' a shaped"« curve exists. POrter does not burden his reader with
0 any detailed proof (or in fact any detail) butmerely states that this tJ-shaped relationship "appears to hold in the US fractional horsepower electric motor business" (Porter^ 1980, p43) . ’ If this is the case, then the
s electric motor business in the US appears to beunique because no other researcher has reported
" evidence of U-shaped curves in other industries. ■. ■
3. A visual inspection of the data was done (see, page 292) and no obvious non-linear pattern . emerged, and therefore, using the 'keep it
simple 1 principle, only linear analysis was" done.
For the purposes of the analysis the two conditions considered above are quantified as follows': -
(a) A significant pps.itiYS-.flf£a.gt..Qn-prg.f.itflb.ility,
As discussed above, a number of previous " empirical studies of market share and
profitability (Henderson, 1979; Jacobson & Aaker, 1985; McLagan, 1981; Newton, 1983; Zeithaml and Fry 1984; Buzzell et al 1975) all postulated that within certain ranges, there is a linear relationship between market share and

CHAPTER 5o' » - „ ^
STATISTICAL ANALYSIS PAGE 127
, profitability.” Therefore, for tfoi purposes of this analysis,,the relationship between market share and profitability will be assumed to be
; linear.. The average value of the slope of thelinear regression of market share and profitability was found to be 0,5 by Buzzell et al (1975). (i.e. a 10% increase in market
5 share results in a ,5% increase in ROI.) Thusfor our purposes, market share is defined as "important" when" the slope of the linear regression is greater than 0,5.
(b) rlhe s.ga.ttex-.,mus.,t-,not_s.w.ainp the, trend fStatistically, this is interpreted to mean that there must be a strong correlation between market share and profitability, i.e. that there is a negligible chance of the trend being the result of random process. For the purposes of
. the analysis, this is measured by computing thesum of squares explained by the regression model and comparing that to the total sum of squares and applying an F-test to test for significance. In this regard, since we are in essence "combing" the data base for trends, a very high level of significance will be required, . and 0,5% was taken to be an appropriate significance level, with 0,05% being regarded as highly significant. <\
5.1.2 The Environmental Variables
The PIMS Limited Information Model has 18 variablessplit up into 3 categories. These are:
Competitive Position and Action

CHAPTER 5 STATISTICAL ANALYSIS PAGE 128
Capital and Production Structure
There ar& 4 market environment variables which are:- - * ; - ; ■
Real Market Growth Rate
Industry Concentration - defined as the share of the 4 largest participants in the market
Customer Concentration - defined as the number of^customers that equal 50% of sales.
The typical purchase amount of individual sales to each customer
These 4 variables will be used in various combinations to define " environments11 where businesses operate under similar external conditions. n ~
5.2 INITIAL ANALYSIS
5.2.1 Introduction
The initial analysis was done in a fairly loose and unconstrained way with the primary objective of exploring the data to lock for trends and characteristics phat might be interesting or throw some new light on the problem. Although the first part of the analysis was not rigidly Structured the following steps were done.

CHAPTER 5 STATISTICAL ANALYSIS PAGE 129______________________ V ' ' ' : ' ■ ' ■ ■" - -. ' . - r- - - - % T ' - -
5.2.2 Graphs and Charts-- " n - ' . - - ' - - -
.': . - ' - - ' ' '' ' /- .- - - The first step was t<5 get a pictorial view of th, 6
data, and to facilitate this various graphs andcharts were plotted (see Appendix I I I ) . It soonbecame obvious that the data included a number ofoutlying points which were far removed from the bulkof the data and which would make analysis verydifficult. The decision was taken to removeoutIyers on the following basis:
- -(a) removal of obvious errors (e.g. where a variable has a minimum value of zero by definition, but a particular observation has a negative value. In these cases every effort
ra was made to go back to source and correct the r; observation but this was not always'possible
and the observation was deleted from the data base) . 0 : f, If-.
(b) rempyal of points t, that were greater than the mean plus 4 standard deviations (or less than the mean minus 4 standard deviations). Although this limit was set, only two points that were removed were closer than 8 standard deviations from the mean.
A total of 13 observations of the 116 in the original data base were removed by applying the two criteria above.
5.2.3 Initial Cluster Analysis- ' ' _ * , ' ’ '
i Cluster analysis has been used very effectively on the PIMS data first by Woo & Cooper (1981) to study effective and ineffective low share businesses and

CHAPTER 5 STATISTICAL ANALYSIS PAGE 130
later by many other authors, for example Hambrick (1983) used cluster analysis to define environmental settings for the study of strategic typologies. Cluster analysis consists of a family of algorithms designed to identify similarities in the data anh classify the data* into different groups depending on" -V r, ' » ' ., the value of the variables used in the cluster analysis. Essentially a cluster consists of observations that correlate highly with one another, and have comparatively , low correlations with observations in other clusters. Clustering techniques can be used to separate data into two or more natural clusters, such that, within any onecluster the points are relatively "dense" or close' ^ o - ' ", -together, while few points are found6 between theclusters.
In many ways cluster analysis is ideal for research on PIMS type data and has become increasingly popular amongst business analysts and researchers. Therefore the next step in the initial analysis was to apply cluster analysis on the data using all the environmental variables described in Section 5.1.2 and some selected structural variables._ The SAS, statistical package was available and the FASTCLTJS Procedure was used. The variables used in the cluster procedure were:
) , oMarket Growth (MGR) fIndustry Concentration (ICO)Customer Concentration (ICU)Purchases Amount (PCU)Capacity Utilisation (CUT) nReceivables to Sales Ratio (RSL)Fixed Capital Intensity (GVS)Vertical Integration (VAD)

CHAPTER 5 STATISTICAL ANALYSIS PAGE 131-.1 • jr ' - " ■ ~i r ' - -
-----------------------------:--------— ----------------------------------- i. „ ■■■ • •• ......... ..... ...............^ ----------------------------------- --------------- ■ i . - r ............... a ..C? ^• "i^^strnent to Sales Ratio "(INS)
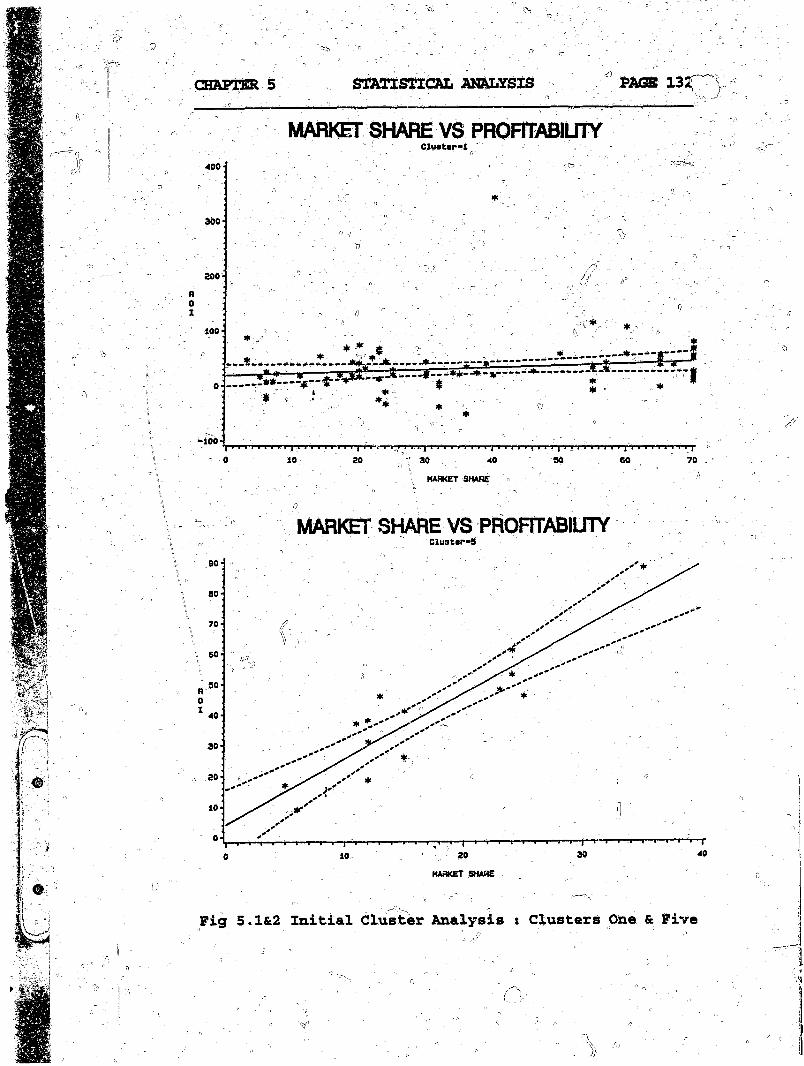
„ As a fir^t analysis 5 clusters were used and graphs . were plotted of market share against profitability
for each of the clusters. , „
The result of this analysis was that Only clusters 1 and 5 had more thah two values, and the result of the graph plotting is shown in Figure 5.1 and 5.2
n below. (See Appendix XI for. a discussion of the other clusters.)
As can be seen the importance of market share is 5 substantially different in the two environments. It •was decided that a more refined analysis should be designed to explore which, of the environmental variables was responsible for the differences in the importance of market share.
STATISTICAL ANALYSISCHAPTER 5
MARKET SHARE VS PROFITABIUTYCluster"!!
400
300
800
-1007010 20 40 50 60
MARKET SHARE
MARKET SHARE VS PROFITABIUTYCluoter-5
BO
70
60
m0140
302010MARKET SHARE
Fig 5.1&2 Initial Cluster Analysis : Clusters One & Five

CHAPTER 5...__________Al
STATISTICAL ANALYSIS PAGE 133
5.3 DETAILED ANALYSIS
5.3.1 Factor Analysis and Standardised Data
As pointed out by Galbraith & Schend®1-, (1983) when using cluster analysis on the Plmi, iata base to analyse strategy types, the data should first be standardised because PIMS variables are typically" measured in non-compatible units. Then principal component analysis or factor analysis can be used to reduce the number of variables considered,r and cluster analysis applied to the reduced number ofVariables. (See also Cooper and Weeks (1983, p267)
0for confirmation of this procedure)%
Accordingly, the cluster„ analysis that was done initially was repeated but the following procedure adopted:
1. The data was standardised. The mean of each variable was 6 left unaltered but the standard deviation was made equal to unity. This was done using the SAS procedure "PROC STANDARD".
2. Principal components were obtained by using the SAS "PROC FACTOR" routine and out of theooriginal 9 variables, 3 principal components were retained.
3. Cluster analysis was done using " PROC FASTCLUS" on the principal components.
4. Regression analysis with market share as the independent variable- and return on investmentas the dependent variable was done using "PROCRfG" for each cluster.

CHAPTER 5 STATISTICAL ANALYSIS PAGE 134
5* Market/share vs ROI was plotted for each cluster. '
The result of this was that the high correlation between market share and profitability that was present in cluster number 5 in the initial study was
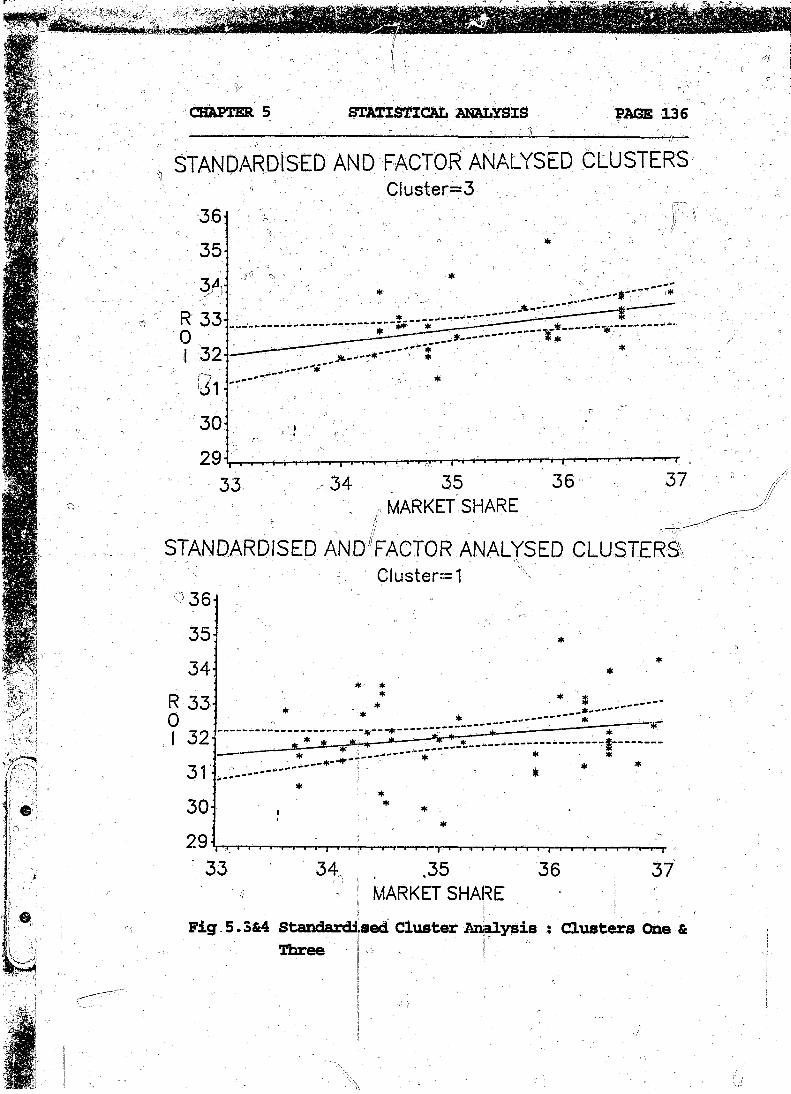
% completely absent from all clusters produced by this procedure. The analysis was done using 3, 4 and 5 factors and it was found that 3 factors gave clusters that had the biggest difference in the strength of the relationship between market share and profitabilityf and hence this was chosen for inclusion in the report.; The factors themselves have no special physical significance but a complete description of the factors in terms of the variables
- they represent is given in appendix IV p321. Briefly, factor 1 is dominated by "purchase amount" and "Customer Concentration; factor 2 is a combination of "Investment/sales", "Fixed Capital Intensity" and "Vertical Integration" and factor 3 is a combination of "Receivables/Sales", "Market Growth" and "Industry Concentration?.
Three clusters had more than two observations assigned to them and the output from the<,,/egression analysis is given in Table 5.1 below: -
Cluster R. Square Slope T Value F Value Prdb > F1 0,1496 0,3i:.l 2,259 5,103 0,03163 0,1726 0,416 1,343 7,805 0,20604 4 0,0068 0,165 0,704 0,496 0,4834
TABLE 5.1 : Standardised Cluster Regressions
Notes The T value is for testing HO: Slope = 0 A plot of market share ys profitability for each of
ft

\ ' -■. - ■; ■. , CHAPTER 5 STATISTICAL ANALYSIS PACE 135
the clusters is presented in Figures 5.3 to 5.5.
5.3.2 Re-design of the Analysis
SrJ: this point it became clear that the statistically correct method of analysing the data (i.e. standardising and factoring before clustering) was covering up the trend that was present when a crude
/ cluster analysis was done On the raw data. Obviously to explore the underlying trend a new approach would have to be employed.
CHAPTER 5 STATISTICAL ANALYSIS PAGE 136
Cluster=336
35
R 33
32
30
293736353433
MARKET SHARE
Cluster=1
35
34
R 33
32
31
30
2933 34 .35
MARKET SHARE36 37
Fig 5. 3&4 Standardised Cluster Analysis ; Clusters One & Three 1 ji »-■
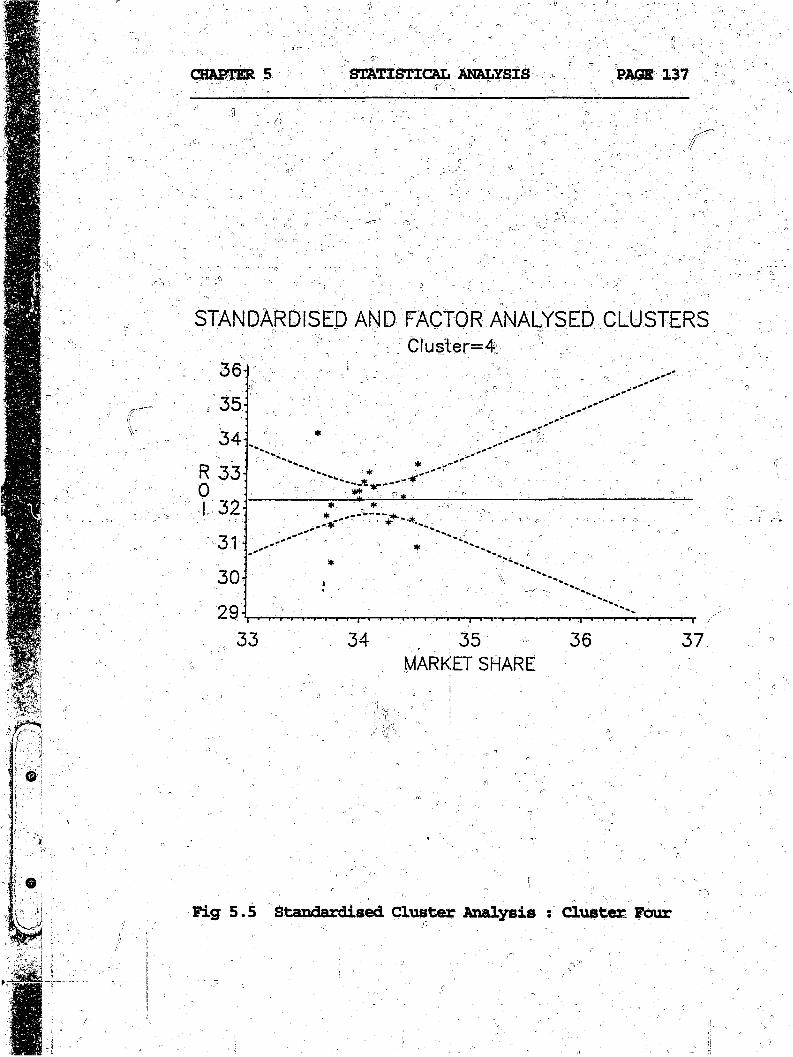
CHAPTER 5 STATISTICAL ANALYSIS PAGE 137
: O
Cluster=4
? | i i , - r ' i | f - r i " T ’t - f : T — i- i | i i i - ...... ; * i i » i i |
33 34 , 35 36 37,MARKET SHARE
Fig 5.5 Standardised Cluster Analysis : Cluster Four

CHAPTER 1
5.3.2.1
STATISTICAL ANALYSIS PAGE 138
Factorial Design
As a way of addressing - the above problem, it was decided to focus on the 4 environmental variables and to try to assess their affect on the relationship between market share , and profitability by testing all possible combinations, of the variables. Previous studies (Hambrick (1983)), had focused only on environmental variables and since the objective of the analysis was to define environmental settings, , the structural variables were omitted.
• ' ■ ' ' 'The procedure that was adopted was then as follows: /
1. Standardise the data.
2. Start with one single environmentalvariable.
3. Et| a cluster analysis on this single variable. j
4. Do a linear regression on each clusterwith market share as the independent^variable and return on investment as thedependent variable. !
5. Print the observations in each cluster. £
6. Plot market share vs ROI for each cluster.
7. Repeat steps 2 to 6 for all combinations

CHAPTER 5A / \
STATISliCAL ANALYSIS PAGE 139
of the 4 environmental variables taking 1, 2, 3 and then 4 at a time. jj :
8. Check the regression outputs for environments which meet the "importance of market share" criteria laid down in Section 1.
5.3.2.2 Number of Clusters
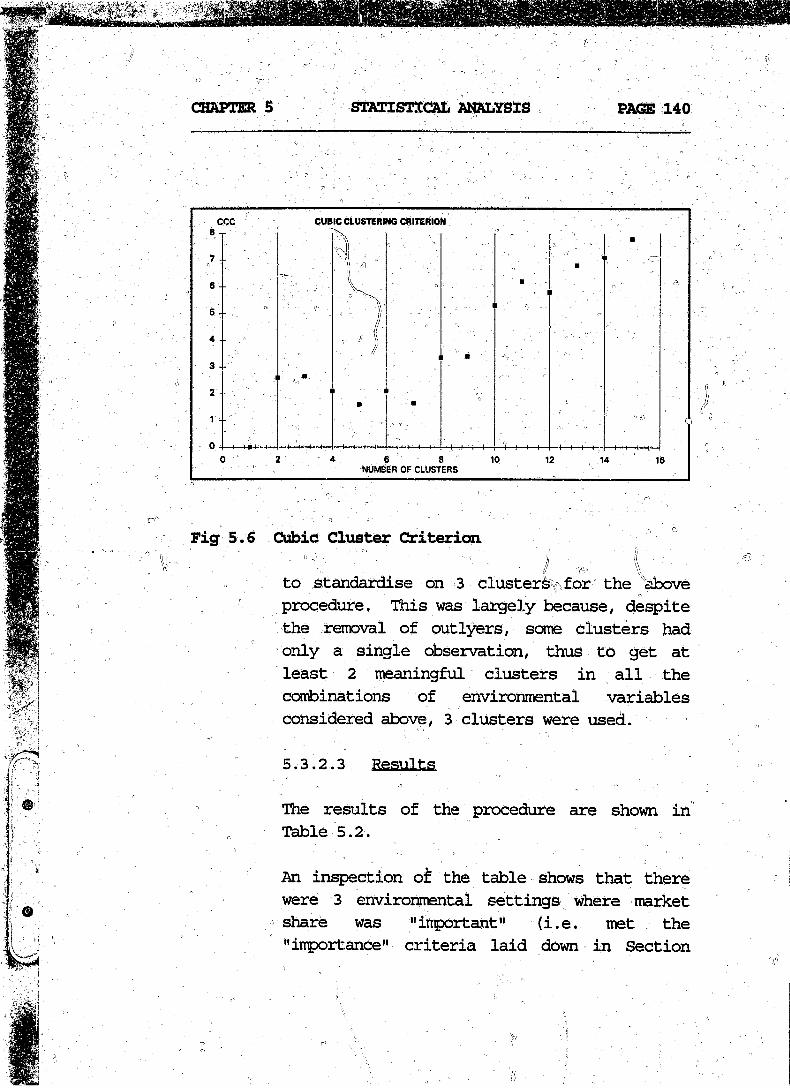
Before the above procedure could be implemented the appropriate number of clusters had to be decided. This always presents a problem to researchers as the number of clusters can substantially alter the results obtained, in the analysis of Section 5.3.1, five clusters had been used. This analysis was repeated using different numbers of clusters to see if any’ natural level could be found, which however, was not the case. Next, the cubic cluster criterion approach as described by SAS Statistics (1987) was used. The plot of the cubic cluster criterion for different numbers of clusters is presented in Figure 5.6. As can be seen, there is a peak at around 2 and 3 clusters and other peaks at much higher numbers.
Additional guidance regarding the appropriate number of clusters cones from Lehmann (quoted in Hambrick (1983) ), who states that there is generally no way to get more than n/30 to n/50 reliable clusters from survey data. For this data, this results in 2 to 3 clusters maximum. After examination of the clusters using some of the environmental variables, it was decided
CHAPTER 5 STATISTICAL ANALYSIS PAGE 140
CUBIC CLUSTERING CRITERIONCCC
6 --
5 --4 --
2 --
NUMBER OF CLUSTERS
Fig 5.6 Cubic Cluster Criterioni , ito standardise on 3 clusters for the above
procedure. This was largely because, despite the removal of outlyers, some clusters had only a single observation, thus to get at least 2 meaningful clusters in all the combinations of environmental variables considered above, 3 clusters were used.
5.3.2.3 Results
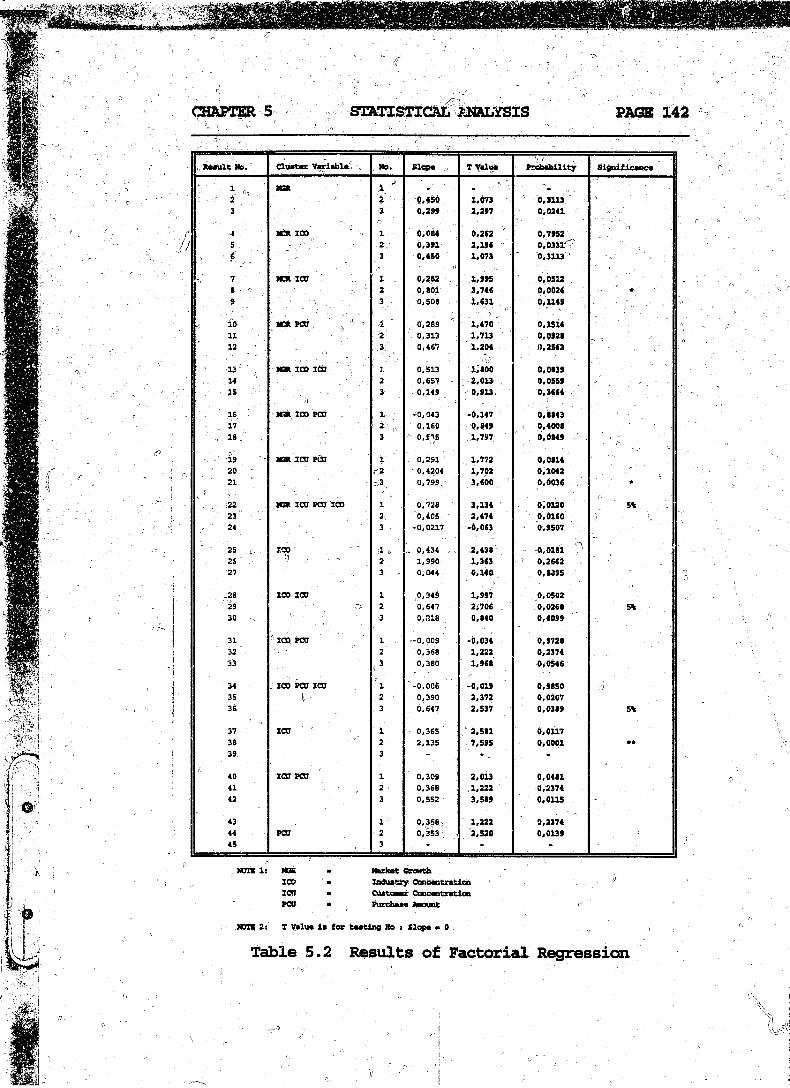
The results of the procedure are shown in Table 5.2.
An inspection of the table shows that there were 3 environmental settings where market share was " important" (i.e. met the "importance" criteria laid down in Section
CHAPTERo ■ -
\
i-
> STATISTICAL ANALYSIS PAGE 141 — — — — - — :— — — - n
5.1) with 3 other environments being significant at the 5% level. By far the most significant of the variables was the Customer Concentration ICU which is defined as the number of customers that equal 50% of sales. As shown by result, number 38, this is highly significant and dominates the clusters in those environments where significance was
_ obtained. When the points in cluster number 38 were plotted they showed exactly the same trend that was present in the initialanalysis. This was checked by printing the identity numbers of the individual businesses in the cluster, and comparing than, with the identities of the businesses in the original cluster analysis. In the case of cluster number 38, a perfect match was obtained.
It is therefore obvious that the customerconcentration variable (ICU) was dominating the initial cluster analysis, and when standardised, this dominance was removed. It was purely as a result of good fortune that the variable that had the largest range was, also the variable that had the most significant effect on the importance of market share. If this had not been the case, then the initial cluster analysis would not have shown any differences in market share's
I> correlation with profitability. However, the above analysis has „ tested all possiblecombinations of environmental factors and, without relying on good fortune, / has identified the most significant environmental variables according to the defined criteria.
" • « r
CHAPTER 5 STATISTICAL JflNALYSIS PAGE 142
h
Result Ho. Cluster Variable {! Ho. Slope „ T V«lu* Probability Significance
: 'i.fV HSR 1 '2 2 0 , 4 5 0 1 . 0 7 3 0 , 3 1 1 33 3 0 , 2 9 9 2 , 2 9 7 0 , 0 2 4 1
< 4 NCR ZOO 1 0 , 0 * 4 0 . 2 6 2 0 , 7 9 5 25 2 0 , 3 9 1 2 . 1 9 6 0 , 0 3 3 16 3 0 , 4 5 0 1 , 0 7 3 0 , 3 1 1 3
7 NCR ICO ■- 1 0 , 2 8 2 1 , 9 9 5 0 , 0 5 1 26 - ” 2 0 , 8 0 1 3 . 7 4 6 0 , 0 0 2 4 *
- ? * " 3 0 , 5 0 8 1 . 6 3 1 o . i i 4 9 ;
i o ICR PCO - 1 0 , 2 8 9 1 , 4 7 0 0 . 1 5 1 41 1 2 0 , 3 1 3 1 , 7 1 3 0 , 0 9 2 11 2 3 0 , 4 6 7 1 , 2 0 4 0 , 2 5 6 3
1 3 HSR ICO ICO 1 0 , 5 1 3 1 , 1 0 0 0 , 0 8 3 9. . .
1 4 2 0 , 6 5 7 2 , 0 1 3 0 , 0 5 5 9 .
1 5F)
3 0 , 1 4 9 0 . 9 1 3 0 , 3 6 6 4
¥ HSR ICO PCS 1 - 0 , 0 4 3 - 0 , 1 4 7 0 , 1 8 4 3. 1 7 2 0 , 1 6 0 0 , 6 4 9 0 , 4 0 0 8
V ' V 1 8 . - 3 ' ■ M l 5 1 , 7 9 7 0 , 0 8 4 9
- ■■ 19 _ ■ Tu N3R ICO PCU 1 0 , 2 9 1 r 1 , 7 7 2 0 , 0 1 1 42 0 ■r-2 0 , 4 2 0 4 1 , 7 0 2 0 , 1 0 4 22 1 -3. 0 . 7 9 9 3 , 6 0 0 0 , 0 0 3 6 •
22, N3R ICO PCU ICO 1 0 , 7 2 8 3 , 1 3 4 0 , 0 1 2 0 5%2 3 2 0 , 4 0 5 2 , 4 7 4 0 , 0 1 6 024 3 - 0 , 0 2 1 7 - 0 , 0 6 3 0 , 9 5 0 7
25 ^ ICO -1 5 0 , 4 3 4 2 , 4 3 8 , 0 . 0 1 8 125 "1 o ' - 2 1 1 , 9 9 0 1 . 3 6 3 0 . 2 6 6 227 3 0 , 0 4 4 0 , 1 4 0 0 , 1 3 9 5
,28 ICO ICO 1 , 0 , 3 4 9 1 , 9 9 7 0 , 0 5 0 229 o 2 0,647 2 , 7 0 6 0 , 0 2 6 8 5%30 3 0,218 , 0 , 8 4 0 0 , 4 0 9 9
31 ICO PCU 1 -0,009 - 0 , 0 3 4 0 , 9 7 2 832 2 0,368 1 , 2 2 2 0 , 2 3 7 433 ,! 3 . 0,380 1 , 9 6 1 0 , 0 5 4 6
34 ICO PCU ICO ' 1 -0,006 - 0 , 0 1 9 0 , 9 8 5 035 2 0,390 2 , 3 7 2 0 , 0 2 0 736 3 0.647 2 , 5 3 7 0 , 0 3 8 9 5 %
37 ICO 1 0,365 2 , 5 1 1 0 , 0 1 1 738 2 2,135 7 , 5 9 5 0 , 0 0 0 139 3 - -
40 ICO PCD 1 0 , 3 0 9 2 , 0 1 3 0 , 0 4 8 141 2 0 , 3 6 6 1 , 2 2 2 0 , 2 3 7 442 3 0,552 3 , 5 8 9 0 , 0 1 1 5 -43 1 0,368, 1 , 2 2 2 0 , 2 3 7 444 PCU 2 0,353 ' 2 , 5 2 0 0 , 0 1 3 945 3 - - -
MOXX 1: HSR - KM*et growthICO • Industry ConcentrationICTT # Customer ConcentrationPCD m Purchase Amount
HOT* 2t T Value is for testing Bo % Slope - 0
Table 5.2 Results of Factorial Regression

CHAPTER 6 INITIAL INVESTIGATION /PAGE 143
CHAPTER 6 INITIAL INVESTIGATION r
6.1 INTRODUCTION r-" - - - . - O ' \ , /' .
This chapter reports Oh the initial study that was done in which a small number of businesses
- were studied in order to understand the causal mechanism at work which underlies the market
f! share/profitability relationship in particularindustries. In Chapter 4 the analysis of the data resulted in two environmental settings
"b /defined by environmental variables) whichexhibited, subs tjant i ally d i fferent relationships between 'market share and profitability. Environment I showed no statistically significant relationship between market share and profitability while environment II (cluster 5) showed a highly significant relationship. The initial study focused on the businesses in environment II and employed a fine grained methodology to explore the,, relationship between market share and profitability and to understand the causal process at work.
6.1.1 ObjectiveThe objective of the research was thus to explore the industries concerned and gain an understanding of:a) the . reason for the correlation
^ between market share and^ profitability
b) the physical mechanism at work andc) the implications for strategy

CHAPTER 6^ "
6 .
5
f C- -- 0 r ^. ^ ' _ __"
INITIAL INVESTIGATION PAGE 144
formulation.0. ''■■■ .
1.2 Hypotheses
A study of the literature led to the formulation of the. following hypotheses. a) Size/scope/learning factors.
Much of the early research on market share ascribed the relationship of market share to profitability to one of the following factors, , allrelating to size/scope/learning.
Learning curve/experience curve (Ghemewat, 1985; Hall, 1985)
- Advantages of scale(Hall and Howell 1985) , 'Volume discounts and supplier.leverage(Porter, 1984; Buzzell eh al 1975)
All of the above lead to cost advantages for the largest competitor which translates directly into improvedprofitability.
Thus the following hypotheses were specified:HI : Experience curve effects are
significant in industries where market share is important.
H2 : Advantages of scale are importantin 'industries where market share is important.
H3 : Supplier leverage is significantin industries where market share

*>
CHAPTER 6 INITIAL INVESTIGATION PAGE 145
, 7 is important.
Price PremiumsThe question of price was specifically separated from the other competitive position variables because of the importance that this is given in the literature. One school of thought (for example Weiss, 1939; Shepherd, 1983;
- ' ifWoo, 1983; Page, 1979) be 1 i eve s r tha t high market share companies have higher prices than competitors, while the other school of thought (for example McGee, 1988; Buzzell et al, 1975; Buzzell and Gale, 1987; Phillips et al , 1983)believes that factors other than price are significant. Therefore it| was thought to be desirable to test the following hypothesis: >- vH4 : The existence of price premiums
for high market share companies is a significant factor in industries where market share is
" important.
Structural Barriers to CompetitionThe argument has been put forward,(Hanan, 1981; Lieberman and Montgomery,1988; Urban et al, 1986; Shaw and Shaw,1984) that market leaders remaindominant because their rivals f ind liu ' .. 1 difficult to challenge the leader. The)/1reason that this is difficult to do islbecause high share companies areentrenched in their existing position byisolating mechanisms and have to be

CHAPTER 6 INITIAL INVESTIGATION PAGE 146
displaced^ from the status quo. This implies that there exists a structural
i - - - - fbarrier which shelters high Share companies from competition. This led to the formulation . of the following hypothesis.H5 : There are significant structural
barriers to competitors in industries where market share is important.
" , - (/6.2 METHODOLOGY
The design of the research methodology was done with no indication of how receptive the chosen businesses would be to this type of research. The hypotheses developed in section6.1.2 were aimed at understanding the reasons for the correlation between market share and profitability and^ the physical mechanism at work, but d o t the implications for strategy
strategyformulation. To understand theimplication^ it was necessary to design. the research methodology so that management' s view of the business was researched (andspecifically management's view of the relationship between market share and profitability) so that this could becontrasted with other views and analyses fromelsewhere in the industry.
A structured questiorihaire was developed (see " ■ »Appendix V) which was designed to testmanagement's views on a number of strategicissues and then to test the hypothesesdirectly. The questionnaire consists of two
CHAPTER 6 INITIAL INVESTIGATION PAGE 147
parts; part I consists of broad questions with non-quant i f iable answers andxpart II much more specific questions with quantiMable answers. Part II is - based on the PIMS format questionnaire with all of the PIMS LlM model questions (see Abell and Hammond, 1979, p355, for examples of the PIMS LIM model) and some additional questions^ designed to test the hypotheses.
: The research procedure was planned as follows:
- 1. Identify the businesses to be researched.2. Make contact with the business and conduct
a structured interview in which all (or as many as possible) of the questions on the questionnaire would be answered.
3. ? Make contact with suppliers or customersof th<§ chosen business and apply the
- relevant parts of the questionnaire.4. Apply the questionnaire to industry
, analysts or industry experts (ifappropriate) I
5. Use secondary sources of data to help analyze specific issues. 1
' 6. Use steps 4 and 5 as a triangu,1 \pnprocedure for the results obtained i\*.s ,ep3. If necessary return to step vto clarify conflicting issues. X. )
6.3 FIELDWORK ? ,f
6.3.1 Identification of the business
The identification" of the business ■: proved to-be a difficult task; in its own '

CHAPTER 6 INITIAL INVESTIGATION PAGE 148- ' ^ ^ " " "
right because the data base had .beeni; . ! , ; ■ ■*;' ■ -
specifically constructed to protect the confidentiality: of participatingbusinesses. !, The particulars of the research methodology was explained to the two researchers : that originallyCompiled the obtained to
■ i i ■concerned.
data and their permission identify- the companies
To, do this, the originalinput documents had to be located and matched to the data S/n the data base. This was a 1 laborious and time consuming task but resulted in the identificationof I: all of the businesses required for
ij 1 j|the initial study, and most of the otherbusinesses. | Care was taken to maintain
- i : . l iconfidentiality whereever possible and the link between the business' name and the code number whs held in a separate data base and only-used in agglomerated form.
After the businesses had been identified, an immediate problem became apparent; 'Of the 13 businesses falling in environment II, 10 were in one particular industry i .e . the paper industry. Furthermore, a superficial investigation showed that the 3 businesses that fell outside the paper industry had all be sold by the original owners and no longer existed in their original form. Therefore the study was reduced to an industry study of the paper industry, thus simplifying the research procedure but making the

CHAPTER 6 INITIAL INVESTIGATION f PAGE 149
results obviously less generalizable.
f 6.3.2 Application of questionnaire
The next major problem encountered was the difficulty experiencedjin obtaining confidential information. | Interviews were obtained (with some difficulty) with senior managers from the businesses concerned and answers obtained to the broader questions in part I of the q u e s t i o n n a i r e . w i t h o u t m a j o r difficulties. However, withoutexception, it proved impossible to get the numerical answers required in part II of the questionnaire. Managers were prepared to give "ball-park" .'-type
v ) answers but were hot prepared to give exact figures, and were uncomfortable wiOh any extensive probing in those areas. ° (Appendix V gives an example of the introductory material given- to management in order to get an interview).
The appropriate parts of the questionnaire were applied to customers and suppliers to the industry without difficulty but this did not compensate for the lack of quantifiable information obtained from the businesses themselves. Other participants in the industry were approached as well as head office Staff and industry observers and, as far as possible, were interviewed as shown in table 6.1. A number of managers were

CHAPTER 6 INITIAL INVESTIGATION PAGE ISO
responsible for two (or more) business units and therefore the 6 managers interviewed covered all 10 of the businesses in question/ ;
Position of Interviewee No of Interviewees
Business unit managers n'6- " - 'Competitors ; \ -Head Offices - jp ■
kustomers/Suppliers 4Industry Observers 1 H
Total ; 18
Table 6.1 Analysis of interviewees
6.4 RESULTS AND ANALYSIS
6.4.1 Introduction
The results obtained from the(} ■ ' ' '' application of the questionnaire instructured interviews are given below.In reviewing the results of thequestionnaire it became obvious that fartoo much information had been requestedin the . questionnaire making itunnecessarily long and difficult toapply. The original intention had beento conduct a detailed, fine grained
CHAPTER 6 INITIAL INVESTIGATION PAGE 151
study into the businesses concerned so as to uncover the physical mechanism by which market ' ihahare affects profitability. The formulation of the 5 hypotheses (discussed in section 6.1) was aimed at splitting the mechanisms into 5 broad categories, but the
» questionnaire and research methodology was designed to give much more detail and colour than merely to accept or
% t,V |reject the hypothesis. In the event, the wide range of detail required by the questionnaire proved impossible , to obtain. However, answers to thequestions concerning the hypotheses were obtained and are listed below. The approach was then modified to take into
« account the difficulties experienced in collecting reliable data; the results of the hypotheses were first obtained and then focused questions were applied at a later interview to probe specific issues in order to get the detailedunderstanding required. ; 0
6.4.2 Test of hypotheses
The results of the questions concerning the hypotheses are given below:
Hi : experience curve. ..All respondents 7 answered "No" toquestion '2.19 therefore Hi can be
. 1 « i irejected.
H2 : advantages of scale.

CHAPTER 6 INITIAL INVESTIGATION' 0 -
PAGE 152
There was a mixed reply to question 2.20 with some respondents p claiming advantages of scale and others not. Therefore H2 could neither be accepted nor rejected and is examined further in section 6.4.3.
H3 : Supplier leverage.Of the 6 business managers interviewed 4 believed that there were volume discounts being applied in the industry but that these were typically small and were not significant. The remaining 2 business managers did not believe there were any differences in raw material pricing. All respondents believed that this w-as not an important factor, (question 2.21). This view was upheld by the major supplier that was interviewed and therefore H3 can be rejected. |
H4 : price premiums.All of the businesses interviewed regarded selling price as a highly sensitive issue and were not prepared to give details. (The same applied to competitors). However, customers wereSimuch mere open in comparing prices. All stated that prices from all participants were very close with little or no variation between suppliers. Prom price comparisons made as a result of tenders received by a particular customer it was obvious thatr there was no correlation between market share and price premium.

CHAPTER 6
fr,
6,
INITIAL INVESTIGATION PAGE 153
’therefore H4 can be rejected. r
5 H5 : barriers to competition.
All respondents believed that the market was open and that there were no specific barriers to competition (question 1.9). In most: cases entry barriers werethought to be low as well. Therefore H5 can be rejected.
4 .3 Detailed analysis of advantages of scale„ ' ^
The above results showed that all the hypotheses could be rejected except for H2, where a mixed result was obtained. The question that , was asked of the interviewees was (question 2.20, Appendix IV)
"Are advantages of scale important in this industry? (Yes/No).(i.e. Would a business double the size of this business have a significantly better return on investment?) "
If respondents answered 'yes' they were asked what specific factor caused the advantage of scale.
There were 8 results obtained for this part of the questionnaire (only the interviews with the businesses (6) and the competitors (2) were used) and the results are given in table 6i2

CHAPTER 6 INITIAL INVESTIGATION PAGE 154
, - : . AriSwer ‘ to" Q2.20’ " •Reason’ . "■: : ; Y r, Better, lower cost systemY Personal selling „ , ^ -Y : ■' f ' Lower inventory costs
. ,y' ^ Lower running costs .Lower invoicing costs
r : _ ^ Small effect on costs in general
N \
Table 6.2 Results of Advantages to Scale Question
: - -
Of the respondents, six believed there were advantages of scale to be obtained in
’ their industry although one of the sixthought this effect was small. All six thought costs would be affected, although they were all vague as to .how this would actually happen. Clearly a more detailed analysis was . needed in this area to
= / ; ,cv uncover the underlying physical mechanism.
More detailed discussions were undertaken , with some of the businesses and later with
two of their customers and the following explanation for the correlation between market share and profitability was derived: ;
Firstly, it must be noted that the marketing key success factors for the business in this industry were well known by the relevant managers because most of the businesses in the industry
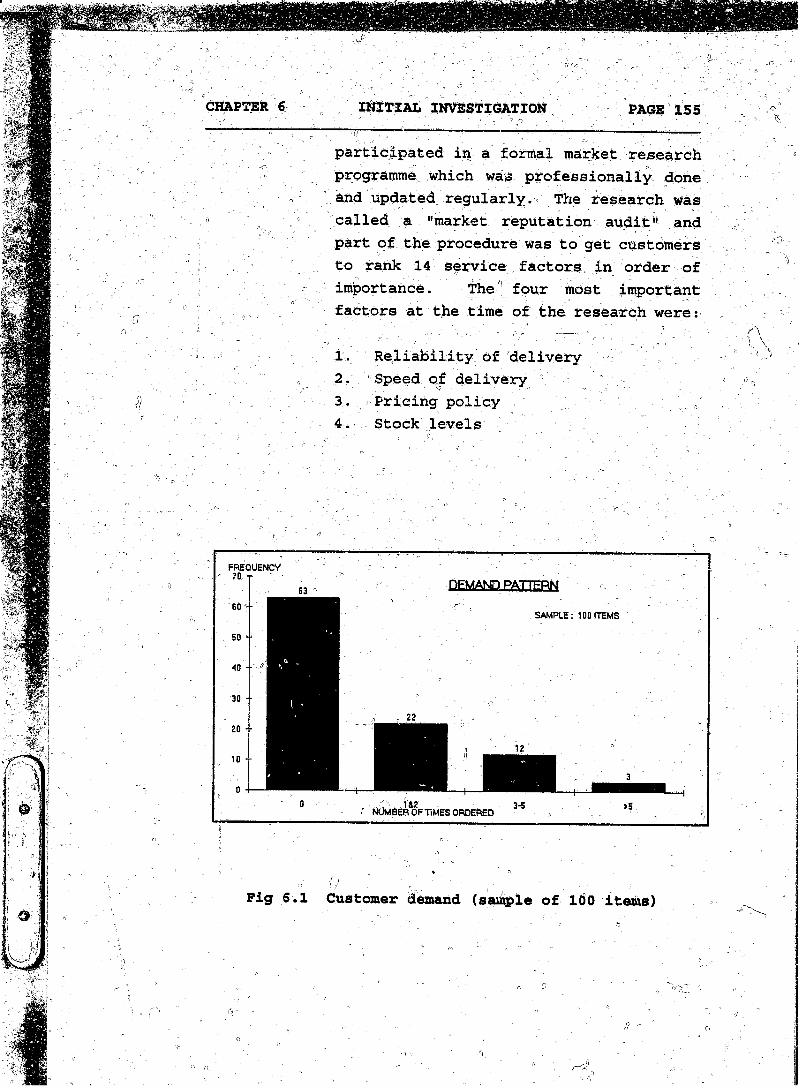
CHAPTER 6 INITIAL INVESTIGATION PAGE 155
participated in a formal market research programme which was professionally done and updated regularly. The research was called a "market reputation audit" and part of the procedure was to get customers to rank 14 service factors in order of importance. The four most important factors at the time of the research were:
1. Reliability of delivery2. Speed of delivery3. r pricing policy4. Stock levels
FREQUENCY 70, j ”
DEMAND PATTERN
SAMPLE; 100 ITEMS
NUMBEFUOF TIMES ORDERED
Fig 5.1 Customer demand (sample of IdO items)

CHAPTER 6 INITIAL INVESTIGATION ? PAG! 156- " ' ' ' ' " ' - ' -
Secondly an analysis of customer ordering' fl11 ' - .patterns showed that a large portion of a
merchant's inventory would be slow moving " with long periods of low or zero demand
_ , punctuated with erratic peaks of high , demand.
This corresponded to the nature of the printing "jobbing" business where Specific jobs require a special paper which is chosen from a vast range of thicknesses, textures and colours.
Typically a merchant would have over a thousand product lines for which stock levels, speed of delivery and reliability of delivery were critical factors. Fig6.1 shows' ah analysis of one customer's ordering pattern over a 7 month period. A sample of 100 items were analyzed and 63% were not ordered once in the period under analysis.
Of the 63 items that were not ordered in the 7 month time period 10 were taken at random and further analyzed over a five year period and found to have inter-order periods ranging from 8 months to 36 months. This erratic demand patterns was seen as a direct result of i the unpredictable "one-off" nature of the printing business,
Using the above information and typical average cost information obtained from the

CHAPTER 6 INITIAL INVESTIGATION PAGE 157
businesses a simulation was done to test whether safety stock and inventory levels could account for the market share/profitability correlation observed in the original data.
>■ ■■ vTo do the simulation the following was assumed: - r ;a) Two similar companies compete in the
same market with similar strategies,b) Each company carries a full range of
products for the market in which they compete.
c) The cost of holding stock (per unit of stock) is identical for both companies.
d) - The purchase price paid for rawmaterials is the same for both
' companies.e) All other costs are the same (per
unit of revenue) for each company.f) Market shares are . assumed to be
different :' ’ company A has 30% market share? and,
company B has 3% market share.
In summary, two companies with no obvious advantages of scale (or disadvantages of scale) are assumed to compete /in the same market.
The demand pattern for both businesses are assumed to * be the same and the demand pattern shown in fig 6.1 is assumed to be typical for customers of both businesses. The simulation starts by focusing on a

CHAPTER 6 INITIAL INVESTIGATION " PAGE 158
single product line and the average stock level required by the businesses in order- to have the same level of service is calculated. (See Appendix VI for more detail on the calculation/method). These results are then used to derive the return on investment for each of the businesses.A summary of the results are given in \ - tables 6.3 and 6.4. j
CompanyA
CompanyRemarks
Average demand (units) 30 3
In line with assumed market share
Standard deviation 19 6 Calculated assuming demand pattern the same
Order quantity i 5 2 CalculatedSafety stock (for
"same service level) 33 9 CalculatedAverage Stock 32,9) - 10 CalculatedRatio : Average - , stock/Average demand 110% 333%
■ _ ^ Calculated
Table 6.3 Simulation of two companies : average stock holding (see Appendix VI for detailed calculation)

CHAPTER 6 INITIAL INVESTIGATION PAGE 159
a
CompanyA
CompanyB Remarks
Purchase (units), • 'V "
30 3 in line with assumed market shares
Price 10 10 Assumed the same (no advantages of scale)
Purchase amount (price x volunie) . ■ <> 300 30 --Stock Holding Costs (30% p.a.)50% fast moving 50% slow moving
% 13,5 50
4,3is.
Calculation based on results shown in table 6.3
Other expenses 200
"" \
20^' Assumed to be the same (proportional to revenue with no advantages or scale assumed) „ "
Total costs ,• 563 69Sales 730 73 Selling prices
assumed identicalProfit 167 « 4Return on investment & 61% ■ 13%
Table 6.4 Simulation of two companies : ROI
■ :The ROI' s for the two companies calculatedin table 6.3 are plotted on the same scaleas the original data and shown in fig 5.2

CHAPTER 6 INITIAL INVESTIGATION, PAGE 160
5
III t
CC O H
Pig 6.2 Conparison of actual ROI with simulated ROI.
SAS 6.0
6 07/
01/94
09:34:
17 028
0GED
CL02
74
CHAPTER
, "'■'6.5
. \
5 INITIAL INVESTIGATION PAGE 161, ^ 'i ; '• /' . '
As can be seen in fig 6.2 the results obtained in the simulation closely track the actual ROI's in the original data.
DISCUSSION .
Within the limitations of the accuracy of the data the simulated mechanism for the effect of market share on profitability totally accounts for the correlation observed in the original data. The result is interesting from two points of view. v
(i) There were no obvious advantages of scale apparent and (in the narrow sense) no advantages of scale were
\ assumed in the simulation. " vA (ii) Managers in rthp businesses. concerned \ realized that there were advantages in
being „ bigger (six out of eight : see \ table 6.2) but did-not fully understand \ -the exact mechanism at work.
After the results of the Simulation were known, 3 of the SBU managers were questioned regarding this effect. All agreed that higher market share resulted in higher average demand and a "smoother" demand pattern, which required proportionately less safety stock to provide the same level of service. Some of the companies had f^cognised this and were - endeavouring to Segment the market and focus on a narrower customer base with a more limited product range and higher average^ demand peb product line. All agreed that this was a likely explanation for the correlation

CHAPTER f INVESTIGATION PAGE 162
In terms of a strategic analysis it is of particular interest to scrutinise the key success factors required by the market and to link them to the appropriate capability in the firms value chain. For example to meet customers needs in terms of speed of delivery, firstly stock must be available, and secondly there must be an efficient system for taking the order, drawing the stock aiid delivering it to the customer. Therefore the capabilities required in the firm in order to meet customers requirements for speed of delivery lie in the "storage and distribution" function and in the "sale and delivery" function. Fig 6.3 gives a graphic representation of the marketing service factors and t h e ; corresponding capability in the value chain.
between market share and profitability
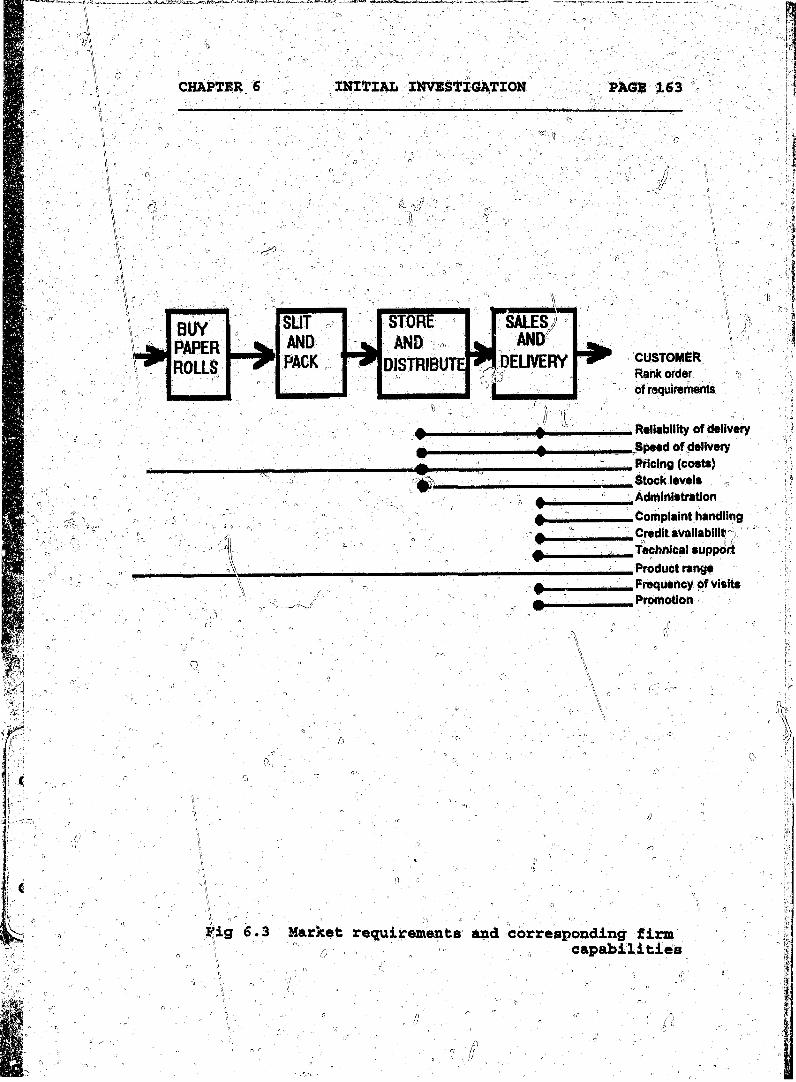
CHAPTER 6 INITIAL INVESTIGATION PAGE 163
STOREPAPER
DELIVERYDISTRIBUTEROLLSCUSTOMERRank order of requirements
Reliability of delivery Speed of delivery
. Pricing (costs)Stock levels Administration Complaint handling Credit availablllt Technical support Product range Frequency of visits Promotion
Rig 6.3 Market requirements and corresponding firm n - . capabilities

CHAPTER 6 INITIAL INVESTIGATIONP' PAGE 104
The market requirements are given in ranked order and it can clearly be seen that the top 4 factors depend on the storage anddistribution capability. As shown by the. - ■ . n i -' _ - .simulation, cost and service level are linked to market shafe in this particular case and therefore this becomes a critical factor for these businesses.
6.6 CONCLUSION
The simulation = cannot be regarded as conclusive proof that the mechanism simulated
" is solely responsible for the correlation between market share and profitability in the industry concerned. However, two factors make this, the most likely mechanism:
1) All ©ther| likely mechanisms wereinvestigated'and eliminated; and,
2) '- Managers agreed that the simulated | mechanism is a plausible explanation for- 3 the correlation. - ' V ,
. ' "" \ \ -For the purposes of this research ;thisevidence was accepted as sufficient and the next phase of the research was undertaken,^ based on the results obtained above.

CHAPTER 7 GENERALISATlCti OF THEORY PAGE 105W - ' - - V - : . ' c l - - V " ■■ '
CHAPTER 7 GENERALIZATION OF THEORY
7.1 INTRODUCTION
In this^ chapter, the results obtained in Chapter 6 are used as a basis to formulate a more general theory. First the central concepts are preciselydefined. Although some of the concepts have been
A ;-
L-
used previously in this research, a precise definition is Critical at this stage in order for the theory to be formally stated.
Next the theory is formally stated in the form of assumptions, postulates and derived theorems (stated I in; the form of hypotheses) . The validity of the theory rests on the testing of the hypotheses which is reported, on in Chapters,. 8 and 9. fi
As brief logical justification for the theory is given and, the,? results from Chapter 6 are put into the new theoretical framework. This is not in any" "A - ' - . .way meant to be^taken as a "proof" of - the theory but
a ; is merely put forward to illustrate that the. theory I is logically consistent. a- \
a -■ ■ v / ; v x7.2 DEFINITION OF CONCEPTS X -
"The Code of Humpty-Dumpty,-,- which allows one to use a word with any meaning One wishes - is much too often invoked as a supreme^ authority on terminological prerogative".
; ; v ". Georgescu - Roegen (1970, p9)
Before the generalization of the theory can commence some of the central concepts require precise

CHAPTER 7 GENERALISATION OP ('THEORY PAGE 166
definitfoif; \ :
7.2.1 Kev Success Factors -
Throughout - bhe literature on strategic o i; planning the concept has been put forward
that il each industry there exists asnVall number of critical factors which have a substantial influence On a firm's profitability (e.g. Boynton and Zmud,
*■„ 1984; Maul ion and Willingston, 1984;- ^ Ferguson and Dickinson, 1982)( These
r _ factors ire known as key success factors(KSFs) (or critical success factors) and have been defined as follows:
"Key success factors consist of the three o. or .four really major determinants of{> financial and competitive success in an
industry. KSFs have to do. with the things all firms in the industry must
Ix ^__concentrabe on doing well, the specific kinds of skills and competencies needed to compete successfully, and which functional^area aspects „ (for example, technical , . expertise, manufacturingefficiency, advertising cleverness and product innovation skills) are the most crucial and why",
(Thompson & Strickland, 1989, plOl).
Ansoff (1984) describes a process for “ getting.to a»key issue list (as part of
impact analysis) which ranks issues according to their impact and urgency. fOther# writers (Yavitz ;& Newman; 1982,

\
\
CHAPTER 7 GENERALISATION OP THEORY PAGE167
p210) describe a process for monitoring only ""the factors, crucial for the success of the plan" and for monitoring external variables that have a similar impact.
Other definitions of KFSs are:
"Those things that must be done if /V - \ company "is, to be successful" X ; r.- )i;- (Freund, 1988, p2d)
"Critical success factors thus are, forany business, the limited number of areas: ■ 1 . ' " " . in- which results, if they aresatisfactory, will^ ensure successfulcompetitive performance for „ the
■ - 0 organisation. They are the few key areaswhere things must go right' for thebusiness to flourish. If the results innthese areas are not adequate, theorganisation's efforts for the periodwill be less than defined". r
(Leidecker & Bruno, 1984, p23)
Perhaps the most simple definition explaining the concept is: ,
"Key success factors* are those variables which management can influence through its decisions that can affect significantly the overall competitive position of the various firms in an industry".
(Hofer & Schendel, 1978, p77)
However, one crucial, extra point is made

CHAPTER 7 GENERALISATION OF THEOF' *;> PAGE 168- , ' / . . . - . "
^ .. " - . . ..' > y de Vasconcellos & Hambrick (1989,/p376yr ' ( " --
success factors are. those tasks^%'r attributes which are 'particularly mandated by the task environment".
.4 n . - ' .n
All of the above definitions seem to describef essentially the same0 concept
, except there is a range of opinion on V what exactly a KFS is. «" n ■ ■ •
"......3 or 4 really major& _^^r>^^determinemts( ^ '
(Thompson & Strickland)
!- - in fs ■ -■ ,"issues" X} (Ansoff)
"factors" (Yavitz & Newman)
" .v.the limited number of areas. . ... " " (Leidecker & Bruno)
"Those things...." (Freund)
" . .. those Variables which management can influence... . '(Hofer & Schendel)
" , i . those tasks or attributed:...."(de Vasconcellos & Hambrick)
Interestingly, of the 7 definitions reviewed, no two authors use the same noun to describe a key success factor. The view taken in this research is that key success factors are:
CHAPTER 7
Cs
7.2.2
0
GENERALISATION OP THEORY PAGE 169- i— ' ■■■- ■ ■
• a limited > number of tasks,■ attributes or variables’ which management can influence
• which are specific to a particular industry and are mandated By the task environment, and
• which affect significantly the overall success of the organisation.
Core Combetencies
The concept of core competencies wasintroduced by Prahalad & Hamel (1990) and refers to the underlying , capabilities that a corporation must have in order to
.,be»s^e§ssful, .
"The corporation, like'a tree, grows from'it'S "roots,. Core products are nourished by competencies and engender business units, whose fruits are end products".
(Prahalad & Hamel, 1990, p81)
This v concept r will be ■„ Used more extensively later but at this stage it is worth drawing a comparison between core competencies and KSFS. KSFs are the requirements dictated by the task environment; W core competencies are the capabilities in the organisation which enable it 'J> to achieve „ outstanding performance in Uhose areas. Clearly,, for
r ‘1 the organisation to be successful there

CHAPTER 7
a
7.2.3
GENERALISATION OF THEORY 5> PAGE 170
must be a fit between competencies and KSFS. , ' »■ ;
For the purposes of this research KSFs" are regarded essentially as static at any particular period in time. However, the point0 has been made (Hamel & Prahalad, 1991) that expeditionary marketing can create a new competitive space where the competencies of an organisation can be applied to change the KSFs of an industry. (e.g. Yamaha's use of digital sound encoding to Change the piano market
: - Hamel & Prahalad, 1991, p84). However, these changes are relatively uncommon and, for the purposes of this research, KSFs are regarded as fixed and static at any-one point in time.
Advantages of scale (AOS) „
The term advantage of scale is used from here oh to describe, in the broadest possible sense, any advantage that may be obtained or accrue to an organisation as a result of being bigger than another organisation. The term includes, but is not limited to, the following:
• economies of scale as classically defined (e.g. McGee, 1988; Shepherd, 1983; Weiss, 1989)
• learning curve effects (e.g. as discussed by Ghemawat & Spence,
r 1985, Gluck, 1985)

CHAPTER 7 GENERALISATION OF THEORY PAGE 171
0 experience curve effects (e.g. as discussed by Hall & Howell, 1985;
: Newton, 1983; Jacobson & Aakef,- 1985; Ghemawct, 1985: Dolan and
Jeuland 1981; Bhattacharya, 1985).
In short, AOS is used to describe any; - " - -- situation where "bigger is better".
7,2.4 Industrv/Business Definition
The Industrial Organisation paradigm can be summarised as follows:
basic conditions dictate market structure which dictates conduct which in turn
"g dictates performance (Scherer, 1980, p4)., . Inherent in this concept is the
assumption that industries can be."isolated and analyzed independently of other industries. The borders of an industry (i.e. what forms part of the industry and what falls outside of an industry) are not clearly defined in the literature. Since the IndustrialOrganisation paradigm has "marketstructure" as a basic building block onemay assume that a market definition could serve as an industry definition without contradicting the 10 paradigm.
This concept also fits in well with thePIMS concept of served market and! their definition of a business unit i.e. "An SBU• sells a distinct set of products and
CHAPTER 7 GENERALISATION OF THEORY a PAGE 172
services
to an identified group of customers
•; in competition with a well-defined C„^t of competitors") . v 1
- (Abell & Hammond, 1979, p273)and,
"The market 'includes all of the products or services, customer types, and geographic areas that are directly related to the activities of the business. For example, it
\\ includes all products and servicesthat are competitive with those sold by the business". '
(Schqeffler, Buzzell & Heany, 1974, p!40)
The question^ of business definition is. \ -- - _ (^^7 ' 'not trivial and is in fact one of the most important strategic decisions that managers make (see for example Hamel & Prahalad (1989) or Abell (1980) for a" " <i g, NV)discussion on how business definition effects future strategic performance).
In this research the view is taken that the served market, defined by management, forms the basis for the definition of the business (see "value chains" below). Industries are defined in a similar way.
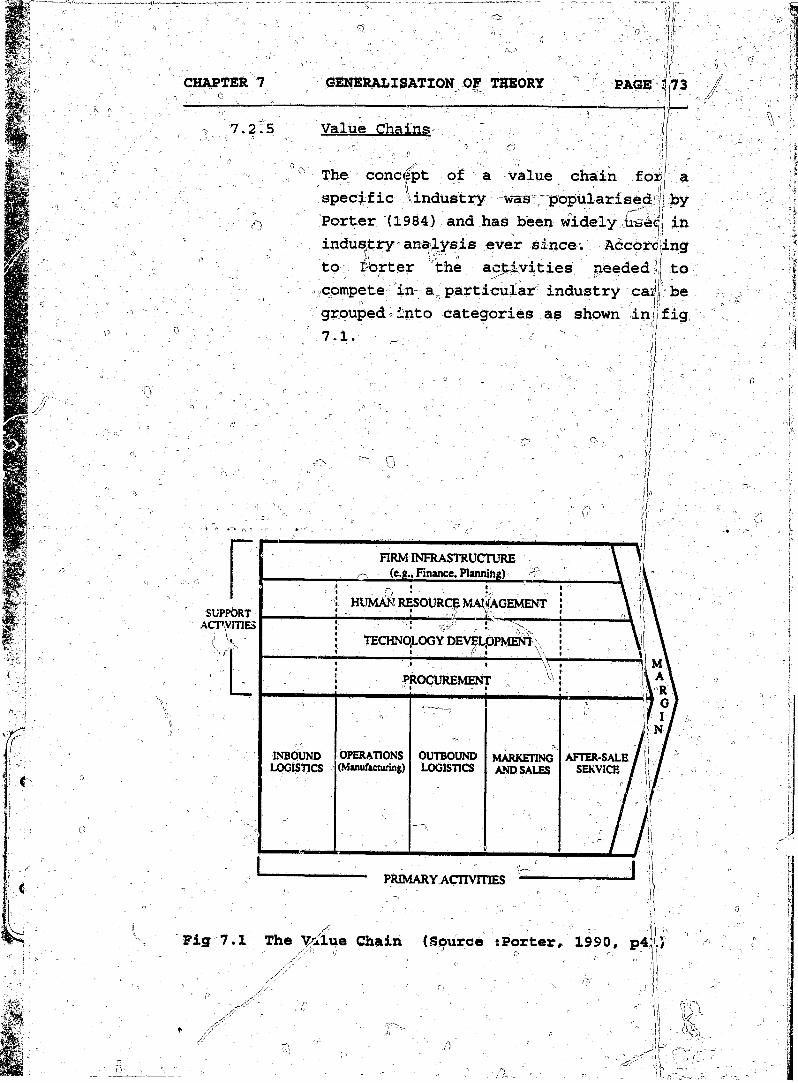
CHAPTER 7 GENERALISATION OF THEORY PAGE 73
7.2.5 Value Chains
The concept of aI-
a
value chain foir a specific industry was popularised by Porter (1984) and has been widely inindustry analysis ever since; According to porter the activities needed to compete in a, particular industry cajjj, be grouped into categories as shown in(fig -7-1. ' ' - -) "
SUPPORTACPymESj \.
FIRM INFRASTRUCTURE (e.g.. Finance, Planning)
HUMAN RESOURCE MANAGEMENT
TECHNOLOGY DEVELpPMENI______L______ l'' -1 \\PROCUREMENTMl I
-
INBOUND OPERATIONS OUTBOUND MARKETINGLOGISTICS (Manufacturing) LOGISTICS AND SALES
'
PRIMARY ACnvmES
AFTER-SALE • SERVICE
Fig 7.1 The Value Chain (Source :Porter, 1990, p4;.}

CHAPTER 7 3 GENERALISATION OF THEORY PAGE 174
Ail the activities' in the value chainr’.. contribute to buyer value. . a ’
:. - / ' . % - -, ^ ;0'-_ "Activities can be divided broadly into
those involved in the ongoing production,1 marketing, delivering and servicing of
the product (primary activities), and those providing purchased inputs, technology, human resoiirces. or overall
o infrastructure functions to support the„ other activities (support activities) .
' 1 Every activity employs purchased inputs,,human resources, some combination of technologies and draws on firm infrastructure such as general management
■ and finance".(Porter, 1990a,p40)
For the purposes of this research• r : f ; . j - '■ ** - * ■ ' i- i . - ; -
Porter's definition of the value chain concept will be used although it will be represented in a simplified form by showing only the primary activities.
For an example of a simplified value chain, see fig 7.2. •
Suppliers'- Buying Manufacturer Distribution Sales — -^-Customer
Fig 7.2 Simple value chain
7.2.6 Industry Specificity
All industries require some inputs which are generally available and not specificto the particular industry under
\\

CHAPTER 7 GENERALISATION OF THEORY PAGE 175 ;________________________________
^ ' "" - " ' ' _ " - . 1 1 consideration. e.g. labour, finance,.;' \ ' electricity etc. However, the extent to
n which these inputs are KSFs, defines the„ 0 level of what is called industry
'’specificity" (SPEC) in this research. If% the KSFS in an industry depend on ,factors ^' ? . , which are specific to the industry then .
' specificity is taken to be hig&. If the* , KSFs depend on factors which are not' specific to an industry then specificity
is taken as low. 11 . , ", ■
7.3 FORMULATION OF GENERALIZED THEORY ?
The proposed theory can be simply and concisely stated as follows: c P "
Assumption I : Market- share is a measure ofthe relative size of a business with respect to 1 other
participants in the servedmarket, but is not necessarily a measure of relative size elsewhere/ in, the value chain.
Assumption II : a) T h e s u c c e s s a n dprofitability of ' an organisation is dictated by a relatively small
>' number of key successfactors.
b) Key success factors may'o * . . -occur anywhere in the
value chain.
Postulate I : Some KSFs are r subject to

. taMfa gteP -saes»4y6to-i-t3S«4iS8rM*es r
CHAPTER 7 GENERALISATION OF THEORY PAGE 176
advantages of scale and some are not,subj Set to advantages of scale. ", ^ p
Postulate II Some KSFs depend on factors which are specific to an industry and some KSFs depend on factors which specific to the industry.
are nota
Postulate III
%
a)
b)
In industries where AOS is Significant and SPEC is high there will be a strong causal relationship between market share and
In industries where AOS is significant and SPEC is low the relationship between market share and profitability will be weaker than III (a) above.
c) In industries where AOS is not significant there will be no causal relationship between market share Jand profitability irrespective of whether SPEC is high or low.
To facilitate the testing of the above theory,' derived theorems stated as hypotheses are given
below.

CHAPTER 7 GENERALISATION OF THEORY PAGE 177
Hypothesis
fh
(i) In industries where AOS is- o significant and SPEC • is
high there is a strong positive correlation between market share andprofitability. " "
- ' " - . "
(ii) In industries where AOS issignificant and SPEC" is low o the correlation
= fi between market share and- profitability will be
weaker than (1 )0 above. ?
(iii)
- _ - /.7.4 JUSTIFICATION
In industries where AOS is ndt significant there will be no correlation between profitability and market share.
n
The above theory was derived by a process of induction and therefore the derivation cannot be completely explained by logic alone. The theory is a generalization of the results obtained in the initial field study reported on in Chapter 6. What follows below is a justification of the theory to show that it is logically consistent. This is not in any way meant to be a proof tif the theory jias theproof rests on the empirical testing hypotheses, not on a logical process.
f the
The reasoning behind the theory is as follows: j
(i) Tf the KSFs -in an industry were subjejct
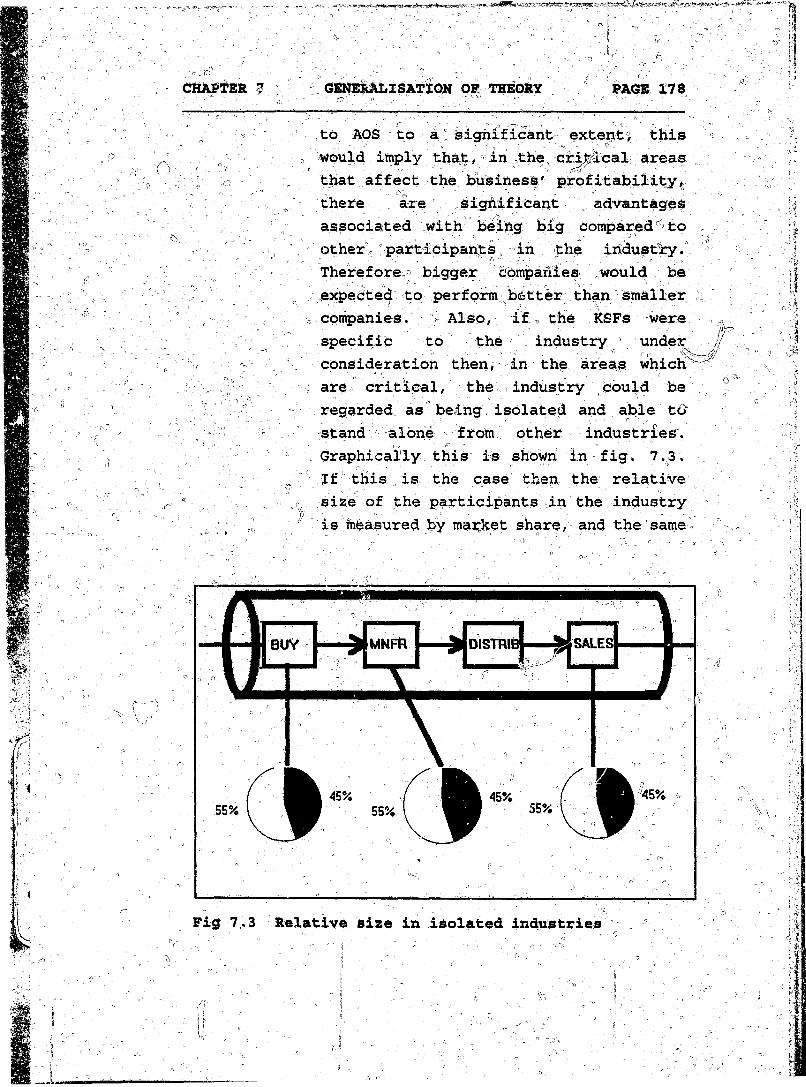
CHAPTER 7 GENERALISATION OF THEORY PAGE 178
to AOS to a ’ significant exterxt? thiso would imply that, in the cri$#.cal areas
that affect the business' profitability,there , are ,, s igni f leant advant age sassociated with being big comparedr toother participants = in the industry.Therefore" bigger Companies would beexpected to perform better than smaller
7 companies. Also, if.» the KSFS werespecific to the industry v underconsideration then, in the areas which
; are critical, the industry could beregarded as being, isolated and able tc>stand alone - from other industries.Graphically this is shown In fig. 7.3.If this is the case then, the relative
n, size of the participants in the industry . . " - - is measured by market share, and the same
DISTRIB
Fig 7,3 Relative size in isolated industries

CHAPTER 7 GENERALISATION OF THEORY PAGE 179
measure (market share) applies at allpoints in the value chain If this isthe case then high ;m|-rj|et share companies will be bigger thai'^fcher companies at the point "in the praxpte chain where the KSFs apply and wili|i clearly then Snjoy the benefits of s c a l e U n d e r these conditions, therefore/ one can expect that higher market share will imply
~ ' P -
DISTRIB SALESMNFR
MNFR DISt RIB
MNFR SA.ES
80% ,
Fig 7.4 Relative size in an open industry

CHAPTER 7\ " GENERALISATION OF THEORY PAGE'!o
higher pyofitabiliby^i.e. a stirbng causal relationship between market share and profitability. ' _ t? |; n.. rIf/ in a different industry/ the KSFs were subject to advantages of scale to au
■ l> significant degree but the KSFs wire not a specific to the industry then market" ehare would not be an accurate measure of
size at the critical points in the value chain. (This is shown graphically in fig
' / -4)' . /- '
- ^ ' .. ' - . ' '' r.\ 'f Fig 7.4 shows a hypothetical example of abusiness in an industry which has two KSFs; one in manufacturing and the other
” in distribution. The KSFs are assumed to ;.=< o , be not specific to the industry but areI'*" ' -- ' .f. " r"'shared with (at least) one other
industry. The pie charts show the relative 'size of the business at the critical positions in^ the value chain. These are hypothetically assumed values but depending on the size of other industries involved could be any valueless than the original market share. If the KSFs are subj ect to advantages of scale to a significant extent i|t is by no means clear how this will effect the firms in industry A. For example firm A1 may only be ctive in industry A and may have the largest market share in market A with 45% (say) as shown in fig 7.4. However there may be another firm A2 wtiich has only 25% of market A but also

CHAPTER 7 GENERALISATION OF THEORY PAGE 181
0 has 25r%- "B' and C. r/ Nov#, by thesame argument as was put forward in (i)
r\ - above firm A2 could be :exp£cted~l:Sf be „r'II ,significantly more profitable, th^n^Ai. ’
In general it could be expected" that lV ■ market share would be a good5 m^igiWe’'‘;of;
" a relative size close to the customer ; en^of the value chain end get progressively worse nearer the supplier end. If this
is the case one could still expect somecorrelation between market T share andprofitability but it clearly would not be as strong as (i) above because of the confounding effect of the otherindustries. ,
(iii) If the KSFs were not. .subject toadvantages of scale it would not matter if they were specific or not specific, one would not expect there to be any significant correlation between market
1 share and profitability.
7.5 DISCUSSION OF RESULTS FROM CHAPTER 6
In chapter 6 a single industry was researched (the paper merchants industry) and it was found that the key requirements from the market could be traced to one key success factor - stock holding. It was shown that the ability to hold stock cost effectively yet j with a high service level is
■ ' 1 X'' ' ' ■'dependent on S»ze i.e. subject to advantages ofscale. It was also shown that the parameters affecting the stock holding ability were specific to the paper industry i.e. there was no way that a
CHAPTER 7 GENERALISATION OF THEORY PAGE 182
merchant could increase his average demand by, for example, selling paper to another industry/market.. The stock holding effectiveness depends on average
' demand and the variatipn in demhnd, both of whiph are specific to the paper industry. (It is interesting to note that in general a stock holding capability would depend on good inventory management skills which are universally available and not specific to a particular industry. However this was not the nature of the KSF discussed in chapter 6 ) .
: - " . • . - ' O ' t
, Therefore, in the particular industry under consideration, the major KSF was both specific to
the industry and subject to advantages of scale. As stated in section 7.3 under these conditions the theory predicts that a strong causal relationship between market share and profitability will exist.
% This was, in fact, the case as shown in chapter 6 .
7.6 CONCLUSION
The theory as stated in section 7.3 rests on the testing of the hypotheses. This is done in the next two chapters.
The question on industry specificity, raised in this chapter and defined in section 7.1, is of critical importance to the main theses of this research. The concept of (KSFs) not being specific to a particular industry cuts across the Industrial Organisation paradigm. It would possibly be argued (by 10 practitioners) that if the industry is properly defined then all KSFs will be specific to the industry i.e. non-specificity is a result of a too narrow definition of the industry. This view is not shared by Prahalad and Hamel (1990) who point out
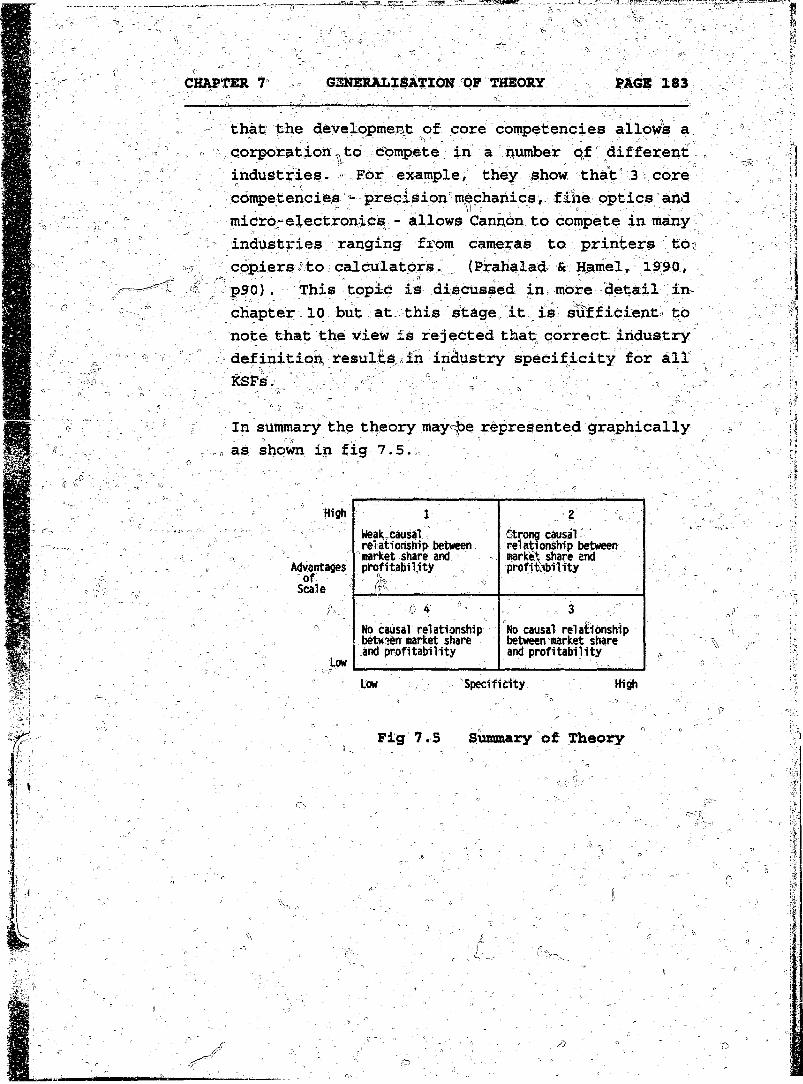
CHAPTER 7 GENERALISATION OF THEORY PASR 183
that the development of core competencies allows a n corporation to Compete in a number qf different
industries. For example, they show that 3 core competencies - precision"mechanics, fine optics and micro-electronics - allows Cannon to compete in many industries ranging from cameras to printers tdo copiers to calculators. (Prahalad & Hamel, 1990,
5 p90). This topic is discussed in more detail inchapter 1 0 but at this stage, it is sufficient to note that the view is rejected that correct industry definition results in industry specificity for all
In summary the theory may be represented graphically as shown in fig 7.5.
High
Advantages ofScale
cs
LwLew Specificity High
1Weak causal relationship between market share and profitab ility
(r^ . '
2Strong causal relationship between market share and profitability
O f - ..No causal relationship between market share and profitability
' ■ , - 3 ^No causal relationship between market share and profitab ility
Fig 7.5 Summary of Theory

CHAPTER 6 v RESEARCH METHODOLOGY PAGE 184
CHAPTER 8 RES^BCH METHODOLOGY
8.1 INTRODUCTION
Chapter 7 dealt with the formulation of a generalized theory and; proposed^ certain hypothetical^ _ relationships > between market share and profitability (depending on industry specificity and advantages of Scale). The purpose of this phase of the research was to test the hypotheses. Chapter 8 deals with the design of th| research methodology and chapter 9 with the application of the methodology and the results obtained. ° n
The major challenges in designing the methodology were as follows: ' =
(i) . to overcome the confidentialityproblem related to getting figures of market share and especially profitability.
(ii) To quantify the concepts such asspecificity and advantages of scale arid obtain an objective-measurement
. system (for those concepts).' \ \ ' ' '
(iii) To have an appropriate level ofdetail so as to have enough data points to obtain / statistical significance while at the same time have enough information to enable the hypotheses to be - evaluated properly.

CHAPTER
8.2
a
" , REiiEARCH METHODOLOGY PAGE 185" r- ' - p, .
This chapter 7 sets opfe^ the approach atidpjted starting wi|h a ; ^iifhstion of the key variables and working 'through to the proposed% c __r:T— » - - o' , .T ^ - . ,
- analysis of results. n >
DISCUSSION OF F-EY VARIABLES
Central to the theory developed in Chapter 7 are the concepts of advantages of scale and whether or not factors effecting performance are industry /specific. The application j?f both these concepts require that a business be broken down and viewed from the stand point of the key success factors which, affect, performance. The various definitions of*key success factors were reviewed in detail in section 7.2 and a specific definition chosen. However, for the purpose; of applying theconcept in a field study, the Hofer and Schendel def inition has;, been used because it is clear, concise and essentially the same as the definition used in section 7.2. . The definition is "those n variables whichmanagement can influence through its decisions that can affect significantly the overall competitive positions of the various firms in an industry" (Hofer & Schendel, 1978, p77) . In summary, the approach adopted was toidentifyjlhe most significant: KSFs and then to examine them to ascertain whether they were specific to the particular industry, andwhether they were subject to advantages of scale.
In adopting this approach there is an inherent assumption that there are a relatively small

CHAPTER 8 RESEARCH METHODOLOGY PAGE 186
number of critical factors which dictatSe the performance of - a V b u s i n e s s A counter argument may be that there^ k ^ ^ m a n y (or inf ihitely
^ 0 mary)^ different" factors "which infiueriee ^a -f n business to a greater or lesser extent at any
one point in ti,me. If this fs truer thenrfocusing on " small number of the ” most- '"c- .-.r # ' % - - , .significant factors would „only result in
- taking into account, a small percentage of thefactors, influencing pe£formarice,. In- the
o literature, although the concept of keyn success fa6 tors_ has been widely recognised (ask
- discussed in section 7.2) the number of factors recommended varies considerably or is not specified at all. Robinson (1986, pl77) points out that "most industries have only a
* few key success factors that, have asubstantial impact on competitive position and it is better to spend time getting a goodweighting on a limited list of factors than to get a comprehensive list of 15 factors'".
Ihe view taken in this research is that theref? " _ hare a few factors which are fundamental to success in an industry. These factors| differ from industry to industry and are sometimes extremely subtle, but are normally| well
understood by managers in the, industry} Forthis reason, the research questionnaire aims to identify (at most) the 3 most important success factors and to investigate these with regard to being specific to an industry or
. subject to advantages of scale. It is believed that, adopting this approach will lead
Referring to Abell & Hammond's (1979, p2l4) lisVof 15 factors.

CHAPTER 8 RESEARCH METHODOLOGY PAGE 187
.to an objective view being taken of the business n-. and will, facilitate ^the quantification of the concepts concerned.
It has also been pointed out in the literature that each factor is likely to impact on profitability and competitive position to a different degree. Therefore a weighting of the factors is, required in order to have an accurate reflection of dynamics of thebusiness. Again, the view is taken in this research that the management understands the business and can rate the critical factors witha suitable degree of accuracy.
Once the KSFs have been identified andweighted each KSF can be examined for itsk). . -_"n .
dependence on scale ^advantages and classified- - / r,
as to whether it is specific to the industry or not. For both these variables this would require a mixture of logical deduction as well as managerial judgement. For example if ,having a low cost „ production base was identified as being a KSF certain requirements would have to be met for advantages of scale to be significant. In this case, questions like stability of demand, number of product lines, smallest economic unit, effect of experience curve, effect of changes of process
0 technology, etc., would have to be explored to ascertain to what extent scale produces an advantage * Once the mechanism is understood it would be ' possible tc come to an understanding as to whether the factor is specific to the industry or not specific. As another example, if being able tc i .oduce

CHAPTER 8 RESEARCH METHODOLOGY PAGE 188
creative designs (advertising agency, fashion designer) was a KSF then different questions would have to be answered in order to ascertain how AOS and SPEC should be rated.
In all cases it is necessary to understand the causal mechanism which is at work which makes
r scale important. This, on a fine grained " level; is the essence of what the research is
endeavouring to explain. On a more macro level it is the causal effect of market share on profitability; on a micro level it is explaining how scale influences KSFs.
8.3 METHODOLOGY
■ ■ : '■ \ - : ' In order to test the,hypotheses developed inchapter 7 the following variables are
■' required: ’ ,, -
a) the significance of advantages of scale / (AOS) ^
b) industry specificity XSPEC)
c) market share (MKTSH), and,
d) profitability (ROI)
The first two variables, AOS and SPEC, while difficult to quantify are not of a confidential or sensitive nature. However the second two variables, MKTSH and ROI, are extremely confidential and difficult to get accurate quantified information made available for research purposes. (This was one of the

CHAPTER" ' < 3
cs
I
RESEARCH METHODOLOGY \ PAGE 189
major difficulties5 encpvinteredrwhen doing the field:research for the initial study reported on in chapter 6 ). Overcoming thisconfidentiality prohleift was seen as a major challenge in - designing the research methodology, , „
One possibility considered was to use companies, listed on the stock exchange that were not diversified and operated in essentially6 one industry only. Being listed companies, information on ROi would be freely available. Information on market share Would be more difficult to obtain but if enough of „ the companies in an industry were listed on the stock exchange, industry sales could be estimated by adding up the sales " of participating companies. Unfortunately, after an initial study of the companies listed on the Johannesburg Stock Exchange, it became clear that this approach would not be-, practical as most of the industries in the South African economy are dominated by a few, very large conglomerate corporations. There are very few companies which are individually listed which could be regarded as a single SBU and almost no industries (with the possible exception of the mining industry that are made- up of separately listed non-diversified companies. \
Therefore, the decision:was taken to use the remaining data in the original data base used for the statistical analysis (discussed in chapter 5). In the statistical analysis a data base consisting of I 103 SBUs was split
■ : '' ■

CHAPTER 8 " RESEARCH METHODOLOGY ^ PAGE 190
into [ two groups (depending oh enviroiirsental factors). The second group, consisting of 13 SBUs, was used in the initial study discuSSed in^chapter 6 . The first group, consisting of 90 SBUs. exhibited no discerhable correlation between market share sand profitability, when subjected^ to vthe boarse-grained analytical methodplo^r employed in chapter 5. It was decided to use these SBUs as the subject for the research.
The advantages of the above approach were that firstly, the confidential variables (MKTSH 7& ROI) were already known for these businesses and secondly, each data point represented a single SBU and not a diversified conglomerate. The disadvantages were that
(i) ; the original data was collected in1983/84 and the follow-up research was due to be done after 1989.Therefore there was a risk that someI//SBUs would have changed completely or even have disappeared over theintervening time period. \This was•' . ojudged to be a minor disadvantage because even if some SBUs had to be disregarded completely the number of SBUs available (90) meant that"there would still be a reasonable number
| left for testing hypotheses.
(ii) the original data had been split,using coarse-grained statistical analysis, into two groups. As stated above ,the group consisting of

CHAPTER S RESEARCH METHODOLOGY PAGE 191
, 90 SBUs had exhibited ndr discernablerelatidhship between profitabilft^-
' and market share. This in itself: was a disadvantage for using/the
^ data because, to test thehypotheses, data was needed from a
j range of industries -o some wheremarket share was important and
0 others where market share was not„ - important. The businesses in
„ question were in an environmentwhere market share was found not to be important by the - coarse-grained analysis. Therefore, there was the possibility that the range of
1 " - I results obtained using this dataJ | would not be sufficient to test the
i| hypotheses. However it was thoughtthat the statistical analysis had
% been too coarse to have picked upall the factors influencing
- , profitability and market share andthereforethe range of 'I results obtained Would be adequate for testing the hypotheses. It was therefore decided that the risk was worth taking and that the range of results obtained would be assessed during the analysis. -
n The validity of the methodology that involves taking data that was collected in 1982/84 and adding to it in 1988/89 is justified as follows:
The nature of the research done in 1988/89 was

CHAPTER 8 RESEARCH MEIHQDOLOGY PAGE 192
to examine the structure of the industry with regard to advantage of Scale and specificity and to apply that information to the market share/profitability information that had been collected in 1982/84. The base assumption was that these are structural variables which are unlikely to vary significatitly over 5 to 7 years. It was accepted that some of the SBU'S
i would have gone through major technical orother discontinuities and caused structural changes in the industry. This was accounted for by : '
: a) some of the SBUs did not exist in theirV ; original form and therefore could not be
used, and o -■ / ir
b) under the . "probe" „ section of the questionnaire the question was asked whether there had been major structural changes over the past 5 years. #
: : 1 V - ' " - : 's A study of the literature shows that major'' structural changes in industries can be
expected to happen in "5 to 15 years" (Foster, 1986, p!99) . Ward and Stascil (1986, p43)reviewed 2 1 companies where major changes had taken place and reported that only one major change took place in each of the industries over the 20 years of their review. Shaw and Shaw (1984, p75) reviewed the Nylon industry in the USA and found that all firms that had dominant market position,in 1980, already had major position in the market in 1953. Ghamawat (1984, p!54) reviews the history of thetitanium dioxide market in the USA and reports

CHAPTER 8 RESEARCH METHODOLOGY PAGE 193
that only two major technology changes took over the period from 1918 to 1970 „
the stability of the market share vs profitability relationship over time can be assessed by comparing the early PIMS findings with PIMS findings from many years later. In 1975 Buzzell et al reported on the relationship between market share and profitability and this Was repeated in 1987 by Buzzell and Gale. The table below gives an extract of approximate figures from the graphs; presented in the
Market Share" ROI 1 ROI 2 -1 0 . ! ~ 9 1 1
1 ' 1 4°-' \ 25 28
1. Buzzell et al (1975, p98)\ 2. Buzzell & Gale (1987, p94)
As can be seen from the above the relationship between market share and profitability did not
„ change significantly (on average) over the 1 2
year period reviewed. (Although theprofitabilities in 1987 are slightly higher than in 1975, the slope of the line has not changed significantly).
The above arguments lead to the conclusion that structural changes in industries typically take place over long periods ( 1 0 to 15 years) and that this should therefore not present a major problem in using the proposed research

CHAPTER 8 PAGE 194- — ---— ■■
methodology. „; j ' ■ ' Yf {' ■ :'1" " ; ■■ ' ;
The approach adored was to interview a-senior operational znanage# (General Manager; Managi^Director or Business Manager^ depending on the - structure) from each SBU, a^d ask a structured set of questions^ The questionnaire was designed for face-to-face or telephonic interviews. Also, the questionnaire was designed to focus oh only the relevant issues and to be as short as possible consistent with getting quality answers to the issues raised.
As can be seen (Appendix VII) the questionnaire follows the logic outlined in section 8 . 2 in that the KSFs are first identified and then weighted. Thereafter the relevahce of advantages of scale is explored and v/hether or not,the factor is specific to the industry is rated for each KSF. In both these latter steps there is a semi - structured section to . the questionnaire which serves a dual purpose.Firstly, it adds more colour and a, finer (0texture to the research and, secondly, it forces the respondent to think through the logic of the various questions before answering the important questions needed for the research. However, | the questionnaire is 1
designed so as to minimise the effect of interviewer bias by I having the important questions structured with quantifiable responses. J
&

" -- * ' - - .. CHAPTER 8 RESEARCH METtK)DOLOGY PAGE 195 : " P- .. 1- - ... " ' y - - ' .% , ; ..y- "/'-I-'
8 4- ^MiYTICAL STRATEGY ■ - '
8.4.1 Retirements•. - ' - ■. 4
The Objective of the research methodology was to classify the SBUs
r; ' in the data base into Quadrants4 depending on whether ^they were
subject to advantages^ of scale and whether the factors influencing the
1 business were specific to the industry dr not specific. Once
4 classified the hypotheses regardingthe correlation between market share arid profitability could be tested directly. The requirement in designing trie analytic method was to be able to test the hypotheses with
c a rigorous statistical significance test. To achieve this, a number of different analytical methods could be used.
8.4,2 Analytical Method/\ : ' r -The questionnaire described in the
previous r section measures the ,following: '
1. The three most important key success factors (KSFs) and their relative significance weighting.
2 . A rating on the extent to which

CHAPTER 8 RESEARCH METHODOLOGY PAGE
each KSF is influenced by advantages of scale (using a scale ranging from 1 to 5).
Whether the KSF1s are specific to the industry or not is- - "n - \ w" -Obtained (also using a scale ranging from l to 5).
A number of analytical methods could be used to classify the data into quadrants. Perhaps the mostappropriate is discriminant function analysis which is described in detail below. This method is used _in the analysis (described in chapter 9) and for completeness other methods of aria lysis are also executed. The method ofdiscriminant function analysis is as follows:
The analytical procedure proposed is as follows:
a) The weighted average for eachSBU is calculated (using therelative significance ratings)
^ for advantages of scale (AOS)" and industry specific (SPEC)
^ratings. This therefore yields one weighted average value per SBU for AOS and SPEC.
b) All SBUs are then plotted aspoints on a two dimensional

Author Edwards G N Name of thesis Market share, profitability and implications for strategy formulation 1994
PUBLISHER: University of the Witwatersrand, Johannesburg
©2013
LEGAL NOTICES:
Copyright Notice: All materials on the Un i ve r s i t y o f the Wi twa te r s rand , Johannesbu rg L ib ra ry website are protected by South African copyright law and may not be distributed, transmitted, displayed, or otherwise published in any format, without the prior written permission of the copyright owner.
Disclaimer and Terms of Use: Provided that you maintain all copyright and other notices contained therein, you may download material (one machine readable copy and one print copy per page) for your personal and/or educational non-commercial use only.
The University of the Witwatersrand, Johannesburg, is not responsible for any errors or omissions and excludes any and all liability for any errors in or omissions from the information on the Library website.