Embed Size (px)
Citation preview
Chapter 2: Housing Diversity
Housing Master Plan - July 2010 Page 2.1
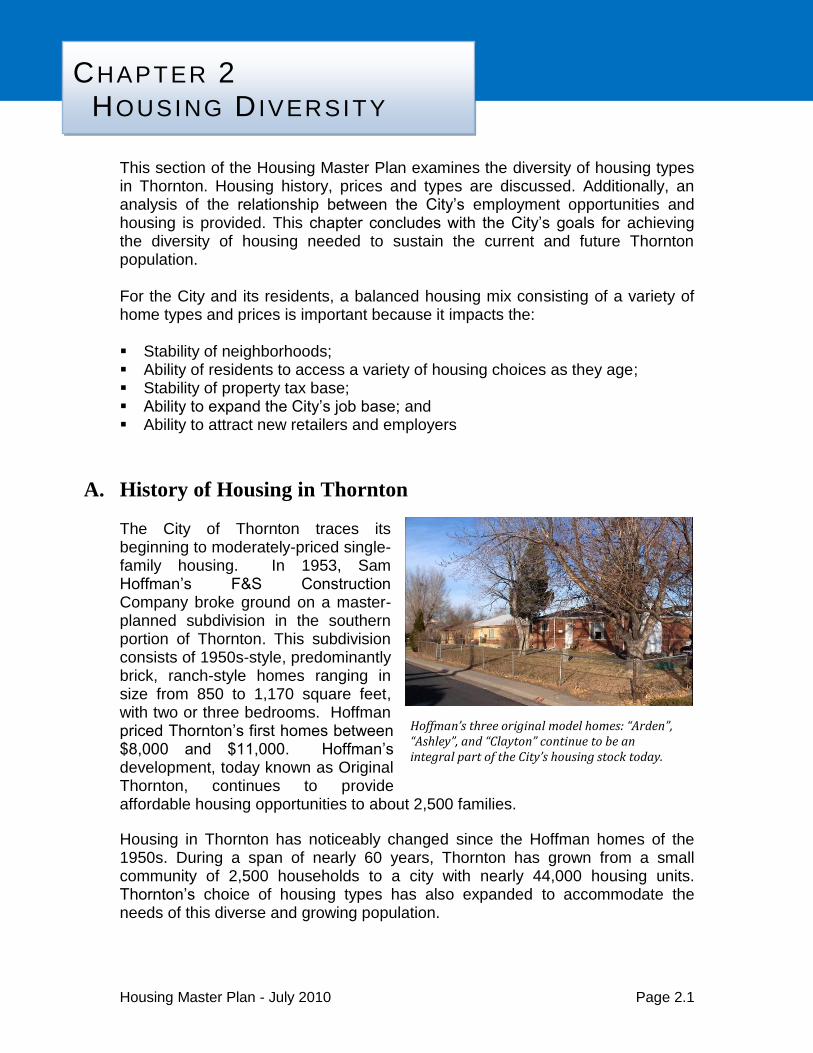
Hoffman’s three original model homes: “Arden”, “Ashley”, and “Clayton” continue to be an integral part of the City’s housing stock today.
This section of the Housing Master Plan examines the diversity of housing types in Thornton. Housing history, prices and types are discussed. Additionally, an analysis of the relationship between the City‟s employment opportunities and housing is provided. This chapter concludes with the City‟s goals for achieving the diversity of housing needed to sustain the current and future Thornton population. For the City and its residents, a balanced housing mix consisting of a variety of home types and prices is important because it impacts the: Stability of neighborhoods; Ability of residents to access a variety of housing choices as they age; Stability of property tax base; Ability to expand the City‟s job base; and Ability to attract new retailers and employers
A. History of Housing in Thornton The City of Thornton traces its beginning to moderately-priced single-family housing. In 1953, Sam Hoffman‟s F&S Construction Company broke ground on a master-planned subdivision in the southern portion of Thornton. This subdivision consists of 1950s-style, predominantly brick, ranch-style homes ranging in size from 850 to 1,170 square feet, with two or three bedrooms. Hoffman priced Thornton‟s first homes between $8,000 and $11,000. Hoffman‟s development, today known as Original Thornton, continues to provide affordable housing opportunities to about 2,500 families.
Housing in Thornton has noticeably changed since the Hoffman homes of the 1950s. During a span of nearly 60 years, Thornton has grown from a small community of 2,500 households to a city with nearly 44,000 housing units. Thornton‟s choice of housing types has also expanded to accommodate the needs of this diverse and growing population.
CHAPTER 2 HOUSING D IVERSITY
Chapter 2: Housing Diversity
Housing Master Plan - July 2010 Page 2.2
0
0.5
1
1.5
2
2.5
0
20,000
40,000
60,000
80,000
100,000
120,000
140,000
1960 1970 1980 1990 2000 2009
Gro
wth
Rat
e
Po
pu
lati
on
Population
Growth Rate
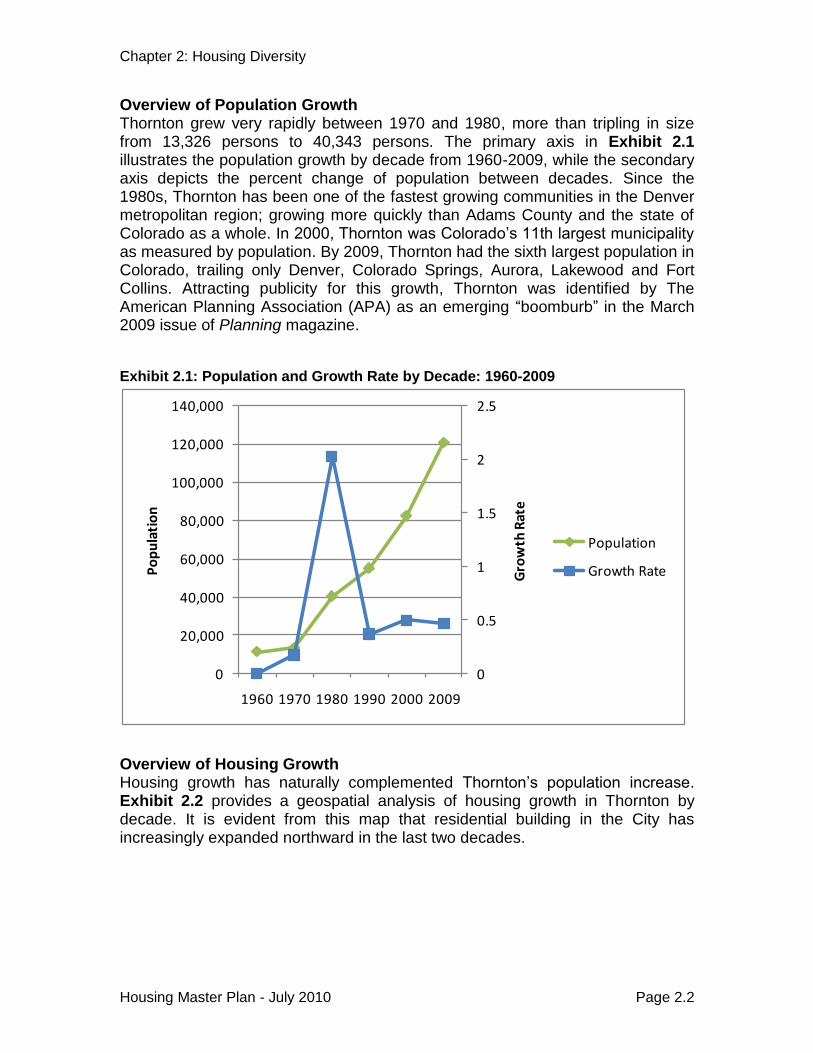
Overview of Population Growth Thornton grew very rapidly between 1970 and 1980, more than tripling in size from 13,326 persons to 40,343 persons. The primary axis in Exhibit 2.1 illustrates the population growth by decade from 1960-2009, while the secondary axis depicts the percent change of population between decades. Since the 1980s, Thornton has been one of the fastest growing communities in the Denver metropolitan region; growing more quickly than Adams County and the state of Colorado as a whole. In 2000, Thornton was Colorado‟s 11th largest municipality as measured by population. By 2009, Thornton had the sixth largest population in Colorado, trailing only Denver, Colorado Springs, Aurora, Lakewood and Fort Collins. Attracting publicity for this growth, Thornton was identified by The American Planning Association (APA) as an emerging “boomburb” in the March 2009 issue of Planning magazine. Exhibit 2.1: Population and Growth Rate by Decade: 1960-2009
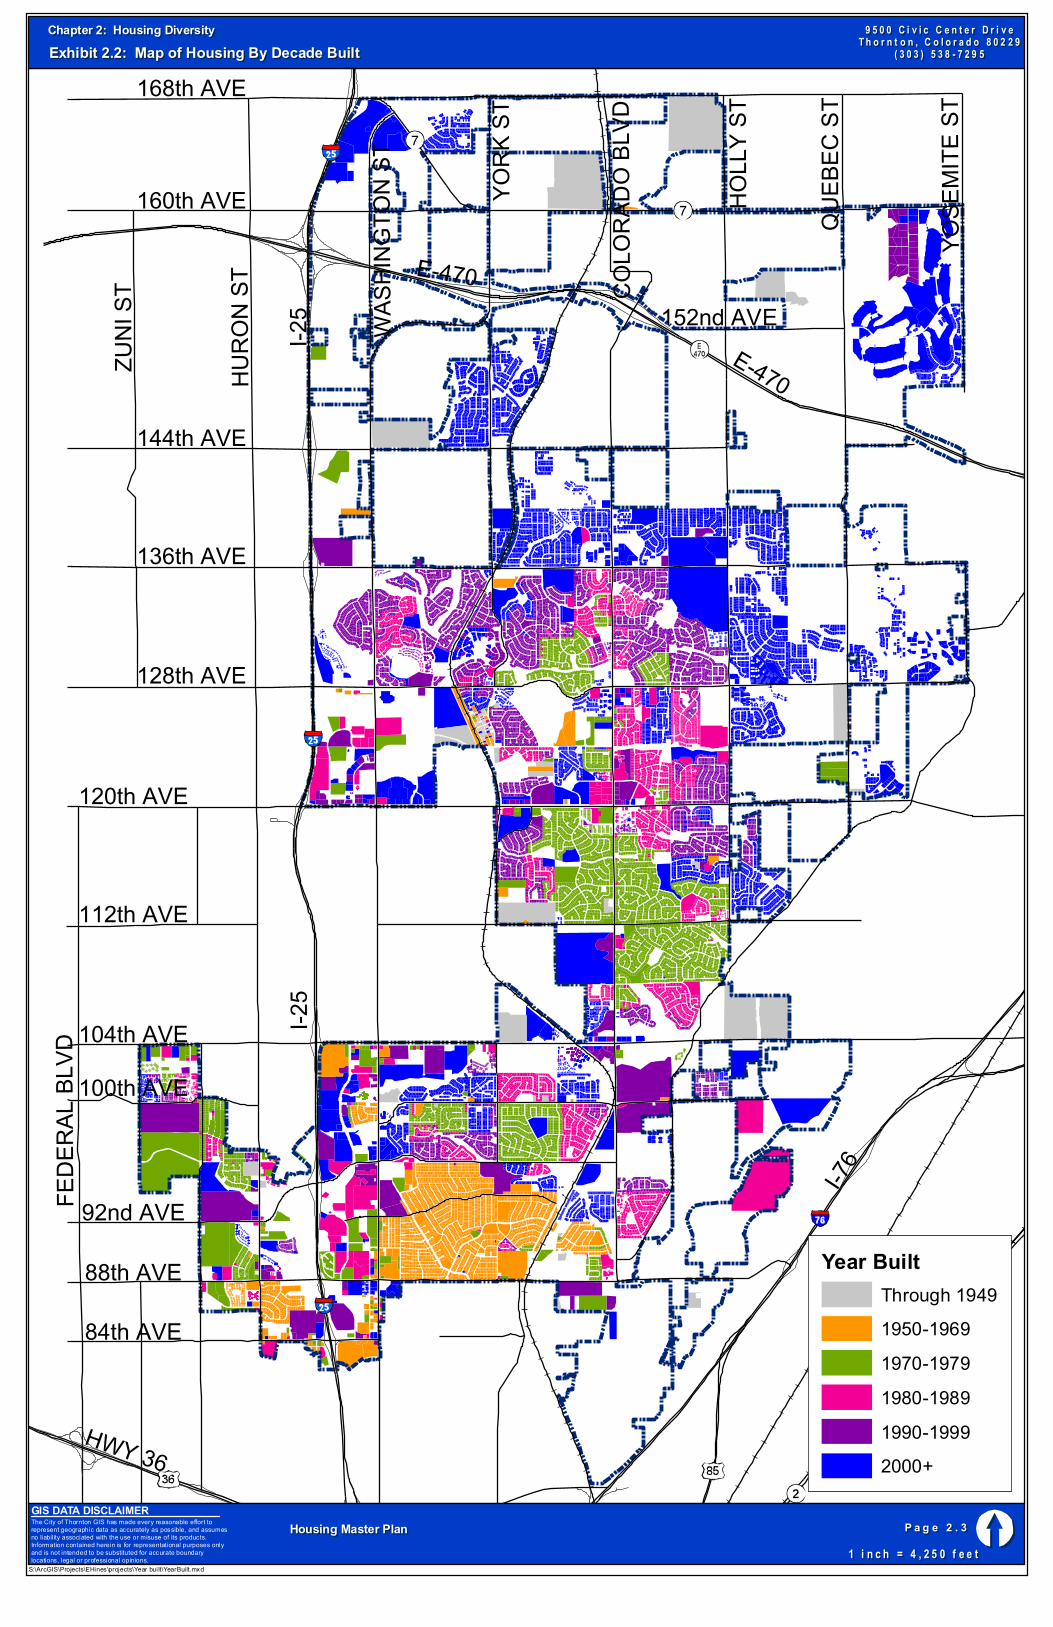
Overview of Housing Growth Housing growth has naturally complemented Thornton‟s population increase. Exhibit 2.2 provides a geospatial analysis of housing growth in Thornton by decade. It is evident from this map that residential building in the City has increasingly expanded northward in the last two decades.
120th AVE
HWY 36
YOSE
MITE
ST
ZUNI
ST
128th AVE
YORK
ST
84th AVE
88th AVE
168th AVE
I-25
FEDE
RAL B
LVD
160th AVE
E-470
I-76
104th AVE
COLO
RADO
BLVD
E-470
144th AVE
100th AVE
HOLL
Y ST
152nd AVE
QUEB
EC S
T
I-25
HURO
N ST
136th AVE
92nd AVE
112th AVE
WASH
INGT
ON ST
The City of Thornton GIS has made every reasonable effort to represent geographic data as accurately as possible, and assumes no liabil ity associated with the use or misuse of its products. Information contained herein is for representational purposes only and is not intended to be substituted for accurate boundary locations, legal or professional opinions.
GIS DATA DISCLAIMER
S:\ArcGIS\Projects\EHines\projects\Year built\YearBuilt.mxd
P a g e 2 . 3P a g e 2 . 3
1 i n c h = 4 , 2 5 0 f e e t1 i n c h = 4 , 2 5 0 f e e t
9 5 0 0 C i v i c C e n t e r D r i v e9 5 0 0 C i v i c C e n t e r D r i v eT h o r n t o n , C o l o r a d o 8 0 2 2 9T h o r n t o n , C o l o r a d o 8 0 2 2 9
( 3 0 3 ) 5 3 8 - 7 2 9 5( 3 0 3 ) 5 3 8 - 7 2 9 5
Year BuiltThrough 19491950-19691970-19791980-19891990-19992000+
Chapter 2: Housing DiversityChapter 2: Housing DiversityExhibit 2.2: Map of Housing By Decade BuiltExhibit 2.2: Map of Housing By Decade Built
Housing Master PlanHousing Master Plan
Chapter 2: Housing Diversity
Housing Master Plan - July 2010 Page 2.4
HOUSING TYPE WARD 1 WARD 2 WARD 3 WARD 4 TOTAL
Single-family Detached (SFD) 4,081 6,038 8,781 7,687 26,587
Single-family Attached (SFA) 1,857 1,290 1,685 1,349 6,181
Multifamily (MF) 2,678 3,117 428 1,665 7,888
Manufactured Homes (MH) 2,111 973 0 0 3,084
TOTAL 10,727 11,418 10,894 10,701 43,740
Population 29,624 31,531 30,116 29,572 120,843
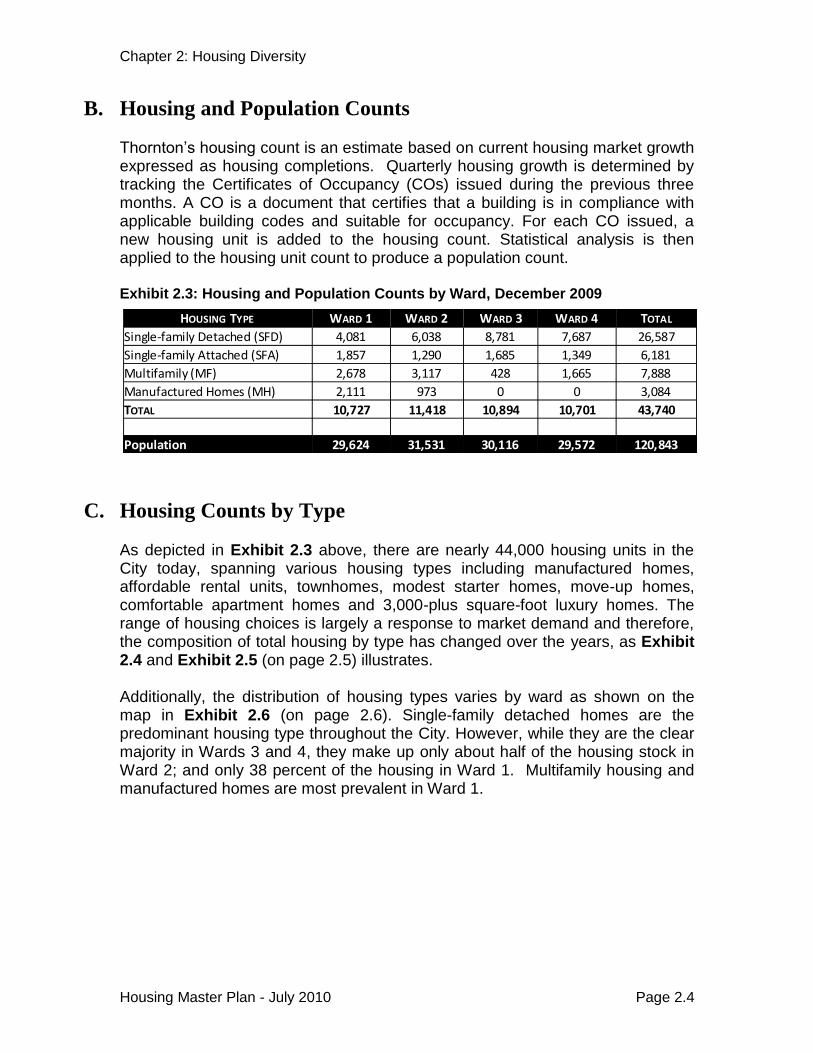
B. Housing and Population Counts Thornton‟s housing count is an estimate based on current housing market growth expressed as housing completions. Quarterly housing growth is determined by tracking the Certificates of Occupancy (COs) issued during the previous three months. A CO is a document that certifies that a building is in compliance with applicable building codes and suitable for occupancy. For each CO issued, a new housing unit is added to the housing count. Statistical analysis is then applied to the housing unit count to produce a population count. Exhibit 2.3: Housing and Population Counts by Ward, December 2009
C. Housing Counts by Type
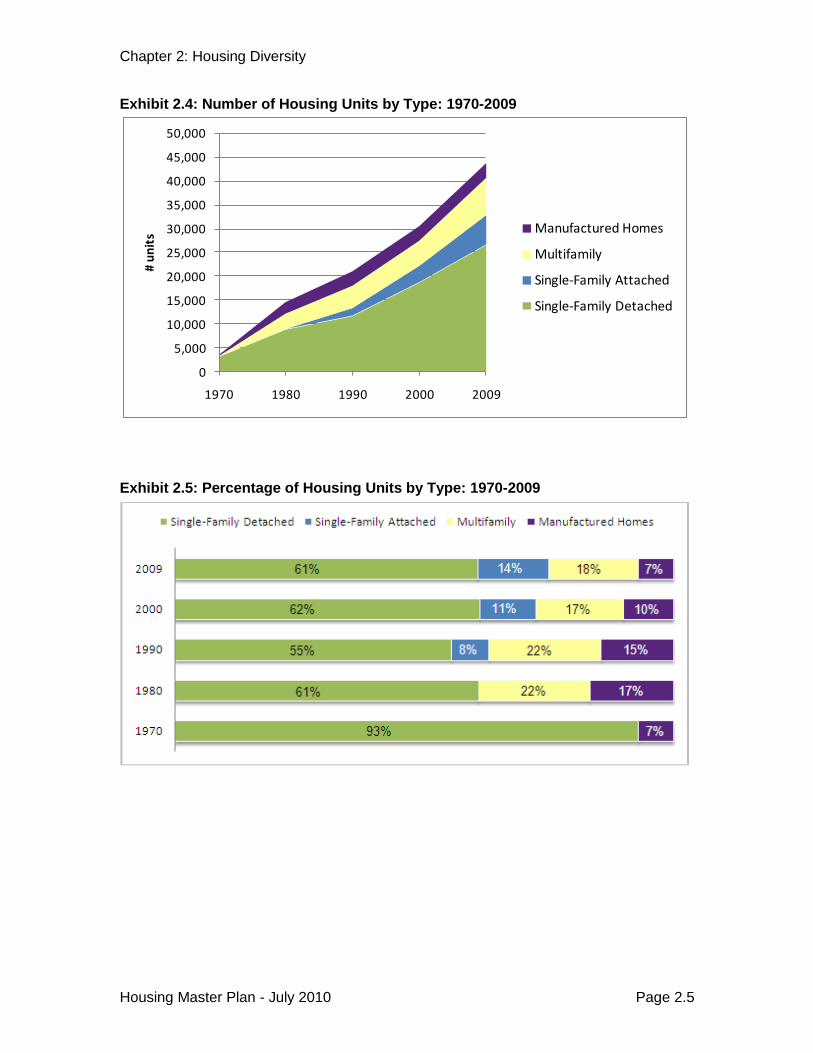
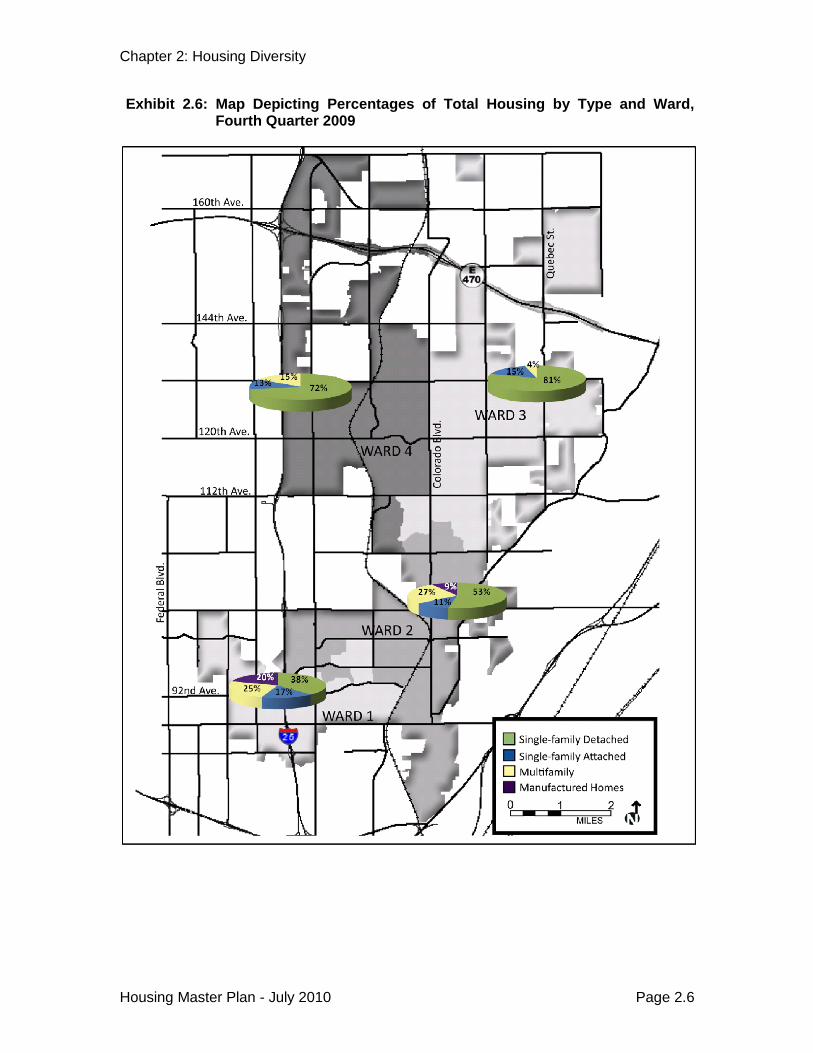
As depicted in Exhibit 2.3 above, there are nearly 44,000 housing units in the City today, spanning various housing types including manufactured homes, affordable rental units, townhomes, modest starter homes, move-up homes, comfortable apartment homes and 3,000-plus square-foot luxury homes. The range of housing choices is largely a response to market demand and therefore, the composition of total housing by type has changed over the years, as Exhibit 2.4 and Exhibit 2.5 (on page 2.5) illustrates. Additionally, the distribution of housing types varies by ward as shown on the map in Exhibit 2.6 (on page 2.6). Single-family detached homes are the predominant housing type throughout the City. However, while they are the clear majority in Wards 3 and 4, they make up only about half of the housing stock in Ward 2; and only 38 percent of the housing in Ward 1. Multifamily housing and manufactured homes are most prevalent in Ward 1.
Chapter 2: Housing Diversity
Housing Master Plan - July 2010 Page 2.5
0
5,000
10,000
15,000
20,000
25,000
30,000
35,000
40,000
45,000
50,000
1970 1980 1990 2000 2009
# u
nit
s Manufactured Homes
Multifamily
Single-Family Attached
Single-Family Detached
Exhibit 2.4: Number of Housing Units by Type: 1970-2009
Exhibit 2.5: Percentage of Housing Units by Type: 1970-2009
Chapter 2: Housing Diversity
Housing Master Plan - July 2010 Page 2.6
Exhibit 2.6: Map Depicting Percentages of Total Housing by Type and Ward, Fourth Quarter 2009
Chapter 2: Housing Diversity
Housing Master Plan - July 2010 Page 2.7
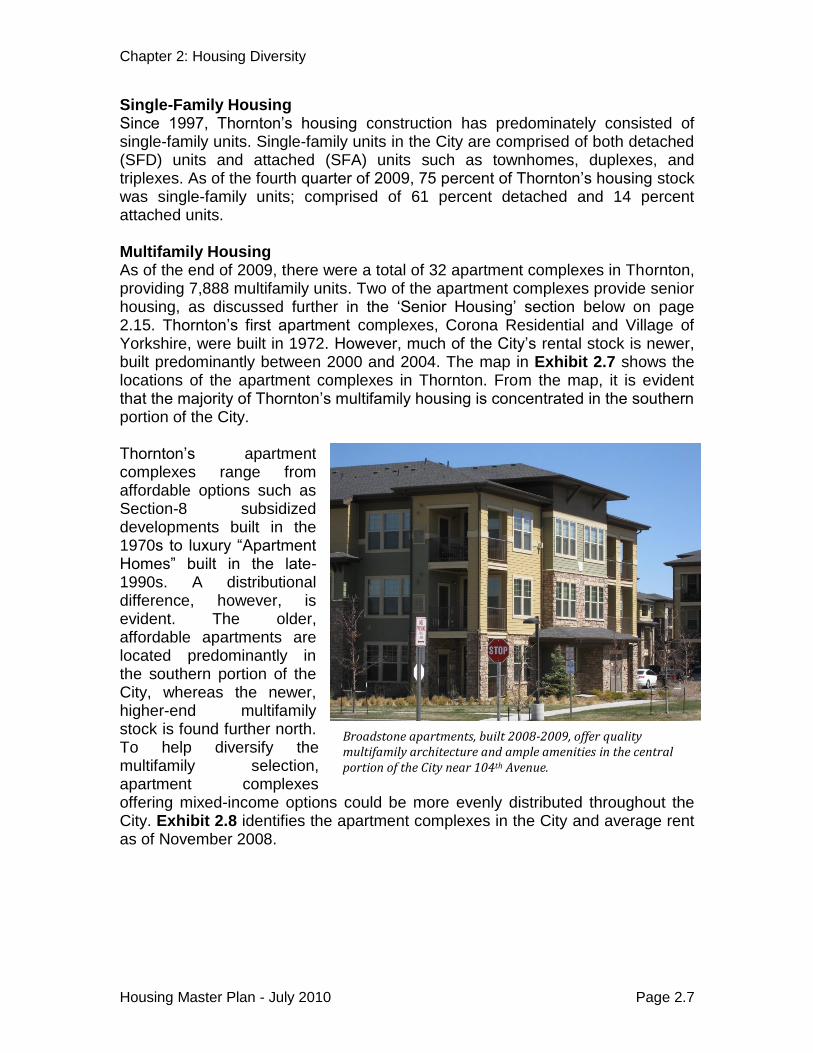
Broadstone apartments, built 2008-2009, offer quality multifamily architecture and ample amenities in the central portion of the City near 104th Avenue.
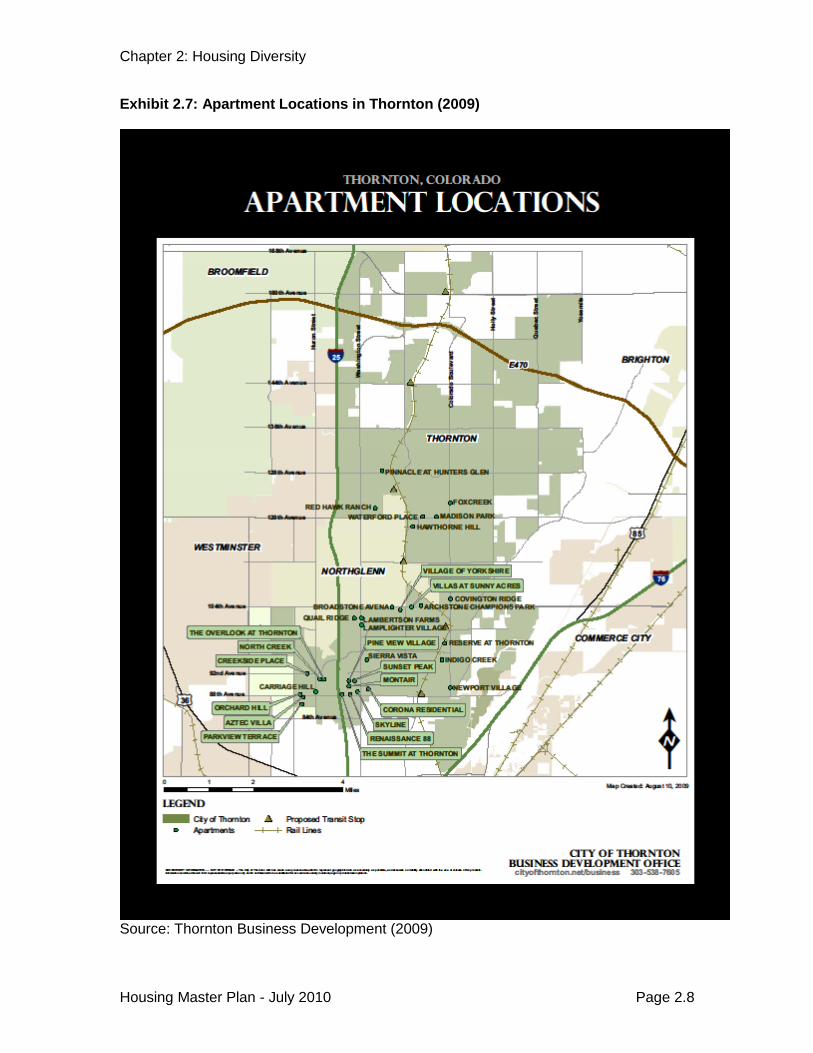
Single-Family Housing Since 1997, Thornton‟s housing construction has predominately consisted of single-family units. Single-family units in the City are comprised of both detached (SFD) units and attached (SFA) units such as townhomes, duplexes, and triplexes. As of the fourth quarter of 2009, 75 percent of Thornton‟s housing stock was single-family units; comprised of 61 percent detached and 14 percent attached units. Multifamily Housing As of the end of 2009, there were a total of 32 apartment complexes in Thornton, providing 7,888 multifamily units. Two of the apartment complexes provide senior housing, as discussed further in the „Senior Housing‟ section below on page 2.15. Thornton‟s first apartment complexes, Corona Residential and Village of Yorkshire, were built in 1972. However, much of the City‟s rental stock is newer, built predominantly between 2000 and 2004. The map in Exhibit 2.7 shows the locations of the apartment complexes in Thornton. From the map, it is evident that the majority of Thornton‟s multifamily housing is concentrated in the southern portion of the City. Thornton‟s apartment complexes range from affordable options such as Section-8 subsidized developments built in the 1970s to luxury “Apartment Homes” built in the late-1990s. A distributional difference, however, is evident. The older, affordable apartments are located predominantly in the southern portion of the City, whereas the newer, higher-end multifamily stock is found further north. To help diversify the multifamily selection, apartment complexes offering mixed-income options could be more evenly distributed throughout the City. Exhibit 2.8 identifies the apartment complexes in the City and average rent as of November 2008.
Chapter 2: Housing Diversity
Housing Master Plan - July 2010 Page 2.8
Exhibit 2.7: Apartment Locations in Thornton (2009)
Source: Thornton Business Development (2009)
Chapter 2: Housing Diversity
Housing Master Plan - July 2010 Page 2.9
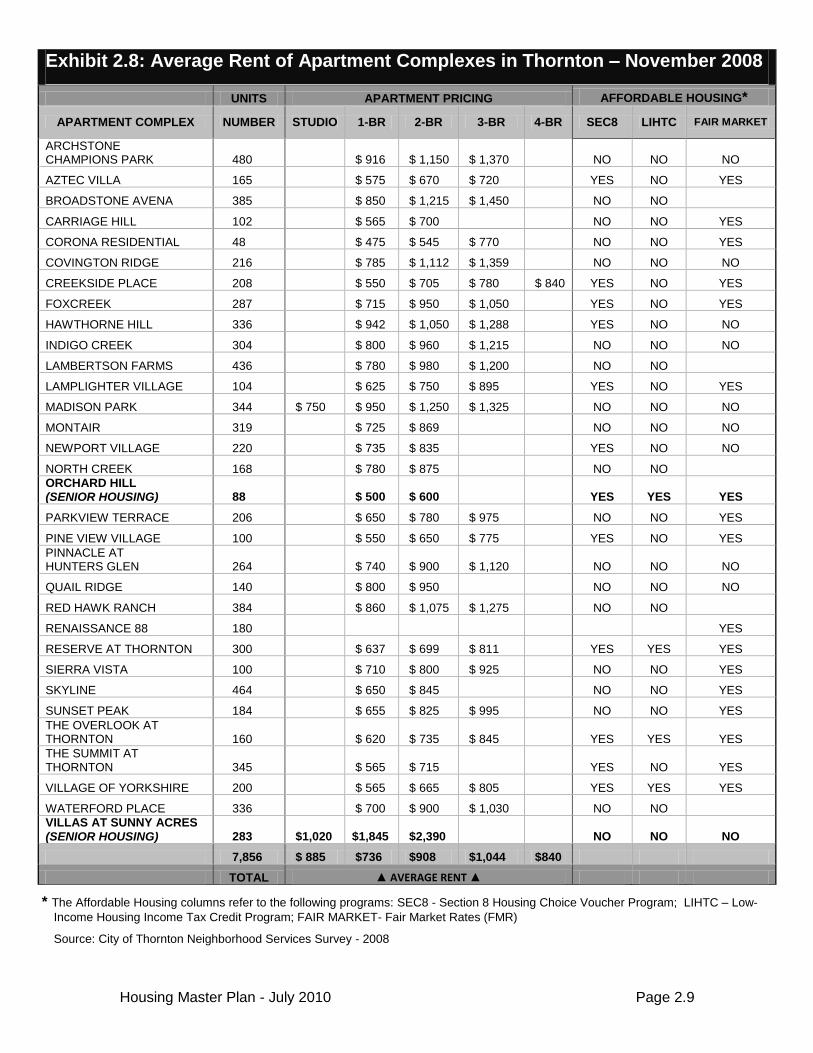
* The Affordable Housing columns refer to the following programs: SEC8 - Section 8 Housing Choice Voucher Program; LIHTC – Low-
Income Housing Income Tax Credit Program; FAIR MARKET- Fair Market Rates (FMR)
Source: City of Thornton Neighborhood Services Survey - 2008
Exhibit 2.8: Average Rent of Apartment Complexes in Thornton – November 2008
UNITS APARTMENT PRICING AFFORDABLE HOUSING*
APARTMENT COMPLEX NUMBER STUDIO 1-BR 2-BR 3-BR 4-BR SEC8 LIHTC FAIR MARKET
ARCHSTONE CHAMPIONS PARK 480 $ 916 $ 1,150 $ 1,370 NO NO NO
AZTEC VILLA 165 $ 575 $ 670 $ 720 YES NO YES
BROADSTONE AVENA 385 $ 850 $ 1,215 $ 1,450 NO NO
CARRIAGE HILL 102 $ 565 $ 700 NO NO YES
CORONA RESIDENTIAL 48 $ 475 $ 545 $ 770 NO NO YES
COVINGTON RIDGE 216 $ 785 $ 1,112 $ 1,359 NO NO NO
CREEKSIDE PLACE 208 $ 550 $ 705 $ 780 $ 840 YES NO YES
FOXCREEK 287 $ 715 $ 950 $ 1,050 YES NO YES
HAWTHORNE HILL 336 $ 942 $ 1,050 $ 1,288 YES NO NO
INDIGO CREEK 304 $ 800 $ 960 $ 1,215 NO NO NO
LAMBERTSON FARMS 436 $ 780 $ 980 $ 1,200 NO NO
LAMPLIGHTER VILLAGE 104 $ 625 $ 750 $ 895 YES NO YES
MADISON PARK 344 $ 750 $ 950 $ 1,250 $ 1,325 NO NO NO
MONTAIR 319 $ 725 $ 869 NO NO NO
NEWPORT VILLAGE 220 $ 735 $ 835 YES NO NO
NORTH CREEK 168 $ 780 $ 875 NO NO
ORCHARD HILL (SENIOR HOUSING) 88 $ 500 $ 600 YES YES YES
PARKVIEW TERRACE 206 $ 650 $ 780 $ 975 NO NO YES
PINE VIEW VILLAGE 100 $ 550 $ 650 $ 775 YES NO YES
PINNACLE AT HUNTERS GLEN 264 $ 740 $ 900 $ 1,120 NO NO NO
QUAIL RIDGE 140 $ 800 $ 950 NO NO NO
RED HAWK RANCH 384 $ 860 $ 1,075 $ 1,275 NO NO
RENAISSANCE 88 180 YES
RESERVE AT THORNTON 300 $ 637 $ 699 $ 811 YES YES YES
SIERRA VISTA 100 $ 710 $ 800 $ 925 NO NO YES
SKYLINE 464 $ 650 $ 845 NO NO YES
SUNSET PEAK 184 $ 655 $ 825 $ 995 NO NO YES
THE OVERLOOK AT THORNTON 160 $ 620 $ 735 $ 845 YES YES YES
THE SUMMIT AT THORNTON 345 $ 565 $ 715 YES NO YES
VILLAGE OF YORKSHIRE 200 $ 565 $ 665 $ 805 YES YES YES
WATERFORD PLACE 336 $ 700 $ 900 $ 1,030 NO NO
VILLAS AT SUNNY ACRES
(SENIOR HOUSING) 283 $1,020 $1,845 $2,390 NO NO NO
7,856 $ 885 $736 $908 $1,044 $840
TOTAL ▲ AVERAGE RENT ▲
Chapter 2: Housing Diversity
Housing Master Plan - July 2010 Page 2.10
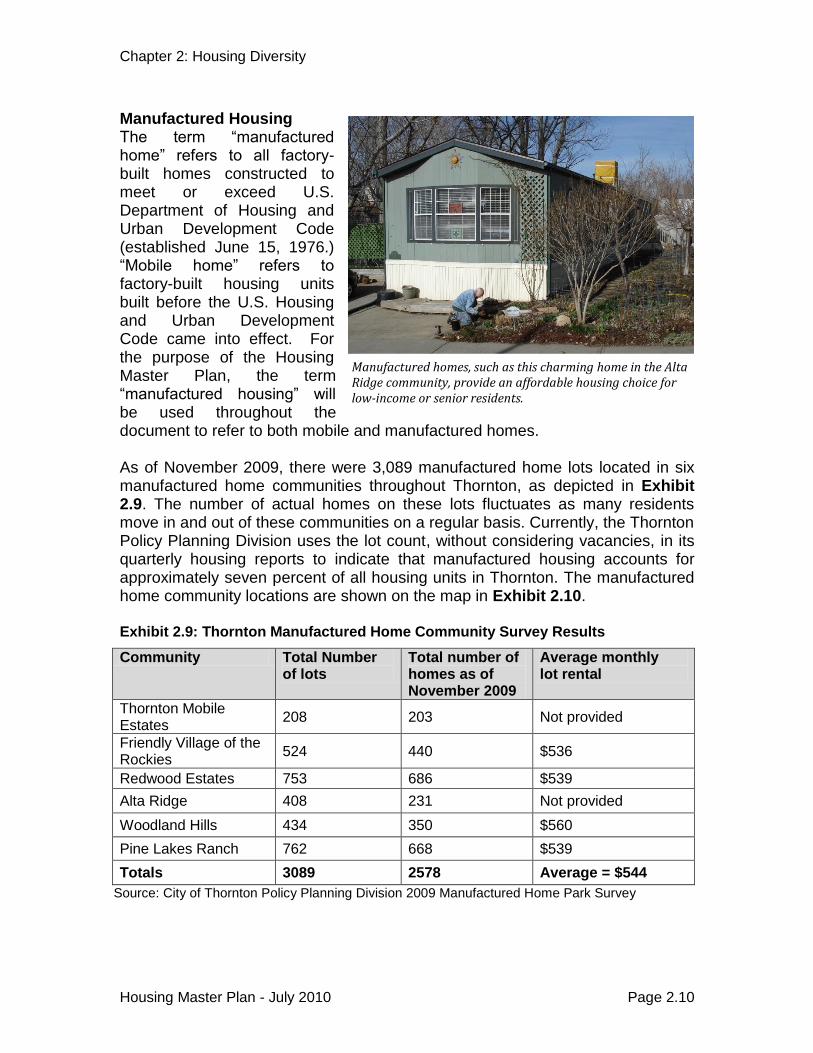
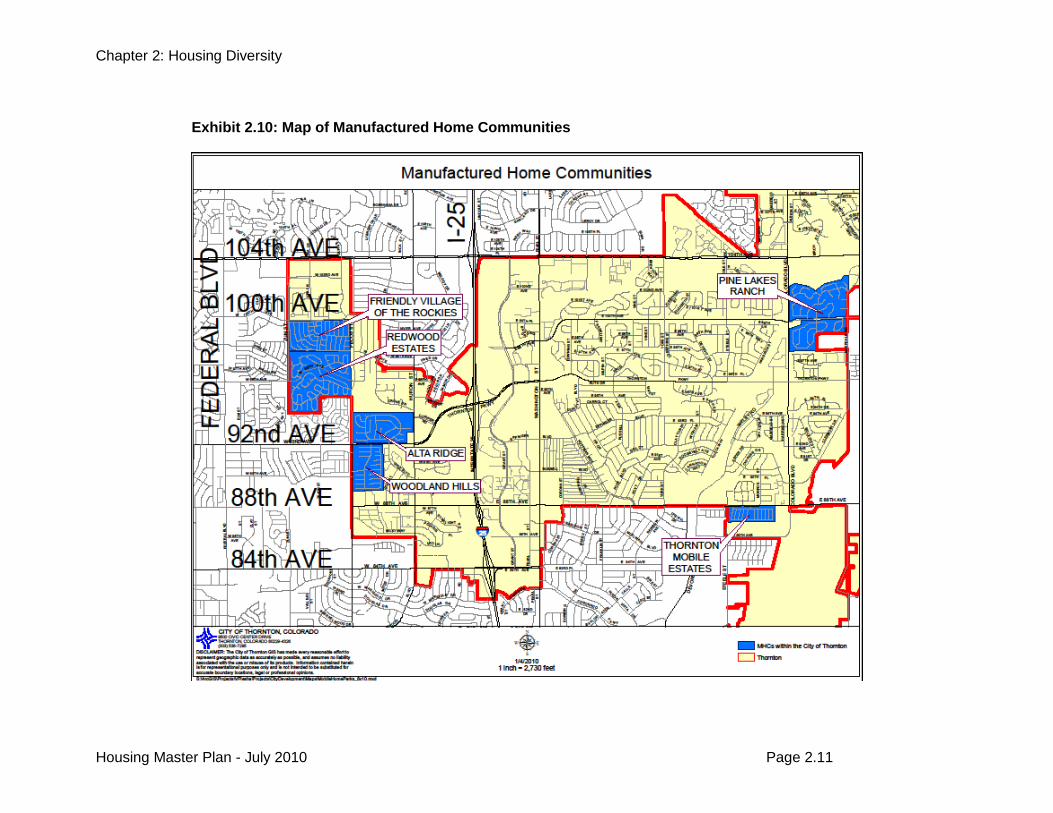
Manufactured Housing The term “manufactured home” refers to all factory-built homes constructed to meet or exceed U.S. Department of Housing and Urban Development Code (established June 15, 1976.) “Mobile home” refers to factory-built housing units built before the U.S. Housing and Urban Development Code came into effect. For the purpose of the Housing Master Plan, the term “manufactured housing” will be used throughout the document to refer to both mobile and manufactured homes. As of November 2009, there were 3,089 manufactured home lots located in six manufactured home communities throughout Thornton, as depicted in Exhibit 2.9. The number of actual homes on these lots fluctuates as many residents move in and out of these communities on a regular basis. Currently, the Thornton Policy Planning Division uses the lot count, without considering vacancies, in its quarterly housing reports to indicate that manufactured housing accounts for approximately seven percent of all housing units in Thornton. The manufactured home community locations are shown on the map in Exhibit 2.10. Exhibit 2.9: Thornton Manufactured Home Community Survey Results
Community Total Number of lots
Total number of homes as of November 2009
Average monthly lot rental
Thornton Mobile Estates
208 203 Not provided
Friendly Village of the Rockies
524 440 $536
Redwood Estates 753 686 $539
Alta Ridge 408 231 Not provided
Woodland Hills 434 350 $560
Pine Lakes Ranch 762 668 $539
Totals 3089 2578 Average = $544
Source: City of Thornton Policy Planning Division 2009 Manufactured Home Park Survey
Manufactured homes, such as this charming home in the Alta Ridge community, provide an affordable housing choice for low-income or senior residents.
Chapter 2: Housing Diversity
Housing Master Plan - July 2010 Page 2.11
Exhibit 2.10: Map of Manufactured Home Communities
Chapter 2: Housing Diversity
Housing Master Plan - July 2010 Page 2.12
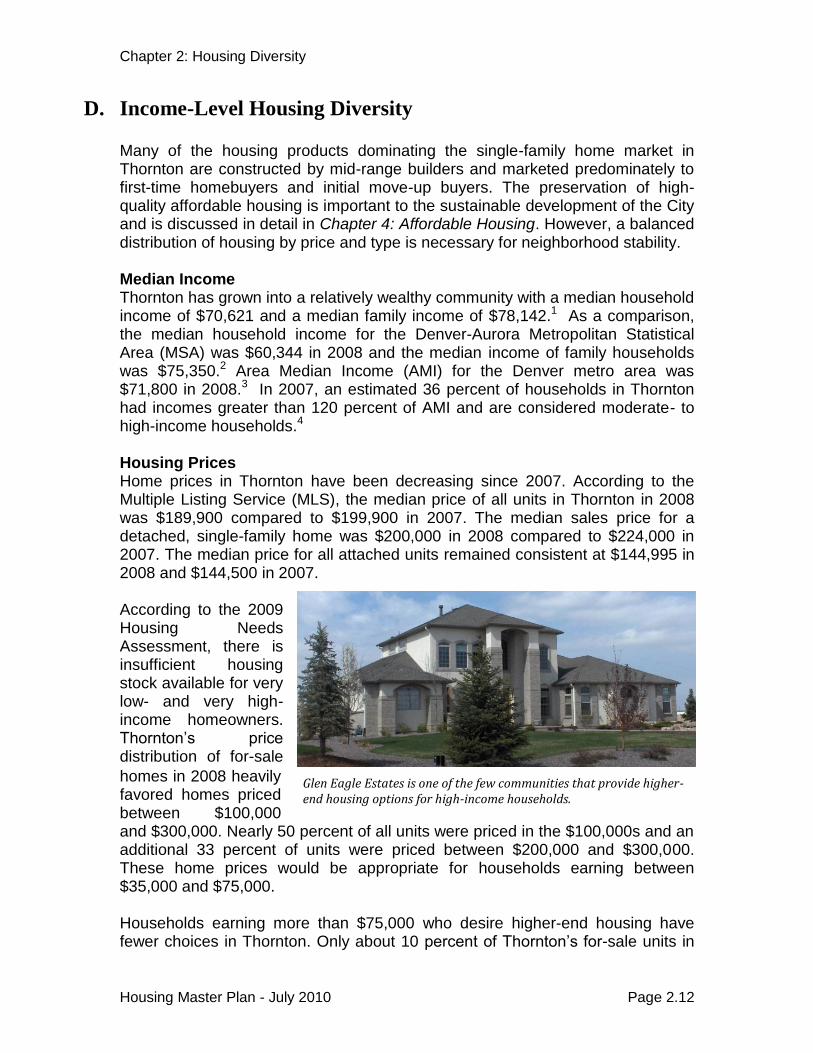
D. Income-Level Housing Diversity Many of the housing products dominating the single-family home market in Thornton are constructed by mid-range builders and marketed predominately to first-time homebuyers and initial move-up buyers. The preservation of high-quality affordable housing is important to the sustainable development of the City and is discussed in detail in Chapter 4: Affordable Housing. However, a balanced distribution of housing by price and type is necessary for neighborhood stability. Median Income Thornton has grown into a relatively wealthy community with a median household income of $70,621 and a median family income of $78,142.1 As a comparison, the median household income for the Denver-Aurora Metropolitan Statistical Area (MSA) was $60,344 in 2008 and the median income of family households was $75,350.2 Area Median Income (AMI) for the Denver metro area was $71,800 in 2008.3 In 2007, an estimated 36 percent of households in Thornton had incomes greater than 120 percent of AMI and are considered moderate- to high-income households.4 Housing Prices Home prices in Thornton have been decreasing since 2007. According to the Multiple Listing Service (MLS), the median price of all units in Thornton in 2008 was $189,900 compared to $199,900 in 2007. The median sales price for a detached, single-family home was $200,000 in 2008 compared to $224,000 in 2007. The median price for all attached units remained consistent at $144,995 in 2008 and $144,500 in 2007. According to the 2009 Housing Needs Assessment, there is insufficient housing stock available for very low- and very high-income homeowners. Thornton‟s price distribution of for-sale
homes in 2008 heavily favored homes priced between $100,000 and $300,000. Nearly 50 percent of all units were priced in the $100,000s and an additional 33 percent of units were priced between $200,000 and $300,000. These home prices would be appropriate for households earning between $35,000 and $75,000. Households earning more than $75,000 who desire higher-end housing have fewer choices in Thornton. Only about 10 percent of Thornton‟s for-sale units in
Glen Eagle Estates is one of the few communities that provide higher-end housing options for high-income households.
Chapter 2: Housing Diversity
Housing Master Plan - July 2010 Page 2.13
2008 were priced above $300,000.5 Therefore, the City may need to examine ways to encourage the construction of higher-end housing. For multifamily units, 2008 price data indicates deficiencies in the availability of rentals for persons earning less than $25,000 a year and more than $50,000 a year.6 This gap is discussed in detail in Chapter 4: Affordable Housing. The average sales price nationwide for a new manufactured home in 2009 was $39,500 for a single-wide and $74,200 for a double-wide.7 Prices in the western region of the U.S. were higher than the national average at $44,300 for a single-wide and $83,200 for a double-wide.8 Manufactured home park residents typically own their homes. However, the lots on which these homes sit are leased from the manufactured home park which makes the cost of owning a manufactured home unpredictable. Still, manufactured homes generally provide an affordable housing choice for low-income and senior residents. Therefore, it is important that these housing units remain a quality component of Thornton‟s housing inventory.
E. Life-Cycle Housing Diversity
Housing needs are not static. Needs change over time as people move through different stages of their lives. The availability of life-cycle housing sustains the community by preventing polarization of residents in one age or income group. As one generation of residents moves through its life-cycle, it can move into the housing provided by the previous generation, just as the next generation will move into the housing being vacated. This evolution is facilitated by the provision of diverse housing by type, value, and stage of life-cycle including:
Affordable rental units for young people just beginning to enter the workforce;
Affordable single-family units for first-time home buyers and young families;
Move-up housing for people with growing families and/or incomes;
Empty-nester housing characterized by small size but high-quality, and lower-maintenance;
Housing for seniors and the disabled that accommodates physical limitations;
Assisted living environments to provide health and medical care to the elderly.
A phone survey conducted by BBC Research for the 2009 Housing Needs Assessment found that 40 percent of respondents have lived in Thornton for at least 10 years, indicating that many residents who move to Thornton remain in the City. This further substantiates the need to provide housing appropriate for all stages of life and income levels.9 Options that allow families to expand and age in place will benefit both residents and the community.

Chapter 2: Housing Diversity
Housing Master Plan - July 2010 Page 2.14
Population Age Distribution Thornton‟s age distribution, as shown in Exhibit 2.11, reveals two key trends that will dictate the future housing and service needs of Thornton‟s residents.10 Although the depicted median age is a youthful 31.7 years of age, the City‟s population is also aging.11
Exhibit 2.11: City of Thornton Population by Age Cohort Estimates
Source: American Community Survey 3-Year Estimates: Thornton, Colorado, 2006-2008
The rise and fall of population growth in specific groups has historically had significant impact on housing and neighborhoods. As such, the City must monitor and adapt to diverging population trends that will require Thornton to meet the housing needs of two very different subsets: (1) existing, aging residents; and 2) new families and other residents. Thornton needs to encourage housing development that will fill current income-level and life-stage gaps and also anticipate future housing needs that will accommodate both a growing and changing population. In recent decades, Thornton‟s strong housing growth in the northern and eastern portions of the City has attracted higher-income, younger families. Overall, families comprise nearly three in four households in Thornton and approximately 80 percent of family households are married couple families.12 A little over half of all family households in Thornton have at least one child under 18 years of age, amounting to an estimated 32,500 children presently residing in Thornton.13 Current trends indicate the need to preserve opportunities for family households in Thornton and accommodate future growth.
27,814
14,11320,131
26,825
16,178
6,518
0
5,000
10,000
15,000
20,000
25,000
30,000
under 15 15 to 24 25 to 34 35 to 49 50 to 64 65 and older
Po
pu
lati
on
Age Cohorts
Chapter 2: Housing Diversity
Housing Master Plan - July 2010 Page 2.15
F. Senior Housing
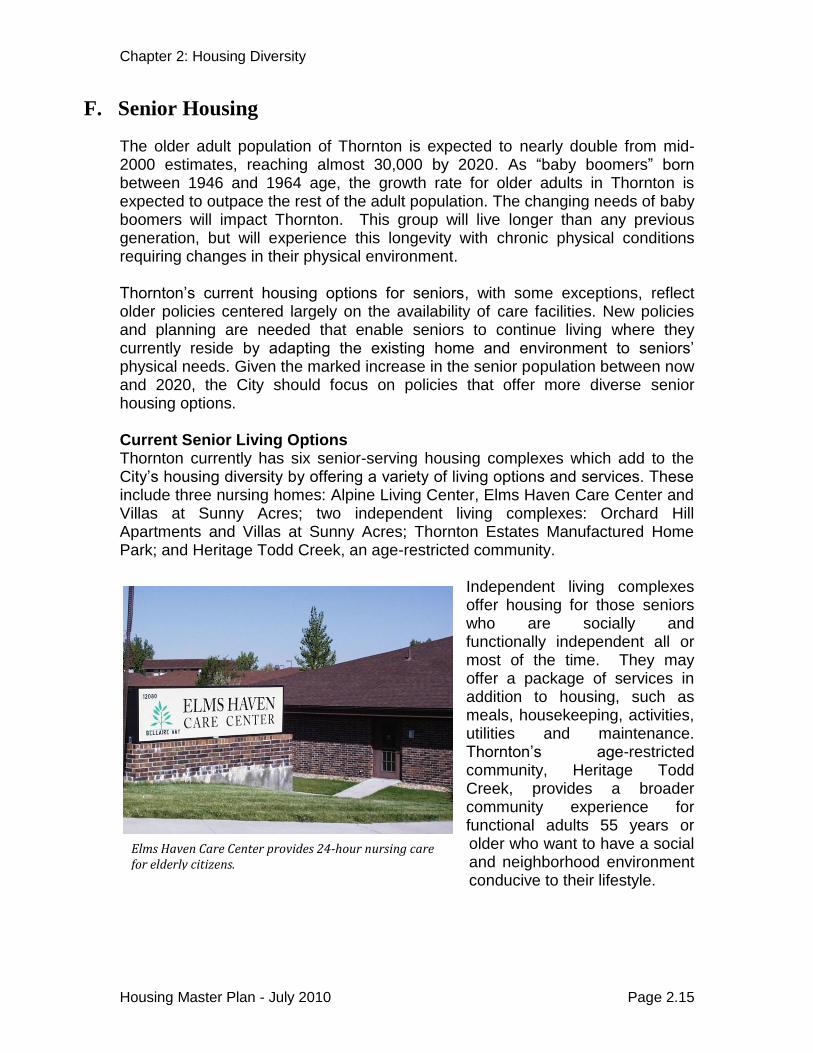
The older adult population of Thornton is expected to nearly double from mid-2000 estimates, reaching almost 30,000 by 2020. As “baby boomers” born between 1946 and 1964 age, the growth rate for older adults in Thornton is expected to outpace the rest of the adult population. The changing needs of baby boomers will impact Thornton. This group will live longer than any previous generation, but will experience this longevity with chronic physical conditions requiring changes in their physical environment. Thornton‟s current housing options for seniors, with some exceptions, reflect older policies centered largely on the availability of care facilities. New policies and planning are needed that enable seniors to continue living where they currently reside by adapting the existing home and environment to seniors‟ physical needs. Given the marked increase in the senior population between now and 2020, the City should focus on policies that offer more diverse senior housing options. Current Senior Living Options Thornton currently has six senior-serving housing complexes which add to the City‟s housing diversity by offering a variety of living options and services. These include three nursing homes: Alpine Living Center, Elms Haven Care Center and Villas at Sunny Acres; two independent living complexes: Orchard Hill Apartments and Villas at Sunny Acres; Thornton Estates Manufactured Home Park; and Heritage Todd Creek, an age-restricted community.
Independent living complexes offer housing for those seniors who are socially and functionally independent all or most of the time. They may offer a package of services in addition to housing, such as meals, housekeeping, activities, utilities and maintenance. Thornton‟s age-restricted community, Heritage Todd Creek, provides a broader community experience for functional adults 55 years or older who want to have a social and neighborhood environment conducive to their lifestyle.
Elms Haven Care Center provides 24-hour nursing care for elderly citizens.
Chapter 2: Housing Diversity
Housing Master Plan - July 2010 Page 2.16
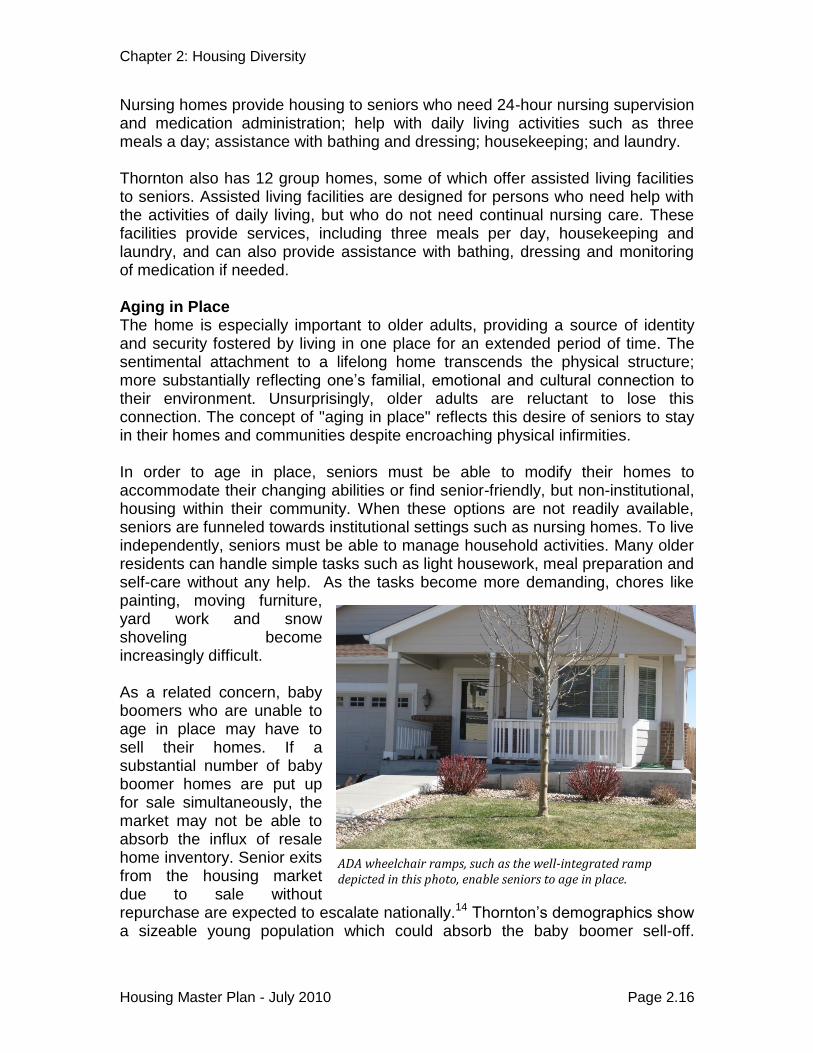
Nursing homes provide housing to seniors who need 24-hour nursing supervision and medication administration; help with daily living activities such as three meals a day; assistance with bathing and dressing; housekeeping; and laundry. Thornton also has 12 group homes, some of which offer assisted living facilities to seniors. Assisted living facilities are designed for persons who need help with the activities of daily living, but who do not need continual nursing care. These facilities provide services, including three meals per day, housekeeping and laundry, and can also provide assistance with bathing, dressing and monitoring of medication if needed. Aging in Place The home is especially important to older adults, providing a source of identity and security fostered by living in one place for an extended period of time. The sentimental attachment to a lifelong home transcends the physical structure; more substantially reflecting one‟s familial, emotional and cultural connection to their environment. Unsurprisingly, older adults are reluctant to lose this connection. The concept of "aging in place" reflects this desire of seniors to stay in their homes and communities despite encroaching physical infirmities. In order to age in place, seniors must be able to modify their homes to accommodate their changing abilities or find senior-friendly, but non-institutional, housing within their community. When these options are not readily available, seniors are funneled towards institutional settings such as nursing homes. To live independently, seniors must be able to manage household activities. Many older residents can handle simple tasks such as light housework, meal preparation and self-care without any help. As the tasks become more demanding, chores like painting, moving furniture, yard work and snow shoveling become increasingly difficult. As a related concern, baby boomers who are unable to age in place may have to sell their homes. If a substantial number of baby boomer homes are put up for sale simultaneously, the market may not be able to absorb the influx of resale home inventory. Senior exits from the housing market due to sale without repurchase are expected to escalate nationally.14 Thornton‟s demographics show a sizeable young population which could absorb the baby boomer sell-off.
ADA wheelchair ramps, such as the well-integrated ramp depicted in this photo, enable seniors to age in place.
Chapter 2: Housing Diversity
Housing Master Plan - July 2010 Page 2.17
However, these young buyers may desire different or newer types of housing products. The City will need to review the Census 2010 data to determine whether Thornton‟s housing market is positioned to accommodate the approaching demographic swing.
Programs that support aging in place provide social and financial benefits to individuals as well as the whole community. To support aging in place, the City should explore policies that link housing with supportive services, modify existing housing to accommodate disability, create new types of accessible housing, and expand housing stock in age-friendly communities.
Home modification programs for seniors with mobility and functionality limitations are an easy and relatively inexpensive way to promote aging in place. The simple provision of handrails and grab bars, ramps, and accessible bathrooms solves the most common home needs of these seniors. Assistance from the City and nonprofit organizations is necessary in these efforts because many seniors are unable to make changes themselves due to lack of ability or money. Additionally, they are often reluctant to hire contractors due to mistrust or lack of knowledge. Currently, the City coordinates a number of programs aimed at home modification for seniors. These programs are described in detail in Chapter 3: Revitalization and Preservation of Housing Stock. It is recommended that the City‟s Neighborhood Services and Senior Center Services Divisions work closely together to develop programs and services, as well as prepare an inventory of individuals and businesses that may be willing to provide modification and maintenance services for seniors.
Other policies being explored in various communities include “visitability”, “universal design”, and “age-friendly communities”. The first two options benefit people with disabilities in addition to seniors, and would require new City Code regulations for residential home builders. Any mandatory requirements may be difficult to implement as builders are currently struggling financially due to the weak economy. The third option, however, is more readily achievable through land use planning and zoning policies.
- Visitability refers to the provision of certain basic accessibility features in the entry and first floor of new single-family housing developments. Typical visitability features include a no-step entrance, wide entry doors, and a full or half bath on the first floor. These features enable persons with mobility problems to both live in their own accessible home, as well as easily access homes of nondisabled friends and family members. Existing visitability codes have been based on either mandatory or voluntary builder requirements. A 2007 national assessment found that visitability codes had been adopted in 17 states and 39 cities.
15 Federal legislation introduced in March 2009, H.R.1408
- Inclusive Home Design Act of 2009, would require, with some
Chapter 2: Housing Diversity
Housing Master Plan - July 2010 Page 2.18
exception, newly-constructed, federally-assisted single-family houses and town houses to include at least one level that complies with minimum standards of visitability for persons with disabilities. The bill was referred to the House Committee on Financial Services but has not progressed.
- Universal Design is similar in motive to visitability, but moves beyond the accessibility focus to include building features appropriate for all persons, regardless of size, age, or ability. At a minimum, such housing would include the features described in the Federal Fair Housing Act, such as accessible entrances, hallways, bathrooms and kitchens; raised electrical outlets; and wall supports in bathrooms for installing grab bars. It could also require accessibility of all entries, closets stacked on different floors to allow an elevator if needed, countertops installed at multiple heights, front loading appliances such as washer/dryers raised off the floor, grab bars in all bathrooms, nonslip surfaces, at least one roll-in shower, doors with either lever handles or automatic openers, and a "livable" first floor.16
- Age-Friendly Communities refer to residential developments where older people are actively involved and integrated into the community, and supported with infrastructure and services that effectively accommodate their needs. Housing in these communities is located near amenities such as stores, churches, and recreation. These communities also provide home modification programs, yard and sidewalk maintenance, adequate intersection crossing, and signage lighting and legibility. Frequently, age-friendly communities are less automobile dependent.
Senior Preference Input The City receives input on senior needs from the Senior Citizen Advisory Board, a group of senior Thornton residents which meets monthly and provides information directly to the Thornton City Council. The Committee contributed input to the 2006 Senior Needs Assessment and the 2009 Housing Needs Assessment on location and housing type preferences, amenities, and City services needed for seniors. The Committee‟s input reflects the desire to age in place. Thornton seniors would prefer to stay in Thornton through retirement as long as they could maintain their homes or find housing that meets their accessibility needs. For those interested in moving out of their current home, the newer, northern portions of the City were seen as desirable if product types for senior citizens were available. Many seniors liked the idea of mixed use communities near public transportation and with easy access to amenities such as beauty shops, restaurants, grocery stores and “one-stop” shops where multiple errands can be accomplished in one location. They also wanted minimal home and yard maintenance and were therefore interested in patio homes. There was mixed interest in shared-wall
Chapter 2: Housing Diversity
Housing Master Plan - July 2010 Page 2.19
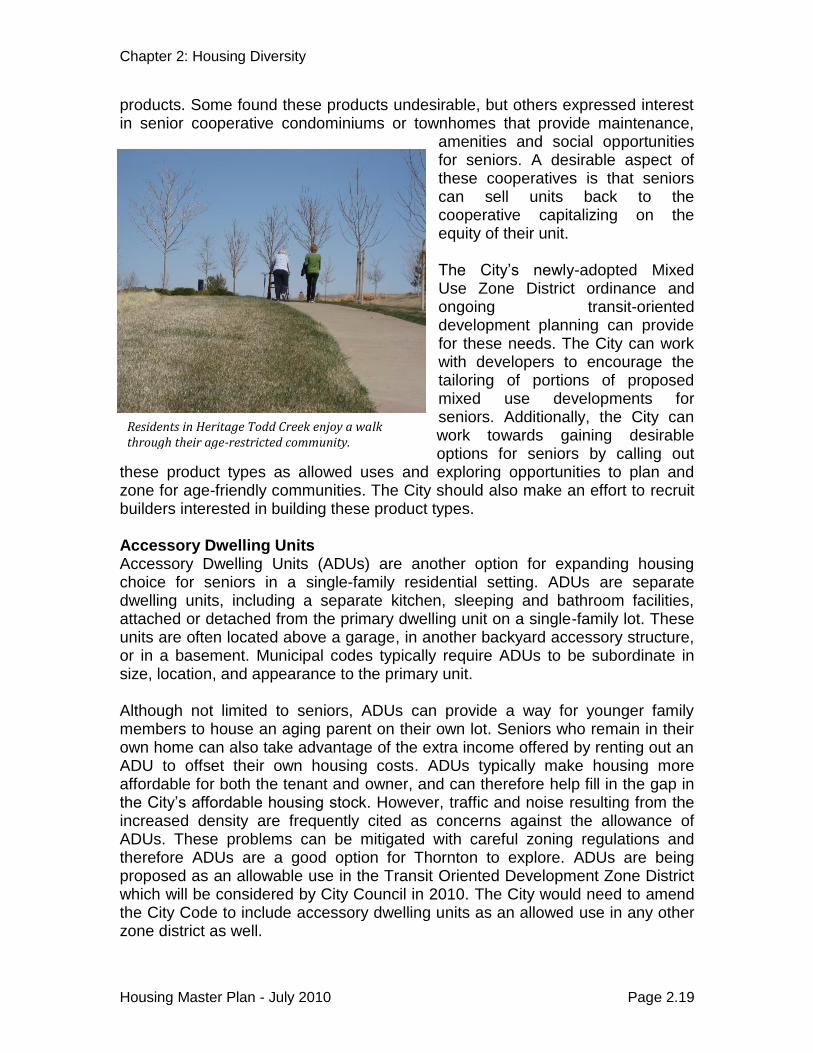
Residents in Heritage Todd Creek enjoy a walk through their age-restricted community.
products. Some found these products undesirable, but others expressed interest in senior cooperative condominiums or townhomes that provide maintenance,
amenities and social opportunities for seniors. A desirable aspect of these cooperatives is that seniors can sell units back to the cooperative capitalizing on the equity of their unit. The City‟s newly-adopted Mixed Use Zone District ordinance and ongoing transit-oriented development planning can provide for these needs. The City can work with developers to encourage the tailoring of portions of proposed mixed use developments for seniors. Additionally, the City can work towards gaining desirable options for seniors by calling out
these product types as allowed uses and exploring opportunities to plan and zone for age-friendly communities. The City should also make an effort to recruit builders interested in building these product types. Accessory Dwelling Units Accessory Dwelling Units (ADUs) are another option for expanding housing choice for seniors in a single-family residential setting. ADUs are separate dwelling units, including a separate kitchen, sleeping and bathroom facilities, attached or detached from the primary dwelling unit on a single-family lot. These units are often located above a garage, in another backyard accessory structure, or in a basement. Municipal codes typically require ADUs to be subordinate in size, location, and appearance to the primary unit. Although not limited to seniors, ADUs can provide a way for younger family members to house an aging parent on their own lot. Seniors who remain in their own home can also take advantage of the extra income offered by renting out an ADU to offset their own housing costs. ADUs typically make housing more affordable for both the tenant and owner, and can therefore help fill in the gap in the City‟s affordable housing stock. However, traffic and noise resulting from the increased density are frequently cited as concerns against the allowance of ADUs. These problems can be mitigated with careful zoning regulations and therefore ADUs are a good option for Thornton to explore. ADUs are being proposed as an allowable use in the Transit Oriented Development Zone District which will be considered by City Council in 2010. The City would need to amend the City Code to include accessory dwelling units as an allowed use in any other zone district as well.
Chapter 2: Housing Diversity
Housing Master Plan - July 2010 Page 2.20
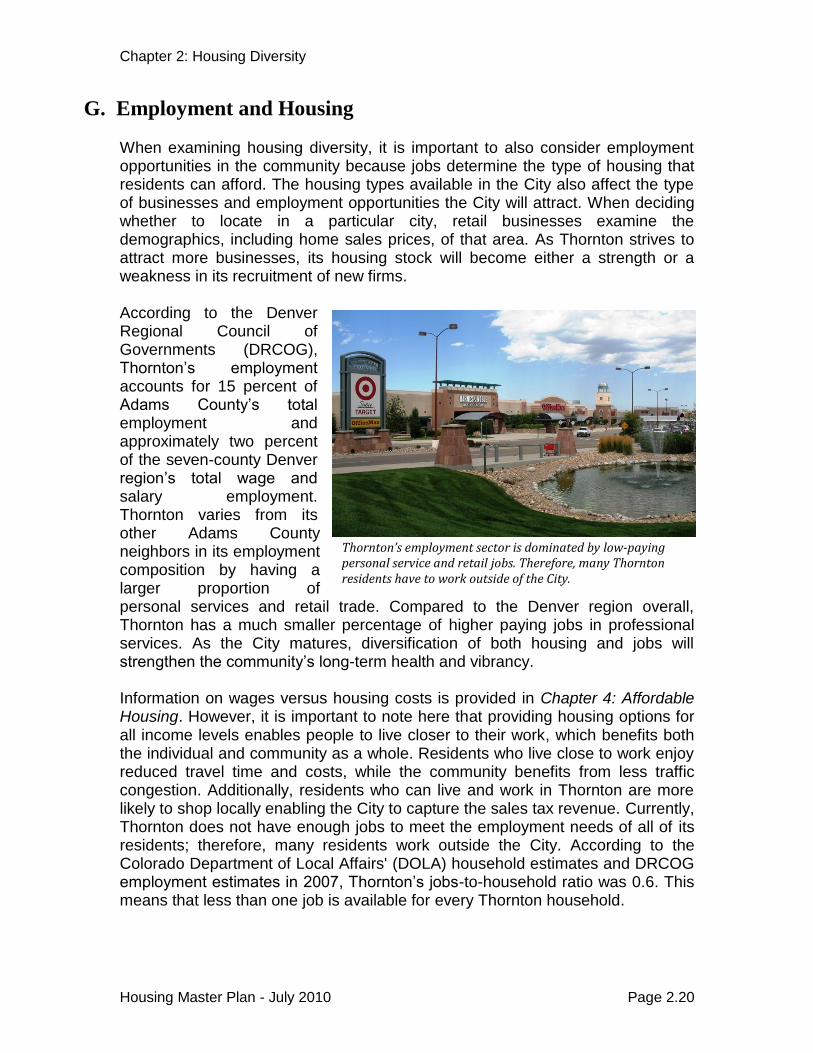
G. Employment and Housing When examining housing diversity, it is important to also consider employment opportunities in the community because jobs determine the type of housing that residents can afford. The housing types available in the City also affect the type of businesses and employment opportunities the City will attract. When deciding whether to locate in a particular city, retail businesses examine the demographics, including home sales prices, of that area. As Thornton strives to attract more businesses, its housing stock will become either a strength or a weakness in its recruitment of new firms. According to the Denver Regional Council of Governments (DRCOG), Thornton‟s employment accounts for 15 percent of Adams County‟s total employment and approximately two percent of the seven-county Denver region‟s total wage and salary employment. Thornton varies from its other Adams County neighbors in its employment composition by having a larger proportion of personal services and retail trade. Compared to the Denver region overall, Thornton has a much smaller percentage of higher paying jobs in professional services. As the City matures, diversification of both housing and jobs will strengthen the community‟s long-term health and vibrancy. Information on wages versus housing costs is provided in Chapter 4: Affordable Housing. However, it is important to note here that providing housing options for all income levels enables people to live closer to their work, which benefits both the individual and community as a whole. Residents who live close to work enjoy reduced travel time and costs, while the community benefits from less traffic congestion. Additionally, residents who can live and work in Thornton are more likely to shop locally enabling the City to capture the sales tax revenue. Currently, Thornton does not have enough jobs to meet the employment needs of all of its residents; therefore, many residents work outside the City. According to the Colorado Department of Local Affairs' (DOLA) household estimates and DRCOG employment estimates in 2007, Thornton‟s jobs-to-household ratio was 0.6. This means that less than one job is available for every Thornton household.
Thornton’s employment sector is dominated by low-paying personal service and retail jobs. Therefore, many Thornton residents have to work outside of the City.
Chapter 2: Housing Diversity
Housing Master Plan - July 2010 Page 2.21
Future Employment According to DRCOG‟s projections, employment growth will be fairly evenly distributed throughout the City, except for small pockets of large employment growth along the I-25 corridor in north Thornton. The City‟s total job projection at buildout in 2050 is approximately 70,000 jobs, based on best available data.17 Future employment growth will be possible primarily because of the City‟s access to major transportation arteries, mainly I-25. However, Thornton will be competing with other local communities to capture future employment. Renewable energy and green technology industries may be attracted to Thornton because of its close proximity to Denver, available workforce and land, and the region‟s overall affordability. If Thornton plans to attract green firms, it may need to offer housing choices that are appealing to these types of workers, such as energy efficient, mixed use or transit oriented developments.
H. Future Housing Thornton's 2007 Comprehensive Plan estimates residential buildout in the City at 86,200 housing units. Thornton still has vacant land available for development in the north, as well as some infill opportunities in the middle and southern portions of the City. As Thornton continues to expand and develop, the City has the opportunity to differentiate itself from neighboring communities through innovative residential products, further defining its niche in the Denver metro area. Transportation developments such as the northeastern link of E-470 and the proposed RTD FasTracks North Metro Corridor commuter rail line will encourage new types of housing as well. Efforts to recruit builders with unique product types and development ideas can help the City create an identity and balanced housing stock. Short-Term Future Residential Estimates The City of Thornton Policy Planning Division estimates future residential development on a quarterly basis using the total number of anticipated residential units derived from current planning documents, plat records, Building Permits (BPs) and Certificates of Occupancy (COs) issued during the previous quarter. Projections are based on three status categories of anticipated units: active projects (projects where building permits have been issued), approved projects (projects platted without building permits), and proposed projects (projects received for review only). Future housing projections released by Policy Planning in December 2009, and depicted in Exhibit 2.12, indicate that single-family detached (SFD) housing is prevalent across the three project status categories ensuring a steady and predictable influx of SFD units. Single-family attached (SFA) housing lagged in the approved category; however, a significant number of SFA units have been proposed. A majority of the potential multifamily (MF) projects fall into the “proposed” category. This category contains the most uncertainty, as projects in this category are in the initial proposal stage. While multifamily buildings have
Chapter 2: Housing Diversity
Housing Master Plan - July 2010 Page 2.22
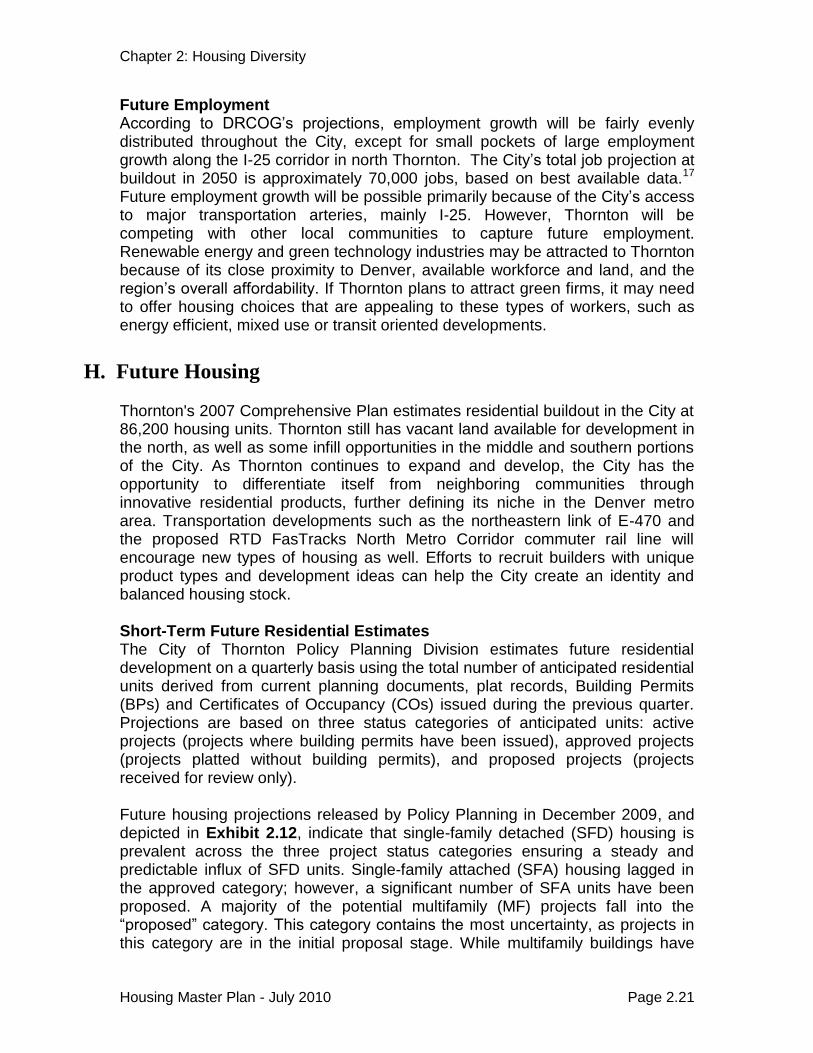
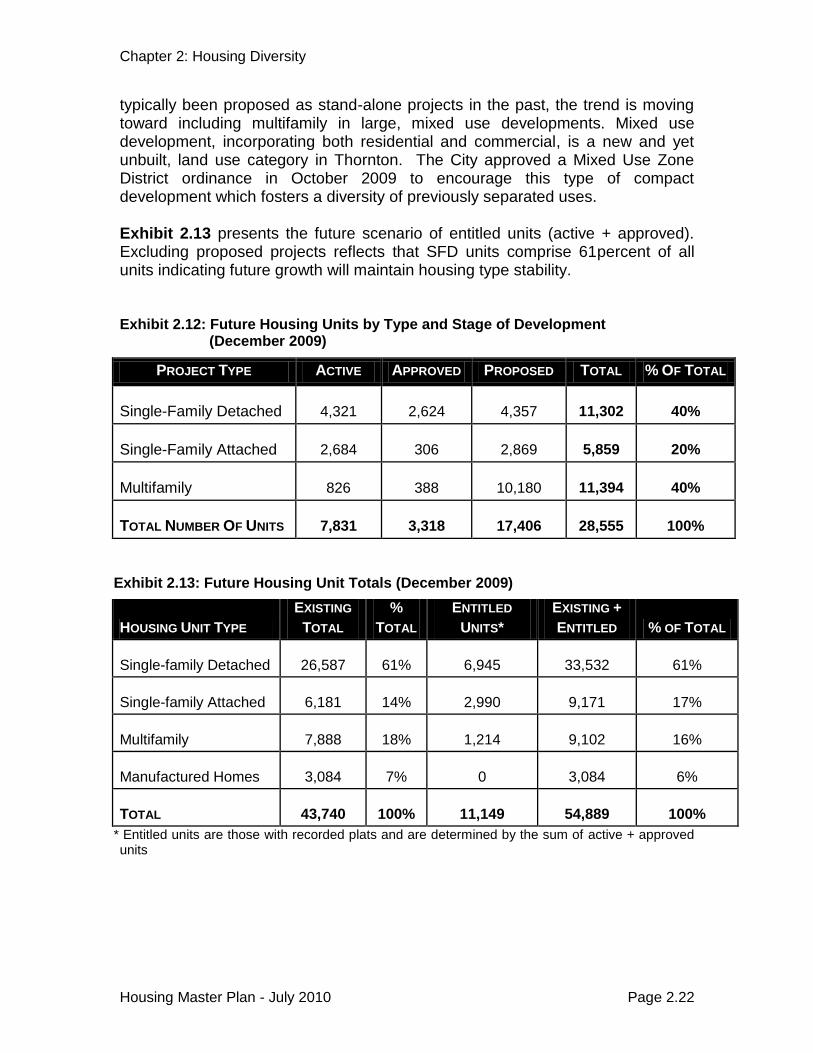
typically been proposed as stand-alone projects in the past, the trend is moving toward including multifamily in large, mixed use developments. Mixed use development, incorporating both residential and commercial, is a new and yet unbuilt, land use category in Thornton. The City approved a Mixed Use Zone District ordinance in October 2009 to encourage this type of compact development which fosters a diversity of previously separated uses. Exhibit 2.13 presents the future scenario of entitled units (active + approved). Excluding proposed projects reflects that SFD units comprise 61percent of all units indicating future growth will maintain housing type stability. Exhibit 2.12: Future Housing Units by Type and Stage of Development (December 2009)
PROJECT TYPE ACTIVE APPROVED PROPOSED TOTAL % OF TOTAL
Single-Family Detached 4,321 2,624 4,357 11,302 40%
Single-Family Attached 2,684 306 2,869 5,859 20%
Multifamily 826 388 10,180 11,394 40%
TOTAL NUMBER OF UNITS 7,831 3,318 17,406 28,555 100%
Exhibit 2.13: Future Housing Unit Totals (December 2009)
HOUSING UNIT TYPE
EXISTING
TOTAL
%
TOTAL
ENTITLED
UNITS*
EXISTING +
ENTITLED % OF TOTAL
Single-family Detached 26,587 61% 6,945 33,532 61%
Single-family Attached 6,181 14% 2,990 9,171 17%
Multifamily 7,888 18% 1,214 9,102 16%
Manufactured Homes 3,084 7% 0 3,084 6%
TOTAL 43,740 100% 11,149 54,889 100%
* Entitled units are those with recorded plats and are determined by the sum of active + approved units
Chapter 2: Housing Diversity
Housing Master Plan - July 2010 Page 2.23
I. Goals The City of Thornton’s Housing Diversity goals are to: 2-A Provide a range of housing options suitable for all stages/phases of the life
cycle. 2-B Work towards achieving a more even distribution of housing types
throughout the City. 2-C Address existing housing gaps as identified in Housing Needs
Assessment.
2-D Facilitate opportunities for home ownership.
Chapter References
1. U.S. Census Bureau. American Community Survey 1-Year Estimates: Thornton,
Colorado. U.S. Census Bureau, Washington D.C.: U.S. Government Printing Office, 2008.
2. Ibid. 3. BBC Research & Consulting. "Housing Needs Assessment: City of Thornton,
Colorado." Denver, CO, 2009. 4. Ibid. 5. Ibid. 6. Ibid. 7. U.S. Census Bureau. "Average Sales Price of New Manufactured Homes by
Region and Size of Home." U.S. Census Bureau Manufactured Homes Survey. January 2010. http://www.census.gov/const/www/mhsindex.html.
8. Ibid. 9. BBC Research & Consulting. "Housing Needs Assessment: City of Thornton,
Colorado." Denver, CO, 2009. 10. U.S. Census Bureau. American Community Survey 3-Year Estimates: Thornton,
Colorado. U.S. Census Bureau, Washington, D.C.: U.S. Government Printing Office, 2006-2008.
11. Ibid. 12. Ibid. 13. Ibid. 14. Myers, Dowell, and John Pitkin. "Demographic Forces and Turning Points in the
American City, 1950-2040." The ANNALS of the American Academy of Political and Social Science Volume 626, 2009: 91-111.
15. Pynoo, Jon, Christy Nishita, Caroline Cicero, and Rachel Caraviello. "Aging in Place, Housing, and the Law." The Elder Law Journal 16 L.J. 77, 2008: 77-105.
16. Ibid. 17. City of Thornton. "Colorado Department of Transportation - North Metro
Transportation Network May 21, 2009 Power Point Presentation." 2009.