Embed Size (px)
Citation preview
2 CHAPTER
2 . 1 T H E B A L A N C E S H E E T
The balance sheet is an accountant’s snapshot of the fi rm’s accounting value on a particular date, as though the fi rm stood momentarily still. The balance sheet has two sides: On the left are the assets and on the right are the liabilities and stockholders’ equity . The balance sheet states what the fi rm owns and how it is fi nanced. The accounting defi nition that un-derlies the balance sheet and describes the balance is
Assets � Liabilities � Stockholders’ equity
We have put a three-line equality in the balance equation to indicate that it must always hold, by defi nition. In fact, the stockholders’ equity is defi ned to be the difference between the assets and the liabilities of the fi rm. In principle, equity is what the stockholders would have remaining after the fi rm discharged its obligations.
Financial Statements and Cash Flow
In November 2009, mortgage giant Fannie Mae announced that it was reviewing a potential write-
off of $5.2 billion in low-income housing tax credits. A so-called write-off occurs when a company
decides that the reported value of one or more of its assets is too high and needs to be reduced
to more accurately represent the company’s finances. In Fannie Mae’s case, the write-off came
about because Fannie Mae owned potentially valuable tax credits, but the company was unlikely
to be profitable enough to use them, so their value was overstated. Fannie Mae’s case was unique
because the Treasury Department would not allow Fannie Mae to sell the tax credits, an option the
company had explored.
While Fannie Mae’s write-off is large, the record holder is media giant Time Warner, which took a
charge of $45.5 billion in the fourth quarter of 2002. This enormous write-off followed an earlier, even
larger, charge of $54 billion.
So, did the stockholders in these companies lose billions of dollars when these assets were writ-
ten off? Fortunately for them, the answer is probably not. Understanding why ultimately leads us to
the main subject of this chapter, that all-important substance known as cash flow .
OPENING CASE
ros30689_ch02_020-043.indd 20ros30689_ch02_020-043.indd 20 6/10/10 6:55 PM6/10/10 6:55 PM
CONFIRMING PAGES
CHAPTER 2 Financial Statements and Cash Flow 21
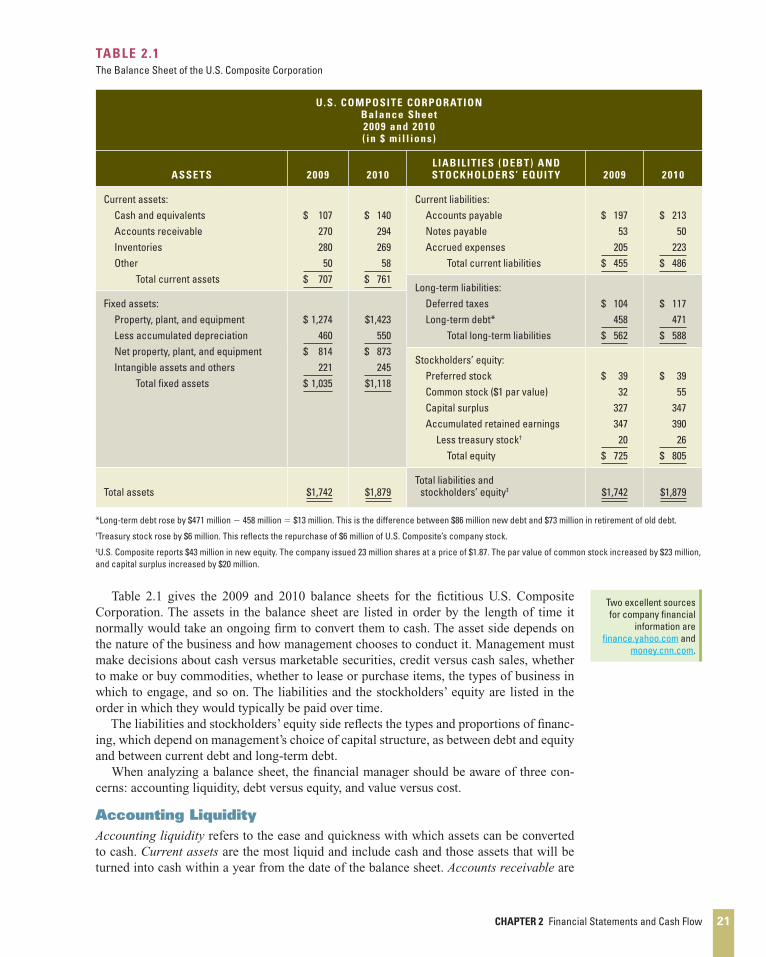
TABLE 2 .1
The Balance Sheet of the U.S. Composite Corporation
U .S . COMPOSITE CORPORATION Balance Sheet 2009 and 2010 ( in $ mil l ions)
ASSETS 2009 2010 L IABILITIES (DEBT) AND STOCKHOLDERS’ EQUITY 2009 2010
Current assets: Cash and equivalents Accounts receivable Inventories Other Total current assets
$ 107
270 280
50 $ 707
$ 140
294 269
58 $ 761
Current liabilities: Accounts payable Notes payable Accrued expenses Total current liabilities
$ 197
53 205
$ 455
$ 213
50 223
$ 486
Long-term liabilities: Deferred taxes Long-term debt * Total long-term liabilities
$ 104
458 $ 562
$ 117
471 $ 588
Fixed assets: Property, plant, and equipment Less accumulated depreciation Net property, plant, and equipment Intangible assets and others Total fi xed assets
$ 1,274
460 $ 814
221 $ 1,035
$1,423
550 $ 873
245 $1,118
Stockholders’ equity: Preferred stock Common stock ($1 par value) Capital surplus Accumulated retained earnings Less treasury stock † Total equity
$ 39
32 327 347
20 $ 725
$ 39
55 347 390
26 $ 805
Total assets $1,742 $1,879 Total liabilities and stockholders’ equity ‡ $1,742 $1,879
*Long-term debt rose by $471 million � 458 million � $13 million. This is the difference between $86 million new debt and $73 million in retirement of old debt.†Treasury stock rose by $6 million. This refl ects the repurchase of $6 million of U.S. Composite’s company stock.‡U.S. Composite reports $43 million in new equity. The company issued 23 million shares at a price of $1.87. The par value of common stock increased by $23 million, and capital surplus increased by $20 million.
Table 2.1 gives the 2009 and 2010 balance sheets for the fi ctitious U.S. Composite Corporation. The assets in the balance sheet are listed in order by the length of time it normally would take an ongoing fi rm to convert them to cash. The asset side depends on the nature of the business and how management chooses to conduct it. Management must make decisions about cash versus marketable securities, credit versus cash sales, whether to make or buy commodities, whether to lease or purchase items, the types of business in which to engage, and so on. The liabilities and the stockholders’ equity are listed in the order in which they would typically be paid over time.
The liabilities and stockholders’ equity side refl ects the types and proportions of fi nanc-ing, which depend on management’s choice of capital structure, as between debt and equity and between current debt and long-term debt.
When analyzing a balance sheet, the fi nancial manager should be aware of three con-cerns: accounting liquidity, debt versus equity, and value versus cost.
Accounting Liquidity Accounting liquidity refers to the ease and quickness with which assets can be converted to cash. Current assets are the most liquid and include cash and those assets that will be turned into cash within a year from the date of the balance sheet. Accounts receivable are
Two excellent sources for company fi nancial
information are fi nance.yahoo.com and
money.cnn.com .
ros30689_ch02_020-043.indd 21ros30689_ch02_020-043.indd 21 6/10/10 6:55 PM6/10/10 6:55 PM
CONFIRMING PAGES
22 PART 1 Overview
amounts not yet collected from customers for goods or services sold to them (after adjust-ment for potential bad debts). Inventory is composed of raw materials to be used in produc-tion, work in process, and fi nished goods. Fixed assets are the least liquid kind of assets. Tangible fi xed assets include property, plant, and equipment. These assets do not convert to cash from normal business activity, and they are not usually used to pay expenses such as payroll.
Some fi xed assets are not tangible. Intangible assets have no physical existence but can be very valuable. Examples of intangible assets are the value of a trademark or the value of a patent. The more liquid a fi rm’s assets, the less likely the fi rm is to experience problems meeting short-term obligations. Thus, the probability that a fi rm will avoid fi nancial dis-tress can be linked to the fi rm’s liquidity. Unfortunately, liquid assets frequently have lower rates of return than fi xed assets; for example, cash generates no investment income. To the extent a fi rm invests in liquid assets, it sacrifi ces an opportunity to invest in more profi table investment vehicles.
Debt versus Equity Liabilities are obligations of the fi rm that require a payout of cash within a stipulated time period. Many liabilities involve contractual obligations to repay a stated amount and inter-est over a period. Thus, liabilities are debts and are frequently associated with nominally fi xed cash burdens, called debt service , that put the fi rm in default of a contract if they are not paid. Stockholders’ equity is a claim against the fi rm’s assets that is residual and not fi xed. In general terms, when the fi rm borrows, it gives the bondholders fi rst claim on the fi rm’s cash fl ow. 1 Bondholders can sue the fi rm if the fi rm defaults on its bond contracts. This may lead the fi rm to declare itself bankrupt. Stockholders’ equity is the residual dif-ference between assets and liabilities:
Assets � Liabilities � Stockholders’ equity
This is the stockholders’ share in the fi rm stated in accounting terms. The accounting value of stockholders’ equity increases when retained earnings are added. This occurs when the fi rm retains part of its earnings instead of paying them out as dividends.
Value versus Cost The accounting value of a fi rm’s assets is frequently referred to as the carrying value or the book value of the assets. 2 Under generally accepted accounting principles (GAAP) , audited fi nancial statements of fi rms in the United States carry the assets at cost. 3 Thus the terms carrying value and book value are unfortunate. They specifi cally say “value,” when in fact the accounting numbers are based on cost. This misleads many readers of fi nancial statements to think that the fi rm’s assets are recorded at true market values. Market value is the price at which willing buyers and sellers would trade the assets. It would be only a coincidence if accounting value and market value were the same. In fact, management’s job is to create value for the fi rm that exceeds its cost.
Many people use the balance sheet, but the information each may wish to extract is not the same. A banker may look at a balance sheet for evidence of accounting liquidity and working capital. A supplier may also note the size of accounts payable and therefore the
Annual and quarterly fi nancial statements for most public U.S. corporations can be found in the EDGAR database at www.sec.gov .
The home page for the Financial Accounting Standards Board (FASB) is www.fasb.org .
1 Bondholders are investors in the fi rm’s debt. They are creditors of the fi rm. In this discussion, the term bondholder means the same thing as creditor .
3 Generally, GAAP require assets to be carried at the lower of cost or market value. In most instances, cost is lower than market value. However, in some cases when a fair market value can be readily determined, the assets have their value adjusted to the fair market value.
2 Confusion often arises because many fi nancial accounting terms have the same meaning. This presents a problem with jargon for the reader of fi nancial statements. For example, the following terms usually refer to the same thing: assets minus liabilities, net worth, stockholders’ equity, owners’ equity, book equity, and equity capitalization.
ros30689_ch02_020-043.indd 22ros30689_ch02_020-043.indd 22 6/10/10 6:55 PM6/10/10 6:55 PM
CONFIRMING PAGES
CHAPTER 2 Financial Statements and Cash Flow 23
general promptness of payments. Many users of fi nancial statements, including managers and investors, want to know the value of the fi rm, not its cost. This information is not found on the balance sheet. In fact, many of the true resources of the fi rm do not appear on the balance sheet: good management, proprietary assets, favorable economic conditions, and so on. Henceforth, whenever we speak of the value of an asset or the value of the fi rm, we will normally mean its market value. So, for example, when we say the goal of the fi nancial manager is to increase the value of the stock, we mean the market value of the stock.
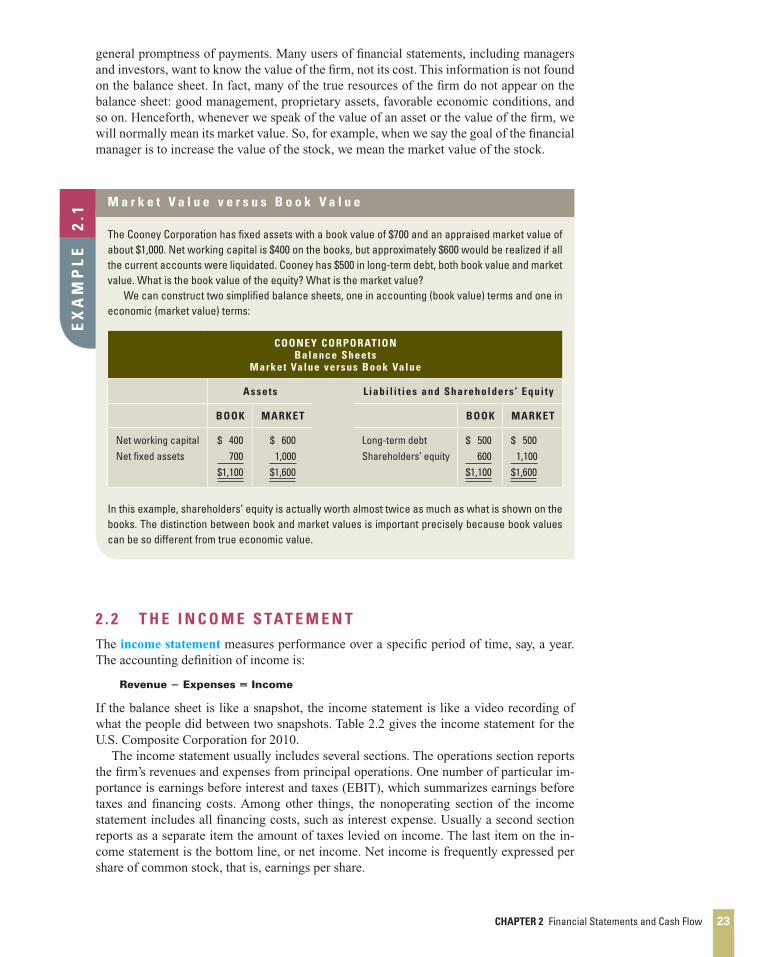
M a r k e t V a l u e v e r s u s B o o k V a l u e
The Cooney Corporation has fi xed assets with a book value of $700 and an appraised market value of about $1,000. Net working capital is $400 on the books, but approximately $600 would be realized if all the current accounts were liquidated. Cooney has $500 in long-term debt, both book value and market value. What is the book value of the equity? What is the market value? We can construct two simplifi ed balance sheets, one in accounting (book value) terms and one in economic (market value) terms:
COONEY CORPORATION Balance Sheets
Market Value versus Book Value
Assets L iabi l i t ies and Shareholders ’ Equi ty
BOOK MARKET BOOK MARKET
Net working capital Net fi xed assets
$ 400 700 $1,100
$ 600 1,000 $1,600
Long-term debt Shareholders’ equity
$ 500 600 $1,100
$ 500 1,100 $1,600
In this example, shareholders’ equity is actually worth almost twice as much as what is shown on the books. The distinction between book and market values is important precisely because book values can be so different from true economic value.
EX
AM
PL
E
2.1
2 . 2 T H E I N C O M E S TAT E M E N T
The income statement measures performance over a specifi c period of time, say, a year. The accounting defi nition of income is:
Revenue � Expenses � Income
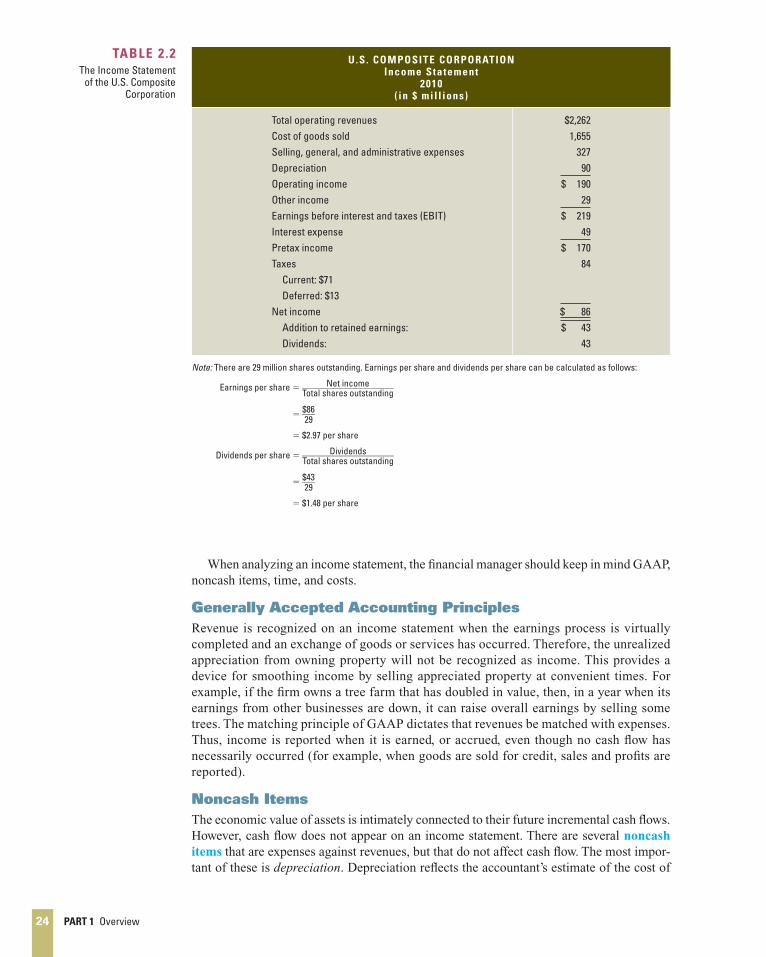
If the balance sheet is like a snapshot, the income statement is like a video recording of what the people did between two snapshots. Table 2.2 gives the income statement for the U.S. Composite Corporation for 2010.
The income statement usually includes several sections. The operations section reports the fi rm’s revenues and expenses from principal operations. One number of particular im-portance is earnings before interest and taxes (EBIT), which summarizes earnings before taxes and fi nancing costs. Among other things, the nonoperating section of the income statement includes all fi nancing costs, such as interest expense. Usually a second section reports as a separate item the amount of taxes levied on income. The last item on the in-come statement is the bottom line, or net income. Net income is frequently expressed per share of common stock, that is, earnings per share.
ros30689_ch02_020-043.indd 23ros30689_ch02_020-043.indd 23 6/10/10 6:55 PM6/10/10 6:55 PM
CONFIRMING PAGES
24 PART 1 Overview
When analyzing an income statement, the fi nancial manager should keep in mind GAAP, noncash items, time, and costs.
Generally Accepted Accounting Principles Revenue is recognized on an income statement when the earnings process is virtually completed and an exchange of goods or services has occurred. Therefore, the unrealized appreciation from owning property will not be recognized as income. This provides a device for smoothing income by selling appreciated property at convenient times. For example, if the fi rm owns a tree farm that has doubled in value, then, in a year when its earnings from other businesses are down, it can raise overall earnings by selling some trees. The matching principle of GAAP dictates that revenues be matched with expenses. Thus, income is reported when it is earned, or accrued, even though no cash fl ow has necessarily occurred (for example, when goods are sold for credit, sales and profi ts are reported).
Noncash Items The economic value of assets is intimately connected to their future incremental cash fl ows. However, cash fl ow does not appear on an income statement. There are several noncash items that are expenses against revenues, but that do not affect cash fl ow. The most impor-tant of these is depreciation . Depreciation refl ects the accountant’s estimate of the cost of
U .S . COMPOSITE CORPORATION Income Statement
2010 ( in $ mil l ions)
Total operating revenues Cost of goods sold Selling, general, and administrative expenses Depreciation Operating income Other income Earnings before interest and taxes (EBIT) Interest expense Pretax income Taxes Current: $71 Deferred: $13 Net income Addition to retained earnings: Dividends:
$2,262 1,655
327 90 $ 190
29 $ 219
49 $ 170
84
$ 86 $ 43
43
Note: There are 29 million shares outstanding. Earnings per share and dividends per share can be calculated as follows:
Earnings per share � Net income ____________________ Total shares outstanding
� $86 ___ 29
� $2.97 per share
Dividends per share � Dividends ____________________ Total shares outstanding
� $43 ___ 29
� $1.48 per share
TABLE 2 .2
The Income Statement of the U.S. Composite
Corporation
ros30689_ch02_020-043.indd 24ros30689_ch02_020-043.indd 24 6/10/10 6:55 PM6/10/10 6:55 PM
CONFIRMING PAGES
CHAPTER 2 Financial Statements and Cash Flow 25
equipment used up in the production process. For example, suppose an asset with a fi ve-year life and no resale value is purchased for $1,000. According to accountants, the $1,000 cost must be expensed over the useful life of the asset. If straight-line depreciation is used, there will be fi ve equal installments and $200 of depreciation expense will be incurred each year. From a fi nance perspective, the cost of the asset is the actual negative cash fl ow in-curred when the asset is acquired (that is, $1,000, not the accountant’s smoothed $200-per-year depreciation expense).
Another noncash expense is deferred taxes . Deferred taxes result from differences be-tween accounting income and true taxable income. 4 Notice that the accounting tax shown on the income statement for the U.S. Composite Corporation is $84 million. It can be bro-ken down as current taxes and deferred taxes. The current tax portion is actually sent to the tax authorities (for example, the Internal Revenue Service). The deferred tax portion is not. However, the theory is that if taxable income is less than accounting income in the current year, it will be more than accounting income later on. Consequently, the taxes that are not paid today will have to be paid in the future, and they represent a liability of the fi rm. This shows up on the balance sheet as deferred tax liability. From the cash fl ow perspective, though, deferred tax is not a cash outfl ow.
In practice, the difference between cash fl ows and accounting income can be quite dra-matic, so it is important to understand the difference. For example, Sirius XM Radio re-ported a net loss of about $413 million for the third quarter of 2009. That sounds bad, but Sirius XM also reported a positive cash fl ow of $116 million from operating activities for the same quarter!
Time and Costs It is often useful to think of all of future time as having two distinct parts, the short run and the long run . The short run is that period of time in which certain equipment, re-sources, and commitments of the fi rm are fi xed; but the time is long enough for the fi rm to vary its output by using more labor and raw materials. The short run is not a precise period of time that will be the same for all industries. However, all fi rms making deci-sions in the short run have some fi xed costs, that is, costs that will not change because of fi xed commitments. In real business activity, examples of fi xed costs are bond interest, overhead, and property taxes. Costs that are not fi xed are variable. Variable costs change as the output of the fi rm changes; some examples are raw materials and wages for laborers on the production line.
In the long run, all costs are variable. Financial accountants do not distinguish between variable costs and fi xed costs. Instead, accounting costs usually fi t into a classifi cation that distinguishes product costs from period costs. Product costs are the total production costs incurred during a period—raw materials, direct labor, and manufacturing overhead—and are reported on the income statement as cost of goods sold. Both variable and fi xed costs are included in product costs. Period costs are costs that are allocated to a time period; they are called selling, general, and administrative expenses . One period cost would be the company president’s salary.
2 . 3 TA X E S
Taxes can be one of the largest cash outfl ows that a fi rm experiences. For example, for the fi scal year 2009, ExxonMobil’s earnings before taxes were about $34.8 billion. Its tax bill, including all taxes paid worldwide, was a whopping $15.1 billion, or about 43.4 percent of its pretax earnings. The size of the tax bill is determined through the tax
4 One situation in which taxable income may be lower than accounting income is when the fi rm uses accelerated depreciation expense procedures for the IRS but uses straight-line procedures allowed by GAAP for reporting purposes.
ros30689_ch02_020-043.indd 25ros30689_ch02_020-043.indd 25 6/10/10 6:55 PM6/10/10 6:55 PM
CONFIRMING PAGES
26 PART 1 Overview
code, an often amended set of rules. In this section, we examine corporate tax rates and how taxes are calculated.
If the various rules of taxation seem a little bizarre or convoluted to you, keep in mind that the tax code is the result of political, not economic, forces. As a result, there is no rea-son why it has to make economic sense.
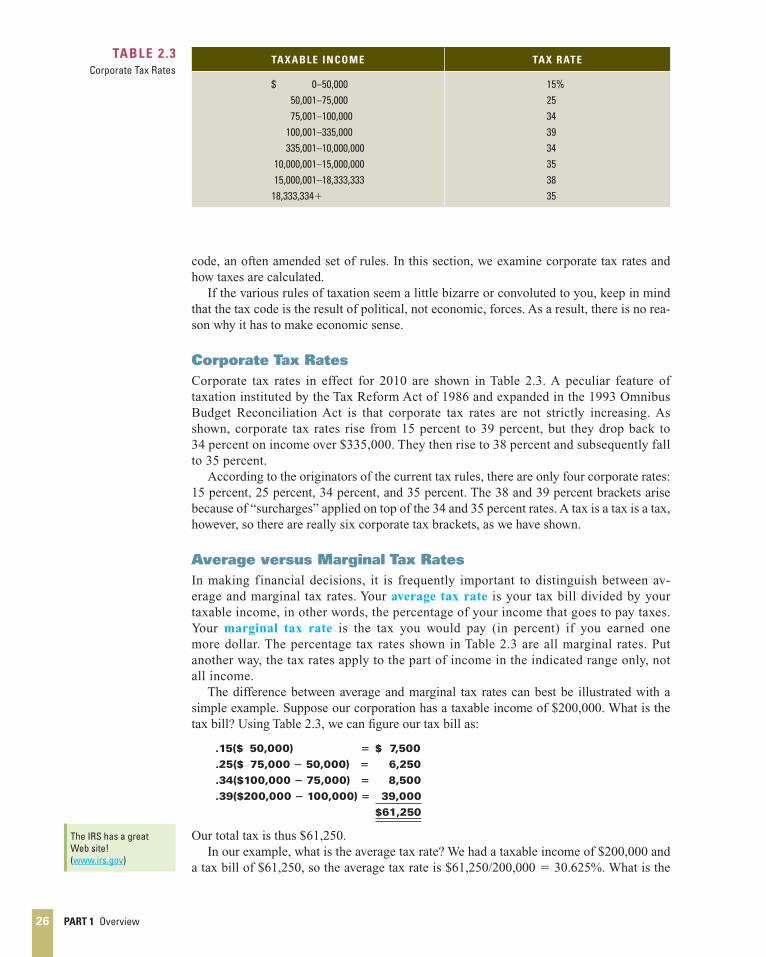
Corporate Tax Rates Corporate tax rates in effect for 2010 are shown in Table 2.3 . A peculiar feature of taxation instituted by the Tax Reform Act of 1986 and expanded in the 1993 Omnibus Budget Reconciliation Act is that corporate tax rates are not strictly increasing. As shown, corporate tax rates rise from 15 percent to 39 percent, but they drop back to 34 percent on income over $335,000. They then rise to 38 percent and subsequently fall to 35 percent.
According to the originators of the current tax rules, there are only four corporate rates: 15 percent, 25 percent, 34 percent, and 35 percent. The 38 and 39 percent brackets arise because of “surcharges” applied on top of the 34 and 35 percent rates. A tax is a tax is a tax, however, so there are really six corporate tax brackets, as we have shown.
Average versus Marginal Tax Rates In making financial decisions, it is frequently important to distinguish between av-erage and marginal tax rates. Your average tax rate is your tax bill divided by your taxable income, in other words, the percentage of your income that goes to pay taxes. Your marginal tax rate is the tax you would pay (in percent) if you earned one more dollar. The percentage tax rates shown in Table 2.3 are all marginal rates. Put another way, the tax rates apply to the part of income in the indicated range only, not all income.
The difference between average and marginal tax rates can best be illustrated with a simple example. Suppose our corporation has a taxable income of $200,000. What is the tax bill? Using Table 2.3 , we can fi gure our tax bill as:
.15($ 50,000) � $ 7,500
.25($ 75,000 � 50,000) � 6,250
.34($100,000 � 75,000) � 8,500
.39($200,000 � 100,000) � 39,000
$61,250
Our total tax is thus $61,250. In our example, what is the average tax rate? We had a taxable income of $200,000 and
a tax bill of $61,250, so the average tax rate is $61,250/200,000 � 30.625%. What is the
The IRS has a great Web site! ( www.irs.gov )
TAXABLE INCOME TAX RATE
$ 0–50,000 50,001–75,000 75,001–100,000
100,001–335,000 335,001–10,000,000
10,000,001–15,000,000 15,000,001–18,333,333
18,333,334�
15% 25 34 39 34 35 38 35
TABLE 2 .3
Corporate Tax Rates
ros30689_ch02_020-043.indd 26ros30689_ch02_020-043.indd 26 6/10/10 6:55 PM6/10/10 6:55 PM
CONFIRMING PAGES
CHAPTER 2 Financial Statements and Cash Flow 27
marginal tax rate? If we made one more dollar, the tax on that dollar would be 39 cents, so our marginal rate is 39 percent.
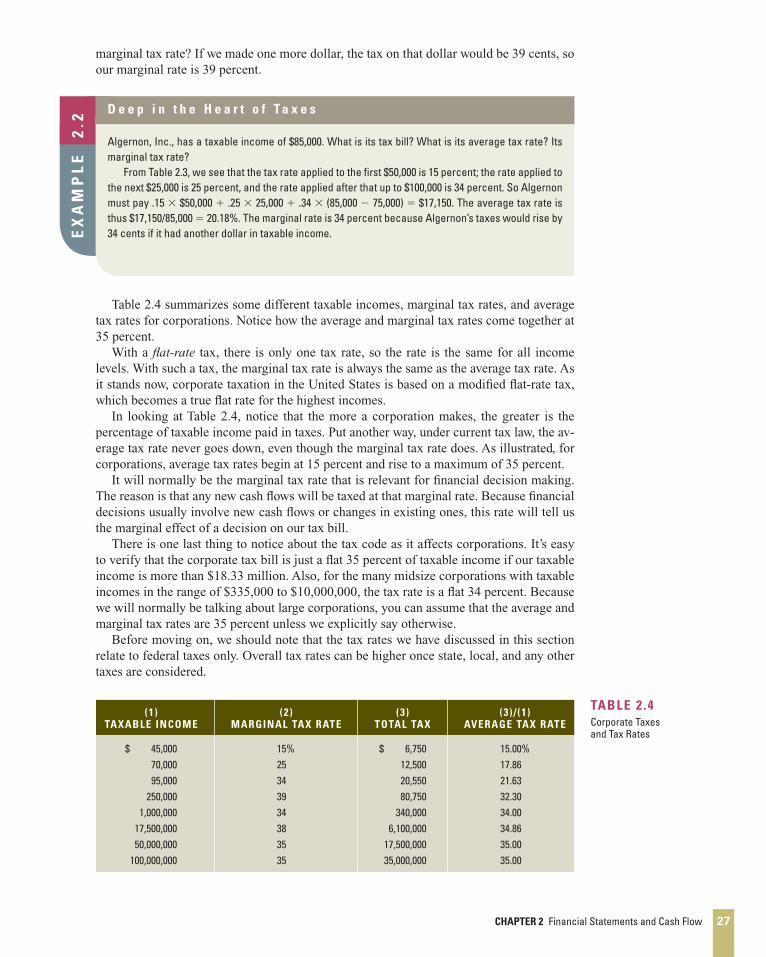
Table 2.4 summarizes some different taxable incomes, marginal tax rates, and average tax rates for corporations. Notice how the average and marginal tax rates come together at 35 percent.
With a fl at-rate tax, there is only one tax rate, so the rate is the same for all income levels. With such a tax, the marginal tax rate is always the same as the average tax rate. As it stands now, corporate taxation in the United States is based on a modifi ed fl at-rate tax, which becomes a true fl at rate for the highest incomes.
In looking at Table 2.4 , notice that the more a corporation makes, the greater is the percentage of taxable income paid in taxes. Put another way, under current tax law, the av-erage tax rate never goes down, even though the marginal tax rate does. As illustrated, for corporations, average tax rates begin at 15 percent and rise to a maximum of 35 percent.
It will normally be the marginal tax rate that is relevant for fi nancial decision making. The reason is that any new cash fl ows will be taxed at that marginal rate. Because fi nancial decisions usually involve new cash fl ows or changes in existing ones, this rate will tell us the marginal effect of a decision on our tax bill.
There is one last thing to notice about the tax code as it affects corporations. It’s easy to verify that the corporate tax bill is just a fl at 35 percent of taxable income if our taxable income is more than $18.33 million. Also, for the many midsize corporations with taxable incomes in the range of $335,000 to $10,000,000, the tax rate is a fl at 34 percent. Because we will normally be talking about large corporations, you can assume that the average and marginal tax rates are 35 percent unless we explicitly say otherwise.
Before moving on, we should note that the tax rates we have discussed in this section relate to federal taxes only. Overall tax rates can be higher once state, local, and any other taxes are considered.
D e e p i n t h e H e a r t o f T a x e s
Algernon, Inc., has a taxable income of $85,000. What is its tax bill? What is its average tax rate? Its marginal tax rate? From Table 2.3 , we see that the tax rate applied to the fi rst $50,000 is 15 percent; the rate applied to the next $25,000 is 25 percent, and the rate applied after that up to $100,000 is 34 percent. So Algernon must pay .15 � $50,000 � .25 � 25,000 � .34 � (85,000 � 75,000) � $17,150. The average tax rate is thus $17,150/85,000 � 20.18%. The marginal rate is 34 percent because Algernon’s taxes would rise by 34 cents if it had another dollar in taxable income. E
XA
MP
LE
2
.2
(1 )TAXABLE INCOME
(2 )MARGINAL TAX RATE
(3 )TOTAL TAX
(3 ) / (1 )AVERAGE TAX RATE
$ 45,000 70,000 95,000
250,000 1,000,000
17,500,000 50,000,000
100,000,000
15% 25 34 39 34 38 35 35
$ 6,750 12,500 20,550 80,750
340,000 6,100,000
17,500,000 35,000,000
15.00% 17.86 21.63 32.30 34.00 34.86 35.00 35.00
TABLE 2 .4
Corporate Taxes and Tax Rates
ros30689_ch02_020-043.indd 27ros30689_ch02_020-043.indd 27 6/10/10 6:55 PM6/10/10 6:55 PM
CONFIRMING PAGES
28 PART 1 Overview
2 . 4 N E T W O R K I N G C A P I TA L
Net working capital is current assets minus current liabilities. Net working capital is posi-tive when current assets are greater than current liabilities. This means the cash that will become available over the next 12 months will be greater than the cash that must be paid out. The net working capital of the U.S. Composite Corporation is $275 million in 2010 and $252 million in 2009:
Current assets
($ millions)�
Current liabilities
($ millions)�
Net working capital
($ millions)
2010 $761 � $486 � $275
2009 707 � 455 � 252
In addition to investing in fi xed assets (i.e., capital spending), a fi rm can invest in net work-ing capital. This is called the change in net working capital . The change in net working capital in 2010 is the difference between the net working capital in 2010 and 2009; that is, $275 million � 252 million � $23 million. The change in net working capital is usually positive in a growing fi rm.
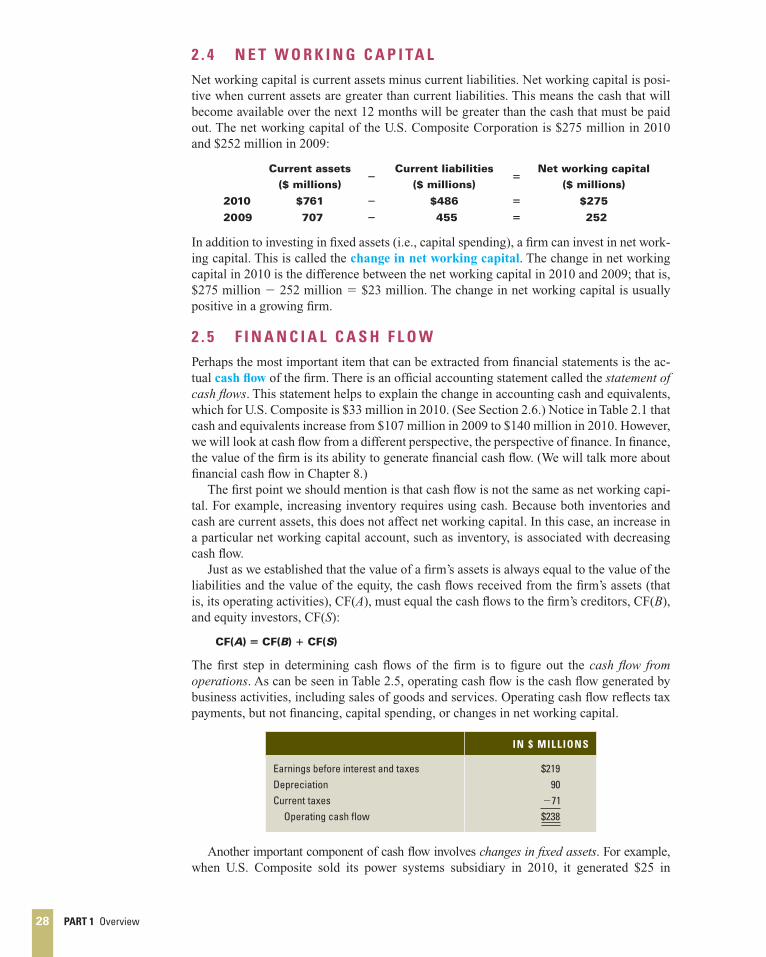
2 . 5 F I N A N C I A L C A S H F L O W
Perhaps the most important item that can be extracted from fi nancial statements is the ac-tual cash fl ow of the fi rm. There is an offi cial accounting statement called the statement of cash fl ows . This statement helps to explain the change in accounting cash and equivalents, which for U.S. Composite is $33 million in 2010. (See Section 2.6.) Notice in Table 2.1 that cash and equivalents increase from $107 million in 2009 to $140 million in 2010. However, we will look at cash fl ow from a different perspective, the perspective of fi nance. In fi nance, the value of the fi rm is its ability to generate fi nancial cash fl ow. (We will talk more about fi nancial cash fl ow in Chapter 8.)
The fi rst point we should mention is that cash fl ow is not the same as net working capi-tal. For example, increasing inventory requires using cash. Because both inventories and cash are current assets, this does not affect net working capital. In this case, an increase in a particular net working capital account, such as inventory, is associated with decreasing cash fl ow.
Just as we established that the value of a fi rm’s assets is always equal to the value of the liabilities and the value of the equity, the cash fl ows received from the fi rm’s assets (that is, its operating activities), CF( A ), must equal the cash fl ows to the fi rm’s creditors, CF( B ), and equity investors, CF( S ):
CF(A) � CF(B) � CF(S)
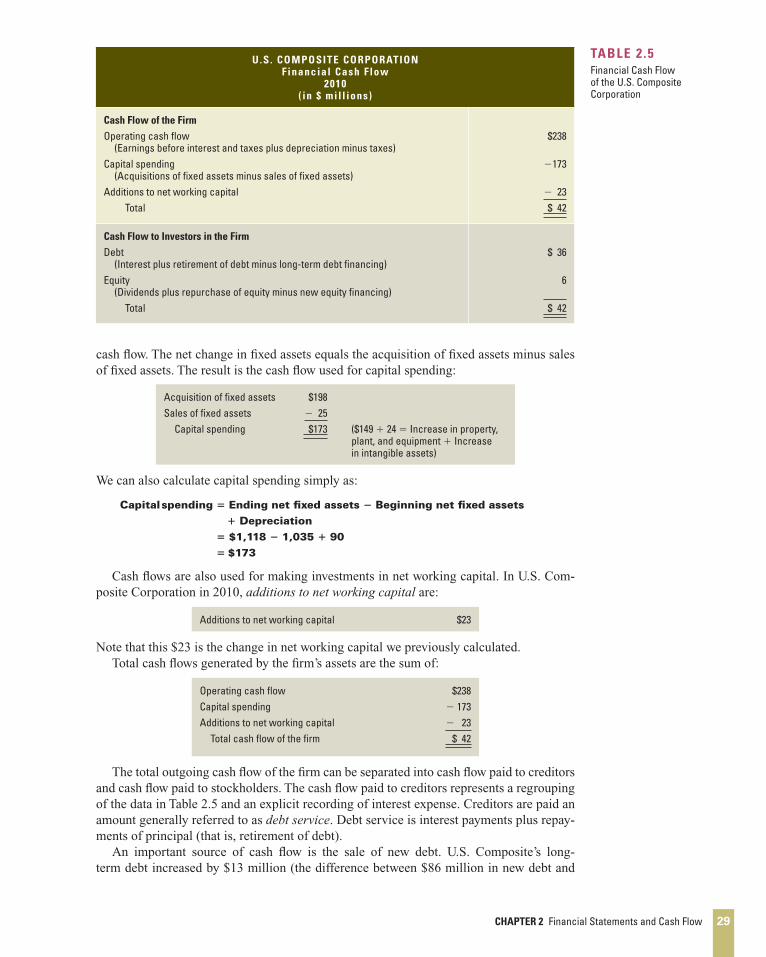
The fi rst step in determining cash fl ows of the fi rm is to fi gure out the cash fl ow from operations . As can be seen in Table 2.5 , operating cash fl ow is the cash fl ow generated by business activities, including sales of goods and services. Operating cash fl ow refl ects tax payments, but not fi nancing, capital spending, or changes in net working capital.
IN $ MILLIONS
Earnings before interest and taxes Depreciation Current taxes Operating cash fl ow
$219 90 �71 $238
Another important component of cash fl ow involves changes in fi xed assets . For example, when U.S. Composite sold its power systems subsidiary in 2010, it generated $25 in
ros30689_ch02_020-043.indd 28ros30689_ch02_020-043.indd 28 6/10/10 6:55 PM6/10/10 6:55 PM
CONFIRMING PAGES
CHAPTER 2 Financial Statements and Cash Flow 29
cash fl ow. The net change in fi xed assets equals the acquisition of fi xed assets minus sales of fi xed assets. The result is the cash fl ow used for capital spending:
Acquisition of fi xed assets Sales of fi xed assets Capital spending
$198 � 25 $173
($149 � 24 � Increase in property, plant, and equipment � Increase in intangible assets)
We can also calculate capital spending simply as:
Capital spending � Ending net fi xed assets � Beginning net fi xed assets
� Depreciation
� $1,118 � 1,035 � 90
� $173
Cash fl ows are also used for making investments in net working capital. In U.S. Com-posite Corporation in 2010, additions to net working capital are:
Additions to net working capital $23
Note that this $23 is the change in net working capital we previously calculated. Total cash fl ows generated by the fi rm’s assets are the sum of:
Operating cash fl ow Capital spending Additions to net working capital Total cash fl ow of the fi rm
$238 � 173 � 23 $ 42
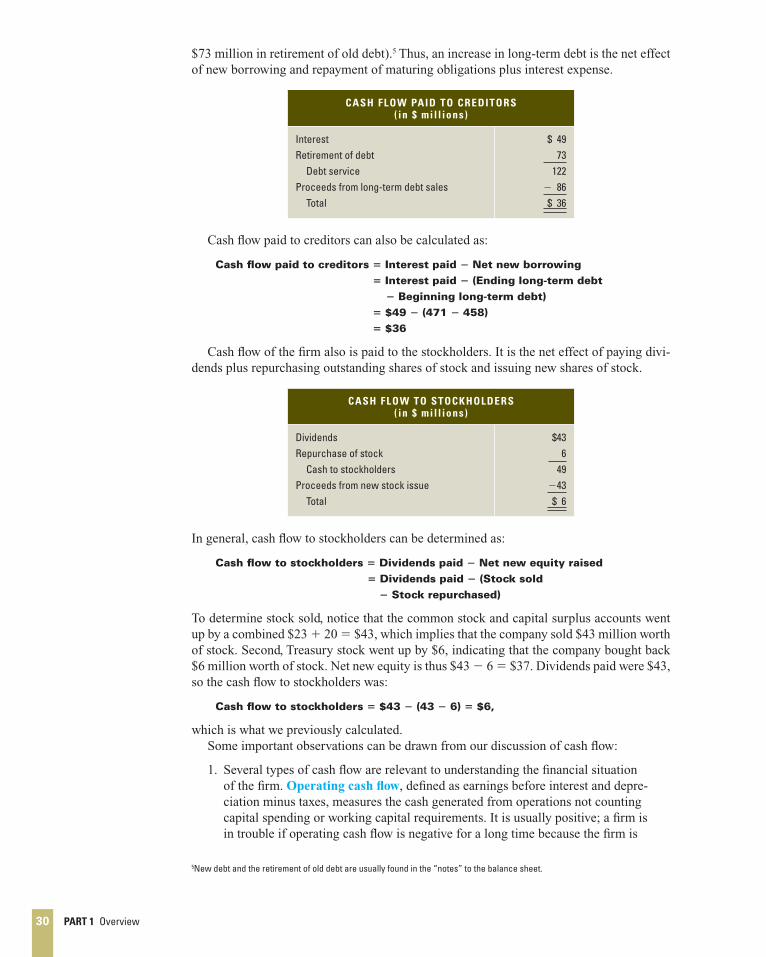
The total outgoing cash fl ow of the fi rm can be separated into cash fl ow paid to creditors and cash fl ow paid to stockholders. The cash fl ow paid to creditors represents a regrouping of the data in Table 2.5 and an explicit recording of interest expense. Creditors are paid an amount generally referred to as debt service . Debt service is interest payments plus repay-ments of principal (that is, retirement of debt).
An important source of cash fl ow is the sale of new debt. U.S. Composite’s long-term debt increased by $13 million (the difference between $86 million in new debt and
U .S . COMPOSITE CORPORATION F inancial Cash Flow
2010 ( in $ mil l ions)
Cash Flow of the Firm
Operating cash fl ow (Earnings before interest and taxes plus depreciation minus taxes) Capital spending (Acquisitions of fi xed assets minus sales of fi xed assets) Additions to net working capital Total
$238
�173
� 23 $ 42
Cash Flow to Investors in the Firm
Debt (Interest plus retirement of debt minus long-term debt fi nancing) Equity (Dividends plus repurchase of equity minus new equity fi nancing) Total
$ 36
6 $ 42
TABLE 2 .5
Financial Cash Flow of the U.S. Composite Corporation
ros30689_ch02_020-043.indd 29ros30689_ch02_020-043.indd 29 6/10/10 6:55 PM6/10/10 6:55 PM
CONFIRMING PAGES
30 PART 1 Overview
$73 million in retirement of old debt). 5 Thus, an increase in long-term debt is the net effect of new borrowing and repayment of maturing obligations plus interest expense.
CASH FLOW PAID TO CREDITORS ( in $ mil l ions)
Interest Retirement of debt Debt service Proceeds from long-term debt sales Total
$ 49 73
122 � 86 $ 36
Cash fl ow paid to creditors can also be calculated as:
Cash fl ow paid to creditors � Interest paid � Net new borrowing
� Interest paid � (Ending long-term debt
� Beginning long-term debt)
� $49 � (471 � 458)
� $36
Cash fl ow of the fi rm also is paid to the stockholders. It is the net effect of paying divi-dends plus repurchasing outstanding shares of stock and issuing new shares of stock.
CASH FLOW TO STOCKHOLDERS ( in $ mil l ions)
Dividends Repurchase of stock Cash to stockholders Proceeds from new stock issue Total
$43 6
49 �43 $ 6
In general, cash fl ow to stockholders can be determined as:
Cash fl ow to stockholders � Dividends paid � Net new equity raised
� Dividends paid � (Stock sold
� Stock repurchased)
To determine stock sold, notice that the common stock and capital surplus accounts went up by a combined $23 � 20 � $43, which implies that the company sold $43 million worth of stock. Second, Treasury stock went up by $6, indicating that the company bought back $6 million worth of stock. Net new equity is thus $43 � 6 � $37. Dividends paid were $43, so the cash fl ow to stockholders was:
Cash fl ow to stockholders � $43 � (43 � 6) � $6,
which is what we previously calculated. Some important observations can be drawn from our discussion of cash fl ow:
1. Several types of cash fl ow are relevant to understanding the fi nancial situation of the fi rm. Operating cash fl ow , defi ned as earnings before interest and depre-ciation minus taxes, measures the cash generated from operations not counting capital spending or working capital requirements. It is usually positive; a fi rm is in trouble if operating cash fl ow is negative for a long time because the fi rm is
5 New debt and the retirement of old debt are usually found in the “notes” to the balance sheet.
ros30689_ch02_020-043.indd 30ros30689_ch02_020-043.indd 30 6/10/10 6:55 PM6/10/10 6:55 PM
CONFIRMING PAGES
CHAPTER 2 Financial Statements and Cash Flow 31
not generating enough cash to pay operating costs. Total cash fl ow of the fi rm includes adjustments for capital spending and additions to net working capital. It will frequently be negative. When a fi rm is growing at a rapid rate, the spending on inventory and fi xed assets can be higher than cash fl ow from sales.
2. Net income is not cash fl ow. The net income of the U.S. Composite Corporation in 2010 was $86 million, whereas cash fl ow was $42 million. The two numbers are not usually the same. In determining the economic and fi nancial condition of a fi rm, cash fl ow is more revealing.
A fi rm’s total cash fl ow sometimes goes by a different name, free cash fl ow . Of course, there is no such thing as “free” cash (we wish!). Instead, the name refers to cash that the fi rm is free to distribute to creditors and stockholders because it is not needed for work-ing capital or fi xed asset investments. We will stick with “total cash fl ow of the fi rm” as our label for this important concept because, in practice, there is some variation in exactly how free cash fl ow is computed; different users calculate it in different ways. Nonetheless, whenever you hear the phrase “free cash fl ow,” you should understand that what is being discussed is cash fl ow from assets or something quite similar.
2 . 6 T H E A C C O U N T I N G S TAT E M E N T O F C A S H F L O W S
As previously mentioned, there is an offi cial accounting statement called the statement of cash fl ows. This statement helps explain the change in accounting cash, which for U.S. Composite is $33 million in 2010. It is very useful in understanding fi nancial cash fl ow.
The fi rst step in determining the change in cash is to fi gure out cash fl ow from operating activities. This is the cash fl ow that results from the fi rm’s normal activities producing and selling goods and services. The second step is to make an adjustment for cash fl ow from investing activities. The fi nal step is to make an adjustment for cash fl ow from fi nancing activities. Financing activities are the net payments to creditors and owners (excluding interest expense) made during the year.
The three components of the statement of cash fl ows are determined below.
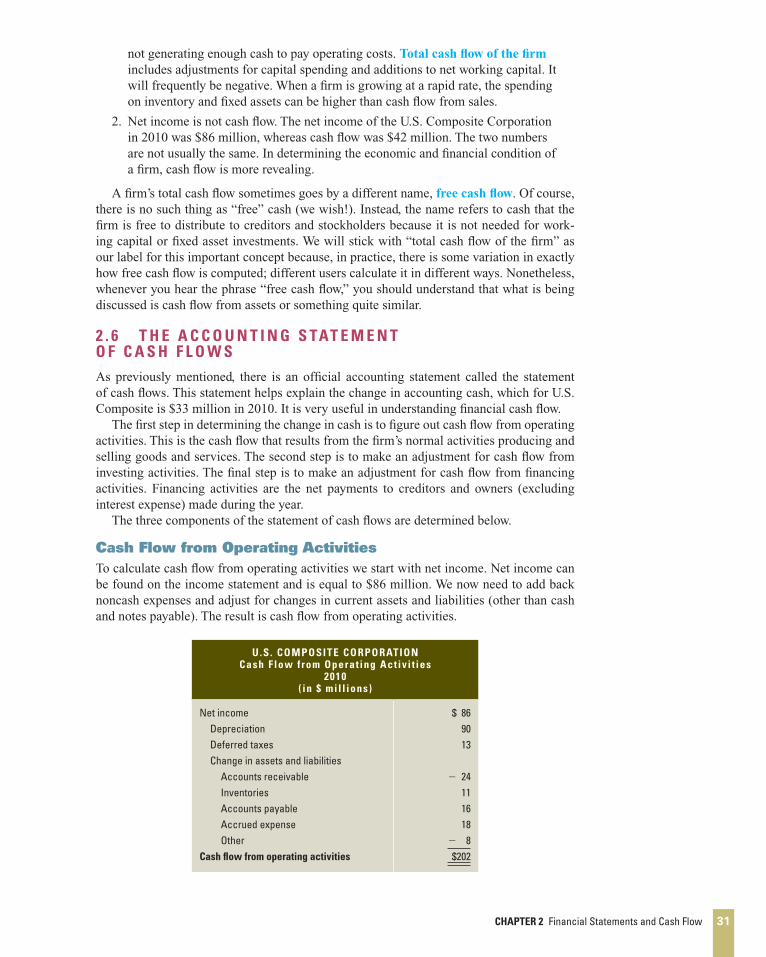
Cash Flow from Operating Activities To calculate cash fl ow from operating activities we start with net income. Net income can be found on the income statement and is equal to $86 million. We now need to add back noncash expenses and adjust for changes in current assets and liabilities (other than cash and notes payable). The result is cash fl ow from operating activities.
U .S . COMPOSITE CORPORATION Cash Flow from Operat ing Act iv i t ies
2010 ( in $ mil l ions)
Net income Depreciation Deferred taxes Change in assets and liabilities Accounts receivable Inventories Accounts payable Accrued expense Other Cash fl ow from operating activities
$ 86 90 13
� 24
11 16 18
� 8 $202
ros30689_ch02_020-043.indd 31ros30689_ch02_020-043.indd 31 6/10/10 6:55 PM6/10/10 6:55 PM
CONFIRMING PAGES
32 PART 1 Overview
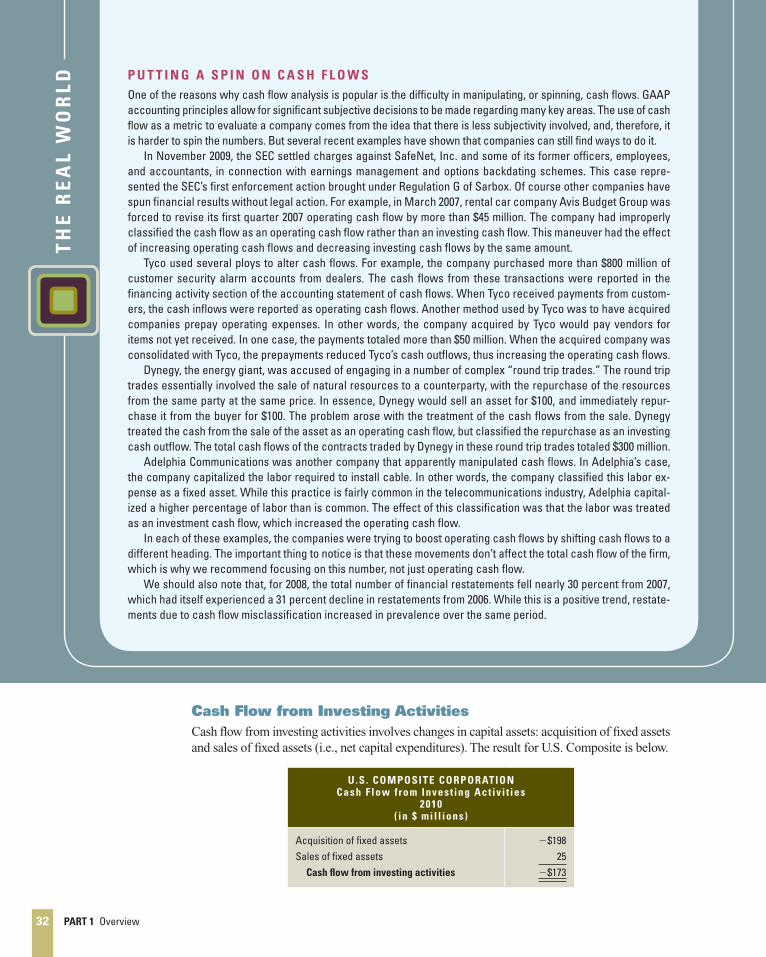
Cash Flow from Investing Activities Cash fl ow from investing activities involves changes in capital assets: acquisition of fi xed assets and sales of fi xed assets (i.e., net capital expenditures). The result for U.S. Composite is below.
U .S . COMPOSITE CORPORATION Cash Flow from Invest ing Act iv i t ies
2010 ( in $ mil l ions)
Acquisition of fi xed assets Sales of fi xed assets Cash fl ow from investing activities
�$198 25 �$173
TH
E R
EA
L W
OR
LD P U T T I N G A S P I N O N C A S H F L O W S
One of the reasons why cash flow analysis is popular is the difficulty in manipulating, or spinning, cash flows. GAAP accounting principles allow for significant subjective decisions to be made regarding many key areas. The use of cash flow as a metric to evaluate a company comes from the idea that there is less subjectivity involved, and, therefore, it is harder to spin the numbers. But several recent examples have shown that companies can still find ways to do it. In November 2009, the SEC settled charges against SafeNet, Inc. and some of its former officers, employees, and accountants, in connection with earnings management and options backdating schemes. This case repre-sented the SEC’s first enforcement action brought under Regulation G of Sarbox. Of course other companies have spun financial results without legal action. For example, in March 2007, rental car company Avis Budget Group was forced to revise its first quarter 2007 operating cash flow by more than $45 million. The company had improperly classified the cash flow as an operating cash flow rather than an investing cash flow. This maneuver had the effect of increasing operating cash flows and decreasing investing cash flows by the same amount. Tyco used several ploys to alter cash flows. For example, the company purchased more than $800 million of customer security alarm accounts from dealers. The cash flows from these transactions were reported in the financing activity section of the accounting statement of cash flows. When Tyco received payments from custom-ers, the cash inflows were reported as operating cash flows. Another method used by Tyco was to have acquired companies prepay operating expenses. In other words, the company acquired by Tyco would pay vendors for items not yet received. In one case, the payments totaled more than $50 million. When the acquired company was consolidated with Tyco, the prepayments reduced Tyco’s cash outflows, thus increasing the operating cash flows. Dynegy, the energy giant, was accused of engaging in a number of complex “round trip trades.” The round trip trades essentially involved the sale of natural resources to a counterparty, with the repurchase of the resources from the same party at the same price. In essence, Dynegy would sell an asset for $100, and immediately repur-chase it from the buyer for $100. The problem arose with the treatment of the cash flows from the sale. Dynegy treated the cash from the sale of the asset as an operating cash flow, but classified the repurchase as an investing cash outflow. The total cash flows of the contracts traded by Dynegy in these round trip trades totaled $300 million. Adelphia Communications was another company that apparently manipulated cash flows. In Adelphia’s case, the company capitalized the labor required to install cable. In other words, the company classified this labor ex-pense as a fixed asset. While this practice is fairly common in the telecommunications industry, Adelphia capital-ized a higher percentage of labor than is common. The effect of this classification was that the labor was treated as an investment cash flow, which increased the operating cash flow. In each of these examples, the companies were trying to boost operating cash flows by shifting cash flows to a different heading. The important thing to notice is that these movements don’t affect the total cash flow of the firm, which is why we recommend focusing on this number, not just operating cash flow. We should also note that, for 2008, the total number of financial restatements fell nearly 30 percent from 2007, which had itself experienced a 31 percent decline in restatements from 2006. While this is a positive trend, restate-ments due to cash flow misclassification increased in prevalence over the same period.
ros30689_ch02_020-043.indd 32ros30689_ch02_020-043.indd 32 6/10/10 6:55 PM6/10/10 6:55 PM
CONFIRMING PAGES
CHAPTER 2 Financial Statements and Cash Flow 33
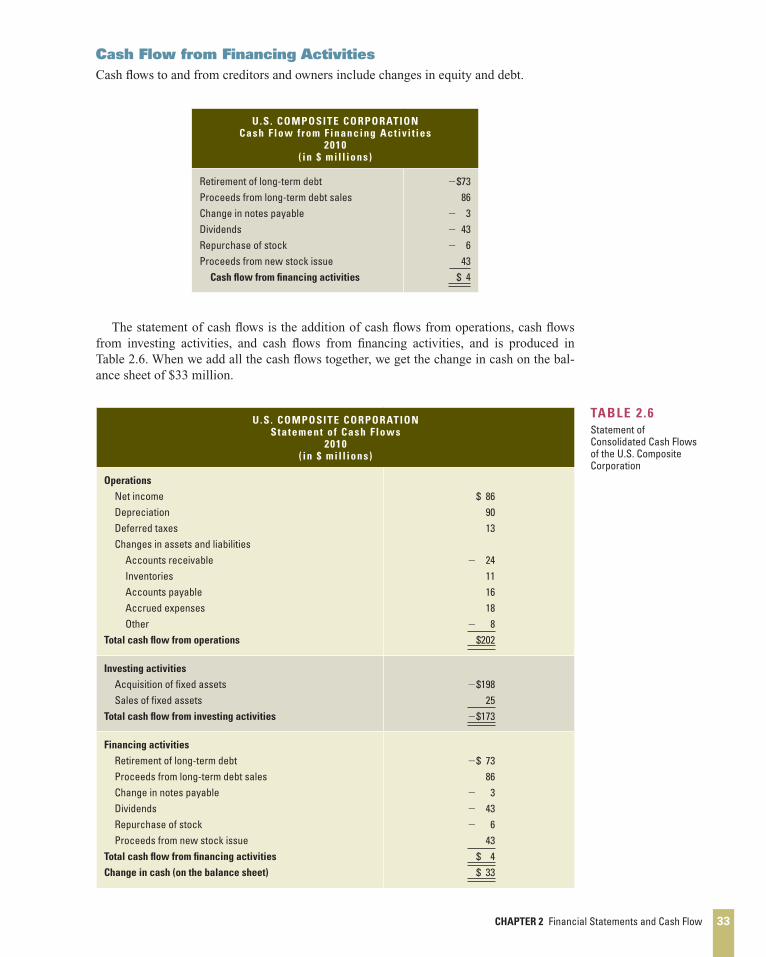
Cash Flow from Financing Activities Cash fl ows to and from creditors and owners include changes in equity and debt.
TABLE 2 .6
Statement of Consolidated Cash Flows of the U.S. Composite Corporation
U .S . COMPOSITE CORPORATION Statement of Cash Flows
2010 ( in $ mil l ions)
Operations
Net income Depreciation Deferred taxes Changes in assets and liabilities Accounts receivable Inventories Accounts payable Accrued expenses Other Total cash fl ow from operations
$ 86
90 13
� 24
11 16 18
� 8 $202
Investing activities
Acquisition of fi xed assets Sales of fi xed assets Total cash fl ow from investing activities
�$198 25 �$173
Financing activities
Retirement of long-term debt Proceeds from long-term debt sales Change in notes payable Dividends Repurchase of stock Proceeds from new stock issue Total cash fl ow from fi nancing activities
Change in cash (on the balance sheet)
�$ 73
86 � 3 � 43 � 6 43 $ 4 $ 33
U .S . COMPOSITE CORPORATION Cash Flow from Financing Act iv i t ies
2010 ( in $ mil l ions)
Retirement of long-term debt Proceeds from long-term debt sales Change in notes payable Dividends Repurchase of stock Proceeds from new stock issue Cash fl ow from fi nancing activities
�$73 86
� 3 � 43 � 6 43 $ 4
The statement of cash fl ows is the addition of cash fl ows from operations, cash fl ows from investing activities, and cash fl ows from fi nancing activities, and is produced in Table 2.6 . When we add all the cash fl ows together, we get the change in cash on the bal-ance sheet of $33 million.
ros30689_ch02_020-043.indd 33ros30689_ch02_020-043.indd 33 6/10/10 6:55 PM6/10/10 6:55 PM
CONFIRMING PAGES
34 PART 1 Overview
There is a close relationship between the offi cial accounting statement called the state-ment of cash fl ows and the total cash fl ow of the fi rm used in fi nance. Going back to the pre-vious section, you should note a slight conceptual problem here. Interest paid should really go under fi nancing activities, but unfortunately that is not how the accounting is handled. The reason is that interest is deducted as an expense when net income is computed. As a consequence, a primary difference between the accounting cash fl ow and the fi nancial cash fl ow of the fi rm (see Table 2.5 ) is interest expense. The Real World box on page 32 discusses some ways in which companies have attempted to “spin the numbers” in the accounting statement of cash fl ows.
S U M M A R Y A N D C O N C L U S I O N S
Besides introducing you to corporate accounting, the purpose of this chapter has been to teach you how to determine cash fl ow from the accounting statements of a typical company.
1. Cash fl ow is generated by the fi rm and paid to creditors and shareholders. It can be classifi ed as:
a. Cash fl ow from operations.
b. Cash fl ow from changes in fi xed assets.
c. Cash fl ow from changes in working capital.
2. Calculations of cash fl ow are not diffi cult, but they require care and particular attention to detail in properly accounting for noncash expenses such as depreciation and deferred taxes. It is especially important that you do not confuse cash fl ow with changes in net working capital and net income.
C O N C E P T Q U E S T I O N S
1. Liquidity What does liquidity measure? Explain the trade-off a fi rm faces between high liquid-ity and low liquidity levels.
2. Accounting and Cash Flows Why is it that the revenue and cost fi gures shown on a standard income statement may not be representative of the actual cash infl ows and outfl ows that oc-curred during the period?
3. Accounting Statement of Cash Flows Looking at the accounting statement of cash fl ows, what does the bottom line number mean? How useful is this number for analyzing a company?
4. Cash Flows How do fi nancial cash fl ows and the accounting statement of cash fl ows differ? Which is more useful when analyzing a company?
5. Book Values versus Market Values Under standard accounting rules, it is possible for a com-pany’s liabilities to exceed its assets. When this occurs, the owners’ equity is negative. Can this happen with market values? Why or why not?
6. Cash Flow from Assets Suppose a company’s cash fl ow from assets was negative for a particular period. Is this necessarily a good sign or a bad sign?
7. Operating Cash Flow Suppose a company’s operating cash fl ow was negative for several years running. Is this necessarily a good sign or a bad sign?
8. Net Working Capital and Capital Spending Could a company’s change in net working capital be negative in a given year? (Hint: Yes.) Explain how this might come about. What about net capital spending?
ros30689_ch02_020-043.indd 34ros30689_ch02_020-043.indd 34 6/10/10 6:55 PM6/10/10 6:55 PM
CONFIRMING PAGES
CHAPTER 2 Financial Statements and Cash Flow 35
www.mhhe.com/rwj
9. Cash Flow to Stockholders and Creditors Could a company’s cash fl ow to stockholders be negative in a given year? (Hint: Yes.) Explain how this might come about. What about cash fl ow to creditors?
10. Firm Values Referring back to the Fannie Mae example used at the beginning of the chapter, note that we suggested that Fannie Mae’s stockholders probably didn’t suffer as a result of the reported loss. What do you think was the basis for our conclusion?
Q U E S T I O N S A N D P R O B L E M S
1. Building a Balance Sheet Brees, Inc., has current assets of $7,500, net fi xed assets of $28,900, current liabilities of $5,900, and long-term debt of $18,700. What is the value of the shareholders’ equity account for this fi rm? How much is net working capital?
2. Building an Income Statement Tyler, Inc., has sales of $753,000, costs of $308,000, deprecia-tion expense of $46,000, interest expense of $21,500, and a tax rate of 35 percent. What is the net income for the fi rm? Suppose the company paid out $67,000 in cash dividends. What is the addi-tion to retained earnings?
3. Market Values and Book Values Klingon Cruisers, Inc., purchased new cloaking machinery three years ago for $7 million. The machinery can be sold to the Romulans today for $5.2 mil-lion. Klingon’s current balance sheet shows net fi xed assets of $4.5 million, current liabilities of $1.8 million, and net working capital of $750,000. If all the current assets were liquidated today, the company would receive $2.7 million cash. What is the book value of Klingon’s assets today? What is the market value?
4. Calculating Taxes The Conard Co. had $285,000 in taxable income. Using the rates from Table 2.3 in the chapter, calculate the company’s income taxes. What is the average tax rate? What is the marginal tax rate?
5. Calculating OCF Williams, Inc., has sales of $25,300, costs of $9,100, depreciation expense of $1,700, and interest expense of $950. If the tax rate is 40 percent, what is the operating cash fl ow, or OCF?
6. Calculating Net Capital Spending Martin Driving School’s 2009 balance sheet showed net fi xed assets of $4.7 million, and the 2010 balance sheet showed net fi xed assets of $5.3 million. The company’s 2010 income statement showed a depreciation expense of $760,000. What was the company’s net capital spending for 2010?
7. Building a Balance Sheet The following table presents the long-term liabilities and stockhold-ers’ equity of Information Control Corp. one year ago:
Long-term debt Preferred stock Common stock ($1 par value) Capital surplus Accumulated retained earnings
$35,000,000 4,000,000
11,000,000 26,000,000 75,000,000
During the past year, Information Control issued 8 million shares of new stock at a total price of $29 million, and issued $6 million in new long-term debt. The company generated $7 million in net income and paid $2.5 million in dividends. Construct the current balance sheet refl ecting the changes that occurred at Information Control Corp. during the year.
Basic
(Questions 1–10)
ros30689_ch02_020-043.indd 35ros30689_ch02_020-043.indd 35 6/10/10 6:55 PM6/10/10 6:55 PM
CONFIRMING PAGES
36 PART 1 Overview
www.mhhe.com/rwj
8. Cash Flow to Creditors The 2009 balance sheet of Maria’s Tennis Shop, Inc., showed long-term debt of $2.4 million, and the 2010 balance sheet showed long-term debt of $2.5 million. The 2010 income statement showed an interest expense of $195,000. What was the fi rm’s cash fl ow to creditors during 2010?
9. Cash Flow to Stockholders The 2009 balance sheet of Maria’s Tennis Shop, Inc., showed $730,000 in the common stock account and $6.2 million in the additional paid-in surplus account. The 2010 balance sheet showed $775,000 and $6.9 million in the same two accounts, respec-tively. If the company paid out $400,000 in cash dividends during 2010, what was the cash fl ow to stockholders for the year?
10. Calculating Total Cash Flows Given the information for Maria’s Tennis Shop, Inc., in the pre-vious two problems, suppose you also know that the fi rm’s net capital spending for 2010 was $810,000, and that the fi rm reduced its net working capital investment by $85,000. What was the fi rm’s 2010 operating cash fl ow, or OCF?
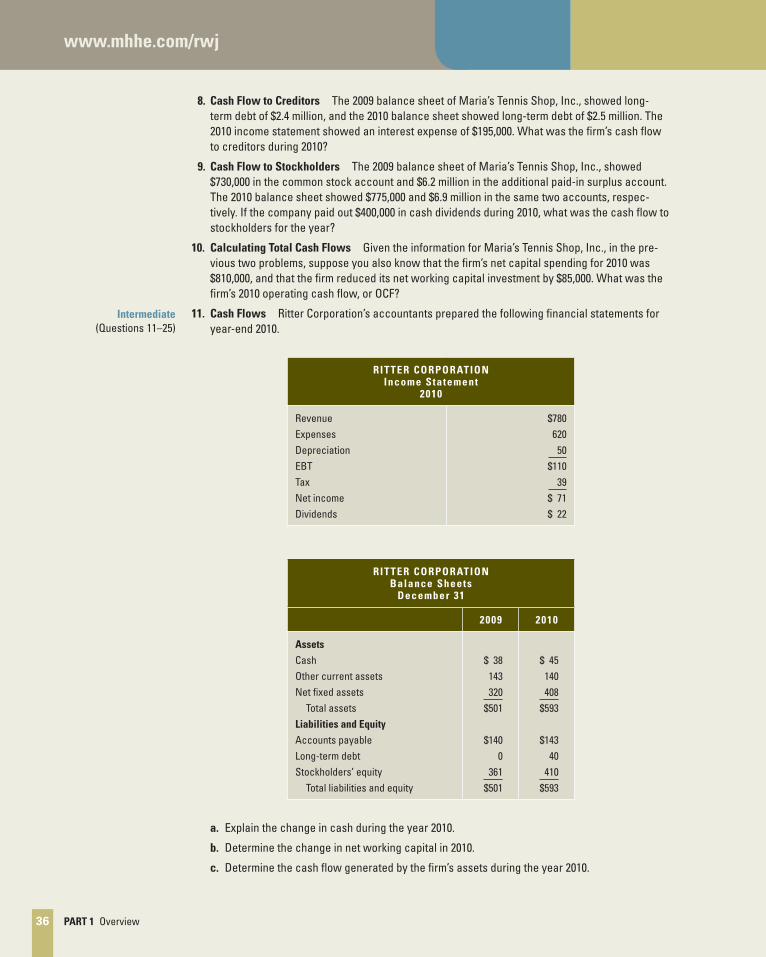
11. Cash Flows Ritter Corporation’s accountants prepared the following fi nancial statements for year-end 2010.
RITTER CORPORATION Income Statement
2010
Revenue Expenses Depreciation EBT Tax Net income Dividends
$780 620
50 $110 39 $ 71 $ 22
RITTER CORPORATION Balance Sheets
December 31
2009 2010
Assets
Cash Other current assets Net fi xed assets Total assets Liabilities and Equity
Accounts payable Long-term debt Stockholders’ equity Total liabilities and equity
$ 38
143 320 $501
$140
0 361 $501
$ 45
140 408 $593
$143
40 410 $593
a. Explain the change in cash during the year 2010.
b. Determine the change in net working capital in 2010.
c. Determine the cash fl ow generated by the fi rm’s assets during the year 2010.
Intermediate
(Questions 11–25)
ros30689_ch02_020-043.indd 36ros30689_ch02_020-043.indd 36 6/10/10 6:55 PM6/10/10 6:55 PM
CONFIRMING PAGES
CHAPTER 2 Financial Statements and Cash Flow 37
www.mhhe.com/rwj
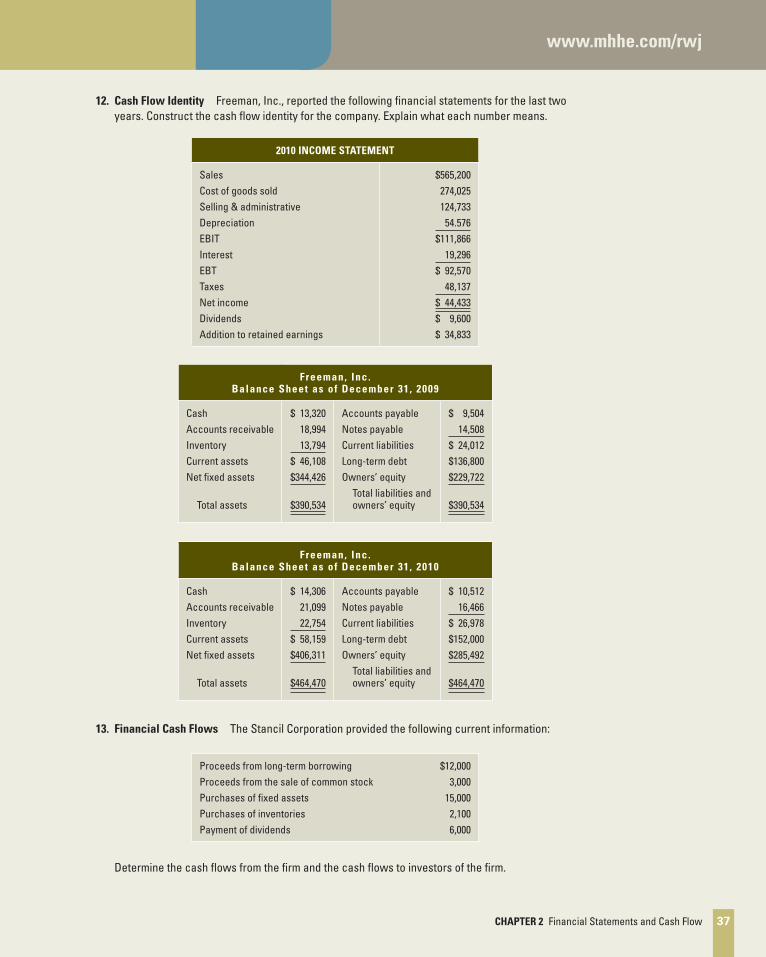
12. Cash Flow Identity Freeman, Inc., reported the following fi nancial statements for the last two years. Construct the cash fl ow identity for the company. Explain what each number means.
2010 INCOME STATEMENT
Sales Cost of goods sold Selling & administrative Depreciation EBIT Interest EBT Taxes Net income Dividends Addition to retained earnings
$565,200 274,025 124,733
54.576 $111,866 19,296 $ 92,570 48,137 $ 44,433 $ 9,600 $ 34,833
F reeman, Inc. Balance Sheet as of December 31 , 2009
Cash Accounts receivable Inventory Current assets Net fi xed assets
Total assets
$ 13,320 18,994
13,794 $ 46,108 $344,426
$390,534
Accounts payable Notes payable Current liabilities Long-term debt Owners’ equity Total liabilities and
owners’ equity
$ 9,504 14,508 $ 24,012 $136,800 $229,722
$390,534
F reeman, Inc. Balance Sheet as of December 31 , 2010
Cash Accounts receivable Inventory Current assets Net fi xed assets
Total assets
$ 14,306 21,099
22,754 $ 58,159 $406,311
$464,470
Accounts payable Notes payable Current liabilities Long-term debt Owners’ equity Total liabilities and
owners’ equity
$ 10,512 16,466 $ 26,978 $152,000 $285,492
$464,470
13. Financial Cash Flows The Stancil Corporation provided the following current information:
Proceeds from long-term borrowing Proceeds from the sale of common stock Purchases of fi xed assets Purchases of inventories Payment of dividends
$ 12,000 3,000
15,000 2,100 6,000
Determine the cash fl ows from the fi rm and the cash fl ows to investors of the fi rm.
ros30689_ch02_020-043.indd 37ros30689_ch02_020-043.indd 37 6/10/10 6:55 PM6/10/10 6:55 PM
CONFIRMING PAGES
38 PART 1 Overview
www.mhhe.com/rwj
14. Building an Income Statement During the year, the Senbet Discount Tire Company had gross sales of $870,000. The fi rm’s cost of goods sold and selling expenses were $280,000 and $155,000, respectively. Senbet also had notes payable of $650,000. These notes carried an interest rate of 6 percent. Depreciation was $86,000. Senbet’s tax rate was 35 percent.
a. What was Senbet’s net income?
b. What was Senbet’s operating cash fl ow?
15. Calculating Total Cash Flows Schwert Corp. shows the following information on its 2010 income statement: sales � $193,000; costs � $96,500; other expenses � $5,100; depreciation expense � $13,800; interest expense � $10,400; taxes � $23,520; dividends � $12,500. In addi-tion, you’re told that the fi rm issued $6,000 in new equity during 2010, and redeemed $7,500 in outstanding long-term debt.
a. What was the 2010 operating cash fl ow?
b. What was the 2010 cash fl ow to creditors?
c. What was the 2010 cash fl ow to stockholders?
d. If net fi xed assets increased by $28,000 during the year, what was the addition to NWC?
16. Using Income Statements Given the following information for O’Hara Marine Co., calculate the depreciation expense: sales � $43,000; costs � $26,000; addition to retained earnings � $5,600; dividends paid � $1,300; interest expense � $1,900; tax rate � 35 percent.
17. Preparing a Balance Sheet Prepare a 2010 balance sheet for Jarrow Corp. based on the fol-lowing information: cash � $175,000; patents and copyrights � $730,000; accounts payable � $435,000; accounts receivable � $240,000; tangible net fi xed assets � $3,650,000; inventory � $405,000; notes payable � $160,000; accumulated retained earnings � $1,980,000; long-term debt � $2,140,000.
18. Residual Claims Huang, Inc., is obligated to pay its creditors $12,500 very soon.
a. What is the market value of the shareholders’ equity if assets have a market value of $15,100?
b. What if assets equal $10,200?
19. Marginal versus Average Tax Rates (Refer to Table 2.3 .) Corporation Growth has $86,000 in taxable income, and Corporation Income has $8,600,000 in taxable income.
a. What is the tax bill for each fi rm?
b. Suppose both fi rms have identifi ed a new project that will increase taxable income by $10,000. How much in additional taxes will each fi rm pay? Why is this amount the same?
20. Net Income and OCF During 2010, Raines Umbrella Corp. had sales of $835,000. Cost of goods sold, administrative and selling expenses, and depreciation expenses were $620,000, $120,000, and $85,000, respectively. In addition, the company had an interest expense of $68,000 and a tax rate of 35 percent. (Ignore any tax loss carryback or carryforward provisions.)
a. What was Raines’s net income for 2010?
b. What was its operating cash fl ow?
c. Explain your results in (a) and (b).
21. Accounting Values versus Cash Flows In the previous problem, suppose Raines Umbrella Corp. paid out $45,000 in cash dividends. Is this possible? If spending on net fi xed assets and net working capital was zero, and if no new stock was issued during the year, what was the change in the fi rm’s long-term debt account?
22. Calculating Cash Flows Cusic Industries had the following operating results for 2010; sales � $25,700; cost of goods sold � $18,400; depreciation expense � $3,450; interest expense � $790; dividends paid � $1,100. At the beginning of the year, net fi xed assets were $19,280, current
ros30689_ch02_020-043.indd 38ros30689_ch02_020-043.indd 38 6/10/10 6:55 PM6/10/10 6:55 PM
CONFIRMING PAGES
CHAPTER 2 Financial Statements and Cash Flow 39
www.mhhe.com/rwj
assets were $5,100, and current liabilities were $3,400. At the end of the year, net fi xed assets were $23,650, current assets were $5,830, and current liabilities were $3,580. The tax rate for 2010 was 40 percent.
a. What was net income for 2010?
b. What was the operating cash fl ow for 2010?
c. What was the cash fl ow from assets for 2010? Is this possible? Explain.
d. If no new debt was issued during the year, what was the cash fl ow to creditors? What was the cash fl ow to stockholders? Explain and interpret the positive and negative signs of your answers in (a) through (d).
23. Calculating Cash Flows Consider the following abbreviated fi nancial statements for Weston Enterprises:
WESTON ENTERPRISES 2009 and 2010 Part ial Balance Sheets
Assets Liabilities and Owners’ Equity
Current assets Net fi xed assets
2009 $ 740 3,600
2010 $ 795 3,800
Current liabilities Long-term debt
2009 $ 330 2,000
2010 $ 360 2,150
WESTON ENTERPRISES 2010 Income Statement
Sales Costs Depreciation Interest paid
$10,900 4,680
930 390
a. What was owners’ equity for 2009 and 2010?
b. What was the change in net working capital for 2010?
c. In 2010, Weston Enterprises purchased $1,900 in new fi xed assets. How much in fi xed assets did Weston Enterprises sell? What was the cash fl ow from assets for the year? (The tax rate is 35 percent.)
d. During 2010, Weston Enterprises raised $440 in new long-term debt. How much long-term debt must Weston Enterprises have paid off during the year? What was the cash fl ow to creditors?
Use the following information for Ingersoll, Inc., for Problems 24 and 25 (assume the tax rate is 35 percent):
2009 2010
Sales Depreciation Cost of goods sold Other expenses Interest Cash Accounts receivable Short-term notes payable Long-term debt Net fi xed assets Accounts payable Inventory Dividends
$ 26,115 3,750 8,985 2,130 1,345
13,695 18,130
2,645 45,865
114,850 14,885 32,235
3,184
$ 28,030 3,755
10,200 1,780 2,010
14,010 20,425
2,485 53,510
117,590 13,950 33,125
3,505
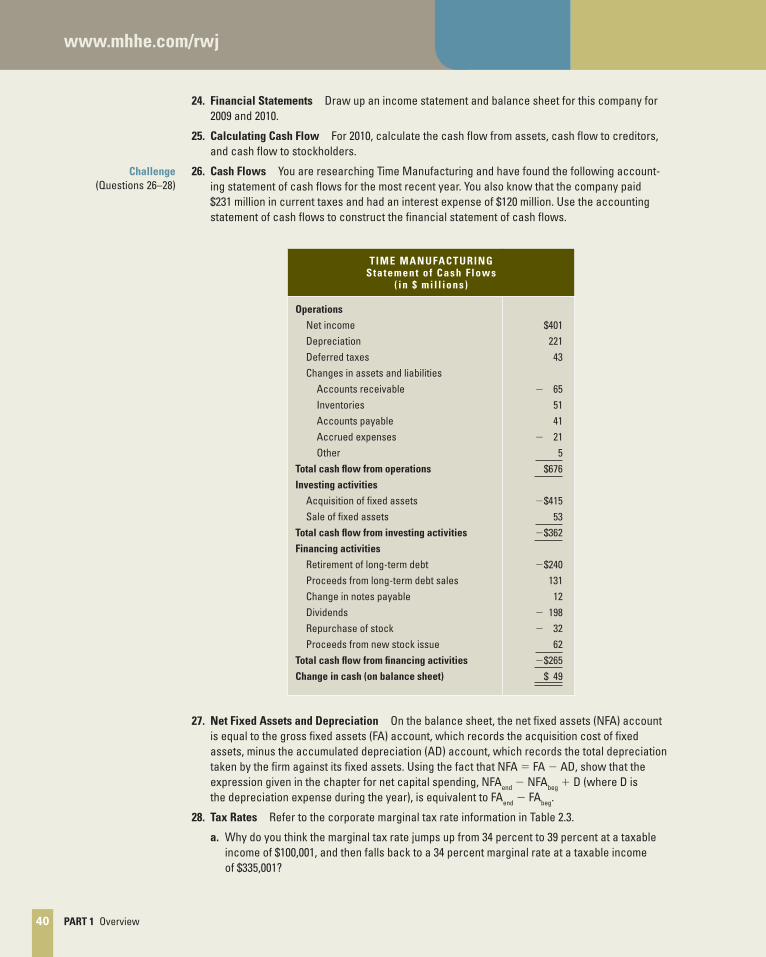
ros30689_ch02_020-043.indd 39ros30689_ch02_020-043.indd 39 6/10/10 6:55 PM6/10/10 6:55 PM
CONFIRMING PAGES
40 PART 1 Overview
www.mhhe.com/rwj
24. Financial Statements Draw up an income statement and balance sheet for this company for 2009 and 2010.
25. Calculating Cash Flow For 2010, calculate the cash fl ow from assets, cash fl ow to creditors, and cash fl ow to stockholders.
26. Cash Flows You are researching Time Manufacturing and have found the following account-ing statement of cash fl ows for the most recent year. You also know that the company paid $231 million in current taxes and had an interest expense of $120 million. Use the accounting statement of cash fl ows to construct the fi nancial statement of cash fl ows.
T IME MANUFACTURING Statement of Cash Flows
( in $ mil l ions)
Operations
Net income Depreciation Deferred taxes Changes in assets and liabilities Accounts receivable Inventories Accounts payable Accrued expenses Other Total cash fl ow from operations
Investing activities
Acquisition of fi xed assets Sale of fi xed assets Total cash fl ow from investing activities
Financing activities
Retirement of long-term debt Proceeds from long-term debt sales Change in notes payable Dividends Repurchase of stock Proceeds from new stock issue Total cash fl ow from fi nancing activities
Change in cash (on balance sheet)
$401 221
43
� 65 51 41
� 21 5 $676
�$415 53 �$362
�$240
131 12
� 198 � 32 62 �$265 $ 49
27. Net Fixed Assets and Depreciation On the balance sheet, the net fi xed assets (NFA) account is equal to the gross fi xed assets (FA) account, which records the acquisition cost of fi xed assets, minus the accumulated depreciation (AD) account, which records the total depreciation taken by the fi rm against its fi xed assets. Using the fact that NFA � FA � AD, show that the expression given in the chapter for net capital spending, NFA end � NFA beg � D (where D is the depreciation expense during the year), is equivalent to FA end � FA beg .
28. Tax Rates Refer to the corporate marginal tax rate information in Table 2.3 .
a. Why do you think the marginal tax rate jumps up from 34 percent to 39 percent at a taxable income of $100,001, and then falls back to a 34 percent marginal rate at a taxable income of $335,001?
Challenge
(Questions 26–28)
ros30689_ch02_020-043.indd 40ros30689_ch02_020-043.indd 40 6/10/10 6:55 PM6/10/10 6:55 PM
CONFIRMING PAGES
CHAPTER 2 Financial Statements and Cash Flow 41
www.mhhe.com/rwj
b. Compute the average tax rate for a corporation with exactly $335,001 in taxable income. Does this confi rm your explanation in part (a)? What is the average tax rate for a corporation with exactly $18,333,334? Is the same thing happening here?
c. The 39 percent and 38 percent tax rates both represent what is called a tax “bubble.” Suppose the government wanted to lower the upper threshold of the 39 percent marginal tax bracket from $335,000 to $200,000. What would the new 39 percent bubble rate have to be?
W H AT ’ S O N T H E W E B ?
1. Change in Net Working Capital Find the most recent abbreviated balance sheets for General Dynamics at finance.yahoo.com . Enter the ticker symbol “GD” and follow the “Balance Sheet” link. Using the two most recent balance sheets, calculate the change in net working capital. What does this number mean?
2. Book Values versus Market Values The home page for Coca-Cola Company can be found at www.coca-cola.com . Locate the most recent annual report, which contains a balance sheet for the company. What is the book value of equity for Coca-Cola? The market value of a company is the number of shares of stock outstanding times the price per share. This information can be found at finance.yahoo.com using the ticker symbol for Coca-Cola (KO). What is the market value of equity? Which number is more relevant for shareholders?
3. Cash Flows to Stockholders and Creditors Cooper Tire and Rubber Company provides fi nan-cial information for investors on its Web site at www.coopertires.com . Follow the “ Investors” link and fi nd the most recent annual report. Using the consolidated statements of cash fl ows, calculate the cash fl ow to stockholders and the cash fl ow to creditors.
ros30689_ch02_020-043.indd 41ros30689_ch02_020-043.indd 41 6/10/10 6:55 PM6/10/10 6:55 PM
CONFIRMING PAGES
42 PART 1 Overview
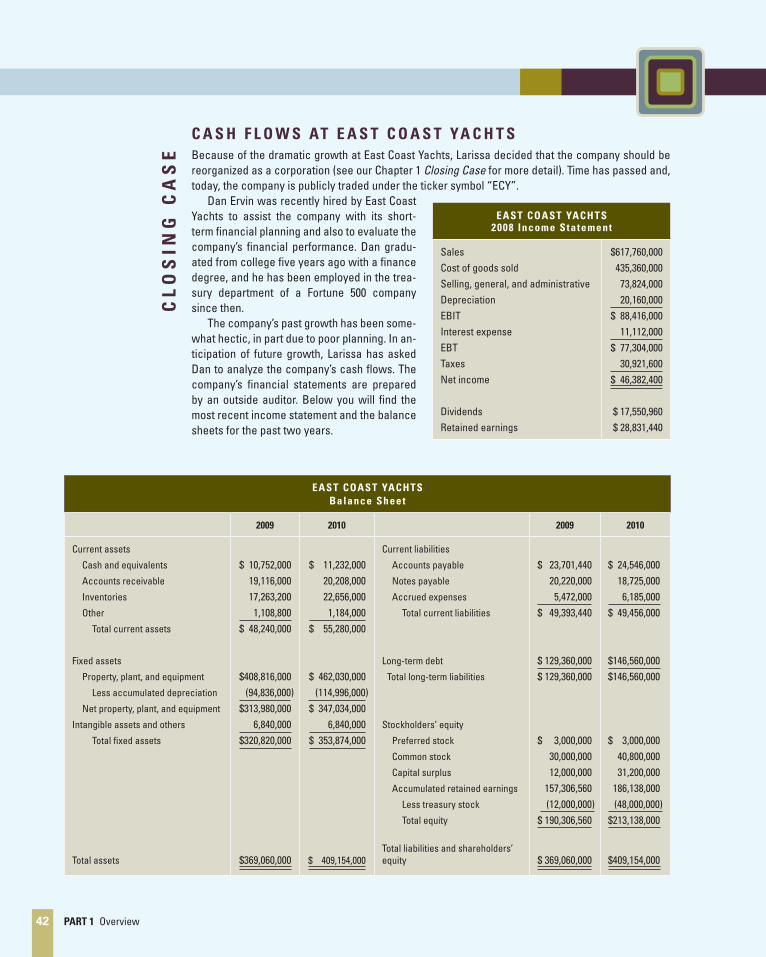
EAST COAST YACHTS
Balance Sheet
2009 2010 2009 2010
Current assets
Cash and equivalents
Accounts receivable
Inventories
Other
Total current assets
Fixed assets
Property, plant, and equipment
Less accumulated depreciation
Net property, plant, and equipment
Intangible assets and others
Total fi xed assets
Total assets
$ 10,752,00019,116,00017,263,200
1,108,800$ 48,240,000
$408,816,000 (94,836,000)$313,980,000 6,840,000$320,820,000
$369,060,000
$ 11,232,00020,208,00022,656,000
1,184,000$ 55,280,000
$ 462,030,000 (114,996,000)$ 347,034,000 6,840,000$ 353,874,000
$ 409,154,000
Current liabilities
Accounts payable
Notes payable
Accrued expenses
Total current liabilities
Long-term debt
Total long-term liabilities
Stockholders’ equity
Preferred stock
Common stock
Capital surplus
Accumulated retained earnings
Less treasury stock
Total equity
Total liabilities and shareholders’ equity
$ 23,701,44020,220,000
5,472,000$ 49,393,440
$ 129,360,000$ 129,360,000
$ 3,000,00030,000,00012,000,000
157,306,560 (12,000,000)
$ 190,306,560
$ 369,060,000
$ 24,546,00018,725,000
6,185,000$ 49,456,000
$146,560,000$146,560,000
$ 3,000,00040,800,00031,200,000
186,138,000 (48,000,000)$213,138,000
$409,154,000
C A S H F L O W S AT E A S T C O A S T YA C H T S
Because of the dramatic growth at East Coast Yachts, Larissa decided that the company should be reorganized as a corporation (see our Chapter 1 Closing Case for more detail). Time has passed and, today, the company is publicly traded under the ticker symbol “ECY”. Dan Ervin was recently hired by East Coast Yachts to assist the company with its short-term fi nancial planning and also to evaluate the company’s fi nancial performance. Dan gradu-ated from college fi ve years ago with a fi nance degree, and he has been employed in the trea-sury department of a Fortune 500 company since then. The company’s past growth has been some-what hectic, in part due to poor planning. In an-ticipation of future growth, Larissa has asked Dan to analyze the company’s cash fl ows. The company’s fi nancial statements are prepared by an outside auditor. Below you will fi nd the most recent income statement and the balance sheets for the past two years.
CL
OS
IN
G C
AS
E
EAST COAST YACHTS 2008 Income Statement
Sales Cost of goods sold Selling, general, and administrative Depreciation EBIT Interest expense EBT Taxes Net income
Dividends Retained earnings
$617,760,000 435,360,000
73,824,000 20,160,000 $ 88,416,000 11,112,000 $ 77,304,000 30,921,600 $ 46,382,400
$ 17,550,960 $ 28,831,440
ros30689_ch02_020-043.indd 42ros30689_ch02_020-043.indd 42 6/10/10 6:55 PM6/10/10 6:55 PM
CONFIRMING PAGES
CHAPTER 2 Financial Statements and Cash Flow 43
Larissa has also provided the following information. During the year, the company raised $40 million in new long-term debt and retired $22.8 million in long-term debt. The company also sold $30 million in new stock and repurchased $36 million. The company purchased $60 million in fi xed assets, and sold $6,786,000 in fi xed assets.
Larissa has asked Dan to prepare the fi nancial statement of cash fl ows and the accounting state-ment of cash fl ows. She has also asked you to answer the following questions:
1. How would you describe East Coast Yachts’ cash fl ows?
2. Which cash fl ows statement more accurately describes the cash fl ows at the company?
3. In light of your previous answers, comment on Larissa’s expansion plans.
ros30689_ch02_020-043.indd 43ros30689_ch02_020-043.indd 43 6/10/10 6:55 PM6/10/10 6:55 PM
CONFIRMING PAGES